document type: project proposal report (ppr) project .... ppr port botany rail line upgrade stage...
TRANSCRIPT
Document Type: Project Proposal Report (PPR)
Project Detail: Port Botany Rail Line (PBRL) Upgrade Stage 2
Delivery Phase
Location: Sydney Urban:
Port Botany – Mascot – Marrickville – Campsie Enfield – Chullora –Flemington Sth / Sefton Park (rail line)
April 2010
Project Proposal Report (PPR)
Port Botany Rail Line Upgrade Stage 2 – Delivery Phase
April 2010 1 of 27
Project Context Background In September 2004, as part the overall suite of agreements dealing with ARTC’s lease and management of the NSW interstate and Hunter railway network, ARTC and the NSW Rail Corporation (RailCorp) signed a Deed of Agreement for Metropolitan Freight Network (MFN) Lease and License. This Agreement provides for a lease by ARTC of the Port Botany Rail Line (PBRL), which includes a dedicated freight connection extending from Sefton Park Junction and Flemington through Chullora and Enfield to Port Botany. The majority of the PBRL is located in its own corridor physically separate from the RailCorp passenger network. A 5.6km section of the PBRL between Campsie and Marrickville is located in a corridor shared with the RailCorp passenger network but the PBRL operates on separate dedicated freight tracks. The PBRL makes an end-on connection at Sefton Park Junction to the Southern Sydney Freight Line (SSFL), which is currently under construction by ARTC. The SSFL will provide a dedicated freight connection from the PBRL to ARTC’s Lease at Macarthur. ARTC has developed a staged upgrading program for the PBRL to meet growing demand for container transport by rail and to achieve efficiencies in operating and maintenance practices, as a potential candidate for funding from the Nation Building Program. Previous funding approvals In December 2008, ARTC commenced its lease of the Port Botany Rail Yard, as the first phase of the lease of the Port Botany Rail Line, to permit detailed planning and preparatory work to proceed for the upgrading of Port Botany Rail Yard. In June 2009 ARTC received advice from the Department of Infrastructure, Transport, Regional Development and Local Government of an allocation of $21.16m for the Port Botany Rail Line Upgrade Stage 1 (Port Botany Rail Yard upgrade). This was additional to an earlier $6m allocation to progress the Development Phase of the project (total allocation to date $27.16m). The Stage 1 works at Port Botany Rail Yard are now well advanced with physical works expected to be complete by August 2010. The Delivery Phase of Stage 1 involves a major track reconfiguration and upgrade of the Port Botany Rail Yard, including associated lighting and access roadways. Stage 1 has also produced Signal Functional Specifications and Track & Civil designs in preparation for the Stage 2 projects. Stage 2 Delivery Phase - funding sought under this PPR This Project Proposal Report seeks approval of $147.0 million from the Nation Building Program, the full amount of funds available to the project, based on cost estimates of $145.4M (P50) to $156.3M (P90) inclusive of contingencies, escalation and company tax but exclusive of GST to allow the Stage 2 package of works to proceed.
Project Proposal Report (PPR)
Port Botany Rail Line Upgrade Stage 2 – Delivery Phase
April 2010 2 of 27
Stage 2 Objectives The Stage 2 PBRL upgrade program is a key component of ARTC’s program to improve rail access to Port Botany. Key objectives are to deliver improved capacity and efficiency for rail, remove rail access bottlenecks and provide for reduced congestion for both rail and road to and from Port Botany.
The physical objectives of these Stage 2 works are to achieve separation of the PBRL from RailCorp and full control from the ARTC Network Control Centre South at Junee thus providing seamless control of trains from ARTC’s southern interstate network to the Port of Botany. New and/or modified signalling and control will be required at various points along the PBRL as part of these works.
The program will also provide a rail staging facility at Enfield to hold and resequence trains away from the congested Port Botany Rail Yard This will allow Port Botany to operate efficiently as an arrival and departure facility linking the rail line to the port stevedores.
In addition, new signalling along with supporting track and civil works in the section from Cooks River to Mascot will upgrade existing siding tracks to achieve an effective mainline duplication in this segment.
Stage 2 Location Geographically, the PBRL can be defined by the following areas:
• Marrickville – Port Botany Line (8.9km) - Marrickville Junction to Port Botany - Port Botany Rail Yard
• Shared Corridor (5.6km) - Campsie to Wardell Rd Junction - Wardell Rd Junction to Marrickville Junction
• Western Freight Corridors (11.8km) - Sefton Park Junction (Enfield West) to Chullora Junction - Flemington South to Chullora Junction - Chullora Junction to Enfield to Campsie
Stage 2 Scope of works The Stage 2 project is defined by the following packages of works:
• Signal Control – Port Botany
• Signal Control Separation – Cooks River to Wardell Road including: - Additional signalling to effectively extend duplication from Cooks River to
Mascot - Control separation of the Marrickville-Wardell Road segment of the shared
corridor
• Signal Control Separation – Shared Corridor (Wardell Road – Campsie segment)
• Signal Control Separation – Enfield Control Area
• Enfield Staging Facility Construction
A map showing the scope and geographical location of the Stage 2 project packages is on Page 6.
Project Proposal Report (PPR)
Port Botany Rail Line Upgrade Stage 2 – Delivery Phase
April 2010 3 of 27
Related Port Botany Rail Line Projects Further stages of the PBRL Upgrade remain under development by ARTC, as follows:
Stage 3: Concrete sleepering and upgrading of the sub-standard sections of track to bring the PBRL to a consistent and reliable standard.
Stage 3 will be the subject of separate Project Proposal Report when planning work is sufficiently progressed. Stages 3 will be complementary to Stages 1 and 2 and will provide additional incremental benefits that will serve to maximise the benefits accruing from Stages 1 and 2. However it should be stressed that Stage 2 is a separable project which is not contingent upon the subsequent progression of Stage 3.
Project Proposal Report (PPR)
Port Botany Rail Line Upgrade Stage 2 – Delivery Phase
April 2010 4 of 27
A PROPONENT AND PROJECT DETAILS
Proponent Details
A1 Proponent Details AUSTRALIAN RAIL TRACK CORPORATION LTD
ABN 75 081 455 754
A2 Project Director Name: Terry Bones
Title: Project Director
Telephone: 02 8259 0706
Facsimile: 02 9279 4538
Email: [email protected]
Address: Australian Rail Track Corporation Ltd
PO Box 14
Sydney NSW 2001
Project Details
A3 Project ID 036644-09SA-NP
A4 Project Name Port Botany Rail Line Upgrade Stage 2.
Project Proposal Report (PPR)
Port Botany Rail Line Upgrade Stage 2 – Delivery Phase
April 2010 5 of 27
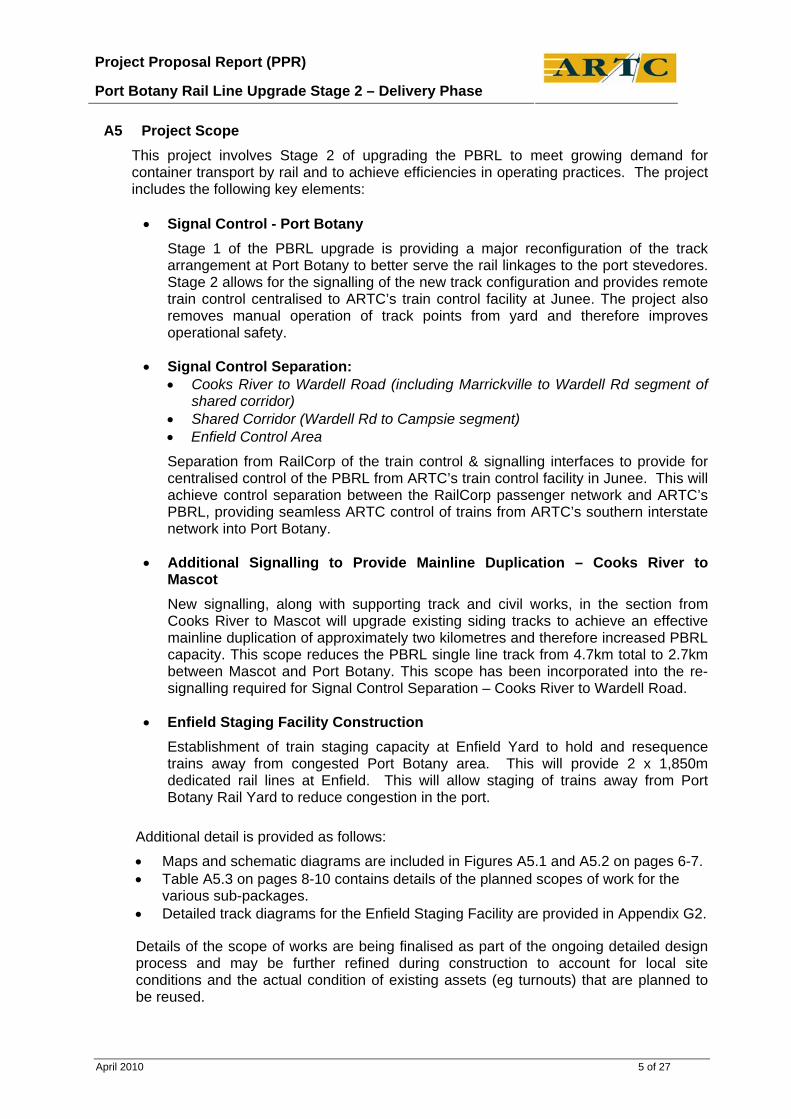
A5 Project Scope This project involves Stage 2 of upgrading the PBRL to meet growing demand for container transport by rail and to achieve efficiencies in operating practices. The project includes the following key elements: • Signal Control - Port Botany
Stage 1 of the PBRL upgrade is providing a major reconfiguration of the track arrangement at Port Botany to better serve the rail linkages to the port stevedores. Stage 2 allows for the signalling of the new track configuration and provides remote train control centralised to ARTC’s train control facility at Junee. The project also removes manual operation of track points from yard and therefore improves operational safety.
• Signal Control Separation: • Cooks River to Wardell Road (including Marrickville to Wardell Rd segment of
shared corridor) • Shared Corridor (Wardell Rd to Campsie segment) • Enfield Control Area
Separation from RailCorp of the train control & signalling interfaces to provide for centralised control of the PBRL from ARTC’s train control facility in Junee. This will achieve control separation between the RailCorp passenger network and ARTC’s PBRL, providing seamless ARTC control of trains from ARTC’s southern interstate network into Port Botany.
• Additional Signalling to Provide Mainline Duplication – Cooks River to Mascot New signalling, along with supporting track and civil works, in the section from Cooks River to Mascot will upgrade existing siding tracks to achieve an effective mainline duplication of approximately two kilometres and therefore increased PBRL capacity. This scope reduces the PBRL single line track from 4.7km total to 2.7km between Mascot and Port Botany. This scope has been incorporated into the re-signalling required for Signal Control Separation – Cooks River to Wardell Road.
• Enfield Staging Facility Construction
Establishment of train staging capacity at Enfield Yard to hold and resequence trains away from congested Port Botany area. This will provide 2 x 1,850m dedicated rail lines at Enfield. This will allow staging of trains away from Port Botany Rail Yard to reduce congestion in the port.
Additional detail is provided as follows:
• Maps and schematic diagrams are included in Figures A5.1 and A5.2 on pages 6-7. • Table A5.3 on pages 8-10 contains details of the planned scopes of work for the
various sub-packages. • Detailed track diagrams for the Enfield Staging Facility are provided in Appendix G2.
Details of the scope of works are being finalised as part of the ongoing detailed design process and may be further refined during construction to account for local site conditions and the actual condition of existing assets (eg turnouts) that are planned to be reused.
Project Proposal Report (PPR)
Port Botany Rail Line Upgrade Stage 2 – Delivery Phase
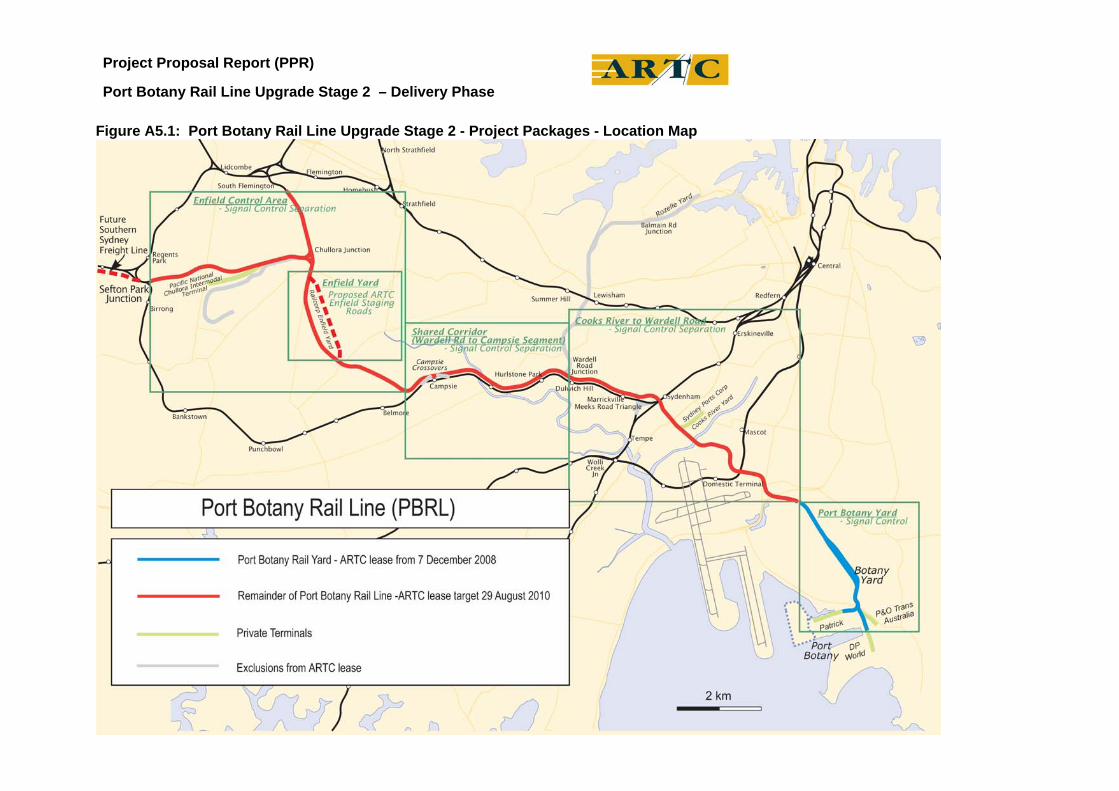
Figure A5.1: Port Botany Rail Line Upgrade Stage 2 - Project Packages - Location Map
Project Proposal Report (PPR)
Port Botany Rail Line Upgrade Stage 2 – Delivery Phase
April 2010 7 of 27
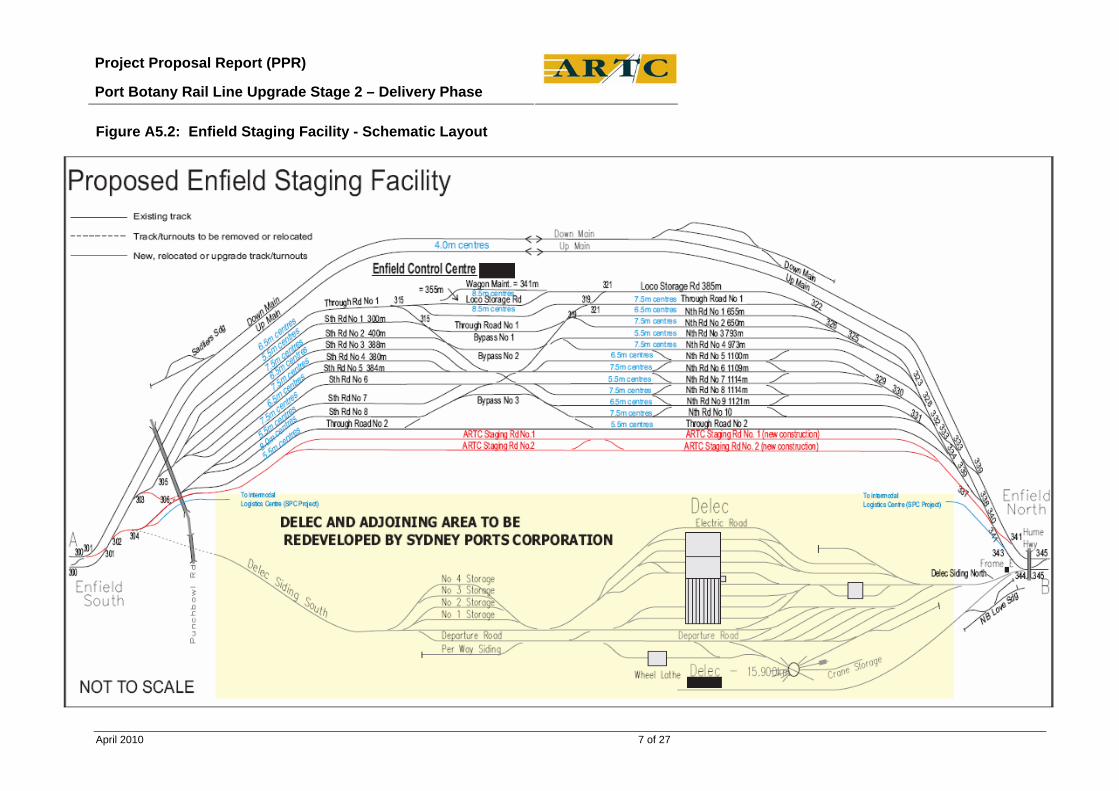
Figure A5.2: Enfield Staging Facility - Schematic Layout
Project Proposal Report (PPR)
Port Botany Rail Line Upgrade Stage 2 – Delivery Phase
April 2010 8 of 27
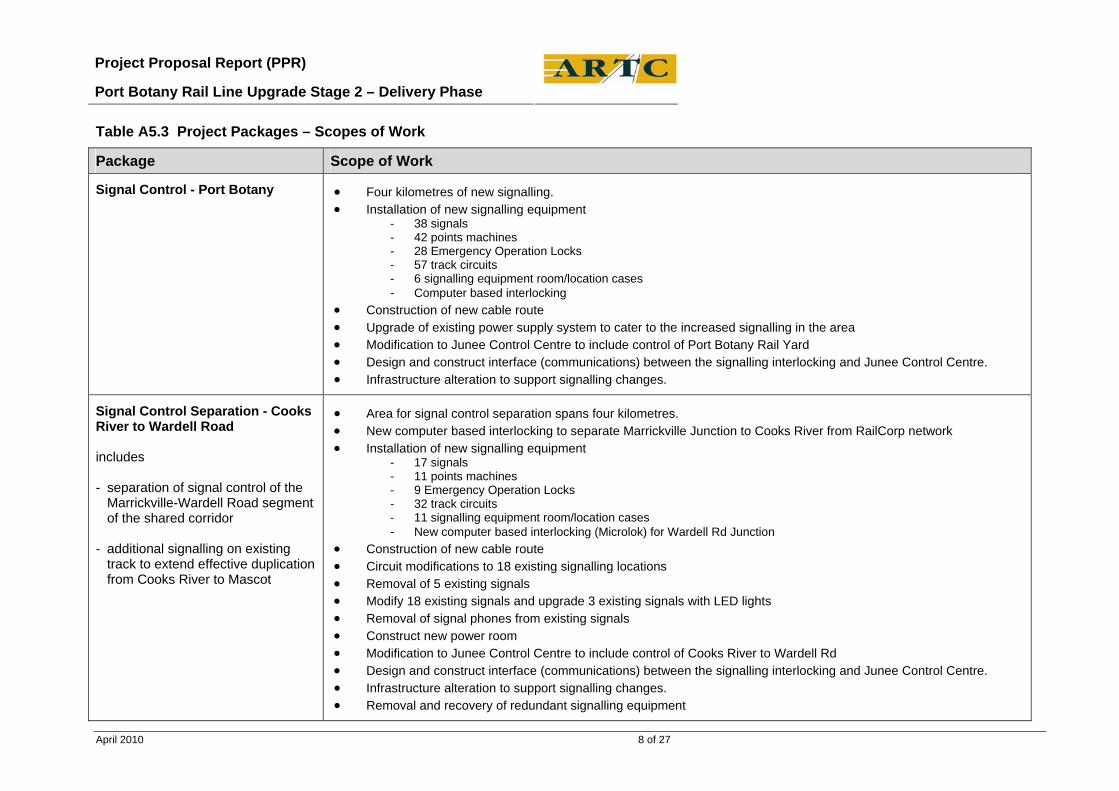
Table A5.3 Project Packages – Scopes of Work
Package Scope of Work
Signal Control - Port Botany • Four kilometres of new signalling. • Installation of new signalling equipment
- 38 signals - 42 points machines - 28 Emergency Operation Locks - 57 track circuits - 6 signalling equipment room/location cases - Computer based interlocking
• Construction of new cable route • Upgrade of existing power supply system to cater to the increased signalling in the area • Modification to Junee Control Centre to include control of Port Botany Rail Yard • Design and construct interface (communications) between the signalling interlocking and Junee Control Centre. • Infrastructure alteration to support signalling changes.
Signal Control Separation - Cooks River to Wardell Road includes - separation of signal control of the
Marrickville-Wardell Road segment of the shared corridor
- additional signalling on existing
track to extend effective duplication from Cooks River to Mascot
• Area for signal control separation spans four kilometres. • New computer based interlocking to separate Marrickville Junction to Cooks River from RailCorp network • Installation of new signalling equipment
- 17 signals - 11 points machines - 9 Emergency Operation Locks - 32 track circuits - 11 signalling equipment room/location cases - New computer based interlocking (Microlok) for Wardell Rd Junction
• Construction of new cable route • Circuit modifications to 18 existing signalling locations • Removal of 5 existing signals • Modify 18 existing signals and upgrade 3 existing signals with LED lights • Removal of signal phones from existing signals • Construct new power room • Modification to Junee Control Centre to include control of Cooks River to Wardell Rd • Design and construct interface (communications) between the signalling interlocking and Junee Control Centre. • Infrastructure alteration to support signalling changes. • Removal and recovery of redundant signalling equipment
Project Proposal Report (PPR)
Port Botany Rail Line Upgrade Stage 2 – Delivery Phase
April 2010 9 of 27
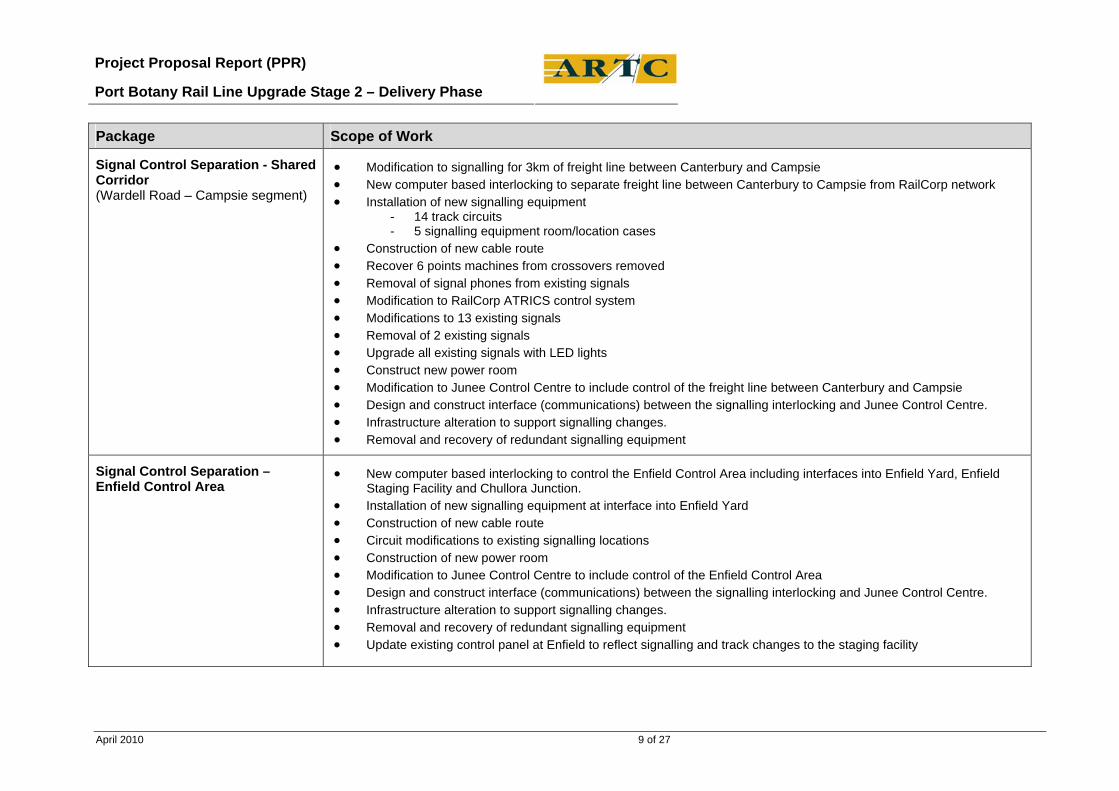
Package Sc e of Work op
Signal Control Separation - Shared Corridor (Wardell Road – Campsie segment)
• Modification to signalling for 3km of freight line between Canterbury and Campsie • New computer based interlocking to separate freight line between Canterbury to Campsie from RailCorp network • Installation of new signalling equipment
- 14 track circuits - 5 signalling equipment room/location cases
• Construction of new cable route • Recover 6 points machines from crossovers removed • Removal of signal phones from existing signals • Modification to RailCorp ATRICS control system • Modifications to 13 existing signals • Removal of 2 existing signals • Upgrade all existing signals with LED lights • Construct new power room • Modification to Junee Control Centre to include control of the freight line between Canterbury and Campsie • Design and construct interface (communications) between the signalling interlocking and Junee Control Centre. • Infrastructure alteration to support signalling changes. • Removal and recovery of redundant signalling equipment
Signal Control Separation – Enfield Control Area
• New computer based interlocking to control the Enfield Control Area including interfaces into Enfield Yard, Enfield Staging Facility and Chullora Junction.
• Installation of new signalling equipment at interface into Enfield Yard • Construction of new cable route • Circuit modifications to existing signalling locations • Construction of new power room • Modification to Junee Control Centre to include control of the Enfield Control Area • Design and construct interface (communications) between the signalling interlocking and Junee Control Centre. • Infrastructure alteration to support signalling changes. • Removal and recovery of redundant signalling equipment • Update existing control panel at Enfield to reflect signalling and track changes to the staging facility
Project Proposal Report (PPR)
Port Botany Rail Line Upgrade Stage 2 – Delivery Phase
April 2010 10 of 27
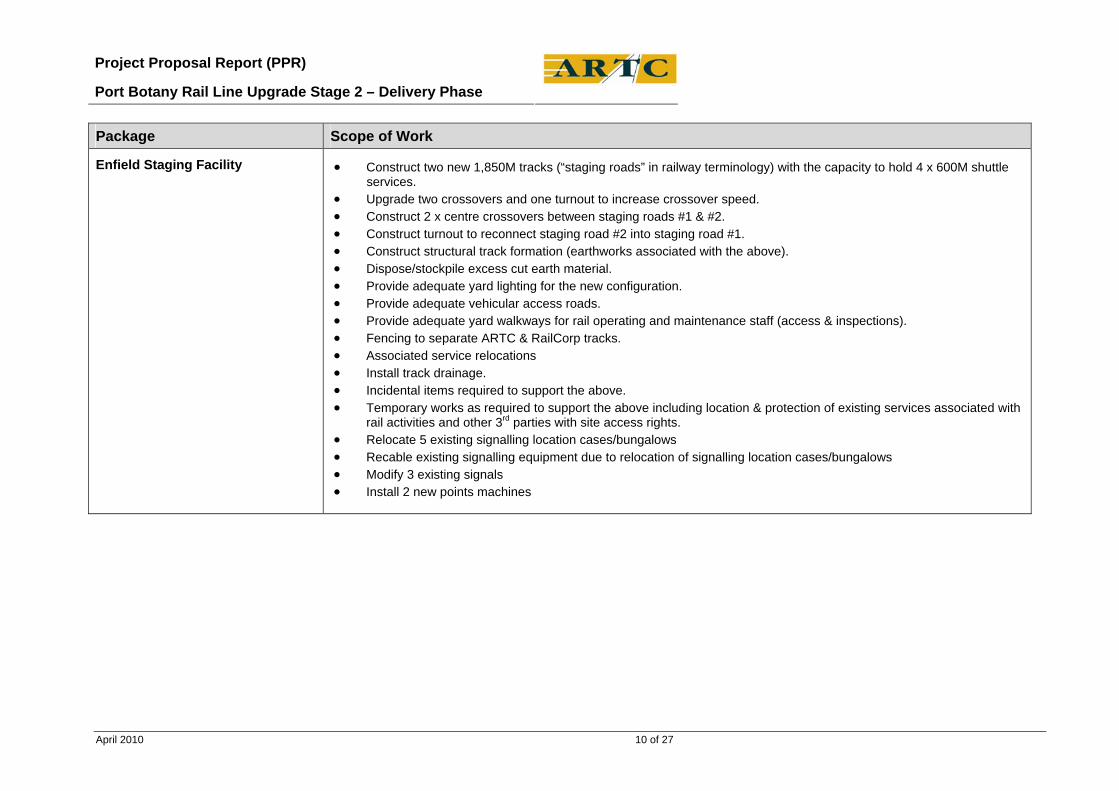
Package Sc e of Work op
Enfield Staging Facility • Construct two new 1,850M tracks (“staging roads” in railway terminology) with the capacity to hold 4 x 600M shuttle services.
• Upgrade two crossovers and one turnout to increase crossover speed. • Construct 2 x centre crossovers between staging roads #1 & #2. • Construct turnout to reconnect staging road #2 into staging road #1. • Construct structural track formation (earthworks associated with the above). • Dispose/stockpile excess cut earth material. • Provide adequate yard lighting for the new configuration. • Provide adequate vehicular access roads. • Provide adequate yard walkways for rail operating and maintenance staff (access & inspections). • Fencing to separate ARTC & RailCorp tracks. • Associated service relocations • Install track drainage. • Incidental items required to support the above. • Temporary works as required to support the above including location & protection of existing services associated with
rail activities and other 3rd parties with site access rights. • Relocate 5 existing signalling location cases/bungalows • Recable existing signalling equipment due to relocation of signalling location cases/bungalows • Modify 3 existing signals • Install 2 new points machines
Project Proposal Report (PPR)
Port Botany Rail Line Upgrade Stage 2 – Delivery Phase
April 2010 11 of 27
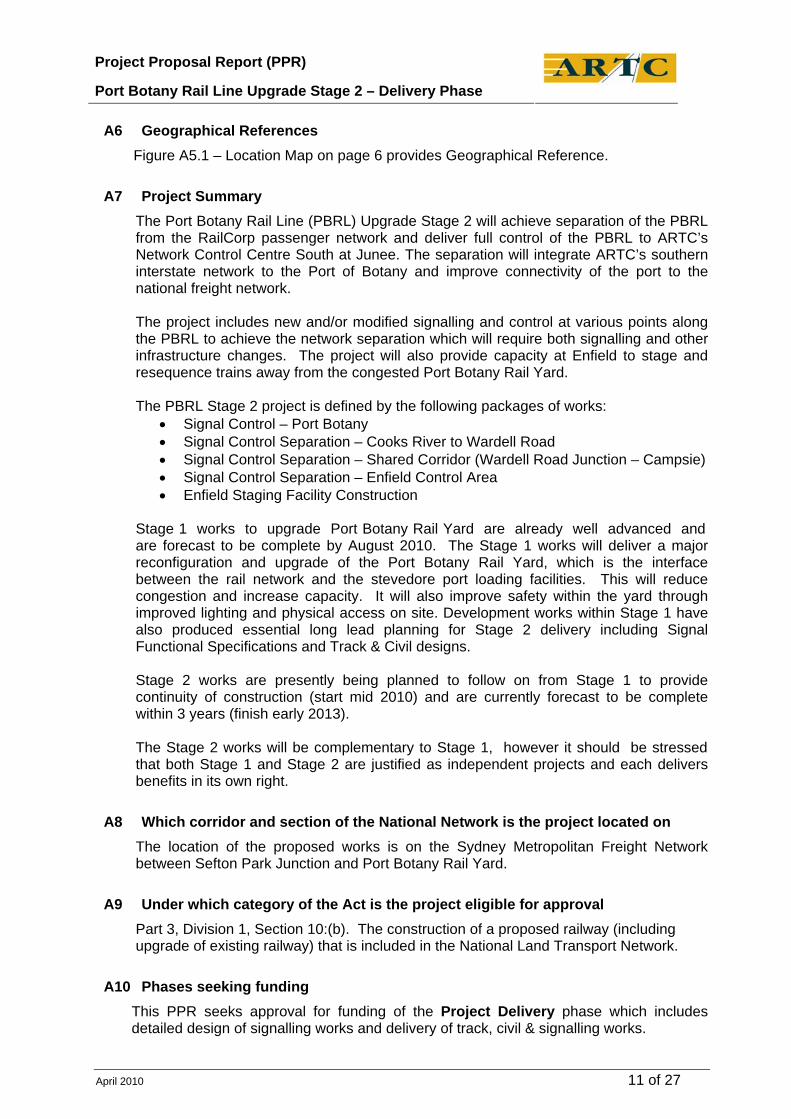
A6 Geographical References Figure A5.1 – Location Map on page 6 provides Geographical Reference.
A7 Project Summary The Port Botany Rail Line (PBRL) Upgrade Stage 2 will achieve separation of the PBRL from the RailCorp passenger network and deliver full control of the PBRL to ARTC’s Network Control Centre South at Junee. The separation will integrate ARTC’s southern interstate network to the Port of Botany and improve connectivity of the port to the national freight network. The project includes new and/or modified signalling and control at various points along the PBRL to achieve the network separation which will require both signalling and other infrastructure changes. The project will also provide capacity at Enfield to stage and resequence trains away from the congested Port Botany Rail Yard. The PBRL Stage 2 project is defined by the following packages of works:
• Signal Control – Port Botany • Signal Control Separation – Cooks River to Wardell Road • Signal Control Separation – Shared Corridor (Wardell Road Junction – Campsie) • Signal Control Separation – Enfield Control Area • Enfield Staging Facility Construction
Stage 1 works to upgrade Port Botany Rail Yard are already well advanced and are forecast to be complete by August 2010. The Stage 1 works will deliver a major reconfiguration and upgrade of the Port Botany Rail Yard, which is the interface between the rail network and the stevedore port loading facilities. This will reduce congestion and increase capacity. It will also improve safety within the yard through improved lighting and physical access on site. Development works within Stage 1 have also produced essential long lead planning for Stage 2 delivery including Signal Functional Specifications and Track & Civil designs. Stage 2 works are presently being planned to follow on from Stage 1 to provide continuity of construction (start mid 2010) and are currently forecast to be complete within 3 years (finish early 2013). The Stage 2 works will be complementary to Stage 1, however it should be stressed that both Stage 1 and Stage 2 are justified as independent projects and each delivers benefits in its own right.
A8 Which corridor and section of the National Network is the project located on The location of the proposed works is on the Sydney Metropolitan Freight Network between Sefton Park Junction and Port Botany Rail Yard.
A9 Under which category of the Act is the project eligible for approval Part 3, Division 1, Section 10:(b). The construction of a proposed railway (including upgrade of existing railway) that is included in the National Land Transport Network.
A10 Phases seeking funding This PPR seeks approval for funding of the Project Delivery phase which includes detailed design of signalling works and delivery of track, civil & signalling works.
Project Proposal Report (PPR)
Port Botany Rail Line Upgrade Stage 2 – Delivery Phase
April 2010 12 of 27
B STRATEGIC FIT
B1 Has the Scoping Phase previously been approved The initial Scoping Phase for the overall Port Botany Rail Line Upgrade program was funded by ARTC and the results where reported in the PPR which sought Development Phase funding as part of Stage 1 of the project. The PPR for the Development Phase was approved on 23 June 2008.
B2 Is the project identified in the MOU The National Partnership Agreement on Implementation of Major Infrastructure Projects in NSW, 2009-2014, Schedule A, lists “Port Botany road and rail access and handling improvements package”, with the Commonwealth Government to provide $150m over the period 2009-2014.
B3 Has it been determined that the project has strategic merit through a formal Strategic Merit Test
The former AusLink Notes on Administration provided that project phases could be combined where necessary. Accordingly the strategic merit of the project was addressed in the PPR of the Development Phase, rather than through a separate strategic merit test. The PPR for the Development Phase was approved on 23 June 2008. In brief, the earlier PPR considered the strategic fit of the project with:
- specific strategic issues within the Sydney metropolitan context, as identified in the Sydney Urban Corridor Strategy (previously undertaken with Australian Government funding)
- broader objectives for the National Land Transport Network - other relevant strategic projects in the Sydney metropolitan area
More specifically:
- The Sydney Urban Corridor Strategy identified rapid growth of container traffic through Port Botany as a key challenge facing the Sydney urban corridors over the next 20 years. The Strategy identified improving rail links to and from Port Botany and enhancing landside port capability and freight distribution as short-term priorities for the Sydney urban corridors.
- The project is directly oriented to addressing these SUCS priorities and the key
objectives of capacity, efficiency, productivity, reliability, safety and sustainability.
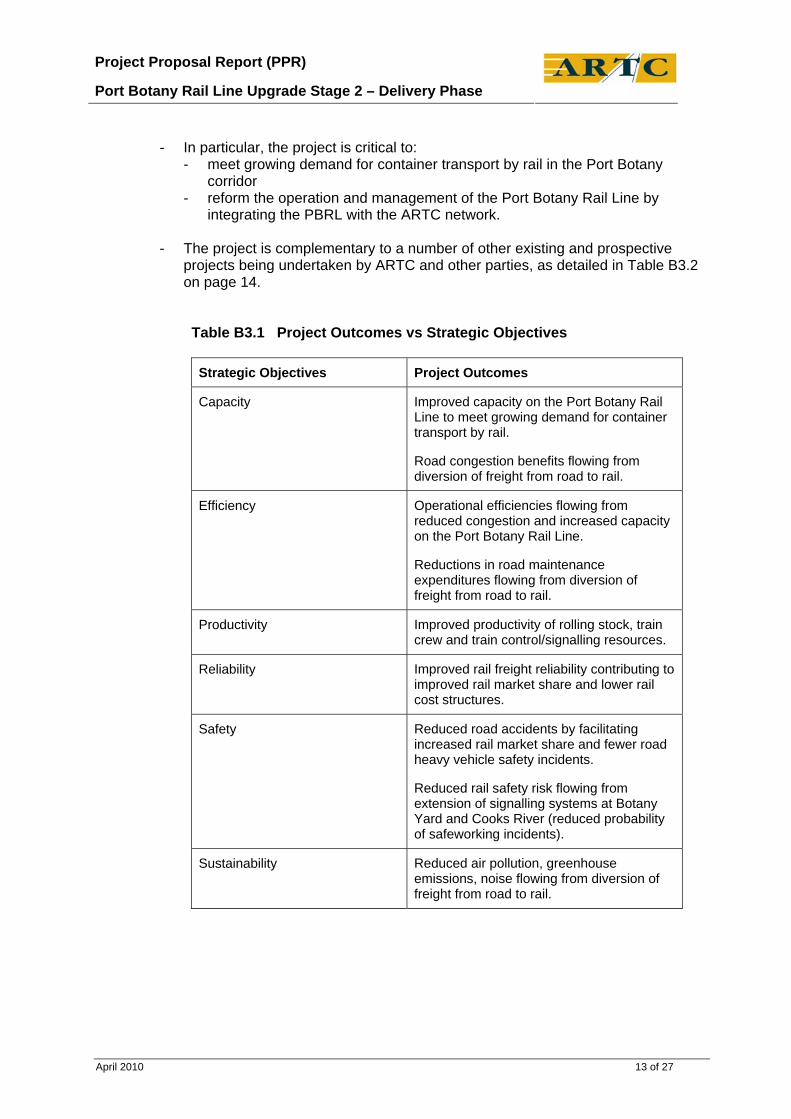
- Table B3.1 on the following page shows the intended project outcomes relative to these key objectives.
Project Proposal Report (PPR)
Port Botany Rail Line Upgrade Stage 2 – Delivery Phase
April 2010 13 of 27
- In particular, the project is critical to:
- meet growing demand for container transport by rail in the Port Botany corridor
- reform the operation and management of the Port Botany Rail Line by integrating the PBRL with the ARTC network.
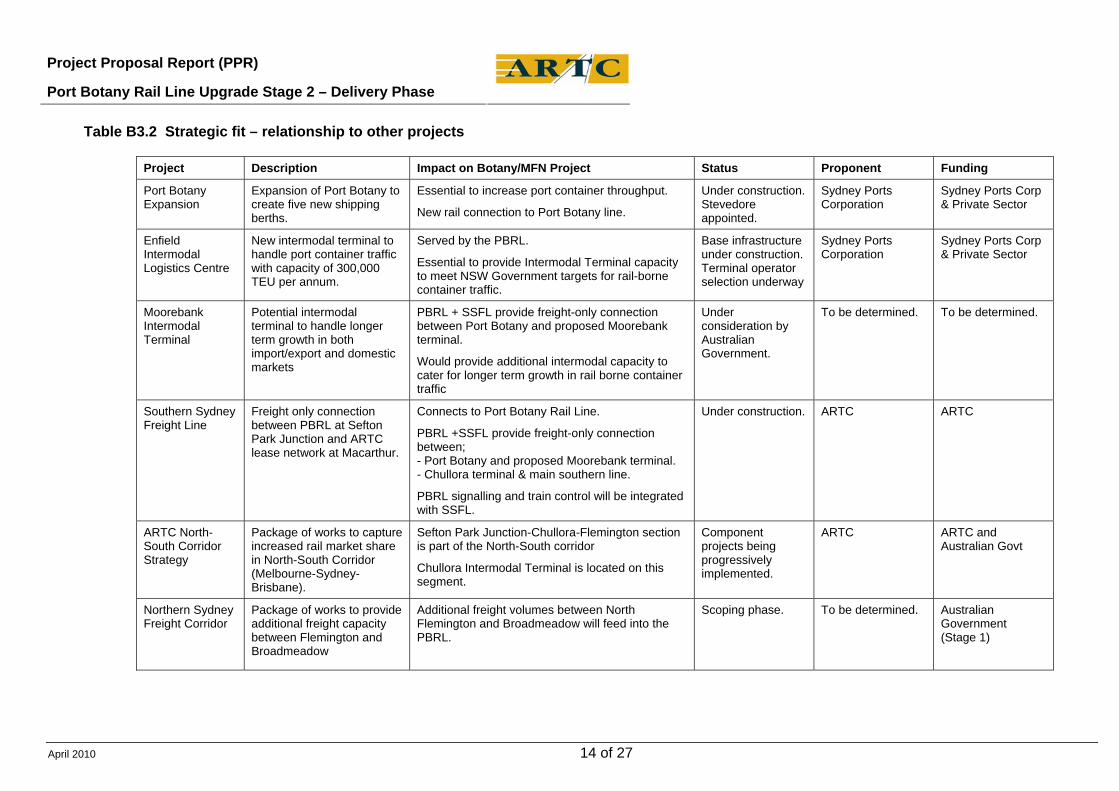
- The project is complementary to a number of other existing and prospective
projects being undertaken by ARTC and other parties, as detailed in Table B3.2 on page 14.
Table B3.1 Project Outcomes vs Strategic Objectives Strategic Objectives Project Outcomes
Capacity Improved capacity on the Port Botany Rail Line to meet growing demand for container transport by rail.
Road congestion benefits flowing from diversion of freight from road to rail.
Efficiency Operational efficiencies flowing from reduced congestion and increased capacity on the Port Botany Rail Line.
Reductions in road maintenance expenditures flowing from diversion of freight from road to rail.
Productivity Improved productivity of rolling stock, train crew and train control/signalling resources.
Reliability Improved rail freight reliability contributing to improved rail market share and lower rail cost structures.
Safety Reduced road accidents by facilitating increased rail market share and fewer road heavy vehicle safety incidents.
Reduced rail safety risk flowing from extension of signalling systems at Botany Yard and Cooks River (reduced probability of safeworking incidents).
Sustainability Reduced air pollution, greenhouse emissions, noise flowing from diversion of freight from road to rail.
Project Proposal Report (PPR)
Port Botany Rail Line Upgrade Stage 2 – Delivery Phase
April 2010 14 of 27
Table B3.2 Strategic fit – relationship to other projects
Project Description Impact on Botany/MFN Project Status Proponent Funding
Port Botany Expansion
Expansion of Port Botany to create five new shipping berths.
Essential to increase port container throughput.
New rail connection to Port Botany line.
Under construction. Stevedore appointed.
Sydney Ports Corporation
Sydney Ports Corp & Private Sector
Enfield Intermodal Logistics Centre
New intermodal terminal to handle port container traffic with capacity of 300,000 TEU per annum.
Served by the PBRL.
Essential to provide Intermodal Terminal capacity to meet NSW Government targets for rail-borne container traffic.
Base infrastructure under construction. Terminal operator selection underway
Sydney Ports Corporation
Sydney Ports Corp & Private Sector
Moorebank Intermodal Terminal
Potential intermodal terminal to handle longer term growth in both import/export and domestic markets
PBRL + SSFL provide freight-only connection between Port Botany and proposed Moorebank terminal.
Would provide additional intermodal capacity to cater for longer term growth in rail borne container traffic
Under consideration by Australian Government.
To be determined. To be determined.
Southern Sydney Freight Line
Freight only connection between PBRL at Sefton Park Junction and ARTC lease network at Macarthur.
Connects to Port Botany Rail Line.
PBRL +SSFL provide freight-only connection between; - Port Botany and proposed Moorebank terminal. - Chullora terminal & main southern line.
PBRL signalling and train control will be integrated with SSFL.
Under construction. ARTC ARTC
ARTC North-South Corridor Strategy
Package of works to capture increased rail market share in North-South Corridor (Melbourne-Sydney-Brisbane).
Sefton Park Junction-Chullora-Flemington section is part of the North-South corridor
Chullora Intermodal Terminal is located on this segment.
Component projects being progressively implemented.
ARTC ARTC and Australian Govt
Northern Sydney Freight Corridor
Package of works to provide additional freight capacity between Flemington and Broadmeadow
Additional freight volumes between North Flemington and Broadmeadow will feed into the PBRL.
Scoping phase. To be determined. Australian Government (Stage 1)
Project Proposal Report (PPR)
Port Botany Rail Line Upgrade Stage 2 – Delivery Phase
April 2010 15 of 27
C PLANNED OUTCOMES AND OUTPUTS
C1 Describe the performance objectives and intended outcomes for this project. Are there any known risks to the project which will impact on project completion
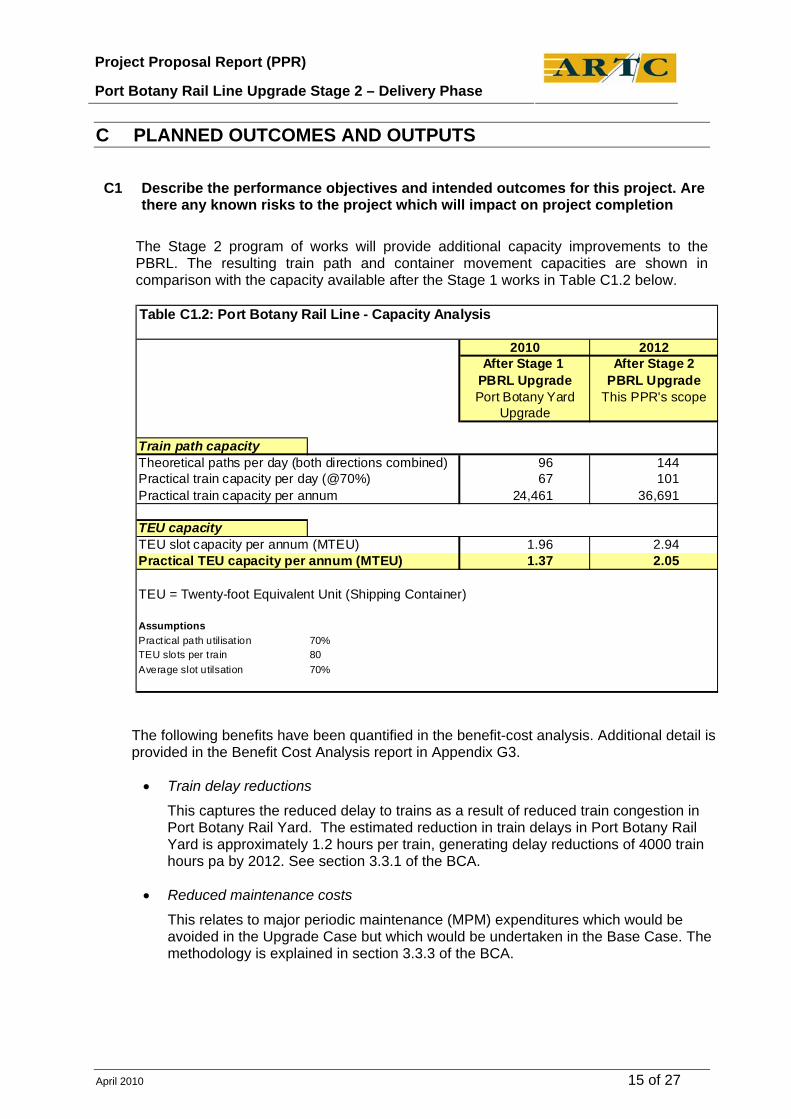
The Stage 2 program of works will provide additional capacity improvements to the PBRL. The resulting train path and container movement capacities are shown in comparison with the capacity available after the Stage 1 works in Table C1.2 below. Table C1.2: Port Botany Rail Line - Capacity Analysis
Train path capacityTheoretical paths per day (both directions combined) 96 144 Practical train capacity per day (@70%) 67 101 Practical train capacity per annum 24,461 36,691
TEU capacityTEU slot capacity per annum (MTEU) 1.96 2.94 Practical TEU capacity per annum (MTEU) 1.37 2.05
TEU = Twenty-foot Equivalent Unit (Shipping Container)
AssumptionsPractical path utilisation 70%TEU slots per train 80Average slot utilsation 70%
2010After Stage 1
Port Botany YardUpgrade
2012After Stage 2
This PPR's scopePBRL Upgrade PBRL Upgrade
The following benefits have been quantified in the benefit-cost analysis. Additional detail is provided in the Benefit Cost Analysis report in Appendix G3.
• Train delay reductions
This captures the reduced delay to trains as a result of reduced train congestion in Port Botany Rail Yard. The estimated reduction in train delays in Port Botany Rail Yard is approximately 1.2 hours per train, generating delay reductions of 4000 train hours pa by 2012. See section 3.3.1 of the BCA.
• Reduced maintenance costs
This relates to major periodic maintenance (MPM) expenditures which would be avoided in the Upgrade Case but which would be undertaken in the Base Case. The methodology is explained in section 3.3.3 of the BCA.
Project Proposal Report (PPR)
Port Botany Rail Line Upgrade Stage 2 – Delivery Phase
April 2010 16 of 27
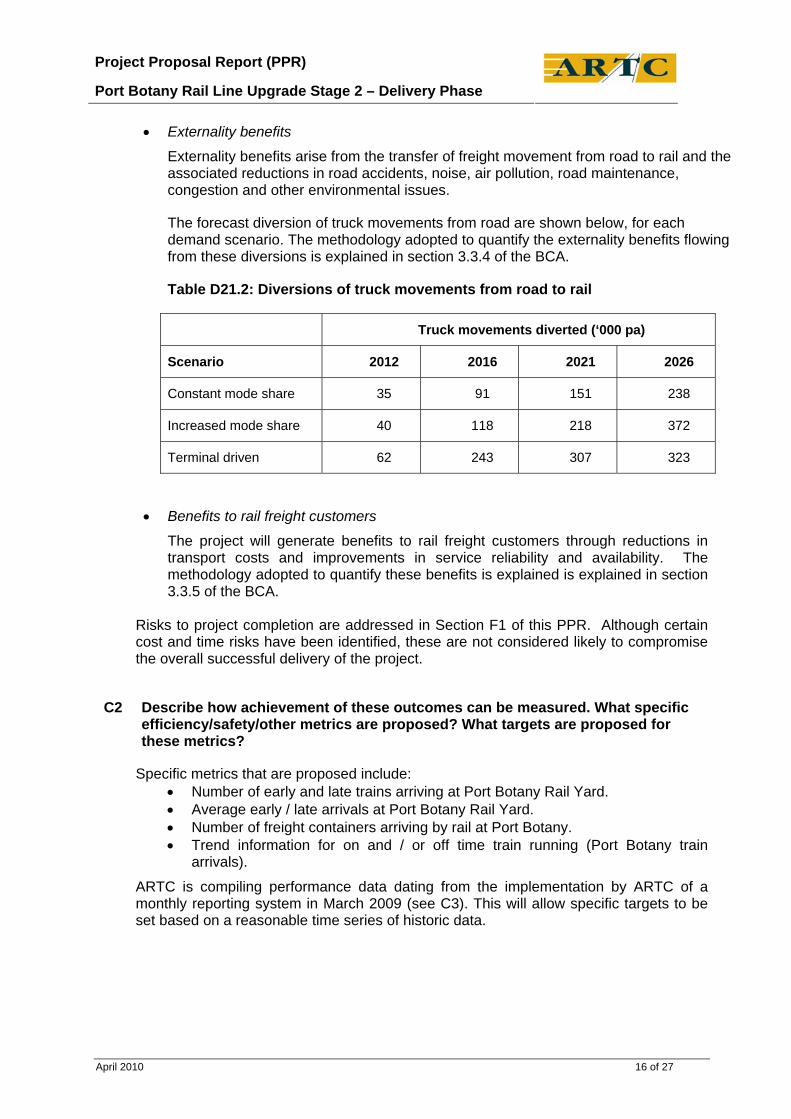
• Externality benefits
Externality benefits arise from the transfer of freight movement from road to rail and the associated reductions in road accidents, noise, air pollution, road maintenance, congestion and other environmental issues.
The forecast diversion of truck movements from road are shown below, for each demand scenario. The methodology adopted to quantify the externality benefits flowing from these diversions is explained in section 3.3.4 of the BCA.
Table D21.2: Diversions of truck movements from road to rail
Truck movements diverted (‘000 pa)
Scenario 2012 2016 2021 2026
Constant mode share 35 91 151 238
Increased mode share 40 118 218 372
Terminal driven 62 243 307 323
• Benefits to rail freight customers
The project will generate benefits to rail freight customers through reductions in transport costs and improvements in service reliability and availability. The methodology adopted to quantify these benefits is explained is explained in section 3.3.5 of the BCA.
Risks to project completion are addressed in Section F1 of this PPR. Although certain cost and time risks have been identified, these are not considered likely to compromise the overall successful delivery of the project.
C2 Describe how achievement of these outcomes can be measured. What specific efficiency/safety/other metrics are proposed? What targets are proposed for these metrics?
Specific metrics that are proposed include: • Number of early and late trains arriving at Port Botany Rail Yard. • Average early / late arrivals at Port Botany Rail Yard. • Number of freight containers arriving by rail at Port Botany. • Trend information for on and / or off time train running (Port Botany train
arrivals).
ARTC is compiling performance data dating from the implementation by ARTC of a monthly reporting system in March 2009 (see C3). This will allow specific targets to be set based on a reasonable time series of historic data.
Project Proposal Report (PPR)
Port Botany Rail Line Upgrade Stage 2 – Delivery Phase
April 2010 17 of 27
C3 Identify what baseline data is available for metrics identified in C2 against which to compare data recorded post project completion
ARTC took up the lease of Port Botany Rail Yard from RailCorp in December 2008. From March 2009 it implemented a monthly reporting system using available data from ARTC’s Daily Operating Plan for the yard. This monthly report is an interim measure pending the Port Botany Rail Line being integrated into the ARTC network (this application) that provides base line data on train numbers and delays (at arrival and departure from Port Botany Rail Yard). Post completion of this project the Daily Operating Plan reports will be replaced by ARTC’s established automated reporting processes however information on train numbers and delays will be broadly comparable. ARTC also has some historical data on train numbers and freight volumes prior to take up from RailCorp, the previous owner, and Sydney Ports Corporation who oversee the ports stevedore operation. There are also a number of studies and reports that provide additional data and information. The baseline data available to ARTC for Port Botany Rail Yard currently includes daily / weekly / monthly reports presenting data on: • Number of early trains each day / week / month • How early the earliest train is each day / week / month • How early on average each day / week / month are early trains • Number of late trains each day / week / month • How late the latest train is each day / week / month • How late each day / week / month on average are late trains • Number of freight containers arriving by rail • Trend information for on and / or off time train running (train arrivals).
C4 Describe the planned outputs from this project The outputs of these Stage 2 works are: • Separation of control of the PBRL from RailCorp and full control from the ARTC
Network Control Centre South at Junee.
• Provision of a staging facility at Enfield to allow trains to be held and resequenced away from the congested Port Botany Rail Yard, increasing capacity of the yard and the overall PBRL.
• New signalling in the section from Cooks River to Mascot to upgrade existing siding
tracks to achieve an effective mainline duplication in this segment, with resulting capacity benefits for the PBRL
The scope of works provided in section A5 above also provides a detailed list of individual works elements.
Project Proposal Report (PPR)
Port Botany Rail Line Upgrade Stage 2 – Delivery Phase
April 2010 18 of 27
D PROJECT APPROACH AND TIMING
D1 Has private financing been investigated Private sector financing of this project is not considered feasible, as the works will not generate a revenue stream to attract private sector investment.
Current rail access prices do not cover maintenance costs on the Port Botany line, and it will be a considerable turnaround challenge to bring the line to breakeven. Current access prices do not provide a revenue stream to service the investment required to upgrade the line. Increasing access prices to provide an incremental revenue stream to support private sector investment is not considered desirable or feasible. In the metropolitan and interstate markets, rail is a price taker – that is the charges that can be levied are effectively determined by the door-to-door prices charged by the road sector. Given the competitive dynamics between road and rail, seeking to increase access prices would serve to encourage a mode shift from rail to road, contrary to the established policy objective for the port logistics chain of increasing rail market share, and would diminish the economic benefits of the project.
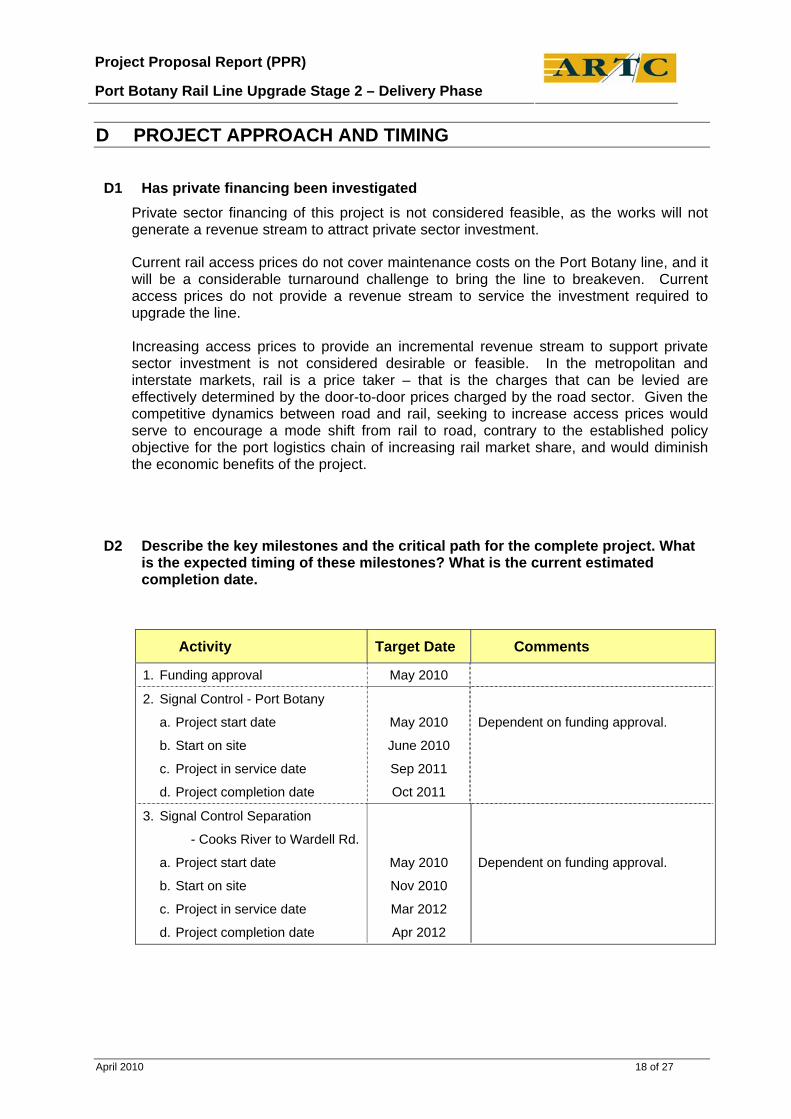
D2 Describe the key milestones and the critical path for the complete project. What is the expected timing of these milestones? What is the current estimated completion date.
Activity Target Date Comments
1. Funding approval May 2010
2. Signal Control - Port Botany
a. Project start date
b. Start on site
c. Project in service date
d. Project completion date
May 2010
June 2010
Sep 2011
Oct 2011
Dependent on funding approval.
3. Signal Control Separation
- Cooks River to Wardell Rd.
a. Project start date
b. Start on site
c. Project in service date
d. Project completion date
May 2010
Nov 2010
Mar 2012
Apr 2012
Dependent on funding approval.
Project Proposal Report (PPR)
Port Botany Rail Line Upgrade Stage 2 – Delivery Phase
April 2010 19 of 27
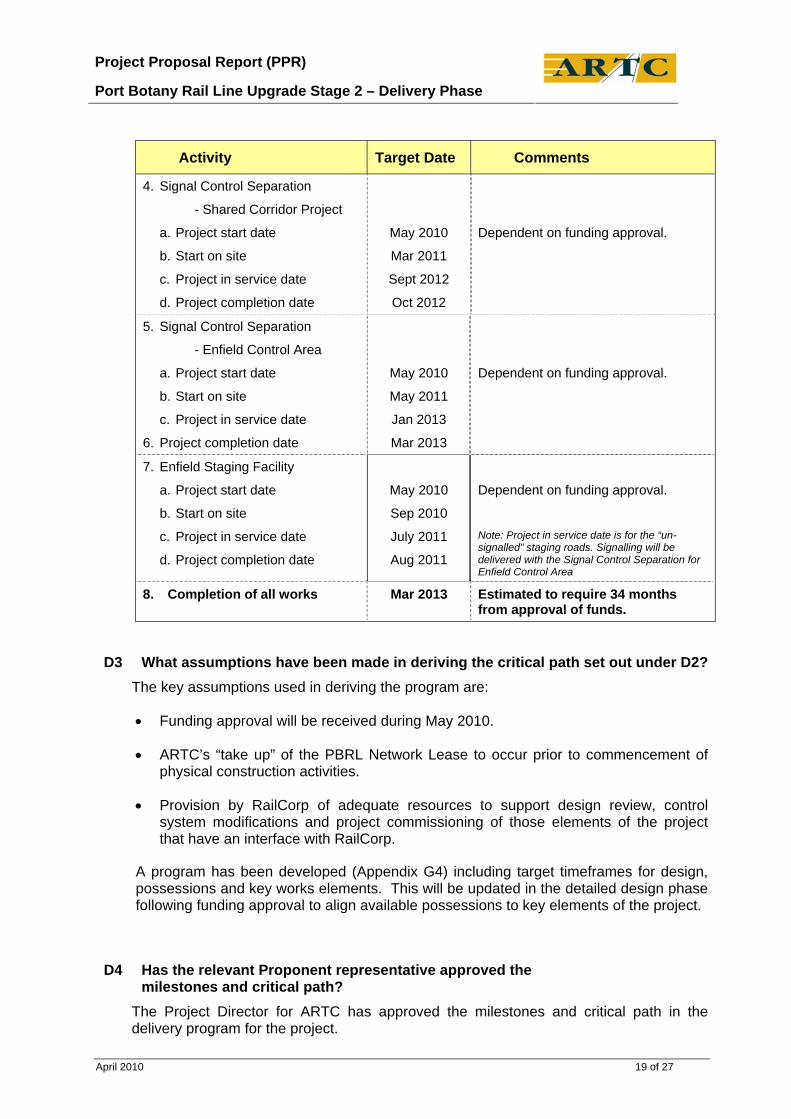
Activity Target Date Comments
4. Signal Control Separation
- Shared Corridor Project
a. Project start date
b. Start on site
c. Project in service date
d. Project completion date
May 2010
Mar 2011
Sept 2012
Oct 2012
Dependent on funding approval.
5. Signal Control Separation
- Enfield Control Area
a. Project start date
b. Start on site
c. Project in service date
6. Project completion date
May 2010
May 2011
Jan 2013
Mar 2013
Dependent on funding approval.
7. Enfield Staging Facility
a. Project start date
b. Start on site
c. Project in service date
d. Project completion date
May 2010
Sep 2010
July 2011
Aug 2011
Dependent on funding approval.
Note: Project in service date is for the “un-signalled” staging roads. Signalling will be delivered with the Signal Control Separation for Enfield Control Area
8. Completion of all works Mar 2013 Estimated to require 34 months from approval of funds.
D3 What assumptions have been made in deriving the critical path set out under D2? The key assumptions used in deriving the program are:
• Funding approval will be received during May 2010.
• ARTC’s “take up” of the PBRL Network Lease to occur prior to commencement of physical construction activities.
• Provision by RailCorp of adequate resources to support design review, control system modifications and project commissioning of those elements of the project that have an interface with RailCorp.
A program has been developed (Appendix G4) including target timeframes for design, possessions and key works elements. This will be updated in the detailed design phase following funding approval to align available possessions to key elements of the project.
D4 Has the relevant Proponent representative approved the milestones and critical path?
The Project Director for ARTC has approved the milestones and critical path in the delivery program for the project.
Project Proposal Report (PPR)
Port Botany Rail Line Upgrade Stage 2 – Delivery Phase
April 2010 20 of 27
E FINANCIAL ANALYSIS
Outturn Cost
E1 What is the anticipated Total Outturn Cost for the project
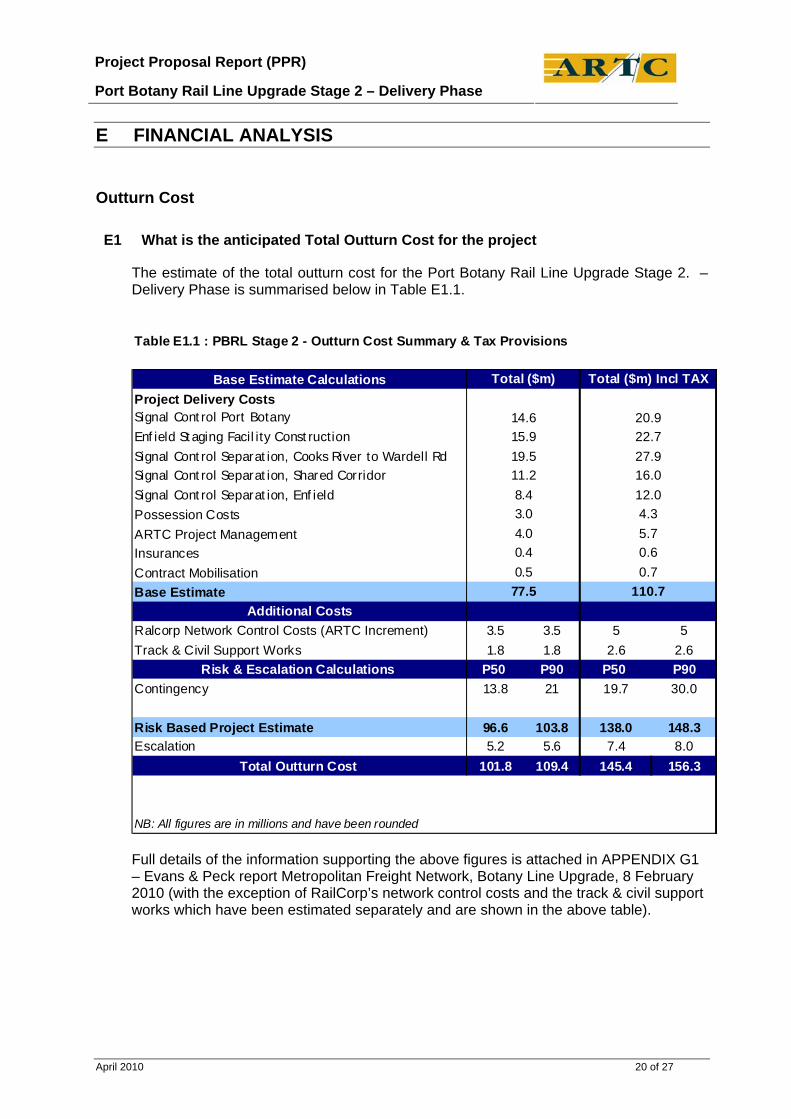
The estimate of the total outturn cost for the Port Botany Rail Line Upgrade Stage 2. – Delivery Phase is summarised below in Table E1.1.
Table E1.1 : PBRL Stage 2 - Outturn Cost Summary & Tax Provisions
Base Estimate CalculationsProject Delivery CostsSignal Control Port Botany Enfield Staging Facility Construction Signal Control Separation, Cooks River to Wardell Rd Signal Control Separation, Shared Corridor Signal Control Separation, Enfield Possession CostsARTC Project ManagementInsurancesContract MobilisationBase Estimate
Additional CostsRalcorp Network Control Costs (ARTC Increment) 3.5 3.5 5 5Track & Civil Support Works 1.8 1.8 2.6 2.6
Risk & Escalation Calculations P50 P90 P50 P90Contingency 13.8 21 19.7 30.0
Risk Based Project Estimate 96.6 103.8 138.0 148.3Escalation 5.2 5.6 7.4 8.0
Total Outturn Cost 101.8 109.4 145.4 156.3
NB: All figures are in millions and have been rounded
Total ($m)
14.615.919.511.28.43.04.00.40.5
77.5
Total ($m) Incl TAX
20.922.727.916.012.04.35.70.60.7
110.7
Full details of the information supporting the above figures is attached in APPENDIX G1 – Evans & Peck report Metropolitan Freight Network, Botany Line Upgrade, 8 February 2010 (with the exception of RailCorp’s network control costs and the track & civil support works which have been estimated separately and are shown in the above table).
Project Proposal Report (PPR)
Port Botany Rail Line Upgrade Stage 2 – Delivery Phase
April 2010 21 of 27
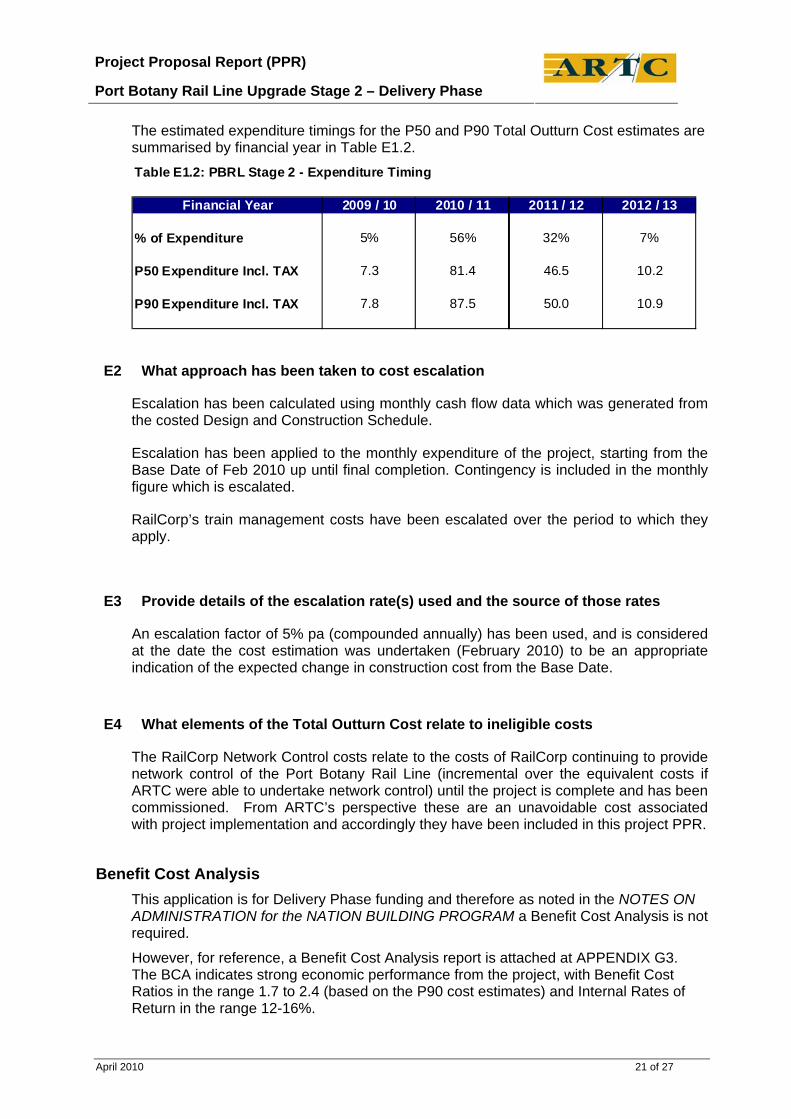
The estimated expenditure timings for the P50 and P90 Total Outturn Cost estimates are summarised by financial year in Table E1.2.
Table E1.2: PBRL Stage 2 - Expenditure Timing
Financial Year 2009 / 10 2010 / 11 2011 / 12 2012 / 13
% of Expenditure 5% 56% 32% 7%
P50 Expenditure Incl. TAX 7.3 81.4 46.5 10.2
P90 Expenditure Incl. TAX 7.8 87.5 50.0 10.9
E2 What approach has been taken to cost escalation
Escalation has been calculated using monthly cash flow data which was generated from the costed Design and Construction Schedule.
Escalation has been applied to the monthly expenditure of the project, starting from the Base Date of Feb 2010 up until final completion. Contingency is included in the monthly figure which is escalated.
RailCorp’s train management costs have been escalated over the period to which they apply.
E3 Provide details of the escalation rate(s) used and the source of those rates
An escalation factor of 5% pa (compounded annually) has been used, and is considered at the date the cost estimation was undertaken (February 2010) to be an appropriate indication of the expected change in construction cost from the Base Date.
E4 What elements of the Total Outturn Cost relate to ineligible costs
The RailCorp Network Control costs relate to the costs of RailCorp continuing to provide network control of the Port Botany Rail Line (incremental over the equivalent costs if ARTC were able to undertake network control) until the project is complete and has been commissioned. From ARTC’s perspective these are an unavoidable cost associated with project implementation and accordingly they have been included in this project PPR.
Benefit Cost Analysis This application is for Delivery Phase funding and therefore as noted in the NOTES ON ADMINISTRATION for the NATION BUILDING PROGRAM a Benefit Cost Analysis is not required.
However, for reference, a Benefit Cost Analysis report is attached at APPENDIX G3. The BCA indicates strong economic performance from the project, with Benefit Cost Ratios in the range 1.7 to 2.4 (based on the P90 cost estimates) and Internal Rates of Return in the range 12-16%.
Project Proposal Report (PPR)
Port Botany Rail Line Upgrade Stage 2 – Delivery Phase
April 2010 22 of 27
F RISK AND GOVERNANCE
F1 Identify the major risks, and proposed mitigation strategies, to successful delivery of this phase and the overall project.
Safety & Business Risks
ARTC’s approach to risk management is based on AS / NZS ISO 31000:2009 (formerly AS / NZS 4360) Risk Management and AS4292.1 Rail Safety Risk Management. All ARTC activities are subject to ARTC’s established Risk Management Policy, Risk Management Procedure and relevant Work Instructions.
Project design has been carried forward to a level sufficient to allow works to be well articulated with programs and budgets identified. The design uses well known and proven technology being applied by an experienced and qualified design team. Developing detailed final designs is not expected to generate any significant unforseen risks.
The Project Delivery phase will involve changes to existing rail infrastructure and will require construction activities to be carried out within an operating rail corridor. ARTC recognises the risks associated with works of this nature and has significant experience in successfully carrying out work in similar environments. Information has been sought from RailCorp the long term previous owner of existing infrastructure and detailed site surveys and inspections have been carried out and will continue as a precondition of finalising designs.
ARTC will undertake the following risk management activities prior to and during construction:
• Risk assessment within the design development process (which is ongoing).
• Risk assessment ahead of construction activities to address both the activities themselves and their interaction with ongoing operations.
• Establish and manage a Project Risk Register for the upgrade works. This will be created as a local risk register within ARTC’s Corporate Risk Register.
• Project risk assessments will be maintained until project completion when any
residual risks will be transferred to the North South corridor risk register within the Corporate Risk Register.
• Ongoing consultation, briefings and workshops with RailCorp, operators, stevedores and Sydney Ports Corporation so that they are aware and informed on the type, extent and timings of works that are carried out.
• Other risk management activities that may be identified as necessary during the ongoing planning and execution of Port Botany Rail Line upgrade works (the subject of this PPR application).
The type of works proposed are being undertaken by ARTC elsewhere on the network on a regular basis. It is considered unlikely that major or unacceptable risks will be encountered.
Project Proposal Report (PPR)
Port Botany Rail Line Upgrade Stage 2 – Delivery Phase
April 2010 23 of 27
Cost and time risks
The following key potential risks to final outturn costs and timing have been identified:
- RailCorp resources - design and design approvals by RailCorp has been identified as a critical item and RailCorp’s resources are known to be constrained. In addition the availability of RailCorp resources to make necessary alterations to RailCorp infrastructure and systems (in particular RailCorp’s ATRICS control system) and to participate in signalling commissioning processes will be critical. ARTC will be seeking to develop and agree with RailCorp the overall program and resource requirements as critical early activity.
- Contamination – appropriate allowances has been provided for in the project budget for treatment and if required off-site disposal of contaminated materials.
- Existing services – this is an existing rail corridor and records of existing services have been considered in design work carried out to date. Additional survey and services searches will be carried as the design and construction is carried out however there remains some risk that previously unidentified services will be found.
- Operational impacts – there may be a need to re-cast the delivery program if operational impacts prove unacceptable to train operators or other critical stakeholders in the port logistics chain. ARTC is currently in liaison with rail operators in the development of a possessions schedule that balances works implementation against operational impacts.
The program / timing risks have been considered during development of the delivery program and appropriate contingency time allowances have been included. The cost risks arising from these issues have been considered in developing the P50 and P90 estimates presented in this PPR.
F2 Is a tender exemption being sought?
The provisions of Section 24 do not apply as the recipient of the funding is not a State or an authority of a State.
ARTC policy is to regularly test rates in the market place and given its significant works program it holds recent and proven information and knowledge on market rates. ARTC is presently assessing its procurement approach to these works which will either follow a tender process and / or an extension of existing contracts that have been market tested.
Project Proposal Report (PPR)
Port Botany Rail Line Upgrade Stage 2 – Delivery Phase
April 2010 24 of 27
F3 If applying for Development or Delivery Phases, will this project trigger any environmental or cultural legislation
The requirements of relevant environmental and cultural legislation are summarised below.
NSW Planning Legislation
• The State Environmental Planning Policy (Infrastructure) 2007 (Infrastructure SEPP) applies to the works.
• Under the Infrastructure SEPP development of rail infrastructure facilities does not require consent and the works are self-assessable by ARTC under Part 5 of the NSW Environmental Planning and Assessment Act 1979 (EP&A Act).
• ARTC has a Code of Practice for Environmental Impact Assessment of Development Proposals in New South Wales (ARTC Code of Practice) which applies to assessment of the project under Part 5 of the EP&A Act.
• The ARTC Code of Practice provides a process for determining the level of Environmental Impact Assessment that will be required for each sub-project.
• A draft Review of Environmental Factors has been prepared for the Enfield Staging Facility and is currently being assessed by ARTC.
• Additional assessments will be undertaken to address the other sub projects and assessed by ARTC before approvals are given for construction works to commence.
Commonwealth Legislation
• The works do not impact on matters of National Environmental Significance and accordingly a referral under the Commonwealth Environment Protection and Biodiversity Conservation Act 1999 (EPBC Act) is not required.
• The site is not subject to any active native title claims and accordingly requirements of the Native Title Act 1993 are not applicable.
Other Relevant NSW Legislation
• ARTC’s existing Environment Protection Licence (EPL) issued under the Protection of the Environment Operations Act 1997 covers railway systems activities. Concurrently with ARTC’s Lease of the PBRL, an amendment to the EPL will be obtained to include the PBRL within the definition of ARTC’s premises. A separate EPL for certain noise-emitting construction activities may also be required – this will be assessed in the environmental assessments for each sub project.
• No other requirements for NSW approvals have been identified, although ARTC has certain obligations in relation to the Noxious Weeds Act 1993, Water Management Act 2000 and Waste Avoidance and Resource Recovery Act 200 that it will need to adhere to during implementation of the works.

Project Proposal Report (PPR)
Port Botany Rail Line Upgrade Stage 2 – Delivery Phase
April 2010 25 of 27
Other NSW State Environmental Planning Policies
• The project consists of a series of physically separable sub-projects which individually cost less than $30m and have stand alone benefits. Accordingly the State Environmental Planning Policy (Major Projects) 2005 (Major Projects SEPP) does not apply
• The State Environmental Planning Policy No. 55 – Remediation of Land requires ARTC to consider whether the land is suitable (or can be made suitable) for the proposed development. Relevant contamination investigation will be undertaken as part of the environmental assessment for each sub-project.
F4 How will public and stakeholder participation be facilitated during this project
During the Project Delivery stage ARTC will maintain industry consultation with the previously identified stakeholders and appropriate stakeholder notifications will be given before works commence.
The project has a significant interface with other projects of broader community concern, in particular Sydney Ports Corporation’s expansion of Port Botany and its proposed Enfield Intermodal Logistics Centre. ARTC is already cooperating closely with Sydney Ports Corporation and other relevant NSW Government Agencies to manage any issues that arise (e.g. any community concerns about increasing rail volumes).
ARTC maintains a fortnightly meeting with the operators and stevedores in relation to Port Botany Rail Yard operations and this will be utilised as a key communications forum with these stakeholders during construction. In addition, at a more strategic level, a Port Botany Rail Team (PBRT), facilitated by Sydney Ports Corporation, has en established with all rail and stevedore stakeholders to progress reform of the rail logistics chain. ARTC will keep the PBRT informed of progress on the PBRL upgrade works.
Project Proposal Report (PPR)
Port Botany Rail Line Upgrade Stage 2 – Delivery Phase
April 2010 26 of 27
G Attachments
G1 Forecast Outturn Investment Costs
G2 Port Botany Rail Line Upgrade Stage 2 – Engineering Drawings
G3 Port Botany Rail Line Upgrade Stage 2 – Delivery Phase Benefit-Cost Analysis
G4 Project Gantt Chart
I acknowledge the information set out in this PPR is an accurate representation of available information.
Terry Bones
Project Director, ARTC
21 April 2010
Project Proposal Report (PPR)
Port Botany Rail Line Upgrade Stage 2 – Delivery Phase
G1 Forecast Outturn Investment Costs
Evans & Peck Report Port Botany Line Upgrade (Stage 2) – Risk Model for Project Cost Estimates 8 February 2010
Australian Rail Track Corporation (ARTC) Metropolitan Freight Network, Port Botany Line Upgrade (Stage 2)
Risk Model for Project Cost Estimates
FINAL DRAFT 8 February 2010
COMMERCIAL IN CONFIDENCE

Risk Model for Project Cost Estimates
Metropolitan Freight Network, Port Botany Line Upgrade (Stage 2)
COMMERCIAL IN CONFIDENCE S:\23592 - ARTC Botany Line Project\Working\04 Working\02 Reporting\20100208 ARTC MFN PBLU Stage 2 Report FINAL DRAFT.docx
i
Table of Contents 1 EXECUTIVE SUMMARY 1 2 BRIEF 2 3 INFORMATION PROVIDED 2 4 METHOD 3 5 BASE ESTIMATE SUMMARY 3 5.1 General 3 5.2 Methodology 3 5.3 Direct Costs (DC’s) 4 5.4 Indirect Costs (IC’s) 5 5.5 Client Costs (CC’s) 5 5.6 Contingency and Escalation 6 5.7 Design and Construction Schedule 6 5.8 Base Estimate 6 6 ASSUMPTIONS & QUALIFICATIONS 8 6.1 Base Estimate 8 6.2 Design and Construction Schedule 8 6.2.1 General 8 6.2.2 Costs 8 6.3 Risk Model 9 7 RISK AND CONTINGENCY 9 7.1 Introduction 9 7.2 Methodology 9 7.3 Risk model inputs 10 7.4 Outcomes 10 8 CASH-FLOW AND ESCALATION 12 9 OUTTURN COST 14
Risk Model for Project Cost Estimates
Metropolitan Freight Network, Port Botany Line Upgrade (Stage 2)
COMMERCIAL IN CONFIDENCE ii
List of Figures
Figure 1 - Cumulative distribution outcome of model
Figure 2 - P50 Cashflow
Figure 3 - P90 Cashflow
List of Tables
Table 1 - Indirect Cost Percentages
Table 2 - Base Estimate Summary
Table 3 - Key P values
Table 4 - Contingency Amounts
Table 5 - Total Outturn cost
COMMERCIAL IN CONFIDENCE 1
Risk Model for Project Cost Estimates
Metropolitan Freight Network, Port Botany Line Upgrade (Stage 2)
1 EXECUTIVE SUMMARY
Evans & Peck (E&P) was requested by Australian Rail Track Corporation (ARTC) to
conduct a P90 Quantitative Risk Analysis for the Port Botany Line Upgrade – Stage 2
(PBLU) project budgets. The risk analysis has been based on cost estimates which have
been prepared by AECOM and Downer EDI Works (DEW). E&P has not conducted a review
of the cost estimates.
The work, along with associated services, is required to support a Project Proposal Report
(PPR) which is to be submitted to the Australian Government for funding, to a standard
required by the Department of Infrastructure, Transport, Regional Development and Local
Government (DITRDLG).
The scope of the work is predominantly signalling separation. A quantitative risk
assessment was carried out involving ARTC, AECOM and DEW, with the workshop
facilitated by Evans & Peck.
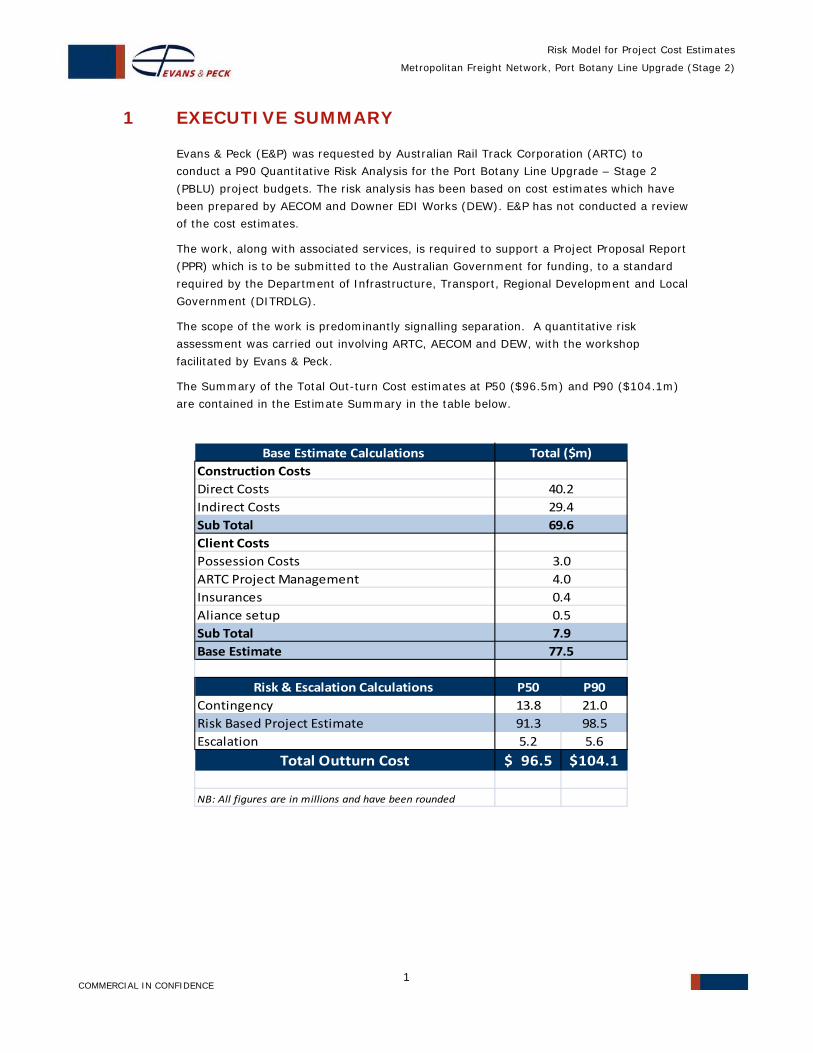
The Summary of the Total Out-turn Cost estimates at P50 ($96.5m) and P90 ($104.1m)
are contained in the Estimate Summary in the table below.
Base Estimate Calculations Construction Costs Direct Costs Indirect Costs Sub TotalClient Costs Possession Costs ARTC Project ManagementInsurances Aliance setupSub TotalBase Estimate
Risk & Escalation Calculations P50 P90Contingency 13.8 21.0Risk Based Project Estimate 91.3 98.5Escalation 5.2 5.6
Total Outturn Cost 96.5$ 104.1$
NB: All figures are in millions and have been rounded
7.977.5
3.04.00.40.5
Total ($m)
40.229.469.6
Risk Model for Project Cost Estimates
Metropolitan Freight Network, Port Botany Line Upgrade (Stage 2)
COMMERCIAL IN CONFIDENCE 2
2 BRIEF
Evans & Peck (E&P) was requested by Australian Rail Track Corporation (ARTC) to
conduct a P90 Quantitative Risk Analysis for the Port Botany Line Upgrade – Stage 2
(PBLU) project budgets. The risk analysis has been based on cost estimates which have
been prepared by AECOM and Downer EDI Works (DEW). E&P has not conducted a review
of the cost estimates.
The work, along with associated services, is required to support a Project Proposal Report
(PPR) which is to be submitted to the Australian Government for funding, to a standard
required by the Department of Infrastructure, Transport, Regional Development and Local
Government (DITRDLG).
As part of the engagement, E&P was also required to:
Receive and collate various costs and associated data (estimates, assumptions,
work scope) from AECOM, DEW and ARTC.
Prepare the project work break down structures in a format suitable for risk
assessment.
Conduct a quantitative risk assessment in a joint workshop.
Assist in the development of a design and construction program.
Allocate project costs to appropriate activity level of the schedule.
Following the risk workshop, determine the P90 value for the Works Program for
inclusion in the PPR.
Establish likely cash-flow and escalation allowances for the project, in order to
calculate the outturn cost at P90.
3 INFORMATION PROVIDED
Throughout the process, E&P was supplied with project cost information from ARTC,
AECOM and DEW.
The type of information includes:
Work Scopes (Concept)
Cost Estimates (Direct, Indirect and Client Costs)
Assumptions and Qualifications
Program Inputs
Various correspondence (emails, etc).
A full list of information provided is outlined in Appendix 1.
Risk Model for Project Cost Estimates
Metropolitan Freight Network, Port Botany Line Upgrade (Stage 2)
COMMERCIAL IN CONFIDENCE 3
4 METHOD
The cost estimates for MFN PBLU (Stage 2) works have been prepared by AECOM, DEW
and ARTC. E&P has used these cost estimates to form the base estimate, which was then
utilised to prepare a risk based estimate. The scope and assumptions of the base estimate
are described in more detail in Section 5 – Base Estimate Summary, and includes
discussion on:
General estimate information
Methodology
Direct Costs
Indirect Costs
Client Costs, and
Design and Construction Schedule.
A Quantitative Risk Assessment workshop was carried out on 2 December 2009 (with
representatives from ARTC, DEW, AECOM and E&P), in order to test the assumptions,
made by the estimators in the cost estimates and also to quantify the inherent and
contingent risks associated with the project. This process is described in more detail in
Section 7 – Quantitative Risk Assessment. Refer to Appendix 3 for a list of workshop
attendees and Agenda.
A @Risk Simulation (Monte Carlo Analysis) was then carried out in order to produce the
risk based cost estimate probability distributions. The input data and the @Risk model
outputs are included in Appendices 7, 8 and 9.
5 BASE ESTIMATE SUMMARY
5.1 General
The contract delivery method assumed for the project is Alliance, as advised by ARTC.
The compilation of figures derived from all the signalling, communications, track and civil
estimates amounts to a Total Construction Cost which includes:
Direct Contractor Costs
Indirect Contractor Costs
Client Costs (as advised)
Contingency allowances for Risk Cover to both Contractor and Client Costs
Escalation from the base date of February 2010 until the date of expected project
completion.
5.2 Methodology
In the process of compiling the estimates, the works for PBLU (Stage 2) were initially
assessed in their five project groups:
Botany Yard (BY)
Risk Model for Project Cost Estimates
Metropolitan Freight Network, Port Botany Line Upgrade (Stage 2)
COMMERCIAL IN CONFIDENCE 4
Cooks River – Wardell Road (CR-WR)
Shared Corridor (SC)
Enfield Yard (EY), and
Enfield Staging Roads (ESR).
The groups were then rationalised and where necessary amalgamated in order to
facilitate an efficient Risk Assessment.
The Direct Costs for BY were treated independently as this package is wholly ARTC
owned, reasonably low risk work with minimal RailCorp interface. This project is deemed
to be Priority 1.
ESR had a reasonably well defined scope, based primarily on Track and Civil Works (as
opposed to Signals and Communications). This project is considered Priority 2.
The Direct Costs for CR-WR and SC were combined as they were considered to be similar
in nature and status at the time (eg. more ARTC/RailCorp interface, more complexities,
possibly optional stages of work). NB: These two projects were later shown separately in
the Base Estimate Summary.
EY was treated as a separate package of Direct Costs. The attributes of this work are
similar to CR-WR and SC.
Indirect Costs and Client Costs were assessed as global items i.e. Applicable to all Direct
Construction Costs.
5.3 Direct Costs (DC’s)
The DC’s represent the cost of performing the work and include materials, plant, labour
and sub-contract items. All the DC’s for the project works were provided to E&P by
others for review and compilation.
The DC’s were first broken down to a suitable level. Then elements of the totals which
belonged in other categories were stripped out (eg. overheads, safe-working,
contingencies). Allowances for like items, such as comms, microloks and relays, were
merged into a combined item.
The majority of the costs in each of the project DC’s are related to Signalling Installation
activities.
Other recurring elements in each of the projects are:
Installation of Communications
Train Control (Phoenix, ATRUS, T&D)
Track Works
RailCorp (including Installation and T&C)
CountryNet Radio.
The DC’s for the five packages amount to approximately $40m for the Program.
A compilation of the Direct Cost Estimates is provided in Appendix 2 – Base Estimate
Summary.
Risk Model for Project Cost Estimates
Metropolitan Freight Network, Port Botany Line Upgrade (Stage 2)
COMMERCIAL IN CONFIDENCE 5
5.4 Indirect Costs (IC’s)
The IC’s were categorised into one global grouping, applicable to all the works across the
program.
The Main elements of the IC’s are:
1. Design Costs (including RailCorp Review/Approval)
2. Project Management
3. Contingency (excluded from Risk Model)
4. Project overheads
5. Margins
All the IC’s were provided to E&P by others. In some cases the figures have been
determined by building up resourced rates and in other cases the IC’s are % factors of
other activities (eg. Construction Phase Service = 10% of Detailed Design).
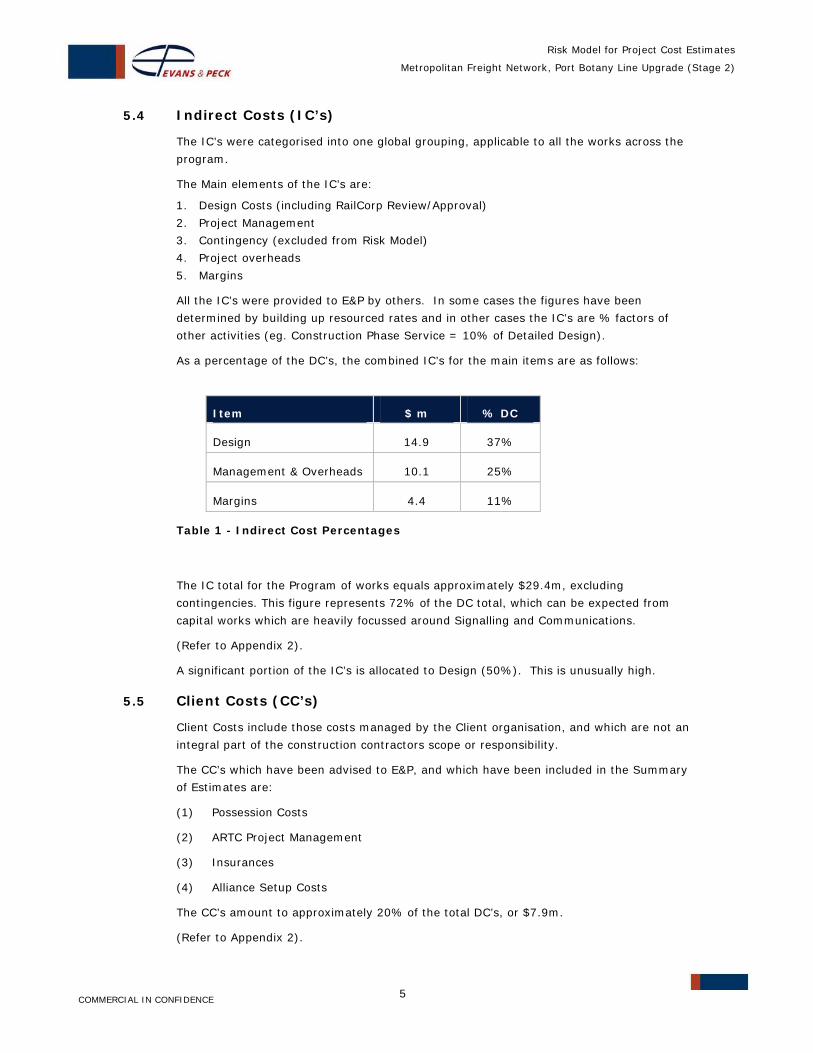
As a percentage of the DC’s, the combined IC’s for the main items are as follows:
Item $ m % DC
Design 14.9 37%
Management & Overheads 10.1 25%
Margins 4.4 11%
Table 1 - Indirect Cost Percentages
The IC total for the Program of works equals approximately $29.4m, excluding
contingencies. This figure represents 72% of the DC total, which can be expected from
capital works which are heavily focussed around Signalling and Communications.
(Refer to Appendix 2).
A significant portion of the IC’s is allocated to Design (50%). This is unusually high.
5.5 Client Costs (CC’s)
Client Costs include those costs managed by the Client organisation, and which are not an
integral part of the construction contractors scope or responsibility.
The CC’s which have been advised to E&P, and which have been included in the Summary
of Estimates are:
(1) Possession Costs
(2) ARTC Project Management
(3) Insurances
(4) Alliance Setup Costs
The CC’s amount to approximately 20% of the total DC’s, or $7.9m.
(Refer to Appendix 2).
Risk Model for Project Cost Estimates
Metropolitan Freight Network, Port Botany Line Upgrade (Stage 2)
COMMERCIAL IN CONFIDENCE 6
5.6 Contingency and Escalation
The Base Estimate Summary does not allow for Contingency or Escalation. These items
are addressed separately and are further described in subsequent sections of this report.
5.7 Design and Construction Schedule
E&P assisted with the development of a preliminary design and construction schedule
which was used to plan and sequence the works, as well as the calculation of time related
indirect costs associated with the project. The schedule was then used to forecast cash-
flow, from which escalation allowances for the duration of the project were derived.
A copy of the construction schedule is included as Appendix 4.
The current preliminary construction schedule indicates construction duration of
approximately 36 weeks. All time-based indirect costs are based on this duration.
The current schedule is a result of a workshop which was recently held by AECOM (27 Jan
2010. A set of Amendment Notes to the schedule was also produced by AECOM
subsequent to the meeting. A copy of this is attached as Appendix 6.
(NB. A noteworthy outcome from the workshop is that the duration originally allocated to
Commercial Mobilisation was set to zero).
A list of people and organisations which provided input to the schedule is attached as
Appendix 5.
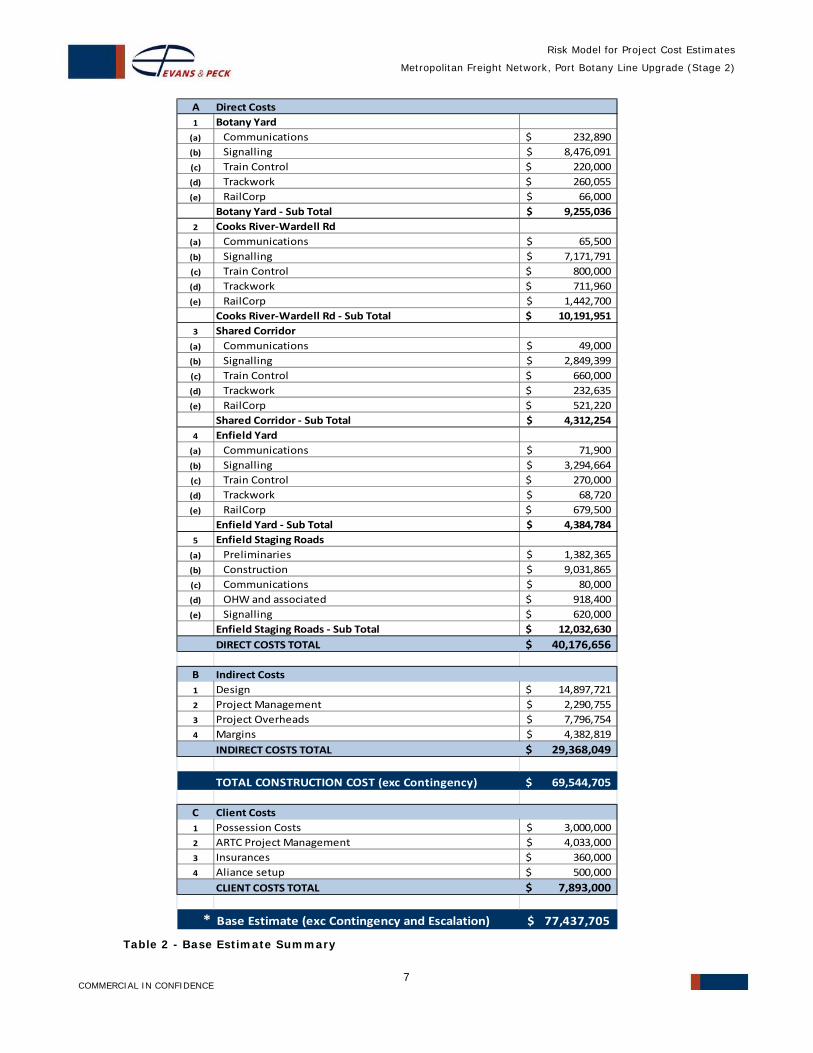
5.8 Base Estimate
The Base Estimate summary is made up of the components described above. The costs
have been estimated at a Base Date of February 2010, and are subject to a quantitative
risk assessment and cost escalation in accordance with the project program. The Base
Estimate Summary, covering all five projects within the MFN program is contained in the
table below:
COMMERCIAL IN CONFIDENCE 7
Risk Model for Project Cost Estimates
Metropolitan Freight Network, Port Botany Line Upgrade (Stage 2)
A Direct Costs1 Botany Yard (a) Communications 232,890$ (b) Signalling 8,476,091$ (c) Train Control 220,000$ (d) Trackwork 260,055$ (e) RailCorp 66,000$
Botany Yard ‐ Sub Total 9,255,036$ 2 Cooks River‐Wardell Rd(a) Communications 65,500$ (b) Signalling 7,171,791$ (c) Train Control 800,000$ (d) Trackwork 711,960$ (e) RailCorp 1,442,700$
Cooks River‐Wardell Rd ‐ Sub Total 10,191,951$ 3 Shared Corridor(a) Communications 49,000$ (b) Signalling 2,849,399$ (c) Train Control 660,000$ (d) Trackwork 232,635$ (e) RailCorp 521,220$
Shared Corridor ‐ Sub Total 4,312,254$ 4 Enfield Yard (a) Communications 71,900$ (b) Signalling 3,294,664$ (c) Train Control 270,000$ (d) Trackwork 68,720$ (e) RailCorp 679,500$
Enfield Yard ‐ Sub Total 4,384,784$ 5 Enfield Staging Roads(a) Preliminaries 1,382,365$ (b) Construction 9,031,865$ (c) Communications 80,000$ (d) OHW and associated 918,400$ (e) Signalling 620,000$
Enfield Staging Roads ‐ Sub Total 12,032,630$ DIRECT COSTS TOTAL 40,176,656$
B Indirect Costs 1 Design 14,897,721$ 2 Project Management 2,290,755$ 3 Project Overheads 7,796,754$ 4 Margins 4,382,819$ INDIRECT COSTS TOTAL 29,368,049$
TOTAL CONSTRUCTION COST (exc Contingency) 69,544,705$
C Client Costs 1 Possession Costs 3,000,000$ 2 ARTC Project Management 4,033,000$ 3 Insurances 360,000$ 4 Aliance setup 500,000$
CLIENT COSTS TOTAL 7,893,000$
* Base Estimate (exc Contingency and Escalation) 77,437,705$
Table 2 - Base Estimate Summary
Risk Model for Project Cost Estimates
Metropolitan Freight Network, Port Botany Line Upgrade (Stage 2)
COMMERCIAL IN CONFIDENCE 8
6 ASSUMPTIONS & QUALIFICATIONS
6.1 Base Estimate
Lump sums for the following items have been split as follows against Design and
Construction elements in the following proportions: (a) Phoenix 80/20%, (b)
ATRICS 80/20%, (c) Communications at Enfield Staging Roads 20/80%.
Lump sums have been apportioned as follows for the following items: (a) MISS
Testing – PB 1/3, CR-WR 1/3 & SC 1/3, (b) CountryNet – BY 85%, CR-WR 5%, SC
5%, EY 5%.
RailCorp cost estimates have been allocated into the relevant categories i.e. Direct
Costs and indirect Costs and do not form part of the Client Cost Group.
The number of possessions required has been assumed at 12No, at a cost of $250k
each.
The costs estimates produced by AECOM and DEW assumed that the projects would
be delivered under an Alliance procurement method.
6.2 Design and Construction Schedule
6.2.1 General
PB Civil works will be completed in a timeframe to support the signalling works in
that yard as part of this program of works.
The decision regarding the preferred ESR option, and whether to proceed with
various detailed design, should be made in accordance with dates indicated in the
program.
The initial (un-signalled) ESR project is dependent on the use of the existing entry
and exit turnouts into the area being used exclusively for the project.
Possessions have been scheduled in accordance with the RailCorp Config 10
possessions program. Documents used and dates obtained are included in
Appendix 7.
Duration for long lead items has utilised the durations from the Signalling
Specifications where appropriate.
It is noted that RailCorp’s technical input incorporated in the estimates is limited to
the information from discussions with RailCorp’s engineering staff. As yet a RailCorp
project team has not been established.
6.2.2 Costs
MISS testing has been allocated into Testing and Commissioning of Signals.
WAE information for track and civil components has been assumed at 5% of design
costs.
Telemetry and data design costs have been placed into Train Control Design.
Telemetry and data installation costs have been placed into Train Control
Construction.
RailCorp design approval has been split 20/80 against concept/detailed design
phases.
Risk Model for Project Cost Estimates
Metropolitan Freight Network, Port Botany Line Upgrade (Stage 2)
COMMERCIAL IN CONFIDENCE 9
Margins have been spread across the projects at Program Level (L1).
Overheads have been allocated at the Program Level (L1).
RailCorp costs have been allocated at the Phase Level (L3) within each project.
All other costs have been allocated to Engineering Discipline Level (L4) within the
relevant projects.
6.3 Risk Model
As part of the risk allocation, some of the ranges were assessed independently and
others were aligned determined via a prorated base group i.e. base group +10%.
Escalation has been excluded from the Risk Model.
Common elements of work were merged for the purpose of running the model.
7 RISK AND CONTINGENCY
7.1 Introduction
The base estimate developed for the project does not contain any allowance for risk; it
reflects the cost of the project based on the assumptions used to develop the estimate.
To assist in determining an appropriate contingency amount, the base estimate is used to
develop a model to reflect uncertainty in terms of rate and quantity as well as making
allowances for unplanned events that may occur. Using a Monte Carlo simulation, a range
of possible project cost outcomes is determined.
7.2 Methodology
A probabilistic risk model has been used to develop a possible range of outcomes for the
project cost. Uncertainty in the model can generally be grouped in two main areas:
1. Inherent risk – risk that relates to uncertainty with regards to the rates or
quantities used in the original cost estimate; and
2. Contingent risk – risk where there is some uncertainty (% probability) regarding
the occurrence of the risk, or where the quantum of the risk issue can vary based on
the severity of the issue, when it eventuates.
The model considers the range of possible outcomes for inherent and contingent risks. To
specify the range for key items in the estimate, three points are determined: a minimum
value (best case scenario); most likely value and a maximum value (worst case scenario).
Given the assumptions made in the base estimate and current information available,
ranges were assigned to relevant activity levels a required. These values were established
in the Quantitative Risk Workshop (2 December 2009) and were further reviewed and
finalised during a meeting held at E&P’s Chatswood offices on Wednesday 9th February,
2010.
Risk Model for Project Cost Estimates
Metropolitan Freight Network, Port Botany Line Upgrade (Stage 2)
COMMERCIAL IN CONFIDENCE 10
7.3 Risk model inputs
To compile the risk model, a range of values (best case, most likely and worst case) were
determined for each element of the cost summary developed. The ranges used for the
inherent risks were based on:
(a) The level of design information available at the time, and
(b) The collective past experiences and lessons with projects of a similar scale and scope
of the workshop participants.
Where a greater amount of uncertainty exists with regards to a particular construction
activity a wide risk range is used, and conversely where more certainty on a particular
component exists, a narrower range is adopted. In general, the ranges used reflect the
level of design information available at the current stage of the project.
The probability assigned and ranges used for each risk item of the contingent schedule
reflect the outcome of the workshop discussions as well as subsequent consideration by
E&P.
The inherent and contingent risk considerations used in the risk model are attached in
Appendices 8 and 9.
7.4 Outcomes
The inputs of the model are used to perform a Monte Carlo simulation (using @Risk
software) to generate a range of possible outcome values. These values are plotted to
reflect the cumulative probability against the likely cost of that given probability. P-values
denote the probability that the outcome values will be less than or equal to corresponding
monetary value. For example, a P50 value represents a 50% likelihood that the outcome
value will be less than or equal to the corresponding monetary value. For budgetary
purposes, it is recommended that a P90 value be used. This represents a 90% probability
that the outcome values will be less than or equal to the determined P90 monetary value.
Appendix 10 contains an output summary from the model.
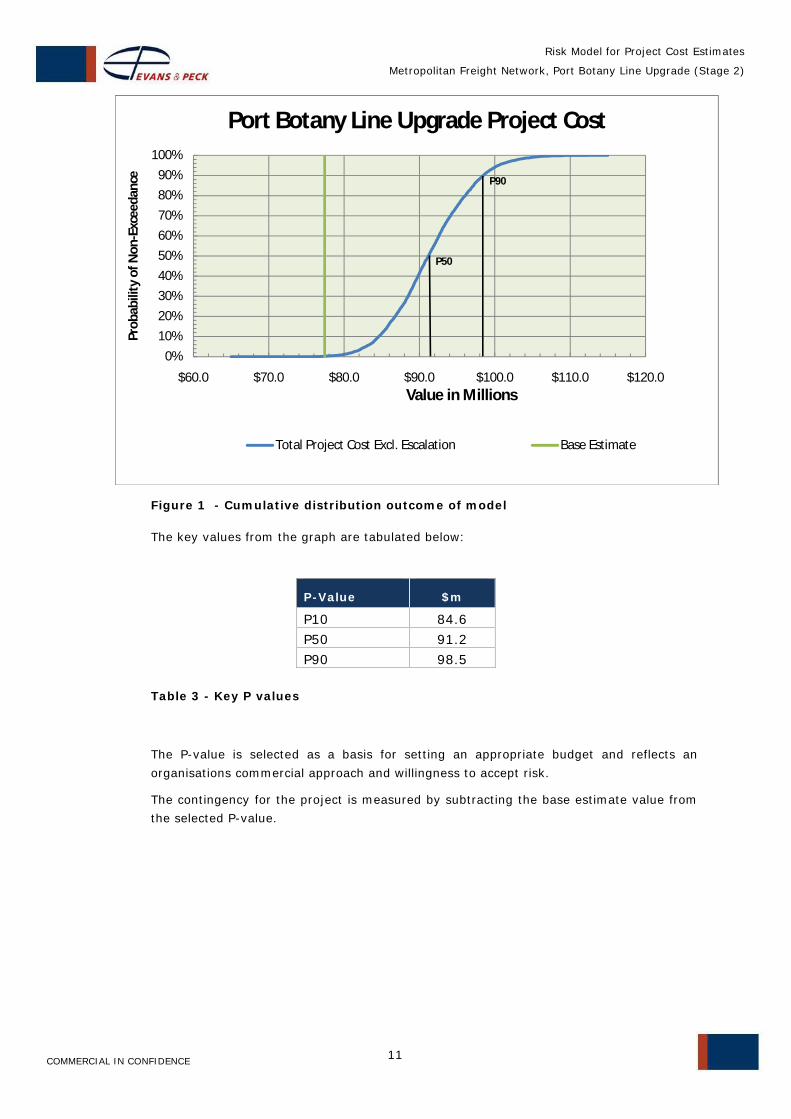
Figure 1 below depicts the cumulative distribution outcome from the model.
Risk Model for Project Cost Estimates
Metropolitan Freight Network, Port Botany Line Upgrade (Stage 2)
COMMERCIAL IN CONFIDENCE 11
Figure 1 - Cumulative distribution outcome of model
The key values from the graph are tabulated below:
P-Value $m
P10 84.6
P50 91.2
P90 98.5
Table 3 - Key P values
The P-value is selected as a basis for setting an appropriate budget and reflects an
organisations commercial approach and willingness to accept risk.
The contingency for the project is measured by subtracting the base estimate value from
the selected P-value.
0%10%20%30%40%50%60%70%
80%90%
100%
$60.0 $70.0 $80.0 $90.0 $100.0 $110.0 $120.0
Prob
abili
ty o
f Non
-Exc
eeda
nce
Value in Millions
Port Botany Line Upgrade Project Cost
Total Project Cost Excl. Escalation Base Estimate
P50
P90
Risk Model for Project Cost Estimates
Metropolitan Freight Network, Port Botany Line Upgrade (Stage 2)
COMMERCIAL IN CONFIDENCE 12
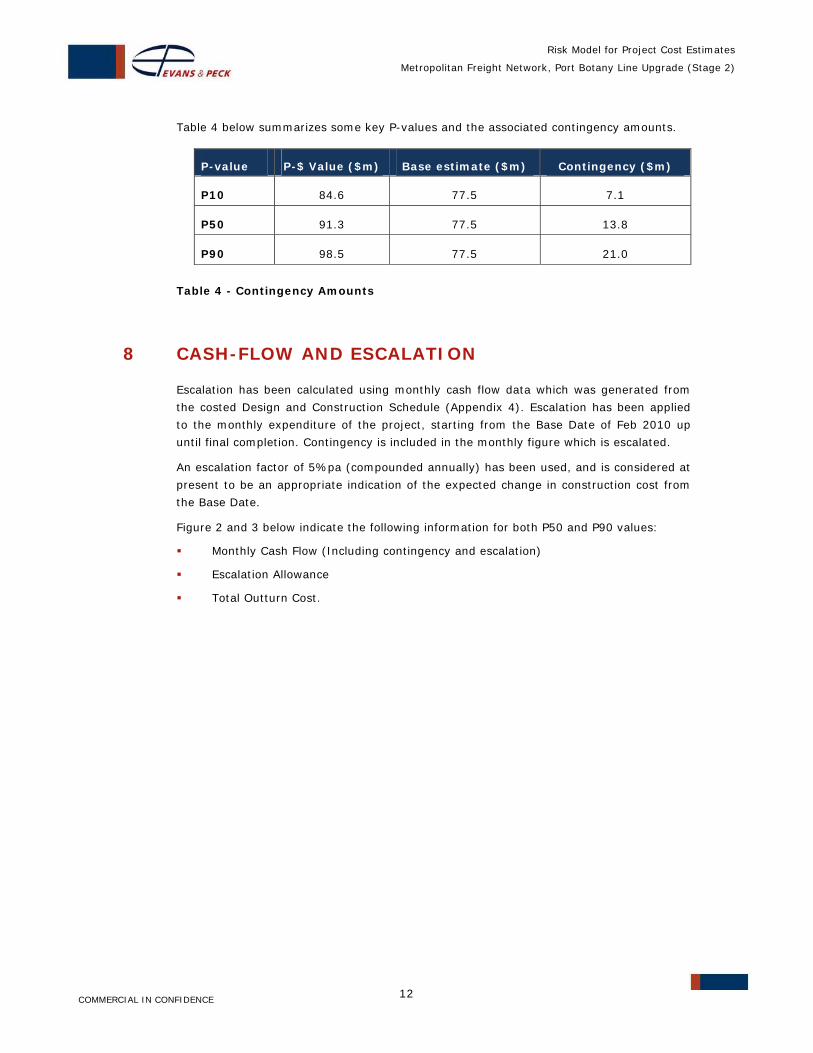
Table 4 below summarizes some key P-values and the associated contingency amounts.
P-value P-$ Value ($m) Base estimate ($m) Contingency ($m)
P10 84.6 77.5 7.1
P50 91.3 77.5 13.8
P90 98.5 77.5 21.0
Table 4 - Contingency Amounts
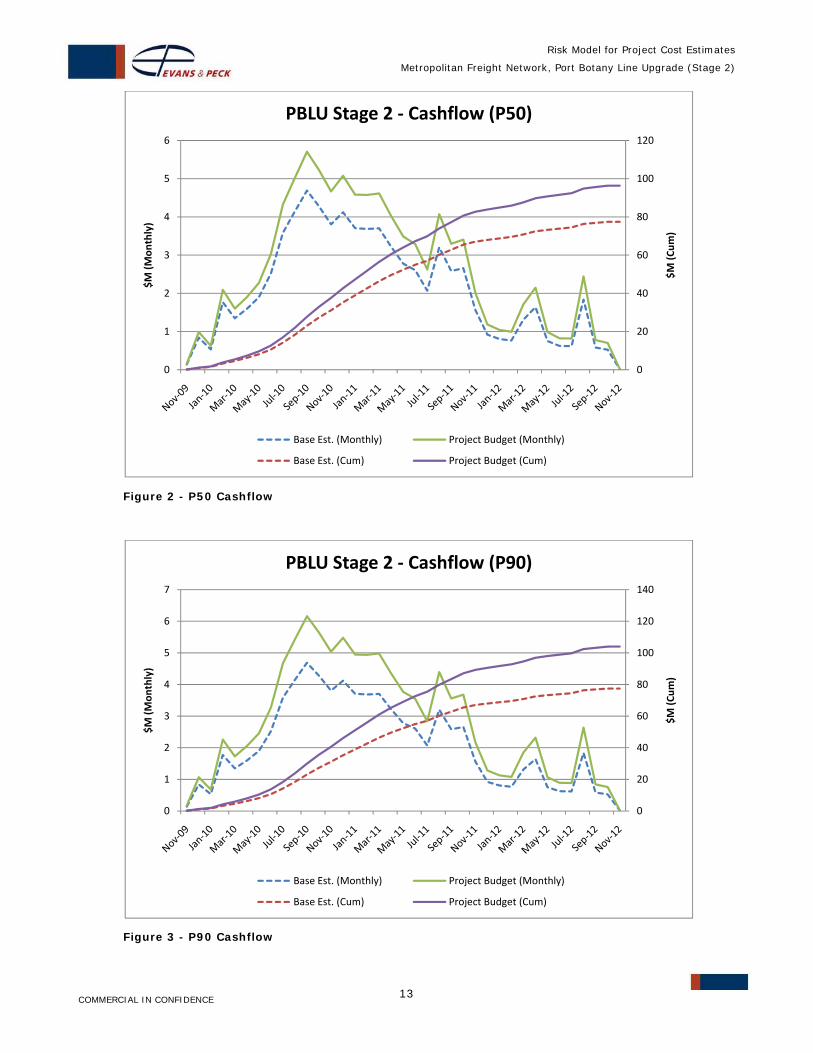
8 CASH-FLOW AND ESCALATION
Escalation has been calculated using monthly cash flow data which was generated from
the costed Design and Construction Schedule (Appendix 4). Escalation has been applied
to the monthly expenditure of the project, starting from the Base Date of Feb 2010 up
until final completion. Contingency is included in the monthly figure which is escalated.
An escalation factor of 5%pa (compounded annually) has been used, and is considered at
present to be an appropriate indication of the expected change in construction cost from
the Base Date.
Figure 2 and 3 below indicate the following information for both P50 and P90 values:
Monthly Cash Flow (Including contingency and escalation)
Escalation Allowance
Total Outturn Cost.
Risk Model for Project Cost Estimates
Metropolitan Freight Network, Port Botany Line Upgrade (Stage 2)
COMMERCIAL IN CONFIDENCE 13
Figure 2 - P50 Cashflow
Figure 3 - P90 Cashflow
0
20
40
60
80
100
120
0
1
2
3
4
5
6
$M (C
um)
$M (M
onthly)
PBLU Stage 2 ‐ Cashflow (P50)
Base Est. (Monthly) Project Budget (Monthly)
Base Est. (Cum) Project Budget (Cum)
0
20
40
60
80
100
120
140
0
1
2
3
4
5
6
7
$M (C
um)
$M (M
onthly)
PBLU Stage 2 ‐ Cashflow (P90)
Base Est. (Monthly) Project Budget (Monthly)
Base Est. (Cum) Project Budget (Cum)

Risk Model for Project Cost Estimates
Metropolitan Freight Network, Port Botany Line Upgrade (Stage 2)
COMMERCIAL IN CONFIDENCE 14
9 OUTTURN COST
The Total Outturn Cost is derived from the Base estimate with the addition of allowances
for Contingency and Cost Escalation that are expected through to completion of the
project.
The following components are described in separate section of this report:
Contingency has been calculated separately and is further described in Section 7.
Cost escalation has been calculated separately and is further described in Section 8.
The Total Outturn Cost is expressed in both P50 and P90 values, as shown in Table 5
below:
Base Estimate Calculations Construction Costs Direct Costs Indirect Costs Sub TotalClient Costs Possession Costs ARTC Project ManagementInsurances Aliance setupSub TotalBase Estimate
Risk & Escalation Calculations P50 P90Contingency 13.8 21.0Risk Based Project Estimate 91.3 98.5Escalation 5.2 5.6
Total Outturn Cost 96.5$ 104.1$
NB: All figures are in millions and have been rounded
7.977.5
3.04.00.40.5
Total ($m)
40.229.469.6
Table 5 - Total Outturn cost
The final outturn cost will be affected by the level of direct and indirect RailCorp interface
throughout the design, installation and commissioning stages. Further definition of this
interface is required to improve the certainty of this estimate.
It is assumed the cost estimates which have been provided to E&P adequately cover the
work scope required to meet the current Signalling Function Specifications (SFS).
The Outturn Cost Estimate takes into account the uncertainty surrounding the
assumptions made, but does not take into account changes or events of a functionality,
scoping or timing nature that would fundamentally change the scope of the works.
COMMERCIAL IN CONFIDENCE
Risk Model for Project Cost Estimates
Metropolitan Freight Network, Port Botany Line Upgrade (Stage 2)
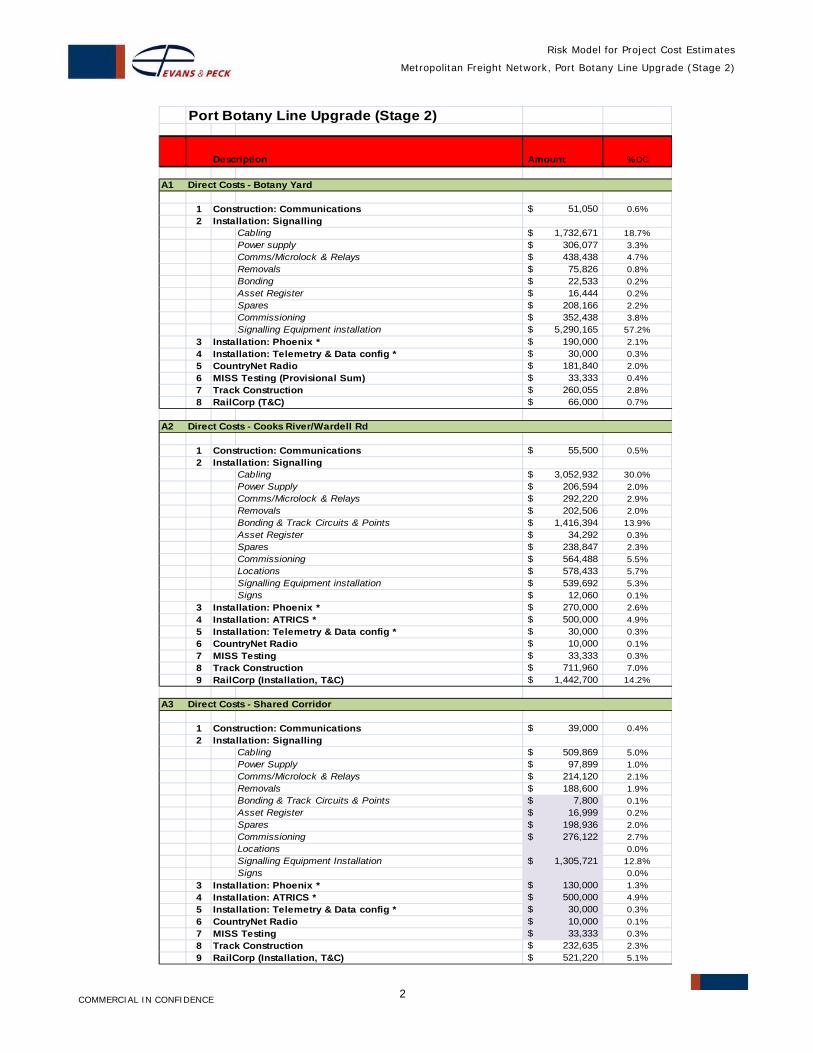
Appendix 2 Base Estimate Summary
Risk Model for Project Cost Estimates
Metropolitan Freight Network, Port Botany Line Upgrade (Stage 2)
COMMERCIAL IN CONFIDENCE 2
Port Botany Line Upgrade (Stage 2)
Description Amount % DC
A1 Direct Costs - Botany Yard
1 Construction: Communications 51,050$ 0.6%2 Installation: Signalling
Cabling 1,732,671$ 18.7%Power supply 306,077$ 3.3%Comms/Microlock & Relays 438,438$ 4.7%Removals 75,826$ 0.8%Bonding 22,533$ 0.2%Asset Register 16,444$ 0.2%Spares 208,166$ 2.2%Commissioning 352,438$ 3.8%
Signalling Equipment installation 5,290,165$ 57.2%3 Installation: Phoenix * 190,000$ 2.1%4 Installation: Telemetry & Data config * 30,000$ 0.3%5 CountryNet Radio 181,840$ 2.0%6 MISS Testing (Provisional Sum) 33,333$ 0.4%7 Track Construction 260,055$ 2.8%8 RailCorp (T&C) 66,000$ 0.7%
A2 Direct Costs - Cooks River/Wardell Rd
1 Construction: Communications 55,500$ 0.5%2 Installation: Signalling
Cabling 3,052,932$ 30.0%Power Supply 206,594$ 2.0%Comms/Microlock & Relays 292,220$ 2.9%Removals 202,506$ 2.0%Bonding & Track Circuits & Points 1,416,394$ 13.9%Asset Register 34,292$ 0.3%Spares 238,847$ 2.3%Commissioning 564,488$ 5.5%Locations 578,433$ 5.7%Signalling Equipment installation 539,692$ 5.3%Signs 12,060$ 0.1%
3 Installation: Phoenix * 270,000$ 2.6%4 Installation: ATRICS * 500,000$ 4.9%5 Installation: Telemetry & Data config * 30,000$ 0.3%6 CountryNet Radio 10,000$ 0.1%7 MISS Testing 33,333$ 0.3%8 Track Construction 711,960$ 7.0%9 RailCorp (Installation, T&C) 1,442,700$ 14.2%
A3 Direct Costs - Shared Corridor
1 Construction: Communications 39,000$ 0.4%2 Installation: Signalling
Cabling 509,869$ 5.0%Power Supply 97,899$ 1.0%Comms/Microlock & Relays 214,120$ 2.1%Removals 188,600$ 1.9%Bonding & Track Circuits & Points 7,800$ 0.1%Asset Register 16,999$ 0.2%Spares 198,936$ 2.0%Commissioning 276,122$ 2.7%Locations 0.0%Signalling Equipment Installation 1,305,721$ 12.8%Signs 0.0%
3 Installation: Phoenix * 130,000$ 1.3%4 Installation: ATRICS * 500,000$ 4.9%5 Installation: Telemetry & Data config * 30,000$ 0.3%6 CountryNet Radio 10,000$ 0.1%7 MISS Testing 33,333$ 0.3%8 Track Construction 232,635$ 2.3%9 RailCorp (Installation, T&C) 521,220$ 5.1%
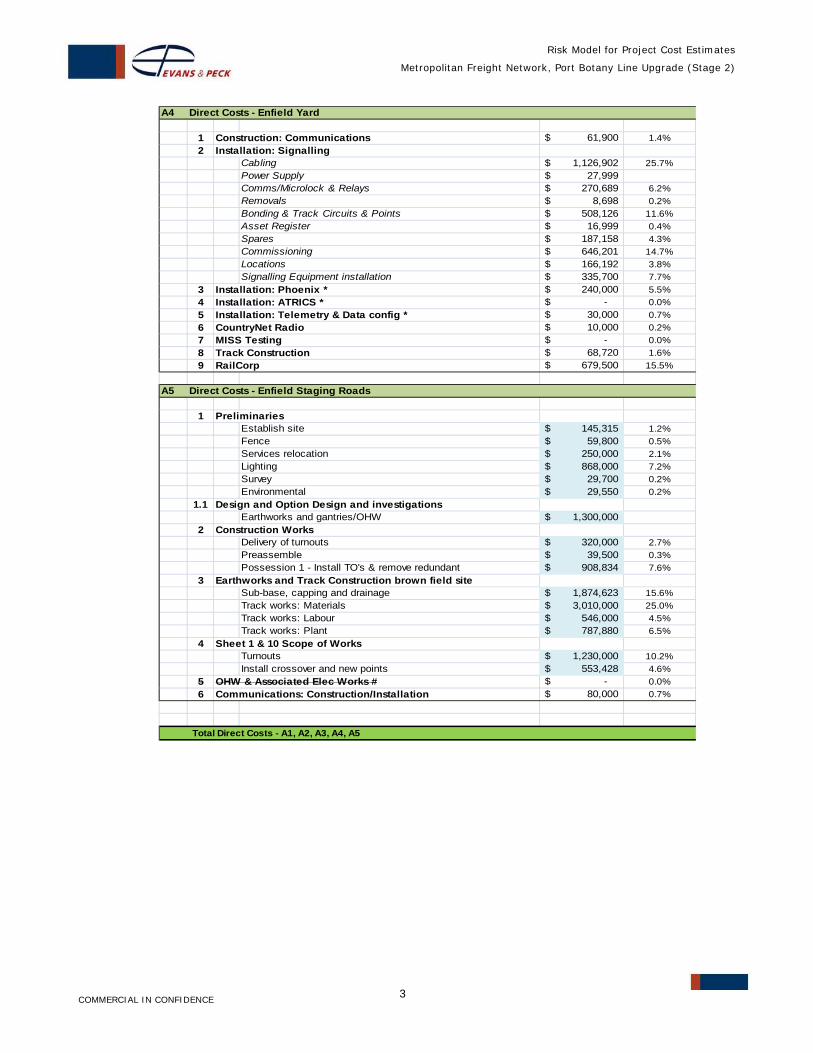
Risk Model for Project Cost Estimates
Metropolitan Freight Network, Port Botany Line Upgrade (Stage 2)
COMMERCIAL IN CONFIDENCE 3
A4 Direct Costs - Enfield Yard
1 Construction: Communications 61,900$ 1.4%2 Installation: Signalling
Cabling 1,126,902$ 25.7%Power Supply 27,999$ Comms/Microlock & Relays 270,689$ 6.2%Removals 8,698$ 0.2%Bonding & Track Circuits & Points 508,126$ 11.6%Asset Register 16,999$ 0.4%Spares 187,158$ 4.3%Commissioning 646,201$ 14.7%Locations 166,192$ 3.8%Signalling Equipment installation 335,700$ 7.7%
3 Installation: Phoenix * 240,000$ 5.5%4 Installation: ATRICS * -$ 0.0%5 Installation: Telemetry & Data config * 30,000$ 0.7%6 CountryNet Radio 10,000$ 0.2%7 MISS Testing -$ 0.0%8 Track Construction 68,720$ 1.6%9 RailCorp 679,500$ 15.5%
A5 Direct Costs - Enfield Staging Roads
1 PreliminariesEstablish site 145,315$ 1.2%Fence 59,800$ 0.5%Services relocation 250,000$ 2.1%Lighting 868,000$ 7.2%Survey 29,700$ 0.2%Environmental 29,550$ 0.2%
1.1 Design and Option Design and investigations Earthworks and gantries/OHW 1,300,000$
2 Construction Works Delivery of turnouts 320,000$ 2.7%Preassemble 39,500$ 0.3%Possession 1 - Install TO's & remove redundant 908,834$ 7.6%
3 Earthworks and Track Construction brown field site Sub-base, capping and drainage 1,874,623$ 15.6%Track works: Materials 3,010,000$ 25.0%Track works: Labour 546,000$ 4.5%Track works: Plant 787,880$ 6.5%
4 Sheet 1 & 10 Scope of Works Turnouts 1,230,000$ 10.2%Install crossover and new points 553,428$ 4.6%
5 OHW & Associated Elec Works # -$ 0.0%6 Communications: Construction/Installation 80,000$ 0.7%
Total Direct Costs - A1, A2, A3, A4, A5
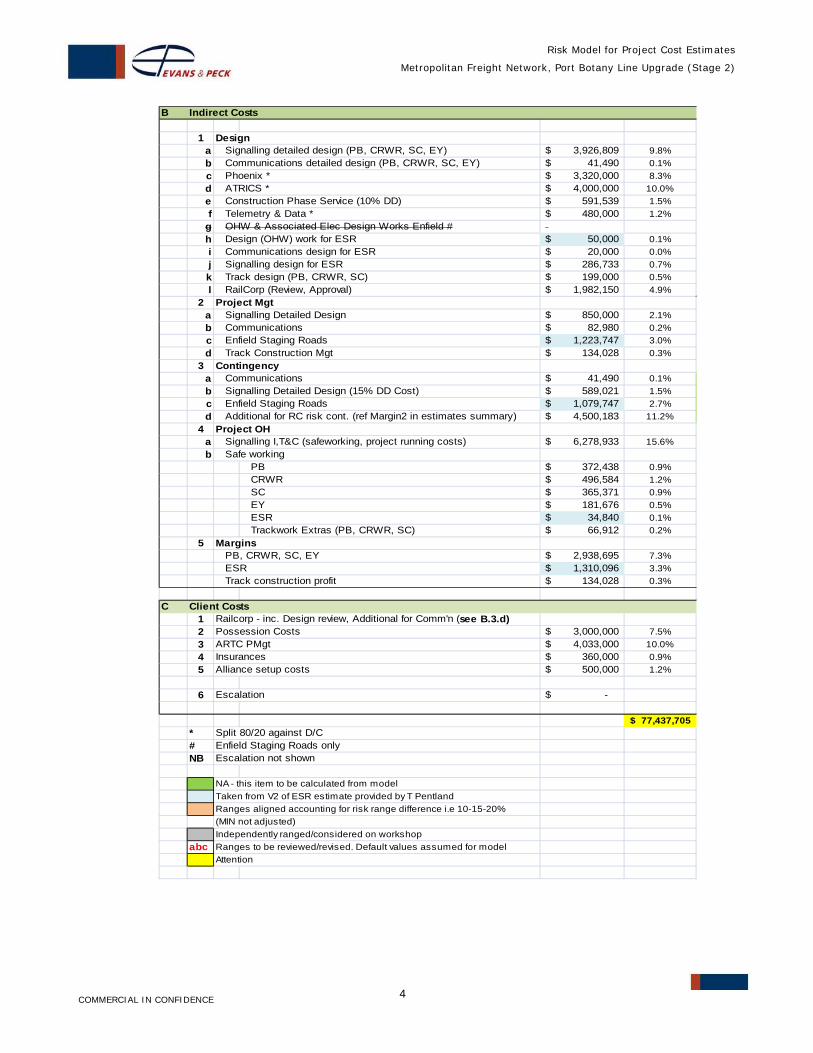
Risk Model for Project Cost Estimates
Metropolitan Freight Network, Port Botany Line Upgrade (Stage 2)
COMMERCIAL IN CONFIDENCE 4
B Indirect Costs
1 Design a Signalling detailed design (PB, CRWR, SC, EY) 3,926,809$ 9.8%b Communications detailed design (PB, CRWR, SC, EY) 41,490$ 0.1%c Phoenix * 3,320,000$ 8.3%d ATRICS * 4,000,000$ 10.0%e Construction Phase Service (10% DD) 591,539$ 1.5%f Telemetry & Data * 480,000$ 1.2%
g OHW & Associated Elec Design Works Enfield # h Design (OHW) work for ESR 50,000$ 0.1%i Communications design for ESR 20,000$ 0.0%j Signalling design for ESR 286,733$ 0.7%k Track design (PB, CRWR, SC) 199,000$ 0.5%l RailCorp (Review, Approval) 1,982,150$ 4.9%
2 Project Mgt a Signalling Detailed Design 850,000$ 2.1%b Communications 82,980$ 0.2%c Enfield Staging Roads 1,223,747$ 3.0%d Track Construction Mgt 134,028$ 0.3%
3 Contingency a Communications 41,490$ 0.1%b Signalling Detailed Design (15% DD Cost) 589,021$ 1.5%c Enfield Staging Roads 1,079,747$ 2.7%d Additional for RC risk cont. (ref Margin2 in estimates summary) 4,500,183$ 11.2%
4 Project OH a Signalling I,T&C (safeworking, project running costs) 6,278,933$ 15.6%b Safe working
PB 372,438$ 0.9%CRWR 496,584$ 1.2%SC 365,371$ 0.9%EY 181,676$ 0.5%ESR 34,840$ 0.1%Trackwork Extras (PB, CRWR, SC) 66,912$ 0.2%
5 Margins PB, CRWR, SC, EY 2,938,695$ 7.3%ESR 1,310,096$ 3.3%Track construction profit 134,028$ 0.3%
C Client Costs1 Railcorp - inc. Design review, Additional for Comm'n (see B.3.d)
2 Possession Costs 3,000,000$ 7.5%3 ARTC PMgt 4,033,000$ 10.0%4 Insurances 360,000$ 0.9%5 Alliance setup costs 500,000$ 1.2%
6 Escalation -$
77,437,705$ * Split 80/20 against D/C# Enfield Staging Roads onlyNB Escalation not shown
NA - this item to be calculated from modelTaken from V2 of ESR estimate provided by T Pentland Ranges aligned accounting for risk range difference i.e 10-15-20%(MIN not adjusted)Independently ranged/considered on workshop
abc Ranges to be reviewed/revised. Default values assumed for modelAttention
COMMERCIAL IN CONFIDENCE
Risk Model for Project Cost Estimates
Metropolitan Freight Network, Port Botany Line Upgrade (Stage 2)
Appendix 8 Risk Assessment Inputs – Inherent Risk
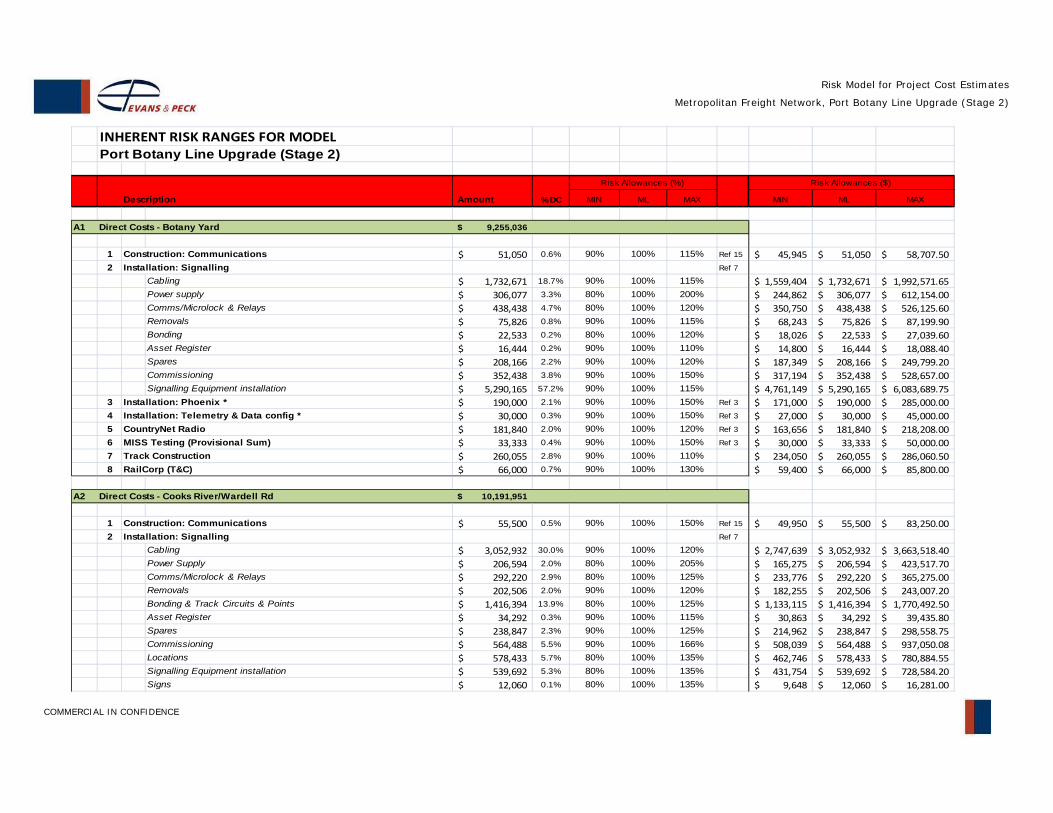
COMMERCIAL IN CONFIDENCE
Risk Model for Project Cost Estimates
Metropolitan Freight Network, Port Botany Line Upgrade (Stage 2)
INHERENT RISK RANGES FOR MODELPort Botany Line Upgrade (Stage 2)
Description Amount % DC MIN ML MAX MIN ML MAX
A1 Direct Costs - Botany Yard 9,255,036$
1 Construction: Communications 51,050$ 0.6% 90% 100% 115% Ref 15 45,945$ 51,050$ 58,707.50$ 2 Installation: Signalling Ref 7
Cabling 1,732,671$ 18.7% 90% 100% 115% 1,559,404$ 1,732,671$ 1,992,571.65$ Power supply 306,077$ 3.3% 80% 100% 200% 244,862$ 306,077$ 612,154.00$ Comms/Microlock & Relays 438,438$ 4.7% 80% 100% 120% 350,750$ 438,438$ 526,125.60$ Removals 75,826$ 0.8% 90% 100% 115% 68,243$ 75,826$ 87,199.90$ Bonding 22,533$ 0.2% 80% 100% 120% 18,026$ 22,533$ 27,039.60$ Asset Register 16,444$ 0.2% 90% 100% 110% 14,800$ 16,444$ 18,088.40$ Spares 208,166$ 2.2% 90% 100% 120% 187,349$ 208,166$ 249,799.20$ Commissioning 352,438$ 3.8% 90% 100% 150% 317,194$ 352,438$ 528,657.00$
Signalling Equipment installation 5,290,165$ 57.2% 90% 100% 115% 4,761,149$ 5,290,165$ 6,083,689.75$ 3 Installation: Phoenix * 190,000$ 2.1% 90% 100% 150% Ref 3 171,000$ 190,000$ 285,000.00$ 4 Installation: Telemetry & Data config * 30,000$ 0.3% 90% 100% 150% Ref 3 27,000$ 30,000$ 45,000.00$ 5 CountryNet Radio 181,840$ 2.0% 90% 100% 120% Ref 3 163,656$ 181,840$ 218,208.00$ 6 MISS Testing (Provisional Sum) 33,333$ 0.4% 90% 100% 150% Ref 3 30,000$ 33,333$ 50,000.00$ 7 Track Construction 260,055$ 2.8% 90% 100% 110% 234,050$ 260,055$ 286,060.50$ 8 RailCorp (T&C) 66,000$ 0.7% 90% 100% 130% 59,400$ 66,000$ 85,800.00$
A2 Direct Costs - Cooks River/Wardell Rd 10,191,951$
1 Construction: Communications 55,500$ 0.5% 90% 100% 150% Ref 15 49,950$ 55,500$ 83,250.00$ 2 Installation: Signalling Ref 7
Cabling 3,052,932$ 30.0% 90% 100% 120% 2,747,639$ 3,052,932$ 3,663,518.40$ Power Supply 206,594$ 2.0% 80% 100% 205% 165,275$ 206,594$ 423,517.70$ Comms/Microlock & Relays 292,220$ 2.9% 80% 100% 125% 233,776$ 292,220$ 365,275.00$ Removals 202,506$ 2.0% 90% 100% 120% 182,255$ 202,506$ 243,007.20$ Bonding & Track Circuits & Points 1,416,394$ 13.9% 80% 100% 125% 1,133,115$ 1,416,394$ 1,770,492.50$ Asset Register 34,292$ 0.3% 90% 100% 115% 30,863$ 34,292$ 39,435.80$ Spares 238,847$ 2.3% 90% 100% 125% 214,962$ 238,847$ 298,558.75$ Commissioning 564,488$ 5.5% 90% 100% 166% 508,039$ 564,488$ 937,050.08$ Locations 578,433$ 5.7% 80% 100% 135% 462,746$ 578,433$ 780,884.55$ Signalling Equipment installation 539,692$ 5.3% 80% 100% 135% 431,754$ 539,692$ 728,584.20$ Signs 12,060$ 0.1% 80% 100% 135% 9,648$ 12,060$ 16,281.00$
Risk Allowances (%) Risk Allowances ($)
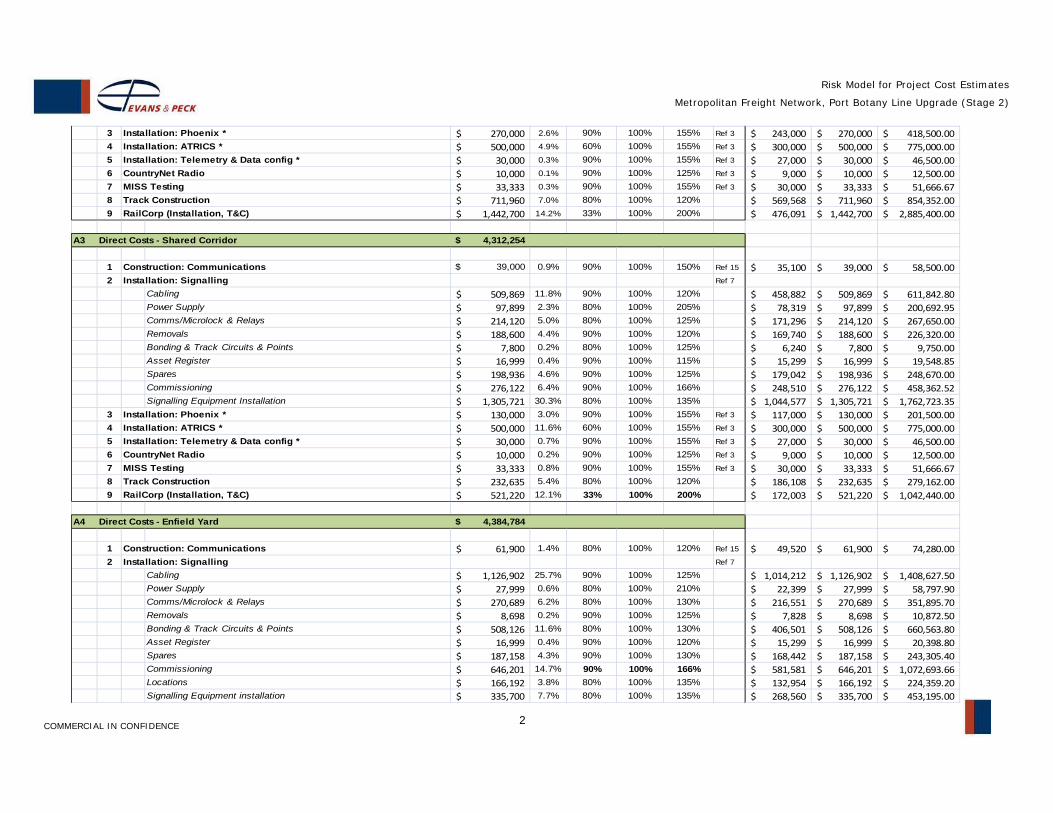
Risk Model for Project Cost Estimates
Metropolitan Freight Network, Port Botany Line Upgrade (Stage 2)
COMMERCIAL IN CONFIDENCE 2
3 Installation: Phoenix * 270,000$ 2.6% 90% 100% 155% Ref 3 243,000$ 270,000$ 418,500.00$ 4 Installation: ATRICS * 500,000$ 4.9% 60% 100% 155% Ref 3 300,000$ 500,000$ 775,000.00$ 5 Installation: Telemetry & Data config * 30,000$ 0.3% 90% 100% 155% Ref 3 27,000$ 30,000$ 46,500.00$ 6 CountryNet Radio 10,000$ 0.1% 90% 100% 125% Ref 3 9,000$ 10,000$ 12,500.00$ 7 MISS Testing 33,333$ 0.3% 90% 100% 155% Ref 3 30,000$ 33,333$ 51,666.67$ 8 Track Construction 711,960$ 7.0% 80% 100% 120% 569,568$ 711,960$ 854,352.00$ 9 RailCorp (Installation, T&C) 1,442,700$ 14.2% 33% 100% 200% 476,091$ 1,442,700$ 2,885,400.00$
A3 Direct Costs - Shared Corridor 4,312,254$
1 Construction: Communications 39,000$ 0.9% 90% 100% 150% Ref 15 35,100$ 39,000$ 58,500.00$ 2 Installation: Signalling Ref 7
Cabling 509,869$ 11.8% 90% 100% 120% 458,882$ 509,869$ 611,842.80$ Power Supply 97,899$ 2.3% 80% 100% 205% 78,319$ 97,899$ 200,692.95$ Comms/Microlock & Relays 214,120$ 5.0% 80% 100% 125% 171,296$ 214,120$ 267,650.00$ Removals 188,600$ 4.4% 90% 100% 120% 169,740$ 188,600$ 226,320.00$ Bonding & Track Circuits & Points 7,800$ 0.2% 80% 100% 125% 6,240$ 7,800$ 9,750.00$ Asset Register 16,999$ 0.4% 90% 100% 115% 15,299$ 16,999$ 19,548.85$ Spares 198,936$ 4.6% 90% 100% 125% 179,042$ 198,936$ 248,670.00$ Commissioning 276,122$ 6.4% 90% 100% 166% 248,510$ 276,122$ 458,362.52$ Signalling Equipment Installation 1,305,721$ 30.3% 80% 100% 135% 1,044,577$ 1,305,721$ 1,762,723.35$
3 Installation: Phoenix * 130,000$ 3.0% 90% 100% 155% Ref 3 117,000$ 130,000$ 201,500.00$ 4 Installation: ATRICS * 500,000$ 11.6% 60% 100% 155% Ref 3 300,000$ 500,000$ 775,000.00$ 5 Installation: Telemetry & Data config * 30,000$ 0.7% 90% 100% 155% Ref 3 27,000$ 30,000$ 46,500.00$ 6 CountryNet Radio 10,000$ 0.2% 90% 100% 125% Ref 3 9,000$ 10,000$ 12,500.00$ 7 MISS Testing 33,333$ 0.8% 90% 100% 155% Ref 3 30,000$ 33,333$ 51,666.67$ 8 Track Construction 232,635$ 5.4% 80% 100% 120% 186,108$ 232,635$ 279,162.00$ 9 RailCorp (Installation, T&C) 521,220$ 12.1% 33% 100% 200% 172,003$ 521,220$ 1,042,440.00$
A4 Direct Costs - Enfield Yard 4,384,784$
1 Construction: Communications 61,900$ 1.4% 80% 100% 120% Ref 15 49,520$ 61,900$ 74,280.00$ 2 Installation: Signalling Ref 7
Cabling 1,126,902$ 25.7% 90% 100% 125% 1,014,212$ 1,126,902$ 1,408,627.50$ Power Supply 27,999$ 0.6% 80% 100% 210% 22,399$ 27,999$ 58,797.90$ Comms/Microlock & Relays 270,689$ 6.2% 80% 100% 130% 216,551$ 270,689$ 351,895.70$ Removals 8,698$ 0.2% 90% 100% 125% 7,828$ 8,698$ 10,872.50$ Bonding & Track Circuits & Points 508,126$ 11.6% 80% 100% 130% 406,501$ 508,126$ 660,563.80$ Asset Register 16,999$ 0.4% 90% 100% 120% 15,299$ 16,999$ 20,398.80$ Spares 187,158$ 4.3% 90% 100% 130% 168,442$ 187,158$ 243,305.40$ Commissioning 646,201$ 14.7% 90% 100% 166% 581,581$ 646,201$ 1,072,693.66$ Locations 166,192$ 3.8% 80% 100% 135% 132,954$ 166,192$ 224,359.20$ Signalling Equipment installation 335,700$ 7.7% 80% 100% 135% 268,560$ 335,700$ 453,195.00$
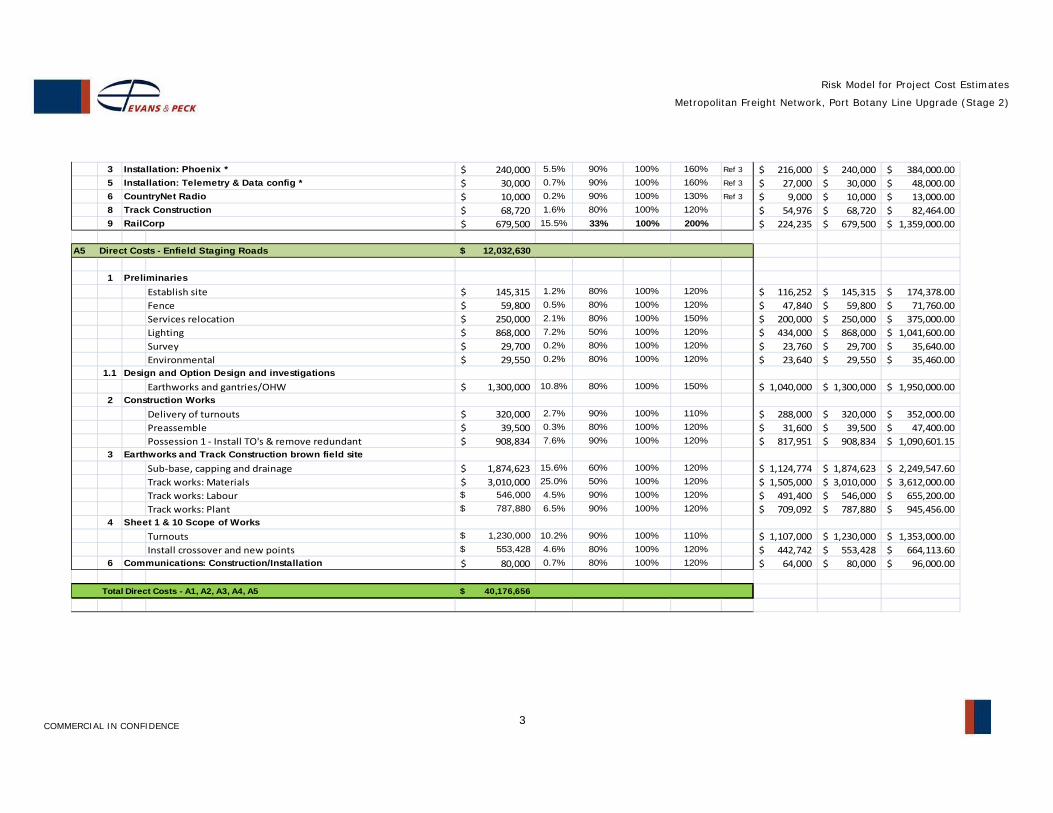
Risk Model for Project Cost Estimates
Metropolitan Freight Network, Port Botany Line Upgrade (Stage 2)
COMMERCIAL IN CONFIDENCE 3
3 Installation: Phoenix * 240,000$ 5.5% 90% 100% 160% Ref 3 216,000$ 240,000$ 384,000.00$ 5 Installation: Telemetry & Data config * 30,000$ 0.7% 90% 100% 160% Ref 3 27,000$ 30,000$ 48,000.00$ 6 CountryNet Radio 10,000$ 0.2% 90% 100% 130% Ref 3 9,000$ 10,000$ 13,000.00$ 8 Track Construction 68,720$ 1.6% 80% 100% 120% 54,976$ 68,720$ 82,464.00$ 9 RailCorp 679,500$ 15.5% 33% 100% 200% 224,235$ 679,500$ 1,359,000.00$
A5 Direct Costs - Enfield Staging Roads 12,032,630$
1 PreliminariesEstablish site 145,315$ 1.2% 80% 100% 120% 116,252$ 145,315$ 174,378.00$ Fence 59,800$ 0.5% 80% 100% 120% 47,840$ 59,800$ 71,760.00$ Services relocation 250,000$ 2.1% 80% 100% 150% 200,000$ 250,000$ 375,000.00$ Lighting 868,000$ 7.2% 50% 100% 120% 434,000$ 868,000$ 1,041,600.00$ Survey 29,700$ 0.2% 80% 100% 120% 23,760$ 29,700$ 35,640.00$ Environmental 29,550$ 0.2% 80% 100% 120% 23,640$ 29,550$ 35,460.00$
1.1 Design and Option Design and investigations Earthworks and gantries/OHW 1,300,000$ 10.8% 80% 100% 150% 1,040,000$ 1,300,000$ 1,950,000.00$
2 Construction Works
Delivery of turnouts 320,000$ 2.7% 90% 100% 110% 288,000$ 320,000$ 352,000.00$ Preassemble 39,500$ 0.3% 80% 100% 120% 31,600$ 39,500$ 47,400.00$ Possession 1 ‐ Install TO's & remove redundant 908,834$ 7.6% 90% 100% 120% 817,951$ 908,834$ 1,090,601.15$
3 Earthworks and Track Construction brown field site Sub‐base, capping and drainage 1,874,623$ 15.6% 60% 100% 120% 1,124,774$ 1,874,623$ 2,249,547.60$ Track works: Materials 3,010,000$ 25.0% 50% 100% 120% 1,505,000$ 3,010,000$ 3,612,000.00$ Track works: Labour 546,000$ 4.5% 90% 100% 120% 491,400$ 546,000$ 655,200.00$ Track works: Plant 787,880$ 6.5% 90% 100% 120% 709,092$ 787,880$ 945,456.00$
4 Sheet 1 & 10 Scope of Works Turnouts 1,230,000$ 10.2% 90% 100% 110% 1,107,000$ 1,230,000$ 1,353,000.00$ Install crossover and new points 553,428$ 4.6% 80% 100% 120% 442,742$ 553,428$ 664,113.60$
6 Communications: Construction/Installation 80,000$ 0.7% 80% 100% 120% 64,000$ 80,000$ 96,000.00$
Total Direct Costs - A1, A2, A3, A4, A5 40,176,656$
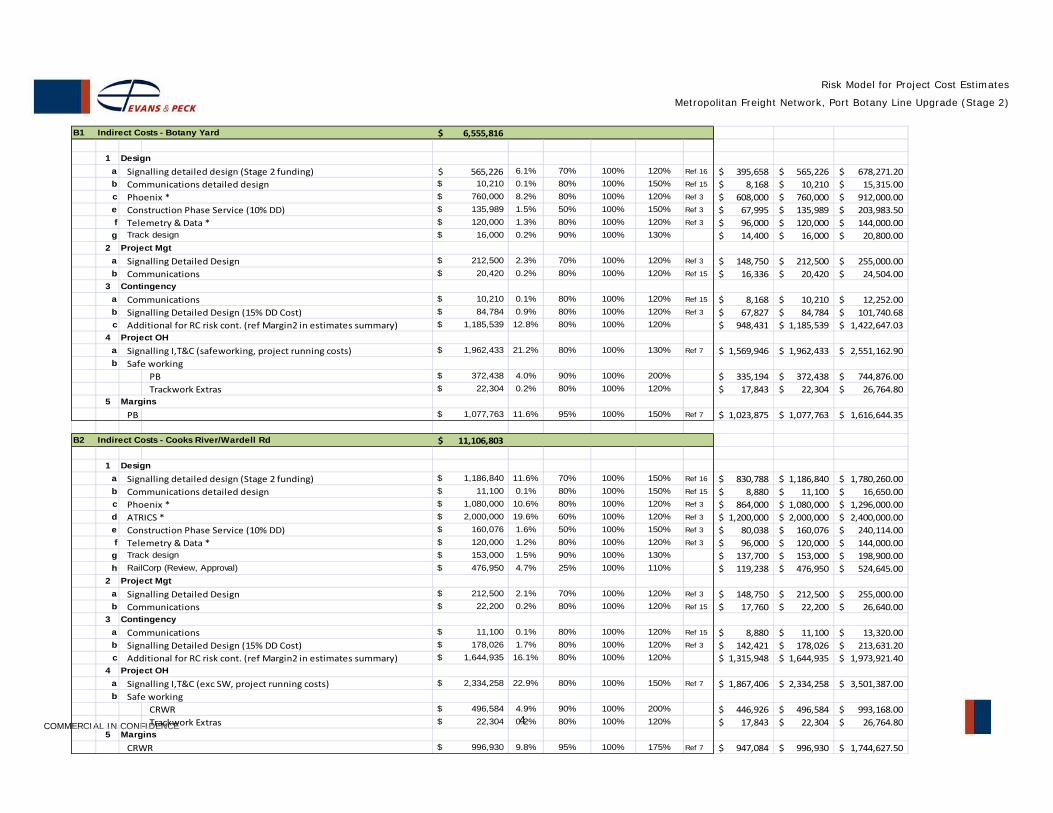
Risk Model for Project Cost Estimates
Metropolitan Freight Network, Port Botany Line Upgrade (Stage 2)
COMMERCIAL IN CONFIDENCE 4
B1 Indirect Costs - Botany Yard 6,555,816$
1 Design a Signalling detailed design (Stage 2 funding) 565,226$ 6.1% 70% 100% 120% Ref 16 395,658$ 565,226$ 678,271.20$ b Communications detailed design 10,210$ 0.1% 80% 100% 150% Ref 15 8,168$ 10,210$ 15,315.00$ c Phoenix * 760,000$ 8.2% 80% 100% 120% Ref 3 608,000$ 760,000$ 912,000.00$ e Construction Phase Service (10% DD) 135,989$ 1.5% 50% 100% 150% Ref 3 67,995$ 135,989$ 203,983.50$ f Telemetry & Data * 120,000$ 1.3% 80% 100% 120% Ref 3 96,000$ 120,000$ 144,000.00$
g Track design 16,000$ 0.2% 90% 100% 130% 14,400$ 16,000$ 20,800.00$ 2 Project Mgt
a Signalling Detailed Design 212,500$ 2.3% 70% 100% 120% Ref 3 148,750$ 212,500$ 255,000.00$ b Communications 20,420$ 0.2% 80% 100% 120% Ref 15 16,336$ 20,420$ 24,504.00$
3 Contingency a Communications 10,210$ 0.1% 80% 100% 120% Ref 15 8,168$ 10,210$ 12,252.00$ b Signalling Detailed Design (15% DD Cost) 84,784$ 0.9% 80% 100% 120% Ref 3 67,827$ 84,784$ 101,740.68$ c Additional for RC risk cont. (ref Margin2 in estimates summary) 1,185,539$ 12.8% 80% 100% 120% 948,431$ 1,185,539$ 1,422,647.03$
4 Project OH a Signalling I,T&C (safeworking, project running costs) 1,962,433$ 21.2% 80% 100% 130% Ref 7 1,569,946$ 1,962,433$ 2,551,162.90$ b Safe working
PB 372,438$ 4.0% 90% 100% 200% 335,194$ 372,438$ 744,876.00$ Trackwork Extras 22,304$ 0.2% 80% 100% 120% 17,843$ 22,304$ 26,764.80$
5 Margins
PB 1,077,763$ 11.6% 95% 100% 150% Ref 7 1,023,875$ 1,077,763$ 1,616,644.35$
B2 Indirect Costs - Cooks River/Wardell Rd 11,106,803$
1 Design a Signalling detailed design (Stage 2 funding) 1,186,840$ 11.6% 70% 100% 150% Ref 16 830,788$ 1,186,840$ 1,780,260.00$ b Communications detailed design 11,100$ 0.1% 80% 100% 150% Ref 15 8,880$ 11,100$ 16,650.00$ c Phoenix * 1,080,000$ 10.6% 80% 100% 120% Ref 3 864,000$ 1,080,000$ 1,296,000.00$ d ATRICS * 2,000,000$ 19.6% 60% 100% 120% Ref 3 1,200,000$ 2,000,000$ 2,400,000.00$ e Construction Phase Service (10% DD) 160,076$ 1.6% 50% 100% 150% Ref 3 80,038$ 160,076$ 240,114.00$ f Telemetry & Data * 120,000$ 1.2% 80% 100% 120% Ref 3 96,000$ 120,000$ 144,000.00$
g Track design 153,000$ 1.5% 90% 100% 130% 137,700$ 153,000$ 198,900.00$ h RailCorp (Review, Approval) 476,950$ 4.7% 25% 100% 110% 119,238$ 476,950$ 524,645.00$
2 Project Mgt a Signalling Detailed Design 212,500$ 2.1% 70% 100% 120% Ref 3 148,750$ 212,500$ 255,000.00$ b Communications 22,200$ 0.2% 80% 100% 120% Ref 15 17,760$ 22,200$ 26,640.00$
3 Contingency a Communications 11,100$ 0.1% 80% 100% 120% Ref 15 8,880$ 11,100$ 13,320.00$ b Signalling Detailed Design (15% DD Cost) 178,026$ 1.7% 80% 100% 120% Ref 3 142,421$ 178,026$ 213,631.20$ c Additional for RC risk cont. (ref Margin2 in estimates summary) 1,644,935$ 16.1% 80% 100% 120% 1,315,948$ 1,644,935$ 1,973,921.40$
4 Project OH a Signalling I,T&C (exc SW, project running costs) 2,334,258$ 22.9% 80% 100% 150% Ref 7 1,867,406$ 2,334,258$ 3,501,387.00$ b Safe working
CRWR 496,584$ 4.9% 90% 100% 200% 446,926$ 496,584$ 993,168.00$ Trackwork Extras 22,304$ 0.2% 80% 100% 120% 17,843$ 22,304$ 26,764.80$
5 Margins
CRWR 996,930$ 9.8% 95% 100% 175% Ref 7 947,084$ 996,930$ 1,744,627.50$
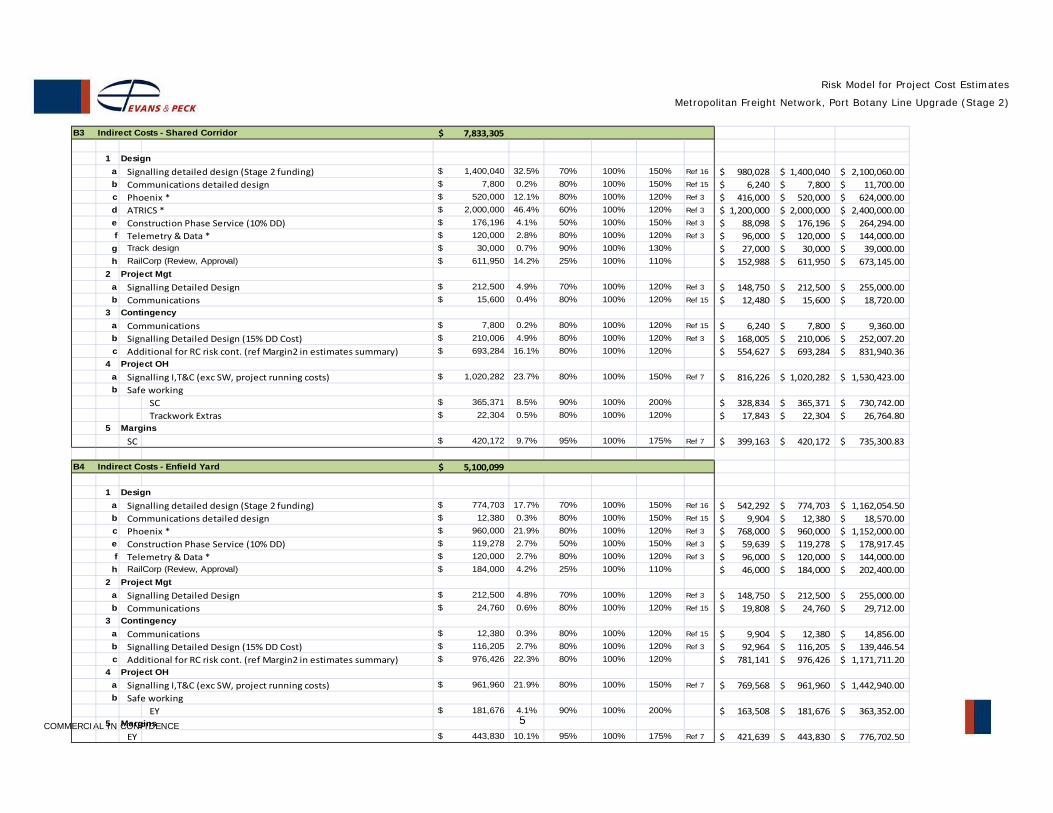
Risk Model for Project Cost Estimates
Metropolitan Freight Network, Port Botany Line Upgrade (Stage 2)
COMMERCIAL IN CONFIDENCE 5
B3 Indirect Costs - Shared Corridor 7,833,305$
1 Design a Signalling detailed design (Stage 2 funding) 1,400,040$ 32.5% 70% 100% 150% Ref 16 980,028$ 1,400,040$ 2,100,060.00$ b Communications detailed design 7,800$ 0.2% 80% 100% 150% Ref 15 6,240$ 7,800$ 11,700.00$ c Phoenix * 520,000$ 12.1% 80% 100% 120% Ref 3 416,000$ 520,000$ 624,000.00$ d ATRICS * 2,000,000$ 46.4% 60% 100% 120% Ref 3 1,200,000$ 2,000,000$ 2,400,000.00$ e Construction Phase Service (10% DD) 176,196$ 4.1% 50% 100% 150% Ref 3 88,098$ 176,196$ 264,294.00$ f Telemetry & Data * 120,000$ 2.8% 80% 100% 120% Ref 3 96,000$ 120,000$ 144,000.00$
g Track design 30,000$ 0.7% 90% 100% 130% 27,000$ 30,000$ 39,000.00$ h RailCorp (Review, Approval) 611,950$ 14.2% 25% 100% 110% 152,988$ 611,950$ 673,145.00$
2 Project Mgt a Signalling Detailed Design 212,500$ 4.9% 70% 100% 120% Ref 3 148,750$ 212,500$ 255,000.00$ b Communications 15,600$ 0.4% 80% 100% 120% Ref 15 12,480$ 15,600$ 18,720.00$
3 Contingency a Communications 7,800$ 0.2% 80% 100% 120% Ref 15 6,240$ 7,800$ 9,360.00$ b Signalling Detailed Design (15% DD Cost) 210,006$ 4.9% 80% 100% 120% Ref 3 168,005$ 210,006$ 252,007.20$ c Additional for RC risk cont. (ref Margin2 in estimates summary) 693,284$ 16.1% 80% 100% 120% 554,627$ 693,284$ 831,940.36$
4 Project OH a Signalling I,T&C (exc SW, project running costs) 1,020,282$ 23.7% 80% 100% 150% Ref 7 816,226$ 1,020,282$ 1,530,423.00$ b Safe working
SC 365,371$ 8.5% 90% 100% 200% 328,834$ 365,371$ 730,742.00$ Trackwork Extras 22,304$ 0.5% 80% 100% 120% 17,843$ 22,304$ 26,764.80$
5 Margins SC 420,172$ 9.7% 95% 100% 175% Ref 7 399,163$ 420,172$ 735,300.83$
B4 Indirect Costs - Enfield Yard 5,100,099$
1 Design a Signalling detailed design (Stage 2 funding) 774,703$ 17.7% 70% 100% 150% Ref 16 542,292$ 774,703$ 1,162,054.50$ b Communications detailed design 12,380$ 0.3% 80% 100% 150% Ref 15 9,904$ 12,380$ 18,570.00$ c Phoenix * 960,000$ 21.9% 80% 100% 120% Ref 3 768,000$ 960,000$ 1,152,000.00$ e Construction Phase Service (10% DD) 119,278$ 2.7% 50% 100% 150% Ref 3 59,639$ 119,278$ 178,917.45$ f Telemetry & Data * 120,000$ 2.7% 80% 100% 120% Ref 3 96,000$ 120,000$ 144,000.00$
h RailCorp (Review, Approval) 184,000$ 4.2% 25% 100% 110% 46,000$ 184,000$ 202,400.00$ 2 Project Mgt
a Signalling Detailed Design 212,500$ 4.8% 70% 100% 120% Ref 3 148,750$ 212,500$ 255,000.00$ b Communications 24,760$ 0.6% 80% 100% 120% Ref 15 19,808$ 24,760$ 29,712.00$
3 Contingencya Communications 12,380$ 0.3% 80% 100% 120% Ref 15 9,904$ 12,380$ 14,856.00$ b Signalling Detailed Design (15% DD Cost) 116,205$ 2.7% 80% 100% 120% Ref 3 92,964$ 116,205$ 139,446.54$ c Additional for RC risk cont. (ref Margin2 in estimates summary) 976,426$ 22.3% 80% 100% 120% 781,141$ 976,426$ 1,171,711.20$
4 Project OH a Signalling I,T&C (exc SW, project running costs) 961,960$ 21.9% 80% 100% 150% Ref 7 769,568$ 961,960$ 1,442,940.00$ b Safe working
EY 181,676$ 4.1% 90% 100% 200% 163,508$ 181,676$ 363,352.00$ 5 Margins
EY 443,830$ 10.1% 95% 100% 175% Ref 7 421,639$ 443,830$ 776,702.50$
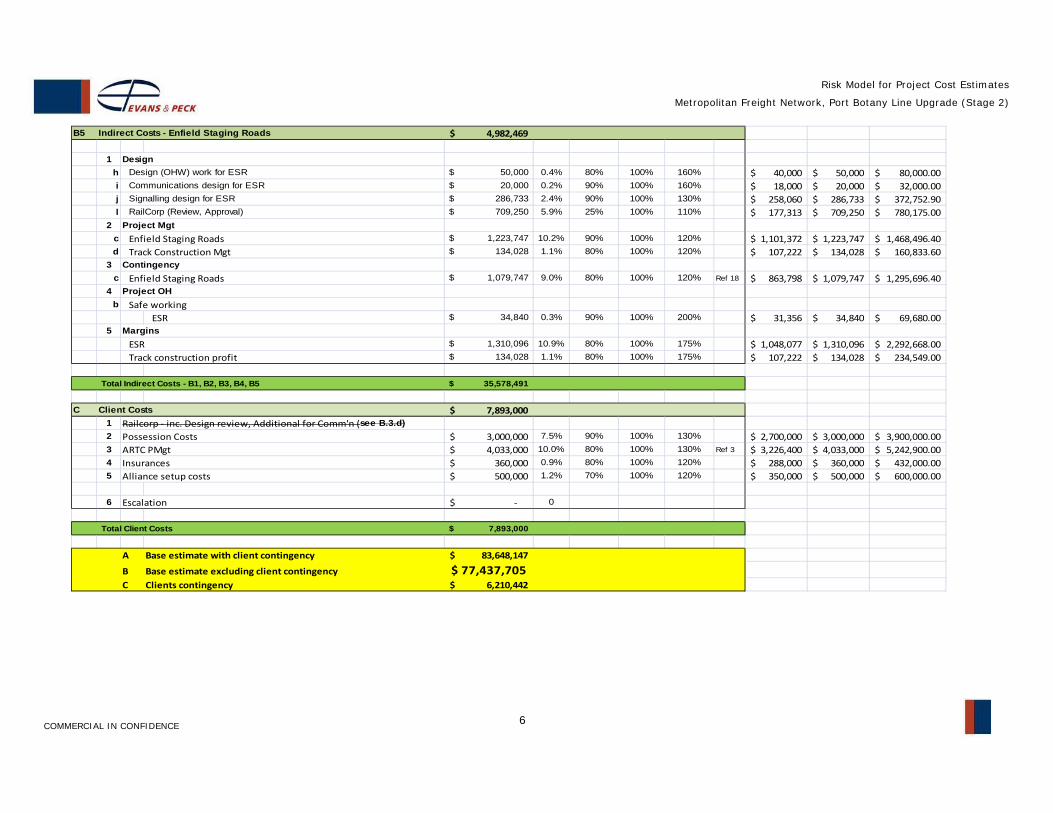
Risk Model for Project Cost Estimates
Metropolitan Freight Network, Port Botany Line Upgrade (Stage 2)
COMMERCIAL IN CONFIDENCE 6
B5 Indirect Costs - Enfield Staging Roads 4,982,469$
1 Design h Design (OHW) work for ESR 50,000$ 0.4% 80% 100% 160% 40,000$ 50,000$ 80,000.00$ i Communications design for ESR 20,000$ 0.2% 90% 100% 160% 18,000$ 20,000$ 32,000.00$ j Signalling design for ESR 286,733$ 2.4% 90% 100% 130% 258,060$ 286,733$ 372,752.90$ l RailCorp (Review, Approval) 709,250$ 5.9% 25% 100% 110% 177,313$ 709,250$ 780,175.00$
2 Project Mgt c Enfield Staging Roads 1,223,747$ 10.2% 90% 100% 120% 1,101,372$ 1,223,747$ 1,468,496.40$ d Track Construction Mgt 134,028$ 1.1% 80% 100% 120% 107,222$ 134,028$ 160,833.60$
3 Contingency c Enfield Staging Roads 1,079,747$ 9.0% 80% 100% 120% Ref 18 863,798$ 1,079,747$ 1,295,696.40$
4 Project OH b Safe working
ESR 34,840$ 0.3% 90% 100% 200% 31,356$ 34,840$ 69,680.00$ 5 Margins
ESR 1,310,096$ 10.9% 80% 100% 175% 1,048,077$ 1,310,096$ 2,292,668.00$ Track construction profit 134,028$ 1.1% 80% 100% 175% 107,222$ 134,028$ 234,549.00$
Total Indirect Costs - B1, B2, B3, B4, B5 35,578,491$
C Client Costs 7,893,000$ 1 Railcorp ‐ inc. Design review, Additional for Comm'n (see B.3.d)
2 Possession Costs 3,000,000$ 7.5% 90% 100% 130% 2,700,000$ 3,000,000$ 3,900,000.00$ 3 ARTC PMgt 4,033,000$ 10.0% 80% 100% 130% Ref 3 3,226,400$ 4,033,000$ 5,242,900.00$ 4 Insurances 360,000$ 0.9% 80% 100% 120% 288,000$ 360,000$ 432,000.00$ 5 Alliance setup costs 500,000$ 1.2% 70% 100% 120% 350,000$ 500,000$ 600,000.00$
6 Escalation ‐$ 0
Total Client Costs 7,893,000$
A Base estimate with client contingency 83,648,147$
B Base estimate excluding client contingency 77,437,705$ C Clients contingency 6,210,442$
COMMERCIAL IN CONFIDENCE
Risk Model for Project Cost Estimates
Metropolitan Freight Network, Port Botany Line Upgrade (Stage 2)
Appendix 9 Risk Assessment Inputs – Contingent Risk
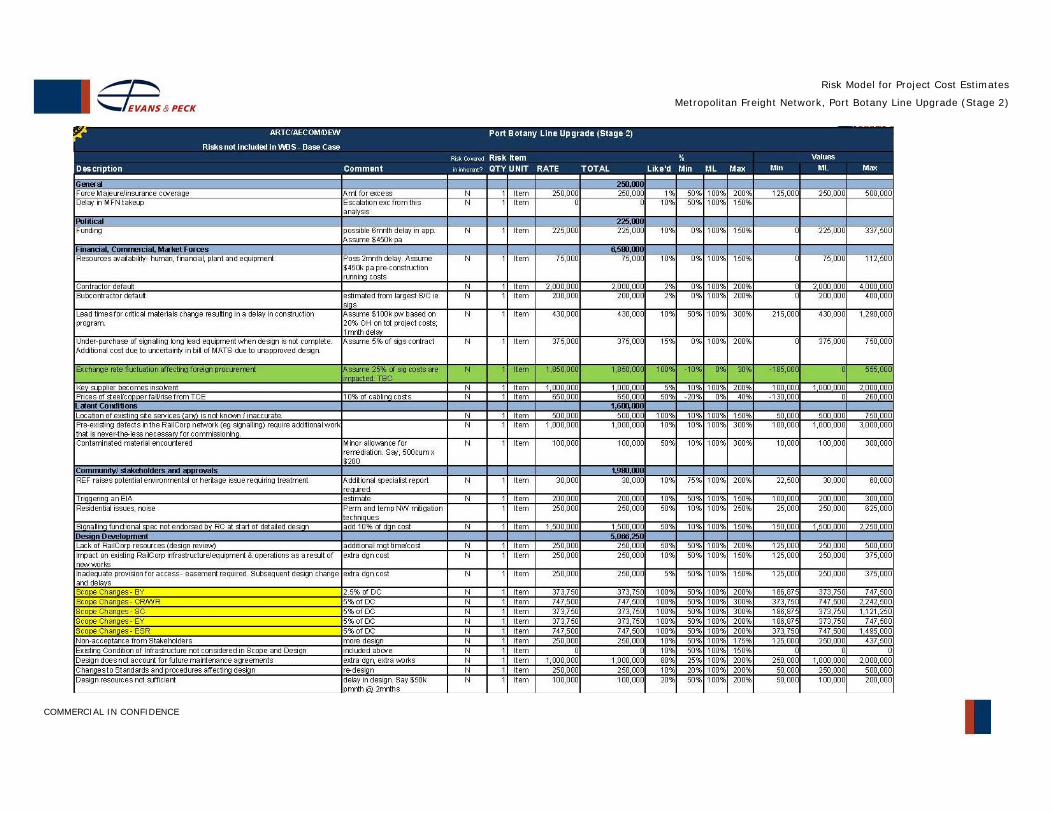
COMMERCIAL IN CONFIDENCE
Risk Model for Project Cost Estimates
Metropolitan Freight Network, Port Botany Line Upgrade (Stage 2)
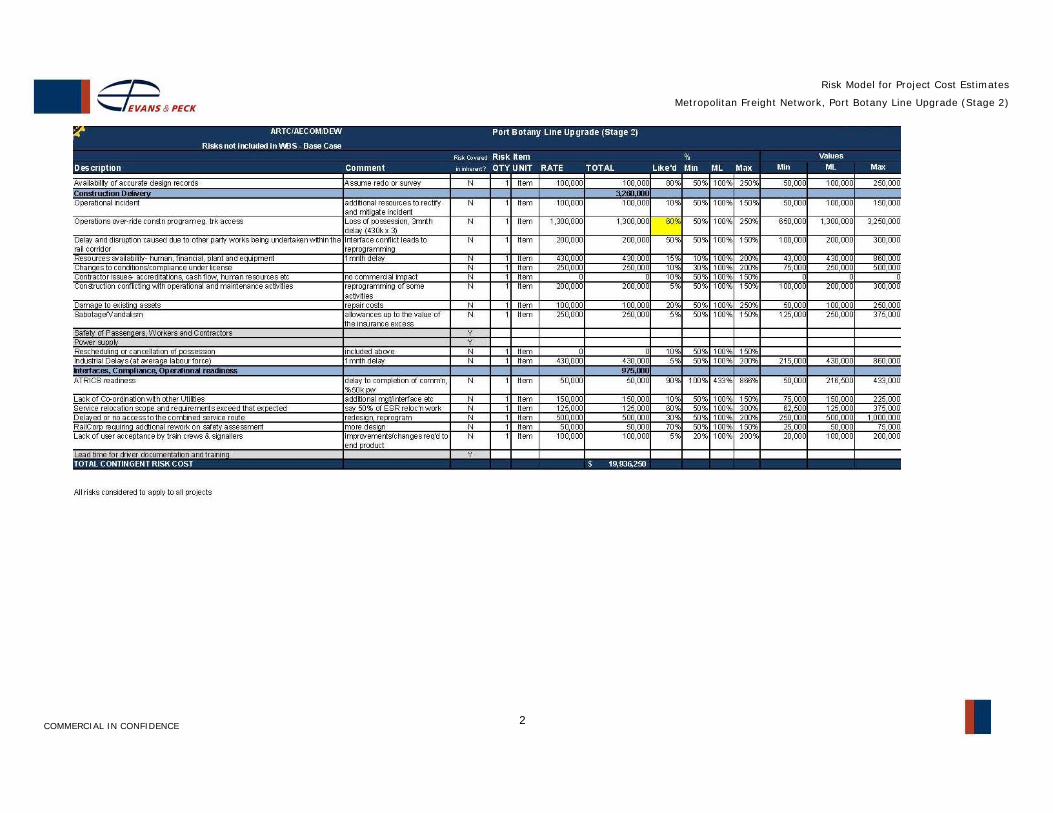
Risk Model for Project Cost Estimates
Metropolitan Freight Network, Port Botany Line Upgrade (Stage 2)
COMMERCIAL IN CONFIDENCE 2
COMMERCIAL IN CONFIDENCE
Risk Model for Project Cost Estimates
Metropolitan Freight Network, Port Botany Line Upgrade (Stage 2)
Appendix 10 Risk Output Report
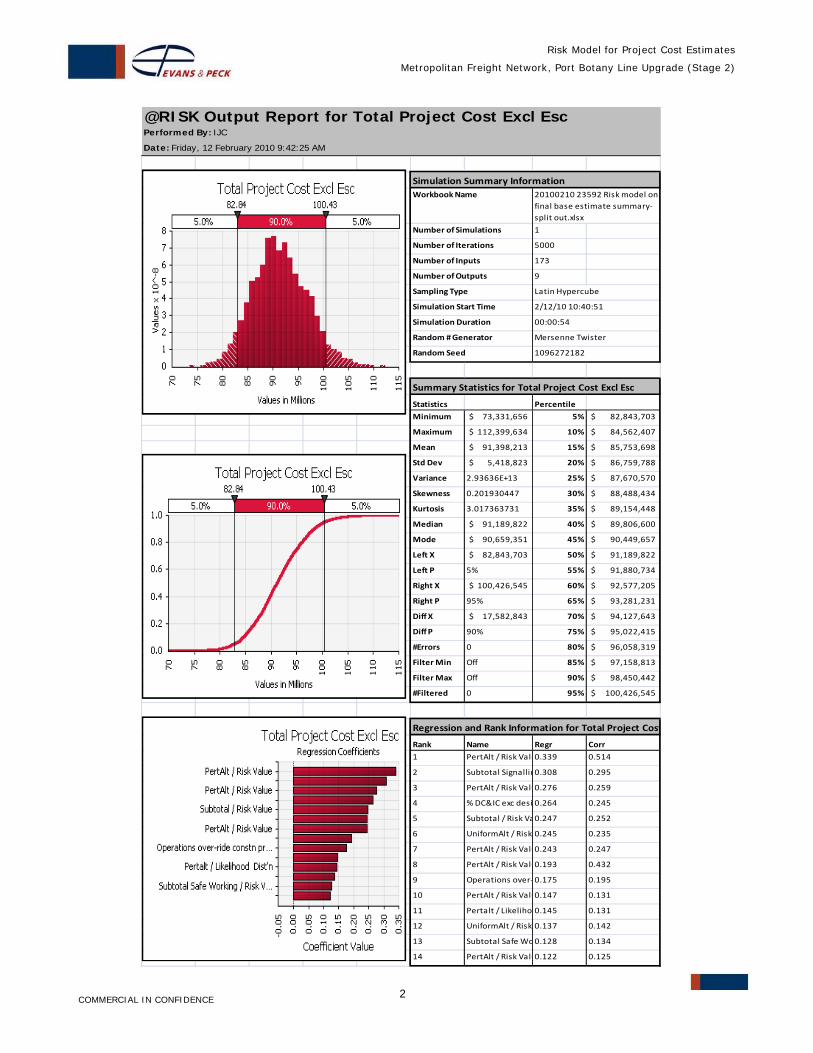
Risk Model for Project Cost Estimates
Metropolitan Freight Network, Port Botany Line Upgrade (Stage 2)
COMMERCIAL IN CONFIDENCE 2
@RISK Output Report for Total Project Cost Excl EscPerformed By: IJC
Date: Friday, 12 February 2010 9:42:25 AM
Workbook Name
Number of Simulations 1
Number of Iterations 5000
Number of Inputs 173
Number of Outputs 9
Sampling Type Latin Hypercube
Simulation Start Time
Simulation Duration
Random # Generator
Random Seed
Statistics Percentile
Minimum 73,331,656$ 5% 82,843,703$
Maximum 112,399,634$ 10% 84,562,407$
Mean 91,398,213$ 15% 85,753,698$
Std Dev 5,418,823$ 20% 86,759,788$
Variance 2.93636E+13 25% 87,670,570$
Skewness 0.201930447 30% 88,488,434$
Kurtosis 3.017363731 35% 89,154,448$
Median 91,189,822$ 40% 89,806,600$
Mode 90,659,351$ 45% 90,449,657$
Left X 82,843,703$ 50% 91,189,822$
Left P 5% 55% 91,880,734$
Right X 100,426,545$ 60% 92,577,205$
Right P 95% 65% 93,281,231$
Diff X 17,582,843$ 70% 94,127,643$
Diff P 90% 75% 95,022,415$
#Errors 0 80% 96,058,319$
Filter Min Off 85% 97,158,813$
Filter Max Off 90% 98,450,442$
#Filtered 0 95% 100,426,545$
Rank Name Regr Corr
1 PertAlt / Risk Valu0.339 0.514
2 Subtotal Signallin0.308 0.295
3 PertAlt / Risk Valu0.276 0.259
4 % DC&IC exc desi 0.264 0.245
5 Subtotal / Risk Va0.247 0.252
6 UniformAlt / Risk 0.245 0.235
7 PertAlt / Risk Valu0.243 0.247
8 PertAlt / Risk Valu0.193 0.432
9 Operations over‐0.175 0.195
10 PertAlt / Risk Valu0.147 0.131
11 Pertalt / Likeliho 0.145 0.131
12 UniformAlt / Risk 0.137 0.142
13 Subtotal Safe Wo0.128 0.134
14 PertAlt / Risk Valu0.122 0.125
Regression and Rank Information for Total Project Cost
Simulation Summary Information
2/12/10 10:40:51
00:00:54
Mersenne Twister
1096272182
Summary Statistics for Total Project Cost Excl Esc
20100210 23592 Risk model on final base estimate summary‐split out.xlsx
Project Proposal Report (PPR)
Port Botany Rail Line Upgrade Stage 2 – Delivery Phase
G2 Enfield Staging Facility – Engineering Drawings
The following drawings relating to the Enfield Staging Facility are attached:
60049133 – EN – RA – 0001
To
60049133 – EN – RA - 0010
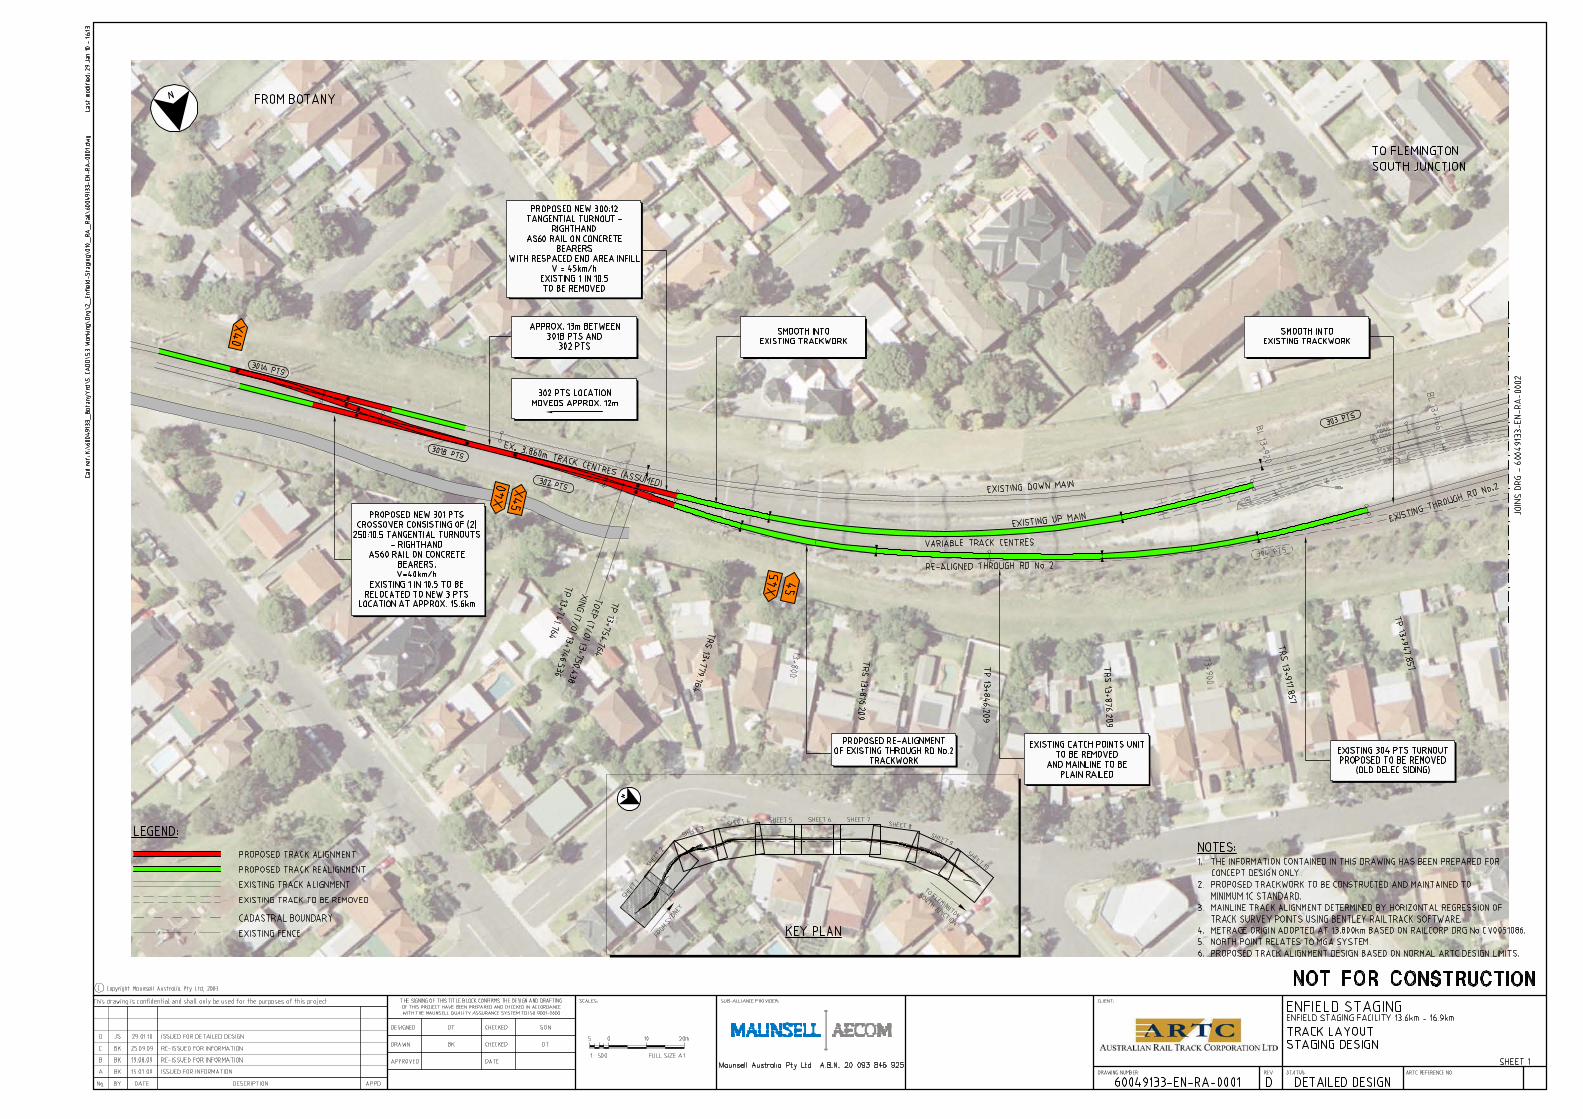
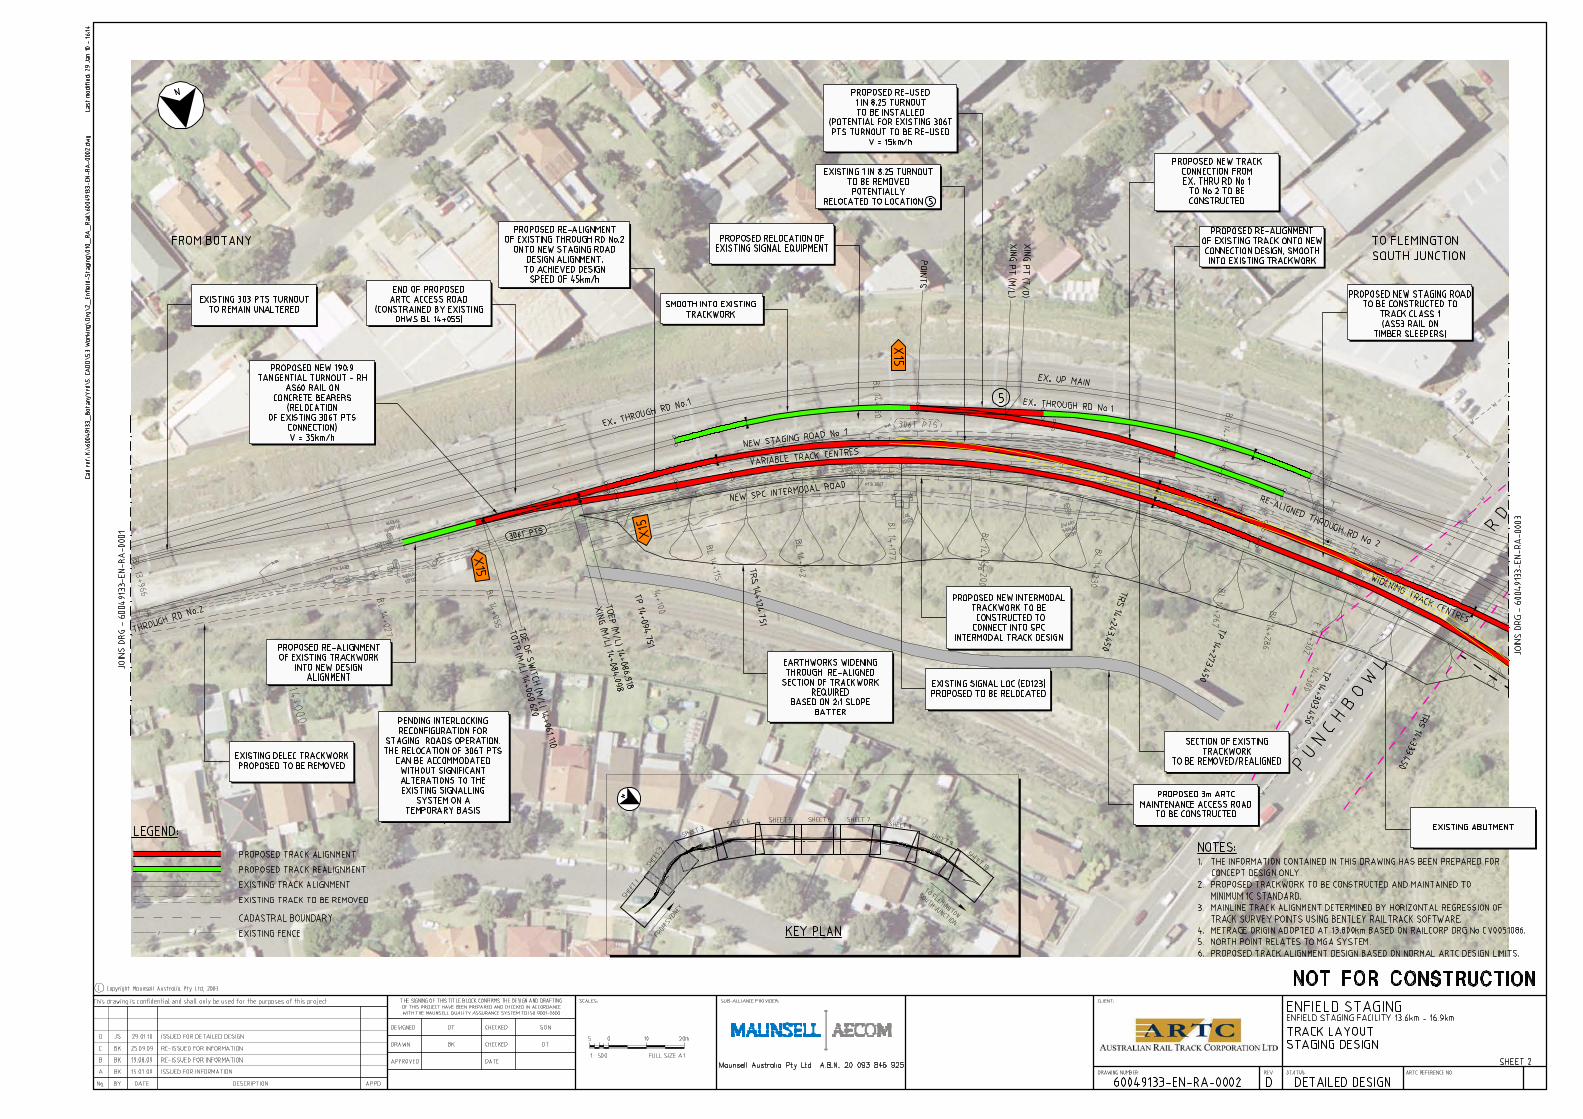
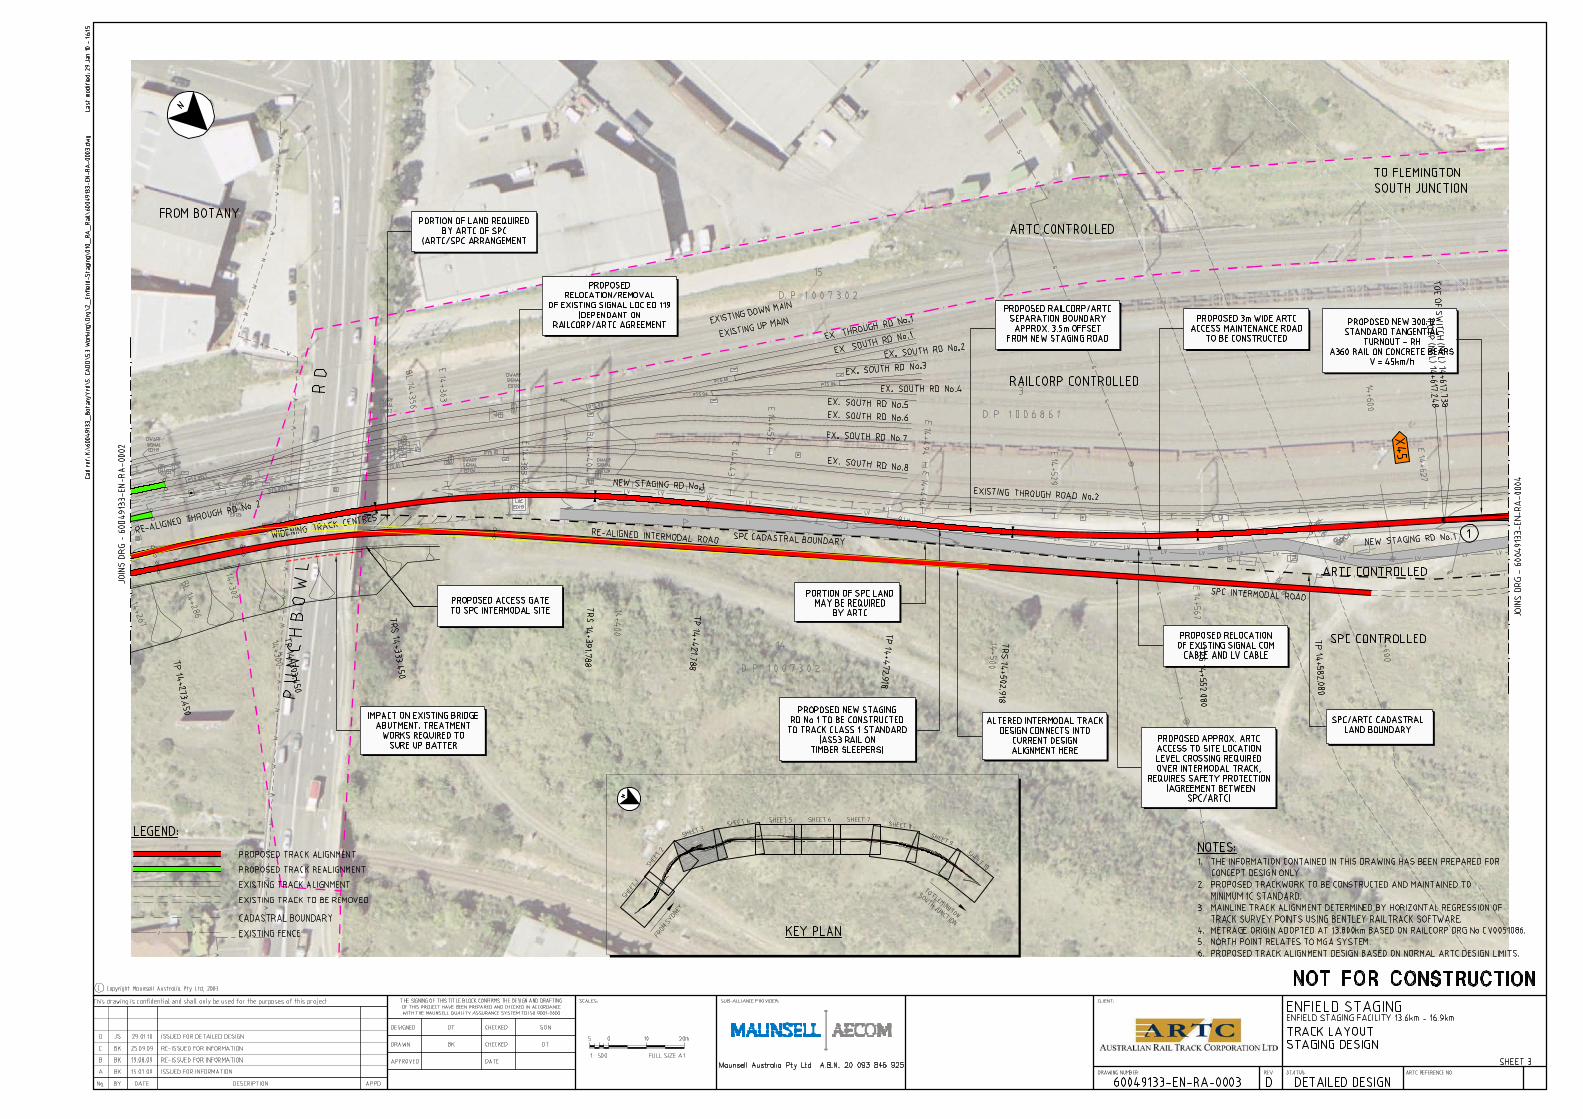
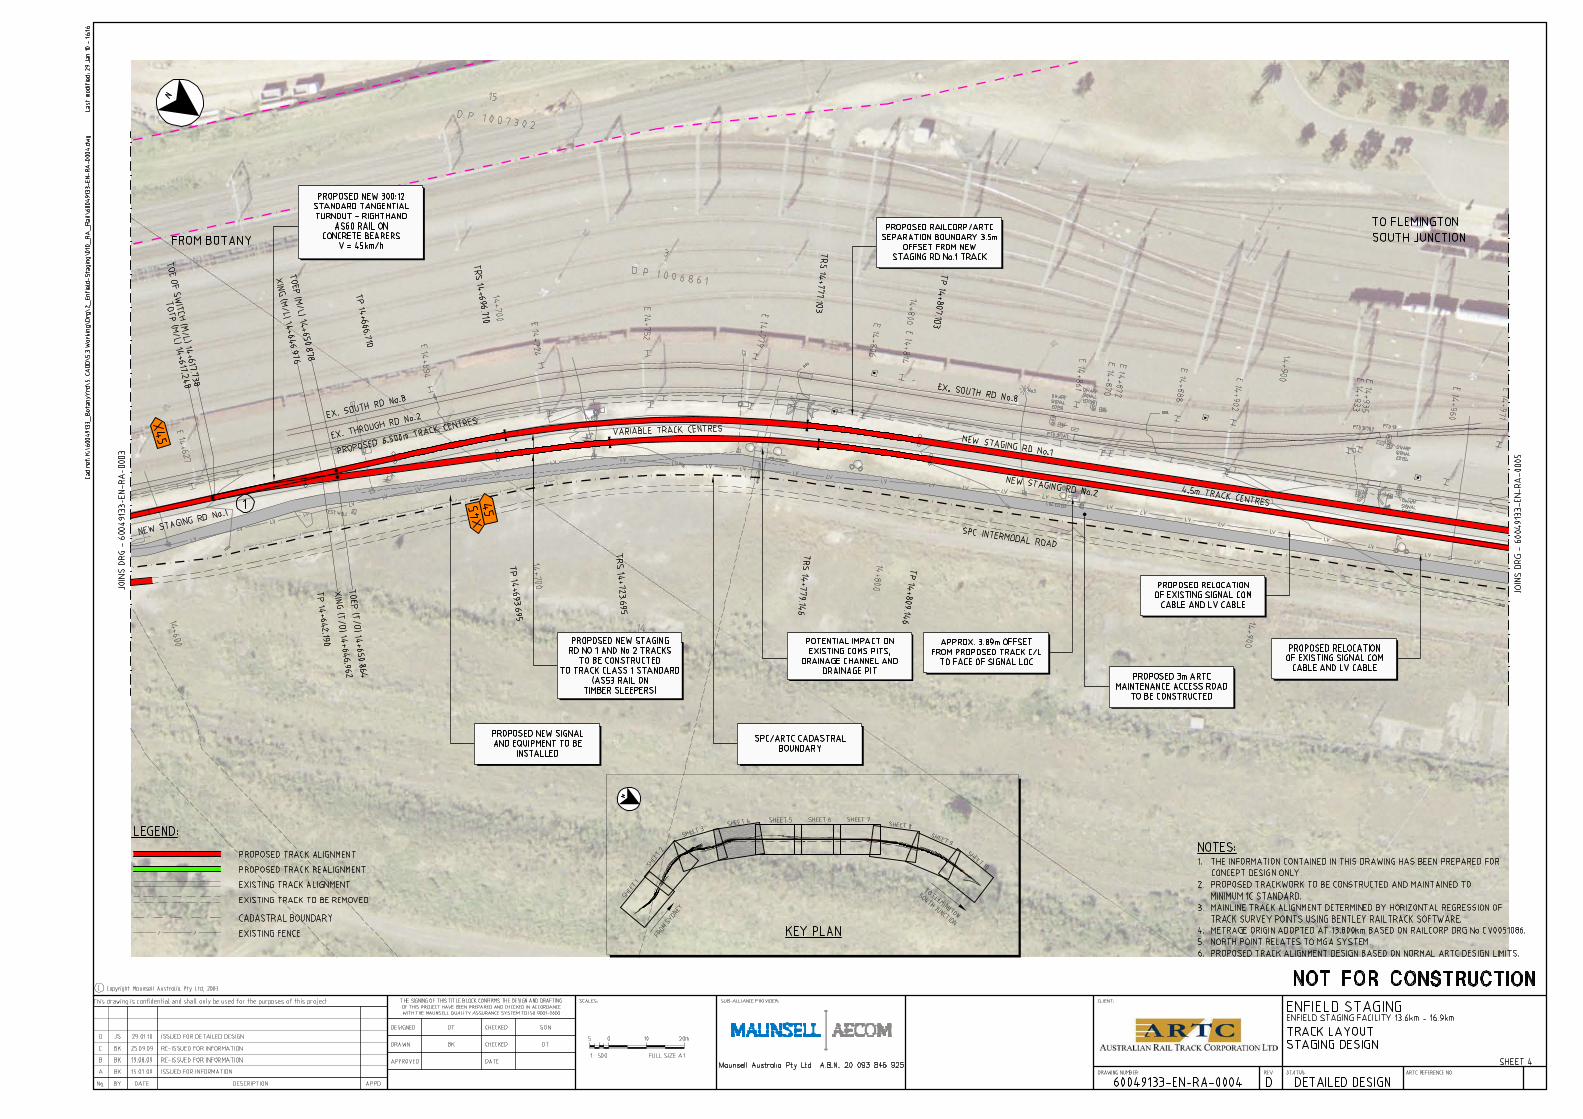
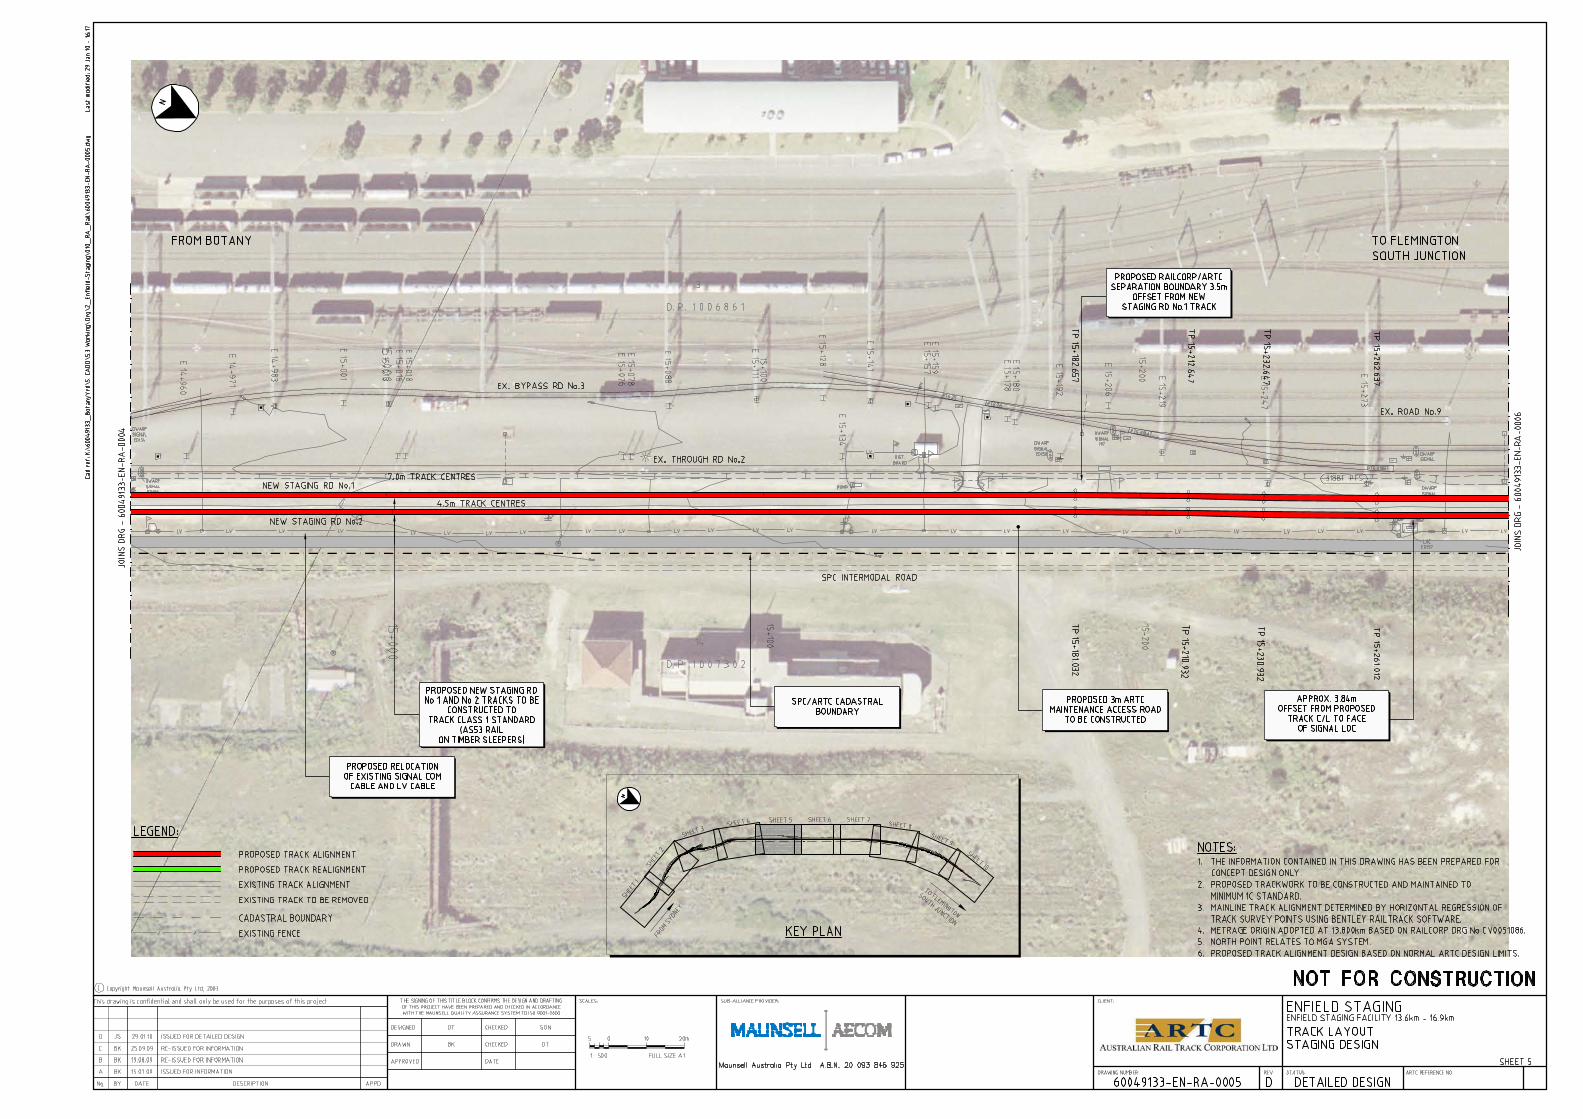
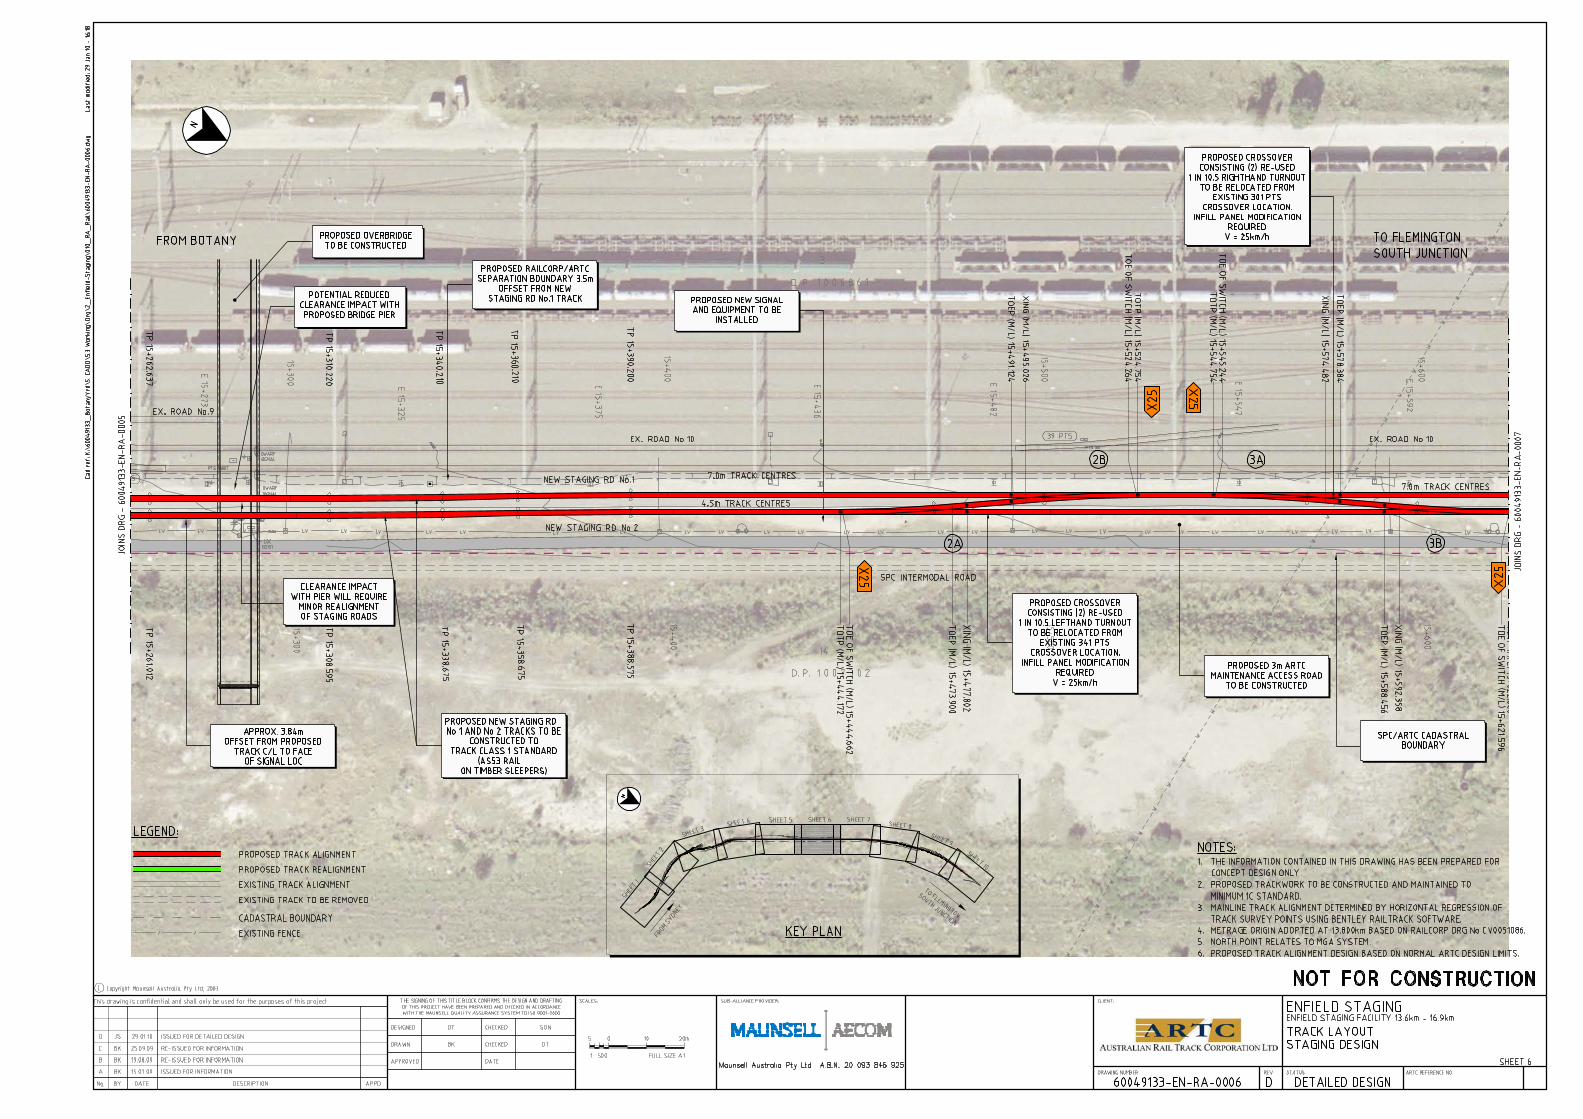

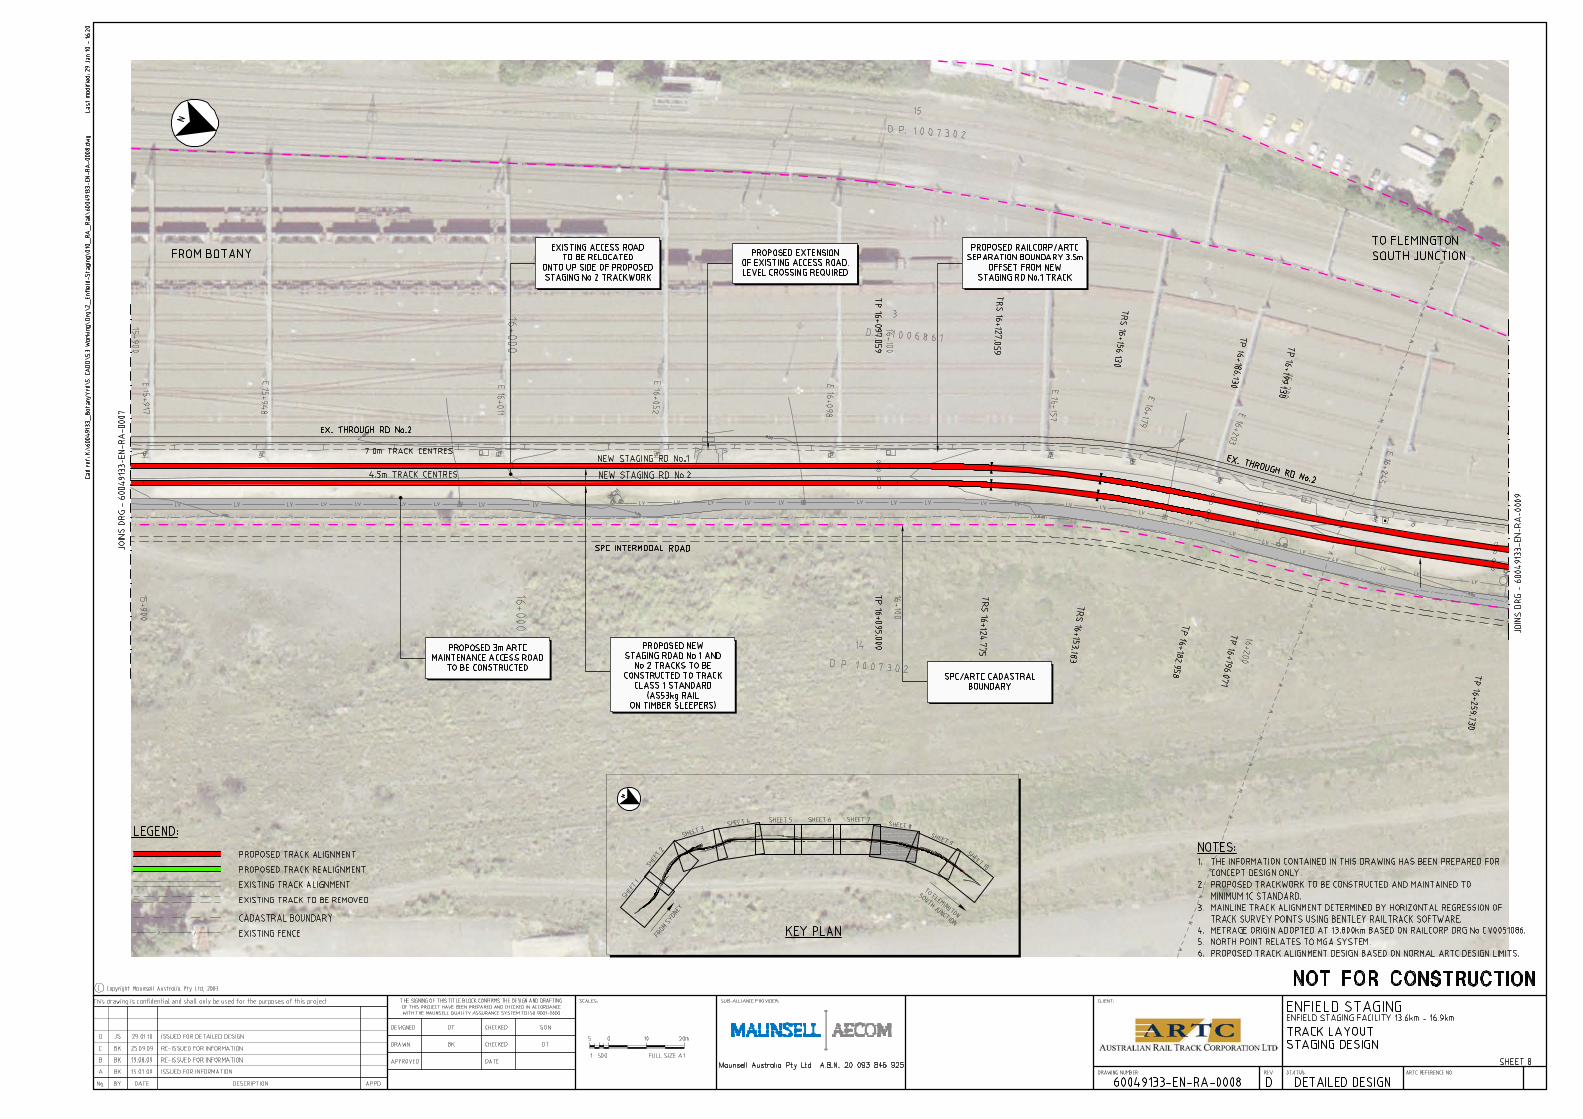
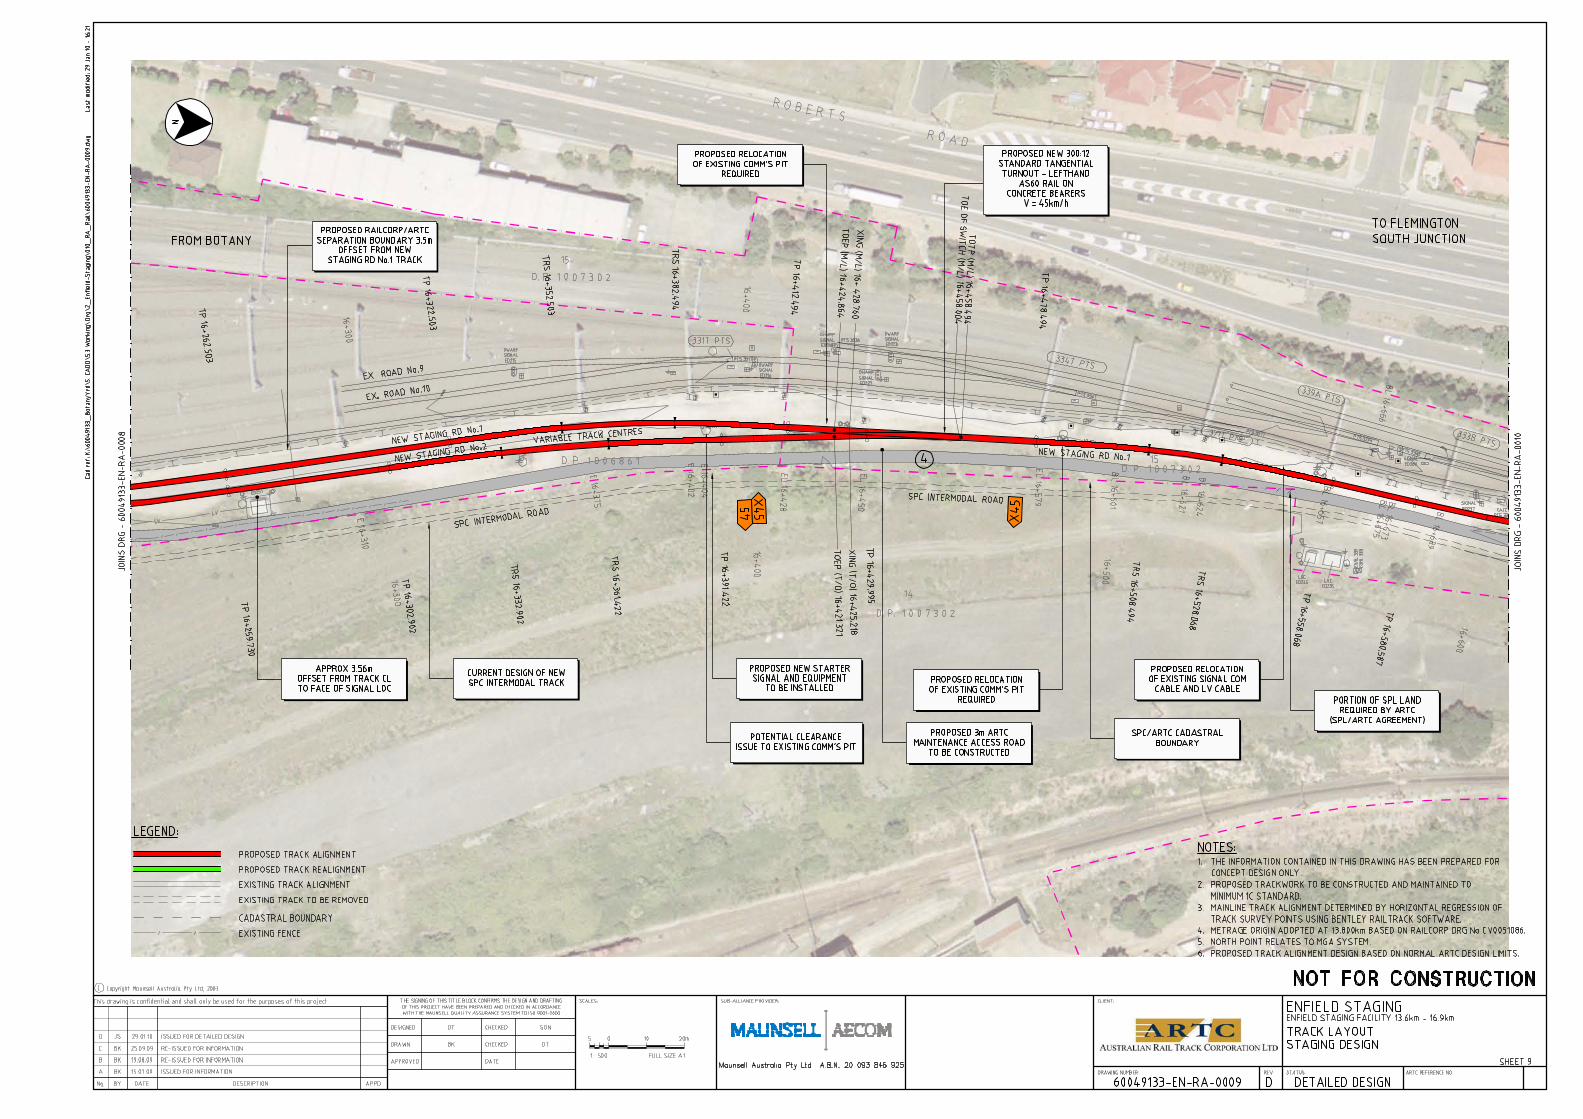
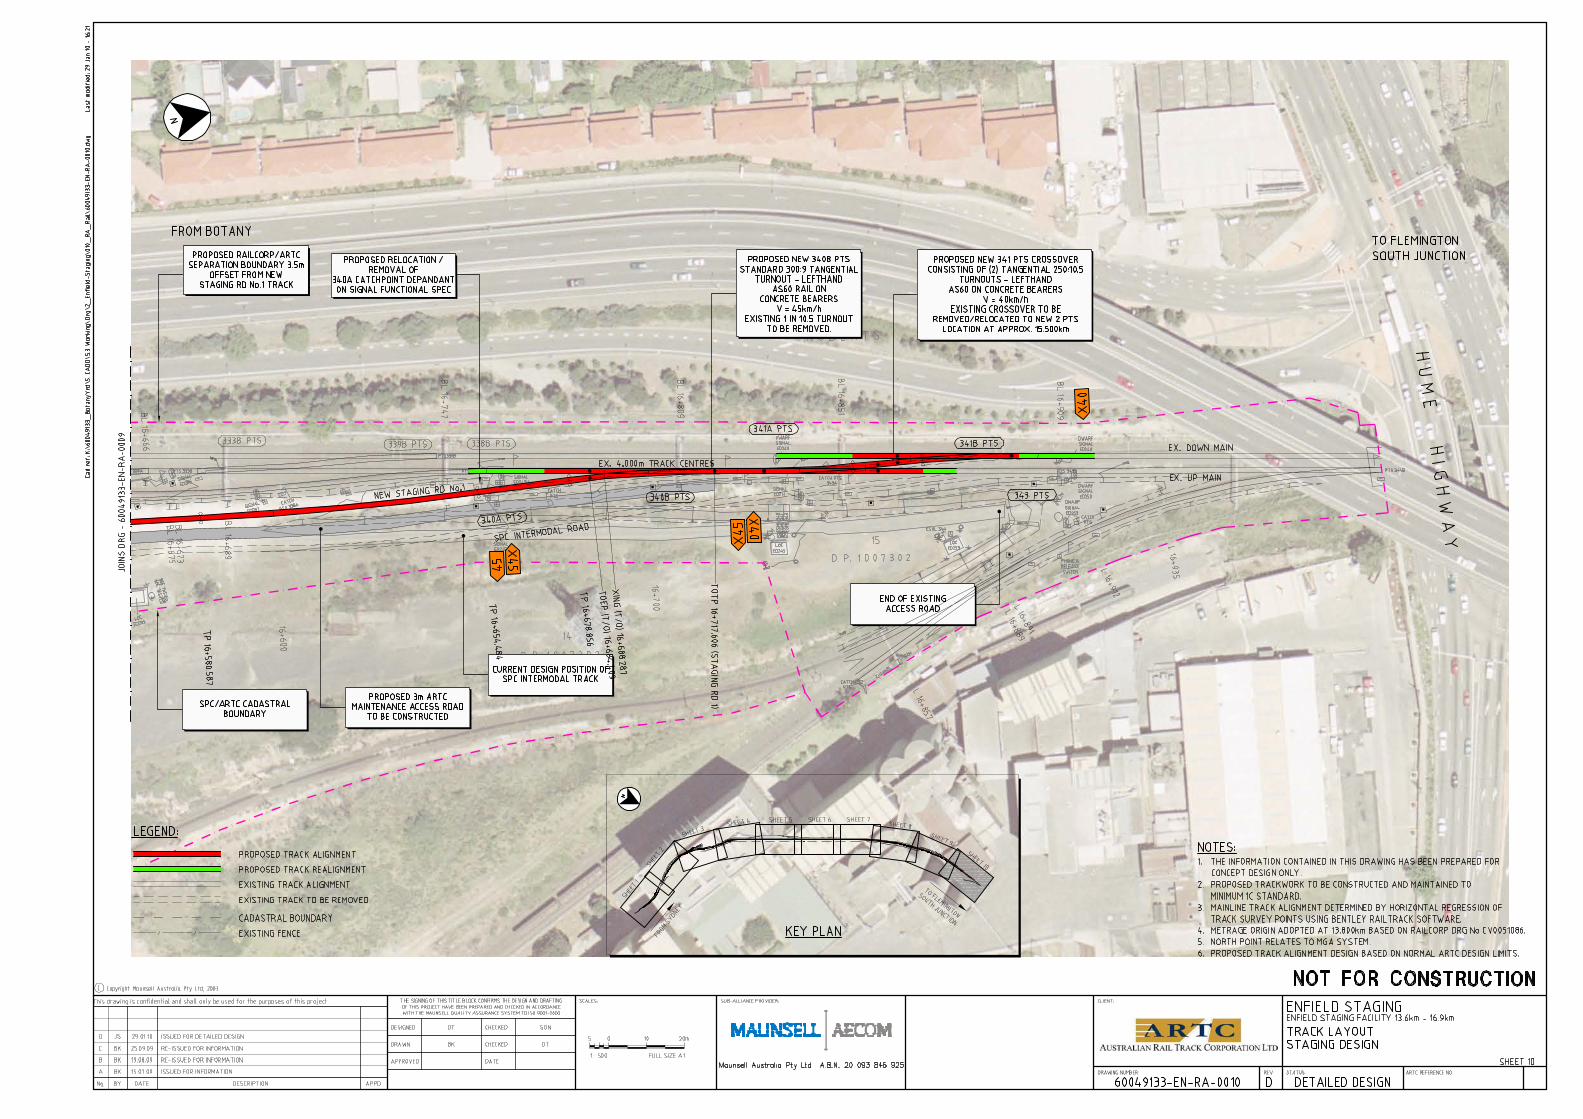
Project Proposal Report (PPR)
Port Botany Rail Line Upgrade Stage 2 – Delivery Phase
G3 Port Botany Rail Line Upgrade Stage 2 Benefit Cost Analysis AECOM Benefit-Cost Analysis of Stage 2 Works – Final report 23 March 2010.
Port Botany Rail Line Upgrade
Australian Rail Track Corporation Ltd
23 March 2010
Benefit-Cost Analysis of Stage 2 Works Final Report

AECOMPort Botany Rail Line Upgrade Benefit-Cost Analysis of Stage 2 Works - Final Report
K:\60049399_Pt_Botany_Rail\8. Issued docs\8.1 Reports\Benefit-Cost Analysis_23March2010.doc Revision B - 23 March 2010
Benefit-Cost Analysis of Stage 2 Works Final Report
Prepared for
Australian Rail Track Corporation Ltd
Prepared by AECOM Australia Pty Ltd Level 11, 44 Market Street, Sydney NSW 2000, PO Box Q410, QVB Post Office NSW 1230, Australia T +61 2 8295 3600 F +61 2 9262 5060 www.aecom.com ABN 20 093 846 925
23 March 2010
60049399
© AECOM Australia Pty Ltd 2010
The information contained in this document produced by AECOM Australia Pty Ltd is solely for the use of the Client identified on the cover sheet for the purpose for which it has been prepared and AECOM Australia Pty Ltd undertakes no duty to or accepts any responsibility to any third party who may rely upon this document.
All rights reserved. No section or element of this document may be removed from this document, reproduced, electronically stored or transmitted in any form without the written permission of AECOM Australia Pty Ltd.
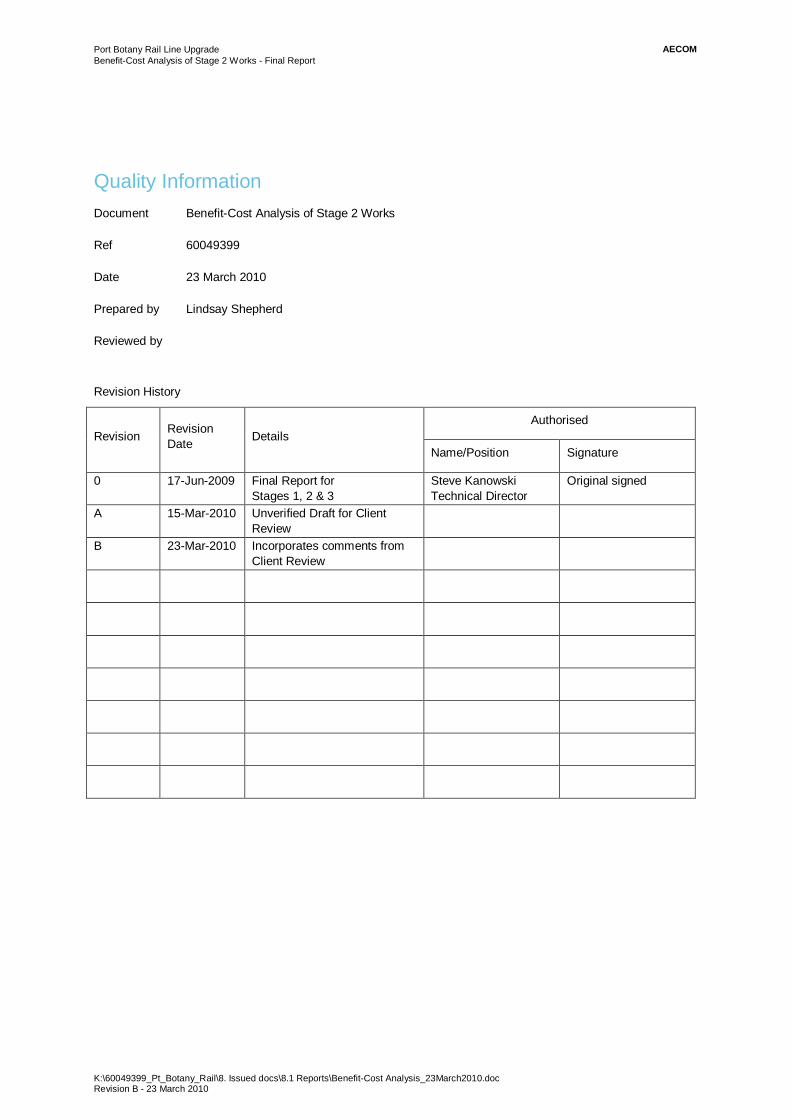
AECOMPort Botany Rail Line Upgrade Benefit-Cost Analysis of Stage 2 Works - Final Report
K:\60049399_Pt_Botany_Rail\8. Issued docs\8.1 Reports\Benefit-Cost Analysis_23March2010.doc Revision B - 23 March 2010
Quality Information Document Benefit-Cost Analysis of Stage 2 Works
Ref 60049399
Date 23 March 2010
Prepared by Lindsay Shepherd
Reviewed by
Revision History
Revision Revision Date Details
Authorised
Name/Position Signature
0 17-Jun-2009 Final Report for Stages 1, 2 & 3
Steve Kanowski Technical Director
Original signed
A 15-Mar-2010 Unverified Draft for Client Review
B 23-Mar-2010 Incorporates comments from Client Review
AECOMPort Botany Rail Line Upgrade Benefit-Cost Analysis of Stage 2 Works - Final Report
K:\60049399_Pt_Botany_Rail\8. Issued docs\8.1 Reports\Benefit-Cost Analysis_23March2010.doc Revision B - 23 March 2010
Table of Contents 1.0 Introduction 1
1.1 Project Background 1 1.2 Study Approach 1 1.3 Report Structure 1
2.0 Benefit-Cost Analysis Framework 2 2.1 Introduction 2 2.2 Base Case 3 2.3 Upgrade Case Rail Volume Scenarios 4
2.3.1 Constant percentage of total port throughput 4 2.3.2 Increased percentage of total port throughput 4 2.3.3 Terminal-driven forecast of metropolitan rail containers 4
2.4 Rail Freight Movements 5 3.0 Stage 2 Appraisal 7
3.1 Introduction 7 3.2 Upgrade Costs 7 3.3 Upgrade Benefits 7
3.3.1 Reductions in train delays 8 3.3.2 Network control cost savings 9 3.3.3 Reduced maintenance costs 9 3.3.4 Externality benefits 10 3.3.5 Rail freight customer benefits 10 3.3.6 Application to the Upgrade 13
3.4 Apportionment of Benefits 15 3.5 Benefit-Cost Analysis Results 15 3.6 Composition of Benefits 16 3.7 Sensitivity Analysis 17
Appendix A Application of Wider Economic Benefits A
AECOMPort Botany Rail Line Upgrade Benefit-Cost Analysis of Stage 2 Works - Final Report
K:\60049399_Pt_Botany_Rail\8. Issued docs\8.1 Reports\Benefit-Cost Analysis_23March2010.doc Revision B - 23 March 2010 1
1.0 Introduction
1.1 Project Background The current configuration of Port Botany and the level of service provided by the Port Botany Rail Line impose a number of constraints on the increased use of rail to transport freight to and from the port.
ARTC has planned a series of works designed to relieve capacity constraints and improve efficiency of rail operations servicing Port Botany (“the Upgrade”). Due to funding constraints, it is anticipated that the Upgrade will be delivered in three stages. The Upgrade works and their proposed staging are:
Reconfiguration of Botany Yard (Stage 1); Establishment of train staging capacity at Enfield (Stage 2); Separation of train control and signalling interfaces to provide for centralised control from ARTC’s train
control facility in Junee (Stage 2);
Provision of signalling in Port Botany Yard to control train movements in and out of the stevedore terminals (Stage 2);
Signalling at Cooks River Yard to streamline entry and exit from the yard (Stage 2); and
Concrete sleepering and upgrading of the remaining timber-sleepered sections of the rail line to bring it to a consistent high standard (Stage 3).
1.2 Study Approach Stages 1 & 2 of the Upgrade have been appraised earlier by ARTC and reported in the Project Proposal Report dated March 2008. The appraisal followed the standard economic benefit-cost analysis methodology used by ARTC and outlined in ARTC North-South Strategy – Economic Analysis, Draft, October 2005. The ARTC approach is consistent with that outlined in Australian Transport Council’s National Guidelines for Transport System Management in Australia, 2006, Volume 3.
A previous AECOM study (dated 16 June 2009) reviewed the earlier ARTC appraisal and recommended a number of changes to the ARTC benefit-cost analysis of Stages 1 & 2. The recommended changes were agreed to by the ARTC Project Director and were incorporated in the AECOM report. The report also incorporated the benefit-cost analysis of Stage 3 of the Upgrade.
Stage 3 was undertaken as a separate benefit-cost analysis to that for Stages 1 & 2. Stages 1 & 2 were appraised together because it was difficult to separately estimate their benefits – the scope of the works in these stages jointly contributes to reducing constraints on the increased use of rail for freight transport to and from the port, with the majority of benefits accruing to freight customers. Stage 3, on the other hand, is to achieve efficiencies in operating and maintenance practices with the benefits accruing to train operators and ARTC.
The present study updates the capital cost estimates and capital expenditure profile of Stage 2. Although funding for Stage 1 has been approved and funds released, it is still necessary to appraise Stage 2 with Stage 1, because of the joint nature of their benefits. Although Stage 2 costs and timing have been updated from the previous report, Stage 1 costs and timing remain unchanged.
1.3 Report Structure The remainder of the report comprises:
Section 2.0 describing the benefit-cost analysis framework and the rail freight movement forecasts used in the analysis; and
Section 3.0 sets out the updated economic appraisal of Stage 2 of the Upgrade, including description of the costs and benefits and the results of the main benefit-cost analysis and the sensitivity analysis.
AECOMPort Botany Rail Line Upgrade Benefit-Cost Analysis of Stage 2 Works - Final Report
K:\60049399_Pt_Botany_Rail\8. Issued docs\8.1 Reports\Benefit-Cost Analysis_23March2010.doc Revision B - 23 March 2010 2
2.0 Benefit-Cost Analysis Framework
2.1 Introduction In the benefit-cost analysis methodology referred to in Section 1.2, an investment proposal is evaluated on an incremental basis from a base case, where the Base Case is defined as the situation without the investment proposal being implemented. Table 2.1 outlines the Base Case and the Upgrade Case for this benefit-cost analysis.
Table 2.1 shows that the rail infrastructure requirements are driven by movements of containers and trains. Container movements through Port Botany consist of import and export containers, both loaded and empty. These movements depend on a range of international and domestic macro-economic and trade factors. Growth in these movements is forecast by organisations such as Bureau of Infrastructure, Transport and Regional Economics and Sydney Ports Corporation. The current appraisal assumes that container movements through Port Botany will not be affected by the Port Botany Rail Line Upgrade, i.e. growth in container movements will be independent of the project (in transport modelling terms, there will be no induced demand).
Containers transported by rail and the resulting number of train movements depend on modal share factors, including the capacity of intermodal terminals serving Port Botany container traffic. Given the limitations of the information and data that are available on freight movements, forecasts of train movements are best prepared using a scenario approach.
For the current appraisal, the Base Case is defined as no additional rail investment - available capacity for increased rail freight is assumed to be 10% of current volumes based on information from ARTC. Three rail volume scenarios were considered for the Upgrade Case:
Metropolitan rail freight grows at the same rate as overall Port Botany container growth (this implies rail maintains its market share);
Metropolitan rail freight grows at 2% per year above overall Port Botany container growth (this would require an annual rail freight growth of around 7% per year which is consistent with achieving the NSW Government target of rail moving 40% of Port Botany containers); and
Metropolitan rail freight growth is based on take-up capacity within new intermodal terminals (this implicitly assumes that there is latent demand which is currently constrained by a lack of intermodal terminal capacity).
It is considered that without any other substantial rail investments beyond Enfield, the Project is unlikely to lead to additional growth in regional rail volumes above the Base Case.1 As such, regional rail freight volumes are the same for all scenarios.
Each rail volume scenario is discussed in the following sections.
1 Port Botany rail freight comprises movements of import/export containers (loaded and empty) to/from metropolitan terminals and regional terminals. Container movements are conventionally measured in terms of twenty-foot equivalent units (TEUs). A TEU is an internationally recognised measure of shipping container volumes, where a 20ft container is equal to one TEU and a 40ft container is equal to two TEUs. ARTC estimates for 2007/08 are 200,000 metropolitan TEUs and 110,000 regional TEUs, with an overall rail mode share of 17% (total container movements through Port Botany were 1.8 million TEUs).
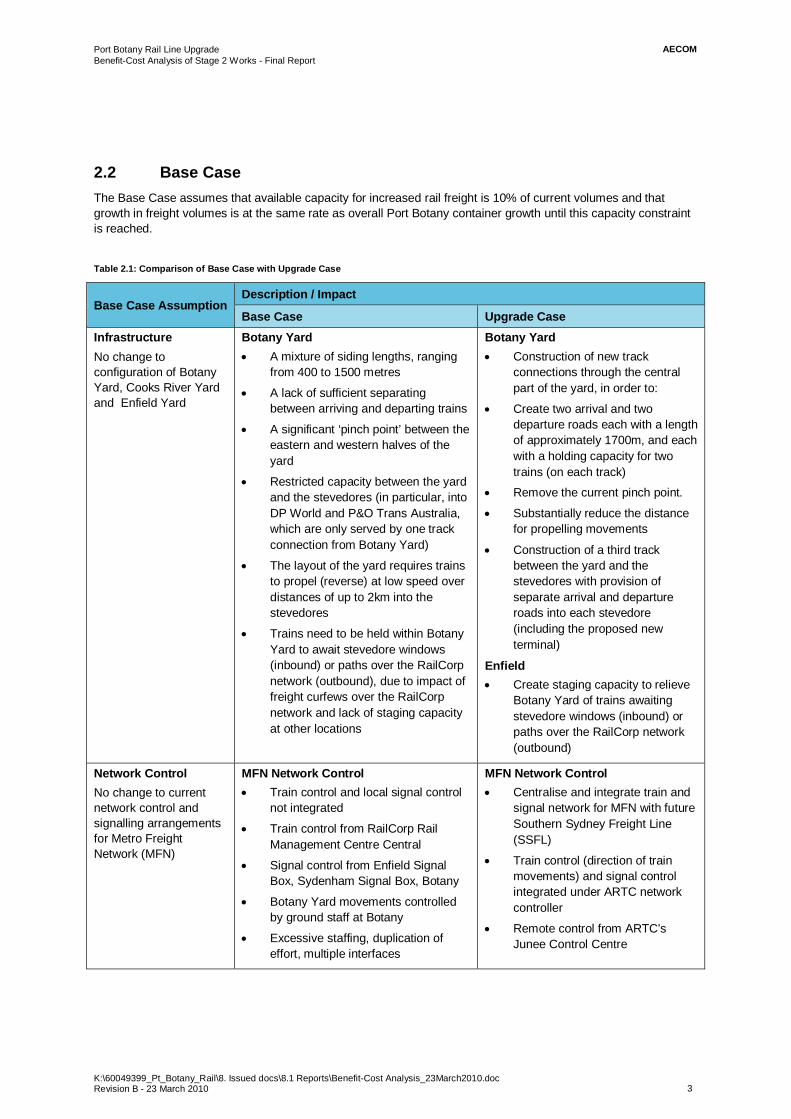
AECOMPort Botany Rail Line Upgrade Benefit-Cost Analysis of Stage 2 Works - Final Report
K:\60049399_Pt_Botany_Rail\8. Issued docs\8.1 Reports\Benefit-Cost Analysis_23March2010.doc Revision B - 23 March 2010 3
2.2 Base Case The Base Case assumes that available capacity for increased rail freight is 10% of current volumes and that growth in freight volumes is at the same rate as overall Port Botany container growth until this capacity constraint is reached. Table 2.1: Comparison of Base Case with Upgrade Case
Base Case Assumption Description / Impact
Base Case Upgrade Case Infrastructure No change to configuration of Botany Yard, Cooks River Yard and Enfield Yard
Botany Yard A mixture of siding lengths, ranging
from 400 to 1500 metres
A lack of sufficient separating between arriving and departing trains
A significant ‘pinch point’ between the eastern and western halves of the yard
Restricted capacity between the yard and the stevedores (in particular, into DP World and P&O Trans Australia, which are only served by one track connection from Botany Yard)
The layout of the yard requires trains to propel (reverse) at low speed over distances of up to 2km into the stevedores
Trains need to be held within Botany Yard to await stevedore windows (inbound) or paths over the RailCorp network (outbound), due to impact of freight curfews over the RailCorp network and lack of staging capacity at other locations
Botany Yard Construction of new track
connections through the central part of the yard, in order to:
Create two arrival and two departure roads each with a length of approximately 1700m, and each with a holding capacity for two trains (on each track)
Remove the current pinch point.
Substantially reduce the distance for propelling movements
Construction of a third track between the yard and the stevedores with provision of separate arrival and departure roads into each stevedore (including the proposed new terminal)
Enfield Create staging capacity to relieve
Botany Yard of trains awaiting stevedore windows (inbound) or paths over the RailCorp network (outbound)
Network Control No change to current network control and signalling arrangements for Metro Freight Network (MFN)
MFN Network Control Train control and local signal control
not integrated
Train control from RailCorp Rail Management Centre Central
Signal control from Enfield Signal Box, Sydenham Signal Box, Botany
Botany Yard movements controlled by ground staff at Botany
Excessive staffing, duplication of effort, multiple interfaces
MFN Network Control Centralise and integrate train and
signal network for MFN with future Southern Sydney Freight Line (SSFL)
Train control (direction of train movements) and signal control integrated under ARTC network controller
Remote control from ARTC’s Junee Control Centre
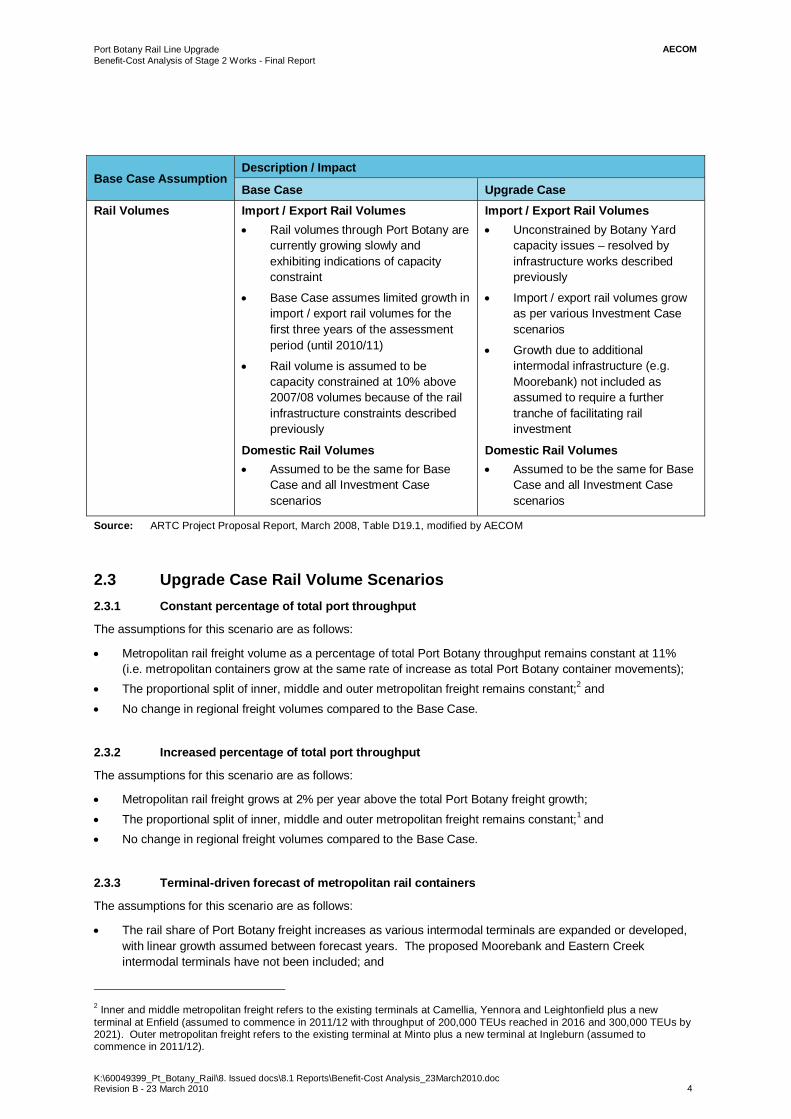
AECOMPort Botany Rail Line Upgrade Benefit-Cost Analysis of Stage 2 Works - Final Report
K:\60049399_Pt_Botany_Rail\8. Issued docs\8.1 Reports\Benefit-Cost Analysis_23March2010.doc Revision B - 23 March 2010 4
Base Case Assumption Description / Impact
Base Case Upgrade Case Rail Volumes Import / Export Rail Volumes
Rail volumes through Port Botany are currently growing slowly and exhibiting indications of capacity constraint
Base Case assumes limited growth in import / export rail volumes for the first three years of the assessment period (until 2010/11)
Rail volume is assumed to be capacity constrained at 10% above 2007/08 volumes because of the rail infrastructure constraints described previously
Domestic Rail Volumes Assumed to be the same for Base
Case and all Investment Case scenarios
Import / Export Rail Volumes Unconstrained by Botany Yard
capacity issues – resolved by infrastructure works described previously
Import / export rail volumes grow as per various Investment Case scenarios
Growth due to additional intermodal infrastructure (e.g. Moorebank) not included as assumed to require a further tranche of facilitating rail investment
Domestic Rail Volumes Assumed to be the same for Base
Case and all Investment Case scenarios
Source: ARTC Project Proposal Report, March 2008, Table D19.1, modified by AECOM
2.3 Upgrade Case Rail Volume Scenarios 2.3.1 Constant percentage of total port throughput
The assumptions for this scenario are as follows:
Metropolitan rail freight volume as a percentage of total Port Botany throughput remains constant at 11% (i.e. metropolitan containers grow at the same rate of increase as total Port Botany container movements);
The proportional split of inner, middle and outer metropolitan freight remains constant;2 and No change in regional freight volumes compared to the Base Case.
2.3.2 Increased percentage of total port throughput
The assumptions for this scenario are as follows:
Metropolitan rail freight grows at 2% per year above the total Port Botany freight growth; The proportional split of inner, middle and outer metropolitan freight remains constant;1 and No change in regional freight volumes compared to the Base Case.
2.3.3 Terminal-driven forecast of metropolitan rail containers
The assumptions for this scenario are as follows:
The rail share of Port Botany freight increases as various intermodal terminals are expanded or developed, with linear growth assumed between forecast years. The proposed Moorebank and Eastern Creek intermodal terminals have not been included; and
2 Inner and middle metropolitan freight refers to the existing terminals at Camellia, Yennora and Leightonfield plus a new terminal at Enfield (assumed to commence in 2011/12 with throughput of 200,000 TEUs reached in 2016 and 300,000 TEUs by 2021). Outer metropolitan freight refers to the existing terminal at Minto plus a new terminal at Ingleburn (assumed to commence in 2011/12).
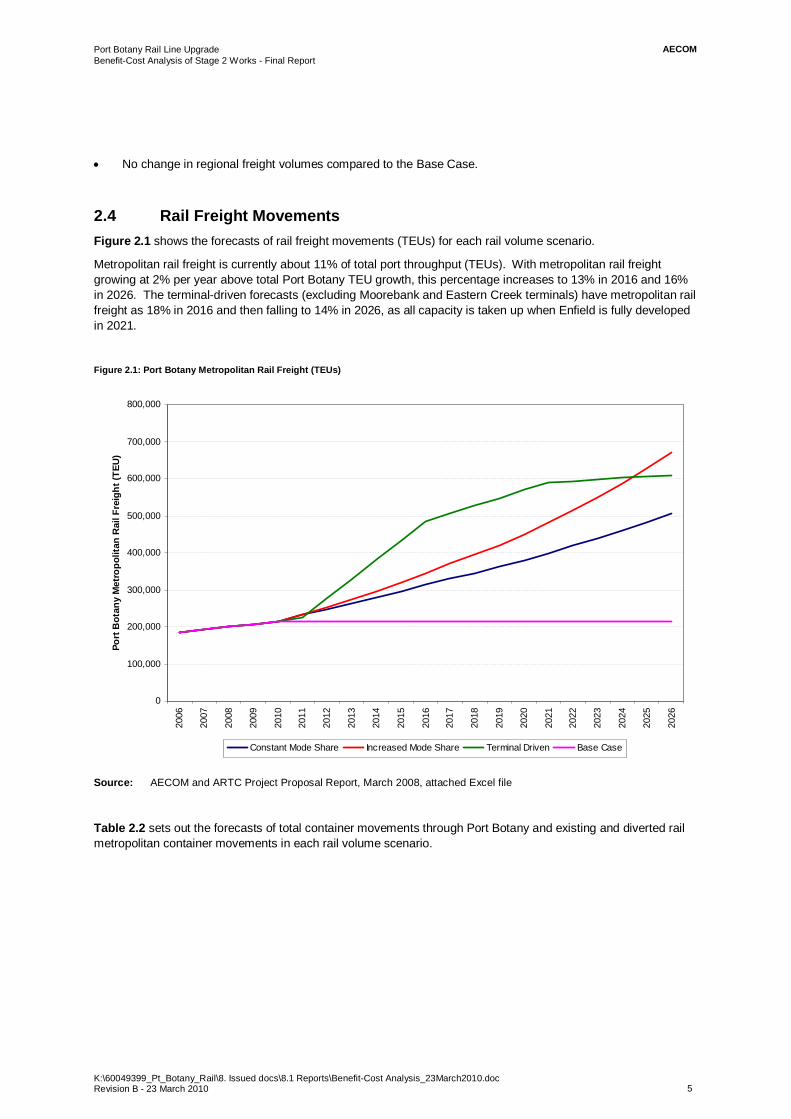
AECOMPort Botany Rail Line Upgrade Benefit-Cost Analysis of Stage 2 Works - Final Report
K:\60049399_Pt_Botany_Rail\8. Issued docs\8.1 Reports\Benefit-Cost Analysis_23March2010.doc Revision B - 23 March 2010 5
No change in regional freight volumes compared to the Base Case.
2.4 Rail Freight Movements Figure 2.1 shows the forecasts of rail freight movements (TEUs) for each rail volume scenario.
Metropolitan rail freight is currently about 11% of total port throughput (TEUs). With metropolitan rail freight growing at 2% per year above total Port Botany TEU growth, this percentage increases to 13% in 2016 and 16% in 2026. The terminal-driven forecasts (excluding Moorebank and Eastern Creek terminals) have metropolitan rail freight as 18% in 2016 and then falling to 14% in 2026, as all capacity is taken up when Enfield is fully developed in 2021.
Figure 2.1: Port Botany Metropolitan Rail Freight (TEUs)
0
100,000
200,000
300,000
400,000
500,000
600,000
700,000
800,000
2006
2007
2008
2009
2010
2011
2012
2013
2014
2015
2016
2017
2018
2019
2020
2021
2022
2023
2024
2025
2026
Port
Bot
any
Met
ropo
litan
Rai
l Fre
ight
(TEU
)
Constant Mode Share Increased Mode Share Terminal Driven Base Case
Source: AECOM and ARTC Project Proposal Report, March 2008, attached Excel file
Table 2.2 sets out the forecasts of total container movements through Port Botany and existing and diverted rail metropolitan container movements in each rail volume scenario.

AECOMPort Botany Rail Line Upgrade Benefit-Cost Analysis of Stage 2 Works - Final Report
K:\60049399_Pt_Botany_Rail\8. Issued docs\8.1 Reports\Benefit-Cost Analysis_23March2010.doc Revision B - 23 March 2010 6
Table 2.2: Forecast Port Botany total container movements and metropolitan rail container movements (TEUs)
Year ending June
Total container movements
Metropolitan rail container movements a/ Existing
Movements diverted from road Constant mode share
Increased mode share
Terminal driven
2008 1,778,000 200,000 2011 1,968,000 213,000 22,000 22,000 12,000 2016 2,635,000 213,000 102,000 133,000 272,000 2026 4,234,000 213,000 293,000 458,000 397,000 Source: 2008 – Sydney Ports Corporation; forecast years - AECOM
Note: a/ There are also regional rail container movements in each forecast year and scenario of 118,000 TEU (2008 actual of 110,000 TEU).
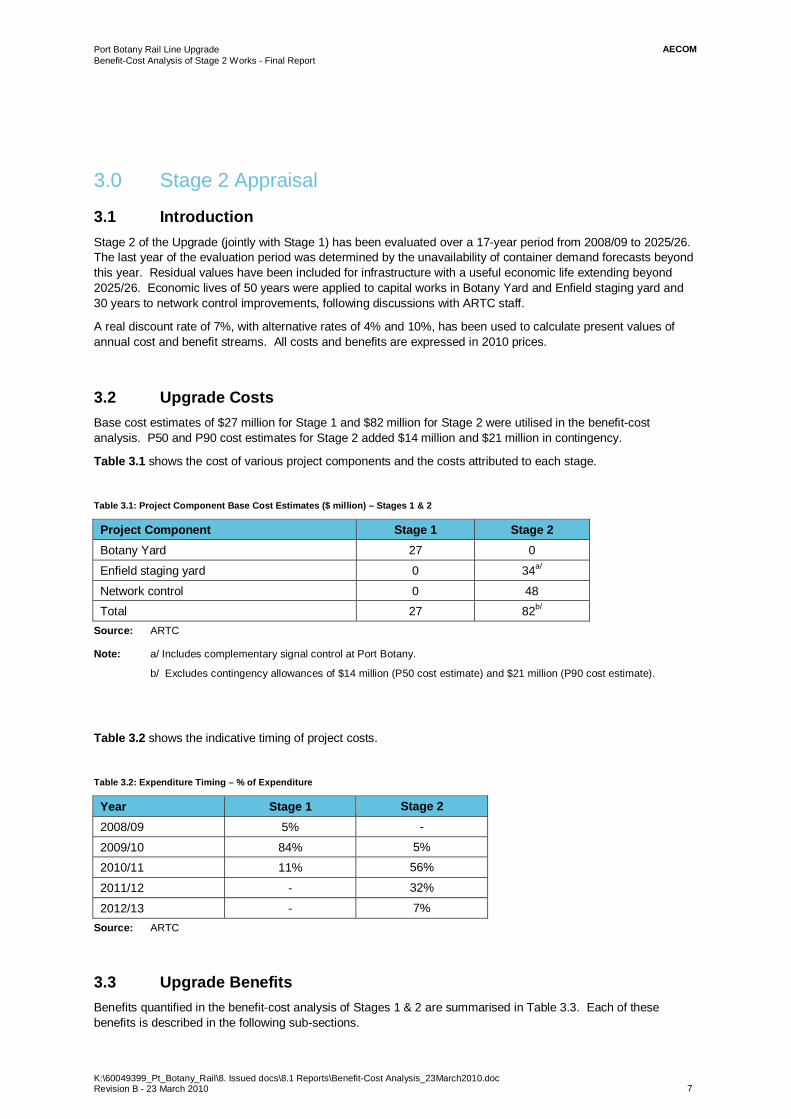
AECOMPort Botany Rail Line Upgrade Benefit-Cost Analysis of Stage 2 Works - Final Report
K:\60049399_Pt_Botany_Rail\8. Issued docs\8.1 Reports\Benefit-Cost Analysis_23March2010.doc Revision B - 23 March 2010 7
3.0 Stage 2 Appraisal
3.1 Introduction Stage 2 of the Upgrade (jointly with Stage 1) has been evaluated over a 17-year period from 2008/09 to 2025/26. The last year of the evaluation period was determined by the unavailability of container demand forecasts beyond this year. Residual values have been included for infrastructure with a useful economic life extending beyond 2025/26. Economic lives of 50 years were applied to capital works in Botany Yard and Enfield staging yard and 30 years to network control improvements, following discussions with ARTC staff.
A real discount rate of 7%, with alternative rates of 4% and 10%, has been used to calculate present values of annual cost and benefit streams. All costs and benefits are expressed in 2010 prices.
3.2 Upgrade Costs Base cost estimates of $27 million for Stage 1 and $82 million for Stage 2 were utilised in the benefit-cost analysis. P50 and P90 cost estimates for Stage 2 added $14 million and $21 million in contingency.
Table 3.1 shows the cost of various project components and the costs attributed to each stage.
Table 3.1: Project Component Base Cost Estimates ($ million) – Stages 1 & 2
Project Component Stage 1 Stage 2 Botany Yard 27 0
Enfield staging yard 0 34a/
Network control 0 48 Total 27 82b/
Source: ARTC
Note: a/ Includes complementary signal control at Port Botany.
b/ Excludes contingency allowances of $14 million (P50 cost estimate) and $21 million (P90 cost estimate).
Table 3.2 shows the indicative timing of project costs.
Table 3.2: Expenditure Timing – % of Expenditure
Year Stage 1 Stage 2 2008/09 5% -
2009/10 84% 5%
2010/11 11% 56%
2011/12 - 32%
2012/13 - 7% Source: ARTC
3.3 Upgrade Benefits Benefits quantified in the benefit-cost analysis of Stages 1 & 2 are summarised in Table 3.3. Each of these benefits is described in the following sub-sections.
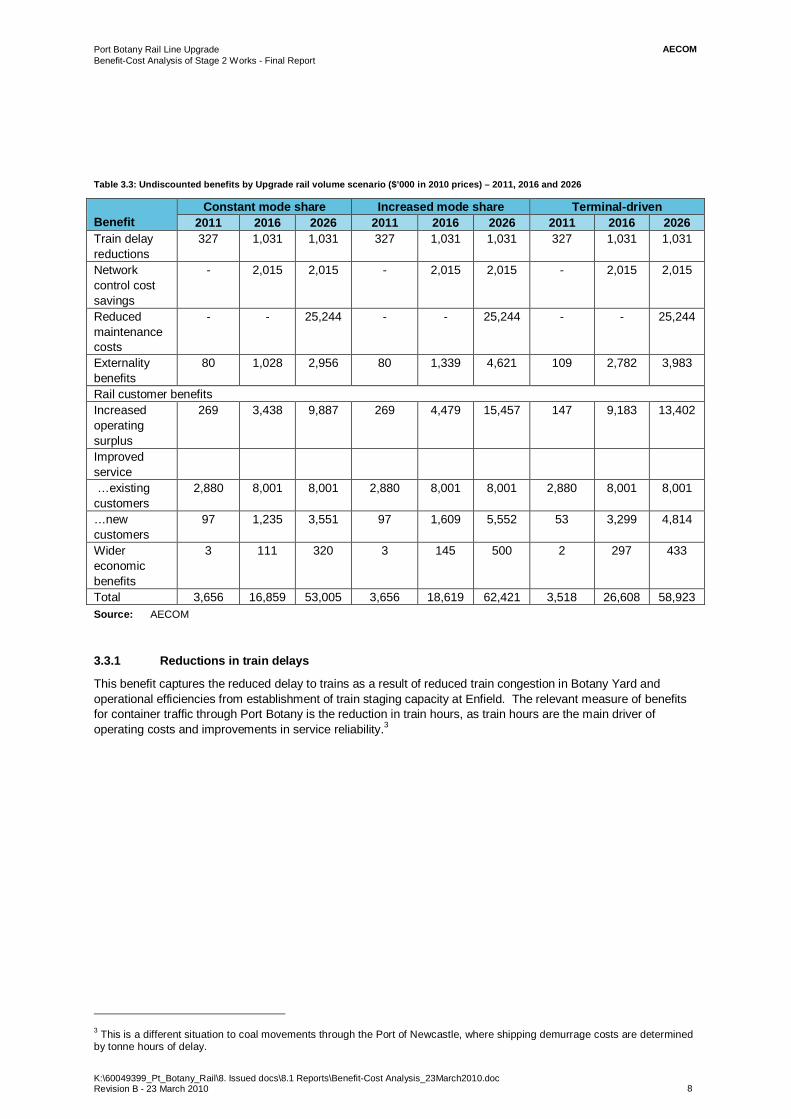
AECOMPort Botany Rail Line Upgrade Benefit-Cost Analysis of Stage 2 Works - Final Report
K:\60049399_Pt_Botany_Rail\8. Issued docs\8.1 Reports\Benefit-Cost Analysis_23March2010.doc Revision B - 23 March 2010 8
Table 3.3: Undiscounted benefits by Upgrade rail volume scenario ($’000 in 2010 prices) – 2011, 2016 and 2026
Benefit
Constant mode share Increased mode share Terminal-driven 2011 2016 2026 2011 2016 2026 2011 2016 2026
Train delay reductions
327 1,031 1,031 327 1,031 1,031 327 1,031 1,031
Network control cost savings
- 2,015 2,015 - 2,015 2,015 - 2,015 2,015
Reduced maintenance costs
- - 25,244 - - 25,244 - - 25,244
Externality benefits
80 1,028 2,956 80 1,339 4,621 109 2,782 3,983
Rail customer benefits Increased operating surplus
269 3,438 9,887 269 4,479 15,457 147 9,183 13,402
Improved service
…existing customers
2,880 8,001 8,001 2,880 8,001 8,001 2,880 8,001 8,001
…new customers
97 1,235 3,551 97 1,609 5,552 53 3,299 4,814
Wider economic benefits
3 111 320 3 145 500 2 297 433
Total 3,656 16,859 53,005 3,656 18,619 62,421 3,518 26,608 58,923 Source: AECOM
3.3.1 Reductions in train delays
This benefit captures the reduced delay to trains as a result of reduced train congestion in Botany Yard and operational efficiencies from establishment of train staging capacity at Enfield. The relevant measure of benefits for container traffic through Port Botany is the reduction in train hours, as train hours are the main driver of operating costs and improvements in service reliability.3
3 This is a different situation to coal movements through the Port of Newcastle, where shipping demurrage costs are determined by tonne hours of delay.

AECOMPort Botany Rail Line Upgrade Benefit-Cost Analysis of Stage 2 Works - Final Report
K:\60049399_Pt_Botany_Rail\8. Issued docs\8.1 Reports\Benefit-Cost Analysis_23March2010.doc Revision B - 23 March 2010 9
Table 3.4: Calculation of train delay reductions
Constant mode share Increased mode share Terminal-driven Value in 2016 a/ $1,031,000 $1,031,000 $1,031,000 Parameters (i) $300 per hour of train delay
(ii) Average train dwell time reduced to 5 hours (currently 5.6 hours) compared to 6.2 hours in the Base Case
Source ARTC Project Proposal Report Port Botany Rail Upgrade Stage 1 (March 2008) accompanying spreadsheet
Formula (Average train dwell time per train in Base Case - Average train dwell time per train in Upgrade Case) x No. of trains in Base Case x Delay cost per hour
Source: AECOM
Note: a/ From Table 3.3
3.3.2 Network control cost savings
This benefit captures cost savings due to the replacement of the current labour-intensive practices with centralised control of the Botany Line and MFN from ARTC’s Junee Control Centre. More effective train and signal control will contribute to improved rail operational efficiency.
Table 3.5: Calculation of network control cost savings
Constant mode share Increased mode share Terminal-driven Value in 2016 a/ $2,015,000 $2,015,000 $2,015,000 Parameters (i) Annual labour cost (including overheads) of $130,000 per staff member
(ii) No. of staff required reduced from 18 in Base Case (6 at Enfield Signal Box, 6 at Sydenham Signal Box, 6 at Botany Yard) to 5.5 in Upgrade Case
Source ARTC Project Proposal Report Port Botany Rail Upgrade Stage 1 (March 2008) accompanying spreadsheet
Formula (No. of staff required in Base Case – No. of staff required in Upgrade Case) x Annual labour cost
Source: AECOM
Note: a/ From Table 3.3
3.3.3 Reduced maintenance costs
This benefit captures major periodic maintenance (MPM) costs in Botany Yard which would be avoided in the Upgrade Case but which would be undertaken in the Base Case (Stage 1), together with the costs of signalling replacement which would be required in about 15 years in the Base Case (Stage 2).4
The former is based on 50% of project cost being for replacement infrastructure and a saving of one-third when trackworks are undertaken as one job rather than spread out over a number of years as they would be in the Base Case. The latter is calculated by dividing the network control project cost by three in each of the last three years of the appraisal period.
4 Existing signalling was installed in the early 1990s and is about half-way through its expected 30-year life.
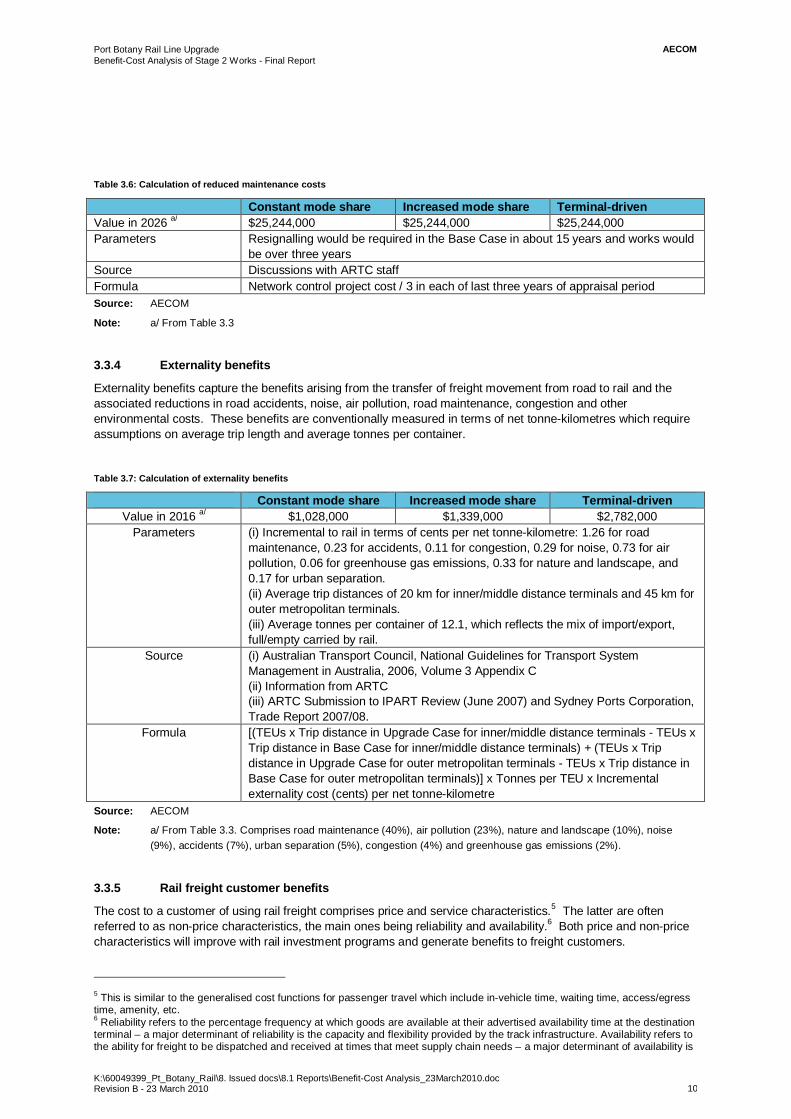
AECOMPort Botany Rail Line Upgrade Benefit-Cost Analysis of Stage 2 Works - Final Report
K:\60049399_Pt_Botany_Rail\8. Issued docs\8.1 Reports\Benefit-Cost Analysis_23March2010.doc Revision B - 23 March 2010 10
Table 3.6: Calculation of reduced maintenance costs
Constant mode share Increased mode share Terminal-driven Value in 2026 a/ $25,244,000 $25,244,000 $25,244,000 Parameters Resignalling would be required in the Base Case in about 15 years and works would
be over three years Source Discussions with ARTC staff Formula Network control project cost / 3 in each of last three years of appraisal period Source: AECOM
Note: a/ From Table 3.3
3.3.4 Externality benefits
Externality benefits capture the benefits arising from the transfer of freight movement from road to rail and the associated reductions in road accidents, noise, air pollution, road maintenance, congestion and other environmental costs. These benefits are conventionally measured in terms of net tonne-kilometres which require assumptions on average trip length and average tonnes per container.
Table 3.7: Calculation of externality benefits
Constant mode share Increased mode share Terminal-driven Value in 2016 a/ $1,028,000 $1,339,000 $2,782,000
Parameters (i) Incremental to rail in terms of cents per net tonne-kilometre: 1.26 for road maintenance, 0.23 for accidents, 0.11 for congestion, 0.29 for noise, 0.73 for air pollution, 0.06 for greenhouse gas emissions, 0.33 for nature and landscape, and 0.17 for urban separation. (ii) Average trip distances of 20 km for inner/middle distance terminals and 45 km for outer metropolitan terminals. (iii) Average tonnes per container of 12.1, which reflects the mix of import/export, full/empty carried by rail.
Source (i) Australian Transport Council, National Guidelines for Transport System Management in Australia, 2006, Volume 3 Appendix C (ii) Information from ARTC (iii) ARTC Submission to IPART Review (June 2007) and Sydney Ports Corporation, Trade Report 2007/08.
Formula [(TEUs x Trip distance in Upgrade Case for inner/middle distance terminals - TEUs x Trip distance in Base Case for inner/middle distance terminals) + (TEUs x Trip distance in Upgrade Case for outer metropolitan terminals - TEUs x Trip distance in Base Case for outer metropolitan terminals)] x Tonnes per TEU x Incremental externality cost (cents) per net tonne-kilometre
Source: AECOM
Note: a/ From Table 3.3. Comprises road maintenance (40%), air pollution (23%), nature and landscape (10%), noise (9%), accidents (7%), urban separation (5%), congestion (4%) and greenhouse gas emissions (2%).
3.3.5 Rail freight customer benefits
The cost to a customer of using rail freight comprises price and service characteristics.5 The latter are often referred to as non-price characteristics, the main ones being reliability and availability.6 Both price and non-price characteristics will improve with rail investment programs and generate benefits to freight customers.
5 This is similar to the generalised cost functions for passenger travel which include in-vehicle time, waiting time, access/egress time, amenity, etc. 6 Reliability refers to the percentage frequency at which goods are available at their advertised availability time at the destination terminal – a major determinant of reliability is the capacity and flexibility provided by the track infrastructure. Availability refers to the ability for freight to be dispatched and received at times that meet supply chain needs – a major determinant of availability is
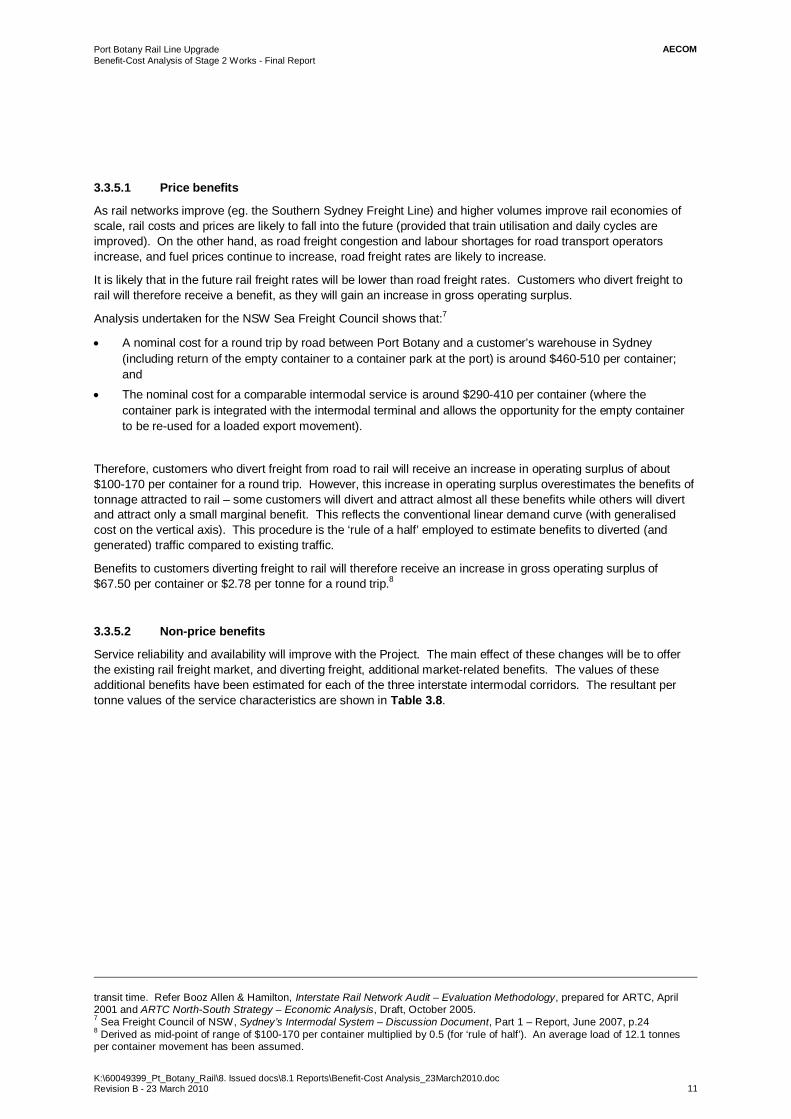
AECOMPort Botany Rail Line Upgrade Benefit-Cost Analysis of Stage 2 Works - Final Report
K:\60049399_Pt_Botany_Rail\8. Issued docs\8.1 Reports\Benefit-Cost Analysis_23March2010.doc Revision B - 23 March 2010 11
3.3.5.1 Price benefits
As rail networks improve (eg. the Southern Sydney Freight Line) and higher volumes improve rail economies of scale, rail costs and prices are likely to fall into the future (provided that train utilisation and daily cycles are improved). On the other hand, as road freight congestion and labour shortages for road transport operators increase, and fuel prices continue to increase, road freight rates are likely to increase.
It is likely that in the future rail freight rates will be lower than road freight rates. Customers who divert freight to rail will therefore receive a benefit, as they will gain an increase in gross operating surplus.
Analysis undertaken for the NSW Sea Freight Council shows that:7
A nominal cost for a round trip by road between Port Botany and a customer’s warehouse in Sydney (including return of the empty container to a container park at the port) is around $460-510 per container; and
The nominal cost for a comparable intermodal service is around $290-410 per container (where the container park is integrated with the intermodal terminal and allows the opportunity for the empty container to be re-used for a loaded export movement).
Therefore, customers who divert freight from road to rail will receive an increase in operating surplus of about $100-170 per container for a round trip. However, this increase in operating surplus overestimates the benefits of tonnage attracted to rail – some customers will divert and attract almost all these benefits while others will divert and attract only a small marginal benefit. This reflects the conventional linear demand curve (with generalised cost on the vertical axis). This procedure is the ‘rule of a half’ employed to estimate benefits to diverted (and generated) traffic compared to existing traffic.
Benefits to customers diverting freight to rail will therefore receive an increase in gross operating surplus of $67.50 per container or $2.78 per tonne for a round trip.8
3.3.5.2 Non-price benefits
Service reliability and availability will improve with the Project. The main effect of these changes will be to offer the existing rail freight market, and diverting freight, additional market-related benefits. The values of these additional benefits have been estimated for each of the three interstate intermodal corridors. The resultant per tonne values of the service characteristics are shown in Table 3.8.
transit time. Refer Booz Allen & Hamilton, Interstate Rail Network Audit – Evaluation Methodology, prepared for ARTC, April 2001 and ARTC North-South Strategy – Economic Analysis, Draft, October 2005. 7 Sea Freight Council of NSW, Sydney’s Intermodal System – Discussion Document, Part 1 – Report, June 2007, p.24 8 Derived as mid-point of range of $100-170 per container multiplied by 0.5 (for ‘rule of half’). An average load of 12.1 tonnes per container movement has been assumed.
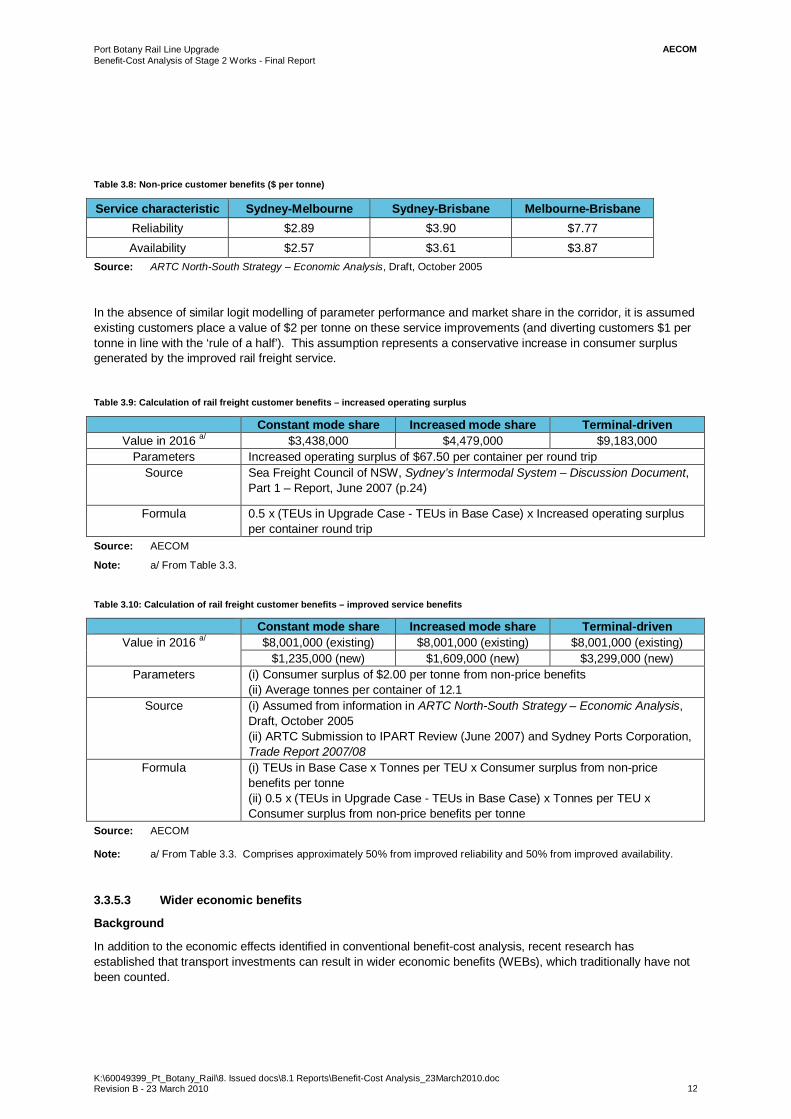
AECOMPort Botany Rail Line Upgrade Benefit-Cost Analysis of Stage 2 Works - Final Report
K:\60049399_Pt_Botany_Rail\8. Issued docs\8.1 Reports\Benefit-Cost Analysis_23March2010.doc Revision B - 23 March 2010 12
Table 3.8: Non-price customer benefits ($ per tonne)
Service characteristic Sydney-Melbourne Sydney-Brisbane Melbourne-Brisbane Reliability $2.89 $3.90 $7.77 Availability $2.57 $3.61 $3.87
Source: ARTC North-South Strategy – Economic Analysis, Draft, October 2005
In the absence of similar logit modelling of parameter performance and market share in the corridor, it is assumed existing customers place a value of $2 per tonne on these service improvements (and diverting customers $1 per tonne in line with the ‘rule of a half’). This assumption represents a conservative increase in consumer surplus generated by the improved rail freight service.
Table 3.9: Calculation of rail freight customer benefits – increased operating surplus
Constant mode share Increased mode share Terminal-driven Value in 2016 a/ $3,438,000 $4,479,000 $9,183,000
Parameters Increased operating surplus of $67.50 per container per round trip Source Sea Freight Council of NSW, Sydney’s Intermodal System – Discussion Document,
Part 1 – Report, June 2007 (p.24)
Formula 0.5 x (TEUs in Upgrade Case - TEUs in Base Case) x Increased operating surplus per container round trip
Source: AECOM
Note: a/ From Table 3.3.
Table 3.10: Calculation of rail freight customer benefits – improved service benefits
Constant mode share Increased mode share Terminal-driven Value in 2016 a/ $8,001,000 (existing) $8,001,000 (existing) $8,001,000 (existing)
$1,235,000 (new) $1,609,000 (new) $3,299,000 (new) Parameters (i) Consumer surplus of $2.00 per tonne from non-price benefits
(ii) Average tonnes per container of 12.1 Source (i) Assumed from information in ARTC North-South Strategy – Economic Analysis,
Draft, October 2005 (ii) ARTC Submission to IPART Review (June 2007) and Sydney Ports Corporation, Trade Report 2007/08
Formula (i) TEUs in Base Case x Tonnes per TEU x Consumer surplus from non-price benefits per tonne (ii) 0.5 x (TEUs in Upgrade Case - TEUs in Base Case) x Tonnes per TEU x Consumer surplus from non-price benefits per tonne
Source: AECOM
Note: a/ From Table 3.3. Comprises approximately 50% from improved reliability and 50% from improved availability.
3.3.5.3 Wider economic benefits
Background
In addition to the economic effects identified in conventional benefit-cost analysis, recent research has established that transport investments can result in wider economic benefits (WEBs), which traditionally have not been counted.
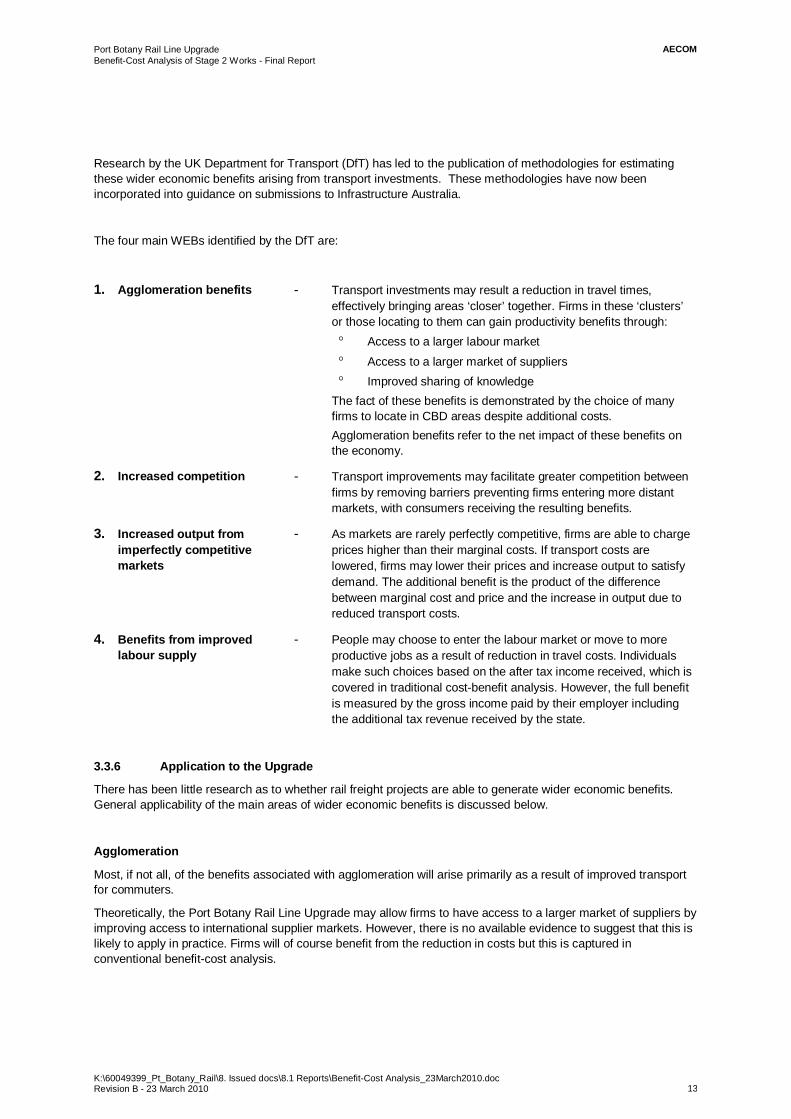
AECOMPort Botany Rail Line Upgrade Benefit-Cost Analysis of Stage 2 Works - Final Report
K:\60049399_Pt_Botany_Rail\8. Issued docs\8.1 Reports\Benefit-Cost Analysis_23March2010.doc Revision B - 23 March 2010 13
Research by the UK Department for Transport (DfT) has led to the publication of methodologies for estimating these wider economic benefits arising from transport investments. These methodologies have now been incorporated into guidance on submissions to Infrastructure Australia.
The four main WEBs identified by the DfT are:
1. Agglomeration benefits - Transport investments may result a reduction in travel times, effectively bringing areas ‘closer’ together. Firms in these ‘clusters’ or those locating to them can gain productivity benefits through:
Access to a larger labour market Access to a larger market of suppliers Improved sharing of knowledge
The fact of these benefits is demonstrated by the choice of many firms to locate in CBD areas despite additional costs. Agglomeration benefits refer to the net impact of these benefits on the economy.
2. Increased competition - Transport improvements may facilitate greater competition between firms by removing barriers preventing firms entering more distant markets, with consumers receiving the resulting benefits.
3. Increased output from imperfectly competitive markets
- As markets are rarely perfectly competitive, firms are able to charge prices higher than their marginal costs. If transport costs are lowered, firms may lower their prices and increase output to satisfy demand. The additional benefit is the product of the difference between marginal cost and price and the increase in output due to reduced transport costs.
4. Benefits from improved labour supply
- People may choose to enter the labour market or move to more productive jobs as a result of reduction in travel costs. Individuals make such choices based on the after tax income received, which is covered in traditional cost-benefit analysis. However, the full benefit is measured by the gross income paid by their employer including the additional tax revenue received by the state.
3.3.6 Application to the Upgrade
There has been little research as to whether rail freight projects are able to generate wider economic benefits. General applicability of the main areas of wider economic benefits is discussed below.
Agglomeration
Most, if not all, of the benefits associated with agglomeration will arise primarily as a result of improved transport for commuters.
Theoretically, the Port Botany Rail Line Upgrade may allow firms to have access to a larger market of suppliers by improving access to international supplier markets. However, there is no available evidence to suggest that this is likely to apply in practice. Firms will of course benefit from the reduction in costs but this is captured in conventional benefit-cost analysis.
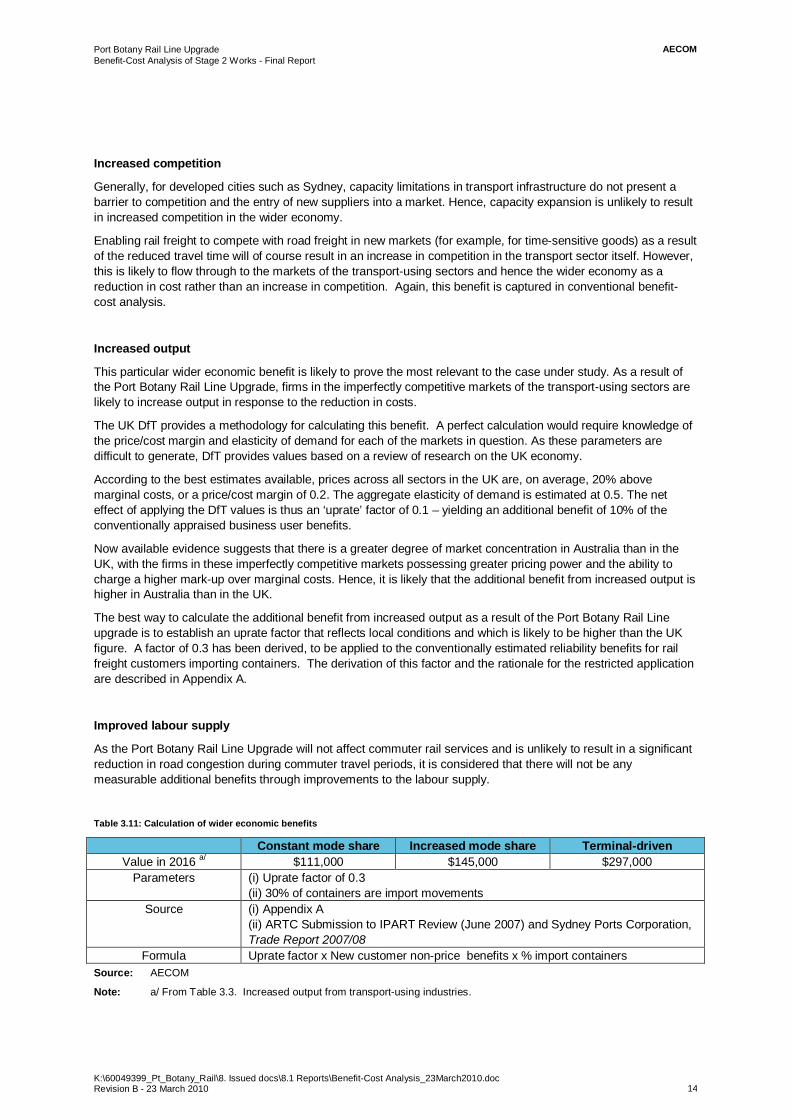
AECOMPort Botany Rail Line Upgrade Benefit-Cost Analysis of Stage 2 Works - Final Report
K:\60049399_Pt_Botany_Rail\8. Issued docs\8.1 Reports\Benefit-Cost Analysis_23March2010.doc Revision B - 23 March 2010 14
Increased competition
Generally, for developed cities such as Sydney, capacity limitations in transport infrastructure do not present a barrier to competition and the entry of new suppliers into a market. Hence, capacity expansion is unlikely to result in increased competition in the wider economy.
Enabling rail freight to compete with road freight in new markets (for example, for time-sensitive goods) as a result of the reduced travel time will of course result in an increase in competition in the transport sector itself. However, this is likely to flow through to the markets of the transport-using sectors and hence the wider economy as a reduction in cost rather than an increase in competition. Again, this benefit is captured in conventional benefit-cost analysis.
Increased output
This particular wider economic benefit is likely to prove the most relevant to the case under study. As a result of the Port Botany Rail Line Upgrade, firms in the imperfectly competitive markets of the transport-using sectors are likely to increase output in response to the reduction in costs.
The UK DfT provides a methodology for calculating this benefit. A perfect calculation would require knowledge of the price/cost margin and elasticity of demand for each of the markets in question. As these parameters are difficult to generate, DfT provides values based on a review of research on the UK economy.
According to the best estimates available, prices across all sectors in the UK are, on average, 20% above marginal costs, or a price/cost margin of 0.2. The aggregate elasticity of demand is estimated at 0.5. The net effect of applying the DfT values is thus an ‘uprate’ factor of 0.1 – yielding an additional benefit of 10% of the conventionally appraised business user benefits.
Now available evidence suggests that there is a greater degree of market concentration in Australia than in the UK, with the firms in these imperfectly competitive markets possessing greater pricing power and the ability to charge a higher mark-up over marginal costs. Hence, it is likely that the additional benefit from increased output is higher in Australia than in the UK.
The best way to calculate the additional benefit from increased output as a result of the Port Botany Rail Line upgrade is to establish an uprate factor that reflects local conditions and which is likely to be higher than the UK figure. A factor of 0.3 has been derived, to be applied to the conventionally estimated reliability benefits for rail freight customers importing containers. The derivation of this factor and the rationale for the restricted application are described in Appendix A.
Improved labour supply
As the Port Botany Rail Line Upgrade will not affect commuter rail services and is unlikely to result in a significant reduction in road congestion during commuter travel periods, it is considered that there will not be any measurable additional benefits through improvements to the labour supply.
Table 3.11: Calculation of wider economic benefits
Constant mode share Increased mode share Terminal-driven Value in 2016 a/ $111,000 $145,000 $297,000
Parameters (i) Uprate factor of 0.3 (ii) 30% of containers are import movements
Source (i) Appendix A (ii) ARTC Submission to IPART Review (June 2007) and Sydney Ports Corporation, Trade Report 2007/08
Formula Uprate factor x New customer non-price benefits x % import containers Source: AECOM
Note: a/ From Table 3.3. Increased output from transport-using industries.
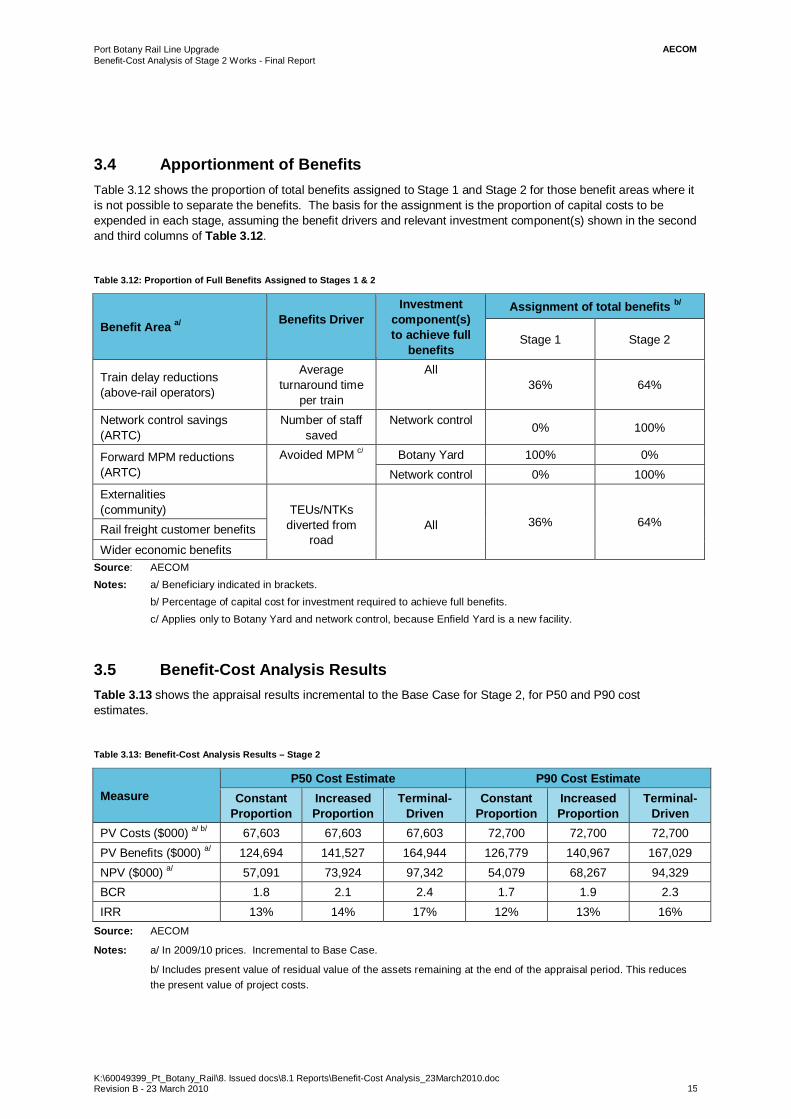
AECOMPort Botany Rail Line Upgrade Benefit-Cost Analysis of Stage 2 Works - Final Report
K:\60049399_Pt_Botany_Rail\8. Issued docs\8.1 Reports\Benefit-Cost Analysis_23March2010.doc Revision B - 23 March 2010 15
3.4 Apportionment of Benefits Table 3.12 shows the proportion of total benefits assigned to Stage 1 and Stage 2 for those benefit areas where it is not possible to separate the benefits. The basis for the assignment is the proportion of capital costs to be expended in each stage, assuming the benefit drivers and relevant investment component(s) shown in the second and third columns of Table 3.12.
Table 3.12: Proportion of Full Benefits Assigned to Stages 1 & 2
Benefit Area a/
Benefits Driver
Investment component(s) to achieve full
benefits
Assignment of total benefits b/
Stage 1 Stage 2
Train delay reductions (above-rail operators)
Average turnaround time
per train
All 36% 64%
Network control savings (ARTC)
Number of staff saved
Network control 0% 100%
Forward MPM reductions (ARTC)
Avoided MPM c/ Botany Yard 100% 0% Network control 0% 100%
Externalities (community)
TEUs/NTKs
diverted from road
All 36% 64% Rail freight customer benefits
Wider economic benefits Source: AECOM Notes: a/ Beneficiary indicated in brackets.
b/ Percentage of capital cost for investment required to achieve full benefits. c/ Applies only to Botany Yard and network control, because Enfield Yard is a new facility.
3.5 Benefit-Cost Analysis Results Table 3.13 shows the appraisal results incremental to the Base Case for Stage 2, for P50 and P90 cost estimates.
Table 3.13: Benefit-Cost Analysis Results – Stage 2
Measure P50 Cost Estimate P90 Cost Estimate
Constant Proportion
Increased Proportion
Terminal-Driven
Constant Proportion
Increased Proportion
Terminal-Driven
PV Costs ($000) a/ b/ 67,603 67,603 67,603 72,700 72,700 72,700 PV Benefits ($000) a/ 124,694 141,527 164,944 126,779 140,967 167,029 NPV ($000) a/ 57,091 73,924 97,342 54,079 68,267 94,329 BCR 1.8 2.1 2.4 1.7 1.9 2.3 IRR 13% 14% 17% 12% 13% 16%
Source: AECOM
Notes: a/ In 2009/10 prices. Incremental to Base Case.
b/ Includes present value of residual value of the assets remaining at the end of the appraisal period. This reduces the present value of project costs.
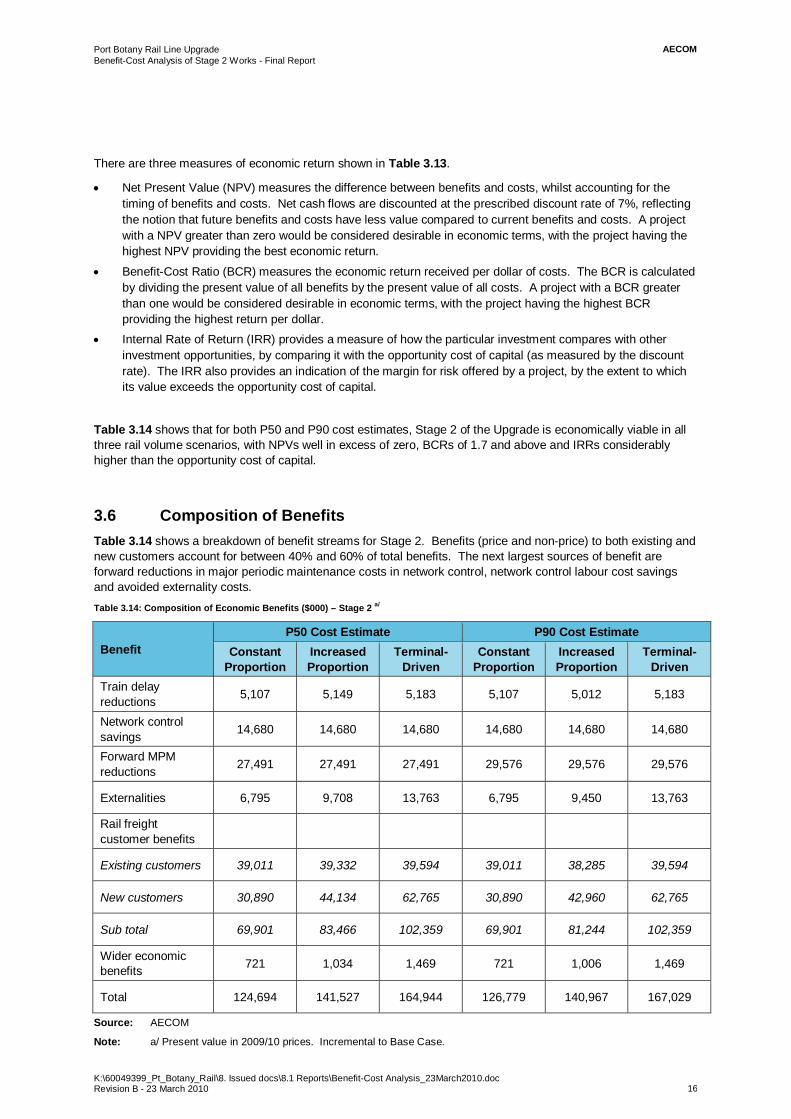
AECOMPort Botany Rail Line Upgrade Benefit-Cost Analysis of Stage 2 Works - Final Report
K:\60049399_Pt_Botany_Rail\8. Issued docs\8.1 Reports\Benefit-Cost Analysis_23March2010.doc Revision B - 23 March 2010 16
There are three measures of economic return shown in Table 3.13.
Net Present Value (NPV) measures the difference between benefits and costs, whilst accounting for the timing of benefits and costs. Net cash flows are discounted at the prescribed discount rate of 7%, reflecting the notion that future benefits and costs have less value compared to current benefits and costs. A project with a NPV greater than zero would be considered desirable in economic terms, with the project having the highest NPV providing the best economic return.
Benefit-Cost Ratio (BCR) measures the economic return received per dollar of costs. The BCR is calculated by dividing the present value of all benefits by the present value of all costs. A project with a BCR greater than one would be considered desirable in economic terms, with the project having the highest BCR providing the highest return per dollar.
Internal Rate of Return (IRR) provides a measure of how the particular investment compares with other investment opportunities, by comparing it with the opportunity cost of capital (as measured by the discount rate). The IRR also provides an indication of the margin for risk offered by a project, by the extent to which its value exceeds the opportunity cost of capital.
Table 3.14 shows that for both P50 and P90 cost estimates, Stage 2 of the Upgrade is economically viable in all three rail volume scenarios, with NPVs well in excess of zero, BCRs of 1.7 and above and IRRs considerably higher than the opportunity cost of capital.
3.6 Composition of Benefits Table 3.14 shows a breakdown of benefit streams for Stage 2. Benefits (price and non-price) to both existing and new customers account for between 40% and 60% of total benefits. The next largest sources of benefit are forward reductions in major periodic maintenance costs in network control, network control labour cost savings and avoided externality costs. Table 3.14: Composition of Economic Benefits ($000) – Stage 2 a/
Benefit P50 Cost Estimate P90 Cost Estimate
Constant Proportion
Increased Proportion
Terminal-Driven
Constant Proportion
Increased Proportion
Terminal-Driven
Train delay reductions 5,107 5,149 5,183 5,107 5,012 5,183
Network control savings 14,680 14,680 14,680 14,680 14,680 14,680
Forward MPM reductions 27,491 27,491 27,491 29,576 29,576 29,576
Externalities 6,795 9,708 13,763 6,795 9,450 13,763
Rail freight customer benefits
Existing customers 39,011 39,332 39,594 39,011 38,285 39,594
New customers 30,890 44,134 62,765 30,890 42,960 62,765
Sub total 69,901 83,466 102,359 69,901 81,244 102,359
Wider economic benefits 721 1,034 1,469 721 1,006 1,469
Total 124,694 141,527 164,944 126,779 140,967 167,029
Source: AECOM
Note: a/ Present value in 2009/10 prices. Incremental to Base Case.
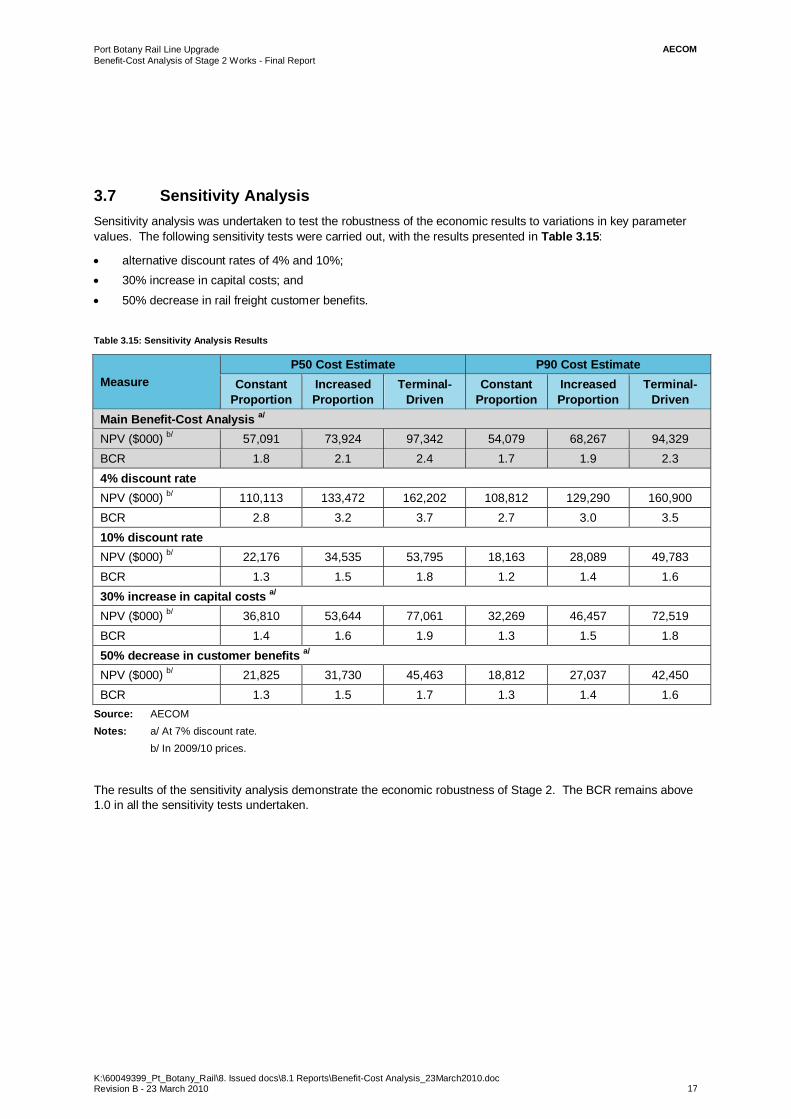
AECOMPort Botany Rail Line Upgrade Benefit-Cost Analysis of Stage 2 Works - Final Report
K:\60049399_Pt_Botany_Rail\8. Issued docs\8.1 Reports\Benefit-Cost Analysis_23March2010.doc Revision B - 23 March 2010 17
3.7 Sensitivity Analysis Sensitivity analysis was undertaken to test the robustness of the economic results to variations in key parameter values. The following sensitivity tests were carried out, with the results presented in Table 3.15:
alternative discount rates of 4% and 10%; 30% increase in capital costs; and 50% decrease in rail freight customer benefits.
Table 3.15: Sensitivity Analysis Results
Measure P50 Cost Estimate P90 Cost Estimate
Constant Proportion
Increased Proportion
Terminal-Driven
Constant Proportion
Increased Proportion
Terminal-Driven
Main Benefit-Cost Analysis a/ NPV ($000) b/ 57,091 73,924 97,342 54,079 68,267 94,329 BCR 1.8 2.1 2.4 1.7 1.9 2.3 4% discount rate NPV ($000) b/ 110,113 133,472 162,202 108,812 129,290 160,900 BCR 2.8 3.2 3.7 2.7 3.0 3.5 10% discount rate NPV ($000) b/ 22,176 34,535 53,795 18,163 28,089 49,783 BCR 1.3 1.5 1.8 1.2 1.4 1.6 30% increase in capital costs a/ NPV ($000) b/ 36,810 53,644 77,061 32,269 46,457 72,519 BCR 1.4 1.6 1.9 1.3 1.5 1.8 50% decrease in customer benefits a/ NPV ($000) b/ 21,825 31,730 45,463 18,812 27,037 42,450 BCR 1.3 1.5 1.7 1.3 1.4 1.6
Source: AECOM Notes: a/ At 7% discount rate.
b/ In 2009/10 prices.
The results of the sensitivity analysis demonstrate the economic robustness of Stage 2. The BCR remains above 1.0 in all the sensitivity tests undertaken.
AECOMPort Botany Rail Line Upgrade Benefit-Cost Analysis of Stage 2 Works - Final Report
K:\60049399_Pt_Botany_Rail\8. Issued docs\8.1 Reports\Benefit-Cost Analysis_23March2010.doc Revision B - 23 March 2010 A
Appendix A
Application of Wider Economic Benefits
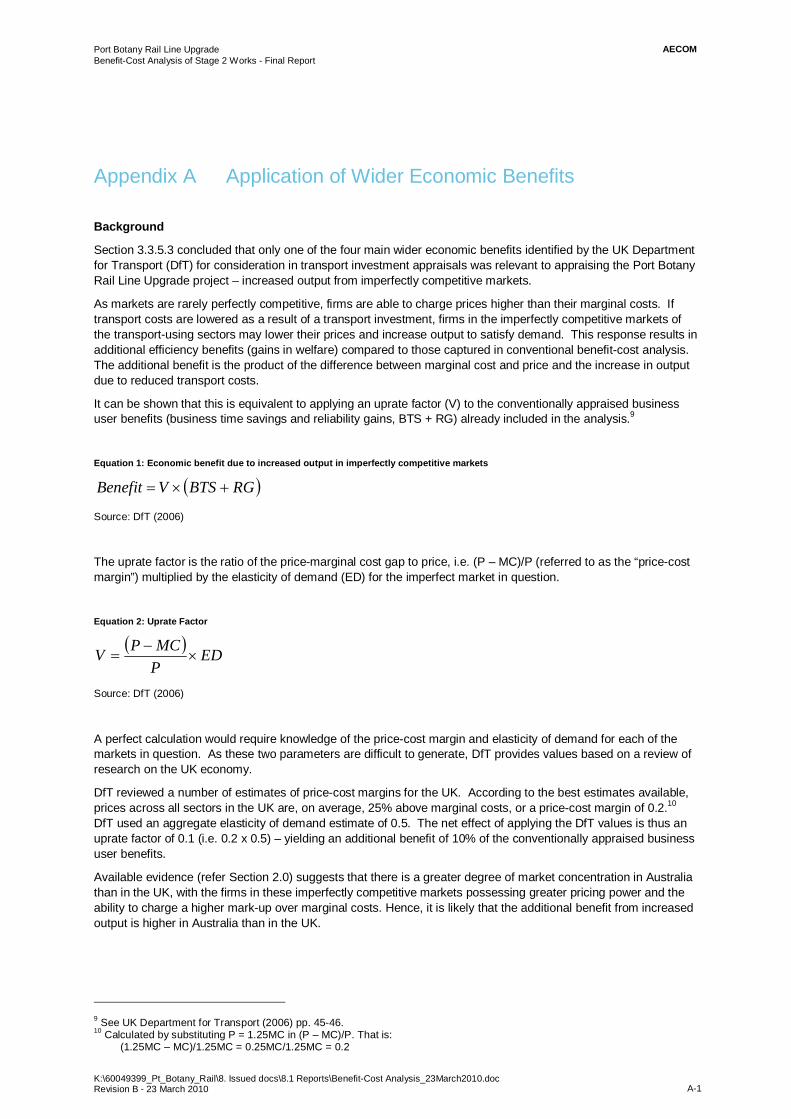
AECOMPort Botany Rail Line Upgrade Benefit-Cost Analysis of Stage 2 Works - Final Report
K:\60049399_Pt_Botany_Rail\8. Issued docs\8.1 Reports\Benefit-Cost Analysis_23March2010.doc Revision B - 23 March 2010 A-1
Appendix A Application of Wider Economic Benefits
Background
Section 3.3.5.3 concluded that only one of the four main wider economic benefits identified by the UK Department for Transport (DfT) for consideration in transport investment appraisals was relevant to appraising the Port Botany Rail Line Upgrade project – increased output from imperfectly competitive markets.
As markets are rarely perfectly competitive, firms are able to charge prices higher than their marginal costs. If transport costs are lowered as a result of a transport investment, firms in the imperfectly competitive markets of the transport-using sectors may lower their prices and increase output to satisfy demand. This response results in additional efficiency benefits (gains in welfare) compared to those captured in conventional benefit-cost analysis. The additional benefit is the product of the difference between marginal cost and price and the increase in output due to reduced transport costs.
It can be shown that this is equivalent to applying an uprate factor (V) to the conventionally appraised business user benefits (business time savings and reliability gains, BTS + RG) already included in the analysis.9
Equation 1: Economic benefit due to increased output in imperfectly competitive markets
RGBTSVBenefit
Source: DfT (2006)
The uprate factor is the ratio of the price-marginal cost gap to price, i.e. (P – MC)/P (referred to as the “price-cost margin”) multiplied by the elasticity of demand (ED) for the imperfect market in question.
Equation 2: Uprate Factor
EDPMCPV
Source: DfT (2006)
A perfect calculation would require knowledge of the price-cost margin and elasticity of demand for each of the markets in question. As these two parameters are difficult to generate, DfT provides values based on a review of research on the UK economy.
DfT reviewed a number of estimates of price-cost margins for the UK. According to the best estimates available, prices across all sectors in the UK are, on average, 25% above marginal costs, or a price-cost margin of 0.2.10 DfT used an aggregate elasticity of demand estimate of 0.5. The net effect of applying the DfT values is thus an uprate factor of 0.1 (i.e. 0.2 x 0.5) – yielding an additional benefit of 10% of the conventionally appraised business user benefits.
Available evidence (refer Section 2.0) suggests that there is a greater degree of market concentration in Australia than in the UK, with the firms in these imperfectly competitive markets possessing greater pricing power and the ability to charge a higher mark-up over marginal costs. Hence, it is likely that the additional benefit from increased output is higher in Australia than in the UK.
9 See UK Department for Transport (2006) pp. 45-46. 10 Calculated by substituting P = 1.25MC in (P – MC)/P. That is:
(1.25MC – MC)/1.25MC = 0.25MC/1.25MC = 0.2
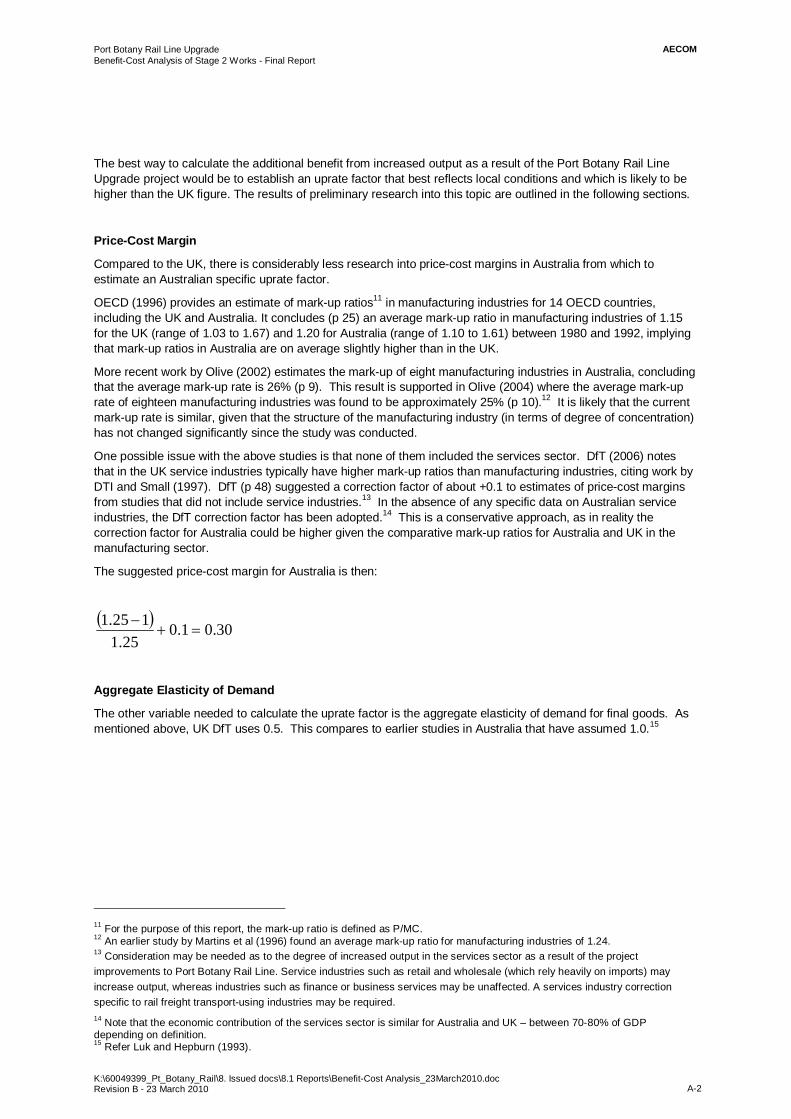
AECOMPort Botany Rail Line Upgrade Benefit-Cost Analysis of Stage 2 Works - Final Report
K:\60049399_Pt_Botany_Rail\8. Issued docs\8.1 Reports\Benefit-Cost Analysis_23March2010.doc Revision B - 23 March 2010 A-2
The best way to calculate the additional benefit from increased output as a result of the Port Botany Rail Line Upgrade project would be to establish an uprate factor that best reflects local conditions and which is likely to be higher than the UK figure. The results of preliminary research into this topic are outlined in the following sections.
Price-Cost Margin
Compared to the UK, there is considerably less research into price-cost margins in Australia from which to estimate an Australian specific uprate factor.
OECD (1996) provides an estimate of mark-up ratios11 in manufacturing industries for 14 OECD countries, including the UK and Australia. It concludes (p 25) an average mark-up ratio in manufacturing industries of 1.15 for the UK (range of 1.03 to 1.67) and 1.20 for Australia (range of 1.10 to 1.61) between 1980 and 1992, implying that mark-up ratios in Australia are on average slightly higher than in the UK.
More recent work by Olive (2002) estimates the mark-up of eight manufacturing industries in Australia, concluding that the average mark-up rate is 26% (p 9). This result is supported in Olive (2004) where the average mark-up rate of eighteen manufacturing industries was found to be approximately 25% (p 10).12 It is likely that the current mark-up rate is similar, given that the structure of the manufacturing industry (in terms of degree of concentration) has not changed significantly since the study was conducted.
One possible issue with the above studies is that none of them included the services sector. DfT (2006) notes that in the UK service industries typically have higher mark-up ratios than manufacturing industries, citing work by DTI and Small (1997). DfT (p 48) suggested a correction factor of about +0.1 to estimates of price-cost margins from studies that did not include service industries.13 In the absence of any specific data on Australian service industries, the DfT correction factor has been adopted.14 This is a conservative approach, as in reality the correction factor for Australia could be higher given the comparative mark-up ratios for Australia and UK in the manufacturing sector.
The suggested price-cost margin for Australia is then:
30.01.025.1
125.1
Aggregate Elasticity of Demand
The other variable needed to calculate the uprate factor is the aggregate elasticity of demand for final goods. As mentioned above, UK DfT uses 0.5. This compares to earlier studies in Australia that have assumed 1.0.15
11 For the purpose of this report, the mark-up ratio is defined as P/MC. 12 An earlier study by Martins et al (1996) found an average mark-up ratio for manufacturing industries of 1.24. 13 Consideration may be needed as to the degree of increased output in the services sector as a result of the project improvements to Port Botany Rail Line. Service industries such as retail and wholesale (which rely heavily on imports) may increase output, whereas industries such as finance or business services may be unaffected. A services industry correction specific to rail freight transport-using industries may be required. 14 Note that the economic contribution of the services sector is similar for Australia and UK – between 70-80% of GDP depending on definition. 15 Refer Luk and Hepburn (1993).
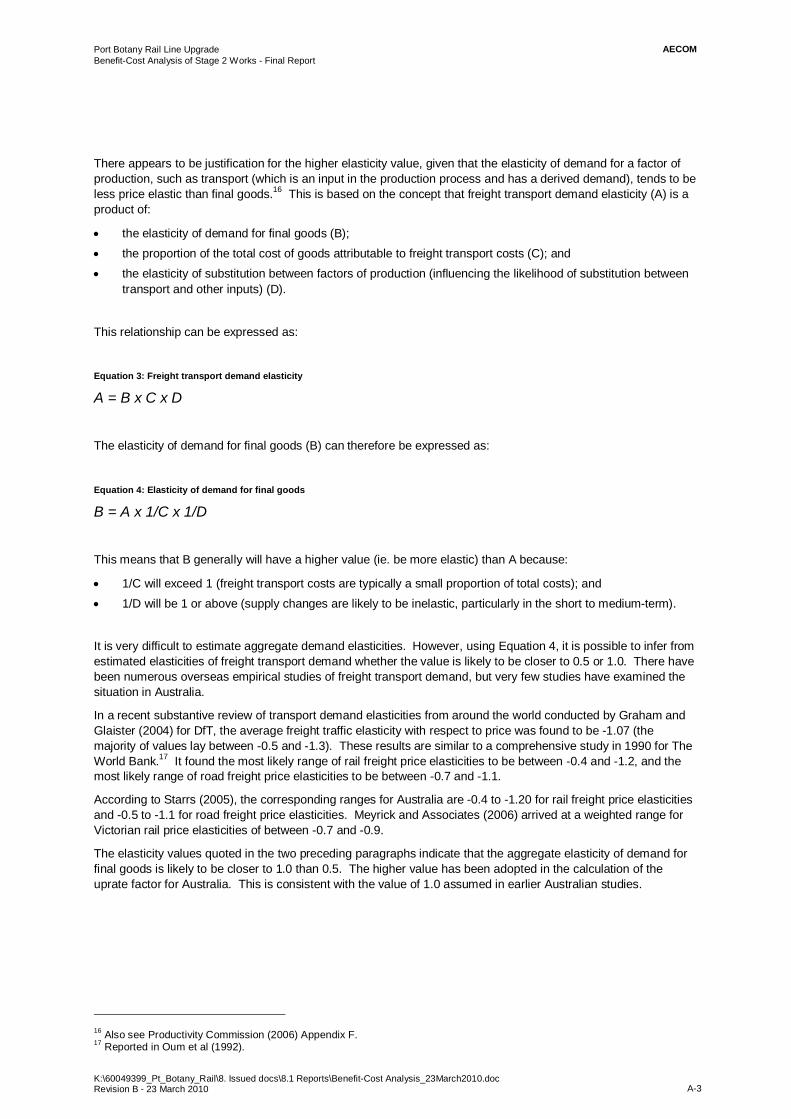
AECOMPort Botany Rail Line Upgrade Benefit-Cost Analysis of Stage 2 Works - Final Report
K:\60049399_Pt_Botany_Rail\8. Issued docs\8.1 Reports\Benefit-Cost Analysis_23March2010.doc Revision B - 23 March 2010 A-3
There appears to be justification for the higher elasticity value, given that the elasticity of demand for a factor of production, such as transport (which is an input in the production process and has a derived demand), tends to be less price elastic than final goods.16 This is based on the concept that freight transport demand elasticity (A) is a product of:
the elasticity of demand for final goods (B); the proportion of the total cost of goods attributable to freight transport costs (C); and the elasticity of substitution between factors of production (influencing the likelihood of substitution between
transport and other inputs) (D).
This relationship can be expressed as:
Equation 3: Freight transport demand elasticity
A = B x C x D
The elasticity of demand for final goods (B) can therefore be expressed as:
Equation 4: Elasticity of demand for final goods
B = A x 1/C x 1/D
This means that B generally will have a higher value (ie. be more elastic) than A because:
1/C will exceed 1 (freight transport costs are typically a small proportion of total costs); and 1/D will be 1 or above (supply changes are likely to be inelastic, particularly in the short to medium-term).
It is very difficult to estimate aggregate demand elasticities. However, using Equation 4, it is possible to infer from estimated elasticities of freight transport demand whether the value is likely to be closer to 0.5 or 1.0. There have been numerous overseas empirical studies of freight transport demand, but very few studies have examined the situation in Australia.
In a recent substantive review of transport demand elasticities from around the world conducted by Graham and Glaister (2004) for DfT, the average freight traffic elasticity with respect to price was found to be -1.07 (the majority of values lay between -0.5 and -1.3). These results are similar to a comprehensive study in 1990 for The World Bank.17 It found the most likely range of rail freight price elasticities to be between -0.4 and -1.2, and the most likely range of road freight price elasticities to be between -0.7 and -1.1.
According to Starrs (2005), the corresponding ranges for Australia are -0.4 to -1.20 for rail freight price elasticities and -0.5 to -1.1 for road freight price elasticities. Meyrick and Associates (2006) arrived at a weighted range for Victorian rail price elasticities of between -0.7 and -0.9.
The elasticity values quoted in the two preceding paragraphs indicate that the aggregate elasticity of demand for final goods is likely to be closer to 1.0 than 0.5. The higher value has been adopted in the calculation of the uprate factor for Australia. This is consistent with the value of 1.0 assumed in earlier Australian studies.
16 Also see Productivity Commission (2006) Appendix F. 17 Reported in Oum et al (1992).
AECOMPort Botany Rail Line Upgrade Benefit-Cost Analysis of Stage 2 Works - Final Report
K:\60049399_Pt_Botany_Rail\8. Issued docs\8.1 Reports\Benefit-Cost Analysis_23March2010.doc Revision B - 23 March 2010 A-4
Conclusion
Considering the results of the research outlined in Section 2.0 and Section 3.0, and using Equation 2, an appropriate uprate factor to adopt for Australian conditions is 0.3 (i.e. a price-cost margin of 0.3 multiplied by an aggregate elasticity of demand of 1.0).
In the case of the Port Botany Rail Line Upgrade project, the uprate factor would be applied to the conventionally estimated reliability benefits for rail freight customers importing containers. The gains in welfare which are not captured by the conventional appraisal accrue to the buyers of the products of the transport-using industries (these industries receive the direct transport benefits not the welfare benefits associated with the increased production18). Therefore, the gains in welfare associated with export containers would not fall to domestic buyers and should not be included in the economic appraisal. In any case, with export products where Australia is largely a price-taker, a change in marginal cost may not be passed through a change in price.
The preliminary benefit-cost analysis of the Port Botany Rail Line Upgrade project estimates wider economic benefits from increased competition in the range of $1.2 million to $2.9 million (in present value terms for total Project), depending on the rail volume scenario. This is around 1% of the estimated value of total economic benefits.19
References
Graham, D. and Glaister, S. (2004), “Road Traffic Demand Elasticity Estimates: A Review”, Transport Reviews, Vol 24 No 3, May, pp. 261-274.
Luk, J. and Hepburn, S. (1993), “New Review of Australian Travel Demand Elasticities”, Australian Road Research Report ARR 249.
Martins, O., Joaquim, Scarpetta, S. and Pilat, D. (1996), “Mark-Up Pricing, Market Structure and the Business Cycle”, OECD Economic Studies, 27, pp 71–105.
Meyrick and Associates (2006) Rail Freight Price Elasticities, prepared for Essential Services Commission (Victoria), January.
OECD (1996), "Mark-up ratios in manufacturing industries - estimates for 14 OECD countries", Economics Department Working Paper No 162.
Olive, M. (2002), “Markup, returns to scale, the business cycle and openness: evidence from Australian manufacturing”, Department of Economics, Macquarie University, 2002.
Olive, M. (2004), “Markup, returns to scale, the business cycle and openness: evidence from Australian manufacturing”, Economic Papers (Economic Society of Australia), Vol 23 No 1, March 2004.
Oum, T., Waters, W. and Yong, J. (1992) “Concepts of price elasticities of transport demand and recent empirical estimates: an interpretative survey”, Journal of Transport Economics and Policy, Vol 26, pp. 139-154
Productivity Commission (2006), Road and Rail Freight Infrastructure Pricing, Inquiry Report No. 41, 22 December.
Small, I. (1997), “The cyclicality of mark-ups and profit margins: Some evidence for manufacturing and services”, Bank of England.
Starrs, M. (2005) Effect of Truck Charges on Rail, Information Paper prepared for National Transport Commission, May
UK Department for Transport (2006), Transport, Wider Economic Benefits and Impacts on GDP, June.
18 Because price exceeds marginal cost where there is imperfect competition in a market, if improved transport induces transport-using firms to increase production, the gain in welfare is the value placed on the additional production less the cost of producing it. Consumers (households, firms, governments) are willing to pay more for additional products (as indicated by the product price) than it would cost to produce them. This is clearly not efficient as increased output would be valued higher by society than the cost of providing it. 19 These estimates assume immediate supply response once the project is completed. In practice, there may be a phasing of these benefits due to time lags in transport-using firms adjusting supply.
Project Proposal Report (PPR)
Port Botany Rail Line Upgrade Stage 2 – Delivery Phase
G4 Project Gantt Chart
Consolidated design and construction program
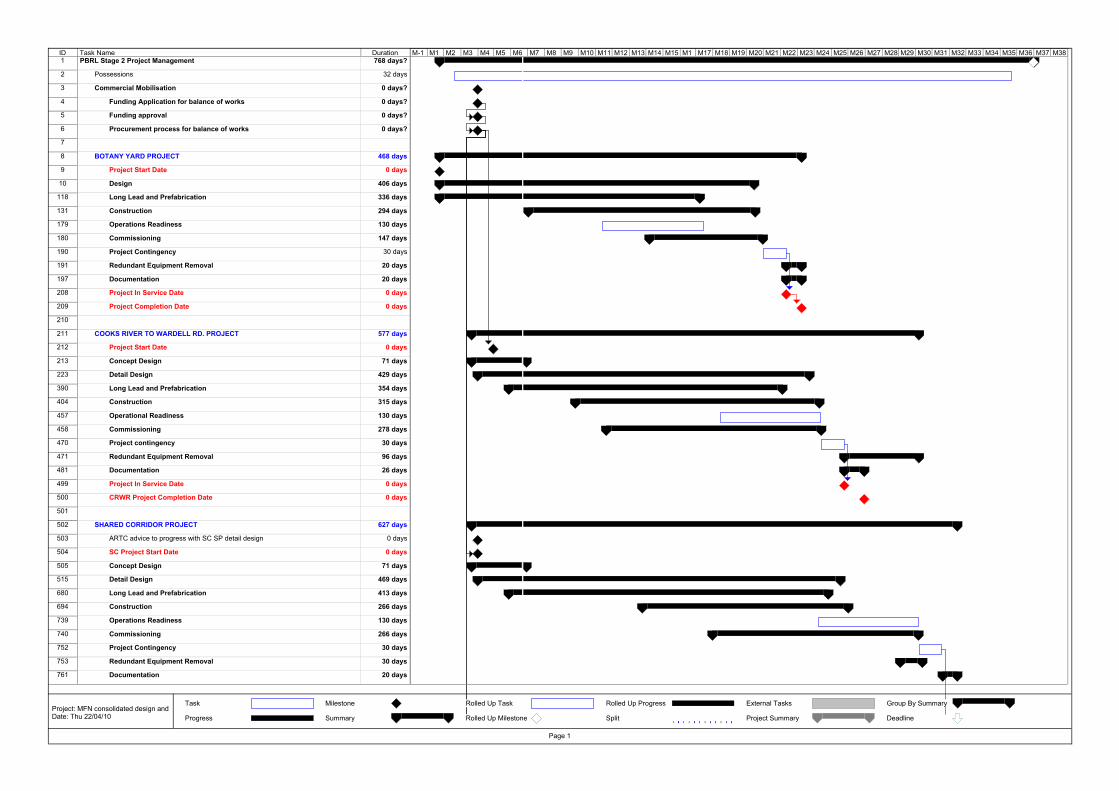
ID Task Name Duration1 PBRL Stage 2 Project Management 768 days?
2 Possessions 32 days
3 Commercial Mobilisation 0 days?
4 Funding Application for balance of works 0 days?
5 Funding approval 0 days?
6 Procurement process for balance of works 0 days?
7
8 BOTANY YARD PROJECT 468 days
9 Project Start Date 0 days
10 Design 406 days
118 Long Lead and Prefabrication 336 days
131 Construction 294 days
179 Operations Readiness 130 days
180 Commissioning 147 days
190 Project Contingency 30 days
191 Redundant Equipment Removal 20 days
197 Documentation 20 days
208 Project In Service Date 0 days
209 Project Completion Date 0 days
210
211 COOKS RIVER TO WARDELL RD. PROJECT 577 days
212 Project Start Date 0 days
213 Concept Design 71 days
223 Detail Design 429 days
390 Long Lead and Prefabrication 354 days
404 Construction 315 days
457 Operational Readiness 130 days
458 Commissioning 278 days
470 Project contingency 30 days
471 Redundant Equipment Removal 96 days
481 Documentation 26 days
499 Project In Service Date 0 days
500 CRWR Project Completion Date 0 days
501
502 SHARED CORRIDOR PROJECT 627 days
503 ARTC advice to progress with SC SP detail design 0 days
504 SC Project Start Date 0 days
505 Concept Design 71 days
515 Detail Design 469 days
680 Long Lead and Prefabrication 413 days
694 Construction 266 days
739 Operations Readiness 130 days
740 Commissioning 266 days
752 Project Contingency 30 days
753 Redundant Equipment Removal 30 days
761 Documentation 20 days
M-1 M1 M2 M3 M4 M5 M6 M7 M8 M9 M10 M11 M12 M13 M14 M15 M1 M17 M18 M19 M20 M21 M22 M23 M24 M25 M26 M27 M28 M29 M30 M31 M32 M33 M34 M35 M36 M37 M38
Task
Progress
Milestone
Summary
Rolled Up Task
Rolled Up Milestone
Rolled Up Progress
Split
External Tasks
Project Summary
Group By Summary
Deadline
Page 1
Project: MFN consolidated design andDate: Thu 22/04/10
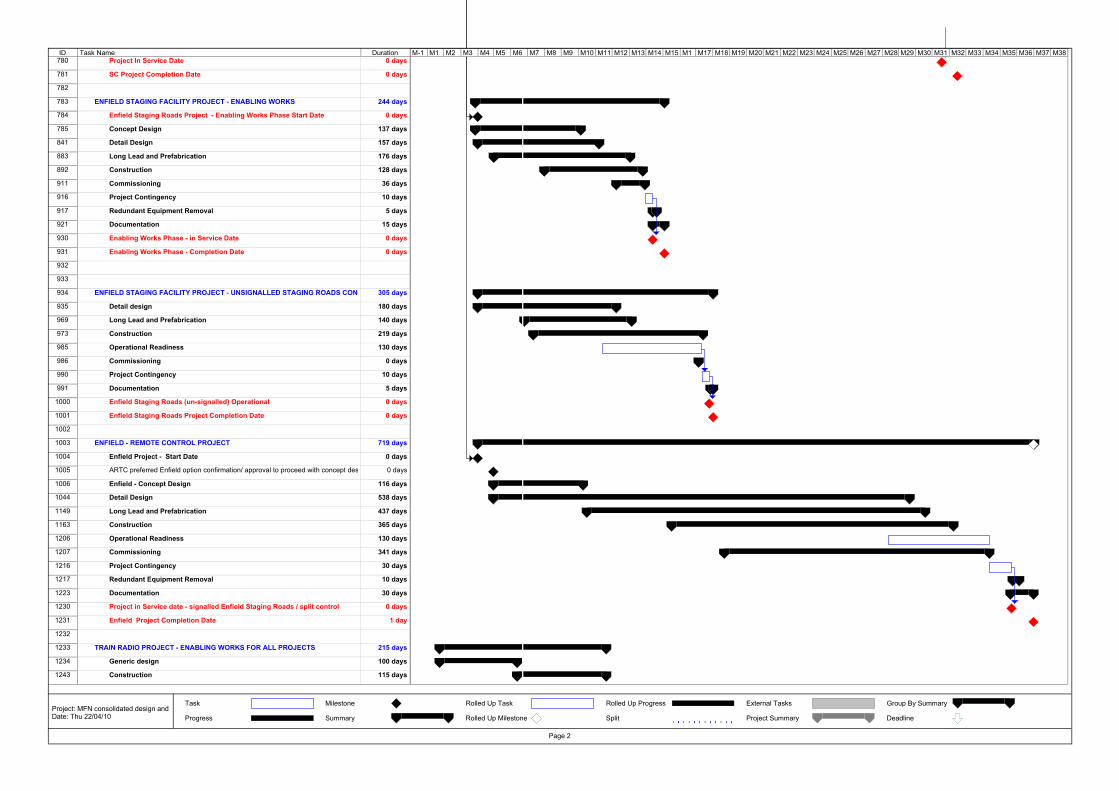
ID Task Name Duration780 Project In Service Date 0 days
781 SC Project Completion Date 0 days
782
783 ENFIELD STAGING FACILITY PROJECT - ENABLING WORKS 244 days
784 Enfield Staging Roads Project - Enabling Works Phase Start Date 0 days
785 Concept Design 137 days
841 Detail Design 157 days
883 Long Lead and Prefabrication 176 days
892 Construction 128 days
911 Commissioning 36 days
916 Project Contingency 10 days
917 Redundant Equipment Removal 5 days
921 Documentation 15 days
930 Enabling Works Phase - in Service Date 0 days
931 Enabling Works Phase - Completion Date 0 days
932
933
934 ENFIELD STAGING FACILITY PROJECT - UNSIGNALLED STAGING ROADS CONSTRUCTION305 days
935 Detail design 180 days
969 Long Lead and Prefabrication 140 days
973 Construction 219 days
985 Operational Readiness 130 days
986 Commissioning 0 days
990 Project Contingency 10 days
991 Documentation 5 days
1000 Enfield Staging Roads (un-signalled) Operational 0 days
1001 Enfield Staging Roads Project Completion Date 0 days
1002
1003 ENFIELD - REMOTE CONTROL PROJECT 719 days
1004 Enfield Project - Start Date 0 days
1005 ARTC preferred Enfield option confirmation/ approval to proceed with concept design 0 days
1006 Enfield - Concept Design 116 days
1044 Detail Design 538 days
1149 Long Lead and Prefabrication 437 days
1163 Construction 365 days
1206 Operational Readiness 130 days
1207 Commissioning 341 days
1216 Project Contingency 30 days
1217 Redundant Equipment Removal 10 days
1223 Documentation 30 days
1230 Project in Service date - signalled Enfield Staging Roads / split control 0 days
1231 Enfield Project Completion Date 1 day
1232
1233 TRAIN RADIO PROJECT - ENABLING WORKS FOR ALL PROJECTS 215 days
1234 Generic design 100 days
1243 Construction 115 days
M-1 M1 M2 M3 M4 M5 M6 M7 M8 M9 M10 M11 M12 M13 M14 M15 M1 M17 M18 M19 M20 M21 M22 M23 M24 M25 M26 M27 M28 M29 M30 M31 M32 M33 M34 M35 M36 M37 M38
Task
Progress
Milestone
Summary
Rolled Up Task
Rolled Up Milestone
Rolled Up Progress
Split
External Tasks
Project Summary
Group By Summary
Deadline
Page 2
Project: MFN consolidated design andDate: Thu 22/04/10