docursnt4resume lb 208 715 'author kahn, peter t. .±tle e
TRANSCRIPT

DOCURSNT4RESUME
lb 208 715 'HE 014 ;322
'AUTHOR Kahn, Peter T. ,
.±TLE *,, e General College Baccalauteate,Applicatipns,Adiissions and Advising! 19767-1-980. A StatisticalStudy.
, , .
INSTITUTION Minnesota Mays, Minneapolis. General Coil.PUB DATE 81 . .
..
HOTE' 43p.JOURNAL CIT General College,Studies; v16 n2 1980-81
,
EDRS PRICE MF01'PCO241us Postage. .
DESCRIPTORS *Academic Advising; Bachelors Degrees; *College.
Admission; *College- Applicants; Efficiency.;*Graduation; Higher Education; InstitutionalResearch; Longitudinal Studies; *NontraditionalEducation; School Surveys; State Universities; Trend .
Analysis.
IDENTIFIERS *University, of Minnesota
ABSTRACTA study was undertaken in the winter and spring
quarters of 1980, addressing aspects of. the baccalaureateapplication, admission, advising, and graduation processes at theGeneral College of the University of Minnesota, a nontraditionalpostsecondary education program. Amohg the issues addressed werethese: the distribution and trends of baccalaureate applicants in theschools and 'divisions, admission's success ratios, admissions responsetimer'graddhtion rates in°the school and'among division, and advisingflow and advisor load. Data were drawn from three institutionaldatabases: baccalaureate program information file cards, committeeaction lists, and graduation 'lists.'The results, presented innarrative and c4art form in this report, indicate that 32 percentfewer students applied to the collegels baccalaureate programs in thefinal year of the study (1980) than in its initial year (1976), afact,awating further ,study. However, the applicationtigure for ,thefinal year represented an:upswing frowthe previous year. Admidsionssuccess rates were inversely ,related to' application rates, kivithproportionately more applicants being admittedtoward the Study'sendlpivisional data generally followed the college-wide trends inthese areas. However, divisional advising loads were not found to`ipe
,
4.equitable, with the science, business,-and math division bearing thegteatest load and the Arts, communication, and philosophy, divisonhaving the snalleSt load. The composite adjusted time taken 14,,the,college to respond to an admisiian application was found to-be sevenweeks for 76 perCent of Cpplicatts, or as high as 85-89 percent insome individuaL years. Asample student record card and notes on datacompilatiovare appended. MSE) . 7
4' 9-
.********************************************************14************* Reproductions supplied by EDRS are the best that can be made *
' . . from the original docuinent. *****,***t***4*********************************************************
. ,
A

isnUniversity of Minnesota eneial colle e
co
LtJ
c.)
Lo
aw
Volume XVI
.4 Number 2
1980-81.
"PERMISSION TO REPRODUCE THIS
MATERIAL HAS BEEN GRANTED BY
TO THE EDUCATIONAL RESOURCES"'INFORMATION CENTER (ERIC)."
GENERAL COLLEGE BACCALAUREATE APPLICATIONS,ADMISSIONS AND ADVISING: 1976-1980
A STATISTICAL STUDY
by Per T. Kahn, J.D.
ABSTRACT
Do fewer students apply to General College'.s four year degree
program? Is the Baccalaureate admissions process a time consuming,
arduous task for an applicant with limited chances for success? How
is the Baccalaureate application/admission/advising/graduation load
distributed among the teaching divisions of the College? 'To assess
these and other Concerns related to General College's four year de-
gree program,.a study was undertaken over Winter and Spring Quarters,
1980, addressing various. aspects of the Baccalaureate application/
admission/advising/graduation process. ...This report presents the
findings of that research. The data contained in this dotument, byfacilitating increased accuracy of faculty" perceptions of Baccalau-reate Programs, will provide a foundation of fact to promote produc-
tive; well-informed decision-making regarding.the need for, and shape
of, prospective changes in the policy andeptructure of the four year
degree program in General, College. ''
Editorial Board: General Collegeesearch Group
r
.'w131/4-.
4
4
/

.;.
: ,
AKNOWLEDGEMENT.,'
A
The author of this report owes, an immeasurable debt to various people.without whose genrouftefforts this undertaking could not have been completed.Not to acknowledge their contributions would be selfish oversight. I am deeply
grateful toTtidy Harris and Sandi Kelzenberg for their assistance in datagatherj.ng. Reseatch Assistant George. Henay.and Assistant Professor Tom Brothen'provided invaluable help and guidance in statIstical.analysis and editing. I
am especially appreciative of the^,sontructive, thoughful criticism and sugges-tions' for improvement as'well as.iiipport and encouragement I received duringthe project from ProXessor Evelyn.U.'Hansen and Associate Dean Tom Buckley.Sincerest thanks to these and other colleagues.
4 1'1 tl
,
"M

INTRODUCTION
Since its beginning, a primary focus of general College has been to "seek
new ways to'give effective attention to the educational needsRif bypassed and C-
..non-traditional student populatione;"I Relative to this experimental mission
of the College, its faculty-believed that d'portion'of the General College
student body should have a broader opportunity to conEinuelitudies beyond, the
Associate in Arts,degree level. Knowing that General College students have
unique educational needs around which suitable individualized"four-year degree
programs could be built, the faculty decided that yucational alternatives not..
airailable through conventional, four -year degree paths should be provided.
Accordingly, General College,launched its ExtendedPrograWs pilot projdct in .
1970 to filthis educational gap.2 The Extended Programs expeilment graau-
ally Oolved into the Present day General College Bacoelaureate Program offer-
ing both Bachelor.of Getieral Studies and Bachelor of Applied Studies degrees.-
Since its inception in 1970, the General College four-year degree program
hadundergone a series of philosophical and organizational changes. Various
growing pains and problems developed and were.reviewed. Suggestions for
stru tural, procedural and Policy change yere proposed and evaluated. These.
even culminated in the psuance of a "policy statements' defining goal's;
phil sophy and stricture of individualized four -year degree programs, the Gen-
eras College Baccalaureate Guidelines, adopted and'imglement0 by the General .
Col ge faculty during the 1976 aeademic year. In conjunction with this'major
re rganization, a-different approaCh to the operational dynamicsjof Baccalau.7'
reate Programs - admissions, advising, graduation - was' adopte4A year later.
The re-designed plan'for administering Baecalaureate Programs was in- Ps
tended to alleviate and correct problems inherent in earlier operatiohal
methods, e.g., the need to make available information and planning help for
potential. candidates; the need for expeditious review and processing of
gram applications; the need to improve the quality of individual programs;
and the need to involve a broad cross -"section of the faculty in baccalaureate. a
programs., . .
,
/. . . , . -.
From the time General College began to offer four-year degree-Opportuni-
ties, the College faculty expressed a broad range of concerns,over the pro.-
gram: Are Baccalaureate Programs within the "missionyof General Coklege% .
Do faculty receive sufficient support and reward for /nvolvement in.the pro-
gram? Are operating guidelines which define program design and admission0 ,
requirements too restrictive or too loose?4 A comprehensive inquiry was '
undertakeq by Profesior Evelyn U Hansen during, the 1978-79 academic.)4ar to,.4
IMoen, General College Studies, Vol. XV, #i.
2lbid.
.141oen, et al., General College-Baccalaureate Program' Orientation
Advising - Administrative Structures, May 18, 1977. .
4Hansen, General College Studies, Vol. kv; #3.
11.
C.
f
4
: 1
.
. ,

-2-
address these and other related issues. In researching, analyzing,aud report-
ing on seven years of Baccalaureate operations data, Professor Hansen focused
upon "student and faculty attitudes toward Baccalaureate degrees, oharacteris-
tics of four-year degree candidates, the value of degrees for employment, pr
motion and admission to graduate or professional study,, the impact of indivi -
dualized programs upon faculty adviiors, and other matters.u.5
/
PURPOSE OF STUDY
f
/ .Professor Hansen's'study provided stimulus for further inquiry into the
accuracy of faculty berceptioni of, and attitudes toward, Baccalaureate Pro-
grams: How time. consuming is the process of reviewing and actiiig upon Bacca-
laureate applications; Does General College lose a large numher,.,of students as
fewer apply to Baccalaureate programs; How efficient and organi00'is the Bac-
calaureate admissions procedure; How is the Baccalaureate ProgrOe applica-
tion/admission service load distributed among divisions and part aipating Col-
lege faculty? To assess these and other.concerns related to BaC0s.laureate
Programs operations, research was undertaken during Winter and Spring Quarters,
1980,-focusing upon the nature and scope of various aspects of BadOlaureate
Programs. Data were collected for the years 1976-77, the firsyelr of pro-
gram operations under the "1976 Guidelines," through the end of Sp4ng Quarter,
1980,9ddressing three major areas: total number of Baccalaureate tudents
(admittances /non - admittances/graduates) processed; time taken to reew and
process Baccalureate applications; and Baccalaureate Advising Servie Load.at,
The results of that-study are reported in the following pages.
1
Before discussing the structure and results of the study, an inir'1
ductory
caution should be emphasized. The Make-up and focus of the study areYimited.
Care must be taken, therefore, not to carry interpietatiOn'of the data,Or '
.beyond the original focus and purpose of the research. Minor errors ml t
have,occurred in retrieving, tracking and tabulating the data. tThe cot pen-
siveness, accuracy and availability of therecords frOm whia the info on
was drawn were, at times, slAhtly deficient. However, thitesults serve to
indicate areas of strength and weakness within the'General-College four-year
degree prograM. The data compiled constitute a reliable working base'from
which informed decisians concerning investment of resources, time,'and effo ,,
can be effectively made? thereby increasing program efficiency, and faciiitar-J0,1_
ting the implimentation of constructive program change. Through the study,, 1,i,,
areas of needed improvement become evident along with areas of effective func.
tioning that require little or n change. The study results proVide a clear- 2,s
er, more factually accurate picture of'Baccalauteate Programs than-the College
has had to date. The data will help to prevent ill-informed or couterproduc- .
Live Nines from occurring. r
le-
e t . '',
.,...
'4 . r
General College Studies, Vol. XV, 4 /8 1 k, 197849.
411
we*.
V
-
{,

r.
1 -
a
-3-
'MEiTOD
. I
A. - Data Collection\
- ,
.g
The exclusive information 'source utilized fox this study UasBaccalauraT
ate,Programs'Oeprational records maintained by the Baccalaureate cler2cal
staff singe the inception of Extended ,Programs in197Q. From these)records,
three data bases were used to retrieve the repotted findings: Baccalaureate
`,Programs Information tile Cards; Baccalaureate Programs Committep.Action
.Lists; and Baccalaureate Programs. Graduation.Lists.. These data bases cam- ,
prise.the foundation of the-BaCcalaureate Programs record system:. NO previous
tabulation or statistical analysis had been,canducted usingthessame data for
.similar purposes.
B. Explanation of Data Bases
The .BacOalaureate Information Card, File is thel:lrimarydata base of die, .
Baccalaureate record keeping systei. .Dating from I:971, the File consists 'of sk,
individual cards containing informationon each applicant to Baccalanreate-
Programs. (See Appendi20A for a sample File Card.) Over a decade of operaz:
tions, with adainistrative, policy,,procedural and personnel changes. the
nature and completenegs of therdata,reported in the cards.has'maried. For,ttle
purposes of the immedigte research, the information drawn from.the card in,eluded: #
1. Date an admissions application was received by the Baccalaureate .
s
Programs Office, - .
.
"i. Divisional` admissions review committeeto which an aPplication .
was referred for review (for applications receId afteigummer*
Session, 1977) .. , ,
3..- Date a letter of acceptance or rejection was sent to an ahlicant.
*. by the Baccalauteate Office f
,
4. Date of graduation5. Title of an applicant's program , ..
.'e
6,J Name of 'assigned advisor of an applicant.
. .
- ,The second data source used in the study was the_BaccalaureatatCommittee
Action List. Dating back to Winter Quarter, 1975, this chronological'log
notea.thedSte official action (admit, admit with.contingencies, hold forClarificittionv or non-admit) was, taken by admission committees (either all
College for pre-Fall, 1977 applications, or divisional for Fall, 1977',. and
thereafter) for each application submitted. The list also contains; in most
caseave advisor assignments fbr program admittees.
The. third informatiodsource emiloied to Compile the reported data was 0
thelBaccalaureate'GradiationList. A chronological record dating back to
Sprtng Quarter, 1912, the-Greduation List notes'when-a'studeni graduated from. -
.Bac&algureate Programs; as wells .as oft idial advisor assigtmerit.
,
C. Data ConipilatiOn.Proiedure-
.
e -ik. .
ilFor the teader's convenience,a detailed discussion of, how the \reported
data were compiled is included in a separate section, AppendIx.B. The bal-
.- ,_, . ....
i 0
* t.-
5"$

r4
t
0
-4- -
ance of thisreport discusges the study findings.
°
SURVEY RESULTS AND ANALYSIS
A. Baccalaureate Applications Data
1. Explanation of Data Presentation Format', .
Table One and Figures One through Seven focus on totalnpplic Ionssubmitted'to General C011ege Baccalaureate Programs from July 10 197 ,
,through June 30, 1980. The figure "total applications" was arrived at by-combining "admits" with "non-admits" (or "holds," in those unusual caseswhere a formal admissions decision was-not made due to technical, proca-'
dural or similar problems). Total applications was computed on an all -
College basis for each year of the study. The yearly College totals were
broken down on an admit/non-admit basis and translated ihto yearly'per-
centage rates. A composite all-College picture, covering the studl-years
sPan,.was presented for the same statistical_categories:
/
'I*
.
College applications dAta, were also analyzed from a divisional per-
spective covering the same statistical categories. For each General 61-.
legeteaching division which fatally reviewed and admitted Baccalaureate
, applications (Social and Behavioral Sciences - S.B.S.; Arts, Communica-
tion & Philosophy = A.C.P.; and Science, Business E./Math - S.B.M.), total
:applications received within a division was noted. These divisions were
the focus of the report since they handle the balk (approximately 95%)
of the CollegeBaccalaureate applications/admission/advisidg load. Only
a bare handful of applications are proceksed_.or housed elsewhere. Yearly-
divisional totals,were translated into admits/non-admitb and cprrespond-
ing'percentage ratei. THe divisional share of the College yearly Bacca-lahreate application load.(admisSion, non-admission and total) was also
calculated. Finally, a composite four-year.divisionaI picture was re-
ported covering the same statistical categories.'
2. . Discussion of All-College Data °
a. Annual Tota Applications-Processed =-.
8---,
.,..° \.
Now many 4tudent4-appty to BaccaiauXeate PkogniO724 in any git-4
en yeah?
Overt a pertiod of dime, low doe4 thi4 6igune'chdnge? Do Sewer 4tudent4'
4eek admi44ion now than once ad?, -;'' 4
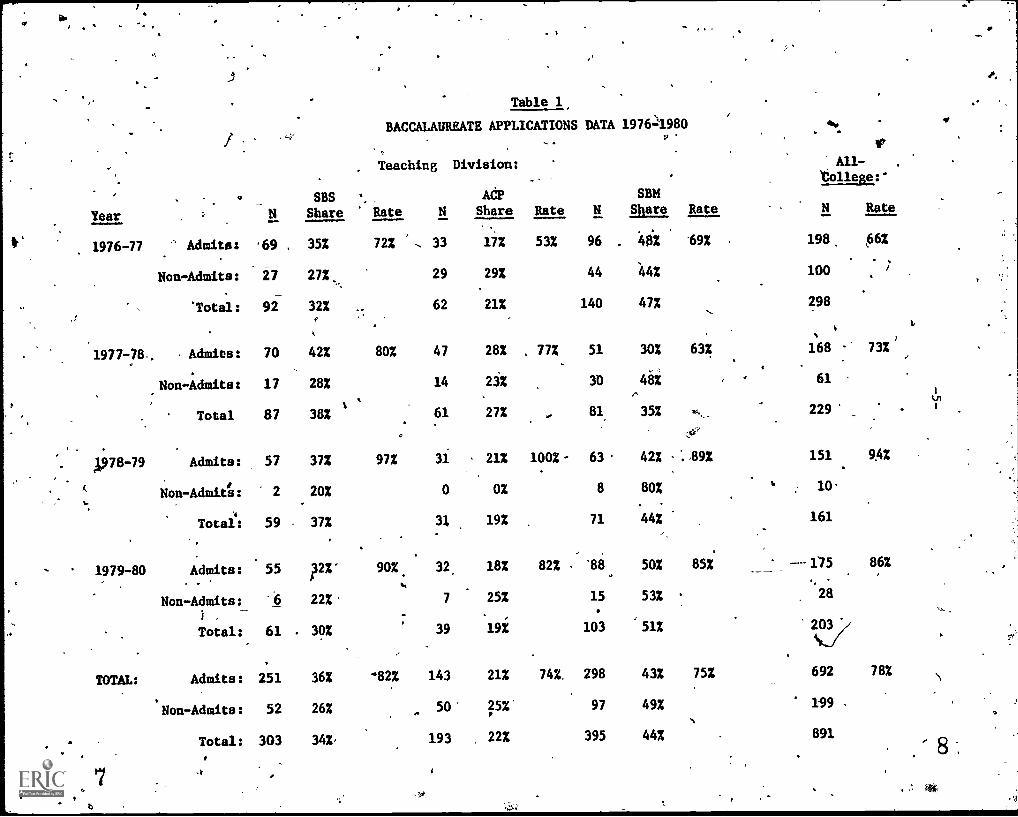
Table One and Figure One reveal that over the'years of the study,
32% fewer students sought admissionto Baccalaureate Programs during the
last year of the study than in the first year. .Total yearly appliCationg
dropped to 203 for 1979-80 from a peak of 298 in 1976-70.. From that
first year peak, yearly applications decreased 46% to 16f in 1978-79.
Over 416 last year of the study, a 26% increase in yearly applications
occurred, closing at 203 for .the study.
la .
Year
k 1976-77
1977-78..
. A978-79
-
"..
1979-80
.
TOTAL:
1
Tab_ le 1,
BACCALAUREATE APPLICATIONS DATA 197621980
N
-r
SBS
Share
Teaching
Rate N
Division:
ACPShare Rate N
p'
SBMShare Rate
All-baleger
N Rate
Admits:
Non-Admits:
'69
27
352
27%
722 33
29
17%
292
53% 96
44
462
44%
69% 198,
100
`Total: 92 322o
62 21% 140 47% 298
Admits: 70 42% 80% 47 28% . 77% 51 30% 632.
168 732
Non-Admits: 17 28% 14 23% 30 482 61
t. ,
Total 87 382 61 272 , 81 352 .._ 229
.1'
Admits:
Non - Admits:
57
2
372
20%
97% 31
0
212
0%
100% 63
8
42%
80%
',SU 151
10
9A%
Total': 59 - 37% 31 19% 71 44% 161
Admits: 55 32Z' 90%. 32. 18% 822 88 50% 85% ---175 86%
I 4,.
4,
Non - Admits: 6 22% 7 25% 15 53% ' 28
1.
Total: 61 . 30% 39 19% 103 51% 203
Admits: 251 36% -82% 143 212 74%. 798 43% 75% 692 78%
Non-Admits: 52 26% 50 25% 97 49% 199
Total: 303 34% 193 22% 395 44% 891
Ui
8
21

1
.9
300
2511
14 200O.
F
150.
D
100 -S
mei
50
4
-.
Figure 1 `-)
BACCALAUREATE ,APPLICATIONSPROCESSED BY GENERAL COLLEGE
1920;1980T
a
1976-77 1977-78 1978-79 1979-80
WARS
9

4
--7-
Pbssibie explanations for the overall 32% decline in students seeking
four-year degrees from General College from 106-71 through 1979-80 are
may and varied. Some people contend that the emergende and growth of coin-
opting, non-traditional individually designed four -year degree Programs,
from bah.within)the University and from without, provide educational al-
ternatives which were once unavailable to students Seeking entry to General
*.
College Baccalatreate Programs-and, therefore, necessarily deplete the Bac-
calaureate applicant pool. Others maintain that the decline in four-yeardegree applications is attributable to the substantive and procedural, proms
gram changes implimented in Baccalaureate programs during 1976-77. It is
theorized that students, tearing the new-admissions policies and practice's
too cumbersome and threatening, seek four-year degrees through more "accom-
Amdating" programs elsewhere. Related to the changes'brought aboht by the
adoption of the "1976 Guidelines" is the possible explana4on that as thequality of applicationa improved,*the casual or more marginal student was
dis raged from applyihg. Still another reason offered for the appliCa-.
ti cline-is ,the increased cost of education coupled with the general
ieco omic downturn. For the financially marginal student, college has been
priced out as a realistic choice.
b. 'Annual Admissions/Non-admissions .
....
How. many atudento aucceed in that elgont to gain admisaion to Bacca-
Zaakelat Ptogtam4? Whati.6 the admi.64iono auccesa taao oli appacants?
flow do the =the& and petcentage oli.admi44ion4 change oven time? Ate,
Ovek 4.tudint.4, athet in ntmbet o/ petcentage, dmitted to Geheica Ca&Zegela lioux-yeat degree ptogum now than once were? ..
.
4 Ia
g 4.
,
Data contained in Table One -ilso-shows.trends in annual College pro- '
'stem admits and nonrtdmits. Since program admissions plus non-admissionsgenerally equals.total applicatons processed, patterns of change in the --
latter should be reflected in the former. Figure Iwo reveals this fact.
From' respective peak positions &ring the first year of study (admits 198
and non-admits 100), these statistics declined through the end of the
,study, admits by-12% and non-admits by 72%. .The sharpest period of admis-
sion decrease for the College occurred through 19.78-79,admits dropping
23% to a 15W of 151. At thesame time, non-admits were bottoming-out, down 4
902 to a survey low of 10. Thereafter, over the last year of the study,
program admits increased le% to,175 and nonradmits 180% to 28. Thus, al-
.though fewer students were being Admitted to Baccalaureate Programs at the
close of the study (a12% reduction), an even greater reduction (72%) had
occurred in the number of applicants'who were not successful in their ef- .
. ,fort to gain admission. The markydlysteeper rate of'decline in programnon-admits over program admits meant that, proportionately, more students
were being idmitpd to pursue -four-year degree plans in the College over
the'span of the study, although in terms of actual numbers, admissigna had.. declined. The College admission rate (See Figure 5)-for, the,years studied
corroborates this conclUsion. At the same time that tdtal,applications
submitted for review was down 32%., the rati of success for, each applicant
(all-College admission rate) had increased 3 %. Rising from a low of 66% :-
in 1976-77, the College yearly admission rat rose 42% to a survey peak of-
94% in 1978 -79, followed by air 8% dItline to 86% over the last year of the
10


I
:
study. Spanning the whole study, the composite College admission rate
was /8%. ;, .
.
, ..
Changes in the number 'and rate of admission/non-admissions reveal a
. distinct pattern: changes in non-admiASions follow changes in admissions.
As the number and rate of admissions declines, so does non-adMissions. The .
reverse also holds true. This fact would seem to indicate an-informal pro-
gram overload control mechanism in'operation. Nevertheless, the reported
4ata clearly prove.a dramatic increase'in the proportion of applicants who
1gain-admission ,
to Baccalaureate Programs. This fact clearly demonstrates.
the benefit studehts are deriving from G.C. 1-894, Planning a_ Baccalaureate
Program. This one credit....S-N galled 'course offers structured assistance to
students in preparing a formal application to the College Baccalaureate .
Programs. Students are helped with choosing program themes, relatiti appro-
priate cOursework and writin supporting explanatory documents.
3. Discussion of ikviiional DataA
a. Total Annual Applications Processed
9Him many appeicatton4 do the neapective admitting diviziona puceu
annuatty? Do Acme divizionds hand& move apptication4 than ot.hpusf To
what extent? Now do .these 4tittaticA change overt. time?
Further undetetanding of trends and patterns of change in Baccalaure-
. .ate Programs can be gained by reviewing applications data from a divisional
perspective. 'Retorted in Table One and Figure Three, the statistics show
that total yearly applications dropped for each division from study year
peaks in 1976-71 to a law Point in 1978-79, with a moderate rise thereafter Aos
over thelast year of the study.'
A.C.P. and S.B.S, experienced nearly identical patterns of change in
this area For the whole study, these two divisions had approximately the
same overall rate of decline in total yearly applicationi (A.C.P. down 34%
and S.B.S. down 37%),. From peak positions (A.C.P. 62, S.B.S. 92) in 1976-
77, both divisions teceived steadily fewer applications through 1978-79,
A.C.P. declinidg 50% to 31 and S.B.S. diopping 36% to 59 applications.
Thereafter, these divisions had a gradual increase in the number of appli-
cations processed over the last-year-.of the study, A.C.P. rising 36% to 39
and S.B.S. increasing 32-to 61 applications. .
The third program admitting division in the College, S.B.M., underwent
significantly-different and more dramatic changes in total annual applica-
tions processed. S.B.M.' was handling 26% fewer applications at the close
of the study than atits beginning. From a peak of 140 in 1976-71, S.B.M.
had a marked 49% decline in total annualoapplications:throdgh 1978-79,
reaching a survey low of 71.- Thispronounced drop in number of applica-
tions abruptly reversed dUriDig 1979-80, as S.B.M. experienced a 45% in-
crease (to 103) in applications received.
Concluding the discussion of total yearly applications processed by
each division, Table One and Figure Three show that, during each of the
years for which data were gatherer}, A.C.P. processed the fewest'number of
O

L
,
t.
. 120
N0.
*
0F 90
AP
P
L.I 60.
'C :41
A
Alp
N 30S
e
FIGURE 3
TOTAL BACCALAUREATE APPLICATIONS. PROCESSED BY TEACIILNG DIVISION
. 1916-1980
ct
SBN
SBS
ACP
It
.1976-77 1977-78 1978-7g 1979-80 _
YEAR
134-
-6+
4.
5
-11applications while S.B.M., for three of.the four years, processed the
areatest number.
b. Annual Admissions/Non-admissions.
How many appticants to Baccataduate prpogAanla ate adtnitted by eaeh.
division? Do the divisions admit the 'game amqunt? 'How might .the ansuim
to these questions be dilgetent Otom a non,a0iaziona pempectime? What
atterms oi change in theae aAeaa omit oveA04,pertiod ot5 time?
Another approach to anatyiing the data reported in Table One is pre-sented in Figure 'Pour which 'depicts divisional applications data from ayearly- admissions /non - admissions perspective. For.the:span of the study,
S.B.S. was admitting 20% fewer students at study's close than at'the begin-ning, A.C.P. had an overall 3% decline in'a9hissions and g.B.M. had anoverall 8% drop in its number of ptOgram admittees. -4
From 1977-78 through 1979=80, A.C.P. aid S.B.S. followedcsimilar pat-terns of admission change. Both divisions dropped from admission peaks in1977-78 to fairly stable admission positions oventhe last two years ofthe study (A..P. declined 34% from 47 to 31 and 32, S.B.S. dropped 2O% to
57 and 55 from a peak of 70). Prior to thein common peak'year,S.B.S..experienced dissimilar patterns of change. 'From 1g76-77 to l0778,A.C.P. waS the any division to undergo an admissions, increase, rising 42%from 33 to 47 admittees.' Except for this year, however, A.C.P. had an eee
'sentially stable admissions picture. for the'study years - in the low 30's.II %
S.B.S. admissions data for thesame'period, 1976-77 throUgh 1977-78,is markedly, different. S.B.S. experienced almost no Change for these studyyears with adMission positions of 69 and 70. This pattern of admissionsstability in S.B.S. was repeated over the last two years of the Study with
admissions at57 and 55, respectively.
Admissions data for S.B.M. show an entirely different pattern. As
with A.C.P.,.the years 1976 through 1978 were ones of significant change.Contrary to A.C.Po's sharp increase in number of admissions overtthisperiod, S.B.M. experienced a 47% admissions decline from a peak of 96 in
1976-77 to a low of 5i one year later. Following this percipitous,de-crease, S.B.M. h'ad a complete about-face, admissions rising 72% during the
last two years of the study,. closing at a near first year peak level of 88.
The divisional admissions data contained in Table One and Figure Four
reveal a curious pattern. During years that S.M. and A.C.P. experiencedeither admissions increases or stability, S.B.M. admissions dropped sharply. -
On the other hand, while A.C.P. and S.B.S$ incurred admissions declines orstability, S.B.M. underwent a decided upsWing.in admissions. What forces
t of substantive and procedural adjustment at play to explain these'dishar-monious results is left to conjecture.
Concluding, the analysis of yearly divisional admissions 'd ata, S.B.M.
had the most program admittees for all the study years except 1977-78. On
the other hand, A.C.P. had the feweit number of admits for each of the-
'ears studied.
"tt

100N0.
0
80
S
T
DEN '60TS
40
20
-12-
Figure 4
ANNUAL BACCALAUREATE ADMISSIONS ANDN011-ADMSS/011.1 BY TEACHM DIVISION
1976 -1980
AdmissionsNon-Admissions
I
SE:1
SBS
..0.NS % ...
N. N. ... 4.%.. N.
%. ...1111
zr-°":"'S.
I
1976:17
O
197748. 1978 -79
YEAR )
1.5..
SBM
ACPSBS
1979-80
s*
s
The lick of convergence among the divisibns in yearly admissions data
does not hold true for non-admissions. Figure Four shows that A.C.P.,
S.B.S. and S.B.M. generally shared the same non-admittance pattern. For .
the span of the study, the respective divisions were rejecting significant-ly fewer applicants tt the clOse of the study than at its beginning, A.C.P.having an overall 76%declinean. its non-admits, S.B.S. a 78,% decrease and
notS.B.M. a drop of 66% FromS.B.S. 27 and S.B.M. 44),'rejeCkii6s bottbottomed-out for each division in
: admission peaks,in 1976-77 (A.C.P. 29,
1978-79, after three years of Steady decline (A.C.P. down 100% to 0, S.B.S.
down 92% to 2 and S.B.M. down 82% to 8). Over the.last year of, the study,
however, this three year downturn in program non-admissions reversed it-self. A.C.P. rejections were upto 7,.S.B.S. experienced a non-admissionsincrease to 6, and S.B.M. had a rise in non-admissions to 15.
For each year Studied, S.B.M.-had the highest number of program rejec--
tions. At the same time, however, it had the highest number of admits forthree of the four years studied. During the middle two years of the study,
AtC.2. had the fewest rejections while also having the least number of pro -,'gram admits for each of the study years. During the first and final study ;
years, S.B.S. was rejecting the fewest number of program applicants.
c. Annual Admission Rate o
., . . .
1
What arEe:them.ate6 o6 adta..64ion lion. each divi6ion? How 4imitaA ate
they? 14 it mov. diaLcat (on easy) to be admitted by one division:thananothetl-HOW does annuat divizionae admiss.ion nate change &tom yeat to
yea/0,
.
. Yearly diVisional applications data reported intthis study can alsobe und'er'stood on the basis o`patieKns in rates of admission. Table One
and Figure FiVe demonstrate that the divisions shared fairly similar pat-,: ... terns of admission rate change., . A.
From 1977 -78 through the end of the study, S.B.M. and S.B.S.had al-most identical admission rate patterns of change. Starting with an admis-sion rate of 72% in 1976-77, S.B.S. hid a steady (35%) increase to a peak .
admission rate of 977inN1978-79. Thereafter, the:admission rate for
S.B.S. declined slightly (7 %j to 90% by the end dr the study. I&.1t.M. had
a different admission rate change over the first year of the study, ex-
periencing a drop of 9 % .from 69% to 63%. Fro& this 1927-78 low point, '
the admission rate for S.B.M. jumped 41% to a peak ofk89% in 1978-79,4,01 -
lowed hy-a slight (4%) ,decline to 85% faf the last yelf of the study. For
the'span of the study, S.B.S. had an overall admissioni rate increase of25% and the highest composite, admissions rate (82%) of the three divisions'.The composite rate for S.B.M. was 75% with the division experiencing anoverall admission tate increase of 23% fot the study.
patters of admission rate change experiericed by A.C.P. was more
dttmaiic than the other two divisions. From an admission rate of 53% in
1 1976-77, A.C.P. had the highest increase across the divisions (89%) through
, its pealcof 100% in 1978-79. Thereafter, A.C.P.'s admission rate dropped18 to close at 82% for the study. Covering the study, A.C.P. had the law-
),v,
O
1

100
-r4-
Figure 5
ANNUAL`)/VISIONAL AND COLLEGE BACCALAUREATE APPLICATION
1976-1980s.'41
' SBS
SBMCOLLEGE
SBS
SBMACP
1976 -77. 1977-78 1978-79 1979-80
ez

est composite admission rate (74%) while at the same time experiencing the
b est overall admission rate increase, 55%.
For the middle years of the study, 1977-79, S.B.M. had the lowest
yearly admission rate (63% and89%). During the kirst and last years ofhe study, A.C.P. had the lowest rate of admissions at 53% and 82%. Ex- i
cept for 1978-79, S.B.S. had the highest adMission rate, ranging from 72%
to 97%.
Comparing yearly divisional admit rates to College rates reveals an
interesting picture. S.B.S. was the only division to maintain an admit
rate higher than the College rate for each of the study years, rangingfrom a 3% point to a 7% point difference. The overall admit rate of S.B.S.,
at 82%, was 4% points higher than'the all-College composite admission rate.The yearly admission rate of A.C.P., on the other hand, wlen contrasted to
the College rate, displayed'an unstable pattern. For two years (1976-77 at
a 13% point difference and in 1979 -80,' at a 4% point difference) the A.C.P.
rate was below the all-College rate. During the other study Years, theA.C:P. rate exceeded the College rate by a 4% to 6% point difference.Overall, the A.C.P. composite admission rate of 74% was 4% points below the
all-College rate. Except for one year, 1976-77, wben its admission rate
was 3% points above the College figure,,8.B.M. had yearly admission rates
froth 1 to ;0% points below the college.level. At 75%, the composite S.B.M.
admission rate was 3% points. lower than the College level.'
d. Distribution, of Yearly College Applications Load
What pottLon o6 the totat apptitations toad i.s bonne by each division?
DV .the divizion4 aharce.equatty in this ARgand? What changt4 in divizionat
Acme of the att-Cottege appti.cati.on6 toad occult oven time? Now i s the
ttege admal6ion4/non-4dffa.44ion4 toad ctiztni.buted among the divizione Do,
e 4hane equally in thi4 anew? What change4.oven time take
peacein,thi4 area? I
$
Final analysis of the applications data reported in Table One focuses
upon the percentages of the College, 3accalaureate load (total applications,admissions and non-admissions) shared by the admitting divisiohs. Figure
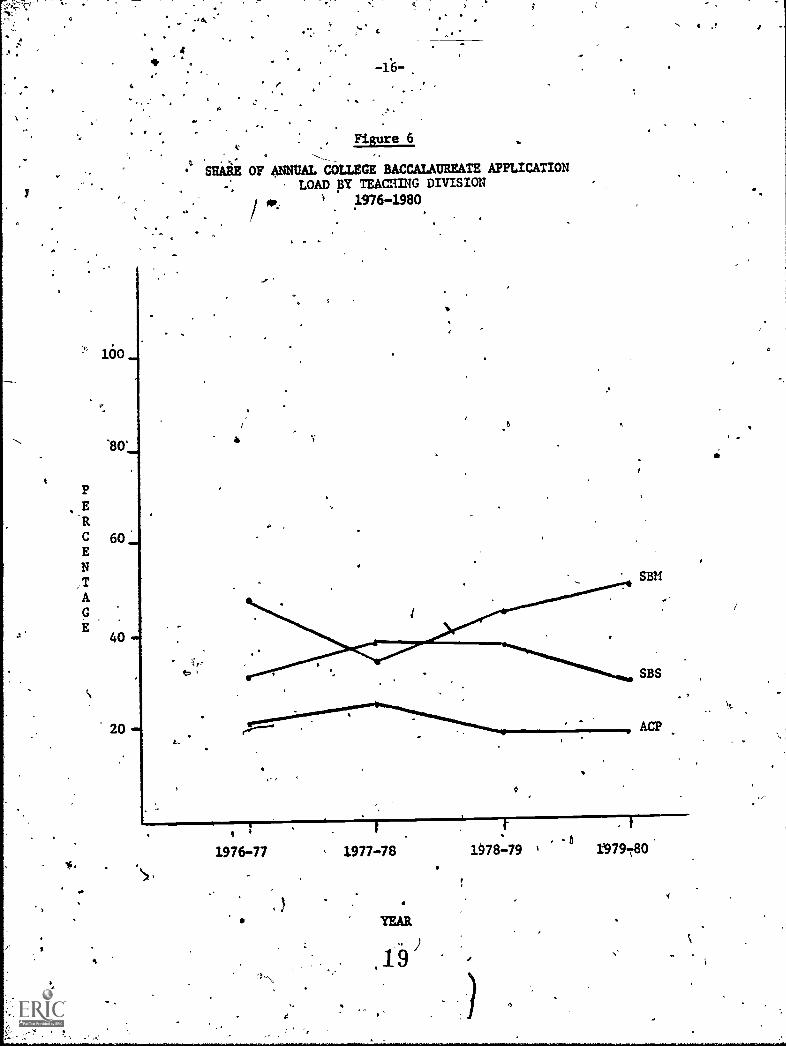
Six presents proportionate divisional sharing of the annual College appli-
cations load. Figure Seven'depicts divisional sharing of. the yearly Col-
lege admissions load. The-data reveal an interesting picture.t
S.M. and A.C.P. had generally similar patterns in sharing yearlyCollege applications load. Both divisions experienced,slight,increaies intheir shares of the total applications load during the first year of the
study followed by a ecline over the last three years of the study. S.B.M. ;
ilunderwent exactly op osite changes. After a decline in its share of theCollege applications. oad.during the first study year, S.B.M.'s share inl-
creaped for the balance of the study years. ,
. ..
, .. .
.
i For the whole study, A.C.P. had an overall 9% reduced share of theCollege yearly applications,load,'dropping,from a 21% share in 1976-77 to
a 19% share by study's end. S.B.S. experienceda similar overall declinein its share of the College applications load, decreasing 6% (from 32% to
P
R
C 60EN
,TAGE
4
4
. .
40 -
20r.
EISEEtA4
SHARE OF ANNUAL COLLEGE BACCALAUREATE APPLICATIONLOAD BY TEACHING DIVISION
4P 1976-1980
1976-77
tr I
1977-78 1978-79 1 1979780

a`
011
'1.00
86.
P-E
60
*T
G40
E
20
*
0
-17-
Figure 7
SHARE OF COLLEGE BACCALAUREATE ADMISSIONLOAD BY TEACHING DIIISSION
1976-1980
9
p
'
Aa
. 4 V
1976-77 1977-78 1978-79
YEAR
1979-80

t
46.
4
I-
-18- L.1 o
'30%) by the final year of thJ study. in contrast, had an o tall
8; greater share of the yearly College applications load at the clos of
the study than at its beginnings, rising to ,a 51% share in 1979-80, from
a 47% share in 1976-77.- .
' A.C.P. and S.B.S., sharing nearly parallel changes in'their,portionsOf the yearly College applications load, had increases froM°1976.-74 thrOUgh
'peak years in1977-78,-A.96. halang an increase of 28% (fr& 21; 0' 27%)and S.A.S. undertoing4an increase of 19% (from 32% to 38%). IhereafterS
the sharesof the a4idations load of these divisions dropped, A.C.P.de-clining 30% to a 19% share by study's end and S.B.S. dropping 21% 40.afinal, year 30% applications share. Both these closing divisional shares
were at levels lower than when the study commencedw,5.. The compodite appli-
cation load shares for A.C.P. and S.B.S. were 22% and 34% "respectively.
a,e.
The pattern in total applications load bdrne by S.B.M. was completely 4
different. During the first Year of the study, S.B.M. ahera.251 drop 44 '
its share of the annual applications load,. down frqm 47% in 1976,-77,'to'
35% for 1977 -78. From that tkme, however, through stuk's'share of the College applications load steadily increased,. rising 46% to
share of 51% for 1979-80, an 8% greater share than during the first year
of the study, The composite applications load share foy S.B.M4, at A4%,
meant that a single division was processing almost half of. the applications
submitted to Baccalaureate Programs.
.7.
. .. ,.
Divisional sharifig of the yearly College admissions load, presented'in, .
Figure-Seven;.is nearly identical to the pattern4f developmene'for:divitsional `sharing of-the annual applications load`:' Study. year 1977-78,was,'
again, a year of signifiaantchange. By the clfte4Of the study, .B.M. hadundergone an overall 4% increase in its share of the adm&sion lOad4r(up
from 48% during the first year of the stud/ .to 50% during the final year).
A.C.P.'s share of the admission load rose an overa11.6% toyer the years
studied (from 17% to 18%) while S.B.S.'s admission share dropped by.8%during the years studied (from 35% in 1976-7 to 32% by 157940). '
' The composite annual admission load shares for the divisions *ere
nearly, identical to annual application load Shares. S.13.S.'hada composite
- admission share of 36% (2%.,points above its applications share),,A.C'.P.'s
composite share of 21% was 1% point below its apPlIcatibus sharg;as was
S.4,4M.' composite admission load share of 43%. Thus, admitted
slightlrmore studentd per application load share than did.AvC.p.,or-4B1;which.admitted slightly fewer. A
.'t
..
S.B.S' and A.C.P., as with application.load share, had nearly identi-
cal patterns of change in admission load share. Both had4adasslop load
share peaks in 1977-78. A.C.P. had an increase of 65% to a 28% admissions
c- share (up from 17% the previous year) and S.B.S. had antincreaseof aim
(from 35% to 42%) over the 'same time. Thereafter; both divisions experi-
enped admission share declines, A.C.P. dropping 36% to a share of 18% by
study's end and S. .S. decreasing 12% to.a 37% share for 1975180. Both
these closing yea y divisional admission shares were below the shares pf
these divisions It the start of the stud/ .' #r , %
21Cf

1tr
ti
4.
-19-
'The admission load share changes experienced by S.B.M..were exactlycontrary to those undergone by S.B.S. and A.C.P. Over the first year ofthe study, S.B.M.-'s share of the admission load dropped 37% (from 48% in1776-77 to a lOw of 39% in 1977-78). From that point, S.B.R.Js admidsionload share steadily increased, rising 67% over the last yeara of the studyto'll 50% share by study's end, a level slightly above its starting posjtion.
Comparing annual. application load share with annual admission loadshare amqhg the divisions leads to interesting conclusions. For three. ofthe four study years, S.1.S. had an admissions load share from 2 to 4%.points higher than its yearly total application load share, indicating that.S.B.S. vas admitting proportionately more students than its applicationsload share mlght dictate. For two of the.study years, S.B.M. had an admis-sions load ,are ranging from 1 to 5% points below its appications loadshare, thus admitting during those years proportionately fewer studentsvis-a-vis its applications load share.: S.B.M.'s admission load share forthe other two years of_the study was essentially the same-as its applica-tion share. A.C.P. had two years during which its admissions load sharewas -below its application share (ranging-from 1 to 2% points) and two, yesin which these two statistical categories were basically the same.
B. Baccalaureate Admissions Review Response Time
1. Explanation of Data Presentation Format 1
Table Two'and Figures Eight and Nine report the time (turn around,response time) taken to process Bacc43ureate applications through the ad-missions process.
;Starting with Summer Session Ione-yelkr periods ending with Spring
was grouped into one of four weeklyfive,.five to seven, and over-seven(admits pl non-admits and holds) in a given yeanoted. RaxTresponse time for each applicationwas oalcqlated (See Data.Compilation ProcedureTime in Appendiic B) and rePortid e approp
TIME!. Total BASE TIME entries or the.latecl, into percentages, indicating whit,proportions of applidations fellinto each category for each of the yeart studied.,
, 1977, and carrying through successiveQuarter, 1980, application processtimecategoried: one to three, three toweeks. Total applications processed
represented by N) wasviewed within a study year
for Application Response -
iate weekly category' as BASE-ve categories were trans-
,Using the adjust process explained, in Data Cpmpilation Procedurefor Application Responie Time contained in Appendix B, applications in the 1,ft
over - seven -week category were subject toreassignment. Rtassigned entrieswere reported as ADJUSTED TIME for theyearly and weekly dati categories.Expected delay adjustments for the dver-seven-week grouping left remainingin that category only.those applicants that had experienced real bureau-,cratic dekgv,(lost lolders, ignored folders, foot-dragging, etc.) in theadmission process either at the admission-review or'the adyisorressignmentstages or-both. Thus; for weekly categories one through three, BASE TIME,entries were
wereadditions.and-reported as:ADJUSTED TIME. Sub-
tractions were made from weekly category four and also repartAd as AD-JUSTED TIME:,-These entries were, in turn, translated into percentages,
. 22
,
.1

-20-G
s
Table 2
'BACCALAUREATE ADMISSIONS REVIEW' RESPONSE TIME
r
BASE BACCALAUREATE APPLICATION PROCESSING TIME
Academic Year .
1-3 Weeks 3-5 Weeks 5-7 Weeks Over 7 Weeks Total**
1977-1978 N: 35 44 33 97 209
(y (17) (21) '(16) (46)
1978-1979' _N: .61 45 20 23 149
(%) (41) (30) (13) (15). A
1979 -1980' N: 1 62 58 p18 54 192 .
.
(Z) \ (12) (30) ( 9) .(28)
Total N: 158 1.47 71 174 550
(%) (29) (274 (13) '` (32)t
'Academic Year
ADJU1TED BACCALAUREATE APPLICATION PROCESSING TIME
1 -3 Weeks 3-5 Week's 5-7 Weeks. Omer 7Weekii Total
.107-1978 N: 37 49 37 86 209
(%) (18) ) (23)' (18) (41)
1.978-1979 N:4 . 64 e 45 24 16 149
(%) (43) (30) (16) (11)
1979-1980 N:. , 75 65 24 28 192(%) (391 (34) (13) (15)
i
Total N:' 176 . 159 85 130 550
(%) ('32) . (29) (15) (24)einwirk
**TotaIs.on Tables 1 and 2 will not agree because re-applications were not is--chided in computation of Table 2Asta; reapplications are counted in data
reported in Table 1.
el
23 t
.00

N
100
N *, 80.0.
0
6 0 -
UDENT 40-1S
20
I4
17k
GW
412 23%..-
77; 78 79-I I I
78. 79 .80
1 .-3 3:-.5. : 5-7 Over 7
, IFigure 8
YEARLY ADJUSTED BACCALAUREATE-APPLICATIONRESPONSE TIME 3
21x
EP 30%
1977-1980
3%
ti
46%
.
f77- 78. .79 77 7i 794 77
r75 79
I I I I' 1 I I I
78 79 80 78 ' ;79 80,
78 79 .80 ..
WEEKS
.24

4
r
411
RCE
'N_
T
E
5
40
30
20
10
K "158
BA
E
Nii14_76
ADJ
0,
IED
..
Figure 9-
COMPOSITE APPLICATIONRESPONSE TIME
1977-1980 .8'
ak.
N..159N..147
BA
E
J.WN1:
ADJ
S
TED
I
0,
NaN=471
A
E
4,
- N-174
BA
A
SJ
E
.Nsalft_
TED
1-3 3-5 f. 5-7
at
WEEKS /.
2 5
4 ,
Over 7
hi,

-23--
reflecting a more accurate assessment of what factor of total applicationsprocessed within a particular year fell within a weekiy.category.
gifting the reported process time survey were composite entries for
each weekly category covering the twelve quarters studied, presenting anoverall picture of admissions review turn-around time.
.02. Distusaion of Admission Res.onse Time Data
How .gong does c t take to move an appLi:cat.i.on thitough the admis,sion.6prtoce44? Oven a period of time, do these Sigurte4 vary aignii.i.cantty?the admiataana review pkoce64 a hopete:say bogged down, enta.itgecl meat.cuith,detay4 a quartet at mote not uncommon?
Thedata contained in Table Two and Charts Eight and Nine clearly
show. that over the years studied, applicatioremesponse time dramaticallyimproved. By the final year for which data were collected, applicationscompleted'the review process in a markedly shorter time, either from a
BASE or an ADJUSTED perspective.
'Since it is contended,based upon the explanation of BASE vis-a-visADJUSTED response time mentioned in Appendix B,that ADJUSTED TIME is a
.morecyealistic, reasonable and fair assessment of_turn-around time, it isthat statistical measSie that will provide the basis for the followingdiscussion.
Over the first year of the study', 37 applications (18% of the total
processed) completed the admission review process by the third week of re-
view. By the last year of.the study, applications completing the admis-
sion process by the-third week ha increased 102% to 75 (a 39% share of the
total submitted for review, representing a 116% increase inthe portion of
applidations falling into this 3ategory).
Applications completing the admission review process by the fifth week
also increased sharpy over the study years. In 1977-78; 23% of the appli-
cations received (49) Had cotpleted review by the fifth week. For 1979-80,
' that figure had risen 48% to'34% (a 33% gain - to 65 - in the number of
applications falling in this category). °
A
Looking at weekly categories one and two combined, 41% of applications
(86)"had completed the admissions process by*the fifth week during the
first year of study. By 1979-80, 140 applications (71% of the total sub-mitted for review) had finished the review process by the fifth week,,a 78%
increase in the number of aeplications'processed within that time and a
near 80% increase in the percentage of- total applications falling into this
grouping.
_Associated with this draMatfeincrease inplications completing the admission process by,occurred aidorrespondini decline in the numberfailing to complete the review process.by thatcations Wire included in the 5-7 week categoryBy 1979-80, that figure had dropped 35% to 24,
7
number, and proportion of ap-the fifth week of reviewand portion of applicationstime. In 1977-78, 37 appli-(18% of the total processed)..representing a 28% decline
6

-24-
, -
(to 13%) in the proportiqn of applications not completing the admissions "4
process bythe Seventh week of review. A similar decrease it the number. 0
and percentage of applications placed in the over-sewn-week category oc-
curred over the study years. 'For the first year of the study, if took
over seven weeks to process 86 applications (41% of the tbtal for that
year) while for the last year df,the study, 28 applications (a 67% decline).
were included in this category, a 63% drop (to 14%) in the portion Hof ap-
plications for. this group. .
4
Viewing admission response time through categories'1-3, 59% of the
applications (123) were reviewed by the seventh week of the admission
.process during 1977 -78. That figure had increased 44% to 862of applica=tions received falling into this grouping (a_33% increase in the number of
applications to 164) by the last year'of the study.
. The everall picture of response time, based on a composite analysis
of the study years, shows that 61% of the applications codpleted the re-
view process by the fifth week. Another 15% had completed the process by*
the seventh week of review, leaving 24% of the applications' still within
the review process beyond tife seventh week.
Concluding the discussion of application response time, the data re-
veal a distinEt relationship when comparing turn-around time to total num-
ber of applications submitted for review% With declinef in .the number of
applications received, occurred a parallel reduction in the time taken to
process them. ,Contrast the 1977-78 response time data, the study year in
which most application§ were received, to the response time Alta for 1978-
79,-during which the fewest,applications over the study years were re-
ceived. With a 29% drop in total applications submitted for review (a
decline of 60 applications) came a 51% increase (from 59% to 89%) in the
portion .of applications completing the review process-by the seventh week.
The following study year,-however, With 43 (a 29% increase) more applica-
tions submitted, the percehtage of applications falling into this category"%,
grouping had dropped 32 points to 86%.(
The year 1977-78 was one of significant change for Baccalaureate Pro-
grams. The previous year sawthe implimentation'of new policy guidelines.
In 1977-78, a new admissions structure (separate divisional admissionscommittees'replacing a.single, College committee), was put in place. New
committee- members were thus adjusting to a new'substantive and procedural
structure. Various bugs had to be worked out. As the/committees became
more familiar with their new roles, as they became more proficient at in-
terpreting and applying the "1976 Guidelines," and as the qUality of pro-
grams improved, the time taken tq reach an admission decision and make an
advisor assignment, no doubt, was shortened.
Although the time span covered in compiling the application response
time data is too limited to report on trends and relationship patterns
with great reliability, certain correlations do emerge from the data. Re-,
liable confirmation of these apparent relationships awaits further study
zr over the ,coming years.4

'C. laccalaureate Graduation and Advisor Service Loads
1. 8xplanation of Data Presentation Format
The third and final major area of statistical inquiry reported in this
study is Baccalaureate graduation and Advisor-Service loads, reported in
Tables Three and Four and Figures-Ten-Fourteen. From July 1, 3976, through
June 30, 1980, number of students graduating each year was reported for
both the College and its teaching divisions. These data were translated
into divisional percentages representing the proportion of the annual Col-
alege graduation_loAd bbrne by each teaching division.' A composite divi-
, sional graduation picture was also reported for the same statistical cate-
gories . '
An Advising Service Load for both the College and each teaching divi-Aton, covering the same time period, was deterlined by first calculatingand reporting an Advising Flow (admits plus graduates). This lighre,was
divided by the number of adyisors,available to service Baccalaureate"stu--
dents to ive.at composite and average yearly College and teaching
division" Advising ervice Loads. Divisional advisor availability was
calcula.d by noting potential advisors available based on all facul-
ty at the- -taut professor and above level since, as a general rule, it
is only at this employment rank that Baccalaureate advising assignments aremade. Thtspool of potential available advisors was reduced by factorswhich 14.mit.BAccalaureate advising assignments (employment termination, job
classificatibn and responsibilities restrictions, etc.) leaving actual
available advisors.
The dat a'reported in Table Three will be discussed separately and be--
forexhe data contained in Table Four.r
4
8. Discussion of Graduation Data
- ..
How many students oaduate 6tom gaccatau&ea4e pitognama in a yak? How
ii thi4 Cottege annuat.,vaduatton Load 4hated among the divioion4, both .f.nl
teium 06 the flambe& ol6 oaduatu 4sexviced and the poA4on ol6 the annual
Load bonne by each divi4ion? Now do .these 4tat44t4:44 vary oven. time?
Table Three and Figure Ten reveal Xhat the number qf graduates from-Baccalaureate Programs processed by'the College dropped 29% for the years
studied. From a peak of 110 in 1976-77, graduates declined to 78 for
1979 -80. This 29% dedrease'ia.program graduates compared to a 12% decline
in admissions a 32% decline in total applidations covering the same
period.
Divisional analysis of graduation data, reported in Figures Eleven andTwelve, show no convergence patterns;* contrast to the application/admis-.sion data discussed earlier. For the years studied; S.B.S. was the onlydivision which-had-an overall increase in number, of graduates -serviced.-
By.the lastyear of-the study, S.B.S. was processing 24% more graduates(an increase from 25 to, 31) than.during the first year of the study. Bac-
calaureate graduates-for S.B.S. rose 56% (from 25 to 39) between 1976 and
1978. Thareafter, graduates dropped 20% to 31 for 1979 -80. These figures

-26-
Table 3
BACCALAUREATE PROGRMAIGRADUATES
TEACHING DIVISION' COLLEGE
Total 1:4
110 //
113 .
97
78
398
Academic Year SBS ACP SEK
1976 -1977 N: 25 17 - 68
(2) (23) (15) (62)
,--
1977-1978 Jj: 39 22 52
, (2) (3t) (19) (46)
1978-1979 Ni 37 - 27 4 33
\__'(2)
(38) (28) (34)
1979-1980 N: 31 14 33
(2) (40) (18) (42)
Total N: 132 80 186
(2)4
(33) (20) (47)
Table 4
ADVISING FLOW AND SERVICE LOAD1976r1980
TEACIMIG DIVISION 7.
SBS ACP SBM
251 143 298
132 80. 186 398aRADUATES:
TOTAL FLOW '.. 383 223' 484
AVERAGE YEARLOIFLOW: 96 56 121
AVAILABLE ADVISORS: 13 18 15
SERVICE LOAD (Advisitig Blow 4 Available Advisors)
COLLEGE
Total
492
1090
273
, 46
TOTAL 29 12 32 24
ANNUAL 7.
29
3. 8 6


100
80
P
RC 60
NTAGE 40
20
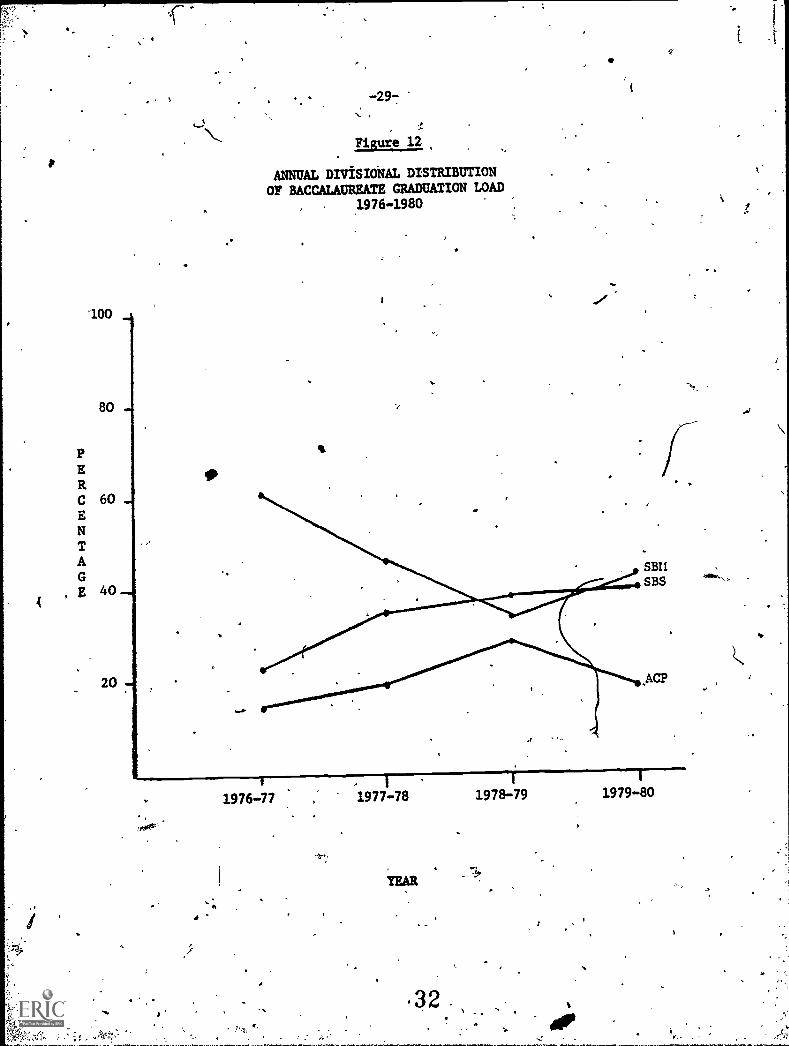
-297
Figure 12
ANNUAL DIVISIONAL DISTRIBUTIONOF BACCALAUREATE GRADUATION LOAD
1976-1980
YEAR

J1.
increase in ale. annual Collage graduation load borne by S.B.S., risingfrom 23% to 40% over the study period. The composite share of the gradua-tion load borne by S.B.S. (33%) was slightly below its admission (36%) and_application (34%) load shares.
.
While S.B.S. experienced an increase in both the number of-graduatesserviced and its share of the College graduation load, A.C.P. had an over-al1.18% reduction in its graduates, dropping from 17 to 14 over the spanof the-study. Frah 1976 through 1979, A.C.P. had a 59% increase in gradu-ates (rising from 17 td, 27). Thereafter, A.C.P.'s number of graduatesprocessed dropped 48% to 14 thiough 1980. Although A.C.P. - experienced a
decline in graduates, its share of the annual College graduation load increased 20% (frOm,15% to 18%). From 1976 (15%) through 1979 (28%),A.C.P.'s share of the College graduation load rose 87%. Over the lastyear of the study, its share declined 36% (to 18%). The composite share
of the College graduation load of A.C.P., at 20%, was nearly the same asits admission (21%) and application (22%) loads.
Similar to the changes exp rienced by A.C.P., S.B.M.'processed fewergraduates by the close of the study. From a'peak pf 68 in 1976-77, S.B.M.
graduates dropped 51% to 33 for 1979-80. This represented in overall de-
cline of 32% in S.B.M.'s share of the College graduation load, which,de-creased from 62% in 197647 to 42% by study's, end.f The sharpest period ofdecrease in S.B.M.'s sharialloccurred from 1976to 1979. Over this period,S.B.M.'s share of the graduation load dropped 45% (from 62% to 34%). Over
the lastcyear of the study, however, the share of the graduation loadborne by S.B.M. rose (by 23%) to 42%. Similar to'the patterns displayedby the other two divisions, S.B.M.'s composite share of the graduationload (47%) was generally the same as its composite admission (43%) andapplication (44%) loads-.
3. Discussion of Advising,Flow/Service Load Data
How many adMiXtee4 and oaduate4 cute handeed by the Cottege? How ,66
th,a Advizing Ftow diztAauted among the diiri4ion4? What the numberof advattee4 and gicaduate4 ptoce4,6ed pet available advizoit lion the Cateege?
How us thi4 Advizot Senvice Load 4hated by the divi6.tons?
The composite all College Advising Flow (admits plus graduates) tie-ported in'zTable Four was.1090, with an-annual average of 273. The numberof divisional adlisors available to service this load was approximately,46. This left a composite College Advisor Servi1cFe Load of t4 and an aver-age annual load of 6, as reported in FliureTh teen.
A divisional bitakdown of,the same st4ti tics, contained in FiguresThirteennd Fourteen, reveals some'interesting facts. Both the lowestcomposite (223) and yearly average (56) Advising Flows were in A.C.P. At the,same time, however, A.C.P. had the largest number of actually availabieadvisors (18) to service its Baccalaureate students. This left A.C.P. a-Composite Advising Service Load of 12 and a yearly average load of 3, both50% below the College figure. On the other hand, S.B.M. had the highest.'total ,dmits and graduates (484) serviced by its advisors as well as the
.

6
/
-
yigtive
ADVISER SERVICE LOAD- ,1976-1980'
ACP/
t.
SBS SBM
3,4

Figure 14
BACCALAUREATH1 ADn SING FLOW
& ,!-- °. .AVAILABLE ADVISERS BY TEACHING DIVISION

highest annualaverage Advising Flow of 121, a 117% greater load than that
of A.C.P.' S.B.M. processed this load with 15 advisors, 20% fewer then
'A.C.P.'s. This translated into a S.B.M. composite Advisor Service Load of32 and a yearly average load of 8 (both 33% greater than the College load).
S.B.,S.,Qfith the fewest available advisors, 13, (28% (fewer than that of
A.C.P.) serviced a composite Advising Flow of 383 and a typical annualFlqw of'°96, a 72%. greater load than that borne by A.C.P. These figures
represented for S.B.S. a composite Advising Service Load of 29 (21% abovethe College figure) and an annual average load of 7,,17% above the compar-
able College load. Comparing Advisor Service Load among the divisions,S.B.M., at 32, had a 10% greater composite road than S.B.S. (29) and a167% greater load than A.C.P.. (12). The Annual Advisor Service Load of
S.B:M. (8) was 14% greater than S.B.S.'s (7) and 167% gieater than A.C.P.'s
(3),.1
CONCLUSION
The data reported and discussed in this study focused on three major areas
of` Baccalaureate Programs operation in General College: annual applications
data (total application submitted for review, admissions, non - admissions,' ad-
missions rates and application load distribution) for both the College and its
teaching divisions; admission review response time; and Advising Flow/Service
Load from both a College and a teaching-divisional persRective. The study find-
-) --'r-ings provide a reliable data base for accurately understanding past develop-
ments and trends in Baccalaureate Programs. This statistical foundation'can
serve to support informed decision making regarding the future of four-year
degree programs is General C011ega as well as help to reduce the chance of mis-
conceptions contaminating tha.decision- making process. With clearer insight
into Baccalaureate Programs, less clouded by myth, proposing, evaluating and
implimenting suggested changes in Baccalaureate policies and practices will
pro4a a productive, worthwhile endeavor. -411,
(.-An attempt was made through the research to answer various questions re- .1
lating to Baccalaureate operatiqns: Do fewer students apply to Baccalaureate
Programs than did. .before? Does Generil College lose "many" students from its
Baccalaureate Program? Is it difficult to gain admittance to Baccalaureate
Programs? How is the Baccalaureate applications/admissions load distributed
ogged down mess with delays of a quarter or more not un-
common ?" How many Baccalaureate graduates are processed each year by the Col-
lege. -How is this annual graduation load distributed among the teaching divisions?
What is the Advising Flow level and Advisor Service load for the College and its
teaching divisions. The researcgfindingsiprovide crear answers to, these questions.
College applications data reveal that 32% fewer students sought admissionto Baccalaureate Programs over the final year of the study .than during its
first year. The meaning and,causes of this declineoliknot clear and await
further study. During the last year,of the'study, however,.this applicationsdownturn was reversed as a 26% applications upswifig occurred. Does thigi
a
I -34-
80 applications increase foreshadow an upsurge for the coming years or is it
merely a temporary, lull in the earlier downward trend? Is the one-third.ap- -
plications reduction over the study years a positive or negatilk development?
As applicatigas decreased, oannual admissions declined at a significantly'
slower rate ( 1.2% decline) and non -admissions took a percipitous plunge (a.72%
reductidn):. thus, Although one-third fewer app6l.icants sought admission, pro-
portionately more students were admitted over the last year of the study in
comparison to the first. Contrasting the 66% admission rate of 1976-.77 to the
86% success ratio of 1979-80,'the 1980 applicant's chances for admission were
30%greater than the 1976 applicant's. With a composite.admission rate of 78%.
it is clear that an applicant's chance for ddmission ate excellent. Finelly,
applications data reveal the possible presence of an'unconscious, informh
admissions.load.balancing protess. Study findings.show admission rates in-
versely related to application totals. As the latter increased, the former
declined. Thus, the,1979-80 26% increase in app ications triggered an Mods-
.sion rate 'slowdown (down to 86% from 94Z the prious year) and a 180% increase
in the number of non-admissions.,
Divisional analysis of applications data also reveal interesting conclu-
sions. -Reflecting the Collegetrend:/each teaching division processed approx-
imately one-third fewer applications (A.C.. down 34%, S.B.M. down 28%,and-
.S.B.S. down 37%) by study's close in comparison to the first year.. A markedly
lower decline in divisional admissions (A.C.P: down 3%, S.B.M. down 8% and
S.B.S. down 20%) and a dramatic reduction.in divisional rejections .(A.C.P.
, dropping 76%, S.B.M. dropping 68% and S.B.S. dropping,78%) indicates that theA
actual number of,admisssions did not drop that significantly over the study.
Divisional admission rate changes bear out this conclusion. While this de-
crease in applications oqguried across the teaching divisions, divisional ad-
mission rates increased (A.C.P. up 55%, S.B.M. up 23%, and S.B.S. gp 25%).
Addressing divisional distribution of the applications load, the data
clearly show that advising loads are not equitable. A single teaching divi-
,sion, S.B.M., carried 44% of the application road, a 43%-share of the admis-
sions load (with a 50% burden in these areas during some study years) and a
47% share of the annual Cbllege graduation load. S.B.M. also processed the
greatest number of applications, admitted the most students (but also rejected
the most) and had the largest composite and annual Advising Flow level, all
with 15 advisors available to service its load. This left S.B.M. with a com-
posite Advisor Servias Load of 32. At the same time, however, another teach-
ing division, A.C.B., with the most actual available advisors (18), had the
lowest load burdens in these areas, (a 20% graduation share, a 21% admission
share, a 22% application Share, half the composite and annual Advisitg Flow
levels of S.B.M.'s as well as the kewest applications processed and admis-
sions), leaving A.C.P. with a composite Advisor Service Load (12) almost one -
third that of S.B.M.1s. Such findings necessarily lead to questions. Is
S.B.M. adequately staffed to handle this load as well as carry out the' full
range of teaching /advising /research/.service responsibilities expected of its
faculty? Are S.B.M. Baccalaureate advisors given worthwhile support, recog-
nition and compensation (fihancial, promotional, responsibility'trade-offs,
etc.) for carrying this disproportionate Baccalaureate Programs' burden?
The final conclusion that.can be drawn from the study results focuses on
the belief that processing Baccalaureate applications takes "so long" that
k 37
r-
awe.

4
1.
t.
"dire consequences" often befall the student awaiting the admissio; decision.
The twelve quarters of data_sampled clearly show that, based on composite j
ADJUSTENTME, 76% of applicants receive bf an admissions decision wfth-
in seven weeks of submitting an application. That figure has been as high as
85Z -89Z during individual years. It is subluitted.that these response rimei are
not a amall achievement given the policies and purposes of'Baccalureate Pro-
grams as well as the 'application reviewiadVisor assignment process which emphs7
size individual attention toand evaluation of u1ique, self-designed programs,
all carried out by a Feaching, advising, researching, publishing, College and
community involved faculty..
The results of this study are the first in a planned series of inquiries
into Baccalaureate operations.' The next stage is to review operations of
otter four-year degree programs, both within the University, of Minnesota and
without, that are similar in scope ind design to General College's, and com-
pare research findings. The final stage ts to carry the present study forward 1
, through 1985, thus producing a decade of Baccalaureate operations data enabling
a clear understanding of'trends, developments and patterns of change.
.e.
*
3&

APPENDIX A
b
8
Sample Card from Baggslaureate Information File
BACCALAUREATE. PROGRAM To Adm C
,ID#SS (I
r
ADDRESS home
present
TELEPHONE NO. home DEGREE.
*work
DATE ADMITTED NOT'ADMITTED
r
CORE TITLE
ADVISER
J
r.
p
GRADUATED
39
c.)
Mb.
44,

O
-37-
AP B
Data Con ilatiop Procedure
1. Baccalaureate Application Data
The sources reliediupon in accumulating the data.repOrted in Table One
were Baccalaureate Information File Cards and Committee 'ActioiIists. From
July 1, 1976' through the end of June, 1980, the names of all applicants(admits, holds and non-admits) to General College Baccalaureate Programs were
taken from Comiittee.Action Lists.= These. applications were cross referenced
to corresponding cards-mithin theq)accalaureateinformation ard File.' The
pertinent informNtion contained in both sources was.abstracted, including the
teaching divisiod to which the applications were referred for adnissiona re-
view and possible advisor assignment. In rare cases, when no advisor, admis-
sions review or other teaching division indicator was-specifically noted, the
core title of the projected program was, relied upon to determine probable
division assignment. Cross referring'Committee Action List entries with in
formation contained in the file cards provided instant validation of the data
compiled.
While gathering the data reported in Table One, minor statistical accuracy
problems were encountered. Since the data were drawn from hand -kept records,
typiocalproblems associated with this method of record.keeping arose. The
original records contained sporadic omissions. In addition; since the statis-
tics for this study were also manually compiled, the normal problems of such a
process occasionally cropped up. In rare cases, double counting, skip-overs,
and only partial tabulation occurred. But,-with cross-validation between Com-
mittee Attion Lists and file cards, these extremely rare inaccuracies were dis-,
covered and corrected.
sDafa accuracy problems for Table One also arose from "multiple applica-
tions." An applicant Originally turned down, or an applicant who, after all-
missions, would make wholesale-program changes; occasionally reapplied to the
program. A single applicant could, therefore, be reported two or three times
as the application, rejection, program change, reapplication; etc., process
played itself out. This multiple contacts problem was quite uncommon, however.
It is doubtful whether,it produced any systematic biasin the reported results.
A third potential for minor inaccuracy arose from the applicant who,
after admisfion, withdrew from the program and never followed'throughon a
degree plan. There was no way of determining this percentage from the data
available it the time of this Otudy. Baccalaureate'administrative and-cleri-%
71 staff estimte the incidente of such cases to be quite rare.
.2. Application Response Time
The informationliburces relied upcin to compile the data reportfd in Table
Two were the BacCalaureate Information Card File and Committee Action Lists.,
400'0

.`\
Commencing with Summer Session, 1977, and carrying through consecutive,subsequent academic quarters to the end of Spring,. 1980, the records for all.admits and.nai-admits (total applications processed) occurring within a quer-t*r were retrieved from,the Baccalaureate Committee Action List. InformationFile Cards for applicants were used to record4the date when an application.lftadbeen received by the Baccalaureate,Prograns clerical office. Also noted onthe cards were the dates offiCial action was taken bk an admission committee.This latter date, cross-validated by reference to identical entries on tyeCommittee Action List, was consistently the datewhen a letter from the Bacca-laureate Programs Office was sent to the applicant, communicating th0 official'decision of the admission committee. The time difference between the 'date anapplication. was received and the date a letter was sent to an applicant consti=tuted raw process, time -.BASE RESPONSE TIME - reported in Table Two and enteredin one of three weekly categories which subdivided the study-years: 0-3-weeks;'3-5 weeks; 5-7 weeks; an over 7 weeks.
(' A significant problem faced in compiling the statistics reported in TableTwo was determining whether BASE RESPONSE-TIME was an accurate and meaningfulmeasurement. Although the figure did indicate the total time applications re-mained within the - Baccalaureate admissions review process, it did not, in all
. ;cases, reflect a realistic assessment of the time daring which admission corarmittees actually had a real opportunity to review applications. Another mea-surement, ADJUSTED RESPONSE TIME, was therefore calculated and utilized insituations where BASE RESPONSE TIME had a significantly distorting effect.
During the past few years, the concensus among Baccalaureate administra-tive
4e-
staff and College faculty has been that a turnaround time of six weeks isan acceptable performance level at the admissions review stage. Reviews ofapplications that dragged beyond the seventh week were considered. unreasonablydelayed. In many cases of over-seven-week process time, however, legitimatereasons are present to explain the delay. The question therefore arises for
4capplications within the over-seven-week category, how many are cases of REAL,inexcusable delay and how manyare situations of EXPECTED, excusable delay.Research was pursued to discover wily delay had occurred and to determinewhether such cause explained why the application appeared in an over-seven-week category.
EXPECTED, excusable delay might occur for various reasons. An applicationplaced an ."hold," due to technical of procedural problems, faces a predict-able admission's delay until the problems are cleared up. Applications spb-
when a
witted during faculty "down" t (over quarter breaks, during summer, etc.),hen admission comnitteepemb and potential advisors are not readily avail-
able to'process applications, will also experience EXPECTED delay. Applica-tions which are received during the last few days of a quarter, when reviewingfaculty and potential advitars are preoccupied with the matters that bring aquarter to a closer will face a longer time. ,Additionally, multi-ple contactstcaset *gained earlier, would most surely encounter predicta$ledelay.
Given these types of4PECTED delay, applications that initially fellwithin the over - seven -week category were cross referenced to corres ndingfile cards. Based upon relevant information contained in the file ca ds, it
°. .
4
41

-39-
was determined whether applicants belonged,in a REAL or-EXPECTED delay category.
,..For applicants who experienced EXPECTEDdelay,AA.adjustment was made in mea-;-
suring response time. Application receipt date-was disregarded as the starting
paint for computing rnaround time. Instead, the date that the admissions re-
view committee could 'b easonably expected to have the opportunity to review
applications was substitu d. Thus, applications received over quarter break,
,after second Summer Session,, or during the last few days of a quarter, were
treated.as having been received during the first week of the immediately fol-
lowing academic quarter. In multiple contacts cases, where a reapplication
date was-aviilableAfrom the records, that date was used for measuring turna-
round time. In those few multiple contacts situations where no reapplication
Late was available from the 'records, the data were excluded since they could
notbe accurately coded.
The process used to identify cases of EXPECTED delay, included initially
in the over-seven-week category,constituted. the mechanism by which ADJUSTED
RESPONE TIME was determined. EXPECTED delays were subtracted from the over-
seven-week category and reassigned td*an earlier, more accurate, ADJUSTED TIME
category. The difference remaining in the over-seven-week category therefore
constituted a more accurate reflection of applications that experienced REAL
delay.
In gathering the data reported in Table Two, several minor problems were
encountered which affected statistical accuracy. In some very rare cases,
after noting the date on which official committee action was taken (reported in
the Committee Action List), upon cross validating the application with the In-
formation Card File, it was discovered that no application-received date had
been recorded. There was no alternative source from which that information
could be gained. In such extremely rare situations', the information was ex-
cluded as impossible to calculate.
Another area of potential inaccuracy occurred with multiple-contacts ap-
plications. Although extremely.uncoMMon,these situations posed a vexing
problem. Initial non-admittance process time was readily calculatable. How-
ever, with subsequent reapplications,occasionally only the official dction of
the review committee would be recorded. No date on which the reapplication
had been submitted was recorded. These data were exclUded from Table Two since
'process time could not be computed with rehsonable preciseness without knowing'
the date a'reapplication had been received.
Finally, since the statistics reported in Table Two were manual tabula-
' tions tetrieved from hand maintained raw records, the oversights, omissions,
and other breakdowns characteristic l'of this data retrieval method andrecord
keeping system mentioned.earlier might have occurred. These accuracyAiffi-
culties were quite insignificant, however-, due to.the cross - validation built
into the data retrieval process.
3. Graduation- Flow and Advising Service Load-.
Data sourcee\tilized to compile the information reported in Tables Three
and Four covering the period from July 1, 1976, to June 30, 1980, were Bacca-
laureate ComMittee Action Lists, BaccalaureateGraduation Lists, and Baccalau-
,
42

reate Information File Cards. Admissions to Baccalaureate Programs along with
division assignment were noted from,ComMittee AC.tion Lists. Data'were crossreferred to the Card File for each admitted applicant. From both these rec-
ords, divisional housing of admitted programs was readily determinable from theinformation (name of the advisor or title of the program) noted in both sources.Graduates per teaching.division and for'the College were compiled by informa-tion contained in Baccalaureate Graduation Lists with cross reference to Informs ,
tuition File Cards.
teWhile compiling the statistics containedin Tables Three and Four, several
accuracy problems were experienced. ,OcCasionally, the faculty member official-ly assigned as advisor to a prograM admittee was not the faculty member whoactually guided the student 'through to graduatiOn. Advisor assignments re-
corded in the Graduationommittee Action Libts, Dr the Information CardFile, were not fool -proof indicators of program "divisional housing. owever,in such cases of little or no student contact with the officially assigned ad-visor, the unofficial advisor usually came from'the same division as the advis-or Of record, primarily due to reasons mf program theme and content as well as
divisions1Nopertise. Therefore, division assignment accuracy was not signif-
icantly diseerted by unofficial advisorguidance. The eons for limitedoffical advisor contact were usually the following: Adv;sor absence due to
Summer Session downtime, illness, departure from employment or faculty leave;lack of expertise; per onality conflicts; and other predictable occurances.
.,gnother potential visor/divisiOn:assignment inaccuracy occurred in those
extremely rare cases en no advisor assignment was recorded in the data bases.In these situations, program title, if available through the Information CardFile, was utilized to indicate probable-division assignment based upon programtheme/content and faculty expertise. Otherwise, the data were.excluded since
they were not accurately reportable.
Finally, since Tables Three and-Four ,report advising and graduation flow
only for the last four years of Baccalaureate Program operations, graduatesduring the years studied cannot be subtracted from program admittees to produce
an accurate'net advising flow. Since Baccalaureate Programs has been operatingin General College since 1970-71, graduates during the immediate study yearswere not necessarily admits during that. time, but were, in .many cases, admit--
tees during the years of program operation prior to the study.
uf.
4s: