dodge & cox balanced fund annual report dated … › pdf › shareholder_reports › dc...dodge...
TRANSCRIPT

D O D G E & C O X F U N D S®
2019
Annual ReportDecember 31, 2019
Balanced FundE S T A B L I S H E D 1 9 3 1
T I C K E R : D O D B X
Important Notice:
Beginning on January 1, 2021, we intend to discontinue mailing paper copies of the Fund’s shareholder reports as permitted by newregulations adopted by the Securities and Exchange Commission, unless you specifically request paper copies from Dodge & Cox Funds orfrom your financial intermediary, such as a broker-dealer or bank. The reports will remain available to you on the Dodge & Cox Fundswebsite (dodgeandcox.com), and you will be notified by mail each time a report is posted and provided with a link to access the report.
If you have already elected to receive shareholder reports electronically, you will not be affected by this change and do not need to take anyaction. If you have not done so already, you may elect to receive shareholder reports and other communications electronically by enrollingin e-delivery on the Funds website, or, if you are invested through a financial intermediary, by updating your mailing preferences throughthe intermediary.
If you wish to continue receiving paper copies of all future shareholder reports, please contact us at (800) 621-3979. Reports will be providedto you free of charge. If you are invested through a financial intermediary, you may contact your financial intermediary to request to receivepaper copies. Your election to receive reports in paper form will apply to all funds held with Dodge & Cox Funds or through your financialintermediary, as applicable.
12/19 BF AR Printed on recycled paper

TO OUR SHAREHOLDERS
The Dodge & Cox Balanced Fund had a total return of 19.6% forthe year ended December 31, 2019, compared to a return of 22.2%for the Combined Index (a 60/40 blend of stocks and fixed incomesecurities).
MARKET COMMENTARY
The U.S. equity market’s performance in 2019 was exceptional:the S&P 500 registered a 31.5% return, its strongest annual returnsince 2013, and reached an all-time high. Every sector of theS&P 500 posted positive, double-digit returns. InformationTechnology surged 50% and was the best-performing sector, whileEnergy (up 12%) was the worst-performing sector.
In fixed income, the U.S. investment-grade fixed incomemarket posted a robust 8.7%a return, fueled by the combination offalling U.S. Treasury yields and strong performance from theCorporate bond sector.
INVESTMENT STRATEGY
We set the Fund’s asset allocation based on our long-term outlookfor the Fund’s equity and fixed income holdings, which currentlyfavors equities. We did not make any meaningful changes to thisallocation during 2019. At year end, the Fund’s 68.1% equityweighting (including 2.8% in preferred stocks) reflected our morepositive outlook for total return potential from equities than fromfixed income.
EQUITY STRATEGY
In the United States, the group of companies that benefits fromlow interest rates, as described below, is trading at an 80%premium to the group of companies that is harmed by low interestrates (or performs better in a rising interest rate environment).Historically, these two groups have traded in roughly the samevaluation range. Post 2010, however, the valuations of these twogroups diverged as investors sought “bond substitutes”—mainly inthe Utilities, Real Estate, and Consumer Staples sectors—withhigher dividend yields in a lower interest rate environment. Theportfolio holds no utilities or real estate companies and has onlyone consumer staples holding (Molson Coors,b 0.8%c of the equityportfolio) because we believe many companies have inflatedvaluations in these sectors. Conversely, companies that benefitfrom rising interest rates—Financials, Energy, and someIndustrials—are almost all categorized as value stocks, and they arenow selling at extraordinary discounts relative to the market. As avalue-oriented manager, the equity portfolio remains overweightFinancials (29.0% of the equity portfolio versus 13.0% of the S&P500) and Energy (9.6% of the equity portfolio versus 4.3%).
We continue to identify attractive investment opportunitiesand have leaned into challenged areas of the market, such asEnergy and Industrials. At the same time, we also reevaluated theportfolio’s strong performers and significantly trimmed back severalof those large positions, including Charter Communications,Comcast, JPMorgan Chase, and Microsoft. During 2019, we addedmore to Energy than any other sector and trimmed the most fromCommunication Services, particularly in the Media industry.
EnergyEnergy companies have suffered from years of lower oil prices,which have reduced cash flows at many companies and made itmore difficult to invest in new projects. There are also long-termconcerns about oil and gas demand as the threat of climate changenecessitates a transition to less carbon-intensive alternatives.However, energy companies currently trade at low multiplesrelative to their history and to the broader market. We believe thevaluations of the equity portfolio’s energy holdings provide anattractive starting point and more than compensate for these risks.
During 2019, we increased the equity portfolio’s exposure toOccidental Petroleum, Concho Resources, Schlumberger, andHalliburton as valuations became more attractive. We alsorecently initiated a position in Hess, an independent oil and gasexploration and production company.
Hess: Hess is investing its strong cash flows from existing assetsinto a new project with significant production potential inGuyana. The company owns 30% of a partnership with ExxonMobil in the Stabroek block in the country, and this oil discoveryis already one of the largest in recent decades. Much of theStabroek block remains unexplored and Hess has interests inadditional blocks in Guyana and Suriname. Incrementaldiscoveries on these blocks could provide additional upside. Inaddition, the Guyana resource has some of the lowest developmentcosts outside of OPEC.d Higher incremental returns from thisinvestment should result in attractive free cash flow growth overthe next several years. Trading at nine times cash flow, Hess was a0.7% position in the equity portfolio at year end.
Media & EntertainmentWithin Communication Services, Media & Entertainment isanother overweight position in the equity portfolio: 11.9%compared to 8.2% for the S&P 500. The majority of the portfolio’sexposure relates to cable and satellite companies (Comcast,Charter Communications, and DISH Network). Comcast andCharter have strong potential to continue generating positive freecash flow and sustaining growth in broadband and businessservices. In addition, DISH has various options for the unrealizedvalue in its wireless spectrum holdings. The other holdings arecontent-related media companies (Alphabet/Google, Fox Corp.,and News Corp.) that offer scarcity value of premium content andgrowth in digital distribution outlets, advertising, andinternational markets.
The competitive landscape is rapidly evolving, due to growthin video streaming services (e.g., Netflix, Amazon, Hulu), changesin consumer viewing and listening habits, shifting revenue streams,and industry consolidation. Longer term, uncertainty surroundingpotential regulatory incursions (e.g., unbundling, forced wholesaleaccess, price regulation on broadband) and 5G fixed wireless as analternative to cable broadband also pose risks. However, we believethe portfolio’s media and entertainment holdings are trading atreasonable valuations in comparison to their growth prospects.
P A G E 2 ▪ D O D G E & C O X B A L A N C E D F U N D

In 2019, the portfolio’s media holdings outperformedsignificantly with Charter Communications and Comcast up 70%and 34%, respectively. Based on their solid performance andhigher valuations, we trimmed both Comcast and Charter.Nevertheless, they remain in the top-ten holdings of the equityportfolio. In addition, Walt Disney acquired the majority ofTwenty-First Century Fox’s assets and the Fund (a largeshareholder) primarily received cash as a result of this transaction.
FIXED INCOME STRATEGY
Over the year, we made a number of adjustments to the fixedincome portfolio’s positioning in light of higher credit marketvaluations and slightly less constructive economic fundamentals.Most notably, we trimmed multiple credite issuers and invested theproceeds in U.S. Treasuries.
The Credit Sector: Reduced Overal l Exposure, but Sti l lFinding Select Opportunit iesThe most meaningful change to positioning throughout 2019 wasan eight percentage point reduction in the portfolio’s creditweighting. Reductions were achieved through a combination ofmaturities, relative value-driven trims, and participation in tendersrelated to corporate liability management exercises. For example,we trimmed Verizon and sold Anheuser-Busch InBev. It isimportant to note that 2019 trims were, by and large, driven by aless attractive risk-reward tradeoff following strong performanceand subsequently higher valuations, rather than a deterioratingview of the issuers’ creditworthiness. Despite reducing theportfolio’s credit exposure generally, we remain on the lookout forindividual opportunities in credit, highlighted by the additions ofAbbVie, Occidental Petroleum, UniCredit, and Vodafone Groupover the course of the year. AbbVie, a biopharmaceutical companythat issued debt in November to help fund its acquisition ofAllergan, merits highlighting. In the coming years, we expect thecompany to generate tens of billions of dollars of free cash flow,which should enable it to pay down debt and improve its creditprofile.
The Securit ized Sector: Adding Liquidity andIncremental Yield at a Compell ing ValuationThe fixed income portfolio’s holdings in the Securitized sectorconsist predominantly of Agencyf mortgage-backed securities(MBS). As a group, these securities can provide attractive total-return potential in the front to intermediate part of the yieldcurve, and they continue to play an important role in the overallportfolio because of their generally substantial liquidity and highcredit quality.
Within MBS, the portfolio features a large position in 30-year4.5% coupon securities. This segment underperformed in 2019 asborrowers faced greater refinancing incentives because of thedecline in interest rates. Through our bottom-up, fundamentalresearch we attempt to measure—and assess whether investors arebeing appropriately compensated for—prepayment risk. Given ouranalysis, we believe this risk going forward is manageable for thesesecurities, and their favorable starting valuations make themattractive, especially relative to credit alternatives. Overall, we feel
the risk-reward equation in Agency MBS continues to lookcompelling given modest dollar prices and relatively wide spreads.
Defensive Duration: Mitigat ing the Risk of RisingRates over TimeWe continue to maintain the portfolio’s overall defensivedurationg position with respect to interest rate risk, reflecting ourlonger-term view that interest rates are still likely to exceedcurrent market expectations.
The portfolio’s relative interest rate positioning isunderpinned by two key factors. First, we believe recession risk islow and the U.S. economy is on solid footing. While we expectthe economy to slow toward trend growth (2% real GDP) as thefiscal stimulus fades, the strengths of the consumer sector and thelabor market should help it avoid a recession. In our view, U.S.Treasury valuations have swung too far in attempting to price in aperiod of low or negative growth. Second, the significant reductionin unemployment and the ensuing labor market tightening haveraised the prospect of more rapid wage growth and somewhathigher inflation than what many indicators are forecasting. Whilewe expect the Fed to keep short term rates steady, we believe thelong end of the curve will move higher over time. Given thesefactors and low starting yields, we believe it is important to remaindefensive in order to mitigate the negative effect of any bondmarket price declines that could stem from potential increases ininterest rates over time.
Inflat ion Expectat ions: An Addit ional Valuation-Driven OpportunityIn developing our economic forecasts, our team of analysts andtraders is constantly on the lookout for segments of the marketthat appear undervalued. One example is Treasury InflationProtected Securities (TIPS), where we recently established a smallposition in three-year securities. These securities look attractiverelative to other investment opportunities due to the low level ofinflation required to generate a competitive total return.
IN CLOSING
U.S. equity and fixed income returns in 2019 were very strong andcertainly not the norm. As a result of high starting equity andcredit market valuations, we caution investors to temperexpectations around future performance. Furthermore, the lowlevel of interest rates increases the risk of quite modest (or evennegative) returns for fixed income if yields rise substantially fromcurrent levels.
That said, we remain optimistic about the long-term outlookfor the Fund. The equity portfolio trades at a meaningful discountto the overall market: 13.5 times forward earningsh compared to18.9 times for the S&P 500. We have positioned the fixed incomeportfolio defensively from a duration standpoint, and we willcontinue to seek opportunities to build portfolio yield through ourbottom-up, research-driven investment approach. In addition, theFund is well diversified and features a variety of investmentthemes.
As a value-oriented manager, patience and persistence arealso essential to long-term investment success. We encourage our
D O D G E & C O X B A L A N C E D F U N D ▪ P A G E 3

shareholders to take a similar view. Thank you for your continuedconfidence in our firm. As always, we welcome your comments andquestions.
For the Board of Trustees,
Charles F. Pohl,Chairman
Dana M. Emery,President
January 31, 2020
a Sector returns as calculated and reported by Bloomberg.b The use of specific examples does not imply that they are more or less
attractive investments than the portfolio’s other holdings.c Unless otherwise specified, all weightings and characteristics are as of
December 31, 2019.d The Organization of the Petroleum Exporting Countries (OPEC) is an
intergovernmental organization of 13 nations.e Credit securities refers to corporate bonds and government-related securities,
as classified by Bloomberg.f The U.S. Government does not guarantee the Fund’s shares, yield, or net
asset value. The agency guarantee (by, for example, Ginnie Mae,Fannie Mae, or Freddie Mac) does not eliminate market risk.
g Duration is a measure of a bond’s (or a bond portfolio’s) price sensitivity tochanges in interest rates.
h Excludes the Fund’s preferred stock positions.
P A G E 4 ▪ D O D G E & C O X B A L A N C E D F U N D

2019 PERFORMANCE REVIEWThe Fund underperformed the Combined Index by 2.6percentage points in 2019. The positive relative impact of theFund’s lower allocation to fixed income was more than offset bythe equity portfolio’s underperformance.
Equity Portfol io*▪ The return for the S&P 500 was led by Information
Technology, which rose 50% in 2019. The Fund’s holdings,though up 27%, trailed significantly. The main driver wasnot owning a few of the large, exceptional performers thatboosted the S&P 500 sector, especially Apple. Weakperformance from holdings, including HP Inc. and JuniperNetworks, was also a factor.
▪ The portfolio was overweight (average 10% versus 5%) andunderperformed in the Energy sector (up 10% compared toup 12% for the S&P 500 sector), which was the weakest areaof the Index by a considerable margin. Occidental Petroleumand Apache were the main detractors.
▪ In the Media industry, the portfolio was overweight (average9% versus 1%) and outperformed (holdings up 45%compared to up 36% for the S&P 500 industry). CharterCommunications and Comcast were key positives.
Fixed Income Portfol io▪ Security selection within credit was positive as several issuers
performed well, including Citigroup capital securities, Enel,Pemex, Petrobras, Rio Oil Finance Trust, TC Energy, andTelecom Italia.
▪ The portfolio’s overweight to corporate bonds andunderweight to U.S. Treasuries added to relative returnsgiven the outperformance of credit.
▪ The portfolio’s below-benchmark duration position (72%**of the Bloomberg Barclays U.S. Agg’s duration) hamperedrelative returns as Treasury yields declined.
* Excludes the Fund’s preferred stock positions.** Denotes Fund positioning at the beginning of the period.
KEY CHARACTERISTICS OF DODGE & COXIndependent Organizat ionDodge & Cox is one of the largest privately owned investmentmanagers in the world. We remain committed to independence,with a goal of providing the highest quality investmentmanagement service to our existing clients.
90 Years of Investment ExperienceDodge & Cox was founded in 1930. We have a stable and well-qualified team of investment professionals, most of whom havespent their entire careers at Dodge & Cox.
Experienced Investment TeamThe U.S. Equity Investment Committee, which is responsiblefor determining the asset allocation of the Balanced Fund andmanaging the equity portion of the Balanced Fund, is a ten-member committee with an average tenure at Dodge & Cox of24 years. The U.S. Fixed Income Investment Committee, whichis responsible for managing the debt portion of the BalancedFund, is a nine-member committee with an average tenure of20 years.
One Business with a Single Research OfficeDodge & Cox manages equity (domestic, international, andglobal), fixed income (domestic and global), and balancedinvestments, operating from one office in San Francisco.
Consistent Investment ApproachOur team decision-making process involves thorough, bottom-up fundamental analysis of each investment.
Long-Term Focus and Low ExpensesWe invest with a three- to five-year investment horizon, whichhas historically resulted in low turnover relative to our peers.We manage Funds that maintain low expense ratios.
Risks: The Fund is subject to market risk, meaning holdings inthe Fund may decline in value for extended periods due to thefinancial prospects of individual companies or due to generalmarket and economic conditions. The Fund also invests inindividual bonds whose yields and market values fluctuate, sothat an investment may be worth more or less than its originalcost. Debt securities are subject to interest rate risk, credit risk,and prepayment and call risk, all of which could have adverseeffects on the value of the Fund. A low interest rateenvironment creates an elevated risk of future negative returns.Financial intermediaries may restrict their market makingactivities for certain debt securities, which may reduce theliquidity and increase the volatility of such securities. Please readthe prospectus and summary prospectus for specific detailsregarding the Fund’s risk profile.
D O D G E & C O X B A L A N C E D F U N D ▪ P A G E 5

GROWTH OF $10,000 OVER 10 YEARSFOR AN INVESTMENT MADE ON DECEMBER 31, 2009
12/31/09 12/31/11 12/31/13 12/31/15 12/31/17 12/31/195,000
10,000
$60,000
20,000
30,000
50,000
40,000
Dodge & Cox Balanced Fund $26,546
Combined Index$25,414
S&P 500 Index $35,667
Bloomberg Barclays U.S.Agg $14,445
AVERAGE ANNUAL TOTAL RETURNFOR PERIODS ENDED DECEMBER 31, 2019
1 Year 5 Years 10 Years 20 Years
Dodge & Cox Balanced Fund 19.62% 7.78% 10.25% 8.21%S&P 500 Index 31.49 11.70 13.56 6.06Bloomberg Barclays U.S. Aggregate
Bond Index (Bloomberg BarclaysU.S. Agg) 8.72 3.05 3.75 5.03
Combined Index(a) 22.18 8.39 9.78 5.95
Returns represent past performance and do not guarantee futureresults. Investment return and share price will fluctuate withmarket conditions, and investors may have a gain or loss whenshares are sold. Fund performance changes over time and currentlymay be significantly lower than stated. Performance is updated andpublished monthly. Visit the Fund’s website at dodgeandcox.comor call 800-621-3979 for current performance figures.
The Fund’s total returns include the reinvestment of dividend andcapital gain distributions, but have not been adjusted for any incometaxes payable by shareholders on these distributions or on Fund shareredemptions. Index returns include dividends and/or interest incomebut, unlike Fund returns, do not reflect fees or expenses.
Standard & Poor’s, Standard & Poor’s 500, and S&P 500® aretrademarks of S&P Global Inc. Bloomberg is a registered trademark ofBloomberg Finance L.P. and its affiliates. Barclays® is a trademark ofBarclays Bank PLC.
(a) The Combined Index reflects an unmanaged portfolio (rebalancedmonthly) of 60% of the S&P 500 Index, which is a market capitalization-weighted index of 500 large-capitalization stocks commonly used torepresent the U.S. equity market, and 40% of the Bloomberg Barclays U.S.Aggregate Bond Index (Bloomberg Barclays U.S. Agg), which is a widelyrecognized, unmanaged index of U.S. dollar-denominated, investment-grade, taxable fixed income securities. The Fund may, however, invest upto 75% of its total assets in equity securities.
FUND EXPENSE EXAMPLEAs a Fund shareholder, you incur ongoing Fund costs, including management fees and other Fund expenses. All mutual funds have ongoingcosts, sometimes referred to as operating expenses. The following example shows ongoing costs of investing in the Fund and can help youunderstand these costs and compare them with those of other mutual funds. The example assumes a $1,000 investment held for the sixmonths indicated.
ACTUAL EXPENSES
The first line of the table below provides information about actual account values and expenses based on the Fund’s actual returns. You mayuse the information in this line, together with your account balance, to estimate the expenses that you paid over the period. Simply divideyour account value by $1,000 (for example, an $8,600 account value divided by $1,000 = 8.6), then multiply the result by the number in thefirst line under the heading “Expenses Paid During Period” to estimate the expenses you paid on your account during this period.
HYPOTHETICAL EXAMPLE FOR COMPARISON WITH OTHER MUTUAL FUNDS
Information on the second line of the table can help you compare ongoing costs of investing in the Fund with those of other mutual funds.This information may not be used to estimate the actual ending account balance or expenses you paid during the period. The hypothetical“Ending Account Value” is based on the actual expense ratio of the Fund and an assumed 5% annual rate of return before expenses (not theFund’s actual return). The amount under the heading “Expenses Paid During Period” shows the hypothetical expenses your account wouldhave incurred under this scenario. You can compare this figure with the 5% hypothetical examples that appear in shareholder reports ofother mutual funds.
Six Months EndedDecember 31, 2019
Beginning Account Value7/1/2019
Ending Account Value12/31/2019
Expenses PaidDuring Period*
Based on Actual Fund Return $1,000.00 $1,080.50 $2.74Based on Hypothetical 5% Yearly Return 1,000.00 1,022.57 2.66
* Expenses are equal to the Fund’s annualized expense ratio of 0.52%, multiplied by the average account value over the period, multiplied by 184/365 (to reflect theone-half year period).
The expenses shown in the table highlight ongoing costs only and do not reflect any transactional fees or account maintenance fees.Though other mutual funds may charge such fees, please note that the Fund does not charge transaction fees (e.g., redemption fees, salesloads) or universal account maintenance fees (e.g., small account fees).
P A G E 6 ▪ D O D G E & C O X B A L A N C E D F U N D

PORTFOLIO INFORMATION December 31, 2019
ASSET ALLOCATION
CommonStocks: 65.2%
Net Cash & Other:(a)
1.5%
DebtSecurities: 30.4%
Preferred Stocks:2.9%
FIVE LARGEST EQUITYSECTORS (%) Common Preferred % of Net Assets
Financials 17.3 2.5 19.8Health Care 14.8 — 14.8Information Technology 10.2 — 10.2Communication Services 8.0 0.3 8.4Energy 6.5 — 6.5
FIXED INCOME SECTORDIVERSIFICATION (%) % of Net Assets
U.S. Treasury 6.6Government-Related 1.3Securitized 12.2Corporate 10.3
(a) Net Cash & Other includes cash, short-term investments, derivatives, receivables, and payables.
D O D G E & C O X B A L A N C E D F U N D ▪ P A G E 7
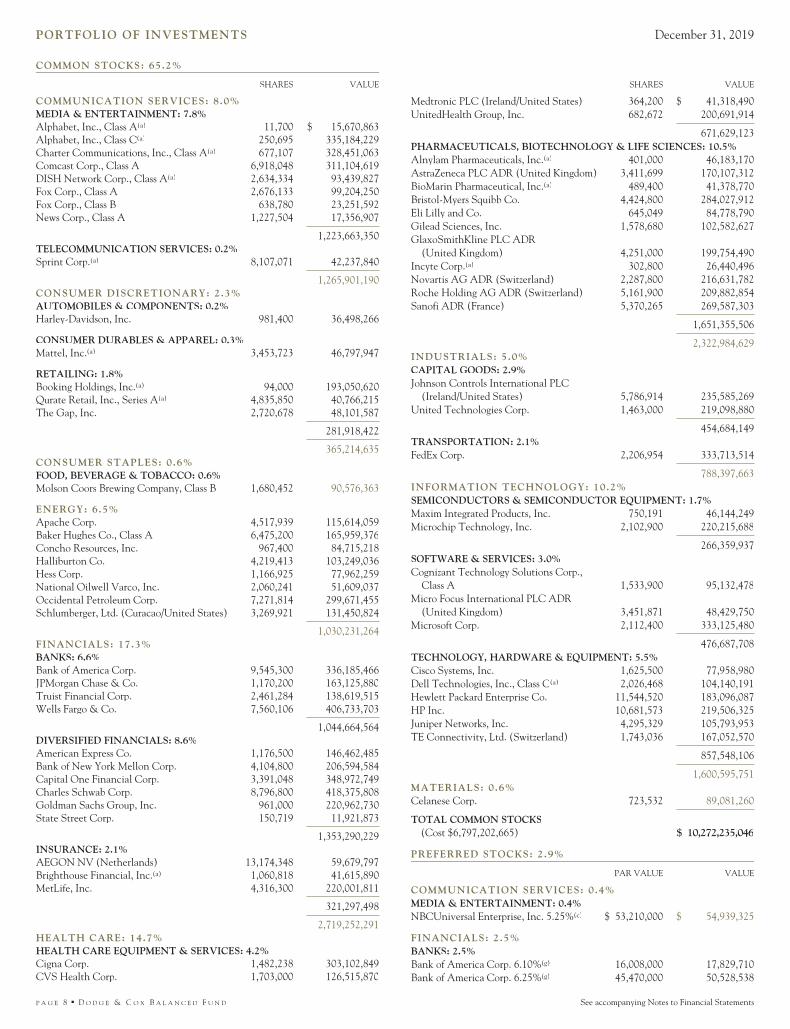
PORTFOLIO OF INVESTMENTS December 31, 2019
COMMON STOCKS: 65.2%
SHARES VALUE
COMMUNICATION SERVICES: 8.0%MEDIA & ENTERTAINMENT: 7.8%Alphabet, Inc., Class A(a) 11,700 $ 15,670,863Alphabet, Inc., Class C(a) 250,695 335,184,229Charter Communications, Inc., Class A(a) 677,107 328,451,063Comcast Corp., Class A 6,918,048 311,104,619DISH Network Corp., Class A(a) 2,634,334 93,439,827Fox Corp., Class A 2,676,133 99,204,250Fox Corp., Class B 638,780 23,251,592News Corp., Class A 1,227,504 17,356,907
1,223,663,350TELECOMMUNICATION SERVICES: 0.2%Sprint Corp.(a) 8,107,071 42,237,840
1,265,901,190CONSUMER DISCRETIONARY: 2.3%AUTOMOBILES & COMPONENTS: 0.2%Harley-Davidson, Inc. 981,400 36,498,266
CONSUMER DURABLES & APPAREL: 0.3%Mattel, Inc.(a) 3,453,723 46,797,947
RETAILING: 1.8%Booking Holdings, Inc.(a) 94,000 193,050,620Qurate Retail, Inc., Series A(a) 4,835,850 40,766,215The Gap, Inc. 2,720,678 48,101,587
281,918,422
365,214,635CONSUMER STAPLES: 0.6%FOOD, BEVERAGE & TOBACCO: 0.6%Molson Coors Brewing Company, Class B 1,680,452 90,576,363
ENERGY: 6.5%Apache Corp. 4,517,939 115,614,059Baker Hughes Co., Class A 6,475,200 165,959,376Concho Resources, Inc. 967,400 84,715,218Halliburton Co. 4,219,413 103,249,036Hess Corp. 1,166,925 77,962,259National Oilwell Varco, Inc. 2,060,241 51,609,037Occidental Petroleum Corp. 7,271,814 299,671,455Schlumberger, Ltd. (Curacao/United States) 3,269,921 131,450,824
1,030,231,264FINANCIALS: 17.3%BANKS: 6.6%Bank of America Corp. 9,545,300 336,185,466JPMorgan Chase & Co. 1,170,200 163,125,880Truist Financial Corp. 2,461,284 138,619,515Wells Fargo & Co. 7,560,106 406,733,703
1,044,664,564DIVERSIFIED FINANCIALS: 8.6%American Express Co. 1,176,500 146,462,485Bank of New York Mellon Corp. 4,104,800 206,594,584Capital One Financial Corp. 3,391,048 348,972,749Charles Schwab Corp. 8,796,800 418,375,808Goldman Sachs Group, Inc. 961,000 220,962,730State Street Corp. 150,719 11,921,873
1,353,290,229INSURANCE: 2.1%AEGON NV (Netherlands) 13,174,348 59,679,797Brighthouse Financial, Inc.(a) 1,060,818 41,615,890MetLife, Inc. 4,316,300 220,001,811
321,297,498
2,719,252,291HEALTH CARE: 14.7%HEALTH CARE EQUIPMENT & SERVICES: 4.2%Cigna Corp. 1,482,238 303,102,849CVS Health Corp. 1,703,000 126,515,870
SHARES VALUE
Medtronic PLC (Ireland/United States) 364,200 $ 41,318,490UnitedHealth Group, Inc. 682,672 200,691,914
671,629,123PHARMACEUTICALS, BIOTECHNOLOGY & LIFE SCIENCES: 10.5%Alnylam Pharmaceuticals, Inc.(a) 401,000 46,183,170AstraZeneca PLC ADR (United Kingdom) 3,411,699 170,107,312BioMarin Pharmaceutical, Inc.(a) 489,400 41,378,770Bristol-Myers Squibb Co. 4,424,800 284,027,912Eli Lilly and Co. 645,049 84,778,790Gilead Sciences, Inc. 1,578,680 102,582,627GlaxoSmithKline PLC ADR
(United Kingdom) 4,251,000 199,754,490Incyte Corp.(a) 302,800 26,440,496Novartis AG ADR (Switzerland) 2,287,800 216,631,782Roche Holding AG ADR (Switzerland) 5,161,900 209,882,854Sanofi ADR (France) 5,370,265 269,587,303
1,651,355,506
2,322,984,629INDUSTRIALS: 5.0%CAPITAL GOODS: 2.9%Johnson Controls International PLC
(Ireland/United States) 5,786,914 235,585,269United Technologies Corp. 1,463,000 219,098,880
454,684,149TRANSPORTATION: 2.1%FedEx Corp. 2,206,954 333,713,514
788,397,663INFORMATION TECHNOLOGY: 10.2%SEMICONDUCTORS & SEMICONDUCTOR EQUIPMENT: 1.7%Maxim Integrated Products, Inc. 750,191 46,144,249Microchip Technology, Inc. 2,102,900 220,215,688
266,359,937SOFTWARE & SERVICES: 3.0%Cognizant Technology Solutions Corp.,
Class A 1,533,900 95,132,478Micro Focus International PLC ADR
(United Kingdom) 3,451,871 48,429,750Microsoft Corp. 2,112,400 333,125,480
476,687,708TECHNOLOGY, HARDWARE & EQUIPMENT: 5.5%Cisco Systems, Inc. 1,625,500 77,958,980Dell Technologies, Inc., Class C(a) 2,026,468 104,140,191Hewlett Packard Enterprise Co. 11,544,520 183,096,087HP Inc. 10,681,573 219,506,325Juniper Networks, Inc. 4,295,329 105,793,953TE Connectivity, Ltd. (Switzerland) 1,743,036 167,052,570
857,548,106
1,600,595,751MATERIALS: 0.6%Celanese Corp. 723,532 89,081,260
TOTAL COMMON STOCKS(Cost $6,797,202,665) $ 10,272,235,046
PREFERRED STOCKS: 2.9%
PAR VALUE VALUE
COMMUNICATION SERVICES: 0.4%MEDIA & ENTERTAINMENT: 0.4%NBCUniversal Enterprise, Inc. 5.25%(c) $ 53,210,000 $ 54,939,325
FINANCIALS: 2.5%BANKS: 2.5%Bank of America Corp. 6.10%(g) 16,008,000 17,829,710Bank of America Corp. 6.25%(g) 45,470,000 50,528,538
P A G E 8 ▪ D O D G E & C O X B A L A N C E D F U N D See accompanying Notes to Financial Statements
PORTFOLIO OF INVESTMENTS December 31, 2019
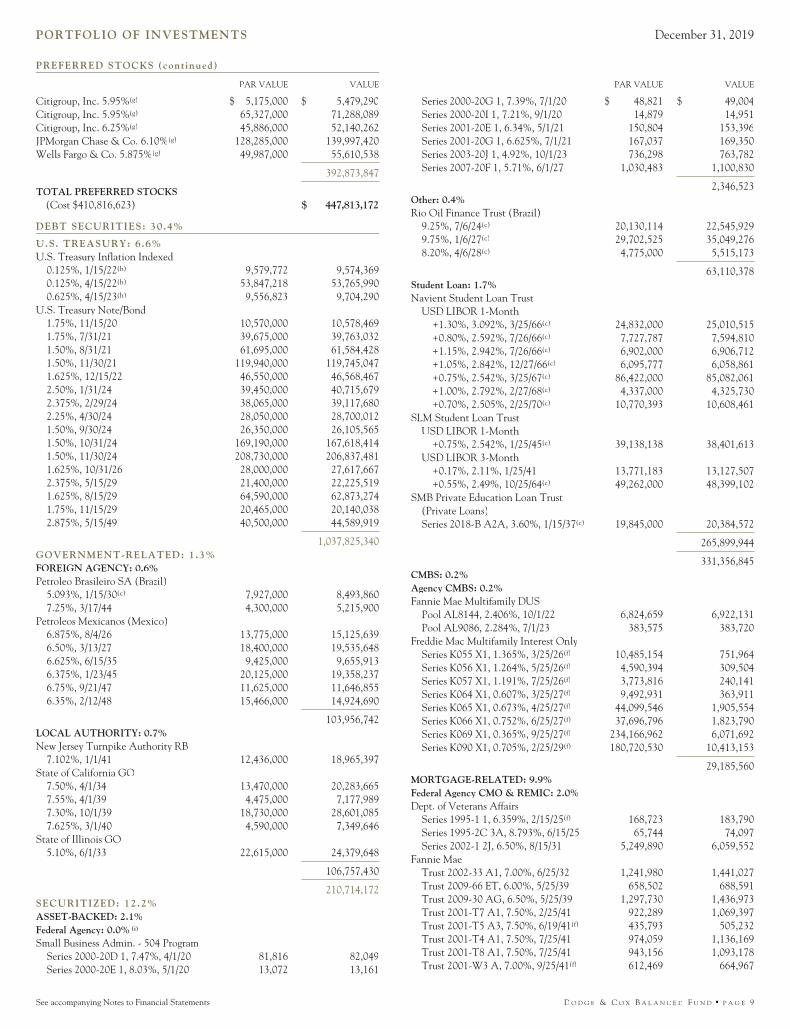
PREFERRED STOCKS (continued)
PAR VALUE VALUE
Citigroup, Inc. 5.95%(g) $ 5,175,000 $ 5,479,290Citigroup, Inc. 5.95%(g) 65,327,000 71,288,089Citigroup, Inc. 6.25%(g) 45,886,000 52,140,262JPMorgan Chase & Co. 6.10%(g) 128,285,000 139,997,420Wells Fargo & Co. 5.875%(g) 49,987,000 55,610,538
392,873,847
TOTAL PREFERRED STOCKS(Cost $410,816,623) $ 447,813,172
DEBT SECURITIES: 30.4%
U.S. TREASURY: 6.6%U.S. Treasury Inflation Indexed
0.125%, 1/15/22(h) 9,579,772 9,574,3690.125%, 4/15/22(h) 53,847,218 53,765,9900.625%, 4/15/23(h) 9,556,823 9,704,290
U.S. Treasury Note/Bond1.75%, 11/15/20 10,570,000 10,578,4691.75%, 7/31/21 39,675,000 39,763,0321.50%, 8/31/21 61,695,000 61,584,4281.50%, 11/30/21 119,940,000 119,745,0471.625%, 12/15/22 46,550,000 46,568,4672.50%, 1/31/24 39,450,000 40,715,6792.375%, 2/29/24 38,065,000 39,117,6802.25%, 4/30/24 28,050,000 28,700,0121.50%, 9/30/24 26,350,000 26,105,5651.50%, 10/31/24 169,190,000 167,618,4141.50%, 11/30/24 208,730,000 206,837,4811.625%, 10/31/26 28,000,000 27,617,6672.375%, 5/15/29 21,400,000 22,225,5191.625%, 8/15/29 64,590,000 62,873,2741.75%, 11/15/29 20,465,000 20,140,0382.875%, 5/15/49 40,500,000 44,589,919
1,037,825,340GOVERNMENT-RELATED: 1.3%FOREIGN AGENCY: 0.6%Petroleo Brasileiro SA (Brazil)
5.093%, 1/15/30(c) 7,927,000 8,493,8607.25%, 3/17/44 4,300,000 5,215,900
Petroleos Mexicanos (Mexico)6.875%, 8/4/26 13,775,000 15,125,6396.50%, 3/13/27 18,400,000 19,535,6486.625%, 6/15/35 9,425,000 9,655,9136.375%, 1/23/45 20,125,000 19,358,2376.75%, 9/21/47 11,625,000 11,646,8556.35%, 2/12/48 15,466,000 14,924,690
103,956,742LOCAL AUTHORITY: 0.7%New Jersey Turnpike Authority RB
7.102%, 1/1/41 12,436,000 18,965,397State of California GO
7.50%, 4/1/34 13,470,000 20,283,6657.55%, 4/1/39 4,475,000 7,177,9897.30%, 10/1/39 18,730,000 28,601,0857.625%, 3/1/40 4,590,000 7,349,646
State of Illinois GO5.10%, 6/1/33 22,615,000 24,379,648
106,757,430
210,714,172SECURITIZED: 12.2%ASSET-BACKED: 2.1%Federal Agency: 0.0% (i)
Small Business Admin. - 504 ProgramSeries 2000-20D 1, 7.47%, 4/1/20 81,816 82,049Series 2000-20E 1, 8.03%, 5/1/20 13,072 13,161
PAR VALUE VALUE
Series 2000-20G 1, 7.39%, 7/1/20 $ 48,821 $ 49,004Series 2000-20I 1, 7.21%, 9/1/20 14,879 14,951Series 2001-20E 1, 6.34%, 5/1/21 150,804 153,396Series 2001-20G 1, 6.625%, 7/1/21 167,037 169,350Series 2003-20J 1, 4.92%, 10/1/23 736,298 763,782Series 2007-20F 1, 5.71%, 6/1/27 1,030,483 1,100,830
2,346,523Other: 0.4%Rio Oil Finance Trust (Brazil)
9.25%, 7/6/24(c) 20,130,114 22,545,9299.75%, 1/6/27(c) 29,702,525 35,049,2768.20%, 4/6/28(c) 4,775,000 5,515,173
63,110,378Student Loan: 1.7%Navient Student Loan Trust
USD LIBOR 1-Month+1.30%, 3.092%, 3/25/66(c) 24,832,000 25,010,515+0.80%, 2.592%, 7/26/66(c) 7,727,787 7,594,810+1.15%, 2.942%, 7/26/66(c) 6,902,000 6,906,712+1.05%, 2.842%, 12/27/66(c) 6,095,777 6,058,861+0.75%, 2.542%, 3/25/67(c) 86,422,000 85,082,061+1.00%, 2.792%, 2/27/68(c) 4,337,000 4,325,730+0.70%, 2.505%, 2/25/70(c) 10,770,393 10,608,461
SLM Student Loan TrustUSD LIBOR 1-Month
+0.75%, 2.542%, 1/25/45(c) 39,138,138 38,401,613USD LIBOR 3-Month
+0.17%, 2.11%, 1/25/41 13,771,183 13,127,507+0.55%, 2.49%, 10/25/64(c) 49,262,000 48,399,102
SMB Private Education Loan Trust(Private Loans)Series 2018-B A2A, 3.60%, 1/15/37(c) 19,845,000 20,384,572
265,899,944
331,356,845CMBS: 0.2%Agency CMBS: 0.2%Fannie Mae Multifamily DUS
Pool AL8144, 2.406%, 10/1/22 6,824,659 6,922,131Pool AL9086, 2.284%, 7/1/23 383,575 383,720
Freddie Mac Multifamily Interest OnlySeries K055 X1, 1.365%, 3/25/26(f) 10,485,154 751,964Series K056 X1, 1.264%, 5/25/26(f) 4,590,394 309,504Series K057 X1, 1.191%, 7/25/26(f) 3,773,816 240,141Series K064 X1, 0.607%, 3/25/27(f) 9,492,931 363,911Series K065 X1, 0.673%, 4/25/27(f) 44,099,546 1,905,554Series K066 X1, 0.752%, 6/25/27(f) 37,696,796 1,823,790Series K069 X1, 0.365%, 9/25/27(f) 234,166,962 6,071,692Series K090 X1, 0.705%, 2/25/29(f) 180,720,530 10,413,153
29,185,560MORTGAGE-RELATED: 9.9%Federal Agency CMO & REMIC: 2.0%Dept. of Veterans Affairs
Series 1995-1 1, 6.359%, 2/15/25(f) 168,723 183,790Series 1995-2C 3A, 8.793%, 6/15/25 65,744 74,097Series 2002-1 2J, 6.50%, 8/15/31 5,249,890 6,059,552
Fannie MaeTrust 2002-33 A1, 7.00%, 6/25/32 1,241,980 1,441,027Trust 2009-66 ET, 6.00%, 5/25/39 658,502 688,591Trust 2009-30 AG, 6.50%, 5/25/39 1,297,730 1,436,973Trust 2001-T7 A1, 7.50%, 2/25/41 922,289 1,069,397Trust 2001-T5 A3, 7.50%, 6/19/41(f) 435,793 505,232Trust 2001-T4 A1, 7.50%, 7/25/41 974,059 1,136,169Trust 2001-T8 A1, 7.50%, 7/25/41 943,156 1,093,178Trust 2001-W3 A, 7.00%, 9/25/41(f) 612,469 664,967
See accompanying Notes to Financial Statements D O D G E & C O X B A L A N C E D F U N D ▪ P A G E 9

PORTFOLIO OF INVESTMENTS December 31, 2019
DEBT SECURITIES (continued)
PAR VALUE VALUE
Trust 2001-T10 A2, 7.50%, 12/25/41 $ 615,480 $ 686,188Trust 2013-106 MA, 4.00%, 2/25/42 6,548,401 6,937,388Trust 2002-W6 2A1, 7.00%, 6/25/42(f) 984,516 1,090,052Trust 2002-W8 A2, 7.00%, 6/25/42 1,285,120 1,500,452Trust 2003-W2 1A1, 6.50%, 7/25/42 2,126,033 2,415,944Trust 2003-W2 1A2, 7.00%, 7/25/42 826,539 962,616Trust 2003-W4 4A, 6.274%, 10/25/42(f) 1,062,570 1,207,131Trust 2012-121 NB, 7.00%, 11/25/42 1,395,635 1,636,046Trust 2004-T1 1A2, 6.50%, 1/25/44 962,084 1,097,026Trust 2004-W2 5A, 7.50%, 3/25/44 1,744,178 1,982,639Trust 2004-W8 3A, 7.50%, 6/25/44 303,989 353,560Trust 2005-W4 1A2, 6.50%, 8/25/45 3,108,400 3,542,913Trust 2009-11 MP, 7.00%, 3/25/49 2,714,498 3,175,249USD LIBOR 1-Month
+0.55%, 2.342%, 9/25/43 5,784,691 5,825,182Freddie Mac
Series 16 PK, 7.00%, 8/25/23 687,476 725,881Series T-48 1A4, 5.538%, 7/25/33 20,097,607 22,108,906Series T-51 1A, 6.50%, 9/25/43(f) 139,081 163,526Series T-59 1A1, 6.50%, 10/25/43 7,177,870 8,523,645Series 4281 BC, 4.50%, 12/15/43(f) 36,335,635 38,960,318USD LIBOR 1-Month
+0.61%, 2.35%, 9/15/43 13,142,385 13,171,318Ginnie Mae
USD LIBOR 1-Month+0.62%, 2.394%, 9/20/64 3,446,533 3,443,779
USD LIBOR 12-Month+0.30%, 3.42%, 1/20/67 23,579,472 23,415,667+0.23%, 2.204%, 10/20/67 21,784,875 21,496,217+0.23%, 2.204%, 10/20/67 13,018,677 12,853,017+0.06%, 3.062%, 12/20/67 33,693,641 33,030,429+0.08%, 2.817%, 5/20/68 9,378,947 9,172,817+0.25%, 2.453%, 6/20/68 28,931,058 28,512,275+0.28%, 3.159%, 11/20/68 42,233,964 41,724,428+0.25%, 3.25%, 12/20/68 4,422,407 4,353,904
308,421,486Federal Agency Mortgage Pass-Through: 7.9%Fannie Mae, 15 Year
6.00%, 3/1/22 61,236 62,3694.50%, 1/1/25-1/1/27 5,515,818 5,791,9483.50%, 11/1/25-12/1/29 16,723,846 17,344,539
Fannie Mae, 20 Year4.00%, 11/1/30-2/1/37 33,735,354 35,893,6384.50%, 1/1/31-12/1/34 50,857,707 54,514,2023.50%, 6/1/35-4/1/37 63,314,243 65,882,495
Fannie Mae, 30 Year6.50%, 12/1/28-8/1/39 12,054,938 13,730,2465.50%, 7/1/33-8/1/37 7,836,298 8,809,1336.00%, 9/1/36-8/1/37 10,914,238 12,516,4317.00%, 8/1/37 299,601 342,3244.50%, 1/1/39-3/1/49 382,635,325 406,709,8205.00%, 12/1/48-3/1/49 18,412,330 19,686,200
Fannie Mae, 40 Year4.50%, 6/1/56 32,746,026 35,511,608
Fannie Mae, Hybrid ARM(f)
1-Year U.S. Treasury CMT+2.05%, 4.163%, 9/1/34 675,357 708,510
USD LIBOR 12-Month+1.32%, 3.402%, 12/1/34 838,054 864,182+1.58%, 4.283%, 1/1/35 737,068 768,509+1.54%, 3.86%, 8/1/35 516,607 540,072+1.64%, 4.684%, 5/1/37 619,879 641,946+1.80%, 4.545%, 7/1/39 357,109 368,275+1.78%, 3.779%, 11/1/40 1,123,287 1,174,465+1.78%, 3.723%, 12/1/40 2,548,581 2,659,444
PAR VALUE VALUE
+1.58%, 3.663%, 11/1/43 $ 1,915,577 $ 1,975,842+1.55%, 4.59%, 4/1/44 4,849,680 5,001,072+1.60%, 2.802%, 11/1/44 11,290,002 11,478,321+1.60%, 2.783%, 12/1/44 9,289,326 9,475,426+1.59%, 2.916%, 9/1/45 2,278,140 2,321,208+1.59%, 2.846%, 12/1/45 12,310,796 12,543,275+1.59%, 2.661%, 1/1/46 11,203,963 11,396,236+1.61%, 2.961%, 4/1/46 6,775,109 6,882,502+1.61%, 2.521%, 12/1/46 10,726,748 10,770,619+1.61%, 3.157%, 6/1/47 9,161,023 9,333,255+1.61%, 3.128%, 7/1/47 12,717,123 12,958,240+1.60%, 2.707%, 8/1/47 16,870,326 17,174,160+1.61%, 3.335%, 1/1/49 10,469,234 10,698,979
USD LIBOR 6-Month+1.53%, 3.61%, 1/1/35 801,735 827,866
Freddie Mac, Hybrid ARM(f)
1-Year U.S. Treasury CMT+2.25%, 4.118%, 10/1/35 1,592,219 1,685,463
USD LIBOR 12-Month+1.96%, 4.836%, 5/1/34 1,137,352 1,201,146+1.55%, 4.442%, 4/1/37 1,292,542 1,350,624+1.80%, 4.045%, 9/1/37 922,443 970,934+1.87%, 4.089%, 1/1/38 161,972 165,543+2.07%, 5.193%, 2/1/38 1,237,356 1,300,593+1.92%, 4.446%, 7/1/38 113,322 117,764+1.73%, 4.294%, 10/1/38 474,800 493,389+1.79%, 3.596%, 10/1/41 698,334 723,045+1.79%, 4.545%, 8/1/42 2,012,365 2,078,765+1.62%, 2.962%, 5/1/44 8,101,351 8,270,751+1.61%, 3.029%, 5/1/44 1,153,003 1,176,432+1.62%, 2.949%, 6/1/44 2,578,773 2,630,189+1.62%, 3.156%, 6/1/44 2,066,815 2,111,710+1.63%, 3.071%, 1/1/45 12,290,211 12,542,358+1.62%, 2.722%, 10/1/45 6,899,727 7,010,644+1.62%, 2.834%, 10/1/45 6,244,966 6,353,501+1.63%, 3.233%, 7/1/47 8,083,316 8,242,864
Freddie Mac Gold, 15 Year4.50%, 9/1/24-9/1/26 3,746,216 3,908,033
Freddie Mac Gold, 20 Year6.50%, 10/1/26 2,059,351 2,287,3764.50%, 4/1/31-6/1/31 6,691,696 7,194,181
Freddie Mac Gold, 30 Year7.75%, 7/25/21 26,304 26,2867.47%, 3/17/23 37,077 37,5256.50%, 12/1/32-4/1/33 3,623,585 4,070,0947.00%, 11/1/37-9/1/38 2,994,022 3,465,1385.50%, 12/1/37 417,227 468,2386.00%, 2/1/39 1,044,042 1,197,6334.50%, 9/1/41-10/1/48 299,190,526 318,485,206
Freddie Mac Pool, 15 Year3.50%, 6/1/34 43,813,717 45,415,879
Ginnie Mae, 30 Year7.97%, 4/15/20-1/15/21 5,168 5,1837.50%, 11/15/24-10/15/25 318,835 342,909
1,252,686,753
1,561,108,239
1,921,650,644CORPORATE: 10.3%FINANCIALS: 3.5%Bank of America Corp.
3.004%, 12/20/23(g) 44,918,000 46,000,4614.20%, 8/26/24 5,825,000 6,252,4684.45%, 3/3/26 3,970,000 4,356,7584.25%, 10/22/26 2,970,000 3,236,5924.183%, 11/25/27 7,925,000 8,584,069
P A G E 1 0 ▪ D O D G E & C O X B A L A N C E D F U N D See accompanying Notes to Financial Statements

PORTFOLIO OF INVESTMENTS December 31, 2019
DEBT SECURITIES (continued)
PAR VALUE VALUE
Barclays PLC (United Kingdom)4.375%, 9/11/24 $ 18,275,000 $ 19,183,7344.836%, 5/9/28 9,525,000 10,260,469
BNP Paribas SA (France)4.25%, 10/15/24 36,700,000 39,341,0014.375%, 9/28/25(c) 8,223,000 8,850,1174.625%, 3/13/27(c) 9,775,000 10,680,881
Boston Properties, Inc.3.125%, 9/1/23 17,550,000 18,100,5403.80%, 2/1/24 5,000,000 5,285,3513.65%, 2/1/26 4,450,000 4,711,036
Capital One Financial Corp.3.50%, 6/15/23 10,581,000 10,989,0614.20%, 10/29/25 10,175,000 10,972,494
Citigroup, Inc.USD LIBOR 3-Month+6.37%, 8.306%, 10/30/40(b) 37,080,925 41,159,827
Equity Residential3.00%, 4/15/23 14,775,000 15,207,7972.85%, 11/1/26 6,000,000 6,151,649
HSBC Holdings PLC (United Kingdom)3.95%, 5/18/24(g) 14,500,000 15,246,8964.30%, 3/8/26 11,462,000 12,470,6486.50%, 5/2/36 23,805,000 32,472,4196.50%, 9/15/37 8,265,000 11,366,714
JPMorgan Chase & Co.8.75%, 9/1/30(b) 25,692,000 37,428,213
Lloyds Banking Group PLC(United Kingdom)4.50%, 11/4/24 19,575,000 20,917,4464.65%, 3/24/26 10,875,000 11,816,332
Royal Bank of Scotland Group PLC(United Kingdom)6.125%, 12/15/22 43,156,000 47,212,4396.00%, 12/19/23 16,825,000 18,699,330
UniCredit SPA (Italy)7.296%, 4/2/34(c)(g) 23,425,000 26,916,076
Unum Group7.25%, 3/15/28 1,526,000 1,885,5206.75%, 12/15/28 11,368,000 14,113,620
Wells Fargo & Co.4.10%, 6/3/26 3,376,000 3,637,6324.30%, 7/22/27 16,645,000 18,222,007
541,729,597INDUSTRIALS: 6.3%AbbVie, Inc.
3.20%, 11/21/29(c) 17,575,000 17,868,0534.05%, 11/21/39(c) 10,550,000 11,149,3374.25%, 11/21/49(c) 5,250,000 5,525,327
AT&T, Inc.5.35%, 9/1/40 27,575,000 33,199,2864.75%, 5/15/46 3,500,000 3,949,5535.65%, 2/15/47 5,175,000 6,583,249
Bayer AG (Germany)3.875%, 12/15/23(c) 7,775,000 8,155,9534.25%, 12/15/25(c) 6,600,000 7,115,4384.375%, 12/15/28(c) 26,300,000 28,671,514
Burlington Northern Santa Fe LLC(e)
5.72%, 1/15/24 2,614,083 2,785,7335.342%, 4/1/24 4,955,995 5,200,6745.629%, 4/1/24 8,040,615 8,508,898
Cemex SAB de CV (Mexico)6.00%, 4/1/24(c) 6,877,000 7,069,6255.70%, 1/11/25(c) 22,475,000 23,093,2876.125%, 5/5/25(c) 12,870,000 13,352,754
PAR VALUE VALUE
Charter Communications, Inc.4.125%, 2/15/21 $ 5,547,000 $ 5,635,7706.55%, 5/1/37 11,000,000 13,466,1826.75%, 6/15/39 6,160,000 7,805,6886.484%, 10/23/45 38,477,000 47,983,9095.375%, 5/1/47 4,100,000 4,586,9875.75%, 4/1/48 12,300,000 14,325,467
Cigna Corp.3.75%, 7/15/23 16,900,000 17,712,4834.125%, 11/15/25 4,100,000 4,444,7837.875%, 5/15/27(c) 17,587,000 22,798,6564.375%, 10/15/28 2,692,000 2,978,617
Cox Enterprises, Inc.3.25%, 12/15/22(c) 6,240,000 6,415,5172.95%, 6/30/23(c) 24,666,000 25,115,9133.85%, 2/1/25(c) 18,776,000 19,884,2323.35%, 9/15/26(c) 3,400,000 3,508,872
CRH PLC (Ireland)3.875%, 5/18/25(c) 10,250,000 10,942,198
CVS Health Corp.4.30%, 3/25/28 12,985,000 14,169,6914.78%, 3/25/38 8,125,000 9,209,340
Dillard’s, Inc.7.875%, 1/1/23 8,660,000 9,354,8057.75%, 7/15/26 50,000 56,4197.75%, 5/15/27 540,000 617,1847.00%, 12/1/28 15,135,000 16,804,562
Dow, Inc.7.375%, 11/1/29 17,000,000 22,519,7289.40%, 5/15/39 5,677,000 9,297,925
Elanco Animal Health, Inc.3.912%, 8/27/21 2,500,000 2,564,1714.272%, 8/28/23 2,500,000 2,639,1654.90%, 8/28/28 3,500,000 3,804,078
Ford Motor Credit Co. LLC(e)
5.75%, 2/1/21 12,700,000 13,107,8125.875%, 8/2/21 12,945,000 13,549,1133.813%, 10/12/21 14,270,000 14,530,4665.596%, 1/7/22 9,425,000 9,929,0314.25%, 9/20/22 4,243,000 4,387,0864.14%, 2/15/23 5,166,000 5,311,9954.375%, 8/6/23 11,405,000 11,851,909
HCA Healthcare, Inc.4.125%, 6/15/29 6,725,000 7,126,0105.25%, 6/15/49 10,255,000 11,430,832
Imperial Brands PLC (United Kingdom)4.25%, 7/21/25(c) 37,725,000 39,775,3623.875%, 7/26/29(c) 15,000,000 15,110,774
Kinder Morgan, Inc.5.50%, 3/1/44 20,643,000 24,101,8535.40%, 9/1/44 20,119,000 23,239,190
Macy’s, Inc.6.70%, 7/15/34 5,890,000 6,627,464
Occidental Petroleum Corp.2.90%, 8/15/24 7,900,000 8,022,0243.20%, 8/15/26 15,450,000 15,632,322
Prosus NV (Netherlands)6.00%, 7/18/20(c) 8,400,000 8,535,1735.50%, 7/21/25(c) 25,825,000 28,668,2294.85%, 7/6/27(c) 14,200,000 15,469,452
RELX PLC (United Kingdom)3.125%, 10/15/22 17,458,000 17,981,2664.00%, 3/18/29 5,400,000 5,857,415
TC Energy Corp. (Canada)5.625%, 5/20/75(b)(g) 20,570,000 21,444,2255.30%, 3/15/77(b)(g) 28,160,000 28,919,1945.50%, 9/15/79(b)(g) 6,850,000 7,189,075
See accompanying Notes to Financial Statements D O D G E & C O X B A L A N C E D F U N D ▪ P A G E 1 1

PORTFOLIO OF INVESTMENTS December 31, 2019
DEBT SECURITIES (continued)
PAR VALUE VALUE
Telecom Italia SPA (Italy)5.303%, 5/30/24(c) $ 18,183,000 $ 19,546,7257.20%, 7/18/36 11,596,000 13,738,9417.721%, 6/4/38 8,212,000 10,100,760
The Walt Disney Co.6.65%, 11/15/37 4,638,000 6,875,429
Ultrapar Participacoes SA (Brazil)5.25%, 10/6/26(c) 12,050,000 12,938,8085.25%, 6/6/29(c) 11,350,000 11,968,575
Union Pacific Corp.6.176%, 1/2/31 5,932,915 6,820,262
Verizon Communications, Inc.4.272%, 1/15/36 11,847,000 13,376,581
Vodafone Group PLC (United Kingdom)USSW5+4.87%, 7.00%, 4/4/79(b)(g) 16,900,000 19,829,560
Xerox Holdings Corp.4.50%, 5/15/21 21,561,000 22,142,716
Zoetis, Inc.3.25%, 2/1/23 2,150,000 2,212,1934.50%, 11/13/25 17,545,000 19,414,050
997,632,895UTILITIES: 0.5%Dominion Energy, Inc.
2.579%, 7/1/20 4,600,000 4,609,4964.104%, 4/1/21 5,650,000 5,789,3585.75%, 10/1/54(b)(g) 22,950,000 24,735,511
Enel SPA (Italy)4.625%, 9/14/25(c) 10,500,000 11,446,5236.80%, 9/15/37(c) 13,700,000 18,200,9206.00%, 10/7/39(c) 13,352,000 16,784,358
81,566,166
1,620,928,658
TOTAL DEBT SECURITIES(Cost $4,582,544,389) $ 4,791,118,814
SHORT-TERM INVESTMENTS: 1.2%
PAR VALUE/SHARES VALUE
REPURCHASE AGREEMENTS: 0.8%Bank of Montreal(d)
1.48%, dated 12/31/19, due 1/2/20,maturity value $35,902,952 $ 35,900,000 $ 35,900,000
Fixed Income Clearing Corporation(d)
1.00%, dated 12/31/19, due 1/2/20,maturity value $24,742,375 24,741,000 24,741,000
Royal Bank of Canada(d)
1.53%, dated 12/31/19, due 1/2/20,maturity value $71,806,103 71,800,000 71,800,000
132,441,000MONEY MARKET FUND: 0.4%State Street Institutional U.S. Government
Money Market Fund 62,983,694 62,983,694
TOTAL SHORT-TERM INVESTMENTS(Cost $195,424,694) $ 195,424,694
TOTAL INVESTMENTS IN SECURITIES(Cost $11,985,988,371) 99.7% $15,706,591,726
OTHER ASSETS LESS LIABILITIES 0.3% 39,971,360
NET ASSETS 100.0% $15,746,563,086
(a) Non-income producing(b) Hybrid security has characteristics of both a debt and equity security.(c) Security exempt from registration under Rule 144A of the Securities Act of
1933. The security may be resold in transactions exempt from registration,normally to qualified institutional buyers. These securities have beendeemed liquid by Dodge & Cox, investment manager, pursuant toprocedures approved by the Fund’s Board of Trustees.
(d) Repurchase agreements are collateralized by:
Bank of Montreal: U.S. Treasury Notes 1.375%-7.875%, 7/15/20-2/15/49and U.S. Treasury Inflation Indexed Note 2.375%, 1/15/25. Total collateralvalue is $36,621,050.
Fixed Income Clearing Corporation: U.S. Treasury Note 1.50%, 8/31/21.Total collateral value is $25,235,999.
Royal Bank of Canada: U.S. Treasury Notes 2.125%-2.50%,12/31/22-5/15/24. Total collateral value is $73,242,298.
(e) Subsidiary (see below)(f) Variable rate security: interest rate is determined by the interest rates of
underlying pool of assets that collateralize the security. The interest rate ofthe security may change due to a change in the interest rates or thecomposition of underlying pool of assets. The interest rate shown is the rateas of period end.
(g) Variable rate security: fixed-to-float security pays an initial fixed interestrate and will pay a floating interest rate established at a predetermined timein the future. The interest rate shown is the rate as of period end.
(h) Inflation-linked(i) Rounds to 0.0%.
In determining a company’s country designation, the Fund generallyreferences the country of incorporation. In cases where the Fund considersthe country of incorporation to be a “jurisdiction of convenience” chosenprimarily for tax purposes or in other limited circumstances, the Fund usesthe country designation of an appropriate broad-based market index. Inthose cases, two countries are listed—the country of incorporation and thecountry designated by an appropriate index, respectively.
Debt securities are grouped by parent company unless otherwise noted.Actual securities may be issued by the listed parent company or one of itssubsidiaries.
Debt securities with floating interest rates are linked to the referencedbenchmark; the interest rate shown is the rate as of period end.
ADR: American Depositary ReceiptARM: Adjustable Rate MortgageCMBS: Commercial Mortgage-Backed SecurityCMO: Collateralized Mortgage ObligationCMT: Constant Maturity TreasuryDUS: Delegated Underwriting and ServicingGO: General ObligationRB: Revenue BondREMIC: Real Estate Mortgage Investment Conduit
P A G E 1 2 ▪ D O D G E & C O X B A L A N C E D F U N D See accompanying Notes to Financial Statements

STATEMENT OF ASSETS AND LIABILITIES
December 31, 2019ASSETS:Investments in securities, at value (cost $11,985,988,371) $15,706,591,726Cash 81,857Receivable for investments sold 1,716,597Receivable for Fund shares sold 5,672,707Dividends and interest receivable 52,531,176Prepaid expenses and other assets 92,778
15,766,686,841
LIABILITIES:Payable for investments purchased 1,472,047Payable for Fund shares redeemed 11,266,777Management fees payable 6,648,546Accrued expenses 736,385
20,123,755
NET ASSETS $15,746,563,086
NET ASSETS CONSIST OF:Paid in capital $11,891,715,807Distributable earnings 3,854,847,279
$15,746,563,086
Fund shares outstanding (par value $0.01 each, unlimitedshares authorized) 154,984,128
Net asset value per share $ 101.60
STATEMENT OF OPERATIONSYear Ended
December 31, 2019INVESTMENT INCOME:Dividends (net of foreign taxes of $3,451,782) $ 242,903,175Interest 210,903,976
453,807,151
EXPENSES:Management fees 75,998,168Custody and fund accounting fees 235,640Transfer agent fees 1,662,212Professional services 224,590Shareholder reports 230,652Registration fees 131,643Trustees’ fees 341,667ADR depositary service fees 1,005,798Miscellaneous 198,441
80,028,811
NET INVESTMENT INCOME 373,778,340
REALIZED AND UNREALIZED GAIN (LOSS):Net realized gain (loss)
Investments in securities 882,635,293Futures contracts (7,355,862)
Net change in unrealized appreciation/depreciationInvestments in securities 1,452,060,764Futures contracts 3,564,635
Net realized and unrealized gain 2,330,904,830
NET CHANGE IN NET ASSETS FROMOPERATIONS $ 2,704,683,170
STATEMENT OF CHANGES IN NET ASSETSYear Ended
December 31, 2019Year Ended
December 31, 2018
OPERATIONS:Net investment income $ 373,778,340 $ 325,934,721Net realized gain (loss) 875,279,431 1,300,493,950Net change in unrealized appreciation/
depreciation 1,455,625,399 (2,310,617,993)
2,704,683,170 (684,189,322)
DISTRIBUTIONS TOSHAREHOLDERS:
Total distributions (1,421,513,759) (1,299,992,127)
FUND SHARE TRANSACTIONS:Proceeds from sale of shares 1,279,350,269 1,255,189,936Reinvestment of distributions 1,341,818,633 1,229,242,880Cost of shares redeemed (2,338,804,558) (2,706,186,811)
Net change from Fund share transactions 282,364,344 (221,753,995)
Total change in net assets 1,565,533,755 (2,205,935,444)
NET ASSETS:Beginning of year 14,181,029,331 16,386,964,775
End of year $15,746,563,086 $14,181,029,331
SHARE INFORMATION:Shares sold 12,844,379 11,905,136Distributions reinvested 13,468,923 12,704,514Shares redeemed (23,371,084) (25,719,422)
Net change in shares outstanding 2,942,218 (1,109,772)
See accompanying Notes to Financial Statements D O D G E & C O X B A L A N C E D F U N D ▪ P A G E 1 3

NOTES TO FINANCIAL STATEMENTS
NOTE 1—ORGANIZATION AND SIGNIFICANT
ACCOUNTING POLICIES
Dodge & Cox Balanced Fund (the “Fund”) is one of the seriesconstituting the Dodge & Cox Funds (the “Trust” or the “Funds”).The Trust is organized as a Delaware statutory trust and is registeredunder the Investment Company Act of 1940, as amended, as anopen-end management investment company. The Fundcommenced operations on June 26, 1931, and seeks regular income,conservation of principal, and an opportunity for long-term growthof principal and income. Risk considerations and investmentstrategies of the Fund are discussed in the Fund’s Prospectus.
The Fund is an investment company and follows theaccounting and reporting guidance issued in Topic 946 by theFinancial Accounting Standards Board. The financial statementshave been prepared in conformity with accounting principlesgenerally accepted in the United States of America, which requirethe use of estimates and assumptions by management. Actualresults may differ from those estimates. Significant accountingpolicies are as follows:
Security valuation The Fund’s net assets are normally valuedas of the scheduled close of trading on the New York Stock Exchange(“NYSE”), generally 4 p.m. Eastern Time, each day that the NYSE isopen for business.
Portfolio securities and other financial instruments for whichmarket quotes are readily available are valued at market value. Listedsecurities, for example, are generally valued using the official quotedclose price or the last sale on the exchange that is determined to bethe primary market for the security.
Debt securities, certain preferred stocks, and derivatives tradedover the counter are valued using prices received from independentpricing services which utilize dealer quotes, recent transaction data,pricing models, and other inputs to arrive at market-basedvaluations. Pricing models may consider quoted prices for similarsecurities, interest rates, cash flows (including prepayment speeds),and credit risk. Exchange-traded derivatives are valued at thesettlement price determined by the relevant exchange. Short-termsecurities less than 60 days to maturity may be valued at amortizedcost if amortized cost approximates current value. Mutual funds arevalued at their respective net asset values. Security values are notdiscounted based on the size of the Fund’s position and may differfrom the value the Fund receives upon sale of the securities. Allsecurities held by the Fund are denominated in U.S. dollars.
If market quotations are not readily available or if normalvaluation procedures produce valuations that are deemed unreliableor inappropriate under the circumstances existing at the time, theinvestment will be valued at fair value as determined in good faith byor under the direction of the Fund’s Board of Trustees. The Board ofTrustees has appointed Dodge & Cox, the Fund’s investmentmanager, to make fair value determinations in accordance with theDodge & Cox Funds Valuation Policies (“Valuation Policies”),subject to Board oversight. Dodge & Cox has established a PricingCommittee that is comprised of representatives from Treasury, Legal,Compliance, and Operations. The Pricing Committee is responsible
for implementing the Valuation Policies, including determining thefair value of securities and other investments when necessary. ThePricing Committee considers relevant indications of value that arereasonably available to it in determining the fair value assigned to aparticular security, such as the value of similar financial instruments,trading volumes, contractual restrictions on disposition, relatedcorporate actions, and changes in economic conditions. In doing so,the Pricing Committee employs various methods for calibrating fairvaluation approaches, including a regular review of key inputs andassumptions, back-testing, and review of any related market activity.
Valuing securities through a fair value determination involvesgreater reliance on judgment than valuation of securities based onreadily available market quotations. In some instances, lack ofinformation and uncertainty as to the significance of informationmay lead to a conclusion that a prior valuation is the best indicationof a security’s value. When fair value pricing is employed, the pricesof securities used by the Fund to calculate its net asset value maydiffer from quoted or published prices for the same securities.
Security transactions, investment income, expenses,and distributions Security transactions are recorded on the tradedate. Realized gains and losses on securities sold are determined onthe basis of identified cost.
Dividend income and corporate action transactions arerecorded on the ex-dividend date, or when the Fund first learns ofthe transaction if the ex-dividend date has passed. Non-cashdividends, if any, are recorded at the fair market value of thesecurities received. Dividends characterized as return of capital forU.S. tax purposes are recorded as a reduction of cost ofinvestments and/or realized gain.
Interest income is recorded on the accrual basis. Interestincome includes coupon interest, amortization of premium andaccretion of discount on debt securities, and gain/loss onpaydowns. The ability of the issuers of the debt securities held bythe Fund to meet their obligations may be affected by economicdevelopments in a specific industry, state, or region. Debtobligations may be placed on non-accrual status and relatedinterest income may be reduced by ceasing current accruals andwriting off interest receivables when the collection of all or aportion of interest has become doubtful. A debt obligation isremoved from non-accrual status when the issuer resumes interestpayments or when collectibility of interest is reasonably assured.
Expenses are recorded on the accrual basis. Some expenses of theTrust can be directly attributed to a specific series. Expenses whichcannot be directly attributed are allocated among the Funds in theTrust using methodologies determined by the nature of the expense.
Distributions to shareholders are recorded on the ex-dividenddate.
Foreign taxes The Fund may be subject to foreign taxeswhich may be imposed by certain countries in which the Fundinvests. The Fund endeavors to record foreign taxes based onapplicable foreign tax law. Withholding taxes are incurred oncertain foreign dividends and are accrued at the time the associateddividend is recorded. The Fund files withholding tax reclaims in
P A G E 1 4 ▪ D O D G E & C O X B A L A N C E D F U N D
NOTES TO FINANCIAL STATEMENTS
certain jurisdictions to recover a portion of amounts previouslywithheld. The Fund records a reclaim receivable based on, amongother things, a jurisdiction’s legal obligation to pay reclaims as wellas payment history and market convention. In consideration ofrecent decisions rendered by European courts, the Fund has filed foradditional reclaims related to prior years. A correspondingreceivable is established when both the amount is known andsignificant contingencies or uncertainties regarding collectabilityare removed. These amounts, if any, are reported in “dividends andinterest receivable” in the Statement of Assets and Liabilities.
To-Be-Announced securities The Fund may purchasemortgage-related securities on a to-be-announced (“TBA”) basis ata fixed price, with payment and delivery on a scheduled future datebeyond the customary settlement period for such securities. TheFund may choose to extend the settlement through a “dollar roll”transaction in which it sells the mortgage-related securities to adealer and simultaneously agrees to purchase similar securities forfuture delivery at a predetermined price. The Fund accounts forTBA dollar rolls as purchase and sale transactions.
Repurchase agreements Repurchase agreements aretransactions under which a Fund purchases a security from a dealercounterparty and agrees to resell the security to that counterpartyon a specified future date at the same price, plus a specified interestrate. The Fund’s repurchase agreements are secured by U.S.government or agency securities, the fair value of which exceedsthe principal amount of the repurchase transaction, includingaccrued interest, at all times. The Fund maintains custody of theunderlying collateral securities, either through its regular custodianor through a third party custodian that maintains separateaccounts for both the Fund and its counterparties. In the event ofdefault by a counterparty, the Fund has the contractual right toliquidate the collateral securities and to apply the proceeds insatisfaction of the obligation.
Indemnification Under the Trust’s organizational documents,its officers and trustees are indemnified against certain liabilitiesarising out of the performance of their duties to the Trust. Inaddition, in the normal course of business the Trust enters intocontracts that provide general indemnities to other parties. TheTrust’s maximum exposure under these arrangements is unknown asthis would involve future claims that may be made against the Trustthat have not yet occurred.
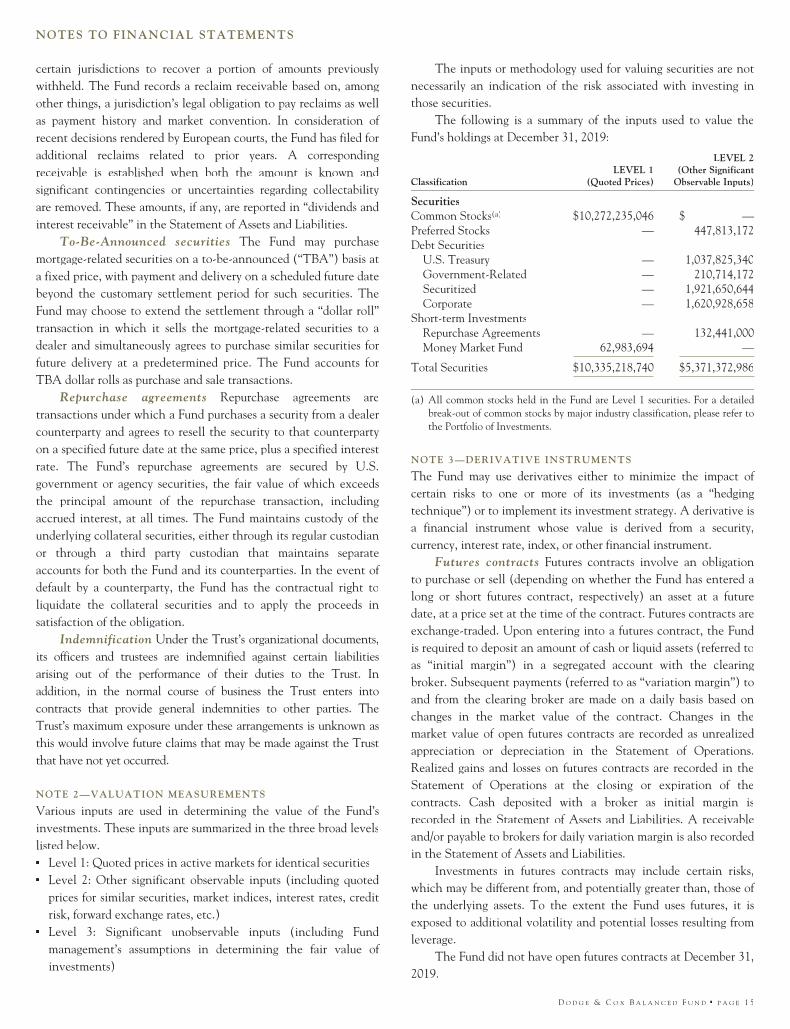
NOTE 2—VALUATION MEASUREMENTS
Various inputs are used in determining the value of the Fund’sinvestments. These inputs are summarized in the three broad levelslisted below.▪ Level 1: Quoted prices in active markets for identical securities▪ Level 2: Other significant observable inputs (including quoted
prices for similar securities, market indices, interest rates, creditrisk, forward exchange rates, etc.)
▪ Level 3: Significant unobservable inputs (including Fundmanagement’s assumptions in determining the fair value ofinvestments)
The inputs or methodology used for valuing securities are notnecessarily an indication of the risk associated with investing inthose securities.
The following is a summary of the inputs used to value theFund’s holdings at December 31, 2019:
ClassificationLEVEL 1
(Quoted Prices)
LEVEL 2(Other Significant
Observable Inputs)
SecuritiesCommon Stocks(a) $10,272,235,046 $ —Preferred Stocks — 447,813,172Debt Securities
U.S. Treasury — 1,037,825,340Government-Related — 210,714,172Securitized — 1,921,650,644Corporate — 1,620,928,658
Short-term InvestmentsRepurchase Agreements — 132,441,000Money Market Fund 62,983,694 —
Total Securities $10,335,218,740 $5,371,372,986
(a) All common stocks held in the Fund are Level 1 securities. For a detailedbreak-out of common stocks by major industry classification, please refer tothe Portfolio of Investments.
NOTE 3—DERIVATIVE INSTRUMENTS
The Fund may use derivatives either to minimize the impact ofcertain risks to one or more of its investments (as a “hedgingtechnique”) or to implement its investment strategy. A derivative isa financial instrument whose value is derived from a security,currency, interest rate, index, or other financial instrument.
Futures contracts Futures contracts involve an obligationto purchase or sell (depending on whether the Fund has entered along or short futures contract, respectively) an asset at a futuredate, at a price set at the time of the contract. Futures contracts areexchange-traded. Upon entering into a futures contract, the Fundis required to deposit an amount of cash or liquid assets (referred toas “initial margin”) in a segregated account with the clearingbroker. Subsequent payments (referred to as “variation margin”) toand from the clearing broker are made on a daily basis based onchanges in the market value of the contract. Changes in themarket value of open futures contracts are recorded as unrealizedappreciation or depreciation in the Statement of Operations.Realized gains and losses on futures contracts are recorded in theStatement of Operations at the closing or expiration of thecontracts. Cash deposited with a broker as initial margin isrecorded in the Statement of Assets and Liabilities. A receivableand/or payable to brokers for daily variation margin is also recordedin the Statement of Assets and Liabilities.
Investments in futures contracts may include certain risks,which may be different from, and potentially greater than, those ofthe underlying assets. To the extent the Fund uses futures, it isexposed to additional volatility and potential losses resulting fromleverage.
The Fund did not have open futures contracts at December 31,2019.
D O D G E & C O X B A L A N C E D F U N D ▪ P A G E 1 5

NOTES TO FINANCIAL STATEMENTS
Additional derivative information The followingsummarizes the effect of derivative instruments on the Statementof Operations.
Interest RateDerivatives
Net realized gain (loss)Futures contracts $(7,355,862)
Net change in unrealized appreciation/depreciationFutures contracts $ 3,564,635
The following summarizes the range of volume in the Fund’sderivative instruments during the year ended December 31, 2019.
Derivative % of Net Assets
Futures contracts USD notional value 0-1%
NOTE 4—RELATED PARTY TRANSACTIONS
Management fees Under a written agreement approved by aunanimous vote of the Board of Trustees, the Fund pays amanagement fee monthly at an annual rate of 0.50% of the Fund’saverage daily net assets to Dodge & Cox, investment manager ofthe Fund.
Fund officers and trustees All officers and two of thetrustees of the Trust are officers or employees of Dodge & Cox.The Trust pays a fee only to those trustees who are not affiliatedwith Dodge & Cox.
NOTE 5—INCOME TAX INFORMATION AND
DISTRIBUTIONS TO SHAREHOLDERS
A provision for federal income taxes is not required since the Fundintends to continue to qualify as a regulated investment companyunder Subchapter M of the Internal Revenue Code and distributeall of its taxable income to shareholders. Distributions aredetermined in accordance with income tax regulations, and suchamounts may differ from net investment income and realized gainsfor financial reporting purposes. The Fund may also designate aportion of the amount paid to redeeming shareholders as adistribution for tax purposes. Financial reporting records areadjusted for permanent book to tax differences at year end to reflecttax character. Book to tax differences are primarily due to differingtreatments of wash sales, net short-term realized gain (loss),derivatives, and distributions.
Distributions during the years noted below were characterized asfollows for federal income tax purposes:
Year EndedDecember 31, 2019
Year EndedDecember 31, 2018
Ordinary income $ 381,385,933 $ 297,446,889($ 2.529 per share) ($ 2.010 per share)
Long-term capital gain $ 1,040,127,826 $ 1,002,545,238($ 6.971 per share) ($ 6.916 per share)
At December 31, 2019, the tax basis components ofdistributable earnings were as follows:
Undistributed ordinary income $ 27,395,424Undistributed long-term capital gain 113,010,136
At December 31, 2019, unrealized appreciation and depreciationfor investments and derivatives based on cost for federal income taxpurposes were as follows:
Tax cost $11,992,150,007
Unrealized appreciation 4,188,276,502Unrealized depreciation (473,834,783)
Net unrealized appreciation 3,714,441,719
Fund management has reviewed the tax positions for openperiods (three years and four years, respectively, from filing the Fund’sFederal and State tax returns) as applicable to the Fund, and hasdetermined that no provision for income tax is required in the Fund’sfinancial statements.
NOTE 6—LOAN FACILITIES
Pursuant to an exemptive order issued by the Securities andExchange Commission (“SEC”), the Fund may participate in aninterfund lending facility (“Facility”). The Facility allows the Fundto borrow money from or loan money to the Funds. Loans underthe Facility are made for temporary or emergency purposes, such asto fund shareholder redemption requests. Interest on borrowings isthe average of the current repurchase agreement rate and the bankloan rate. There was no activity in the Facility during the year.
All Funds in the Trust participate in a $500 millioncommitted credit facility (“Line of Credit”) with State Street Bankand Trust Company, to be utilized for temporary or emergencypurposes to fund shareholder redemptions or for other short-termliquidity purposes. The maximum amount available to the Fund is$250 million. Each Fund pays an annual commitment fee on itspro-rata portion of the Line of Credit. For the year endedDecember 31, 2019, the Fund’s commitment fee amounted to$95,540 and is reflected as a Miscellaneous Expense in theStatement of Operations. Interest on borrowings is charged at theprevailing rate. There were no borrowings on the Line of Creditduring the year.
NOTE 7—PURCHASES AND SALES OF INVESTMENTS
For the year ended December 31, 2019, purchases and sales ofsecurities, other than short-term securities and U.S. governmentsecurities, aggregated $2,373,436,244 and $3,322,909,319,respectively. For the year ended December 31, 2019, purchases andsales of U.S. government securities aggregated $2,762,152,617 and$2,099,697,530, respectively.
P A G E 1 6 ▪ D O D G E & C O X B A L A N C E D F U N D

NOTES TO FINANCIAL STATEMENTS
NOTE 8—NEW ACCOUNTING GUIDANCE
In March 2017, the Financial Accounting Standards Board issuedan update to amend the amortization period for certain purchasedcallable debt securities held at a premium. The amendmentsshorten the amortization period for premiums to the earliest calldate, but do not require an accounting change for securities held ata discount. The amendments are effective for financial statementsfor fiscal years beginning after December 15, 2018, and interimperiods within those fiscal years. The Fund’s adoption of theupdated accounting standards on January 1, 2019 did not have amaterial impact on the Fund’s financial statements.
NOTE 9—SUBSEQUENT EVENTS
Fund management has determined that no material events ortransactions occurred subsequent to December 31, 2019, andthrough the date of the Fund’s financial statements issuance, whichrequire additional disclosure in the Fund’s financial statements.
FINANCIAL HIGHLIGHTS
SELECTED DATA AND RATIOS(for a share outstanding throughout each year) Year Ended December 31,
2019 2018 2017 2016 2015
Net asset value, beginning of year $93.27 $107.00 $103.35 $94.42 $102.48Income from investment operations:
Net investment income 2.48 2.20 2.28 2.34 2.06Net realized and unrealized gain (loss) 15.35 (7.00) 10.45 12.89 (4.99)
Total from investment operations 17.83 (4.80) 12.73 15.23 (2.93)
Distributions to shareholders from:Net investment income (2.46) (2.01) (2.29) (2.34) (2.06)Net realized gain (7.04) (6.92) (6.79) (3.96) (3.07)
Total distributions (9.50) (8.93) (9.08) (6.30) (5.13)
Net asset value, end of year $101.60 $93.27 $107.00 $103.35 $94.42
Total return 19.62% (4.61)% 12.59% 16.55% (2.88)%Ratios/supplemental data:
Net assets, end of year (millions) $15,747 $14,181 $16,387 $15,382 $14,269Ratio of expenses to average net assets 0.53% 0.53% 0.53% 0.53% 0.53%Ratio of net investment income to average net assets 2.46% 2.06% 2.12% 2.41% 2.03%Portfolio turnover rate 35% 24% 19% 24% 20%
See accompanying Notes to Financial Statements
D O D G E & C O X B A L A N C E D F U N D ▪ P A G E 1 7

REPORT OF INDEPENDENT REGISTERED PUBLIC ACCOUNTING FIRM
To the Board of Trustees of the Dodge & Cox Funds and Shareholders of Dodge & Cox Balanced Fund
Opinion on the Financial StatementsWe have audited the accompanying statement of assets and liabilities, including the portfolio of investments, of Dodge & Cox BalancedFund (one of the funds constituting Dodge & Cox Funds, referred to hereafter as the “Fund”) as of December 31, 2019, the related statementof operations for the year ended December 31, 2019, the statement of changes in net assets for each of the two years in the period endedDecember 31, 2019, including the related notes, and the financial highlights for each of the five years in the period ended December 31,2019 (collectively referred to as the “financial statements”). In our opinion, the financial statements present fairly, in all material respects,the financial position of the Fund as of December 31, 2019, the results of its operations for the year then ended, the changes in its net assetsfor each of the two years in the period ended December 31, 2019 and the financial highlights for each of the five years in the period endedDecember 31, 2019 in conformity with accounting principles generally accepted in the United States of America.
Basis for OpinionThese financial statements are the responsibility of the Fund’s management. Our responsibility is to express an opinion on the Fund’sfinancial statements based on our audits. We are a public accounting firm registered with the Public Company Accounting Oversight Board(United States) (PCAOB) and are required to be independent with respect to the Fund in accordance with the U.S. federal securities lawsand the applicable rules and regulations of the Securities and Exchange Commission and the PCAOB.
We conducted our audits of these financial statements in accordance with the standards of the PCAOB. Those standards require thatwe plan and perform the audit to obtain reasonable assurance about whether the financial statements are free of material misstatement,whether due to error or fraud.
Our audits included performing procedures to assess the risks of material misstatement of the financial statements, whether due to erroror fraud, and performing procedures that respond to those risks. Such procedures included examining, on a test basis, evidence regarding theamounts and disclosures in the financial statements. Our audits also included evaluating the accounting principles used and significantestimates made by management, as well as evaluating the overall presentation of the financial statements. Our procedures includedconfirmation of securities owned as of December 31, 2019 by correspondence with the custodian, transfer agent and brokers; when replieswere not received from brokers, we performed other auditing procedures. We believe that our audits provide a reasonable basis for ouropinion.
PricewaterhouseCoopers LLPSan Francisco, CaliforniaFebruary 20, 2020
We have served as the auditor of one or more investment companies in the Dodge & Cox Funds since 1931.
P A G E 1 8 ▪ D O D G E & C O X B A L A N C E D F U N D
SPECIAL 2019 TAX INFORMATION(unaudited)The following information is provided pursuant to provisions ofthe Internal Revenue Code:
The Fund designates $1,040,127,826 as long-term capital gaindistributions in 2019.
The Fund designates $246,323,442 of its distributions paid toshareholders in 2019 as qualified dividends (treated for federalincome tax purposes in the hands of shareholders as taxable at amaximum rate of 20%).
For shareholders that are corporations, the Fund designates37% of its ordinary dividends paid to shareholders in 2019 asdividends from domestic corporations eligible for the corporatedividends received deduction, provided that the shareholderotherwise satisfies applicable requirements to claim that deduction.
FUNDS’ LIQUIDITY RISK MANAGEMENTPROGRAM(unaudited)The Funds have adopted and implemented a written liquidity riskmanagement program as required by Rule 22e-4 under theInvestment Company Act. The program is reasonably designed toassess and manage each Fund’s liquidity risk, taking intoconsideration the Fund’s investment strategy and the liquidity ofits portfolio investments during normal and reasonably foreseeablestressed conditions; its short and long-term cash flow projections;and its cash holdings and access to other funding sources includingthe Funds’ interfund lending facility and line of credit. The Funds’Board of Trustees approved the appointment of a Liquidity RiskManagement Committee including representatives from Dodge &Cox’s legal, compliance, treasury, operations, trading, and portfoliomanagement departments, which is responsible for the program’sadministration and oversight and for reporting to the Board on atleast an annual basis regarding the program’s operation andeffectiveness. The Liquidity Risk Management Committeerefreshed its assessment of the Fund’s liquidity risk profile,considering additional data gathered in the 12 months endedSeptember 30, 2019 and the adequacy and effectiveness of theliquidity risk management program’s operations since its inceptionin February, 2019 (the “covered period”) in order to prepare awritten report to the Board of Trustees for consideration at itsmeeting held on December 12, 2019. The report concluded that(i) the Fund did not experience significant liquidity challengesduring the covered period (ii) the Fund’s investment strategy isappropriate for an open-end fund; and (iii) the Fund’s liquidity riskmanagement program is reasonably designed to assess and manageits liquidity risk.
BOARD APPROVAL OF FUNDS’ INVESTMENTMANAGEMENT AGREEMENTS ANDMANAGEMENT FEES(unaudited)The Board of Trustees is responsible for overseeing the performanceof the Dodge & Cox Funds’ investment manager and determiningwhether to continue the Investment Management Agreementsbetween the Funds and Dodge & Cox each year (the“Agreements”). At a meeting of the Board of Trustees of the Trust
held on December 12, 2019, the Trustees, by a unanimous vote(including a separate vote of those Trustees who are not “interestedpersons” (as defined in the Investment Company Act of 1940) (the“Independent Trustees”)), approved the renewal of the Agreementsfor an additional one-year term through December 31, 2020 withrespect to each Fund. During the course of the year, the Boardreceived extensive information and materials relating to theinvestment management and administrative services provided byDodge & Cox and the performance of each of the Funds.
INFORMATION RECEIVED
Over the past several years, the Board has requested, received, anddiscussed a number of special presentations on topics relevant totheir annual consideration of the proposed renewal of the Funds’Agreements. In addition to the foregoing and in advance of themeetings referred to below, the Board, including the IndependentTrustees, requested, received, and reviewed materials relating tothe Agreements and the services provided by Dodge & Cox. TheIndependent Trustees retained Broadridge to prepare anindependent expense and performance summary for each Fund andcomparable funds managed by other advisers identified byBroadridge. The Broadridge materials included informationregarding advisory and administrative fee rates, expense ratios, andtransfer agency, custodial, and distribution expenses, as well asperformance comparisons to each Fund’s peer group and to abroad-based securities index or combination of indices. TheBroadridge materials also included a comparison of expenses ofvarious share classes offered by comparable funds. The materialsreviewed by the Board contained information concerning, amongother things, Dodge & Cox’s profitability, financial results andcondition, management fee revenue, and separate account feeschedules. The Board additionally considered the Funds’ brokeragecommissions, turnover rates, sales and redemption data, and theinvestment that Dodge & Cox makes in research used in managingthe Funds. The Board received and reviewed memoranda andrelated materials addressing, among other things, Dodge & Cox’sservices to the Funds; how Dodge & Cox Funds’ fees compare tofees of peer group funds; the different fees, services, costs, and risksassociated with other accounts managed by Dodge & Cox ascompared to the Dodge & Cox Funds; and the ways in which theFunds realize economies of scale. Throughout the process ofreviewing the services provided by Dodge & Cox and preparing forthe meeting, the Independent Trustees found Dodge & Cox to beopen, forthright, detailed, and helpful in answering questionsabout all issues. The Board received copies of the Agreements anda memorandum from the independent legal counsel to theIndependent Trustees discussing the factors generally regarded asappropriate to consider in evaluating mutual fund managementarrangements. The Trust’s Contract Review Committee, consistingsolely of Independent Trustees, met with the independent legalcounsel on November 7, 2019 and again on December 12, 2019 todiscuss whether to renew the Agreements. The Board, includingthe Independent Trustees, subsequently concluded that theexisting Agreements are fair and reasonable and voted to approvethe Agreements. In considering the Agreements, the Board,including the Independent Trustees, did not identify any singlefactor or particular information as all-important or controlling. In
D O D G E & C O X B A L A N C E D F U N D ▪ P A G E 1 9

reaching the decision to approve the Agreements, the Boardconsidered several factors, discussed below, to be key factors andreached the conclusions described below.
NATURE, QUALITY, AND EXTENT OF THE SERVICES
The Board considered that Dodge & Cox provides a range ofservices to the Funds in addition to portfolio management,including regulatory compliance, trading desks, proxy voting,transfer agent and custodian oversight, administration, regulatoryfilings, tax compliance and filings, website, and anti-moneylaundering. The nature of services provided by Dodge & Cox hasbeen documented in materials provided to the Board and inpresentations made to the Board throughout the year. Inparticular, the Board considered the nature, quality, and extent ofportfolio management, administrative, and shareholder servicesperformed by Dodge & Cox. With regard to portfolio managementservices, the Board considered Dodge & Cox’s established long-term history of care in the management of the Funds; itsconsistency in investment approach and depth; the backgroundand experience of the Dodge & Cox U.S. Equity InvestmentCommittee, International Equity Investment Committee, GlobalEquity Investment Committee, U.S. Fixed Income InvestmentCommittee, and Global Fixed Income Investment Committee, andresearch analysts responsible for managing the Funds;Dodge & Cox’s methods for assessing the regulatory andinvestment climate in various jurisdictions; its overall level ofattention to its core investment management function; and itscommitment to the Funds and their shareholders. The Boardreviewed information from Dodge & Cox regarding any materialconflicts of interest between the Funds and Dodge & Cox or itsother clients, and regarding how Dodge & Cox addresses thoseconflicts. The Board noted Dodge & Cox’s record of favorablepress and industry coverage, as well as its good compliance record,and its reputation as a trusted, shareholder-friendly mutual fundfamily. In addition, the Board considered that Dodge & Coxmanages approximately $211 billion in Fund assets with fewerprofessionals than most comparable funds, and that on averagethese professionals have more experience and longer tenure thaninvestment professionals at comparable funds. The Board alsonoted that Dodge & Cox is an investment research-oriented firmwith no other business endeavors to distract management’sattention from its research efforts, that its investment professionalsadhere to a consistent investment approach across the Funds, andthat due to its deliberate strategy with respect to new products,Dodge & Cox has had stability in its mutual fund product offeringsover the course of many years and has the fewest funds of any ofthe 25 largest mutual fund families by assets. The Board furtherconsidered the “Gold” analyst rating awarded by Morningstar to allof the Funds (other than the Global Bond Fund, which has a“Silver” rating). The Board concluded that it was satisfied with thenature, extent, and quality of investment management and otherservices provided to the Funds by Dodge & Cox.
INVESTMENT PERFORMANCE
The Board reviewed each Fund’s recent and long-term investmentperformance (including periods of outperformance andunderperformance), as compared to relevant indices and the
performance of such Fund’s peer group and broader Morningstarcategory. In assessing the performance of the Funds, the Boardconsidered the Funds’ investment returns over various periods andthe volatility thereof and concluded that the levels experiencedwere consistent with Dodge & Cox’s long-term approach andactive investment style. The Board also compared the short- andlong-term investment performance of the equity funds to value-oriented indices, in recognition of the significant performancedivergence between value and growth stocks over the past severalyears. It was noted that equity performance has been consistentwith the value oriented investment strategy employed byDodge & Cox. The Board concluded that Dodge & Cox’s historic,long-term, team-oriented, bottom-up investment approachremains consistent and that Dodge & Cox continues to bedistinguished by its integrity, transparency, and independence.The Board considered that the performance of the Funds is theresult of a value-oriented investment management process thatemphasizes a long-term investment horizon, independent research,a team approach, price discipline, low cost, and low portfolioturnover. The Board concluded that Dodge & Cox has deliveredlong-term performance for Fund investors consistent with thelong-term investment strategies being pursued by the Funds.
COSTS AND ANCILLARY BENEFITS
Costs of Services to Funds: Fees and Expenses The Boardconsidered each Fund’s management fee rate and net expense ratiorelative to (1) a broad category of other mutual funds with similarportfolio characteristics and share class and expense structures and(2) a smaller group of peers selected by Broadridge based oninvestment style, share class characteristics, and asset levels. TheBoard also considered the management fees charged byDodge & Cox to other clients. In particular, the Board consideredthat the Funds continue to be below their peer group medians innet expense ratios. The Board also evaluated the operatingstructures of the Funds and Dodge & Cox, noting that the Fundsdo not charge front-end sales commissions or distribution fees, andDodge & Cox bears, among other things, the cost of most third-party research, reimbursement for shareholder recordkeeping andadministrative costs to third-party retirement plan administrators,and administrative and office overhead. The Board noted that theBroadridge report shows that the net expense ratio of everyDodge & Cox Fund is in the least expensive quartile compared toits broad Morningstar category. The Board noted the Funds’unusual single-share-class structure and reviewed Broadridge data(including asset-weighted average expense ratios) showing thatmost of the peer group funds offer several different classes of shares,with different expense ratios, to different categories of investors,and that the Broadridge expense comparisons described abovegenerally compare the net expense ratio of each Dodge & CoxFund’s single share class to one of the least expensive share classesof the peer fund, even though those share classes are often notavailable to retail investors. The Board noted that the Fundsprovide access for small investors to high quality investmentmanagement at a relatively low cost. The Board also consideredthat the Funds are priced to scale, i.e., management fee rates begin
P A G E 2 0 ▪ D O D G E & C O X B A L A N C E D F U N D
at relatively low levels. Even without breakpoints, the Funds’management fee rates are lower than those of many peer fundswhose fee schedules include breakpoints. With respect to non-U.S.funds sponsored and managed by Dodge & Cox that arecomparable to the Funds in many respects, the Board noted thatthe fee rates charged by Dodge & Cox are the same as or higherthan the fee rates charged to the Funds. The Board reviewedinformation regarding the fee rates Dodge & Cox charges toseparate accounts that have investment programs similar to thoseof the Funds, including instances where separate account fees arelower than Fund fees. The Board considered the differences in thenature and scope of services Dodge & Cox provides to the Funds ascompared to other client accounts, as well as material differencesin regulatory, litigation, and other risks as between Dodge & CoxFunds and other types of clients. The Board noted that differentmarkets exist for mutual fund and institutional separate accountmanagement services and that a comparison of Fund fee rates andseparate account fee rates must consider the fact that separateaccount clients bear additional costs and responsibilities that areincluded in the cost of a Fund. After consideration of thesematters, the Board concluded that the overall costs incurred by theFunds for the services they receive (including the management feepaid to Dodge & Cox) are reasonable and that the fees areacceptable based upon the qualifications, experience, reputation,and performance of Dodge & Cox and the low overall expenseratios of the Funds.
Profitability and Costs of Services to Dodge & Cox;“Fall-out” Benefits The Board reviewed reports of Dodge &Cox’s financial position, profitability, and estimated overall valueand considered Dodge & Cox’s overall profitability within itscontext as a private, employee-owned S-Corporation and relativeto the scope and quality of the services provided. The Board notedin particular that Dodge & Cox’s profits are not generated by highfee rates, but reflect a focused business approach towardinvestment management. The Board recognized the importance ofDodge & Cox’s profitability—which is derived solely frommanagement fees and does not include other business ventures—tomaintain its independence, stability, company culture and ethics,and management continuity. The Board also considered that thecompensation/profit structure at Dodge & Cox includes a returnon shareholder employees’ investment in the firm, which is vitalfor remaining independent and facilitating retention ofmanagement and investment professionals. The Board alsoconsidered that Dodge & Cox has in the past closed some of theFunds to new investors to proactively manage growth in thoseFunds. While these actions are intended to benefit existing Fundshareholders, the effect is to reduce potential revenues toDodge & Cox from new shareholders. The Board also consideredpotential “fall-out” benefits (including the receipt of research fromunaffiliated brokers and reputational benefits to non-U.S. fundssponsored and managed by Dodge & Cox) that Dodge & Coxmight receive as a result of its association with the Funds anddetermined that they are acceptable. The Board also noted thatDodge & Cox continues to invest in its business to provideenhanced services, systems, and research capabilities, all of which
benefit the Funds. The Board concluded that Dodge & Cox’sprofitability is the keystone of its independence, stability, andlong-term investment performance and that the profitability ofDodge & Cox’s relationship with the Funds (including fall-outbenefits) is fair and reasonable.
ECONOMIES OF SCALE
The Board considered whether there have been economies of scalewith respect to the management of each Fund, whether the Fundshave appropriately benefited from any economies of scale, andwhether the management fee rate is reasonable in relation to thelevel of Fund assets and any economies of scale that may exist. Inthe Board’s view, any consideration of economies of scale musttake account of the Funds’ low fee and expense structure and thefact that the Dodge & Cox Funds build economies of scale intotheir fee structures by charging low fees from a fund’s inceptionand keeping overall expenses down as a Fund grows, as comparedto other fund complexes that employ fee “breakpoints” only after afund reaches a certain scale. An assessment of economies of scalemust also take into account that Dodge & Cox invests time andresources in each new Fund for months (and sometimes years)prior to launch; in addition, in a Fund’s early periods of operations,expenses are capped, which means that Dodge & Cox subsidizesthe operations of a new Fund for a period of time until it reachesscale. The Board also observed that, while total Fund assets havegrown over the long term, this growth has not been continuous orevenly distributed across all of the Funds. In addition, the Boardnoted that Dodge & Cox has shared the benefits of economies ofscale with the Funds by adding services to the Funds over time,and that Dodge & Cox’s internal costs of providing investmentmanagement, technology, administrative, legal, and complianceservices to the Funds continue to increase. For example,Dodge & Cox has increased its global research staff andinvestment resources over the years to add new capabilities for thebenefit of Fund shareholders and to address the increasedcomplexity of investing globally. In addition, Dodge & Cox hasmade expenditures in other staff, technology, and infrastructure toenable it to integrate credit and equity analyses and to implementits strategy in a more effective manner. Over the last ten years,Dodge & Cox has increased its spending on research, investmentmanagement, client servicing, cybersecurity, technology, third-party research, data services, and computer systems for trading,operations, compliance, accounting, and communications at a ratethat has outpaced the Funds’ growth rate during the same period.The Board also observed that, even without fee breakpoints, theFunds are competitively priced in a competitive market and thathaving a low fee from inception is better for shareholders thanstarting with a higher fee and adding breakpoints. The Board alsonoted that there are certain diseconomies of scale associated withmanaging large funds, insofar as certain of the costs and risksassociated with portfolio management increase disproportionatelyas assets grow. The Board concluded that the currentDodge & Cox fee structure is fair and reasonable and adequatelyshares economies of scale that may exist.
D O D G E & C O X B A L A N C E D F U N D ▪ P A G E 2 1

CONCLUSION
Based on their evaluation of all material factors and assisted by theadvice of independent legal counsel to the Independent Trustees,the Board, including the Independent Trustees, concluded that themanagement fee structure was fair and reasonable, that each Fundwas paying a competitive fee for the services provided, thatDodge & Cox’s services have provided value for Fund shareholdersover the long term, and that approval of the Agreements was inthe best interests of each Fund and its shareholders.
FUND HOLDINGSThe Fund provides a complete list of its holdings on a quarterlybasis by filing the lists with the SEC on Form N-CSR (as of theend of the second and fourth quarters) and on Part F ofForm N-PORT (as of the end of the first and third quarters).Shareholders may view the Fund’s Form N-CSR and Part F ofForm N-PORT on the SEC’s website at sec.gov. A list of theFund’s quarter-end holdings is also available at dodgeandcox.comon or about the 15th day following each quarter end and remainsavailable on the website until the list is updated for the subsequentquarter.
PROXY VOTINGFor a free copy of the Fund’s proxy voting policies and procedures,please call 800-621-3979, visit the Fund’s website atdodgeandcox.com, or visit the SEC’s website at sec.gov.Information regarding how the Fund voted proxies relating toportfolio securities during the most recent 12-month period endingJune 30 is also available at dodgeandcox.com or at sec.gov.
HOUSEHOLD MAILINGSThe Fund routinely mails shareholder reports and summaryprospectuses to shareholders and, on occasion, proxy statements.In order to reduce the volume of mail, when possible, only onecopy of these documents will be sent to shareholders who are partof the same family and share the same residential address.
If you have a direct account with the Funds and you do notwant the mailing of shareholder reports and summary prospectusescombined with other members in your household, contact theFunds at 800-621-3979. Your request will be implemented within30 days.
P A G E 2 2 ▪ D O D G E & C O X B A L A N C E D F U N D
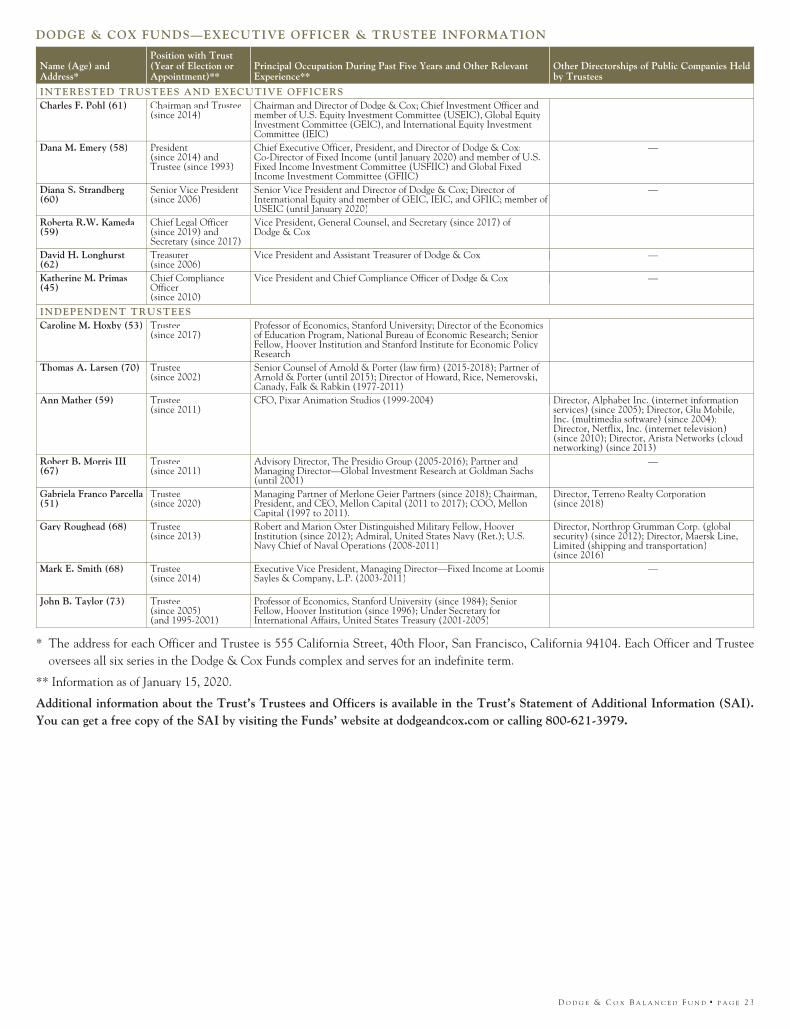
DODGE & COX FUNDS—EXECUTIVE OFFICER & TRUSTEE INFORMATION
Name (Age) andAddress*
Position with Trust(Year of Election orAppointment)**
Principal Occupation During Past Five Years and Other RelevantExperience**
Other Directorships of Public Companies Heldby Trustees
INTERESTED TRUSTEES AND EXECUTIVE OFFICERSCharles F. Pohl (61) Chairman and Trustee
(since 2014)Chairman and Director of Dodge & Cox; Chief Investment Officer andmember of U.S. Equity Investment Committee (USEIC), Global EquityInvestment Committee (GEIC), and International Equity InvestmentCommittee (IEIC)
—
Dana M. Emery (58) President(since 2014) andTrustee (since 1993)
Chief Executive Officer, President, and Director of Dodge & Cox;Co-Director of Fixed Income (until January 2020) and member of U.S.Fixed Income Investment Committee (USFIIC) and Global FixedIncome Investment Committee (GFIIC)
—
Diana S. Strandberg(60)
Senior Vice President(since 2006)
Senior Vice President and Director of Dodge & Cox; Director ofInternational Equity and member of GEIC, IEIC, and GFIIC; member ofUSEIC (until January 2020)
—
Roberta R.W. Kameda(59)
Chief Legal Officer(since 2019) andSecretary (since 2017)
Vice President, General Counsel, and Secretary (since 2017) ofDodge & Cox
—
David H. Longhurst(62)
Treasurer(since 2006)
Vice President and Assistant Treasurer of Dodge & Cox —
Katherine M. Primas(45)
Chief ComplianceOfficer(since 2010)
Vice President and Chief Compliance Officer of Dodge & Cox —
INDEPENDENT TRUSTEESCaroline M. Hoxby (53) Trustee
(since 2017)Professor of Economics, Stanford University; Director of the Economicsof Education Program, National Bureau of Economic Research; SeniorFellow, Hoover Institution and Stanford Institute for Economic PolicyResearch
—
Thomas A. Larsen (70) Trustee(since 2002)
Senior Counsel of Arnold & Porter (law firm) (2015-2018); Partner ofArnold & Porter (until 2015); Director of Howard, Rice, Nemerovski,Canady, Falk & Rabkin (1977-2011)
—
Ann Mather (59) Trustee(since 2011)
CFO, Pixar Animation Studios (1999-2004) Director, Alphabet Inc. (internet informationservices) (since 2005); Director, Glu Mobile,Inc. (multimedia software) (since 2004);Director, Netflix, Inc. (internet television)(since 2010); Director, Arista Networks (cloudnetworking) (since 2013)
Robert B. Morris III(67)
Trustee(since 2011)
Advisory Director, The Presidio Group (2005-2016); Partner andManaging Director—Global Investment Research at Goldman Sachs(until 2001)
—
Gabriela Franco Parcella(51)
Trustee(since 2020)
Managing Partner of Merlone Geier Partners (since 2018); Chairman,President, and CEO, Mellon Capital (2011 to 2017); COO, MellonCapital (1997 to 2011).
Director, Terreno Realty Corporation(since 2018)
Gary Roughead (68) Trustee(since 2013)
Robert and Marion Oster Distinguished Military Fellow, HooverInstitution (since 2012); Admiral, United States Navy (Ret.); U.S.Navy Chief of Naval Operations (2008-2011)
Director, Northrop Grumman Corp. (globalsecurity) (since 2012); Director, Maersk Line,Limited (shipping and transportation)(since 2016)
Mark E. Smith (68) Trustee(since 2014)
Executive Vice President, Managing Director—Fixed Income at LoomisSayles & Company, L.P. (2003-2011)
—
John B. Taylor (73) Trustee(since 2005)(and 1995-2001)
Professor of Economics, Stanford University (since 1984); SeniorFellow, Hoover Institution (since 1996); Under Secretary forInternational Affairs, United States Treasury (2001-2005)
—
* The address for each Officer and Trustee is 555 California Street, 40th Floor, San Francisco, California 94104. Each Officer and Trusteeoversees all six series in the Dodge & Cox Funds complex and serves for an indefinite term.
** Information as of January 15, 2020.
Additional information about the Trust’s Trustees and Officers is available in the Trust’s Statement of Additional Information (SAI).You can get a free copy of the SAI by visiting the Funds’ website at dodgeandcox.com or calling 800-621-3979.
D O D G E & C O X B A L A N C E D F U N D ▪ P A G E 2 3

Balanced Fund
dodgeandcox.com
For Fund literature, transactions, and accountinformation, please visit the Funds’ website.
or write or call:
DODGE & COX FUNDS
c/o DST Asset Manager Solutions, Inc.P.O. Box 219502Kansas City, Missouri 64121-9502(800) 621-3979
INVESTMENT MANAGER
Dodge & Cox555 California Street, 40th FloorSan Francisco, California 94104(415) 981-1710
This report is submitted for the general information of the shareholders of the Fund. The report is not authorized for distributionto prospective investors in the Fund unless it is accompanied by a current prospectus.
This report reflects our views, opinions, and portfolio holdings as of December 31, 2019, the end of the reporting period.Any such views are subject to change at any time based upon market or other conditions and Dodge & Cox disclaims anyresponsibility to update such views. These views may not be relied on as investment advice and, because investment decisionsfor a Dodge & Cox Fund are based on numerous factors, may not be relied on as an indication of trading intent on behalf ofany Dodge & Cox Fund.