doe-em-gjtac1782 final biota monitoring report 2008
TRANSCRIPT

Prepared by the Technical Assistance Contractor under contract number DE-AC30-07CC60012
for the U.S. Department of Energy Office of Environmental Management, Grand Junction, Colorado.
Moab UMTRA Project Final Report 2008 Biota Monitoring March 2009
DOE–EM/GJTAC1782

DOE-EM/GJTAC1782
Moab UMTRA Project Final Report 2008 Biota Monitoring
March 2009
Prepared by the Technical Assistance Contractor under contract number DE-AC30-07CC60012 for the U.S. Department of Energy Office of Environmental Management, Grand Junction, Colorado.

DOE-EMIGJTAC1782
Moab UMTRA ProjectFinal Report 2008 Biota Monitoring
Revision 0
Review and Approval
Kenneth G. Pill
/4%— ,Z~A,Date
TAC Ground Water Manager
TAC Senior Manager
U.S. Department of EnergyRevision 0 March 2009
Moab UMTRA Project Final Report 2008 Biota MonitoringDOE EM/OJTAC 1782

U.S. Department of Energy Moab UMTRA Project Final Report 2008 Biota Monitoring Revision 0 March 2009 DOE-EM/GJTAC1782
Page ii
Revision History Revision No. Date Reason/Basis for Revision
0 March 2009 Initial issue.

U.S. Department of Energy Moab UMTRA Project Final Report 2008 Biota Monitoring Revision 0 March 2009 DOE-EM/GJTAC1782
Page iii
Table of Contents Section Page 1.0 Introduction.............................................................................................................................1 2.0 Background .............................................................................................................................2 3.0 Results ......................................................................................................................................2
3.1 June 2008 Summary ..........................................................................................................2 3.2 July 2008 Summary ...........................................................................................................4 3.3 August 2008 Summary ......................................................................................................5 3.4 September 2008 Summary.................................................................................................6
4.0 Conclusions and Recommendations......................................................................................7 5.0 References................................................................................................................................8
Table
Table 1. Benchmark Values vs. Values Observed On Site..............................................................8
Figures Figure 1. Map of Channel Locations ...............................................................................................3 Figure 2. Colorado River Cisco Gaging Station Hydrograph for June 2008...................................4 Figure 3. Colorado River Cisco Gaging Station Hydrograph for July 2008 ...................................5 Figure 4. Colorado River Cisco Gaging Station Hydrograph for August 2008...............................6 Figure 5. Colorado River Cisco Gaging Station Hydrograph for September 2008 .........................7
Appendix
Appendix A. Photographs of Backwater Channels..................................................................... A-1 Photos 1 and 2. Biota Monitoring July 14, 2008 ........................................................................ A-1 Photos 3 through 6. Biota Monitoring July 17, 2008.................................................................. A-2 Photos 7 and 8. Biota Monitoring July 24, 2008 ........................................................................ A-4 Photos 9 through 11. Biota Monitoring July 29, 2008................................................................ A-5 Photos 12 and 13. Biota Monitoring July 31, 2008 .................................................................... A-7 Photos 14 through 16. Biota Monitoring August 4, 2008........................................................... A-8 Photos 17 through 19. Biota Monitoring August 12, 2008....................................................... A-10 Photos 20 and 21. Biota Monitoring August 27, 2008 ............................................................. A-12
Attachment
Attachment 1. Analytical Results of Select Surface Water Sampling Locations (June through September 2008)
U.S. Department of Energy Moab UMTRA Project Final Report 2008 Biota Monitoring Revision 0 March 2009 DOE-EM/GJTAC1782
Page 1
1.0 Introduction The Moab Uranium Mill Tailings Remedial Action (UMTRA) Project site is a former uranium ore-processing facility located approximately 3 miles northwest of the city of Moab in Grand County, Utah. The plant was constructed in 1956 by the Uranium Reduction Company, which operated the mill until 1962 when the assets were sold to the Atlas Minerals Corporation (Atlas). Operations continued under Atlas until 1984. When the processing operations ceased in 1984, the mill had accumulated an estimated 16 million yards of uranium mill tailings in an unlined impoundment in the floodplain of the Colorado River. The tailings pile covers approximately 130 acres, is about 0.5 mile in diameter, averages about 94 feet (ft) in height above the surface of the Colorado River terrace, and is located about 750 ft west of the Colorado River. Atlas placed an interim cover over the tailings pile as part of the decommissioning activities ongoing between 1988 and 1995. In October 2001, the title of the property and responsibility for remediation of the tailings pile and contaminated ground water beneath the site were transferred to the U.S. Department of Energy (DOE). The results reported in the Site Observational Work Plan for the Moab, Utah, Site (SOWP), show that contaminants have leached from the tailings pile into the ground water. Several site-related contaminants have been identified, but the most pervasive and highest concentration constituent is ammonia. The DOE investigations have identified two plumes of ammonia associated with the site: a deep plume beneath the tailings pile and a shallower plume emanating from the toe of the tailings pile to the Colorado River. Ground water from the shallow plume has been demonstrated to discharge to the Colorado River and to have a localized impact on surface water quality. Degradation of surface water quality is of concern because of potential effects on aquatic species in the area, particularly endangered fish. In its final Biological Opinion issued as part of the DOE’s Final Environmental Impact Statement for the Moab, Utah, UMTRA Project (FEIS), the U.S. Fish and Wildlife Service identified several actions required by DOE to address concerns regarding endangered fish. DOE initiated an interim action in 2003 to pump contaminated ground water from the shallow plume to an evaporation pond and associated sprinkler system on top of the tailings pile. Another interim action includes the injection of diverted Colorado River water into the shallow soils to create a hydraulic barrier reducing discharge of contaminants to the Colorado River. This is accomplished by wells (and an infiltration trench since September 2006) near the west bank of the river. The goal of the action is to reduce contaminant mass in the aquifer and protect potential endangered fish habitat in backwater areas of the river until the final corrective action can be implemented. In its FEIS for remediation of the Moab site, DOE proposed to intercept ground water and control discharge of contaminants to the river until concentrations in the alluvial system are reduced to levels that permit unrestricted discharge to the river. The objective of biota monitoring plan is to evaluate the river channel morphology and the ammonia concentration in the backwater habitat areas adjacent to the Moab site. In 2008, the initial action and biota monitoring were combined into one work plan, with an emphasis on monitoring and diluting concentrations of unionized ammonia in the mixing zone of the Colorado River where suitable habitat may exist. A real-time ammonia sensor was added to the biota monitoring program in 2008 to achieve immediate results in potential endangered habitat areas. If a habitat area has an ammonia concentration above 3 milligrams per liter (mg/L),
U.S. Department of Energy Moab UMTRA Project Final Report 2008 Biota Monitoring Revision 0 March 2009 DOE-EM/GJTAC1782
Page 2
freshwater will be introduced into the channel via a portable water storage tank until the concentration has decreased. 2.0 Background The Colorado Pikeminnow is the primary endangered species present in the Colorado river near the Moab site. Suitable habitat for the Colorado Pikeminnow is slow-moving waters and relatively shallow backwaters. The most favorable habitat areas are backwaters that are connected to the river on the downstream end and closed on the upstream end. The most critical factor for a potential habitat is very low flow velocities. Isolated pools of water are not likely to be considered a habitat area; however, if the pools are surrounded by saturated sediment, it is possible that young-of-year fish may take refuge in these pools until an increase in river flow. Based on observations from 2008, suitable habitats formed adjacent to the Moab site only when the Colorado River discharge was less than 5,810 to 6,780 cubic feet per second (cfs) (as measured at the U.S. Geological Survey [USGS] Cisco gaging station). The configuration of the backwater channel varies from year to year. During the 2008 monitoring season, one main backwater channel flowed from Configuration 3 to Configuration 4 (Figure 1). Throughout varying river flows, certain portions of the channel would be shut off on the upstream or downstream side or sometimes both. In 2008, the backwater channel flowed more consistently through Configurations 1 and 4, or the southernmost portion adjacent to the interim action well field. The backwater channel locations in this report are referred to in relation to the adjacent portion of the interim action well field. For instance, the Configuration 2 backwater channel refers to the portion of the backwater channel, east of Configuration 2 (Figure 1). All of the Colorado River discharge rates mentioned in the text are instantaneous river flows that were recorded at specific time within a day. The river discharge rates shown in the hydrographs and in Appendix A are mean daily flows. 3.0 Results 3.1 June 2008 Summary The Colorado River discharge along the Moab site varied from 18,900 to 39,500 cfs (Figure 2) in June 2008. The June monthly sampling took place from June 9 to 11, 2008, and the site-wide routine sampling was conducted from June 2 to 4, 2008. At this time, the river flow varied between 27,400 and 39,500 cfs, which is too high for the formation of suitable backwater habitats. Sample results from early to mid June indicate that the ammonia levels in the surface water were all 0.1 mg/L (the detection limit).

U.S. Department of Energy Moab UMTRA Project Final Report 2008 Biota Monitoring Revision 0 March 2009 DOE-EM/GJTAC1782
Page 3
Figure 1. Map of Channel Locations

U.S. Department of Energy Moab UMTRA Project Final Report 2008 Biota Monitoring Revision 0 March 2009 DOE-EM/GJTAC1782
Page 4
Figure 2. Colorado River Cisco Gaging Station Hydrograph for June 2008
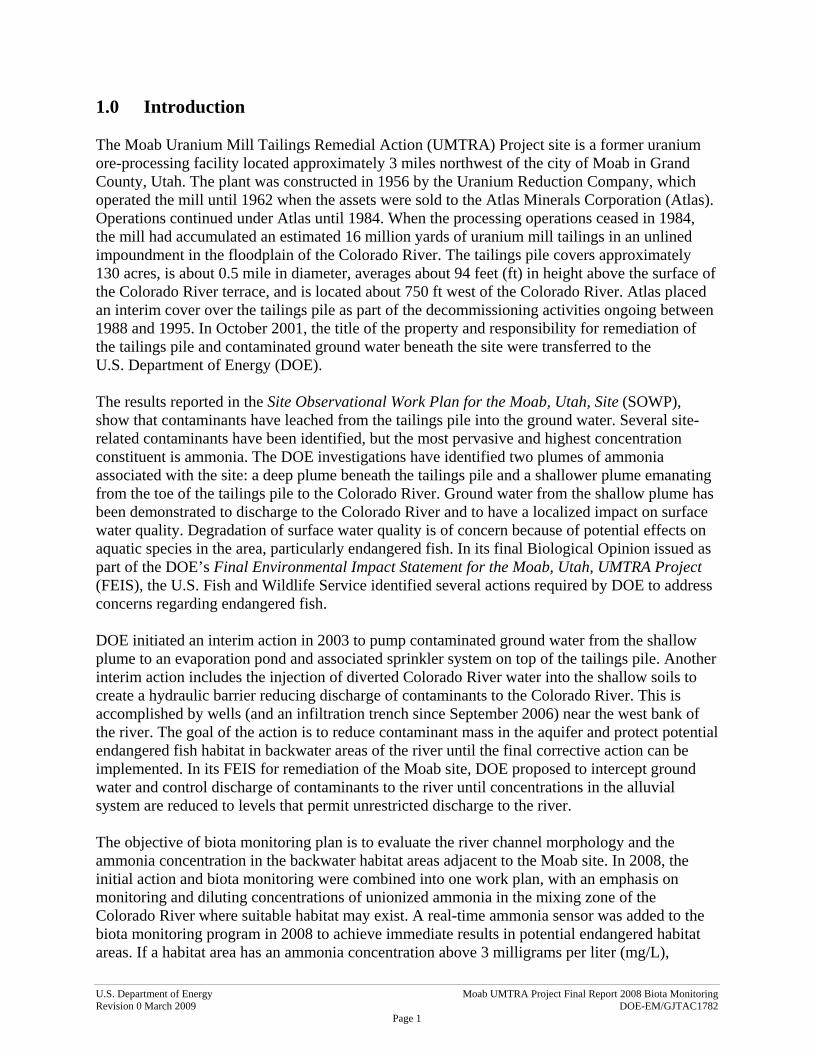
3.2 July 2008 Summary The Colorado River discharge along the Moab site varied from 6,100 to 18,700 cfs (Figure 3) in July 2008. In response to the high runoff, up to 3 feet of sediment was deposited in the backwater channels, significantly changing the morphology observed in previous years. The July routine sampling took place from June 30 to July 1, the July surface water/ground water (SW/GW) interaction sampling took place July 8 to 10, and the July monthly sampling took place July 14 to 24. Sample results from July indicate that most of the ammonia levels in the surface water were 0.1 mg/L (the detection limit). Surface water location 0226 (approximately 450 ft downriver from the Moab site) had an ammonia concentration of 0.18 mg/L on June 30, and surface water location 0241 (adjacent to the baseline area) had an ammonia concentration of 0.24 mg/L on July 10. These values are below the acute and chronic action levels based on pH and temperature. Biota monitoring commenced on July 14 when the river flow was 9,720 cfs. Many of the secondary channels that flowed in 2007 were silted in from the above average spring runoff. On July 14, one secondary backwater channel extended north from Configuration 3 to Configuration 4 (southernmost end of the well field). The species of most concern adjacent to the Moab site is the Colorado Pikeminnow, which prefers shallow secondary channels that are connected on the downriver side only. The observed channel was open to the river both upriver and downriver, so it was not considered a habitat area.
Routine Sampling Event
Monthly Sampling Event
U.S. Department of Energy Moab UMTRA Project Final Report 2008 Biota Monitoring Revision 0 March 2009 DOE-EM/GJTAC1782
Page 5
Figure 3. Colorado River Cisco Gaging Station Hydrograph for July 2008
The secondary channel flowed through the habitat area until the river flow decreased to 6,780 cfs on July 29. At this time, the channel became much shallower and was barely connected upriver, adjacent to Configuration 3, and downriver, adjacent to Configuration 2. A surface water sample collected from the channel near the upriver portion had an ammonia concentration of 0.1995 mg/L, which is below the chronic or acute threshold for Colorado Pikeminnow. During this time, the backwater channel remained open both upriver and down-river adjacent to Configurations 1 and 4. This same pattern of backwater channel morphology was observed in both 2006 and 2007. An isolated pocket of water located between Configurations 2 and 3 had an ammonia concentration of 3.10 mg/L (measured with the ammonia sensor), which was below the acute and chronic criteria based on temperature and pH. The temperature in this pocket of water was 36.12 Celsius, no fish were observed, and it was not considered a habitat since it was not open to the river downstream. On July 31, the river flow had decreased to 5,810 cfs, and the main secondary channel adjacent to Configurations 3 and 2 was no longer connected to the river. The channel consisted of slightly disconnected pockets of shallow water. No fish were observed at this time. This channel was documented as a habitat area when the river flow was between 5,810 and 6,780 cfs (July 31). 3.3 August 2008 The Colorado River discharge along the Moab site varied from 4,010 to 7,360 cfs (Figure 4) in August 2008. The August monthly sampling took place from August 3 to 14. Sample results from August indicate that most of the ammonia levels in the surface water were 0.1 mg/L (the detection limit).
Monthly Sampling Event
Routine Sampling Event
SW/GW Sampling Event
Biota Monitoring Begins
Habitat Formed in Backwater Channel

U.S. Department of Energy Moab UMTRA Project Final Report 2008 Biota Monitoring Revision 0 March 2009 DOE-EM/GJTAC1782
Page 6
Figure 4. Colorado River Cisco Gaging Station Hydrograph for August 2008
A rainstorm the weekend of August 8 to 10 resulted in a river flow of nearly 8,000 cfs early in the week. During this time, the main backwater channel flowed adjacent to Configuration 3, and south to Configuration 4. On August 12, the main backwater channel was irregular and discontinuous throughout the area adjacent to Configurations 3 and 2. An isolated pool of water containing fish was identified near the Configuration 2 well points, and a habitat area (open to the river downstream only) was identified on the south end of Configuration 2. Both of these locations were tested for ammonia using the sensor. The isolated pool contained an ammonia concentration of 0.0329 mg/L, and the habitat area contained an ammonia concentration of 0.0392 mg/L. These levels were below the chronic and acute criteria based on temperature and pH. As the river flow decreased during the day, the main backwater channel was once again dry adjacent to Configurations 3 and 2. It was documented that a habitat area forms adjacent to Configuration 2 when the flow is 6,300 cfs. The backwater channel adjacent to Configurations 1 and 4 was still open both upriver and downriver and thus was not considered a habitat. 3.4 September 2008 The Colorado River discharge along the Moab site varied from 4,380 to 5,550 cfs (Figure 5) in September 2008. The September monthly sampling took place from September 2 to 11, and the SW/GW investigation sampling took place September 29 to 30. Analytical results from surface water locations 0216 (adjacent to Configuration 1) and 0243 (adjacent to the baseline area on the river edge) consisted of ammonia concentrations of 0.31 and 0.27 mg/L. These values are below the acute and chronic action levels based on pH and temperature.
Monthly Sampling Event
Habitat Formed in Backwater Channel

U.S. Department of Energy Moab UMTRA Project Final Report 2008 Biota Monitoring Revision 0 March 2009 DOE-EM/GJTAC1782
Page 7
Figure 5. Colorado River Cisco Gaging Station Hydrograph for September 2008
During September 2008, the backwater channel adjacent to Configurations 3 and 2 remained dry, and the channel adjacent to Configurations 1 and 4 remained open to the river both upstream and downstream. Therefore, no habitat areas were observed during the month. 4.0 Conclusions and Recommendations
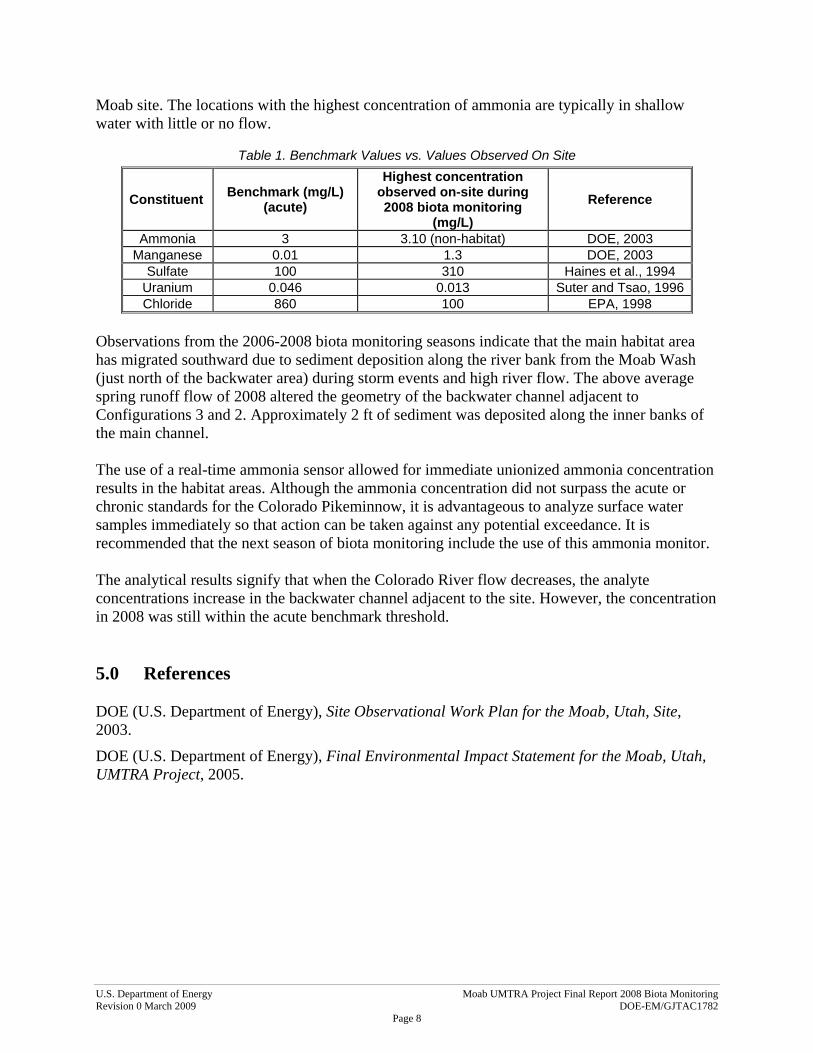
During the 2008 season of biota monitoring, the backwater channel that extends from Configuration 3 to 2 met the definition of a habitat area when the river flow ranged from 5,810 to 6,780 cfs, which is similar to what was observed in 2007. In 2007, Configuration 1 was a habitat area when the flow was approximately 3,300 cfs. However, in 2008, the river flow did not decrease past 4,010 cfs during the biota monitoring season. The constituent of most concern to the habitat is unionized ammonia due to its bioavailability. Table 1 compares the acute benchmark for the constituents of concern with the highest concentration observed on site during the 2008 biota monitoring. The concentration of unionized ammonia varies with water temperature and pH. According to the SOWP, the acute ammonia criteria for the Moab site backwaters is 3 mg/L (Table 1). All of the locations sampled during the 2008 biota monitoring season were below the acute and chronic levels, based on temperature and pH. Only one backwater location surpassed an ammonia concentration of 3 mg/L; however, that concentration was measured in an isolated pocket of water, not a habitat area. In addition, all of the uranium and chloride samples were below the acute aquatic benchmarks (Table 1). However, manganese and sulfate concentrations in the backwater channel were above acute benchmark thresholds. Review of data in the SOWP indicates that the background concentration of these two constituents are higher in the general vicinity and are not necessarily a direct impact of the
Monthly Sampling Event
SW/GW Sampling Event
U.S. Department of Energy Moab UMTRA Project Final Report 2008 Biota Monitoring Revision 0 March 2009 DOE-EM/GJTAC1782
Page 8
Moab site. The locations with the highest concentration of ammonia are typically in shallow water with little or no flow.
Table 1. Benchmark Values vs. Values Observed On Site
Constituent Benchmark (mg/L) (acute)
Highest concentration observed on-site during 2008 biota monitoring
(mg/L) Reference
Ammonia 3 3.10 (non-habitat) DOE, 2003 Manganese 0.01 1.3 DOE, 2003
Sulfate 100 310 Haines et al., 1994 Uranium 0.046 0.013 Suter and Tsao, 1996Chloride 860 100 EPA, 1998
Observations from the 2006-2008 biota monitoring seasons indicate that the main habitat area has migrated southward due to sediment deposition along the river bank from the Moab Wash (just north of the backwater area) during storm events and high river flow. The above average spring runoff flow of 2008 altered the geometry of the backwater channel adjacent to Configurations 3 and 2. Approximately 2 ft of sediment was deposited along the inner banks of the main channel. The use of a real-time ammonia sensor allowed for immediate unionized ammonia concentration results in the habitat areas. Although the ammonia concentration did not surpass the acute or chronic standards for the Colorado Pikeminnow, it is advantageous to analyze surface water samples immediately so that action can be taken against any potential exceedance. It is recommended that the next season of biota monitoring include the use of this ammonia monitor. The analytical results signify that when the Colorado River flow decreases, the analyte concentrations increase in the backwater channel adjacent to the site. However, the concentration in 2008 was still within the acute benchmark threshold.
5.0 References DOE (U.S. Department of Energy), Site Observational Work Plan for the Moab, Utah, Site, 2003.
DOE (U.S. Department of Energy), Final Environmental Impact Statement for the Moab, Utah, UMTRA Project, 2005.

U.S. Department of Energy Moab UMTRA Project Final Report 2008 Biota Monitoring Revision 0 March 2009 DOE-EM/GJTAC1782
Page A-1
Appendix A Photographs of Backwater Channels
July 14, 2008 Daily Mean River Flow 10,400 cfs First Day of Biota Monitoring
On July 14, the main backwater channel was connected to the river on the upstream side (Photo 1). This channel extended from the area adjacent to Configuration 3, south towards Configuration 1 (Photo 2).
Photo 1. Area Adjacent to Configuration 3, Facing East, July 14, 2008
Photo 2. Area Adjacent to Configuration 2, Looking West, July 14, 2008

U.S. Department of Energy Moab UMTRA Project Final Report 2008 Biota Monitoring Revision 0 March 2009 DOE-EM/GJTAC1782
Page A-2
July 17, 2008 Daily Mean River Flow 8,660 cfs
On July 17, the main backwater channel was still open upstream (Photo 3) and continued through the areas adjacent to Configuration 2 (Photos 4 and 5) and 1 (Photo 6).
Photo 3. Area Adjacent to Configuration 3, Facing North, July 17, 2008
Photo 4. Area Adjacent to Configuration 2, Facing North, July 17, 2008

U.S. Department of Energy Moab UMTRA Project Final Report 2008 Biota Monitoring Revision 0 March 2009 DOE-EM/GJTAC1782
Page A-3
Photo 5. Area Adjacent to Configuration 2, Facing South, July 17, 2008
Photo 6. Area Adjacent to Configuration 1, Facing East, July 17, 2008

U.S. Department of Energy Moab UMTRA Project Final Report 2008 Biota Monitoring Revision 0 March 2009 DOE-EM/GJTAC1782
Page A-4
July 24, 2008 Daily Mean River Flow 7,790 cfs On July 24, the main backwater channel was barely connected upstream adjacent to Configuration 3 (Photo 7). A stagnant pocket of water was located adjacent to Configuration 2 (Photo 8).
Photo 7. Area Adjacent to Configuration 3, Facing North, July 24, 2008
Photo 8. Area Adjacent to Configuration 3, Facing South, July 24, 2008

U.S. Department of Energy Moab UMTRA Project Final Report 2008 Biota Monitoring Revision 0 March 2009 DOE-EM/GJTAC1782
Page A-5
July 29, 2008 Daily Mean River Flow 7,030 cfs
On July 29, the main backwater channel was more discontinuous and contained some isolated pockets of water (Photo 9). The channel was still connected to the river downstream through the areas adjacent to Configurations 2 and 1 (Photos 10 and 11).
Photo 9. Area Adjacent to Configuration 2, Facing Southeast, July 29, 2008
Photo 10. Area Adjacent to Configuration 2, Facing South, July 29, 2008

U.S. Department of Energy Moab UMTRA Project Final Report 2008 Biota Monitoring Revision 0 March 2009 DOE-EM/GJTAC1782
Page A-6
Photo 11. Backwater Channel Adjacent to Configurations
2 and 1, Facing South, July 29, 2008

U.S. Department of Energy Moab UMTRA Project Final Report 2008 Biota Monitoring Revision 0 March 2009 DOE-EM/GJTAC1782
Page A-7
July 31, 2008 Daily Mean River Flow 6,100 cfs
On July 31, the main backwater channel was nearly dry and consisted of isolated pockets of water (Photos 12 and 13).
Photo 12. Area Adjacent to Configuration 3, Facing South, July 31, 2008
Photo 13. Area Adjacent to Configuration 2, Facing South, July 31, 2008
U.S. Department of Energy Moab UMTRA Project Final Report 2008 Biota Monitoring Revision 0 March 2009 DOE-EM/GJTAC1782
Page A-8
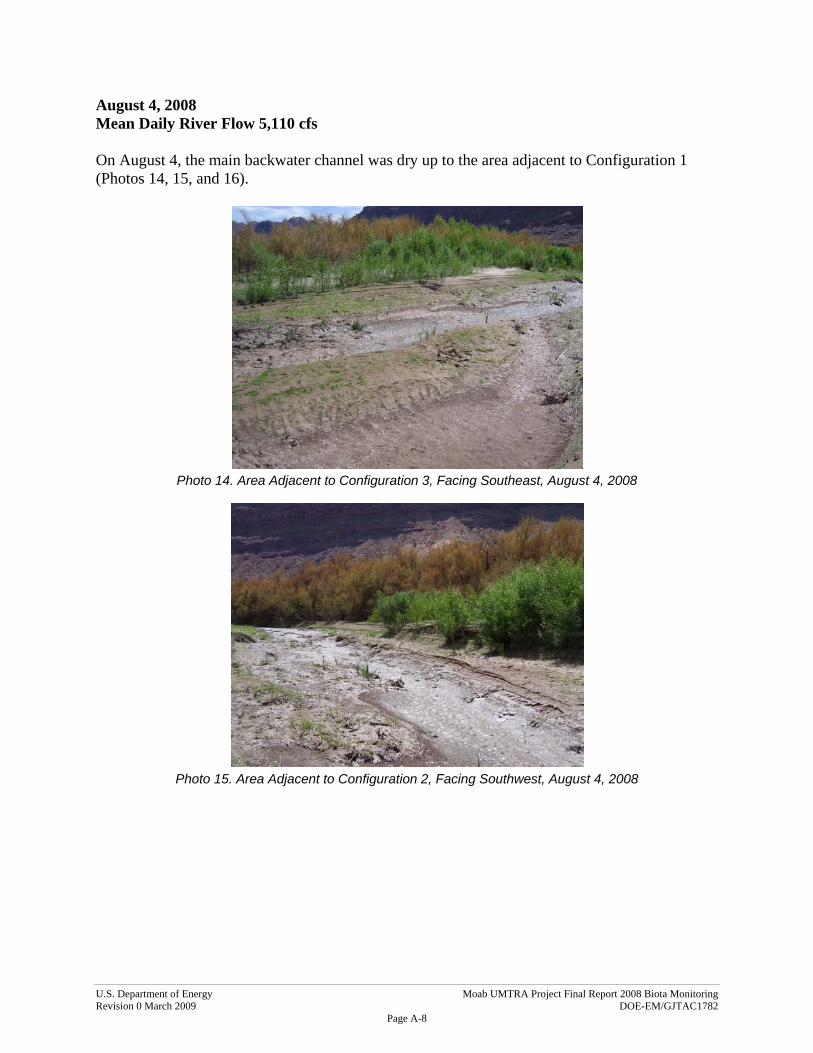
August 4, 2008 Mean Daily River Flow 5,110 cfs
On August 4, the main backwater channel was dry up to the area adjacent to Configuration 1 (Photos 14, 15, and 16).
Photo 14. Area Adjacent to Configuration 3, Facing Southeast, August 4, 2008
Photo 15. Area Adjacent to Configuration 2, Facing Southwest, August 4, 2008

U.S. Department of Energy Moab UMTRA Project Final Report 2008 Biota Monitoring Revision 0 March 2009 DOE-EM/GJTAC1782
Page A-9
Photo 16. Area Adjacent to Configuration 2, Facing South, August 4, 2008

U.S. Department of Energy Moab UMTRA Project Final Report 2008 Biota Monitoring Revision 0 March 2009 DOE-EM/GJTAC1782
Page A-10
August 12, 2008 Daily Mean River Flow 6,470 cfs An early August monsoonal storm led to an increase in river flow. As a result, the main backwater channel was barely connected to the river on the upstream side (Photo 17). The backwater channel flowed through to the area adjacent to Configurations 2 and 1 (Photos 18 and 19).
Photo 17. Area Adjacent to Configuration 3, Facing Northeast, August 12, 2008
Photo 18. Area Adjacent to Configuration 2, Facing South, August 12, 2008

U.S. Department of Energy Moab UMTRA Project Final Report 2008 Biota Monitoring Revision 0 March 2009 DOE-EM/GJTAC1782
Page A-11
Photo 19. Area Adjacent to Configurations 1 and 2, Facing South, August 12, 2008
U.S. Department of Energy Moab UMTRA Project Final Report 2008 Biota Monitoring Revision 0 March 2009 DOE-EM/GJTAC1782
Page A-12
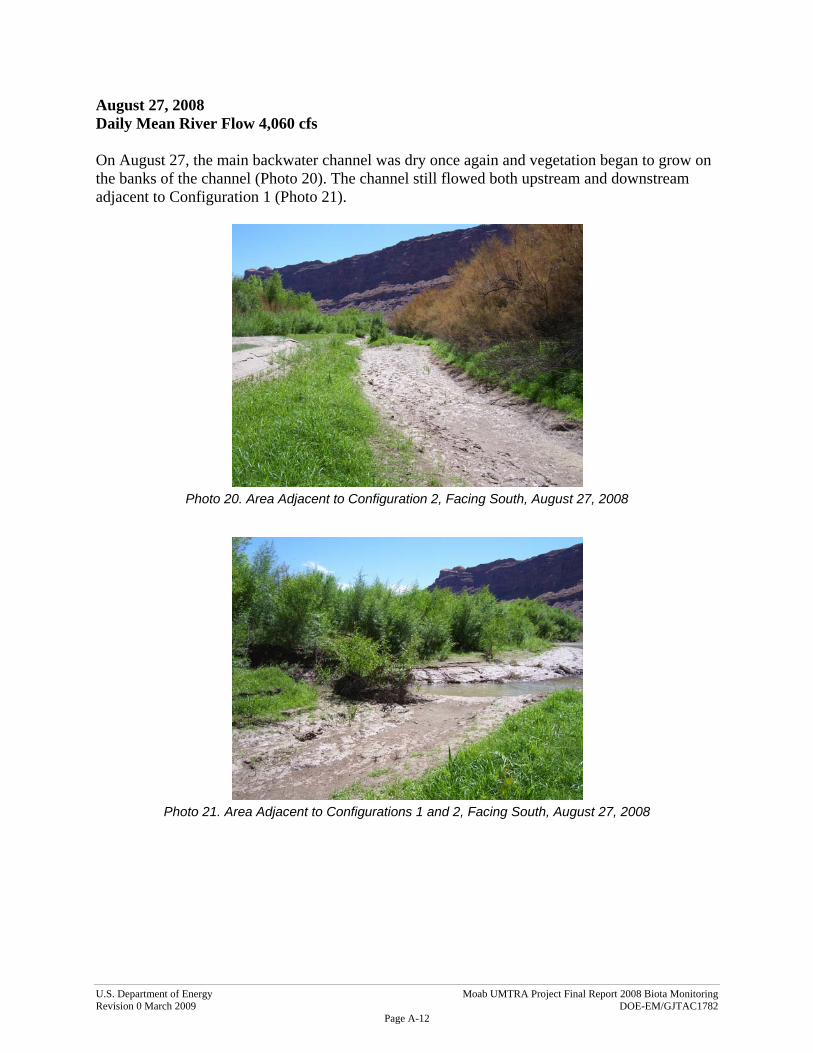
August 27, 2008 Daily Mean River Flow 4,060 cfs
On August 27, the main backwater channel was dry once again and vegetation began to grow on the banks of the channel (Photo 20). The channel still flowed both upstream and downstream adjacent to Configuration 1 (Photo 21).
Photo 20. Area Adjacent to Configuration 2, Facing South, August 27, 2008
Photo 21. Area Adjacent to Configurations 1 and 2, Facing South, August 27, 2008
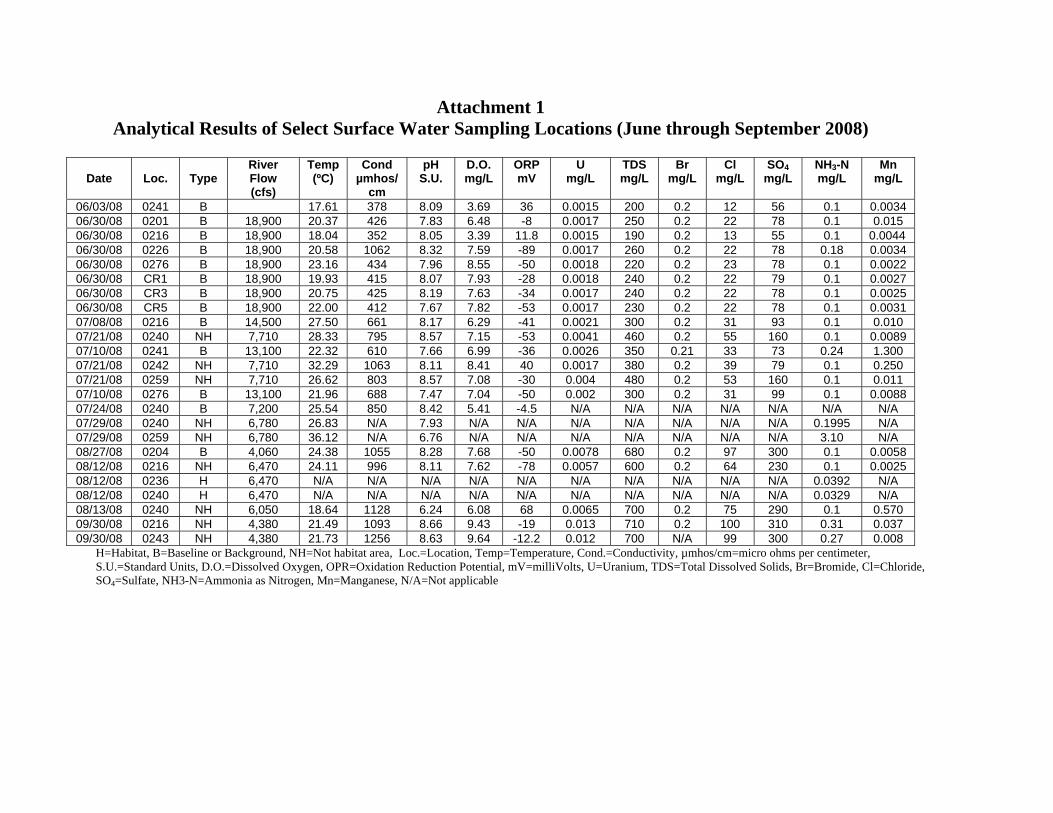
Attachment 1 Analytical Results of Select Surface Water Sampling Locations (June through September 2008)
Date
Loc.
Type River Flow (cfs)
Temp (ºC)
Cond µmhos/
cm
pH S.U.
D.O. mg/L
ORP mV
U mg/L
TDS mg/L
Br mg/L
Cl mg/L
SO4 mg/L
NH3-N mg/L
Mn mg/L
06/03/08 0241 B 17.61 378 8.09 3.69 36 0.0015 200 0.2 12 56 0.1 0.0034 06/30/08 0201 B 18,900 20.37 426 7.83 6.48 -8 0.0017 250 0.2 22 78 0.1 0.015 06/30/08 0216 B 18,900 18.04 352 8.05 3.39 11.8 0.0015 190 0.2 13 55 0.1 0.0044 06/30/08 0226 B 18,900 20.58 1062 8.32 7.59 -89 0.0017 260 0.2 22 78 0.18 0.0034 06/30/08 0276 B 18,900 23.16 434 7.96 8.55 -50 0.0018 220 0.2 23 78 0.1 0.0022 06/30/08 CR1 B 18,900 19.93 415 8.07 7.93 -28 0.0018 240 0.2 22 79 0.1 0.0027 06/30/08 CR3 B 18,900 20.75 425 8.19 7.63 -34 0.0017 240 0.2 22 78 0.1 0.0025 06/30/08 CR5 B 18,900 22.00 412 7.67 7.82 -53 0.0017 230 0.2 22 78 0.1 0.0031 07/08/08 0216 B 14,500 27.50 661 8.17 6.29 -41 0.0021 300 0.2 31 93 0.1 0.010 07/21/08 0240 NH 7,710 28.33 795 8.57 7.15 -53 0.0041 460 0.2 55 160 0.1 0.0089 07/10/08 0241 B 13,100 22.32 610 7.66 6.99 -36 0.0026 350 0.21 33 73 0.24 1.300 07/21/08 0242 NH 7,710 32.29 1063 8.11 8.41 40 0.0017 380 0.2 39 79 0.1 0.250 07/21/08 0259 NH 7,710 26.62 803 8.57 7.08 -30 0.004 480 0.2 53 160 0.1 0.011 07/10/08 0276 B 13,100 21.96 688 7.47 7.04 -50 0.002 300 0.2 31 99 0.1 0.0088 07/24/08 0240 B 7,200 25.54 850 8.42 5.41 -4.5 N/A N/A N/A N/A N/A N/A N/A 07/29/08 0240 NH 6,780 26.83 N/A 7.93 N/A N/A N/A N/A N/A N/A N/A 0.1995 N/A 07/29/08 0259 NH 6,780 36.12 N/A 6.76 N/A N/A N/A N/A N/A N/A N/A 3.10 N/A 08/27/08 0204 B 4,060 24.38 1055 8.28 7.68 -50 0.0078 680 0.2 97 300 0.1 0.0058 08/12/08 0216 NH 6,470 24.11 996 8.11 7.62 -78 0.0057 600 0.2 64 230 0.1 0.0025 08/12/08 0236 H 6,470 N/A N/A N/A N/A N/A N/A N/A N/A N/A N/A 0.0392 N/A 08/12/08 0240 H 6,470 N/A N/A N/A N/A N/A N/A N/A N/A N/A N/A 0.0329 N/A 08/13/08 0240 NH 6,050 18.64 1128 6.24 6.08 68 0.0065 700 0.2 75 290 0.1 0.570 09/30/08 0216 NH 4,380 21.49 1093 8.66 9.43 -19 0.013 710 0.2 100 310 0.31 0.037 09/30/08 0243 NH 4,380 21.73 1256 8.63 9.64 -12.2 0.012 700 N/A 99 300 0.27 0.008
H=Habitat, B=Baseline or Background, NH=Not habitat area, Loc.=Location, Temp=Temperature, Cond.=Conductivity, µmhos/cm=micro ohms per centimeter, S.U.=Standard Units, D.O.=Dissolved Oxygen, OPR=Oxidation Reduction Potential, mV=milliVolts, U=Uranium, TDS=Total Dissolved Solids, Br=Bromide, Cl=Chloride, SO4=Sulfate, NH3-N=Ammonia as Nitrogen, Mn=Manganese, N/A=Not applicable