doe technical assistance program · doe technical assistance program date: nov. 10, 2010 ... best...
TRANSCRIPT

1 | TAP Webinar eere.energy.gov
The Parker Ranch installation in Hawaii
DOE Technical Assistance Program
Date: Nov. 10, 2010
2:00-3:00pm EST
EM&V Basics, Tools and Resources
to Assist EECBG and SEP Grantees
Presenters: Julie Michals, Northeast Energy Efficiency Partnerships, Inc.
Phil Sieper, Cadmus Group
Mark Stetz, Stetz Consulting

2 | TAP Webinar eere.energy.gov
What is TAP?
DOE’s Technical Assistance Program (TAP) supports the Energy
Efficiency and Conservation Block Grant Program (EECBG) and the
State Energy Program (SEP) by providing state, local, and tribal officials
the tools and resources needed to implement successful and
sustainable clean energy programs.
3 | TAP Webinar eere.energy.gov
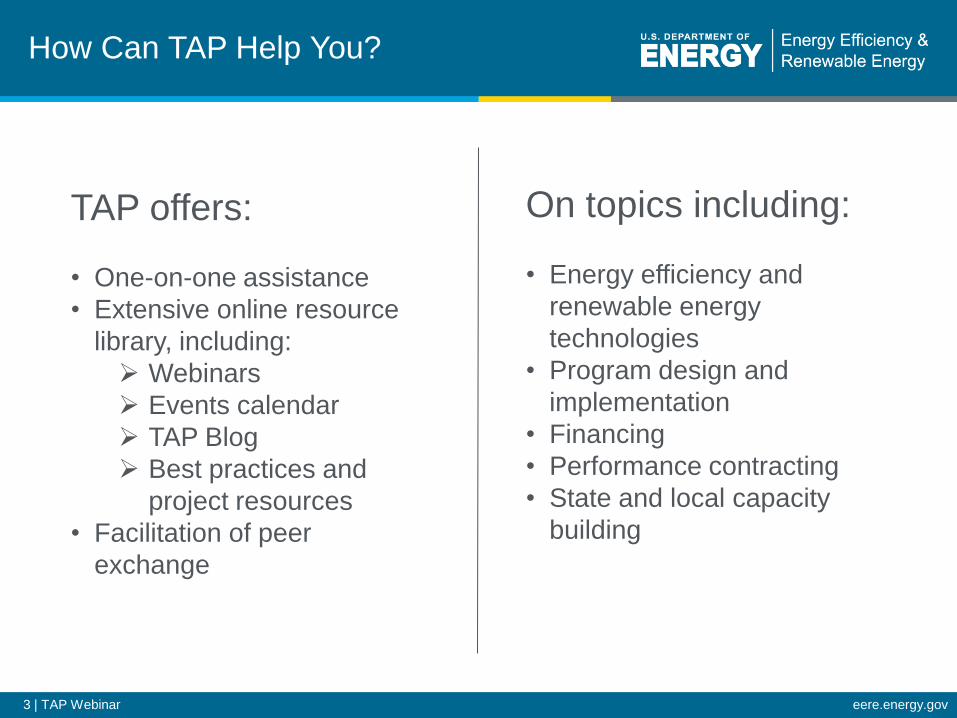
How Can TAP Help You?
TAP offers:
• One-on-one assistance
• Extensive online resource
library, including:
Webinars
Events calendar
TAP Blog
Best practices and
project resources
• Facilitation of peer
exchange
On topics including:
• Energy efficiency and
renewable energy
technologies
• Program design and
implementation
• Financing
• Performance contracting
• State and local capacity
building

4 | TAP Webinar eere.energy.gov
The TAP Blog
Provides a platform for
state, local, and tribal
government officials
and DOE’s network of
technical and
programmatic experts
to connect and share
best practices on a
variety of topics.
Access the TAP Blog!http://www.eereblogs.energy.gov/tap/

5 | TAP Webinar eere.energy.gov
Accessing TAP Resources
3) Ask questions via our call center at
1-877-337-3827 or email us at
We encourage you to:
1) Explore our online resources
via the Solution Center2) Submit a request via the
Technical Assistance Center

6 | TAP Webinar eere.energy.gov

7 | TAP Webinar eere.energy.gov
OVERVIEW
1. What is EM&V, and why is it important?
2. DOE Guidance on EM&V to Date
3. Initial Project Savings Estimates Using Available
Data and Tools/Calculators
4. Data Collection, Tracking Tools and M&V
Options/Approaches
1. If doing limited EM&V (few/no EM&V resources)
2. If doing third party evaluations
5. Reporting Energy Savings
6. Q&A

8 | TAP Webinar eere.energy.gov
What is EM&V?
• Measurement & Verification: collects data to support
energy savings for an efficiency measure, project or
facility using site surveys, metering of energy
consumption, monitoring of certain variables, and
verification
• Evaluation: Refers to measuring the performance of
programs, or collections of projects (which can include
M&V for a statistically significant sample of individual
projects) forming the basis for calculating total
program/project savings

9 | TAP Webinar eere.energy.gov
EM&V used to determine:
Gross Savings: The change in energy consumption
and/or demand that results directly from (ARRA) program
or project-related actions taken by participants, regardless
of why they participated
Net Savings: The change in energy consumption and/or
demand that is attributable to specific (ARRA) program(s)
or project(s) that would not have occurred in the absence of
the program(s) or project(s)
GROSS and NET SAVINGS

10 | TAP Webinar eere.energy.gov
EM&V supports credibility of efficiency to:
1. Create jobs
2. Track cost-effectiveness of efficiency projects, how much
$$ is being saved (lower electricity bills), and help
plan/inform future projects
3. Reduce air pollution
4. Meet city/community and state climate change goals
Consistency in EM&V approaches/methods used across
ARRA Grantees is important, so we can add up collective
impact of efficiency investments across the country, along
with other efficiency programs (e.g., ratepayer funded
efficiency, weatherization programs, etc.)
Why is EM&V Important?

11 | TAP Webinar eere.energy.gov
Energy Savings Measurement
The basic equation that EM&V addresses:
Annual Energy Savings = Baseline - Post-retrofit ± Adjustments
Where Baseline (i.e., Base Year energy use) is what would have
been the energy use in the absence of the retrofit project
(program), Post Retrofit is energy use after the retrofit project, and
controlling for Adjustments to capture significant changes that did
not exist in the base year (e.g., changes in square footage, weather
differences/normalization, changes in operational hours, additions
of load e.g., new computers)

12 | TAP Webinar eere.energy.gov
1. How are you going to estimate and/or evaluate
savings from your energy efficiency project? i.e.,
what method/approach will you use?
2. What data will you collect to support your energy
savings estimate and/or evaluation, and how will
you analyze it?
3. How will you track and report the savings data to
DOE?
EM&V Planning/Considerations

13 | TAP Webinar eere.energy.gov
DOE Guidance on EM&V to Date(& Available Tools)
• EM&V not required as part of Grantees award agreement
• Estimates can be calculated using Recovery Act Benefits
Calculator http://www1.eere.energy.gov/wip/guidance.html but not intended
to replace EM&V
• Grantees with resources to conduct more sophisticated EM&V
efforts encouraged to conduct studies in accordance with Program
Notice 10-017, and encouraged to share results with DOE through
Project Officers. Guidelines at http://www1.eere.energy.gov/wip/pdfs/eecbg_evaluation_guidelines_10_017.pdf
• Measure and track post-installation energy performance of a building
or building stock, preferably at the whole building level, with
adjustments to weather normalize. Useful, available no-cost tool =
ENERGY STAR’s Portfolio Manager Tool

14 | TAP Webinar eere.energy.gov
DOE Savings Estimate Tools Let’s Start with the Most Basic ...
Recovery Act Benefits Calculator:
EECBG and SEP Program Notices 10-07B and 10-006A refer
recipients to calculator that can estimate energy savings
from efficiency projects by identifying measures installed
Provides high level estimates of savings and emissions, not
intended to replace contractor or engineering estimates
Basic data entered e.g., # units installed, HP, square footage,
etc. Assumptions and algorithms built into the calculator, no
direct EM&V involved
Includes Residential Retrofit and Non-Residential Retrofit
Useful for initial savings estimates or if no available EM&V
resources
http://www1.eere.energy.gov/wip/solutioncenter/calculator/default.aspx

15 | TAP Webinar eere.energy.gov
ENERGY STAR Portfolio Manager
Useful tool, available at no cost to grantees:
www.energystar.gov/benchmark
Whole Building approach for commercial retrofit projects:
• Uses basic building data - square footage, building type, hours
of operation, zip code, and utility bill energy use (12 month
pre-installation, at least 4 months post-installation)
• Provides weather-normalized baseline and post-installation
building energy performance
• For M&V, use IPMVP Option C approach (discussed later)
• Refer to earlier TAN Portfolio Manager webinars
Trainings available at www.energystar.gov/businesstraining

16 | TAP Webinar eere.energy.gov
DOE Guidance on EM&V – for GranteesConducting 3rd Party Evaluations
Guidelines for States Conducting or Contracting Evaluations of ARRA
Funded SEP Activities (using 3rd party contractors): http://www1.eere.energy.gov/wip/pdfs/evaluation_webinar_slides_june16_2010.
High level guidelines/standards on:
• Evaluation Metrics – energy/demand savings, carbon emission
reductions, job creation
• Independent Evaluations – by 3rd independent party
• Attribution of Effects – net effects due to SEP funds, with guidance
on allocation of effects for jointly funded projects
• Evaluation Budgeting – recommends 5% or less of project budget
• Timing of Evaluation – evaluation planning to start at same time as
when projects are initiated, determine baseline approach, data
collection and analysis efforts
Continued…

17 | TAP Webinar eere.energy.gov
DOE Guidance on EM&V – for GranteesConducting 3rd Party Evaluations cont.
High level guidelines/standards cont:
• State of the Art Analysis – evaluation approach should use current
state of the art evaluation approaches and analysis methods
• Evaluation Rigor and Reliability: Study should be as reliable as
possible within study approach and budget limits
• Study Design and Study Plan: Study methods/approach, tasks to be
conducted, detailed data collection approach, detailed analysis
approach for energy and demand savings
• Sampling and Statistical Significance: minimize bias and maximize
representativeness of the population. Sample to be no less rigorous
than 90% confidence level with +/- 10% precision
• M&V Approaches: analytic approach, baseline and post-installation
operation assessments should use IPMVP field data collection
frameworks (discussed later)

18 | TAP Webinar eere.energy.gov
Initial Savings Estimates
• Can use DOE Recovery Benefits Calculator
• Can refer to existing state energy efficiency program
administrator data assumptions and algorithms where data is not
available or not collected:
For example:
California DEER Database: http://www.energy.ca.gov/deer/
NW Regional Technical Forum: http://www.nwcouncil.org/energy/rtf/
Other state savings assumptions documents for: CT, MA, ME, NJ, NY, VT,
PA and multi-state TRM (MD, DC, DE) http://neep.org/emv-
forum/emv-library/research-evaluation-studies

19 | TAP Webinar eere.energy.gov
Initial Savings EstimatesCommercial Lighting Retrofit Example:
Algorithms for Energy and Demand Savings:
kWh Saved = (Quantitybaseline x Wattsbaseline) – (Quantityinstalled x Wattsinstalled) /
(1000 × (Annual Operating Hours))
kW Saved = (Quantitybaseline x Wattsbaseline) – (Quantityinstalled x Wattsinstalled) /
(1000 x (Coincidence Factor))
Where:
Baseline Fixture Quantity = number of existing fixtures
Baseline Fixture Wattage = connected wattage of the existing fixture for C&I retrofit
Installed Fixture Quantity = number of installed fixtures
Installed Fixture Wattage = rated wattage of the installed fixture, inclusive of both lamp
and ballast. Obtained from nameplate data
Annual Hours = number of operating hours for the fixture in a typical year, either site-
specific or assigned by building type (assumed to remain constant)
Summer Coincidence = ratio of peak demand at the same time as a “summer” period to
the peak demand across all periods
Winter Coincidence = ratio of peak demand at the same time as a “winter” period to the
peak demand across all periods

20 | TAP Webinar eere.energy.gov
1. Approaches/methods range from simple and direct to complex
and indirect, sometimes combined, where more complex
methods generally require more detailed data and higher cost
2. Guidelines for good measurement/analysis include: US DOE/EPA Model Energy Efficiency Program Impact Evaluation Guide
http://www.epa.gov/cleanenergy/documents/suca/evaluation_guide.pdf
CA Evaluation Protocols: http://www.calmac.org
Regional EM&V Forum Guidelines: http://neep.org/emv-forum/forum-
products-and-guidelines
NW Regional Technical Forum Protocols
U.S. FEMP M&V Guidelines: Measurement and Verification for Federal Energy Projects Version 3.0, 2008 http://mnv.lbl.gov/
ASHRAE Guideline 14: Measurement of Energy and Demand Savings (2002) –updated version forthcoming 2011. www.ashrae.org
Most refer to IPMVP: The International Performance Measurement &
Verification Protocol (IPMVP Vol 1, 2010 www.evo-world.org)
Which EM&V Approach to Use for Energy Savings?

21 | TAP Webinar eere.energy.gov
Measurement & Verification
2 key components to M&V:
• Verify potential to generate savings
• Determine savings
Lighting retrofit example:
Before After
100 Watts/fixture 23 Watts/fixture
Savings: Determined by how many fixtures installed and
operating hours

22 | TAP Webinar eere.energy.gov
Questions:
Were baseline conditions accurately defined? (Were proper equipment/systems installed?)
Are the systems performing to specification? (Do systems have potential to generate predicted savings?)
Is there continuing potential for savings?
Baseline and Post-Installation Conditions Are Verified Using:
Inspections
Spot measurement tests
Commissioning activities
Verifying Potential to Save Energy

23 | TAP Webinar eere.energy.gov
Determining Savings RequiresTwo Types of Meters
250,000
500,000
750,000
1,000,000
kW
h
Baseline Period Performance Period
Watt-hour Meter
What Would Have Happened Meter

24 | TAP Webinar eere.energy.gov
What Would Have Happened?
• What would have happened meter “measures” the base year
energy use (or baseline)
• What would have happened (and the savings) are determined
using one or more of the following M&V methods:
Engineering calculations
End-use metering (A, B)
Whole building (utility) meters (C) – DOE preference as a minimum
Calibrated computer simulation (D)
• International Performance Measurement and Verification
Protocol (IPMVP) provides framework for definitions and methods
for four options
• IPMVP does NOT cover evaluation activities (sampling, net
savings, cost of M&V activities, or design of meter and
instrumentation systems)

25 | TAP Webinar eere.energy.gov
M&V STEPS
Regardless of the M&V approach, similar steps taken to “measure & verify” savings:
Step 1: Gather the baseline data (energy, demand and
operating conditions)
Step 2: Develop a Project Specific M&V Plan
Step 3: Verify the proper equipment/systems were installed
and are performing to specification - potential to
perform
Step 4: Gather post-retrofit measured data and compute
energy and demand savings (and cost avoidance) as
defined in the M&V Plan - actual performance

26 | TAP Webinar eere.energy.gov
M&V Approaches
Approach Advantages Disadvantages Comments
Engineering
Calculations
Low cost, easy No rigor Not M&V
End Use
Metering –
Partial (A)
Low cost, easy,
ignores external
factors
Makes assumptions
about non-measured
values
Suitable for simple
measures, e.g.
lighting
End Use
Metering –
Full (B)
Low cost, easy Requires additional
analysis, influenced by
external factors
Suitable for complex
measures, e.g.
HVAC, VSDs
Whole
Building (C)
Easy to
understand
results
Influenced by external
factors, requires
stability, takes time
Suitable where
savings > 10% of
facility use
Simulation
Model (D)
Flexible,
historical
baseline not
required
Can be expensive,
requires skilled
practitioners
Suitable for complex
projects and new
construction

27 | TAP Webinar eere.energy.gov
DATA COLLECTION
Basic Data Collection (at a minimum, e.g., Portfolio Manager, data
varies depending on building type): Gross floor area (SF)
Weekly operating hours
# rooms
# computers
% of floor area that is cooled
% of floor area that is heated
Detailed Data Collection - DOE Guidance for SEP Grantees:
Contact Information of people served/impacted (name, company,
address of contact, phone, email)
Detail descriptions of services received: address of actions taken,
recommendations from audits, measures taken, installation dates etc.
e.g., CA Evaluation Protocols (April 2006, pg 205)
http://www.calmac.org/events/EvaluatorsProtocols_Final_AdoptedviaRuling_06-19-2006.pdf

28 | TAP Webinar eere.energy.gov
TRACKING EE DATA TO SUPPORT EM&V and REPORTING
• Tracking tools/systems used to compile and report
energy efficiency data to support calculations of
estimated energy/demand savings and economic goals.
• Basic function is to record collected data
• Tracking systems can be very comprehensive and
sophisticated to simple spreadsheets
• Example tracking systems:
ENERGY STAR Portfolio Manager
Many other examples of tracking systems - possible topic for
next EM&V webinar in January is to review options/features and
range of costs…

29 | TAP Webinar eere.energy.gov
Reporting required on:
Energy Savings
Energy Costs and Savings
Renewable Energy Capacity and Generation
Emission Reductions
Process Metrics: # buildings retrofitted, square footage, efficiency
measures purchased, etc.
EEBCG Program Guidance 10-07B - Reporting:
http://www1.eere.energy.gov/wip/pdfs/eecbg_reporting_program_gui
dance_10_007b.pdf
SEP Program Guidance 10-006BA – Reporting:
http://www1.eere.energy.gov/wip/pdfs/sep_10-
006a_arra_reporting_guidance.pdf
DOE Reporting Requirements

30 | TAP Webinar eere.energy.gov
Q&A
Questions?
Please complete poll regarding your priorities
for additional information/guidance on EM&V to
support your needs/activities
Results will help inform potential January, and
other future webinar topics

31 | TAP Webinar eere.energy.gov
Team 4 Contacts
CONTACTS
VEIC: Dan Quinlan, [email protected], 802-488-7677 (Team 4 Lead)
MEEA: Wendy Jaehn, [email protected], 312-784-7272
NEEP: Ed Londergan, [email protected], 781-860-9177
NEEA: Dave Kresta, [email protected], 503-827-8416
SWEEP: Curtis Framel, [email protected], 303-447-0078
SEEA: Ben Taube, [email protected], 404-931-1518
ACEEE: Eric Mackres, [email protected], 202-507-4038
NRDC: Lara Ettenson, [email protected], 415-875-6100
EFG: Richard Faesy, [email protected], 802-482-5001

32 | TAP Webinar eere.energy.gov
Title: Energy Efficiency Rebate Programs 101
Host: Catul Kiti, Senior Manager Energy Efficiency
Programs, ICF International
Date: November 15, 2010
Time: 12:00 - 2:00 PM EST
Title: State Clean Energy Policy Impact
Host: Liz Doris, NREL
Date: November 17, 2010
Time: 3:00 - 4:15 PM EST
Title: Negotiating and Entering Into an ESPC
Host: Meg Giuliano, ICF International and Sentech
Date: November 18, 2010
Time: 1:30 - 2:30 PM EST
Title: Community Renewables Projects
Host: Cheryl Jenkins, VEIC
Date: November 30, 2010
Time: 2:00 - 3:00 PM EST
Title: Defining and Establishing the Role of a
Sustainability Manager
Host: Harrison Rue, ICF International and Katherine
Gajewski, Director of Sustainability, City of
Philadelphia
Date: December 2, 2010
Time: 12:00 – 1:30 EST
Title: Building Actionable Climate Action Plans
Host: Jennifer Clymer, ICF International
Date: December 6, 2010
Time: 2:00-3:30 EST
Upcoming Webinars
For the most up-to-date information and registration links, please visit the Solution Center
webcast page at www.wip.energy.gov/solutioncenter/webcasts
Please join us again: