does a decrease in the real interest rate actually ...€¦ · does a decrease in the real interest...
TRANSCRIPT

Working Paper Series
Research and Statistics Department
Bank of Japan
C.P.O BOX 203 TOKYO
100-8630 JAPAN
*e-mail:[email protected]
**e-mail:[email protected]
Does a Decrease in the Real Interest Rate ActuallyStimulate Personal Consumption?✝
- An Empirical Study -
Shinobu Nakagawa* And Kazuo Oshima**
Working Paper 00-2
Views expressed in Working Paper Series are those of authors and do not necessarily reflect those of the Bank of Japan or Research and Statistics Department.

Does a Decrease in the Real Interest Rate Actually Stimulate PersonalConsumption?==
- An Empirical Study -
Shinobu Nakagawa*
Kazuo Oshima**
February 2000
= The opinions expressed herein are those of authors, and do not represent the official opinion andview of the Bank of Japan or of the Research and Statistics Department.* Economic Research Division, Research and Statistics Department, Bank of Japan (E-mail:[email protected]).** Economic Research Division, Research and Statistics Department, Bank of Japan (E-mail:[email protected]).

Abstract
1. As a remedy for Japan’s distressed economy, Professor Paul Krugman of MIT hassuggested that a reduction in real interest rates caused by inflation expectations wouldstimulate personal consumption. Although that is controversy whether inflationcausing policy is effective or feasible, we must still ask whether a decrease in realinterest rates actually stimulated personal consumption in Japan.
2. Generally a decrease in real interest rates stimulates personal consumption, which iswhat Professor Krugman has pointed out. When the real interest rate goes down, inother words, the magnitude of the substitution effect, which stimulates consumption,outweighs that of the income effect, which reduces interest income. Scatter diagramsand estimation results of consumption functions show that negative relationshipsbetween the real interest rate and per capita consumption growth exist in the USA andUK, but there is no clear relationship in Japan.
3. We find no clear relationship between the real interest rate and personalconsumption because the Japanese people like to save and they don’t want to consumeby drawing on savings or by taking consumer loans even if real interest rates go down.In contrast, the use of consumer credit to buy durable goods is observed everywhereand every day in the USA and UK.
4. There is also the fact that Japanese households have over 60 percent of safety assetssuch as deposits in savings and the older the household is, the larger this ratio is.Although consumption is stimulated by a decrease in real interest rates, it seems thatat the same time and at the same scale interest income is reduced by that decrease, sothat the substitution effect and income effect cancel each other out. Yet, in the USAand UK, the shares of safety assets are about 15 percent and 20 percent, respectively atthe end of 1998, so the income effect in each country seems to be smaller than that ofJapan.
5. In conclusion, Professor Krugman’s proposition that stimulating consumption bymaking the real interest rate decline makes sense in the USA and UK. Statisticalevidence, however, shows that is not the case in Japan, because of the reluctance to useconsumer credit in general and the likelihood that Japanese households willaccumulate safety assets under any circumstances.

1
1. Introduction As a remedy for Japan’s distressed economy1, Krugman (1998) suggested that a reduction inreal interest rates caused by inflation expectations would stimulate personal consumption.Although it is controversial whether an inflation-causing policy (e.g. inflation targeting,monetary expansion policy) is effective or feasible, we must ask whether a decrease in realinterest rates would actually stimulate personal consumption in Japan. To answer this question, we analyze the direct relationship between real interest rates andpersonal consumption using time series data. We adapt the same empirical approach to thedeveloped countries, the USA, UK and France, to verify Professor Krugman’s assertion,although we are primarily concerned with Japan.
2. Relationship between the Real Interest Rate and Personal Consumption -Theory and Evidence -
2-1. Theory Economic theory indicates that the effect of real interest rates on personal consumptiondepends on the relative magnitudes of the substitution effect and the income effect. The formeris the amount that a consumer wins benefit from a decrease in real interest rates by consumingtoday rather than saving for tomorrow, so it results in an increase in consumption today. Thelatter is the effect that a decrease in real interest rates causes by decreasing today’s consumptionsince the amount of lifetime income declines by the reduction in the return on savings. Ingeneral, it is said that the substitution effect is larger than the income effect, which is thatProfessor Krugman has pointed out.
2-2. Data and Evidence Before analyzing the relationship between real interest rates and personal consumption, wedefine the real interest rate. The real interest rate is defined as the difference between thenominal interest rate and the expected inflation rate. Although the representative nominalinterest rate that a consumer faces should be used, due to constraints on the latest data, weactually use the deposit rate (weighted average over each maturity) in Japan and France and thethree-month TB rate in the USA and UK2. We also substitute the quarter-to-quarter change ratein the seasonally adjusted CPI for the expected inflation rate, assuming that inflationexpectations are formed by individual forecasts of future inflation rates based on today’sinflation. Personal consumption, seasonally adjusted in SNA, is also calculated with a quarter-to-quarter change rate. To eliminate the impact of population growth on consumption, the data isnormalized on a per capita basis. Taking a closer look at the relationship between the real interest rate and per capitaconsumption growth rate, we find no clear relationship in Japan (Chart 1-1, upper). Somedownward tendencies are found in the USA (Chart 1-2, upper) and UK (Chart 1-3, upper)however, which means that the substitution effect is dominant in each country. In France (Chart1-4, upper), there also seems to be negative relationship. In those three countries, this evidencetell us that Professor Krugman’s assertion is acceptable. In addition, since individuals have risky assets such as equities and mutual funds, we shouldconsider the wealth effect, or the degree to which today’s consumption is stimulated by theincrease in stock returns. To analyze the wealth effect, we also examine the relationship between 1 Precisely, Japan’s economy has fallen into the liquidity trap, which has a horizontal LM curve and anear zero equilibrium interest rate.2 The correlation coefficient between the TB3M rate and the deposit rate is very high: 0.98 with the 3Mdeposit rate, 0.97 with the 6M deposit rate (USA, 63/1-98/4Q), and 0.96 with the deposit rate (UK, 57/1-98/4Q), respectively. So we accept the opinion that there is no problem in substituting the TB3M rate forthe deposit rate.

2
the rate of return on stocks (including dividends in Japan) and the per capita consumptiongrowth rate. Although there is no clear evidence in Japan (Chart 1-1, lower), UK (Chart 1-3,lower) and France (Chart 1-4, lower), we observe a clear upward slope in the USA (Chart 1-2,lower), which shows that the wealth effect significantly influences consumption growth in theUSA.
2-3. A Case Study during Oil Shocks In scatter diagrams (Chart 1-1 through 1-4), we show the white dots in two oil-shock eras todistinguish the effect of high inflation. In each upper chart white dots show that there areupward relationships between the real interest rate and personal consumption in the USA, UKand France. The large decline in the real interest rate caused by high inflation, creating anegative real interest rate in many cases, does bring about the negative consumption growth.Therefore, we have to say that the negative relationship between the real interest rate andpersonal consumption does not always hold even in the USA, UK and France. During severerecessionary periods, such as in today’s Japanese economy, personal consumption is stronglyaffected by the factors other than real interest rates (e.g. sharp decreases in current income,pessimistic expectations about future economic growth, etc). These points must also beconsidered.
3. Estimation of the Consumption Function
3-1. All Consumption Since scatter diagrams only provide rough images, we also estimate the consumption functionto measure the quantitative effect of real interest rates on personal consumption. We set up anestimation formula based on the theoretical relationship between the real interest rate andpersonal consumption, which is called C-CAPM (Consumption-based Capital Asset PricingModel), following Lucas (1978) and Breeden (1979). See the appendix for details.
[Equation-1]
1it4it3it211it
it VSRc
clog −
−
α+α+α+α=
c: per capita consumption (real, s.a.)R: real interest rates (deposit rate<Japan, France>, TB3M<USA, UK>)S: rate of change in real stock prices (including rate of dividends in case of Japan)
V: uncertainty indexes (see Chart 2)3
The estimation results in Chart 3-1 indicate that all variables are not significant in Japan asshown in the scatter diagrams. On the other hand, the real interest rate (parameter 2α ) has asignificant negative impact on consumption in the USA and UK, which means that thesubstitution effect is dominant. In addition, the stock return (parameter 3α ) has a positive
impact on consumption in the USA, which confirms that the wealth effect exists. Furthermore,lowering the significance level shows that the substitution effect is relatively strong in France,while the income effect seems to be dominant in Japan4.
3-2. Durable Goods To precisely estimate the consumption function, durable goods of all consumption must be 3 We use the conditional variances of error terms regressed each country’s real wage by GARCH modelas substitute variables for uncertainty, one of the factors that hinders the consumer’s rationalintertemporal choice. See Ooyama and Yoshida (1999) in detail.4 The reason why the income effect is relatively dominant in Japan is analyzed in section 4.

3
excluded5. For example, Mankiw (1985) expressed the empirical result that the real interest ratehad a significantly negative effect on durable goods. We analyze the relationship between thereal interest rate and durable goods to investigate this point. Avoiding the problems stated infootnote 5 when handling durable goods, we employ an indirect method that subtracts durablegoods from all consumption in equation-1 (see equation-2). Concretely speaking, we comparetwo estimated parameters in equation-1 and equation-2 to investigate the direct relationshipbetween the real interest rate and durable goods6.
[Equation-2]
1it4it3it211it
it VSRcnd
cndlog −
−
α+α+α+α=
cnd: per capita non-durable and service consumption (real, s.a.)
While the estimation results in Chart 3-2 show almost the same results as those in Chart 3-1,we observe some interesting facts. First, the result in the USA shows that the values ofparameters, 2α , 3α , are lowered by 30-40% compared to those in Chart 3-1. Second, we find
that the substitution effect is diminished in the UK and it disappears in France. We conclude thatboth the substitution effect and the wealth effect have stronger impacts on durable goods. In themeanwhile, no significant relationship is recognized in Japan in Chart 3-2 even if durable goodsare excluded.
3-3. Liquidity Constraint One of the reasons why a real interest rate has little impact on personal consumption in Japanis probably that consumer finance has not been widely established in Japan. In other words,people are reluctant to borrow money for today’s consumption. The use of the consumer creditfor buying durable goods (e.g. cars, electric appliances) is observed everywhere and every dayin the USA and UK. In these countries, the decline in real interest rates, which leads to adecrease in real borrowing costs for individuals, is likely to induce an increase in personalconsumption, especially in durable goods. The proportion of consumer credit outstanding tonominal GDP is 7.5% in Japan, 15.2% in the USA and 13.1% in the UK, respectively7. It issignificant and revealing that the substitution effect is dominant in the USA and UK, where theproportion of consumer credit outstanding outweighs that of Japan. This indicates that current income condition is thought to be important in deciding currentconsumption in Japan. In other words, consumers in Japan are likely to face on liquidityconstraints. To confirm this point, we also employ the following equation, which adds today’sincome growth to explanatory variables.
[Equation-3]
1it4it3it211it
it
1it
it VSRy
ylog
c
clog −
−−
α+α+α+α+
λ=
y: per capita disposable income (real, s.a.)
5 As for durable goods, there exists some lags between expenditure (e.g., purchasing a car) andconsumption (e.g. consuming services from driving a car purchased). Due to lags, when analyzingconsumption behavior based on the utility function, it is necessary to estimate by making the service flowfrom the expenditure on durable goods as in Bernanke (1985) and Mankiw (1985).Making this flow hasmany calculation difficulties, such as the rigid assumption that depreciation rate is always constant.6 The estimation procedure that excludes the durable goods in all consumption is employed in manyinstructive papers. See, for example, Hall (1978), Flavin (1981).7 We use consumer credit outstanding based on the flow of funds of each country. In the UK, however, thefigures don’t include non-bank accounts, so the actual figure may be larger.
4
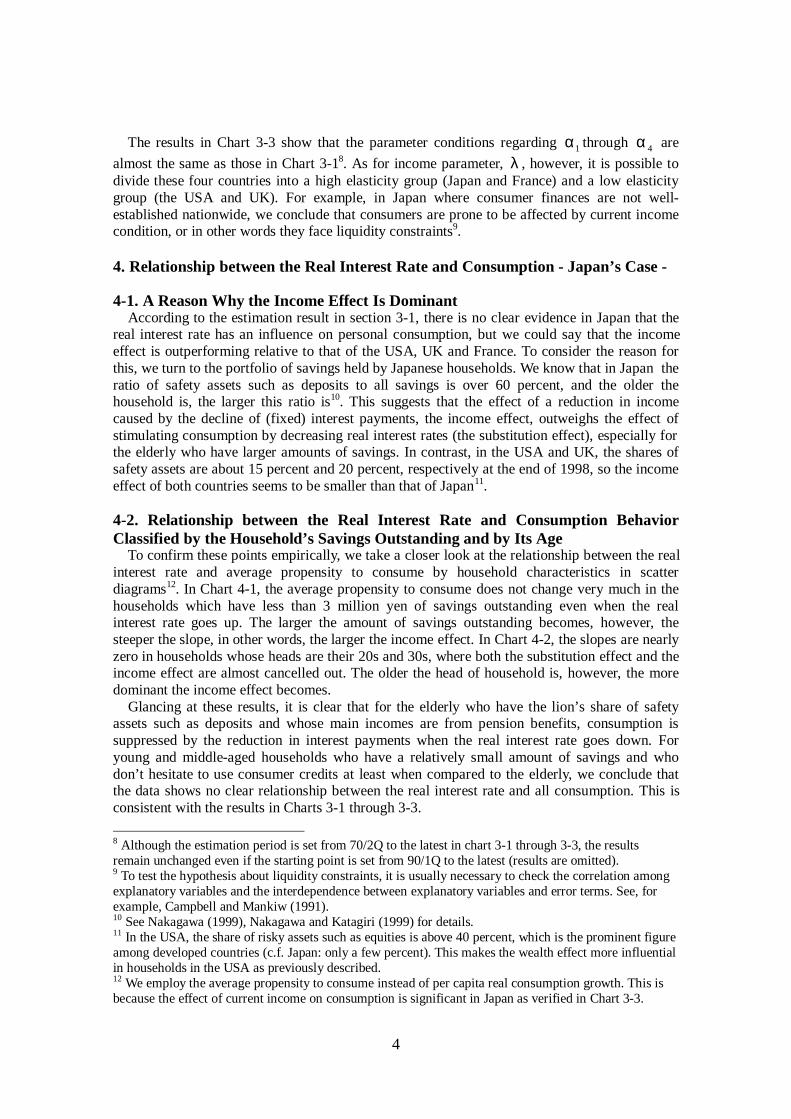
The results in Chart 3-3 show that the parameter conditions regarding 1α through 4α are
almost the same as those in Chart 3-18. As for income parameter, λ , however, it is possible todivide these four countries into a high elasticity group (Japan and France) and a low elasticitygroup (the USA and UK). For example, in Japan where consumer finances are not well-established nationwide, we conclude that consumers are prone to be affected by current incomecondition, or in other words they face liquidity constraints9.
4. Relationship between the Real Interest Rate and Consumption - Japan’s Case -
4-1. A Reason Why the Income Effect Is Dominant According to the estimation result in section 3-1, there is no clear evidence in Japan that thereal interest rate has an influence on personal consumption, but we could say that the incomeeffect is outperforming relative to that of the USA, UK and France. To consider the reason forthis, we turn to the portfolio of savings held by Japanese households. We know that in Japan theratio of safety assets such as deposits to all savings is over 60 percent, and the older thehousehold is, the larger this ratio is10. This suggests that the effect of a reduction in incomecaused by the decline of (fixed) interest payments, the income effect, outweighs the effect ofstimulating consumption by decreasing real interest rates (the substitution effect), especially forthe elderly who have larger amounts of savings. In contrast, in the USA and UK, the shares ofsafety assets are about 15 percent and 20 percent, respectively at the end of 1998, so the incomeeffect of both countries seems to be smaller than that of Japan11.
4-2. Relationship between the Real Interest Rate and Consumption BehaviorClassified by the Household’s Savings Outstanding and by Its Age To confirm these points empirically, we take a closer look at the relationship between the realinterest rate and average propensity to consume by household characteristics in scatterdiagrams12. In Chart 4-1, the average propensity to consume does not change very much in thehouseholds which have less than 3 million yen of savings outstanding even when the realinterest rate goes up. The larger the amount of savings outstanding becomes, however, thesteeper the slope, in other words, the larger the income effect. In Chart 4-2, the slopes are nearlyzero in households whose heads are their 20s and 30s, where both the substitution effect and theincome effect are almost cancelled out. The older the head of household is, however, the moredominant the income effect becomes. Glancing at these results, it is clear that for the elderly who have the lion’s share of safetyassets such as deposits and whose main incomes are from pension benefits, consumption issuppressed by the reduction in interest payments when the real interest rate goes down. Foryoung and middle-aged households who have a relatively small amount of savings and whodon’t hesitate to use consumer credits at least when compared to the elderly, we conclude thatthe data shows no clear relationship between the real interest rate and all consumption. This isconsistent with the results in Charts 3-1 through 3-3.
8 Although the estimation period is set from 70/2Q to the latest in chart 3-1 through 3-3, the resultsremain unchanged even if the starting point is set from 90/1Q to the latest (results are omitted).9 To test the hypothesis about liquidity constraints, it is usually necessary to check the correlation amongexplanatory variables and the interdependence between explanatory variables and error terms. See, forexample, Campbell and Mankiw (1991).10 See Nakagawa (1999), Nakagawa and Katagiri (1999) for details.11 In the USA, the share of risky assets such as equities is above 40 percent, which is the prominent figureamong developed countries (c.f. Japan: only a few percent). This makes the wealth effect more influentialin households in the USA as previously described.12 We employ the average propensity to consume instead of per capita real consumption growth. This isbecause the effect of current income on consumption is significant in Japan as verified in Chart 3-3.

5
5. Concluding Remarks Previous sections show that the Professor Krugman’s proposition that stimulatingconsumption by making the real interest rate decline is supported in case of the USA and UK,where consumer are not so reluctant to borrow. Also, in the USA where the share of risky assetssuch as equities is high, we confirm that the wealth effect has a powerful effect. On the otherhand, the data and statistical evidence show that what Professor Krugman proposes does notwork in Japan, since Japanese households are relatively reluctant to use consumer credit and arelikely to accumulate safety assets under any circumstances. The conclusion of this paper doesn’t deny that a decrease in the real interest rate stimulatesthe housing and business investment, which produces the economic cycle “an increase incompany’s profits leads to an increase in employee’s incomes” and results in consumptiongrowth13.
13 The relationship between the real interest rate and housing investment is analyzed in Bank of Japan(1998).

6
Appendix : C-CAPM - Outlines of Theory and Its Reduced Form14 -
A representative household behaves to
max ( )
β∑
∞
=0tt
t0 cuE
s.t. ( )∑ ∑= =
+ ++=+N
1i
N
1ititititt1itit yQdqcQq . (1)
It chooses today’s consumption and n-types of financial assets so as to maximize the discountedvalue of expected utility of future consumption under the budget constraint in each period. Thevariables in equation (1) are
β : subjective discount rate
ct : consumption at t period (real, per capita)
qit : price of financial asset at t period
dit : dividend of financial asset at t period
Qit : amount of asset holding at t period (real, per capita)
yt : income other than return on assets at t period (real, per capita)
u(ct) : utility function of representative household
E0(• ) : conditional expectation based on the information available at t period.
Solving the equation (1) by Lagrange multiplier method, we obtain the following first order
condition (Euler equation),
( )( ) ( ) 01r1c'u
c'uE 1it
t
1tt =
−+β +
+ . (2)
We here define rit+1 as
1q
dqr
it
1it1it1it −
+= ++
+ , (3)
which is the return on financial assets. In addition, specifying the utility function of
representative household as
( )γ−−
=γ−
1
1ccu
1t
t , (4)
which is the constant relative risk aversion type, equation (2) is reduced to
( ) 01r1c
cE 1it
t
1tt =
−+
β +
γ−
+ . (5)
Next, as for the equation (5), we define
( ) ( ) 1t1itt
1tt1it
t
1t r1c
cEr1
c
c++
γ−
++
γ−
+ ξ≡
+
β−+
β
( ) 0E 1tt =ξ + , ( ) ( ) 2t1tt
21tt VarE σ=ξ=ξ ++ , (6)
14 The theory of C-CAPM and its derivation manner to the reduced form are explained in detail in Hamori(1996) and in Nakagawa (1998), respectively.
7
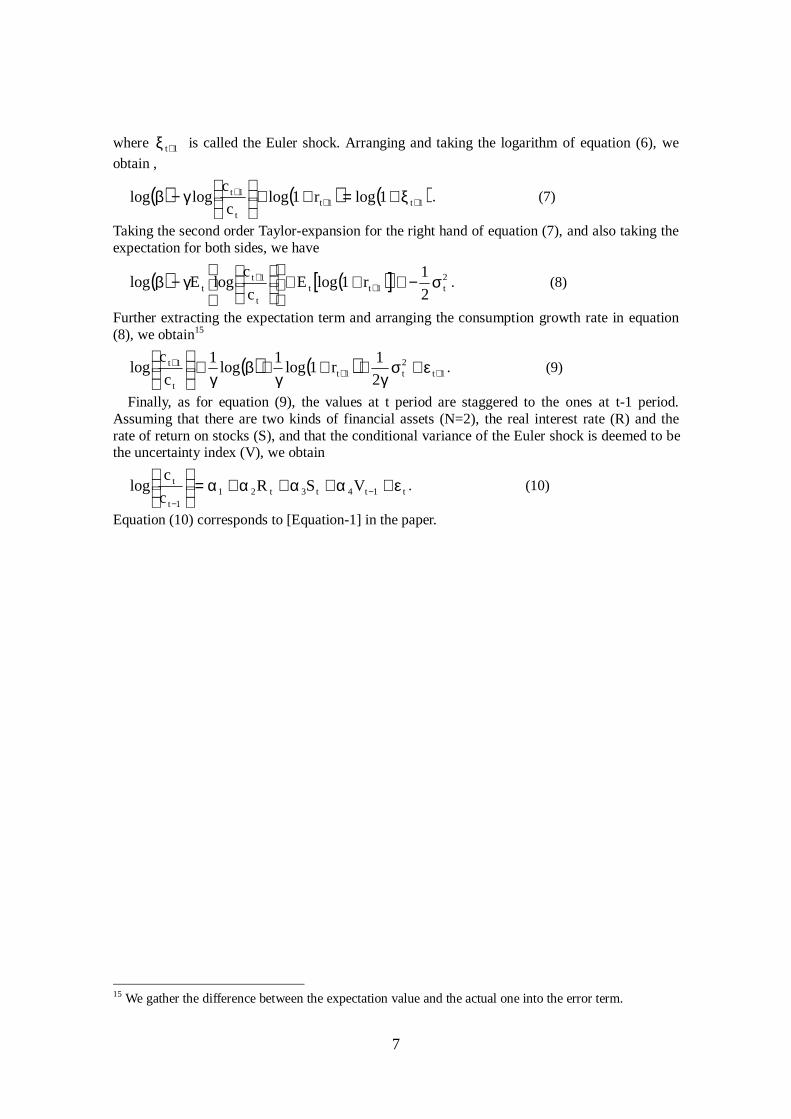
where 1t+ξ is called the Euler shock. Arranging and taking the logarithm of equation (6), we
obtain ,
( ) ( ) ( )1t1tt
1t 1logr1logc
cloglog ++
+ ξ+=++
γ−β . (7)
Taking the second order Taylor-expansion for the right hand of equation (7), and also taking theexpectation for both sides, we have
( ) ( )[ ] 2t1tt
t
1tt 2
1r1logE
c
clogElog σ−≅++
γ−β +
+ . (8)
Further extracting the expectation term and arranging the consumption growth rate in equation(8), we obtain15
( ) ( ) 1t2t1t
t
1t
2
1r1log
1log
1
c
clog ++
+ ε+σγ
++γ
+βγ
≅
. (9)
Finally, as for equation (9), the values at t period are staggered to the ones at t-1 period.Assuming that there are two kinds of financial assets (N=2), the real interest rate (R) and therate of return on stocks (S), and that the conditional variance of the Euler shock is deemed to bethe uncertainty index (V), we obtain
t1t4t3t211t
t VSRc
clog ε+α+α+α+α=
−
−
. (10)
Equation (10) corresponds to [Equation-1] in the paper.
15 We gather the difference between the expectation value and the actual one into the error term.

8
References
[Japanese Language]
Bank of Japan (1998), “Saikin no juutakutoushi doukou ni tsuite,” (Recent Developments inHousing Investment), Bank of Japan Monthly Bulletin, October 1998.
Hamori, S. (1996), “Shouhisha koudou to nihon no shisanshijou,” (Consumer Behavior and theJapanese Asset Market), Toyo Keizai Shinpousha.
Ooyama, T. and K. Yoshida (1999), “Nihon no chochiku wa kajou nanoka : aruiwaoubeishuyoukoku no chochiku ga kashounanoka,” (Is Japan’s Savings Rate too High?: Or Are Those of Western Countries too Low?), Research and Statistics Department,Bank of Japan, Working Paper Series 99-5, December 1999.
Nakagawa, S. (1998), “Fukakujitsuseika no shouhisha koudou,” (Consumer Behavior underUncertainty), Research and Statistics Department, Bank of Japan, Working PaperSeries 98-6, June 1998.
Nakagawa, S. and T. Katagiri (1999), “Nihon no kakei no kin-yushisan sentaku koudou,”(Japanese Household’s Portfolio Selection Behavior), Bank of Japan MonthlyBulletin, November 1999.
[English Language]
Bernanke, B. S. (1985), “Adjustment Costs, Durables and Aggregate Consumption,” Journal ofMonetary Economics.
Breeden, D. T. (1979), “An Intertemporal Asset Pricing Model with Stochastic Consumptionand Investment Opportunities,” Journal of Financial Economics 25.
Campbell, J. A. and N. G. Mankiw (1991), “The Response of Consumption to Income,”European Economic Review, Vol.35.
Flavin, M. (1981), “The Adjustment of Consumption to Changing Expectation about FutureIncome,” Journal of Political Economy 89.
Hall, R. E. (1978), “Stochastic Implications of the Life Cycle-Permanent Income Hypothesis:Theory and Evidence,” Journal of Political Economy 86.
Krugman. P. (1998), “Japan’s Trap,” at http://web.mit.edu/krugman/www/japtrap.html.Lucas, R. E. (1978), “Asset Prices in an Exchange Economy,” Econometrica, Vol.46.Mankiw, N. G. (1985), “Consumer Durables and the Real Interest Rate,” The Review of
Economics and Statistics.Nakagawa, S. (1999), “Why Has Japan’s Household Savings Rate Remained High even during
the 1990s?”at http://www.boj.or.jp/en/ronbun/ronbun_f.htm. (The paper was originallypublished in Japanese in the Bank of Japan Monthly Bulletin, April 1999 issue.)

1. Deposit Rate
(Notes) 1970/1-99/3Q (Data in 1973-74 and 1979-80 are shown by white dots.) Deposit Rate: Weighted average of each term (quarterly converted)
2. Rate of Return on Stocks (TSE 1st section)
(Notes) 1970/1-99/3Q (Data in 1973-74 and 1979-80 are shown by white dots.) Rate of Return on Stocks=Capital Gains+Rate of Dividends
(Sources) Economic Planning Agency, "System of National Accounts"Management and Coordination Agency, "Consumer Price Index"BIS, "International Financial Statistics"Nihon Shouken Keizai Kenkyusho, "Rates of Return on Common Stocks"
(Chart 1-1)
Rates of Return on Assets and Consumption Growth (Japan)
-8
-6
-4
-2
0
2
4
6
8
-8 -6 -4 -2 0 2Deposit Rate (real, %)
G
row
th R
ate
of P
er C
apita
Rea
l Con
sum
ptio
n (s
.a.,
%)
-8
-6
-4
-2
0
2
4
6
8
-15 -10 -5 0 5 10 15
Rate of Return on Stocks (real, %)
G
row
th R
ate
of P
er C
apita
Rea
l Con
sum
ptio
n (s
.a.,
%)

1. TB3M Rate
(Notes) 1970/1-99/2Q (Data in 1973-74 and 1979-80 are shown by white dots.)
2. Rate of Change in Stock Prices (S&P500)
(Notes) 1970/1-99/2Q (Data in 1973-74 and 1979-80 are shown by white dots.)
(Sources) Department of Commerce, Department of Labor, FRB and S&P etc.
(Chart 1-2)
Rates of Return on Assets and Consumption Growth (USA)
-3
-2
-1
0
1
2
3
-5 -4 -3 -2 -1 0 1 2 3 4 5
TB3M Rate (real, %)
Gro
wth
Rat
e of
Per
Cap
ita R
eal C
onsu
mpt
ion
(s.a
., %
)
regression line of black dots
-3
-2
-1
0
1
2
3
-25 -20 -15 -10 -5 0 5 10 15 20 25
Change in Stock Prices (real, %)Gro
wth
Rat
e of
Per
Cap
ita R
eal C
onsu
mpt
ion
(s.a
., %
)
regression line of black dots

1. TB3M Rate
(Notes) 1970/1-99/2Q (Data in 1973-74 and 1979-80 are shown by white dots.)
2. Rate of Change in Stock Prices (Industrial Average, IFS)
(Notes) 1970/1-99/2Q (Data in 1973-74 and 1979-80 are shown by white dots.)
(Sources) BIS and IMF etc.
(Chart 1-3)
Rates of Return on Assets and Consumption Growth (UK)
-6
-4
-2
0
2
4
6
-8 -6 -4 -2 0 2 4 6 8
TB3M Rate (real, %)Gro
wth
Rat
e of
Per
Cap
ita R
eal C
onsu
mpt
ion
(s.a
., %
)
regression line of black dots
-6
-4
-2
0
2
4
6
-40 -35 -30 -25 -20 -15 -10 -5 0 5 10 15 20 25 30 35 40
Change in Stock Prices (real, %)Gro
wth
Rat
e of
Per
Cap
ita R
eal C
onsu
mpt
ion
(s.a
., %
)

1. Deposit Rate
(Notes) 1970/2-98/4Q (Data in 1973-74 and 1979-80 are shown by white dots.) Deposit Rate: Weighted average of each term (quarterly converted)
2. Rate of Change in Stock Prices (IFS)
(Notes) 1970/2-98/4Q (Data in 1973-74 and 1979-80 are shown by white dots.)
(Sources) BIS and IMF etc.
(Chart 1-4)
Rates of Return on Assets and Consumption Growth (France)
-4
-3
-2
-1
0
1
2
3
4
-6 -4 -2 0 2 4 6
Deposit Rate (real, %)
Gro
wth
Rat
e of
Per
Cap
ita R
eal C
onsu
mpt
ion
(s.a
., %
)
-4
-3
-2
-1
0
1
2
3
4
-30 -25 -20 -15 -10 -5 0 5 10 15 20 25 30
Change in Stock Prices (real, %)
Gro
wth
Rat
e of
Per
Cap
ita R
eal C
onsu
mpt
ion
(s.a
., %
)

1. Japan
2. USA
3. UK
4. France
(Notes) Conditional variances of error terms regressed real wages by GARCH model (quarterly average)(Sources) Ministry of Labour, "Monthly Labour Survey" BIS, "International Financial Statistics"
(Chart 2)
Uncertainty Indexes
0.0000.0010.0020.0030.0040.0050.0060.0070.0080.009
61 62 63 64 65 66 67 68 69 70 71 72 73 74 75 76 77 78 79 80 81 82 83 84 85 86 87 88 89 90 91 92 93 94 95 96 97 98 99CY
0.0000.0010.0020.0030.0040.0050.0060.0070.0080.009
61 62 63 64 65 66 67 68 69 70 71 72 73 74 75 76 77 78 79 80 81 82 83 84 85 86 87 88 89 90 91 92 93 94 95 96 97 98 99CY
0.0000.0010.0020.0030.0040.0050.0060.0070.0080.009
61 62 63 64 65 66 67 68 69 70 71 72 73 74 75 76 77 78 79 80 81 82 83 84 85 86 87 88 89 90 91 92 93 94 95 96 97 98 99CY
0.0000.0010.0020.0030.0040.0050.0060.0070.0080.009
61 62 63 64 65 66 67 68 69 70 71 72 73 74 75 76 77 78 79 80 81 82 83 84 85 86 87 88 89 90 91 92 93 94 95 96 97 98 99CY

(Chart3-1)
Estimation Results of Consumption Function (all consumption)
(Equation)
1it4it3it211it
it VSRc
clog −
−
α+α+α+α=
c: per capita consumption (real, s.a.)R: real interest rates (deposit rate<Japan, France>, TB3M<USA, UK>)S: rate of change in real stock prices (including rate of dividends in case of Japan)V: uncertainty indexes (see Chart 2.)
(Estimation Results)
1α 2α 3α 4α adjR2 SE/DW
-0.004(-0.42)
0.007(1.09)
0.00 0.0122.43
Japan -0.003(-0.31)
0.006(0.92)
0.046(0.04)
-0.01 0.0122.41
(est. period)
1970/2-99/3Q
-0.004(-0.34)
0.007(0.94)
0.0001(0.42)
0.192(0.16)
-0.02 0.0122.41
0.032(4.45)
-0.017(-3.73)
0.10 0.0071.61
USA 0.033(4.33)
-0.018(-3.58)
7.652(0.54)
0.10 0.0071.58
(est. period)
1970/2-99/2Q
0.026(3.35)
-0.011(-2.13)
0.0039(3.47)
42.732(2.53)
0.18 0.0071.94
0.043(3.08)
-0.022(-2.66)
0.05 0.0122.24
UK 0.040(2.83)
-0.019(-2.31)
-2.400(-1.84)
0.07 0.0122.29
(est. period)
1970/2-99/2Q
0.039(2.65)
-0.018(-2.08)
0.0003(0.30)
-2.130(-1.34)
0.06 0.0122.30
0.020(1.57)
-0.009(-1.20)
0.02 0.0081.98
France 0.023(1.77)
-0.011(-1.45)
1.444(1.05)
0.02 0.0082.02
(est. period)
1970/2-98/4Q
0.027(1.62)
-0.013(-1.34)
-0.0005(-0.37)
1.039(0.59)
0.01 0.0082.03
(Notes) Figures in parentheses show the t value.
The shadowed areas have a significance level of 5 percent.
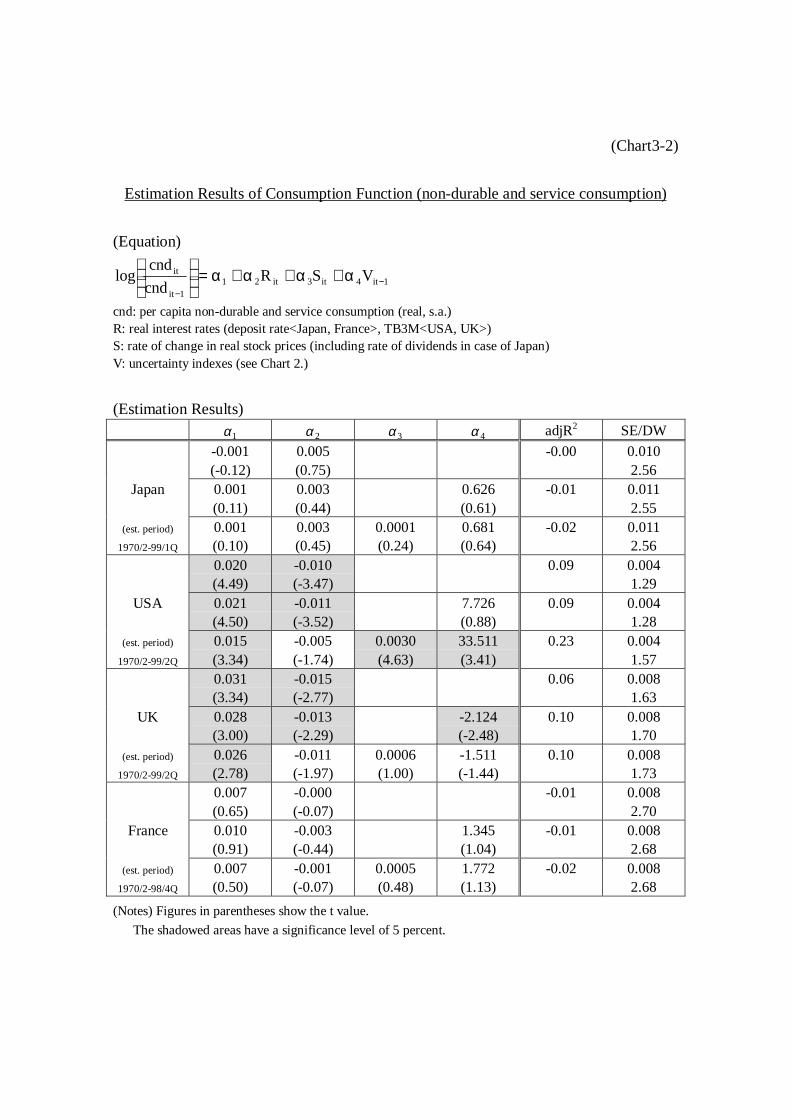
(Chart3-2)
Estimation Results of Consumption Function (non-durable and service consumption)
(Equation)
1it4it3it211it
it VSRcnd
cndlog −
−
α+α+α+α=
cnd: per capita non-durable and service consumption (real, s.a.)R: real interest rates (deposit rate<Japan, France>, TB3M<USA, UK>)S: rate of change in real stock prices (including rate of dividends in case of Japan)V: uncertainty indexes (see Chart 2.)
(Estimation Results)
1α 2α 3α 4α adjR2 SE/DW
-0.001(-0.12)
0.005(0.75)
-0.00 0.0102.56
Japan 0.001(0.11)
0.003(0.44)
0.626(0.61)
-0.01 0.0112.55
(est. period)
1970/2-99/1Q
0.001(0.10)
0.003(0.45)
0.0001(0.24)
0.681(0.64)
-0.02 0.0112.56
0.020(4.49)
-0.010(-3.47)
0.09 0.0041.29
USA 0.021(4.50)
-0.011(-3.52)
7.726(0.88)
0.09 0.0041.28
(est. period)
1970/2-99/2Q
0.015(3.34)
-0.005(-1.74)
0.0030(4.63)
33.511(3.41)
0.23 0.0041.57
0.031(3.34)
-0.015(-2.77)
0.06 0.0081.63
UK 0.028(3.00)
-0.013(-2.29)
-2.124(-2.48)
0.10 0.0081.70
(est. period)
1970/2-99/2Q
0.026(2.78)
-0.011(-1.97)
0.0006(1.00)
-1.511(-1.44)
0.10 0.0081.73
0.007(0.65)
-0.000(-0.07)
-0.01 0.0082.70
France 0.010(0.91)
-0.003(-0.44)
1.345(1.04)
-0.01 0.0082.68
(est. period)
1970/2-98/4Q
0.007(0.50)
-0.001(-0.07)
0.0005(0.48)
1.772(1.13)
-0.02 0.0082.68
(Notes) Figures in parentheses show the t value.
The shadowed areas have a significance level of 5 percent.

(Chart3-3)
Estimation Results of Consumption Function (with liquidity constraint)
(Equation)
1it4it3it211it
it
1it
it VSRy
ylog
c
clog −
−−
α+α+α+α+
λ=
c: per capita consumption (real, s.a.)y: per capita disposable income (real, s.a.)R: real interest rates (deposit rate<Japan, France>, TB3M<USA, UK>)S: rate of change in real stock prices (including rate of dividends in case of Japan)V: uncertainty indexes (see Chart 2.)
(Estimation Results)λ 1α 2α 3α 4α adjR2 SE/DW
Japan(est. period)
1970/2-99/1Q
0.30(3.68)
0.005(3.15)
0.001(0.50)
-0.0002(-0.70)
1.066(1.62)
0.11 0.0122.47
USA(est. period)
1970/2-99/2Q
0.21(5.46)
0.024(4.08)
-0.010(-2.52)
0.0121(3.34)
-0.224(-0.21)
0.39 0.0062.13
UK(est. period)
1970/2-99/2Q
0.18(3.08)
0.025(2.18)
-0.011(-1.54)
0.0124(1.86)
1.353(1.55)
0.17 0.0112.55
France(est. period)
1970/2-98/4Q
0.27(2.75)
0.010(0.90)
-0.004(-0.57)
0.004(0.55)
0.072(0.15)
0.04 0.0082.09
(Notes) Figures in parentheses show the t value.
The shadowed areas have a significance level of 5 percent.

Less than 3 million yen 3 to 5 million yenslope: 0.56 R-square: 0.60 slope: 1.27 R-square: 0.75
5 to 7 million yen 7 to 10 million yenslope: 1.52 R-square: 0.61 slope: 1.66 R-square: 0.65
10 million yen or largerslope: 1.76 R-square: 0.69
(Notes) period: 1973-1998 Average Propensity to Consume = 100-Average Savings Rate
(Sources) Management and Coordination Agency, "Family Savings Survey" , "Consumer Price Index"
BIS, "International Financial Statistics"
(Chart 4-1)
Interest Rate and Propensity to Consume (by household's outstanding of Savings)
50
60
70
80
90
100
-20 -15 -10 -5 0 5Deposit Rate (real, %)
Ave
rage
Pro
pens
ity to
Con
sum
e (%
)
50
60
70
80
90
100
-20 -15 -10 -5 0 5Deposit Rate (real, %)A
vera
ge P
rope
nsity
to C
onsu
me
(%)
50
60
70
80
90
100
-20 -15 -10 -5 0 5Deposit Rate (real, %)
Ave
rage
Pro
pens
ity to
Con
sum
e (%
)
50
60
70
80
90
100
-20 -15 -10 -5 0 5Deposit Rate (real, %)
Ave
rage
Pro
pens
ity to
Con
sum
e (%
)
50
60
70
80
90
100
-20 -15 -10 -5 0 5Deposit Rate (real, %)
Ave
rage
Pro
pens
ity to
Con
sum
e (%
)

20s 30sslope: 0.13 R-square: 0.04 slope: 0.28 R-square: 0.23
40s 50sslope: 0.39 R-square: 0.25 slope: 0.50 R-square: 0.25
60 or olderslope: 0.56 R-square: 0.15
(Notes) period: 1966-1998 Average Propensity to Consume = 100-Average Savings Rate
(Sources) Management and Coordination Agency, "Family Savings Survey" , "Consumer Price Index"BIS, "International Financial Statistics"
(Chart 4-2)
Interest Rate and Propensity to Consume (by household's ages)
60
70
80
90
100
-20 -15 -10 -5 0 5Deposit Rate (real, %)
Ave
rage
Pro
pens
ity to
Con
sum
e (%
)
60
70
80
90
100
-20 -15 -10 -5 0 5Deposit Rate (real, %)A
vera
ge P
rope
nsity
to C
onsu
me
(%)
60
70
80
90
100
-20 -15 -10 -5 0 5Deposit Rate (real, %)
Ave
rage
Pro
pens
ity to
Con
sum
e (%
)
60
70
80
90
100
-20 -15 -10 -5 0 5Deposit Rate (real, %)A
vera
ge P
rope
nsity
to C
onsu
me
(%)
60
70
80
90
100
-20 -15 -10 -5 0 5Deposit Rate (real, %)A
vera
ge P
rope
nsity
to C
onsu
me
(%)