does “yes or no” on the telephone mean the same as “check-all-that-apply… · 2006-01-18 ·...
TRANSCRIPT

1
Does “Yes or No” on the Telephone Mean the Same as
“Check-All-That-Apply” on the Web?1
By
Jolene D. Smyth, Leah Melani Christian, and Don A. Dillman
INTRODUCTION
It is common practice to ask multiple-response questions as a series of yes/no (forced-
choice) items for telephone surveys, but to ask the same questions in a check-all-that-apply
format in both mail and Internet surveys. However, a growing body of research indicates that the
forced-choice question format tends to result in endorsement of significantly more response
options than does the check-all question format (Rasinski, Mingay, and Bradburn 1994; Smyth,
Dillman, Christian, and Stern, Forthcoming). One limitation, however, of most research on this
issue to date is that the comparisons of these question formats have been conducted within as
opposed to across survey modes. As a result, these studies give us a greater understanding of
pure question format effects, but fall short of addressing the fundamental issue of whether or not
converting between question formats to accommodate survey modes yields similar data of
comparable quality. In other words, they cannot address the issue of interactions between
question format and survey mode.
In this paper we extend previous research by experimentally examining the extent to
which the check-all and forced-choice question formats produce comparable responses across
telephone and web modes and we attempt to isolate question format effects from survey mode
effects. Using data collected from a random sample of Washington State University (WSU)
students in the Fall of 2004, we compare results from five questions administered in the check-all
1 This paper was presented at the Second International Conference on Telephone Survey Methodology, Miami, FL January 11-15, 2006. Analysis of these data was supported by funds provided to the Washington State University Social and Economic Sciences Research Center (SESRC) under Cooperative Agreement #43-3AEU-1-80055 with the USDA-National Agricultural Statistics Service, supported by the National Science Foundation, Division of Science Resource Statistics. Data collection was financed by funds provided to the SESRC by the Gallup Organization.

2
format via the web to those of the same five questions administered in the forced-choice format
via the telephone. In order to examine mode differences independent of question format we also
compare the results of six questions administered in the forced-choice format via both telephone
and web survey modes.
BACKGROUND
Multiple-Answer Question Format Effects and Their Sources
Two previous studies have directly and experimentally addressed the comparability of
responses between the forced-choice and check-all question formats. Rasinski et al. (1994)
report that for all three experimental items in a paper questionnaire, the mean number of options
endorsed per respondent was significantly greater when they were formatted as forced-choice
questions than as check-all questions. The second study contained data from 16 experimental
comparisons using eight different questions that were embedded in two web surveys and a paper
survey comparison (Smyth et al. Forthcoming). Like Rasinski et al. (1994), Smyth et al.
(Forthcoming) reported that in 15 of the 16 comparisons the forced-choice question format led to
significantly more options being endorsed than did the check-all question format (the one
“insignificant” difference approached significance with a p-value of .054). This study extended
Rasinski and colleagues’ findings to web surveys and included questions lying along a
continuum from fact and behavior based to opinion and attitude based questions.
According to Smyth et al. (Forthcoming) the root source of differences in responses
between the forced-choice and the check-all question formats seems to lay in the fundamental
difference in response task between these two question formats. While the forced-choice
question format requires respondents to consider each option individually and decide whether it
does or does not apply, the check-all format presents the options as a set of items from which the

3
respondent should choose those that apply (Sudman and Bradburn 1982). In other words, the
check-all format does not demand the attention of the respondent for each independent response
option in the same way that the forced-choice format does. As a result, the check-all question
format allows for a weak satisficing response strategy (Rasinski et al. 1994) whereby
respondents can quickly and easily satisfy the requirements of the question by choosing the first
options they can reasonably justify and then move on without giving ample consideration to
remaining response options (Krosnick 1991; 1999; Krosnick and Alwin 1987). In contrast, the
options in the forced-choice format should be prone to deeper processing as this question format
requires respondents to report a judgment about every response option in order to satisfy the
requirements of the question (Sudman and Bradburn 1982). Thus, in the forced-choice format,
respondents should process more of the list and process each individual option more deeply.
Smyth et al. (Forthcoming) find evidence in support of these assertions. They show that
1) overall, respondents spend significantly less time answering check-all questions; 2) the
response patterns of those respondents who answer the questions in under the mean response
time show evidence of primacy (i.e, higher likelihood of an item being endorsed when it is
located in the top of the list), an effect that is consistent with the theory that check-all questions
are prone to satisficing response behavior; and 3) those respondents who spend over the mean
response time on check-all questions mark as many or more options as forced-choice
respondents. Smyth et al. found that a substantial proportion (66%) of respondents answered
check-all questions quickly, and therefore, may not have fully processed all of the response
options. In contrast, they found that respondents spent significantly longer on the forced-choice
formatted questions and that they marked the same number of response options regardless of

4
response time, suggesting that all respondents more deeply process the response options in this
question format.
Both the Rasinski et al. (1994) and the Smyth et al. (Forthcoming) studies shed
considerable light on forced-choice and check-all question format differences and the processes
that may underlie such differences. Nevertheless, as mentioned above, both pieces are limited to
comparisons of the forced-choice and check-all formats within paper and web modes, but few, if
any, survey designers use these two question formats interchangeably in this way (i.e., within
modes). Rather, the practical question at hand is do we get comparable data when we use these
two question formats across modes as is customarily done? To answer this question we need to
consider how survey mode might influence responses to multiple-answer questions.
Multiple-Answer Question Mode Effects
There are a number of mode-related factors that may influence responses to web and
telephone multiple-answer questions. Since there are many sources of mode effects, many of
which affect respondents differently, we expect some elements of each mode to encourage
endorsement of options and other elements to discourage endorsement. To elaborate on the
expected outcomes of the relevant mode factors we draw on de Leeuw’s (1992; 2005)
organizational classification of mode effects, using it to frame our discussion and the summary
of expected mode effects presented in Figure 1. In order to organize the vast literature on mode
effects, de Leeuw (1992; 2005) groups the various factors into three general classes: media-
related factors (social conventions and customs related to the survey mode), information
transmission factors, and interviewer impact factors.
Media-Related Factors. Media-related factors might include such things as familiarity with the
mode being used, locus of control within the mode, and cultural characteristics of the mode.

5
With respect to familiarity, respondents are more likely to know how to conduct a conversation
over the telephone than they are to know how to access the Internet to complete a survey simply
because telephone technology has existed longer and most people conduct conversations
everyday. Completing a survey via the Internet requires a special set of skills and
tools/technology that not everyone currently possesses or can access. It is unclear, however, how
such mode familiarity or lack of familiarity might affect responses to multiple-answer questions
across modes.
For this study the most important media-related factor may be locus of control. The
amount of control a respondent has over the survey process varies greatly across web and
telephone surveys and can be expected to impact the motivation and ability of the respondent to
process and answer questions in the survey. In telephone surveys the interviewer largely
controls these factors. As a result, telephone surveys tend to be conducted at relatively fast paces
(Krosnick and Alwin 1987), a factor encouraging the use of more pre-formed responses
(Dillman, Sangster, Tarni, and Rockwood 1996; Schwarz et al. 1991) and likely shallower
processing of options in multiple-answer questions. The relatively quick pace of telephone
surveys may have especially large effects on responses to attitude/opinion-based questions as
these questions require substantial processing by respondents. In contrast, respondents to web
surveys have higher degrees of control over the interview process and especially the pace of the
interview. When needed, they can slow down and devote more time to processing a particular
question or response option. In addition, they oftentimes have the ability to skip ahead or
backward through the survey to see what is coming next or to check or reconsider a previous
answer. Given the opportunity to slow down and fully process response options, we might
expect web respondents to endorse more of them.
6
However, although web respondents do not have interviewer-imposed time constraints,
the Internet is an exceptionally dynamic mode (i.e., respondents can multitask while completing
the survey) embedded in an environment marked by expectations of speed, convenience, and fun.
These cultural characteristics of the Internet may result in respondents being impatient with and
quickly bored by a web questionnaire. As a result, they may hurry through the survey, only
shallowly processing items and relying more strongly on pre-formed responses. Telephone
surveys are also couched in a cultural framework that may result in fewer options being
endorsed. Telephones are increasingly becoming viewed as personal devices (i.e., individuals
often have their own personal phones and cell phones) and unsolicited calls are seen as major
inconveniences (e.g., so much so that national do not call registries have been developed and
many people have rushed to get their names on them). Many respondents do not differentiate
between legitimate telephone survey research and tele-marketing. Frustration with unsolicited
phone calls may result in respondents attempting to hurry through the call, being unmotivated to
cooperate or to expend effort to give optimal answers, and treating the interaction very
superficially. In this case, we would expect only shallow processing of items, and therefore,
fewer options endorsed on multiple-answer questions.
Information Transmission Factors. The means through which respondents receive
questionnaire information can also affect their ability to process and respond to survey items.
Surveys are presented to respondents through either aural or visual communication channels
(Schwarz et al. 1991). Web survey respondents generally receive relevant information through
visual channels. These visual channels tend to leave paper trails, or at least virtual paper trails
that respondents can reference and re-reference throughout the survey process to minimize the
amount of memory and cognitive energy devoted to responding. Visually based communication

7
channels should, therefore, facilitate more comprehensive consideration of survey items and
higher endorsement. In contrast, because they receive information aurally, telephone
respondents are left with only “mental trails,” the defining characteristic of which is their
tendency to quickly dissipate. Therefore, telephone respondents must devote considerable
mental energy to managing the question and response options and formulating judgments.
Additionally, once they have moved beyond a response option, it is more difficult for them to
return to it for additional consideration than it is for web respondents (who can check the virtual
paper trail) (Schwarz et al. 1991).
Interviewer Impact Factors. The final class of mode effects is interviewer impacts. In
telephone surveys, the interviewer presence brings into play social norms that are not as relevant
or salient in self-administered surveys and that can affect responses. Phenomenon such as social
desirability, acquiescence and general norms about participation all become increasingly salient
when interviewers are present. The effects of these different forces on responses to multiple-
answer questions vary. The expected effects of social desirability are somewhat unclear because
they are highly context dependent. If the question is about socially undesirable behavior, we
should see fewer items endorsed in telephone surveys than in web surveys. If, on the other hand,
the question is about socially desirable behavior we would expect higher endorsement of options
in the telephone than the web mode. The effects of acquiescence are easier to predict as we
expect respondents to be more agreeable, and therefore more likely to endorse options, when an
interviewer is present. Finally, the presence of an interviewer in telephone surveys has the latent
effect of strengthening the obligation of the respondent to answer individual items and complete
the survey after initially agreeing to participate. In contrast, web respondents may feel very little
accountability for honoring their [unspoken] agreement to participate because their participation

8
and progress is not being directly monitored by a person they have to interact with.
Consequently, we might expect higher item nonresponse for items administered over the Internet
than for those administered over the telephone.
Although these three classes of mode effects are presented separately for organizational
and analytical purposes, in reality they share substantial overlap. As a case in point, telephone
surveys tend to progress at relatively rapid paces because interactional and conversational norms
are triggered by the interviewer’s presence. In general, long moments of empty silence in
conversations (esp. between participants who are not well acquainted) are considered awkward
and to be avoided. When participating in a telephone survey conversation we lack the ability to
use nonverbal communication (i.e., body language) to show that although we are silent we are
still engaged in the conversation (i.e., thinking and processing) (Schwarz et al. 1991). Therefore,
anything beyond a brief silence may get interpreted as “empty” silence which then prompts the
interviewer and/or the respondent to continue. In web surveys, there is no conversation in the
literal sense of the word so respondents do not have to worry about hurrying to avoid awkward
silences or about inconveniencing interviewers by taking their time on an item.
Format and Mode Interaction Effects
As Figure 1 shows, it is not uncommon for the expected effects of question format and
survey mode to directly contradict each other, nor is it uncommon for different types of mode
effects to be contradictory. For example, while the endorsement of options is expected to
increase in the forced-choice question format it is expected to decrease as a result of a number of
telephone mode factors such as: lack of control over the survey pace, cultural tendencies to feel
inconvenienced by unsolicited calls, and reliance on aural communication (and thus limited
memory capacity). In contrast, the endorsement of options over the telephone mode is expected

9
to increase due to acquiescence triggered by social interaction with the telephone interviewer.
Similarly, the check-all question format is expected to reduce the number of options endorsed,
but having control of the survey pace and having visual access to information on web surveys is
expected to increase the number of options marked. At the same time, a cultural tendency to
move quickly and stay entertained when using the Internet as well as privacy to disclose should
reduce the number of options marked.
As a result of these oftentimes contradictory expectations, it is difficult to predict what
the combined effects of question format and survey mode will be and, to date, we are not aware
of any research that has been able to disentangle the effects. In fact, we know of only one article
in which the check-all format administered in a visual mode and the forced-choice format
administered in an aural mode have been compared. In a comprehensive effort to explore mode
effects between telephone and face-to-face surveys Jordan, Marcus, and Reeder (1980) compared
the results of responses to three checklists presented in the forced-choice format to telephone
respondents and in the check-all format on show cards to the face-to-face interview respondents.
In all three comparisons they found that the telephone forced-choice respondents endorsed more
options. The authors offered two alternative explanations for these findings: acquiescence
among the telephone sample or more clear communication of the question’s intent in the face-to-
face interviews. However, as is common among mode comparison studies, the effects that
Jordan et al. (1980) called mode effects may have been confounded by question format effects
(Biemer 1988; Schwarz et al. 1991).
The goal of this paper is to address the extent to which data collected using the forced-
choice question format and administered via telephone surveys is comparable to data collected

10
using the check-all format via web surveys and to attempt to parse any differences into those
attributable to mode effects and those attributable to question format effects.
PROCEDURES AND ANALYTIC STRATEGY
The data used in this paper were collected in the Fall 2004 via simultaneous telephone
and web surveys of a random sample of Washington State University undergraduates registered
for classes on the Pullman campus. Overall, 3,408 students were sampled and randomly
assigned to one of six questionnaire versions (three web and three telephone). The telephone
survey received a 59 percent response rate (945/1,608) and the web survey received a 60 percent
response rate (1,082/1,800).
All respondents were initially contacted via postal mail and received a $2 incentive. To
ensure that only sampled students completed the survey and to avoid duplicate cases, web
respondents were also provided with a personal identification number required to access the
survey instrument. In addition to the initial postal contact, all web respondents for whom we had
e-mail addresses (about 2/3 of them) were sent an e-mail including both their personal
identification code and a link to the web survey. Throughout the field period, web non-
respondents were sent additional postal and e-mail reminders requesting their participation.
After receiving the initial contact via postal mail, telephone respondents were contacted by the
WSU Social and Economic Science Research Center’s telephone lab to complete the
questionnaire. Up to ten call-back attempts were made to try to reach sampled respondents.
The telephone and the web versions of the questionnaires all contained the same 25
survey questions about the student experience at WSU and the questions appeared in the same
order in every version. The web survey was designed using a page-by-page design with
questions appearing in black text on a colored background and answer spaces appearing in white

11
so as to provide contrast. To standardize the visual stimulus across various hardware and
software configurations, the pages were designed with HTML tables using proportional widths
and with cascading style sheets to adjust for font size and style.
In the analyses that follow, we look at both the mean number of items endorsed in each
format/mode and the percent of individual response options marked more or less often across all
questions presented in a specific format. To ground our research in previous literature, we start
by comparing responses from the forced-choice and check-all question formats within the web
survey mode. This comparison allows us to examine question format effects and to determine
whether or not the current data replicate the finding that the forced-choice question format
produces significantly more items endorsed than does the check-all question format. We then
compare the check-all format on the web to the forced-choice format on the telephone to
examine the effects of question format on responses across modes. This comparison addresses
the fundamental question of this paper: does the telephone forced-choice format yield the same
results as the web check-all format? Finally, in order to examine mode effects independently of
question format effects, we compare telephone and web results from the forced-choice format.
Our primary statistical test throughout the analyses is a difference of means t-test. However,
where appropriate we also employ a chi-squared significance test.
While we cannot simultaneously model question format and mode effects, these three
layers of analysis allow us to independently address each type of effect and to look at them in
concert to help shed light on how these effects may work. Additionally, since the survey design
consisted of three experimental versions of each of the web and telephone mode surveys, we are
able to examine the same four questions (#11, #13, #20, #22) across all three layers of the
analysis. The telephone and web versions of these four questions as well as additional questions

12
analyzed in this paper can be seen in Figure 3. Note that in all figures and tables the questions
being analyzed are listed in order from the most to the least concrete question topics, not in the
order in which they appeared in the survey. This presentation order is intentional as it highlights
how format and mode effects may differ by question type.
FINDINGS
Table 1 shows the results of within web comparisons of the forced-choice and the check-
all question formats. These results largely confirm the findings of both Rasinski et al. (1994) and
Smyth et al. (Forthcoming); in every comparison the forced-choice question format yields higher
endorsement of options than the check-all format. Overall, the forced-choice format yielded an
average of 4.72 options endorsed and the check-all format yielded an average of 4.17 (t = 5.19, p
≤ .000). Individually the differences are significant in two of the four questions. Among the
two questions that are not significant, one reaches significance at the .10 level (p ≤ .099) and the
other approaches this mark (p ≤ .107). Additionally, inspection of the 46 individual response
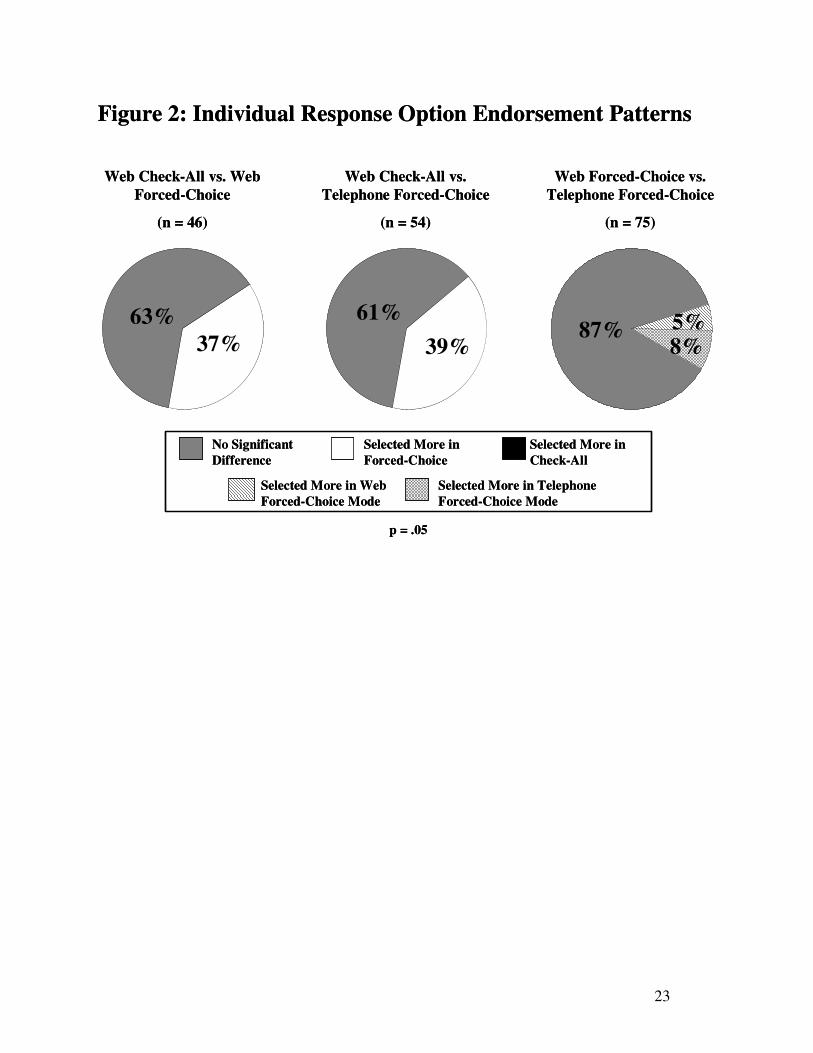
options in all of the questions shown in Table 1 indicates that 80 percent of them were marked
more often in the forced-choice format, 37 percent significantly so.2 None were marked
significantly more often in the check-all format (see the far left pie chart in Figure 2). These
results, taken together with the results of the two previous studies, indicate fairly strongly that
there is a consistent question format effect between the forced-choice and the check-all question
formats.
Table 2 compares the mean number of options endorsed in the forced-choice format on
the telephone and the check-all format on the web. Here again, the forced-choice format
consistently yields higher endorsement of options than does the check-all format with three of
the five comparisons reaching significance. Overall, the telephone forced-choice format yielded
2 Analysis not shown, but available upon request from the authors.

13
an average of 4.44 options endorsed while the web check-all format only yielded an average of
3.85 options endorsed (t = 7.83, p ≤ .000). Individually, 80 percent of the 54 options were
marked more often in the telephone forced-choice format, 39 percent significantly so. Again,
none were marked significantly more often in the web check-all format (see the middle pie chart
in Figure 2). These findings confirm the show-card check-all versus telephone forced-choice
results of Jordan et al. (1980). However, despite the fact that they look strikingly similar to those
presented in Table 1 (looking at question format effects only), we cannot yet determine the
extent to which this difference is due to either mode or question format effects.
Table 3 addresses the extent to which the forced-choice question format is prone to mode
effects by comparing this format across the telephone and web modes. On average, the
telephone forced-choice questions yielded an average of 5.54 options marked. The web forced-
choice questions yielded a comparable 5.42 options marked (t = 1.58, p ≤ .113). In eight of nine
comparisons there is no significant difference in the mean number of options endorsed across
these two modes. Additionally, while 49 percent of the 75 individual response options were
marked more often in the web mode (4% were significantly different), a very comparable 52
percent were marked more often in the telephone mode (6% were significantly different) (see the
far right pie chart in Figure 2). These results indicate that the forced choice question format
performs similarly across web and telephone survey modes. As such, they suggest that the
differences found between the web check-all format and the telephone forced-choice format
likely trace back to question format effects.
Nevertheless, as Table 4 shows, there appears to be significant forced-choice mode
differences with respect to the rejection of response options for four of the nine comparisons
made. These differences appear to be linked to significant mode differences in item

14
nonresponse. Seven of nine comparisons show significant differences at the .05 level in the
mean number of options left blank across modes and the remaining two comparisons reach
significance at the .10 level. In seven of the comparisons the differences are consistent with the
expectations of higher item nonresponse on the web than on the telephone that is presented in
Figure 1. The two cases in which the telephone produces higher item nonresponse are both for
the question asking about descriptors of WSU (Q3).
The unexpected reversal of effect direction for the comparisons in this item stimulated
additional exploration of missing data patterns first throughout all of the questions and then in
this particular question. Similarly to Smyth et al. (Forthcoming) we find that very few
respondents treated the forced-choice questions as check-all questions (i.e., marking only in the
affirmative category and not in the negative). On average, only about 0.9 percent (range: 0.3% -
2.3%) of web respondents used this response tactic.
Table 5 shows the percent of forced-choice respondents leaving no options blank, one to
three options blank, or over three options blank per question as well as the number leaving all
options blank (excluding those treating the forced-choice questions as de facto check-all
questions).3 Since Q3 is rather anomalous compared to the other questions, the mean percents in
the table are calculated both with and without that data. When Q3 is excluded from the
calculations the data reveal that on average across questions comparable percents of telephone
and web respondents left one to three options blank (telephone – 1.3%; web – 1.9%), but web
respondents were more likely to leave over three blank (telephone – 0.1%; web 2.0%). In fact,
within the web mode an average of 1.8 percent of respondents left all of the options in a question
blank compared to less than 0.1 percent of respondents in the telephone mode. This data
3 To simplify the table and facilitate mode comparisons (rather than question format comparisons) the multiple forced-choice versions of each question are aggregated at the question level in the table. Similar data split out by version is available from the authors upon request.

15
suggests that while telephone respondents may have occasionally been uncomfortable enough
with an option to skip it, they did not have the same latitude to skip multiple options or even
whole questions that web respondents seemed to have.
We now turn to specific analyses of question 3. The wording and response options for
this question can be seen in Table 6. Table 5 shows that similar proportions of web respondents
left options missing on this question as on the other four, but substantially more telephone
respondents left options missing. Most of the increase in item nonresponse among telephone
respondents occurred among those leaving one to three options blank per question (17.8% for
Q3; 1.3% for the other four questions). This increased nonresponse among telephone
respondents is reflected in the distributions shown in Table 6 where for all but one option the
telephone produced higher nonresponse than the web. For five of these options the difference
was statistically significant. Although we do not have conclusive evidence pertaining to the
mechanism(s) behind this increase in nonresponse for telephone respondents, it seems likely that
all respondents found this question and its attendant response options to be a bit sensitive, but
telephone respondents were particularly uncomfortable with it because they had to report their
responses to a live interviewer who they knew was associated with WSU.
Qualitative evidence from monitoring of the telephone interviews indicates that first year
students felt especially ill-equipped to attribute descriptions to WSU when they had only just
begun their studies there at the time they were surveyed. This evidence is confirmed in the
substantive data in that 49.2 percent of the missing options in the telephone versions and 53.3
percent of those missing in the web versions of this question could be attributed to first-year
students.4 However, since first year students accounted for less of the nonresponse in the
4 Responses to a question asking students to report the month and year they began their studies at WSU were used to determine each respondents’ year in school.

16
telephone mode than in the web mode, the discomfort this particular group felt in attributing
descriptions to WSU cannot explain the significantly higher nonresponse among telephone
respondents. If anything it appears that the telephone mode may have increased the discomfort
of those students in their second or higher year at WSU.
DISCUSSION AND CONCLUSIONS
One advantage of the tripartite design of the telephone and web surveys reported here is
that it gives us the ability to examine question format, survey mode, and format/mode interaction
effects independently and compare the results.5 Furthermore, we can follow the same four
questions (#22, #13, #11, and #20) through all three major steps of the analysis. In doing so we
see clear patterns suggesting that, in the case of multiple-answer questions, question format
effects are independent of and much larger in magnitude than survey mode effects. As can be
seen in Figure 2, comparing the forced-choice and the check-all format both within the web
mode and across the web and telephone modes shows that the forced-choice format yields higher
endorsement of items, a finding that is consistent with past research comparing these two
question formats in various modes (Jordan et al. 1980; Rasinski et al. 1994; Smyth et al.
Forthcoming; and Tipping and Nicholaas 2005). Moreover, the findings seem to follow a pattern
whereby those questions referring to less concrete topics (attitude and opinion questions) are
prone to larger question format effects than those referring to more concrete topics (behavior and
fact questions).
Since there is virtually no evidence that survey mode significantly impacts the
endorsement of items in the forced-choice question format (see Figure 2), it is likely that that the
differences found between web check-all and telephone forced-choice questions are the result of
5 Unfortunately, we are unable to model these three effects simultaneously because of the lack of ability to administer a check-all question in the telephone mode.

17
question format differences (i.e., forced-choice vs. check-all) more so than survey mode. These
findings suggest that the differences that Jordan et al. (1980) attributed to survey mode effects in
their study may, in fact, be the result of the change in question format that accompanied their
mode comparison. In the case of multiple-answer questions, previous findings that the forced-
choice format is subject to deeper processing and may discourage satisficing (Smyth et al.
Forthcoming) combined with our finding here that this question format translates relatively well
across visual and aural survey modes suggests that the forced-choice question format should be
used instead of the check-all format in both single and multiple-mode surveys.
The larger implication of these findings is that changes made to accommodate mode
limitations may significantly change the question stimulus such that results across modes are not
comparable. The consequences of such unintended effects have been minimal in the past
because most surveys were limited to one mode of administration. However, now that we are
increasingly relying on mixed-mode data collection strategies we need to revisit parallel mode-
specific measures (e.g., forced-choice and check-all; polar and fully labeled scales, etc.) to
ensure that they are presenting the same stimulus to respondents in order to measure the same
constructs (intermode question validity).
As de Leeuw (2005) points out, achieving the same stimulus across modes (i.e., universal
mode design) may not require presenting the same exact question format and wording in both
modes. It may, in fact, be necessary to make adjustments to accommodate the distinctive
characteristics and demands of each mode. However, researchers should carefully consider and
research such mode-specific changes rather than developing surveys under the assumption that
mode-specific question formats developed during a time when single mode surveys
predominated are appropriate in this time of mixed-mode surveys. The findings in this and other

18
recent papers indicate that the check-all and forced-choice question formats do not present the
same stimulus to respondents within or across survey modes, but that the forced-choice format
performs well both within and across web and telephone modes. As such, we recommend using
it instead of the check-all question format.

19
Table 1: Mean Number of Options Endorsed in the Web Check-All and Forced-Choice
Formats
One-Sided
T-Test Questions Listed from Most Concrete
Topic to Least Concrete Topic
Forced-
Choice
Check-
All Diff. t p
Q22: Possessions (13) 6.60 6.36 0.24 1.29 .099 Q13: Use of WSU resources (9) 5.12 4.88 0.24 1.96 .025 Q11: WSU services purchased (9) 2.54 2.39 0.15 1.24 .107 Q20: Cougar varsity sports fan (15) 4.63 3.03 1.60 6.16 .000
Overall Means 4.72 4.17 0.55 5.19 .000
Note: Parentheses contain the number of response options accompanying the question.
Table 2: Mean Number of Options Endorsed in the Telephone Forced-Choice Format
Compared to the Web Check-All Format
One-Sided
T-Test Questions Listed from Most Concrete
Topic to Least Concrete Topic
Mean:
Telephone
Forced-
Choice
Mean:
Web/Check-
All Difference t p
Q22: Possessions (13) 6.51 6.36 0.15 0.80 .212 Q13: Use of WSU resources (9) 5.01 4.88 0.13 1.08 .140 Q11: WSU Services purchased (9) 2.66 2.39 0.27 2.12 .017 Q12: Financial resources while attending WSU (8) 3.03 2.58 0.45 4.22 .000 Q20: Cougar varsity sports fan (15) 5.01 3.02 1.99 7.83 .000
Overall Mean 4.44 3.85 0.59 6.56 .000
Note: Parentheses contain the number of response options accompanying the question.
Table 3: Mean Number of Options Endorsed in the Telephone and Web Forced-Choice
Formats
Two-Sided T-Test Questions Listed from Most Concrete
Topic to Least Concrete Topic Tele. Web Diff. t p
Q22: Possessions (have or not vs. possess or not) (13) 6.51 6.60 -0.09 -0.53 .595 Q22: Possessions (possess or not vs. possess or not) 6.51 6.67 -0.16 -0.88 .376 Q22: Possessions (have or not vs. have or not) 6.71 6.60 0.11 0.61 .545 Q13: Use of WSU resources (Original Order) (9) 5.01 5.12 -0.11 -0.95 .343 Q13: Use of WSU resources (Reverse Order) 5.13 4.93 0.20 1.54 .123 Q11: WSU Services purchased (9) 2.66 2.54 0.12 0.89 .373 Q20: Cougar varsity sports fan (15) 5.01 4.63 0.38 1.23 .220 Q3: Descriptions of WSU (Original Order) (10) 6.42 6.32 0.10 0.75 .451 Q3: Descriptions of WSU (Reverse Order) 6.78 6.43 0.35 2.57 .010
Overall Means 5.54 5.42 0.12 1.58 .113
Note: Parentheses contain the number of response options accompanying the question. When versions are included in multiple comparisons (as in Q22) they are only counted in the overall means once.

20
Tab
le 4
: M
ean
Nu
mb
er o
f O
pti
on
s D
ism
isse
d o
r L
eft
Bla
nk
in
th
e T
elep
hon
e an
d W
eb F
orc
ed-C
hoic
e Q
ues
tion
s
Mea
n N
um
ber
of
Op
tio
ns
Ma
rked
No
M
ean
Nu
mb
er o
f O
pti
on
s L
eft
Bla
nk
Q
uest
ion
s L
iste
d f
rom
Mo
st C
on
cret
e
To
pic
to
Lea
st C
on
cret
e T
op
ic
Tel
eph
on
e W
eb
Dif
f.
t*
p
Tel
eph
on
e W
eb
Dif
f.
t*
p
Q2
2:
Po
sses
sio
ns
(hav
e o
r no
t vs.
po
sses
s o
r no
t) (
13
) 6
.45
6
.21
0
.25
1
.35
.1
77
0
.04
0
.19
-0
.15
-1
.70
.0
90
Q2
2:
Po
sses
sio
ns
(po
sses
s o
r no
t vs.
po
sses
s o
r no
t)
6.4
5
5.8
6
0.5
9
3.2
5
.00
1
0.0
4
0.4
7
-0.4
3
-3.4
2
.00
1
Q2
2:
Po
sses
sio
ns
(hav
e o
r no
t vs.
hav
e o
r no
t)
6.2
8
6.2
1
0.0
7
0.4
3
.66
9
0.0
1
0.1
9
-0.1
8
-2.3
9
.01
8
Q1
3:
Use
of
WS
U r
eso
urc
es (
Ori
gin
al O
rder
) (9
) 3
.99
3
.72
0
.27
2
.25
.0
25
0
.00
0
.15
-0
.15
-2
.71
.0
07
Q
13
: U
se o
f W
SU
res
ourc
es (
Rev
erse
Ord
er)
3.8
6
3.8
2
0.0
4
0.2
7
.78
6
0.0
1
0.2
5
-0.2
4
-3.1
4
.00
2
Q1
1:
WS
U S
ervic
es p
urc
has
ed (
9)
6.2
8
6.2
7
0.0
1
0.0
6
.94
9
0.0
7
0.1
9
-0.1
2
-1.9
0
.05
9
Q2
0:
Co
ugar
var
sity
sp
ort
s fa
n (
15
) 9
.95
9
.80
0
.15
0
.46
.6
45
0
.04
0
.56
-0
.52
-3
.62
.0
00
Q
3:
D
escr
ipti
ons
of
WS
U (
Ori
gin
al O
rder
) (1
0)
3.1
8
3.5
7
-0.3
9
-2.7
5
.00
6
0.3
9
0.1
1
0.2
8
4.5
4
.00
0
Q3
:
Des
crip
tio
ns
of
WS
U (
Rev
erse
Ord
er)
2.8
6
3.4
0
-0.5
4
-4.0
4
.00
0
0.3
5
0.1
7
0.1
8
2.4
0
.01
7
Ov
era
ll M
ean
s 5
.36
5
.30
0
.06
0
.72
.4
73
0
.11
0
.26
-0
.15
-4
.65
.0
00
No
te:
Par
enth
eses
co
nta
in t
he
nu
mb
er o
f re
spo
nse
op
tio
ns
acco
mp
anyin
g t
he
ques
tio
n.
Wh
en v
ersi
ons
are
incl
ud
ed i
n m
ult
iple
co
mp
aris
ons
(as
in Q
22
) th
ey a
re
only
co
unte
d i
n t
he
over
all
mea
ns
once
. *
Tw
o-s
ided
t-t
est
of
mea
ns
Tab
le 5
: P
erce
nt
of
Tel
eph
on
e an
d W
eb R
esp
on
den
ts L
eavin
g 1
to 3
or
4+
Ite
ms
Bla
nk
by Q
ues
tion
PE
CE
NT
WIT
HO
UT
Q3
PE
RC
EN
T W
ITH
Q3
Q
22
**
*
Q1
3*
*
Q1
1*
**
Q
20
*
Mea
n P
erce
nt
Q
3*
**
M
ean
Per
cen
t
No
Ite
ms
Bla
nk
9
9.6
9
9.5
9
5.7
9
9.4
9
8.6
81
.7
95
.2
1 t
o 3
Ite
ms
Bla
nk
0
.3
0.5
4
.2
0.3
1
.3
1
7.8
4
.6
4 o
r M
ore
Ite
ms
Bla
nk
0
.1
0.0
0
.1
0.3
0
.1
0
.5
0.2
To
tal
1
00
.0
10
0.0
1
00
.0
10
0.0
1
00
.0
1
00
.0
10
0.0
PHONE
All
Ite
ms
Bla
nk
0
.1
0.0
0
.0
0.0
0
.0
0
.0
0.0
No
Ite
ms
Bla
nk
9
5.6
9
7.7
9
6.3
9
4.9
9
6.1
96
.7
96
.2
1 t
o 3
Ite
ms
Bla
nk
2
.1
0.5
1
.9
3.1
1
.9
1
.9
1.9
4 o
r M
ore
Ite
ms
Bla
nk
2
.3
1.8
1
.8
2.0
2
.0
1
.4
1.9
To
tal
1
00
.0
10
0.0
1
00
.0
10
0.0
1
00
.0
1
00
.0
10
0.0
WEB
All
Ite
ms
Bla
nk
2
.1
1.8
1
.6
1.7
1
.8
0
.7
1.6
* O
ne
ver
sio
n o
f th
is q
ues
tio
n w
as i
ncl
ud
ed;
** T
wo
ver
sio
ns
of
this
ques
tio
n w
ere
incl
ud
ed;
**
* T
hre
e ver
sio
ns
of
this
ques
tio
n w
ere
incl
ud
ed.

21
Tab
le 6
: P
erce
nt
of
Res
pon
den
ts L
eavin
g E
ach
Op
tion
Bla
nk
on
th
e D
escr
ipto
rs Q
ues
tion
*
Q3
: D
o y
ou
fee
l th
at
each
of
the
foll
ow
ing
des
crip
tio
ns
do
es o
r d
oes
no
t d
escr
ibe
Wa
shin
gto
n S
tate
Un
iver
sity
?
Ph
on
e
Web
Ov
era
ll
Ch
i-S
qu
are
Ver
sio
n 1
Yes
/No
(Ori
gin
al)
Ver
sio
n 2
Yes
/No
(Rev
erse
d)
Ver
sio
n 3
Yes
/No
(Ra
nd
om
) O
ver
all
Ver
sio
n 1
Yes
/No
(Ori
gin
al)
Ver
sio
n 2
Yes
/No
(Rev
erse
d)
Ver
sio
n 3
Yes
/No
(Ra
nd
om
) O
ver
all
X
2
p
Far
m o
r A
gri
cult
ure
Sch
oo
l
4.6
1
3.3
1
2.1
9
3.4
9
0
.57
1
.32
1
.16
1
.39
9
.67
.0
02
P
arty
Sch
oo
l
1.9
7
2.6
5
1.5
6
2.0
1
0
.57
1
.32
1
.45
1
.39
1
.19
.2
75
E
lect
ronic
or
“Wir
ed”
Univ
ersi
ty
4
.61
1
.99
1
.88
2
.86
0.5
7
1.3
2
0.8
7
1.1
1
8.1
7
.00
4
Co
mp
etit
ive
in P
ac 1
0 S
port
s
3.2
9
1.3
2
0.9
4
1.8
0
0
.86
1
.58
1
.16
1
.76
0
.01
.9
42
C
onse
rvat
ive
Un
iver
sity
7.8
9
7.6
2
3.4
4
7.0
9
1
.43
2
.11
1
.73
2
.22
2
7.9
2
.00
0
Po
liti
call
y C
har
ged
/So
cial
ly C
onsc
iou
s
5.2
6
1.6
6
2.1
9
3.0
7
0
.86
2
.11
1
.73
2
.03
2
.21
.1
38
R
elig
ious
2
.96
3
.64
2
.19
4
.02
1.1
5
1.5
8
0.5
8
1.6
6
10
.44
.0
01
O
utd
oo
rs O
rien
ted
2.3
0
5.3
0
2.5
0
3.7
0
1
.43
1
.58
1
.45
2
.03
5
.15
.0
23
W
orl
d C
lass
Univ
ersi
ty
2
.63
3
.31
1
.88
2
.65
1.1
5
2.1
1
1.4
5
1.7
6
1.8
8
.17
0
Div
erse
0.6
6
0.9
9
0.6
3
0.7
4
0
.57
1
.58
1
.45
1
.57
2
.97
.0
85
% o
f m
issi
ng i
tem
s fr
om
1st y
r. s
tud
ents
4
9.1
4
8.4
5
0.0
4
9.2
62
.5
50
.8
46
.7
53
.3
% o
f m
issi
ng i
tem
s fr
om
2+
yr.
stu
den
ts
50
.9
51
.6
50
.0
50
.8
3
7.5
4
9.2
5
3.3
4
6.7
N
3
04
3
02
3
20
9
45
34
9
37
9
34
6
1,0
82
* E
xcl
ud
ing t
ho
se w
ho
tre
ated
the
forc
ed-c
ho
ice
ques
tio
n f
orm
at a
s a
de
fact
o c
hec
k-a
ll f
orm
at.

22
Figure 1: Expected Format and Mode Effects for Multiple-Answer Questions
FORCED-CHOICE CHECK-ALL
Response
Task
Respondents must record a position for every option, leading to deeper processing.
Outcome: More options endorsed.
Respondents don’t have to record a position for every option, allowing them to superficially process some items. Outcome: Fewer options endorsed.
TELEPHONE WEB
Locus of Control
Respondent has little control over pace. Rapid pace means little processing time. Expectation: Fewer options endorsed.
Respondent controls survey pace. Can slow down when needed.
Expectation: More options endorsed.
Med
ia-R
ela
ted
Fa
cto
rs
Cultural Characteristics
of Mode
Telephones are personal devices and unsolicited calls are inconveniences. May lead to reduced motivation, superficial interactions, and satisficing strategies. Expectation: Fewer options endorsed.
The Internet is dynamic, interactive, and expected to be quick, convenient, and fun. These characteristics may promote superficial processing of items. Expectation: Fewer options endorsed.
Info
rma
tio
n
Tra
nsm
issi
on
Visual vs. Aural
Reliance on aural communication makes respondents rely on memory a lot. It’s difficult to return to an item or skip ahead. Expectation: Fewer options endorsed.
Visual communication channels allow, respondents to repeatedly reference information, reducing mental burden. Expectation: More options endorsed.
Social Desirability
Interviewer presence increases social desirability pressures. Expectation: More desirable and fewer
undesirable responses.
Reduced social desirability pressures and increased privacy of disclosure. Expectation: Fewer desirable and more
undesirable responses.
Acquiescence
Interviewer presence increases the tendency of respondents to be agreeable. Expectation: More options endorsed.
Anonymity and privacy of disclosure reduces agreeing response bias. Expectation: Fewer options endorsed.
Inte
rvie
wer
Im
pa
ct F
act
ors
Participation Expectations
Increased accountability for skipping items or breaking off b/c of interviewer presence. Expectation: Lower item nonresponse.
Reduced feelings of accountability for skipping items or breaking off participation. Expectation: Higher item nonresponse.
23
63%
37%
Web Check-All vs. Web
Forced-Choice
(n = 46)
61%
39%87% 5%
8%
Web Check-All vs.
Telephone Forced-Choice
(n = 54)
Web Forced-Choice vs.
Telephone Forced-Choice
(n = 75)
No Significant
Difference
Selected More in
Forced-Choice
Selected More in
Check-All
Selected More in Web
Forced-Choice Mode
Selected More in Telephone
Forced-Choice Mode
p = .05
Figure 2: Individual Response Option Endorsement Patterns
63%
37%
63%
37%
Web Check-All vs. Web
Forced-Choice
(n = 46)
61%
39%
61%
39%87% 5%
8%87% 5%
8%
Web Check-All vs.
Telephone Forced-Choice
(n = 54)
Web Forced-Choice vs.
Telephone Forced-Choice
(n = 75)
No Significant
Difference
Selected More in
Forced-Choice
Selected More in
Check-All
Selected More in Web
Forced-Choice Mode
Selected More in Telephone
Forced-Choice Mode
p = .05
Figure 2: Individual Response Option Endorsement Patterns

24
Figure 3: Web and Telephone Experimental Treatment Summaries
WEB TELEPHONE*
Do you have or not have each of the following items in your possession here in Pullman?
I am going to read a list of items. Please indicate whether you possess or do not possess each item here in Pullman by saying yes or no.
Q22:
I am going to read a list of campus resources. Please indicate whether you have or have not used each resource at WSU by saying yes or no.
I am going to read a list of campus resources. Please indicate whether you have or have not used each resource at WSU by saying yes or no.
Q13:
I am going to read a list of optional services provided by WSU. Please indicate whether you have purchased or not purchased each service from WSU this semester by saying yes or no.
Q11:
I am going to read a list of optional services provided by WSU. Please indicate whether you have purchased or not purchased each service from WSU this semester by saying yes or no.
Options read in inverse order.
* Response options were read in the order seen at left unless otherwise noted.

25
Figure 3: Web and Telephone Experimental Treatment Summaries (continued)
WEB TELEPHONE*
Q12:
I am going to read a list of sources of financial support. Please indicate whether you have or have not received support from each source by saying yes or no.
I am going to read a list of Cougar varsity sports. Please indicate whether you are a fan or not a fan of each by saying yes or no.
Q20:
I’m going to read a list of descriptions. Please indicate whether you feel that each description does or does not describe Washington State University by saying yes or no.
Q3:
I’m going to read a list of descriptions. Please indicate whether you feel that each description does or does not describe Washington State University by saying yes or no.
* Response options were read in the order seen at left unless otherwise noted.

26
REFERENCES Biemer, Paul P. 1988. “Measuring Data Quality.” In Robert M. Groves, Paul P. Biemer, Lars E.
Lyberg, James T. Massey, William L. Nicholls, and Joseph Waksberg (eds.), Telephone
Survey Methodology (pp. 321-340). New York: Wiley. de Leeuw, Edith D. 1992. Data Quality in Mail, Telephone, and Face to Face Surveys.
Amsterdam: TT Publications. de Leeuw, Edith D. 2005. “To Mix or Not to Mix: Data Collection Modes in Surveys.” Journal
of Official Statistics. 21(2): 233-255. Dillman, Don A. 2000. Mail and Internet Surveys: The Tailored Design Method. 2nd ed. New
York, NY: John Wiley and Sons, Inc. Dillman, Don A., Roberta L. Sangster, John Tarnai, & Todd H. Rockwood. 1996. Understanding
Differences in People’s Answers to Telephone and Mail Surveys. In M. T. Braverman & J. K. Slater (Eds.), New Directions for Evaluation Series, 70 (Advnces in survey research), (pp. 45-62). San Francisco: Jossey-Bass.
Groves, Robert M., Paul P. Biemer, Lars E. Lyberg, James T. Massey, William L. Nicholls, and
Joseph Wakesberg. 1988. Telephone Survey Methodology. New York: Wiley. Jordan, Lawrence A., Alfred C. Marcus, & Leo G. Reeder. 1980. “Response Styles in Telephone
and Household Interviewing: A Field Experimet.” Public Opinion Quarterly. 44(2): 210-222. Krosnick, Jon A. 1991. “Response Strategies for Coping with the Cognitive Demands of Attitude
Measures in Surveys.” Applied Cognitive Psychology. 5: 213-236. Krosnick, Jon A. 1999. “Survey Research.” Annual Review of Psychology. 50: 537-567. Krosnick, Jon A. and D. F. Alwin. 1987. “An Evaluation of a Cognitive Theory of Response-
Order Effects in Survey Measurement.” Public Opinion Quarterly. 51: 201-219. Rasinski, Kenneth A., David Mingay, and Norman M. Bradburn. 1994. “Do Respondents Really
‘Mark All That Apply’ on Self-Administered Questions?” Public Opinion Quarterly. 58: 400-408.
Schwarz, Norbert, Fritz Strack, Hans-J. Hippler, and George Bishop. 1991. “The Impact of
Administration Mode on Response Effects in Survey Measurement.” Applied Cognitive
Psychology. 5:193-212. Smyth, Jolene D., Don A. Dillman, Leah Melani Christian, & Michael J. Stern. (Forthcoming).
“Comparing Check-All and Forced-Choice Question Formats in Web Surveys.” Public
Opinion Quarterly.

27
Sudman, Seymour and Norman M. Bradburn. 1982. Asking Questions. San Francisco, CA: Jossey-Bass
Tipping, Sarah and Gerry Nicolaas. 2005. “Neighbourhood Survey 2005: Report on Modes
Comparison.” Report prepared for the Socio-Economic Inequalities Branch, Office for National Statistics. England.