does big 4 audit quality improve after a failed audit or
TRANSCRIPT
Does Big 4 Audit Quality Improve after a Failed Audit or is it Business as Usual?
PWC-India Audit Quality before and after Satyam Revelation
Sudhir S. Jaiswall***
Indian Institute of Management Calcutta
K. K. Raman
The University of Texas at San Antonio
***Submitting author. Authors’ names are listed alphabetically.
Does Big 4 Audit Quality Improve after a Failed Audit or is it Business as Usual?
PWC-India Audit Quality before and after Satyam Revelation
Abstract
Coffee (2019) suggests that Big 4 auditors (in the US and abroad) are now less protective of their reputational
capital and provide a “commodity” audit service. Consistent with this notion, whether Big 4 auditors provide higher audit
quality than non-Big 4 auditors (in the US or abroad) remains controversial. Because an audit is designed to provide only
reasonable (not absolute) assurance, after a failed audit a Big 4 auditor could decide to wait out the furor rather than
improve audit quality. In this paper, we examine whether the 2009 revelation of PWC-India’s failed Satyam audit was
followed by an improvement in audit quality. Our difference-in-differences analyses suggest that PWC-India audit
quality was lower than that of both other-Big 4 (OB4) and non-Big 4 (NB4) India auditors before the 2009 revelation.
PWC-India audit quality improved after the 2009 revelation and during 2015-17 appears to overall exceed that of NB4
auditors. By contrast, we find little or no evidence of an increase in other-Big 4 (OB4) audit quality vis-à-vis NB4
auditors. Notably, both PWC and the other-Big 4 (OB4) India firms were subject to PCAOB regulatory oversight during
our study period. Collectively, our findings suggest that even in a weak investor protection environment, PWC was
protective of its reputation and improved its audit quality (following the failed Satyam audit) to overall exceed that of
NB4 auditors. Our findings are of potential interest to regulators and investors both in the US and abroad.
JEL classifications: M4; M49
Keywords: Big 4 audit failure, Audit quality, Reputation argument, PCAOB regulatory oversight.
Data Availability: All data are publicly available.
1
Does Big 4 Audit Quality Improve after a Failed Audit or is it Business as Usual?
PWC-India Audit Quality before and after Satyam Revelation
1. Introduction
If a Big 4 firm is protective of its reputation, it may be expected to improve its audit quality after the revelation
of a failed audit since Big 4 firms have more reputational capital to lose (DeAngelo 1981).1 Skinner and Srinivasan
(2012) and Weber et al. (2008) suggest that a Big 4 audit failure in Japan and Germany (where litigation risk is low or
non-existent) inflicts reputation loss on the non-US Big 4 auditor that rendered the failed audit. However, they do not
examine whether the failed audit is followed by an increase in actual audit quality. Further, Coffee (2019) suggests that
Big 4 firms (in the US as well as abroad) are now less protective of their reputational capital and market a “commodity”
audit service. Consistent with this idea, whether Big 4 auditors provide higher actual audit quality than NB4 auditors –
in the US or abroad – remains controversial (DeFond et al. 2016; Francis and Wang 2008; Lawrence et al. 2011, 2017).
In this paper, we examine whether the January 2009 revelation of the failed audit of Satyam Computer Services
Ltd., a US-listed client of PWC-India was followed by an improvement in audit quality for PWC-India vis-à-vis the
other-Big 4 (OB4) and non-Big 4 (NB4) auditors in India. 2 Our difference-in-differences analysis also allows us to
examine the audit quality of PWC-India (and the OB4 firms) vis-à-vis the NB4 firms both before and after the 2009
revelation of the Satyam failure.
As background, India is currently ranked as the world’s sixth largest economy (ahead of France) and is projected
by the IMF to grow to become the fifth largest (ahead of the UK) by the end of this year 2019 and the third largest (ahead
of Germany and Japan) by 2030. Further, India’s importance as both a source and destination for foreign portfolio as
well as direct investment is also projected to grow, so that audit quality in India is of potential interest to US regulators,
1 The Big 4 audit firms are Deloitte, EY, KPMG, and PWC. These firms are structured as an international network of legally
independent national audit firm affiliates. Consequently, a failed audit by a non-US Big 4 firm is generally viewed as not affecting the
legal liability of other firms in the network including that of the US national firm. 2 PWC operates in India through five affiliates (PCAOB 2011a, b). We refer to these India affiliates as PWC-India although to vary
the exposition we use the terms PWC-India and PWC interchangeably. The PCAOB is the US audit regulator which inspects both US
and foreign audit firms with US-listed clients for compliance with US auditing standards. Notably, the PCAOB inspects audit firms
(not clients) and inspects only US-listed client engagements of foreign auditors although it does inspect the foreign auditor’s firm-level
quality controls. During our study period (2007-2017), all the Big 4 firms in India were subject to PCAOB regulatory oversight.
Consistent with PCAOB parlance, we use the terms “audit firm and auditor” and “client and company” interchangeably.
2
investors and academics. Although India is a common law country and the laws and procedures look good on paper (in
form), enforcement (substance) is often weak (Narayanaswamy et al. 2012), and traditionally there has been little or no
shareholder activism. Domestic companies, even the large US-listed ones (such as Satyam), are majority owned or
effectively controlled by founding families, and auditors often have personal if not family connections with the
controlling shareholders. In other words, given family/concentrated ownership, India corporate owners may prefer a
deferential auditor and a commodity service as a means of protecting their private benefits of control. In this milieu and
given that audits are designed to provide only reasonable (not absolute) assurance, PWC-India could have sought to ride
out the storm and wait for the return to business as usual without increasing audit quality.
On the other hand, PWC-India underwent its initial PCAOB inspection in February 2008. However, Aobdia
(2018) and Dowling et al. (2018) suggest that auditors use PCAOB inspections to assess the minimum bar (i.e., the
minimum level of audit effort on an engagement consistent with professional standards) and adapt their practices
(including the use of checklists) to minimize the risk of deficiency findings pertaining to audit input and process rather
than to improve audit outcomes (quality). Consistent with this argument, the PCAOB inspectors did not detect the
Satyam failed audit during their February 2008 inspection of PWC-India. Still, the objective of PCAOB regulatory
oversight is to ensure compliance with minimum professional standards and this could contribute to an
improvement in audit quality (Lamoreaux 2016).
Separately, the Satyam audit failure appears to have been a watershed event marking the advent of “a new age”
of greater scrutiny of India companies by foreign and domestic analysts, proxy advisory companies, and activist
institutional investors (including private equity and hedge funds) buoyed by India regulatory reforms targeted at
strengthening shareholder activism and audit quality (Crabtree 2012; Narayanaswamy et al. 2015; Swanson 2013;
Varottil 2013). Although these changes are relatively recent, to the extent that PWC-India is protective of its reputation
capital, the 2009 Satyam revelation could trigger an improvement in audit quality. For these reasons, whether the Satyam
failed audit incentivized higher Big 4 audit quality remains an open empirical question which we investigate in our study.
We begin by examining the reputation consequences for PWC-India of the January 2009 revelation of
the Satyam failed audit. Specifically, we examine the changes in PWC-India’s switching risk and inflation-
adjusted audit fees over the 2007-2011 time period relative to the OB4 and NB4 auditors in India. Our results
3
using difference-in-difference comparisons indicate that PWC’s risk of losing (gaining) clients relative to that
of OB4 and/or NB4 auditors increased (decreased) between the 2007-2009 pre-revelation period and 2010-
2011 post-revelation period.3 The magnitude of these effects was economically significant as reflected in a 12.1
percent increase in the risk of client loss for PWC against OB4 auditors and a 5.7 percent decrease in the
likelihood of client gain against NB4 auditors. In addition, PWC suffered a decline in inflation-adjusted audit
fees relative to both OB4 and NB4 auditors between the same 2007-2009 pre-revelation and 2010-2011 post-
revelation periods. The magnitude of these fee decreases was also economically significant as reflected in an
8.3 percent fee decline for PWC-India relative to OB4 and NB4 auditors.
Potentially, the other-Big 4 (OB4) firms in India – as members of what the UK House of Commons
(2018) calls the Big 4 “cozy club” -- could have suffered “spillover” reputation loss from the 2009 Satyam
revelation. For this analysis, we examine the changes in OB4 firms’ switching risk and inflation-adjusted audit
fees over the 2007-2011 time period relative to that of the non-Big 4 (NB4) auditors in India. Our results using
difference-in-difference comparisons indicate that OB4 firms’ risk of losing (gaining) clients relative to that of
NB4 auditors did not change between the 2007-2009 pre-revelation period and 2010-2011 post-revelation
period. In addition, our findings suggest that the NB4 firms suffered no decline in inflation-adjusted audit fees
relative to NB4 auditors between the same 2007-2009 pre-revelation and 2010-2011 post-revelation periods.
Overall these findings suggest that there was no spillover reputation loss from the 2009 Satyam revelation to
the other-Big 4 (OB4) audit firms in India.
Next, we examine whether the 2009 revelation of the Satyam failed audit was followed by an increase
in actual audit quality for PWC relative to the OB4 and NB4 firms. As noted by DeFond and Zhang (2014), audit
quality is best viewed as a continuum with higher audit quality providing greater assurance of financial reporting quality.
Further, they indicate that audit quality is a multidimensional construct and that all audit quality proxies have their
3 Over 95% of India companies have a March 31 fiscal year-end, and India convention is to refer to the 12 months (fiscal year) ending
March 31, 20XX as 20XX. We follow India convention and refer (as an example) to the fiscal year ending March 31, 2009 as 2009.
Hence, the January 2009 revelation of the Satyam failed audit occurred during 2009. Although this partitioning method includes in the
pre-revelation period the two months after the January 2009 revelation of the Satyam failed audit, this is not a material issue since re-
contracting frictions tend to significantly delay auditor and/or audit fee change decisions. In robustness checks, our results do not change
if the fiscal year-end is adjusted to include February and March 2009 in the post-revelation period.
4
limitations. Consequently, we utilize several actual audit quality proxies used in the prior international auditing literature
including accrual quality, discretionary accruals, the propensity to just meet earnings benchmarks, and the likelihood of
a modified audit opinion. In particular, discretionary accruals provide evidence of opportunistic earnings management
and attempt to capture subtle variations in audit quality based on the notion that higher quality audit is more likely to
constrain earnings management. The propensity to just meet earnings benchmarks is also linked to the continuous nature
of audit quality and is suggestive of within-GAAP manipulation that could signal financial misstatements (DeFond and
Zhang 2014). 4 Finally, the last measure is similar to the propensity to issue a going-concern opinion for US companies
and is intended to capture auditor independence, i.e., the auditor’s ability to withstand client pressure to issue a clean audit
opinion (Fung et al. 2017). We do not examine financial restatements since prior research (Srinivasan et al. 2015)
suggests that companies abroad are unwilling to admit mistakes and hence restatements are not a good proxy for reporting
quality for foreign companies.
To examine the impact on PWC-India audit quality of the 2009 revelation of the Satyam failed audit
we compare the 2007-2009 pre-revelation period with the 2010-2011 post-revelation period. Our results using
difference-in-differences comparisons indicate that PWC audit quality was generally lower than that of OB4
and NB4 auditors in the pre-revelation period. Further, we find that PWC audit quality improved vis-à-vis both
OB4 and NB4 auditors between the 2007-2009 pre-revelation period and the 2010-2011 post-revelation
period.5
Next, we examine whether PWC sustained the increase in audit quality over a longer time frame by
examining the change in PWC audit quality between the 2007-2009 pre-revelation period and a later 2015-
2017 post-period. Once again, our results using difference-in-differences comparisons indicate that PWC audit
quality was generally lower than that of OB4 and NB4 auditors in the 2007-2009 pre-revelation period but
4 Using proprietary PCAOB data, Aobdia (2019) evaluates the association between the proxies for actual audit quality used in
academic research and audit input and process deficiencies identified by the PCAOB during its audit firm inspections, and reports that
absolute discretionary accruals and just meeting earnings thresholds are significantly associated with PCAOB assessments of audit
quality. 5 The improvement was economically significant as reflected, for example, in a 27.3 (29.9) percent decrease in the
discretionary accruals metric for PWC against OB4 (NB4) auditors.
5
increased between the 2007-2009 pre-revelation period and the 2015-2017 later post-period to be overall higher
than that of both OB4 and NB4 auditors.6
By contrast, we find little or no evidence of improvement in audit quality for OB4 auditors vis-à-vis
the NB4 auditors between the 2007-2009 pre-revelation period and the later 2015-2017 post-period. Notably,
during our study time period both PWC and the OB4 firms were subject to PCAOB regulatory oversight. Our
finding for the OB4 firms (no improvement in overall audit quality relative to NB4 firms) is not surprising for
two reasons: (1) the OB4 firms suffered no “spillover” reputation loss from the 2009 revelation (as noted
previously), and (2) the objective of PCAOB regulatory oversight is to ensure compliance with minimum
professional standards rather than improve Big 4 audit quality over that of the NB4 firms (Aobdia 2018;
Dowling et al. 2018). Thus, our findings suggest that the improvement in overall audit quality we observe for
PWC relative to the NB4 firms is due to the incentivizing effects of the reputation loss suffered by PWC rather
than PCAOB regulatory oversight.
In April 2011, the PCAOB (2011a, b) censured PWC-India for the Satyam failed audit. In untabulated analysis,
we find no additional reputational loss for PWC from the 2011 censure.7 Since the 2011 censure was triggered by the
2009 revelation, it is not surprising that there was no additional reputation loss for PWC-India from the censure. In
addition to a monetary penalty, the PCAOB censure required PWC-India to install an independent third-party monitor,
overhaul its quality control policies and procedures as well as provide remedial training and examinations for its India
professional staff (including partners) at the hands of PWC-International senior audit staff flown-in from outside India
for that purpose. However, since the objective of a PCAOB censure is to incentivize compliance with minimum
professional standards, the improvement in audit quality that we observe for PWC vis-à-vis NB4 auditors
6 The improvement was economically significant as reflected, for example, in a 5.5 (4.9) percent decrease in the propensity
to just meet earnings benchmark for PWC against OB4 (NB4) auditors; this decrease is material since on average only
13.9 percent of our sample observations just meet benchmark. 7 Note that in coordination with the PCAOB, the Securities and Exchange Commission (SEC 2011a, b) also took enforcement action
against PWC-India for the Satyam failed audit on the same day (April 5, 2011) as the PCAOB censure. Given that both events occurred
the same day, we cannot separate the reputation loss effects of the PCAOB censure from those of the SEC enforcement action.
However, prior research indicates that US Big 4 auditors suffer no reputation loss following SEC enforcement actions (Kedia et al.
(2017).
6
between the 2007-2009 pre-revelation period and the later 2015-2017 post-period is likely due to the
incentivizing effects of reputation loss rather than the PCAOB censure.8
Potentially, our findings could be driven by the demand for higher audit quality from US investors in
the US-listed India companies in our sample. However, client-year observations pertaining to US-listed
companies are less than one percent (about 0.5%) of our sample, and deleting these observations from our
analysis does not alter our findings or inferences for any of our tests. These results suggest that the audit quality
improvement we observe for PWC-India are driven by non-US-listed India clients rather than US-listed clients.
We also form a sub-sample of “constant auditor” clients (i.e., clients that kept the same auditor during both
the pre-period and the post-period in our various analyses), which takes the endogenous choice of auditor in the base
period as a given. Despite the drop in sample size, our results and inferences hold which suggests that our findings
for PWC-India audit quality improvement relative to OB4 and NB4 India auditors are not being driven by
auditor switches. More broadly, unlike the US where the Big 4 dominate, in India the Big 4 hold only a minority share
of the audit market. Still, to control for potential endogeneity in auditor choice, we utilize the inverse Mills ratio
(derived from a Big 4/non-Big 4 auditor choice model) as an additional control variable in all our PWC-India
vs. NB4 difference-in-differences audit quality analyses.9 Our findings and inferences remain unchanged. Note
that our findings pertaining to PWC vs. other-Big 4 (OB4) auditors are unaffected by potential endogeneity in
Big 4/non-Big 4 auditor choice.
Our study makes an important contribution to the literature. First, we examine whether a standard theory
in the auditing literature (the reputation rationale for Big 4 audit quality) applies outside the traditional Anglo-American
or developed economy environment. The reputation argument for audit quality may be framed as a pair of
8 Not all failed audits are followed by PCAOB censures and not all PCAOB censures are triggered by failed audits. In general, it is not
clear what triggers a PCAOB censure (Boone et al. 2019). To date, the PCAOB has censured Big 4 auditors in the US as well as
several countries abroad. With respect to PCAOB censures of US Big 4 firms, prior research suggests that the first-ever censure of a
US Big 4 firm (Deloitte in 2007) triggered reputation loss for the auditor but no increase in audit quality for the censured US Big 4
auditor (Boone et al 2015). However, subsequent PCAOB censures of US Big 4 firms appear to have triggered neither reputation loss
nor an improvement in audit quality for the censured US Big 4 auditor (Boone et al 2019). With respect to PCAOB censures of non-
US Big 4 firms, to date the PCAOB has censured Big 4 auditors in several countries abroad. However, to our knowledge no prior
study has examined the reputation effects of any of these PCAOB censures of non-US Big 4 firms abroad. 9For reasons discussed later in the paper, we utilize the inverse Mills ratio (IMR) rather than propensity score matching (PSM) to
control for possible endogeneity in the choice of Big 4/non-Big 4 auditor.
7
questions: (a) Does a failed audit damage the Big 4 auditor’s reputation? and (b) does reputation loss incentivize the Big
4 auditor to increase audit quality? In prior research, although Skinner and Srinivasan (2012) document PWC’s attempts
at rehabilitating its brand in Japan following a failed audit (e.g., frequent visits by the head of PWC-International to meet
with Japan regulators, pursuit of a “two-firm strategy” by forming a new Japan affiliate to audit clients such as Sony and
Toyota as a way of signaling higher audit quality for international clients), they do not examine whether the failed audit
was followed by an improvement in PWC-Japan’s actual audit quality. We document that the 2009 revelation of the
Satyam audit failure was followed by an increase in PWC-India’s actual audit quality.
Second, if Big 4 auditors are concerned about their reputation, they may be expected to provide higher audit
quality than non-Big 4 (NB4) auditors because they have more reputation capital to lose (DeAngelo 1981; DeFond et al.
2016). However, whether Big 4 auditors provide higher audit quality than NB4 auditors – in the US or abroad -- is not
without controversy (Choi and Wong 2007; DeFond et al. 2016; Fan and Wong 2005; Francis and Wang 2008;
Lawrence et al. 2011, 2017). For other-Big 4 (OB4) auditors, we document that their audit quality was similar to that of
the non-Big 4 (NB4) auditors both before and after the 2009 revelation of the Satyam failed audit. By contrast, we find
an improvement in PWC audit quality after the 2009 revelation so that by 2015-2017 its audit quality was overall higher
than that of non-Big 4 (NB4) auditors.
Finally, during the time period of our study (2007-2017), all Big 4 India auditors (PWC as well as the OB4
auditors) were subject to PCAOB regulatory oversight. Still, we find evidence of improvement in audit quality only for
PWC but not for the other-Big 4 (OB4) firms. We also show that the 2009 revelation of the failed Satyam audit inflicted
reputation loss on PWC and that there was no “spillover” reputation loss for the other-Big 4 (OB4) firms. These findings
suggest that the improvement in audit quality we observe for PWC is driven by reputation loss rather than PCAOB
oversight. Collectively, our findings suggest that PWC was protective of its reputation after the Satyam failed audit and
improved its audit quality over that of non-Big 4 (NB4) auditors to provide a differentiated (rather than commodity) audit
service.
In the next section, we provide background information and develop our hypotheses. Sections 3 and 4
provide a discussion of our sample, research design, and empirical findings. Section 5 provides concluding
comments.
8
2. Background and Hypothesis Development
2.1 Background
On January 9, 2009, the founder and Chairman of Satyam, a NYSE-listed India outsourcing company, wrote
to the company’s Board confessing to a USD 1.2 billion fraud (the largest in India corporate history) carried out over the
preceding six years and orchestrated by the company’s senior officers involving false invoices, manufactured (fictitious)
accounts receivables and bank statement confirmations, and overstated cash and bank balances. The false information
enabled the company to report inflated revenues and assets, and appear to be much more profitable and cash-rich than it
really was. As Satyam’s auditor since 2000, PWC-India had in each of the prior years issued an unqualified (clean) audit
opinion on the company’s financial statements stating that the audits (since 2004) had been conducted in accordance with
PCAOB auditing standards. Following the revelation of the Satyam fraud, the India government took control of Satyam
and following a bidding process merged it with another company (Tech Mahindra). More broadly, the failed audit
appears to have been a watershed event culminating in an overhaul in 2013 of the Companies Act which governs India
audit practices and government oversight of business (Crabtree 2012; Swanson 2013).
As an auditor of a US-listed India company, PWC-India was registered with the PCAOB which gave the Board
the authority to require cooperation from the auditor in its investigation of the Satyam fraud.10 The PCAOB investigation
revealed that the Satyam fraud was facilitated by the fact that PWC-India audit engagement teams had ceded much of
the accounts receivable and bank confirmation process to the client’s management because they believed them to be
honest, a clear and unambiguous violation of PCAOB rules and quality control standards that require the auditor to
maintain control of the confirmation process and exercise due professional skepticism in planning and executing the
audit. In follow-up disciplinary action (censure), on April 5, 2011 the PCAOB imposed a monetary penalty on PWC-
India and required the firm to appoint an independent third-party monitor as well as implement sweeping changes to its
India firm-level quality control policies and procedures. In addition, the PCAOB required PWC-India professional staff
(including partners) to undergo live periodic specialized technical training (pertinent to audits of US-listed companies) to
10 Unlike China, India permits the PCAOB to inspect and investigate its audit firms with US-listed clients. However, unlike China
(and several other countries), India does not have an independent audit regulator (such as the PCAOB) to conduct audit firm inspections
(IFIAR 2018).
9
be taught by senior audit professionals seconded from PWC-International network firms outside India followed by
examinations on the topics covered (PCAOB 2011a,b).
2.2 The Satyam failed audit and PWC reputation loss
The role of the independent audit is to add credibility to client-prepared financial statements by providing
reasonable (but not absolute) assurance that the financial statements are free of material misstatements. However, the
level of assurance provided by the auditor (or its complement, the risk of a material misstatement) is not observable to a
user of the financial statements. Consequently, prior research suggests that users of financial statements rely on the size
and brand name of the auditor (such as the Big 4) as an observable proxy for the quality of the audit (DeAngelo 1981;
DeFond and Zhang 2014; DeFond et al. 2016; Simunic and Stein 1987).
Prior research also suggests that audit quality is a function of auditor competence and auditor independence.
Big 4 auditors are viewed as providing a higher quality audit for two reasons: (1) their larger resources allows them to
invest heavily in brand name competencies, i.e., sophisticated audit technologies and specialized employee training
(human capital), and (2) their size and large clientele contributes to their independence, i.e., gives them the ability to
pushback against a client’s demands for earnings management or walk-away from the client if necessary. In turn, the
brand name competencies and independence represent reputation capital (brand equity) which allow the Big 4 firm to
differentiate its audit services (by providing an audit that exceeds minimum professional standards) to gain market share
and earn higher fees. By the same token, failure to live up to the implied brand name audit quality – as revealed by a
failed audit – can result in reputation damage and economic loss in the form of a decrease in the demand for the firm’s
services.
The reputation argument for Big 4 audit quality suggests that it is this threat of reputation damage and economic
loss that deters a deficient audit, and that a failed audit incentivizes the Big 4 auditor to rehabilitate its tainted brand by
improving its service quality (Klein and Leffler 1981; Shapiro 1983). In particular, Karpoff (2012) suggests that
reputation is an intangible asset that permits the firm to increase sales possibly at higher prices. Although the reputation
argument was developed in the context of Anglo-American economies characterized by dispersed stock ownership and
demand for high quality audits and financial reports, Skinner and Srinivasan (2012) and Weber et al. (2008) indicate that
10
a failed audit in two developed economies (Japan and Germany) was followed by loss of market share for the tainted Big
4 auditor.
As noted previously, India companies generally are controlled by founding families that prefer low audit quality
as a means of protecting their private control benefits (Narayanaswamy et al. 2012, 2015). Further, although India laws
and procedures look good in form (appearance), in substance (reality) enforcement is weak so that the country is largely
characterized by shareholder apathy and weak investor protection (Varottil 2013). India is not unique in this regard, and
prior international auditing research provides mixed evidence on whether Big 4 auditors provide a higher quality audit
outside the US (Choi and Wong 2007; Fan and Wong 2005; Francis and Wang 2008). From this perspective, India
companies and investors may view audits as no more than a statutorily required commodity service with little or no
expectation for a Big 4 auditor to provide a higher quality audit. Consistent with this argument, Ye and Simunic (2017)
suggest that in a weak legal environment (such as India) there is little or no incentive for a Big 4 auditor to exceed
minimum professional standards. Consequently, although the Satyam failed audit may have been a high-profile event it
could have been taken in stride by the India audit market with no adverse reputational consequences for PWC-India.
On the other hand (and also as noted previously), other evidence suggests that the Satyam audit failure was a
signature event that changed attitudes among India legislators, financial analysts, and institutional investors towards
corporate governance and ushered in a new era of greater scrutiny for India companies (Crabtree 2012; Narayanaswamy
et al. 2012, 2015; Swanson 2013; Varottil 2013). Because of its salience, the Satyam failed audit could have induced
India companies to shy away from a tainted auditor or push for a lower audit fee resulting in economic loss for PWC-
India. For these reasons, whether the Satyam failed audit resulted in reputation damage for PWC-India remains an
empirical question which we examine for completeness as discussed later in the paper.
2.3 The Satyam failed audit and audit quality
As noted previously, the reputation argument suggests that a failed audit incentivizes the Big 4 auditor to
rehabilitate its brand by improving its actual audit quality. Also as noted previously, in the India milieu of family-
controlled businesses, shareholder apathy, and weak legal enforcement and investor protection, audits may be viewed as
no more than a commodity service mandated by statute. Also, the audit is designed to provide only reasonable assurance
that the financial statements are free of material misstatements, since absolute assurance would be prohibitively costly.
11
Hence, in the wake of the Satyam failed audit PWC-India could have decided to wait out the furor without improving its
audit quality. From this perspective, despite the adverse publicity from the failed audit, the firm may not feel sufficiently
incentivized in the India corporate milieu to improve its audit quality. In other words, despite the reputation argument for
Big 4 audit quality, consistent with Ye and Simunic (2017) the weak legal environment milieu and potential lack of
demand for audit quality in India could result in no discernible or sustained improvement in audit quality for PWC-India.
On the other hand, as noted previously, PWC-India underwent its initial PCAOB inspection in February 2008.
Aobdia (2018) indicates that auditors use PCAOB inspections to assess the minimum bar, i.e., the minimum level of
audit effort on an engagement consistent with professional standards, and adjust audit effort (up or down) towards the
minimum bar as clarified by PCAOB inspectors. Similarly, Dowling et al. (2018) suggest that auditors cope with
inspections by adapting their practices (such as the use of checklists) to minimize the risk of deficiency findings pertaining
to audit input and process rather than to improve audit outcomes. Still, prior research suggests that PCAOB regulatory
oversight improves compliance with minimum professional standards and contributes to an improvement in audit
quality (Lamoreaux 2016).
Separately, the high profile Satyam failed audit -- following not too long after another major failed audit (that
of Kanebo Co. in 2004) at PWC’s Japan affiliate -- appears to have caused deep public embarrassment at the US-led
PWC-International firm (Chen 2009; Lakshman 2009a,b). Although the Big 4 firms market their audit services
worldwide as a consistent global brand (implying that Big 4 affiliates provide a higher quality audit), in reality their audit
services abroad are not of uniform quality and appear to fall short of US-level audit quality (Francis and Wang 2008; Ye
and Simunic 2017). More specific to India (and as discussed previously), the Satyam failed audit appears to have been a
catalyst in triggering a shift in the India corporate governance landscape towards significant reforms aimed at increasing
shareholder activism culminating in the 2013 Companies Act (Crabtree 2012; Narayanaswamy et al. 2012, 2015;
Swanson 2013; Varottil 2013). Given these broad India currents, PWC-International could have decided to proactively
try to improve audit quality at PWC-India rather than merely attempt to ride out the storm and wait for things to get back
to business as usual. For these reasons whether the Satyam failed audit resulted in PWC-India improving its audit quality
remains an open empirical question. A related empirical question is whether the improvement in PWC-India audit quality
12
(if any) was a short-lived response to the immediate crisis (the 2009 Satyam failed audit revelation) or was sustained over
a later 2015-2017 post-period. Our hypothesis, stated in the null form, is as follows:
H1a: Following the January 2009 revelation of the Satyam failed audit, there is no change in PWC-India audit
quality relative to other-Big 4 (OB4) or non-Big 4 (NB4) auditors in India between the 2007-2009 pre-
revelation period and the 2010-2011 post-revelation period.
H1b: Following the January 2009 revelation of the Satyam failed audit, there is no change in PWC’s audit
quality relative to other Big 4 (OB4) or non-Big 4 (NB4) auditors in India between the 2007-2009 pre-
revelation period and a later 2015-2017 post-revelation period.
3. Research Design
3.1 Auditor switch and change in audit fees models
We begin our investigation of whether PWC-India suffered reputation loss following the 2009 Satyam failed
audit revelation by focusing on the change in the likelihood of PWC-India losing or gaining clients and/or the change in
PWC-India audit fees following the revelation. To examine this change relative to other-Big 4 (OB4) and non-Big 4
(NB4) auditors in India, we first analyze switching activity over a five-year period. For the January 2009 revelation, we
include the three years 2007-2009 in the pre-revelation period and the two post-revelation years 2010-2011 in the post-
revelation period (POST1).11 We choose two years’ time for the post-revelation period and end the post-period in March
2011 to avoid an overlap with the April 2011 PCAOB censure of PWC-India.
We use the following regression models (1) and (2) for our auditor switch tests:
SWITCHi,t = δ0 + δ1 PWC_PYi,t + δ2 POST1i,t + δ3 PWC_PYi,t×POST1i,t + Σ βk CONTROLi,t-1 + εi,t .............(1)
SWITCHi,t = δ0 + δ1 PWC_CYi,t + δ2 POST1i,t + δ3 PWC_CYi,t×POST1i,t + Σ βk CONTROLi,t-1 + εi,t ............(2)
where, SWITCH is an indicator variable having a value of 1 if a client changed its auditor between the previous fiscal
year (t-1) and the current fiscal year (t), else 0; PWC_PY (PWC_CY) is an indicator variable having a value of 1 if PWC-
India served as the auditor in the previous (current) fiscal year, else 0; POST1 is a an indicator variable for fiscal years
2010 and 2011; and CONTROL is a vector of control variables comprising of the lagged values of MODOP, GROWTH,
11 As noted previously, India companies overwhelmingly have a March 31 fiscal year-end. Also, we follow India convention and refer
to the year ending March 31, 20XX as FY20XX. Hence, the January 2009 revelation occurred in FY2009; however, given that there
are delays in switching auditors and/or negotiating a new audit fee, this is not a material issue: our results do not change if we include
February and March 2009 in the post-revelation period. In additional analyses, we re-define the pre-revelation period as the two years
2007-2008 (rather than 2007-2009) and our results and inferences remain unchanged.
13
ABSDACC, INVREC, Tenure, ROA, LOSS, LEVERAGE, ΔLEVERAGE, CASH, MISMATCH, SIZE, ΔSIZE, M&A,
AbnormalFee, and industry fixed effects. The control variables capture audit and financial risk factors and are primarily
drawn from Boone et al. (2015) and Landsman et al. (2009). Pl. see Appendix A for variable definitions.
Following Chen and Vashishtha (2017), Fung et al. (2017), and Hanlon and Hoopes (2014), we estimate models
(1) and (2) as linear probability (LP) models.12 A positive (negative) coefficient on PWC_PY×POST1
(PWC_CY×POST1) would indicate that the likelihood of client loss (gain) increased (decreased) for PWC-India vis-à-
vis OB4 or NB4 auditors during the two post-Satyam failed audit revelation years 2010-2011. Alternatively, the
coefficient on PWC_PY×POST1 (PWC_CY×POST1) may be no different from zero if the 2009 revelation of the
Satyam failed audit had no effect on PWC-India’s reputation.
We use the following regression model (3) for our change in audit fees tests:
ΔLnAuditFeei,t = δ0 + δ1 PWC_CYi,t + δ2 POST1i,t + δ3 PWC_CYi,t×POST1i,t + Σ βk CONTROLi,t + εi,t ........(3)
where, ΔLnAuditFee is the year-to-year change in the natural log of inflation-adjusted audit fees (in Indian rupees);
PWC_CY and POST1 are as defined previously; and CONTROL is a vector of control variables for client complexity
(ΔLnSEG, ΔCATA, ΔFOREIGN), client size (ΔSIZE), and client riskiness (ΔMODOP, ΔQUICK, ΔLEVERAGE,
ΔROA, ΔLOSS) following Simunic (1980) and Choi et al. (2004). Following Boone et al. (2015), we include prior-year
abnormal audit fees (AbnormalFee) to control for pricing pressure and industry fixed effects to allow the intercept to vary
by industry groups.
A negative coefficient on PWC_CY×POST1 would indicate that PWC-India experienced a lower growth in
audit fees relative to OB4 and NB4 auditors during the two post-Satyam failed audit revelation years 2010-2011.
Alternatively, the coefficient on PWC_CY×POST1 may be no different from zero or even positive if the 2009 revelation
of the Satyam failed audit did not lead the firm to lower its fees to retain clients (following reputation damage) or allowed
12 We utilize a LP model instead of a nonlinear limited dependent variable (LDV) model for several reasons: (1) estimations using the
LDV model can suffer from potential bias when group sizes are small, (2) the LDV model with fixed effects can produce biased
coefficients due to the incidental parameters problem (Greene 2004, Lancaster 2000), and (3) the LP model allows for easy
interpretation of coefficients (Angrist and Pischke 2009, Hanlon and Hoopes 2014). Further, the LP model agrees closely with the logit
model when the LP model’s implied probabilities do not attain extreme values (Fox 2008, p. 343), as is the case in our study. While
the predicted probabilities from a LP model falling outside the unit interval [0, 1] can be a problem, it is not common in our study since
the predicted value of probabilities fall within [-0.118, 0.683]. Also, we use heteroskedasticity-robust standard errors in the estimation
of the LP models to control for heteroskedasticity as suggested by Hanlon and Hoopes (2014).
14
the firm to raise fees to pass along the costs of higher audit quality to its audit clients.
3.2 Audit quality models
Our Hypotheses 1a and 1b examine the change in PWC-India audit quality relative to OB4 and NB4 auditors
during 2007-2011 and 2015-2017. Hypothesis H1a examines the change in PWC-India audit quality following the 2009
revelation of the Satyam failed audit. As before, for the January 2009 revelation, we include the three years 2007-2009
in the pre-revelation period and the two years 2010-2011 in the post-revelation period (POST1). By contrast, Hypothesis
H1b examines whether the PWC-India audit quality improvement (if any) was just a short-lived response to the crisis
(Satyam failed audit) facing the firm or a more sustained response. For this particular analysis, we treat the three pre-
revelation years 2007-2009 as the pre-period and the three later years 2015-2017 as the post-period (POST2).
We use the following regression models (4) through (7) for the PWC-India audit quality change tests. The four
models test a different proxy for audit quality and, following prior studies, include a different set of control variables:
AccQi,t = δ0 + δ1 PWC_CYi,t + δ2 POSTi,t + δ3 PWC_CYi,t×POSTi,t + Σ βk CONTROLi,t + εi,t ..................... (4)
ABSDACCi,t = δ0 + δ1 PWC_CYi,t + δ2 POSTi,t + δ3 PWC_CY×POSTi,t + Σ βk CONTROLi,t + εi,t ............. (5)
MEETi,t= δ0 + δ1 PWC_CYi,t + δ2 POSTi,t + δ3 PWC_CYi,t×POSTi,t + Σ βk CONTROLi,t + εi,t .................... (6)
MODOPi,t = δ0 + δ1 PWC_CYi,t + δ2 POSTi,t + δ3 PWC_CYi,t×POSTi,t + Σ βk CONTROLi,t + εi,t .............. (7)
where, the dependent variable AccQ is accruals quality; ABSDACC is absolute discretionary accruals; MEET is an
indicator variable for just meeting earnings benchmarks; and MODOP is an indicator variable for a modified audit
opinion. Also, CONTROL is a vector of control variables specific to each model. In models (4) and (5), following prior
studies (Boone et al. 2015; Choi et al. 2010; Francis and Yu 2009) we control for various auditor attributes (SHORT,
LnAuditFee, LnNonAuditFee, EFFORT), client characteristics (SIZE, LnSEG, LOSS, GROWTH, MTB, LEVERAGE,
BANKRUPTCY, SalesVolatility, CFO, CFOVolatility, ACCRUALS_Lag, ISSUE), and industry fixed effects. In model
(6), following Fung et al. (2017) we control for auditor attributes (TENURE, EFFORT), client characteristics (SIZE,
MTB, GROWTH, LOSS_Lag, CFO, AGE, ROA, LEVERAGE), and industry fixed effects. Finally, in model (7),
following Fung et al. (2017) we control for auditor attributes (MODOP_Lag, TENURE), client characteristics (SIZE,
MTB, GROWTH, LOSS_Lag, CFO, AGE, ROA, LEVERAGE, ΔLEVERAGE, FISSUE, INVESTMENTS,
BANKRUPTCY), and industry fixed effects. All variables are defined in Appendix A.
15
In models (4) through (7), variable PWC_CY is as defined previously; POST is either POST1 (fiscal years
2010-2011) or POST2 (2015-2017). Further, the variable PWC_CY×POST captures the incremental change in
audit quality for PWC-India relative to OB4 and NB4 auditors. Note that in models (4) through (6), AccQ,
ABSDACC, and MEET are inverse proxies for audit quality, i.e., the higher the value of AccQ, ABSDACC, and MEET,
the lower the audit quality.13 Hence, in models (4) through (6) a negative coefficient on PWC_CY×POST1 would
indicate that PWC-India raised its audit quality relative to OB4 and NB4 auditors during the two post-revelation years
2010-2011. By the same token, a negative coefficient on PWC_CY×POST2 would indicate that the improvement in
audit quality for PWC-India was sustained over the later post-period 2015-2017.
By contrast, in model (7) a positive coefficient on PWC_CY×POST1 would indicate that PWC-India raised its
audit quality relative to OB4 and NB4 auditors during the post-revelation. By the same token, a positive coefficient on
PWC_CY×POST2 would indicate that the PWC-India audit quality improvement was a more sustained response.
Alternatively, in models (4) through (7), the coefficient on PWC_CY×POST1 may be no different from zero if PWC-
India failed to raise its audit quality (relative to OB4 and NB4 auditors) during the post-revelation. Similarly, the
coefficient on PWC_CY×POST2 may be no different from zero if the PWC-India audit quality improvement (if any)
was just a short-lived response to the crisis (the Satyam failed audit) facing the firm. We estimate model (6) and (7) using
LP models, for reasons discussed previously (fn. 12).
3.3 Sample and data
We obtain our company financial and auditor identity data from the Prowess database which has been
extensively used in prior large sample India studies such as Bertrand et al. (2002), Gopalan et al. (2007), Jaiswall and
Raman (2019), and Khanna and Palepu (2000). However, the audit fee data in Prowess includes not only the fee for the
independent/statutory audit but also other services such as the internal audit. Hence, we obtain our audit fee data from
the ACE Equity database which provides data separately for the independent/statutory audit. We rely on Compustat
Global for data on audit opinions because India-specific databases do not provide this information.
13 Ecker et al. (2013) point out the problem of substantial sample attrition for non-US data when discretionary accrual models are
estimated by industry-year using at least 15 observations in an industry-year. Hence, following Ecker et al. (2013) we obtain
ABSDACC by estimating the discretionary accrual model over a size-based estimation sample. In robustness tests, we find that our
results/inferences hold with ABSDACC obtained from industry-year regressions.
16
[Insert Table 1 about here]
Table 1 reports information on our sample formation. We begin with all client-year observations with complete
panel data for fiscal years 2007-2011 and 2015-2017 in Prowess and ACE Equity databases (excluding observations
with multiple auditors during a fiscal year) to get 17,957 observations for 2,245 companies. Next, we delete 3,280
observations (410 unique companies) for banking and financial service companies and another 204 observations for
client-years having fewer than 12 months in the financial year. As a result, we have 14,473 client-year observations, of
which 9,015 observations pertain to fiscal years 2007-2011 for our analysis of reputation loss following the 2009 Satyam
revelation. Next, we drop observations with missing data needed for the variables used in different models which leaves
us with 5,991 observations (1,424 unique companies) for the auditor switch analysis, 7,130 observations (1,629
companies) for the change in audit fee analysis, 9,556 observations (1,512 companies) for the accruals quality and
abnormal accruals analysis, and 10,571 observations (1,585 companies) for the analysis of the propensity to just meet
earnings benchmarks and the likelihood of the auditor issuing a modified audit opinion.
Table 2 reports descriptive statistics for the variables used in our empirical analysis. While panels A and B relate
to the samples used in auditor switching risk and change in audit fees analyses, respectively, panels C and D pertain to
the samples used in the audit quality analyses.
[Insert Table 2 about here]
In Table 2 panel A, the mean values of the client-year variables indicate an auditor switching rate of 6.4 percent.
PWC-India served as auditor in about 4.9 percent of the firm-years (PWC_CY), whereas an OB4 firm was the auditor in
13.6 percent of the firm years (OB4_CY). Mean auditor tenure is close to 7 years. Clients reported asset growth of 21.9
percent, abnormal accruals of 9.0 percent of total assets, and receivables and inventory amounting to 34.5 percent of total
assets. Average ROA for our sample clients was 5.9 percent. About 11.8 percent of the client-year observations exhibited
a net loss. Clients were moderately leveraged with mean LEVERAGE of 27.3 percent. The mean level of cash is 6.1
percent of total assets. About 17.5 percent of the observations reflected poor auditor-client alignment (MISMATCH). On
average, total assets were INR 1.57 billion (SIZE).14 Only 4.1 percent of the client-year observations had a merger or
14 1.57 billion = 1573 million = exp(7.361). INR 1.57 billion is equivalent to about US $22.7 million using May 6, 2019 exchange rate
of Rs. 69.328 per US dollar (https://in.investing.com/currencies/usd-inr)
17
acquisition. Panel B shows that inflation-adjusted audit fees grew at an average rate of 4.2 percent during 2007-2011.
The mean and median for a majority of the control variables in the change form are close to zero.
Turning to Table 2 panel C, accruals quality (AccQ) has a mean of 0.088, whereas abnormal accruals
(ABSDACC) has a mean of 0.077. In panel D, MEET has a mean of 0.139, which suggests that 13.9 percent of the clients
in our sample just meet earnings benchmarks. MODOP has a mean of 0.527 suggesting that the sample is evenly split
between client-years with a clean audit opinion and those with a qualified, adverse, or no opinion.15
4. Results
4.1 Reputation loss analysis
We begin by investigating by whether the January 2009 revelation of the Satyam failed audit inflicted reputation
loss on PWC-India (as measured by a change in switching risk and/or audit fees) vis-à-vis other-Big 4 (OB4) and non-
Big 4 (NB4) India auditors. We examine whether the likelihood of client loss (gain) and the change in inflation-adjusted
audit fee was higher (lower) for PWC vis-à-vis the other auditors after the 2009 revelation of the Satyam audit failure. In
Table 3, panel A presents results for the client loss analysis, panel B for the client gain analysis, and panel C for the
change in audit fees analysis. For each test, we separately analyze PWC-India vs. OB4 auditors (using a subsample of
PWC and OB4 observations) and PWC vs. NB4 auditors (using a subsample of PWC and NB4 observations).
[Table 3 about here]
Table 3 panel A presents results for model (1) for the client loss analysis following the 2009 revelation of the
Satyam failed audit. For the PWC vs. OB4 analysis, column (1) shows that both PWC_PY (-0.054, p-value < 0.10) and
POST1 (-0.051, p-value < 0.10) have negative and significant coefficients, whereas the interaction term
PWC_PY×POST1 (0.121, p-value < 0.10) has a positive and significant coefficient.16 These results suggest that relative
to OB4 firms, PWC-India had a 5.4 percent lower likelihood of client loss in the pre-revelation period. Also, whereas the
15 In our sample, 47.3 percent of the observations received a clean opinion, 11.5 percent a qualified opinion, 5.6 percent a no opinion,
35.6 percent an unqualified opinion with additional explanatory language, and 0.05 percent an adverse opinion. 16 For this difference-in-differences analysis, we test the parallel path assumption in the pre-period in two ways (results not tabulated
for brevity). First, we test for the univariate differences in SWITCH between PWC and OB4 in the pre-revelation period and find that
the difference in means is not significant (t-statistics -1.32). Second, we replace POST1 with indicator variables Year2008, Year2009,
Year2010, and Year2011 in model (1) and estimate the model. We find that the coefficients for Year2008, Year2009,
PWC_CY×Year2008, and PWC_CY×Year2009 are not significant, consistent with the pre-period parallel trend assumption (t-
statistics range between -1.26 and +0.94).
18
likelihood of client loss for OB4 firms decreased 5.1 percent between the pre-revelation and post-revelation periods, the
likelihood of client loss for PWC increased by 12.1 percent during the same time period. Moreover, this effect appears
to be concentrated in FY 2011 as shown in column (2). For the PWC vs. NB4 analysis, columns (3) and (4) show that
PWC_PY has a negative and significant coefficient (p-value < 0.01), although POST1 and PWC_PY × POST1 are not
significant. These findings suggest that PWC enjoyed a lower likelihood of client loss relative to NB4 firms in the pre-
revelation period. Overall, the evidence in panel A points to a deterioration in PWC-India’s ability to retain clients relative
to OB4 (but not NB4) auditors) in the post-revelation period.
Table 3 panel B reports estimates for model (2) with results for the PWC vs. OB4 analysis in columns (1) and
(2), and for the PWC vs. NB4 analysis in columns (3) and (4). In column (1), PWC_CY × POST1 is not significant which
suggests that PWC’s likelihood of client gain vis-à-vis other-Big 4 (OB4) auditors was unaffected by the Satyam
revelation. By contrast, in column (3) PWC_CY × POST1 is negative and significant (-0.057, p-value < 0.01) which
suggests that PWC’s likelihood of client gain declined relative to that of non-Big 4 (NB4) auditors in the post-Satyam
revelation time-period. Finally, column (4) indicates that that this decline in PWC’s likelihood of client gain was
observable in both FY 2010 and 2011.
Table 3 panel C presents results for model (3) analyzing the change in inflation-adjusted audit fees (following
the Satyam revelation) for continuing clients of PWC vis-à-vis OB4 and NB4 auditors. Since the dependent variable is
the change in log audit fees and the fees are inflation-adjusted, the coefficients may be interpreted as the approximate
percentage change in real audit fees. In Panel C column 1, PWC_CY is not significant which suggests that PWC and
OB4 auditors enjoyed a similar fee growth rate during the 2007-2009 pre-revelation period. The interaction term
PWC_CY×POST1 is negative and significant (-0.083, p-value < 0.01) indicating an 8.3 percent decline in PWC’s
inflation-adjusted audit fees relative to OB4 auditors in the post-revelation period. Further, column (2) results suggest
that this decline occurred in both 2010 and 2011. Similarly, column (3) and (4) results suggest that PWC experienced a
7.0 to 9.1 percent decline in inflation-adjusted audit fees relative to NB4 auditors during the post-revelation years 2010
and 2011. In sum, the results reported in Table 3 suggest that the 2009 Satyam failed audit revelation inflicted reputation
loss on PWC-India as indicated by the firm’s difficulty in retaining existing clients, attracting new clients, and in growing
19
audit fees vis-à-vis both other-Big 4 (OB4) and non-Big 4 (NB4) India auditors during the 2010-2011 post-revelation
time-period.17
Next, we examine whether the January 2009 revelation of the Satyam failed audit inflicted “spillover”
reputational harm on the OB4 India auditors. As noted previously, the Big 4 firms (PWC and the OB4) are perceived to
be members of a global “cozy club” (UK House of Commons 2018). To the extent that these firms are perceived to be
similar, a failed audit by one Big 4 firm could trigger spillover reputation damage for other Big 4 firms. For this analysis,
we modify model (1) by replacing PWC_PY with OB4_PY and PWC_PY×POST1 with OB4_PY×POST1 to obtain
model (1’). We also modify models (2) and (3) by replacing PWC_CY with OB4_CY and PWC_CY×POST1 with
OB4_CY×POST1 to obtain models (2’) and (3’), respectively. Note that the variable of interest is the interaction term
OB4_PY×POST1 in model (1’) and the interaction term OB4_CY×POST1 in models (2’) and (3’). Table 4 reports the
results of this analysis.
[Table 4 about here]
In Table 4 panel A column (1), the interaction variable OB4_PY×POST1 is not significant which suggests that
the OB4 firms’ likelihood of client loss (vis-à-vis the NB4 firms) was unaffected by the 2009 revelation of the Satyam
failed audit. Similarly, in panel B column (1), OB4_CY×POST1 is not significant which suggests that the OB4 likelihood
of client gain vis-à-vis the NB4 was unaffected by the 2009 revelation. In panel C column (1), variable OB4_CY×POST1
is not significant which suggests that growth in OB4 auditors’ inflation-adjusted audit fees vis-à-vis the NB4 was also
unaffected by the Satyam audit failure revelation. Collectively, these findings suggest that the OB4 firms suffered no
spillover reputation loss from the 2009 revelation.
4.2 Audit quality analysis
4.2.1 Test of Hypothesis H1a
Our Hypothesis H1a pertains to whether the 2009 revelation of the Satyam failed audit was followed by an
improvement in audit quality for PWC-India vis-à-vis other-Big 4 (OB4) and non-Big 4 (NB4) India auditors during the
2010-2011 post-revelation time period relative to the 2007-2009 pre-revelation period. Table 5 reports results for the test
17 In April 2011, the PCAOB (2011a, b) censured PWC-India for the Satyam failed audit. In untabulated analysis, we find no additional
reputational loss for PWC from the 2011 censure.
20
of this hypothesis with panels A through D corresponding to each of our four audit quality proxies. Note that in panels A
through C, AccQ, ABSDACC, and MEET are inverse proxies of audit quality, i.e., the higher the metric, the lower the
audit quality. By contrast, in panel D the higher the metric MODOP, the higher the audit quality. Thus, a negative
coefficient on PWC_CY×POST in panels A through C would suggest a decline in the metric, and an increase in audit
quality for PWC-India relative to OB4 and NB4 auditors. By contrast, in panel D where MODOP is the dependent
variable, a positive coefficient on PWC_CY×POST would indicate an increase in the metric and also an increase in PWC
audit quality vis-à-vis OB4 and NB4 auditors.
[Table 5 about here]
In Table 5 column (1), PWC_CY is significant with a positive (negative) sign in panels A through C (panel D)
indicating that PWC audit quality was lower than that of OB4 firms in the 2007-2009 pre-revelation period. Further, in
column (1) of all four panels, the results for variable POST1 suggest either no improvement or a possible worsening in
audit quality for OB4 auditors between the pre-revelation period and the 2010-2011 post-revelation period. By contrast,
the coefficient on PWC_CY×POST1 is significant and negative in panels A, B, and C, and significant and positive in
panel D indicating an improvement in PWC audit quality relative to OB4 auditors between the pre-revelation and 2010-
2011 post-revelation periods.18 In panel A column (1), the dependent variable is accruals quality and the coefficient on
PWC_CY×POST1 is -0.008 (p-value < 0.05). Using the mean value of accruals quality in our sample as a benchmark,
the coefficient represents a 9.1 percent (= -0.008÷0.088) decrease in AccQ. Similarly, in panel B, where the dependent
variable is abnormal accruals, the coefficient on PWC_CY×POST1 (-0.021, p-value < 0.01) represents a 27.3 percent (=
-0.021÷0.077) decrease in abnormal accruals given that the sample average for ABSDACC is 0.077. Further, for the
analysis of MEET in panel C, PWC_CY×POST1 has a coefficient of -0.082 (p-value < 0.01), i.e., the propensity to just
meet earnings benchmarks declined 8.2 percent, which is economically significant given that on average only 13.9
18 For this difference-in-differences analysis also we test the parallel path assumption in the pre-period in two ways following Fung et
al. (2017) (results not tabulated for brevity). First, we test for the univariate differences in audit quality proxies between PWC and OB4
in the pre-revelation period and find that the differences in the mean are not statistically significant (t-statistics range between -0.75 and
+1.23). Second, we replace POST1 with indicator variables (Year2008, Year2009, Year2010, and Year2011) in model (4) – (7) and
then estimate the models. We find that the coefficient for Year2008, Year2009, PWC_CY×Year2008, and PWC_CY×Year2009 are
not statistically significant for the four audit quality proxies, consistent with the pre-period parallel trend assumption (t-statistics range
between -2.05 and +1.23; p-value > 0.10).
21
percent of sample observations just meet earnings benchmarks. Similarly, in the analysis of MODOP in panel D, the
coefficient on PWC_CY×POST1 is 0.186 (p-value < 0.01), suggesting an 18.6 percent increase in the likelihood of a
modified audit opinion which too is economically significant relative to the sample mean of 52.7 percent for MODOP.
Further, results reported in column (2) of Table 5 panels A through D suggest that the improvement in PWC audit quality
relative to OB4 firms occurred in both post-revelation fiscal years 2010 and 2011.
For the results reported in column (3) of panels A through D, the findings are broadly similar. Based on findings
for variable PWC_CY, PWC audit quality appears to be lower than that of NB4 auditors in the 2007-2009 pre-revelation
period (based on three out of four of our audit quality proxies). Based on the findings for variable POST1, there appears
to be no improvement or a possible worsening in audit quality for NB4 auditors between the pre-revelation and 2010-
2011 post-revelation time periods. For the test interaction variable PWC_CY×POST1, the results suggest an
improvement in PWC audit quality vis-à-vis NB4 auditors (based on three out of four audit quality proxies) between the
pre-revelation and 2010-2011 post-revelation time periods. The estimates in column (4) also suggest an improvement in
PWC audit quality vis-à-vis NB4 auditors in both post-revelation fiscal years 2010 and 2011. In sum, the overall evidence
reported in Table 5 points to an economically as well as statistically significant increase in PWC audit quality relative to
both OB4 and NB4 auditors between the 2007-2009 pre-revelation and 2010-2011 post-revelation time periods.
4.2.2 Test of Hypothesis H1b
Hypothesis H1b relates to whether the improvement in PWC-India audit quality (relative to OB4 and NB4
India auditors) since the 2009 revelation of the Satyam failed audit was a short-lived response or one that was sustained
over a later 2015-2017 post-period.
[Table 6 about here]
Table 6 reports results for the difference-in-differences analysis of the change in PWC audit quality (relative to
OB4 or NB4 auditors) between the 2007-2009 pre-revelation period and the later 2015-2017 post-revelation period. In
column (1), the interaction variable PWC_CY×POST2 is significant with a negative sign in panel A (-0.028, p-value <
0.01), panel B (-0.017, p-value < 0.01), and panel C (-0.055, p-value < 0.05), and significant with a positive sign in panel
D (0.141, p-value < 0.01), suggesting an improvement in PWC audit quality (relative to OB4 auditors) across all four of
our audit quality metrics. Based on the estimated coefficients of PWC_CY×POST2, the relative audit quality
22
improvement for PWC represents about 31.8 percent of average AccQ (= |-0.028÷0.088|), 22.1 percent of average
ABSDACC (= |-0.017÷0.077|), 39.6 percent of average MEET (= |-0.055÷0.139|), and 26.8 percent of average MODOP
(=0.141÷0.527). Once again, these findings suggest that the audit quality improvement for PWC was economically
significant. In column (3), the findings are similar when comparing the improvement in audit quality for PWC vis-à-vis
non-Big 4 (NB4) auditors. In sum, these results suggest that the improvement in PWC-India audit quality was not a short-
lived response to the immediate crisis (the revelation of the Satyam failed audit) but was a more durable response that
was sustained over a later 2015-2017 post-period.
We also examine OB4 audit quality relative to that of NB4 in the later 2015-2017 post-period vis-à-vis the
2007-2009 pre-revelation period to assess whether audit quality improved for OB4 auditors vis-à-vis NB4 auditors over
this time period. As before, we modify models (4) through (7) by replacing PWC_CY with OB4_CY and
PWC_CY×POST2 with OB4_CY×POST2 to obtain models (4’) through (7’), respectively. Table 7 reports the results
of our difference-in-differences analysis. Note that our primary variable of interest is the interaction variable
OB4_CY×POST2. In comparing the change in audit quality for OB4 auditors relative to NB4 auditors, in column (1)
OB4_CY×POST2 is not significant in panels A through C and significant with a negative sign in panel D (-0.090, p-
value < 0.01). These findings suggest no change in overall audit quality for OB4 auditors relative to NB4 auditors
between the 2007-2009 pre-revelation and 2015-2015 post-revelation periods.
[Table 7 about here]
4.2.3 Assessment of Changes in Overall Audit Quality
Next, we assess overall audit quality changes (if any) for PWC, OB4 auditors and NB4 auditors between the
2007-2009 pre-revelation period and the later 2015-2017 post-period. Recall that in Tables 6 and 7 panels A through C,
the higher the metric, the lower the audit quality; by contrast, in panel D, the higher the metric, the higher the audit
quality. We assess whether audit quality is higher, similar (not different), or lower based on the sign and significance (or
lack thereof) of each of our four audit quality metrics and present the results in Table 8. As noted by DeFond and Zhang
(2014), there is no single composite measure of audit quality since the construct is multidimensional and all audit quality
proxies have their limitations. Consequently, our assessment of overall audit quality changes is based on our four audit
quality metrics equally weighted.
23
[Table 8 about here]
In Table 8 rows (1) and (2), we compare PWC with other-Big 4 (OB4) auditors: In row (1) for the comparison
in the 2007-2009 pre-revelation period, the assessment is based on the coefficient for PWC_CY in Table 6 column 1
panels A through D. As reported in row (1), PWC audit quality was similar (not different) on one metric (AccQ) and
lower on the three other metrics (ABSDACC, MEET, and MODOP) suggesting that overall PWC audit quality was lower
than that of OB4 auditors in the 2007-2009 pre-revelation period. In row (2) for the comparison in the 2015-2017 post-
period, the assessment is based on the sum of the coefficients of PWC_CY and PWC_CY×POST2 in Table 6 column 1
panels A through D. As reported in row (2), PWC audit quality was higher on one audit quality metric (AccQ) and not
different on the three remaining metrics (ABSDACC, MEET, and MODOP) vis-à-vis OB4 auditors in the 2015-2017
post-period.19 These findings suggest that PWC audit quality improved from being overall lower to being overall higher
than that of OB4 auditors between the 2007-2009 pre-revelation period and the 2015-2017 post-revelation period.
In Table 8 rows (3) and (4), we compare PWC with non-Big 4 (NB4) auditors: In row (3) for the PWC vs. NB4
audit quality comparison in the 2007-2009 pre-revelation period, the assessment is based on the coefficient for PWC_CY
in Table 6 column 3 panels A through D. Row (3) indicates that PWC audit quality is similar to that of NB4 auditors on
one audit quality metric (AccQ) and lower on the remaining three (ABSDACC, MEET, and MODOP). Thus, PWC’s
audit quality was overall lower than that of the NB4 firms in the 2007-2009 pre-revelation period. In row (4), the
assessment for the 2015-2017 post-period is based on the sum of the coefficients of PWC_CY and PWC_CY×POST2 in
Table 6 column 3 panels A through D. Row (4) indicates that PWC audit quality is higher than that of the NB4 on two
audit quality metrics (AccQ and ABSDACC), similar on one metric (MEET), and lower on the remaining one metric
(MODOP) in the 2015-2017 post-period.20 These findings suggest that PWC audit quality improved from being overall
lower to being overall higher than that of NB4 auditors between the 2007-2009 pre-revelation period and the 2015-2017
post-revelation period.
19The sum of the coefficients of PWC_CY and PWC_CY×POST2 is -0.025 (0.003-0.028, p-value < 0.01) in Table 6 panel A column
1, -0.004 (0.013-0.017, p-value > 0.10) in panel B, +0.007 (0.062-0.055, p-value >0.10) in panel C, and -0.050 (-0.191-0.141, p-value
> 0.10) in panel D. 20The sum of the coefficients of PWC_CY and PWC_CY×POST2 is -0.040 (-0.002-0.038, p-value < 0.01) in Table 6 panel A column
3, -0.007 (0.012-0.019, p-value < 0.05) in panel B, 0.013 (0.062-0.049, p-value > 0.10) in panel C, and 0.140 (-0.175-0.035, p-value <
0.01) in panel D.
24
Finally, in Table 8 rows (5) and (6), we compare other-Big 4 (OB4) auditors with non-Big 4 (NB4) auditors:
In row (5) for the OB4 vs. NB4 audit quality comparison in the 2007-2009 pre-revelation period, the assessment is based
on the coefficient for OB4_CY in Table 7 column 1 panels A through D. Row (5) indicates that OB4 audit quality is
similar to that of NB4 auditors on all four of audit quality metrics (AccQ, ABSDACC, MEET, and MODOP). Thus,
OB4’s audit quality was overall similar to that of the NB4 firms in the 2007-2009 pre-revelation period. In row (6), the
assessment for the 2015-2017 post-period is based on the sum of the coefficients of OB4_CY and OB4_CY×POST2 in
Table 7 column 1 panels A through D. Row (6) indicates that OB4 audit quality is similar to that of the NB4 on two
audit quality metrics (AccQ and MEET), higher on one metric (ABSDACC), and lower on the remaining one metric
(MODOP) in the 2015-2017 post-period.21 These findings suggest that OB4 audit quality remained overall similar to
that of NB4 auditors in both the 2007-2009 pre-revelation period and the 2015-2017 post-revelation period.
4.3 Additional Analyses and Sensitivity Tests
4.3.1 Constant auditor sample
In an alternative specification for the audit quality difference-in-differences analyses, we form a sub-
sample of “constant auditor” observations, i.e., we include only observations where the client is with the same auditor
(i.e., either PWC, the same OB4 auditor, or the same NB4 auditor) in both the pre- and post-periods for our various tests.
This constant auditor sample takes the endogenous choice of auditor in the base period as a given. As a result of this
restriction, the sample size drops to between 354 and 675 observations for the analysis of audit quality for PWC vis-à-
vis OB4 auditors, and between 2442 and 3720 observations for the analysis of PWC vis-à-vis NB4 auditors in Table 4,
and between 2154 and 4545 observations for the analysis of OB4 vis-à-vis NB4 auditors in Table 5. Despite this decrease
in sample size, our results and inferences (untabulated for brevity) hold for all our various tests and tables. Collectively
our results for the “constant auditor” sample suggest that our findings for PWC-India improvement in audit
quality vis-à-vis OB4 and NB4 auditors are not being driven by auditor switches.
21 The sum of the coefficients of OB4_CY and OB4_CY×POST2 is -0.005 (0.000-0.005, p-value > 0.10) in Table 7 panel A column
1, -0.007 (-0.004-0.003, p-value < 0.01) in panel B, -0.001 (-0.011+0.010, p-value > 0.10) in panel C, and -0.050 (+0.040-0.090, p-
value < 0.01) in panel D.
25
4.3.2 Endogenous choice of Big 4/non-Big 4 auditor
Unlike the US (where the Big 4 dominate the audit market), in India the Big 4 account for only about a quarter
of the audit market in terms of the number of listed clients and about a third in terms of total audit fees (Subramanian and
Modak 2016). Further, there is little to no evidence that Big 4 auditors provide higher audit quality than non-Big 4 auditors
in India. In fact, as discussed previously (in the context of our difference-in-differences analysis), our evidence suggests
that (1) in the pre-revelation period 2007-2009 audit quality for PWC-India audit was lower than that of both other-Big
4 (OB4) and non-Big 4 (NB4) auditors, and (2) during our study period audit quality for OB4 auditors was similar to that
of NB4 auditors. Still, for completeness, we use the Big 4/non-Big 4 auditor choice model in Eshleman and Guo (2014)
to calculate the inverse Mills ratio (IMR) and include it as an additional control variable in all our PWC-India vs. NB4
and OB4 vs. NB4 difference-in-differences analyses. Our results and inferences remain unchanged. We use the IMR
rather than the propensity score matching approach to control for possible endogeneity in the choice of Big 4/non-Big 4
auditor for the following reasons. Propensity score matching (PSM) implies several research design choices that can lead
the researcher to several different conclusions based on the same data and covariates (Angrist and Pischke 2009). Along
the same lines, Shipman et al. (2017, p. 213) point to the fact that “seemingly innocuous design choices [in propensity
score matching] greatly influence sample composition and estimates of the average treatment effects.” Similarly, King
and Nielsen (2019) suggest that PSM can increase (not decrease) imbalance, model dependence, inefficiency, research
discretion, and statistical bias. Finally, Lawrence et al. (2017) agree with DeFond et al. (2016) that “differences in audit
quality proxies between Big 4 and non-Big 4 auditors largely reflect client characteristics and, more specifically, client
size.” In Appendix B, our Big 4/non-Big 4 choice model (based on Eshleman and Guo 2014) controls for size as well
several additional client characteristics. In any event, note that potential endogeneity in the choice of Big 4/non-Big 4
auditor affects only the results pertaining to PWC vs. non-Big 4 (NB4) auditors, i.e., our findings (discussed previously)
pertaining to PWC vs. other-Big 4 (OB4) auditors are unaffected by this possible endogeneity.
4.3.3 Alternative pre- and post-revelation time periods, and deleting non-March 31 fiscal year-end
observations
An overwhelming majority of India companies have a March 31 fiscal year-end, and we follow India
convention whereby the fiscal year ending March 31, 20XX is referred to as 20XX. Hence, the January 2009 revelation
26
of the Satyam failed audit occurred during 2009. In alternative analyses pertaining to reputation loss, we delete 2009
observations from our sample by redefining the pre-revelation period as the two years 2007-2008, with no change in the
post-revelation POST1 time period (the two years 2010-2011). Similarly, in alternative analyses relating to Hypothesis
H1b, we re-define the later post-period POST2 as the two years 2016-2017. These alternative period definitions allow
for an equal number of (two) years in all the pre- and post-periods in all our analyses. Despite a 19 to 35 percent drop in
the number of observations used in these analyses, our overall results and inferences (not tabulated for brevity) remain
unchanged.
Also, we delete the small percentage of observations (under 5 percent) of our sample with companies with a
non-March 31 fiscal year-end. The results and inferences (untabulated for brevity) from analyzing this alternative sample
are similar to what we report in the various tables in our paper.
4.3.4 Alternative analysis deleting US-listed or other foreign-listed company observations
Potentially, our findings could be driven by the demand for higher audit quality from US investors in
the US-listed India companies in our sample. However, when we delete observations for US-listed companies
(about 0.5 percent of our sample), our findings and inferences remain unchanged. Similarly, when we delete observations
for India companies listed abroad in non-US countries (about 1.1 percent of our sample) or for India-listed subsidiaries
owned by foreign multinationals (about 6.6 percent of our sample), our results and inferences also remain broadly
unchanged. These results (untabulated for brevity) indicate that our findings regarding the improvement in PWC-India
audit quality are driven by domestic India companies.
4.3.5 Chen et al. (2018) and Ecker et al. (2013)
Chen et al. (2018) express concerns about the two-stage approach used in the literature for estimating abnormal
accruals. To address these concerns, we follow Sletten et al. (2018) and expand our models (4) and (5) to include all the
first-stage regressors (including industry*year fixed effects) as independent variables in our second-stage regression. We
find that results and inferences (not tabulated for brevity) from this alternative abnormal accruals estimation process are
similar to what we currently report in Tables 5 through 8.
Separately, Ecker et al. (2013) point out the problem of substantial sample attrition for non-US data when
discretionary accrual models are estimated by industry-year using at least 15 observations in an industry-year. Following
27
Ecker et al. (2013), in our study we estimate the performance-adjusted modified Jones (1991) model over a size-based
estimation sample. In a robustness test (results not tabulated for brevity), we find that our results for model (5) reported
in Tables 5 through 7 panel B hold when we estimate abnormal accruals obtained from industry-year regressions.
4.3.6 Inflation-adjusted vs. nominal audit fees
In model (3), we examine the change in inflation-adjusted audit fees given the relatively high India inflation rate
during our sample period. We repeat the analysis reported in panel C of Tables 3 and 4 using change in nominal (rather
than inflation-adjusted) audit fees and find that our results (not tabulated for brevity) continue to hold. The coefficient of
PWC_CY×POST1 is -0.080 (p-value < 0.01) for both PWC vs. OB4 and PWC vs. NB4. Similarly, the coefficient of
OB4_CY×POST1 is -0.001 and not significant for OB4 vs. NB4.These findings suggest that our audit fees analysis results
are not driven by our inflation-adjustment.
5. Concluding Remarks
If Big 4 firms are concerned about their reputation, they may be expected to improve audit quality after a failed
audit since they have more reputational capital (brand equity) to lose. Coffee (2019) suggests that Big 4 auditors (abroad
as well as in the US) are now less protective of their brand equity and provide a commodity audit service. In prior research,
Skinner and Srinivasan (2012) and Weber et al. (2008) do not examine whether a Big 4 audit failure abroad (specifically
in Japan and Germany) is followed by an increase in actual audit quality. We extend prior sparse research on the
reputation argument for Big 4 audit quality by examining the issue in the context of India, a large emerging economy
also characterized by little or no litigation risk. Specifically, we examine whether the 2009 revelation of the failed audit
of Satyam (a large NYSE-listed client of PWC-India) was followed by an increase in audit quality for the Big 4 auditor.
Our difference-in-differences analyses suggest that PWC-India audit quality was generally lower than that of
other-Big 4 (OB4) and non-Big 4 (NB4) auditors in the pre-revelation period. However, the 2009 revelation of the
Satyam failed audit appears to have incentivized PWC-India to improve its audit quality relative to both other-Big 4
(OB4) and non-Big 4 (NB4) auditors in India. For OB4 auditors, their audit quality was similar to that of the NB4 auditors
both before and after the 2009 revelation. By contrast, the Satyam failed audit appears to have incentivized PWC to
improve its audit quality so that by 2015-2017 its audit quality was overall higher than that of non-Big 4 (NB4) auditors.
28
During the time period of our study (2007-2017), all of the Big 4 firms in India (PWC as well as the OB4
auditors) were subject to PCAOB regulatory oversight. We find evidence of improvement in audit quality for PWC but
not for the other-Big 4 (OB4) firms. Also, we find that PWC suffered reputation loss from the 2009 revelation of the
failed Satyam audit, but find no “spillover” reputation loss from the 2009 revelation for the other-Big 4 (OB4) firms.
These findings suggest that the improvement in audit quality we observe for PWC is driven by reputation loss rather than
PCAOB regulatory oversight. Collectively, our findings suggest that even in a weak investor protection environment,
PWC was protective of its reputation and improved its audit quality (following the failed Satyam audit) to overall exceed
that of NB4 auditors. Our findings are of potential interest to regulators and investors both in the US and abroad.
29
References
Altman, E. 2002. Corporate distress prediction models in a turbulent economic and BASEL II environment.
http://pages.stern.nyu.edu/~ealtman/Corp-Distress.pdf
Angrist, J.D. and J. Pischke. 2009. Mostly Harmless Econometrics: An Empiricist’s Companion. Princeton University
Press, Princeton, NJ.
Aobdia, D., 2018. The impact of the PCAOB individual engagement inspection process–preliminary evidence. The
Accounting Review 93(4): 53-80.
Aobdia, D., 2019. Do practitioner assessments agree with academic proxies for audit quality? Evidence from PCAOB
and Internal Inspections (June 7). Journal of Accounting and Economics (forthcoming).
Bertrand, M., P. Mehta, S. Mullainathan. 2002. Ferreting Out Tunnelling: An Application to Indian Business Groups.
Quarterly Journal of Economics. 117, 121–148.
Boone, J. P., I. K. Khurana, K. K. Raman. 2015. Did the 2007 PCAOB Disciplinary Order against Deloitte Impose
Actual Costs on the Firm or Improve Its Audit Quality? The Accounting Review. 90 (2): 405-441.
Boone, J. P., I. K. Khurana, K. K. Raman. 2019. Audit Market Response to PCAOB Censures of US Big 4 Firms.
European Accounting Review 28(4): 621-658.
Chen, G. 2009. Satyam scandal rattles confidence in accounting Big Four. Reuters. January 8.
Chen, Q. and R. Vashishtha. 2017. The effects of bank mergers on corporate information disclosure. Journal of
Accounting and Economics 60: 56–77
Chen, W., P. Hribar, and S. Melessa. 2018. Incorrect Inferences when using Residuals as Dependent Variables. Journal
of Accounting Research. 56 (3): 751–796.
Choi, J., R. Doogar, and A. Ganguly. 2004. The riskiness of large audit firm client portfolios and changes in audit liability
regimes: Evidence from the U.S. audit market. Contemporary Accounting Research 21 (Winter): 747–785.
Choi, J., C. Kim, J. Kim, and Y. Zang. 2010. Audit office size, audit quality, and audit pricing. Auditing: A Journal of
Practice & Theory 29 (1): 73–97.
Choi, J. H., and T. J. Wong. 2007. Auditors’ governance functions and legal environments: An international
investigation. Contemporary Accounting Research 24, 13-46.
Coffee, J. 2019. Why do auditors fail? What might work? What won’t. European Corporate Governance Institute
(ECGI) Working Paper. ssrn.com.
Crabtree, J. 2012 Analysts toughen stance on corporate India. Financial Times (August 13)
https://www.ft.com/content/f998c784-e431-11e1-ae92-00144feab49a
DeAngelo, L.E. 1981. Auditor Size and Audit Quality. Journal of Accounting and Economics. 3: 183-199
Dechow, P., and I. Dichev. 2002. The quality of accruals and earnings: the role of accrual estimation errors. The
Accounting Review 77 (Supplement), S35–S59.
DeFond M., D. H. Erkens, and J. Zhang. 2016. Do Client Characteristics Really Drive the Big N Audit Quality Effect?
New Evidence from Propensity Score Matching. Management Science. 63 (11): 3628–3649.
DeFond M. and J. Zhang. 2014. A review of archival auditing research. Journal of Accounting and Economics 58 (2–
3): 275-326
Dowling C., W. R. Knechel and R. Moroney. 2018. Public oversight of audit firms: The slippery-slope
of enforcing regulation. Abacus 54(3): 353-380.
Ecker, F., J. Francis, P. Olsson, and K. Schipper. 2013. Estimation sample selection for discretionary accruals. Journal
of Accounting and Economics 56: 190–211.
Eshleman, J. D. and P. Guo. 2014. Do Big 4 auditors provide higher audit quality after controlling for the endogenous
choice of auditor. Auditing: A Journal of Practice & Theory 33 (4): 197–219.
Fan, J. P.H., and T. J. Wong. 2005. Do External Auditors Perform a Corporate Governance Role in Emerging Markets?
Evidence from East Asia. Journal of Accounting Research 43 (1): 35–72.
Fox, J. 2008. Applied Regression Analysis and Generalized Linear Models. Second Edition. Sage Publication, Thousand
Oaks, CA.
Francis, J. R., and D. Wang. 2008. The joint effect of investor protection and Big 4 audits on earnings quality around the
world. Contemporary Accounting Research 25, 157-191.
30
Francis, J. R., R. LaFond, P. Olsson, and K. Schipper. 2005. The market pricing of accruals quality. Journal of
Accounting and Economics 39 (2): 295–327.
Francis, J. R., and M. Yu. 2009. Big 4 office size and audit quality. The Accounting Review 84 (5): 1521–1553.
Fung, S.Y.K., K. K. Raman, X. Zhu. 2017. Does the PCAOB international inspection program improve audit quality for
non-US-listed foreign clients? Journal of Accounting and Economics. 64 (1): 15-36.
Gopalan, R., V. Nanda, and A. Seru. 2007. Affiliated firms and financial support: Evidence from Indian business groups.
Journal of Financial Economics 86 (3): 759–795.
Greene, W. 2004. The behavior of the maximum likelihood estimator of limited dependent variable models in the
presence of fixed effects. The Econometrics Journal 7: 98–119.
Hanlon, M., and J. L. Hoopes, 2014. What do firms do when dividend tax rates change? An examination of alternative
payout responses. Journal of Financial Economics. 114 (1): 105–124.
Hosmer D, and S. Lemeshow (2000) Applied Logistic Regression, Wiley Series in Probability and Statistics, 2nd ed.
(John Wiley & Sons, New York).
International Forum of Independent Audit Regulators (IFIAR). 2018. Survey of Inspection Findings.
https://www.ifiar.org/.
Jaiswall, S. S. and K. K. Raman. 2019. Sales Growth, CEO Pay, and Corporate Governance in India. Journal of
Accounting, Auditing, and Finance (in press).
Jones, J. 1991. Earnings management during import relief investigations. Journal of Accounting Research. 29 (2):
193−228.
Karpoff, J., 2012. Does reputation work to discipline corporate misconduct? In: Barnett, M., and T. Pollock. The Oxford
Handbook of Corporate Reputation Oxford, UK: Oxford University Press.
Kedia, S., U. Khan, and S. Rajgopal. 2017. The SEC’s enforcement record against auditors. Ssrn.com
Khanna, T., and K.G. Palepu. 2000. Is Group Affiliation Profitable in Emerging Markets? An Analysis of Diversified
Indian Business Groups. Journal of Finance. 55, 867–891.
King , G. and R. Nielsen. 2019. Why propensity scores should not be used for matching. Political Analysis, 1-20.
doi:10.1017/pan.2019.11
Kothari, S. P., A. J. Leone, and C. E. Wasley. 2005. Performance matched discretionary accrual measures. Journal of
Accounting and Economics 39 (1): 163–197.
Klein, B., and K. Leffler. 1981. The role of market forces in assuring contractual performance. Journal of Political
Economy. 89: 615-641
Krishnan, J., J. Krishnan, H. Song, 2017. PCAOB international inspections and audit quality. The Accounting Review
92(5): 143-166.
Lakshman, N. 2009a. PWC India struggles to overcome Satyam scandal. Business Week. March 30, 2009.
Lakshman, N. 2009b. Satyam Computer Fraud Grows to $2.5 Billion. Time. November 27, 2009.
Lamoreaux, P. 2016. Does PCAOB inspection access improve audit quality? An examination of foreign firms listed in
the United States. Journal of Accounting and Economics 61(2/3): 313-337.
Lancaster, T. 2000. The incidental parameter problem since 1948. The Journal of Econometrics 95 (2): 391–413.
Landsman, W., K. Nelson, and B. Rountree. 2009. Auditor switches in the pre- and post-Enron eras: Risk or realignment?
The Accounting Review 84 (2): 531–558.
Lawrence, A., M. Minutti-Meza, and P. Zhang. 2017. The importance of client size in the estimation of the Big 4 effect:
A comment on DeFond, Erkens, and Zhang. Management Science 63(11): 3650-3653.
Lawrence, A., M. Minutti-Meza, and P. Zhang. 2011. Can Big 4 versus Non-Big 4 differences in audit-quality proxies
be attributed to client characteristics? The Accounting Review 86(1): 259-286.
Narayanaswamy, R., K. Raghunandan, and D. V. Rama. 2012. Corporate Governance in the Indian Context. Accounting
Horizons 26 (3): 583–599.
Narayanaswamy, R., K. Raghunandan, and D. V. Rama. 2015. Satyam Failure and Changes in Indian Audit
Committees. Journal of Accounting, Auditing, and Finance. 30 (4): 529–540.
Public Company Accounting Oversight Board (PCAOB). 2004. Report on 2003 Limited Inspection of PWC (August
26).)
31
Public Company Accounting Oversight Board (PCAOB). 2011a. PCAOB Announces Settled Disciplinary Order
Against PricewaterhouseCoopers International Firms in India for Audit Violations Related to Satyam. April 5.
https://pcaobus.org/News/Releases/Pages/04052011_DisciplinaryOrders.aspx
Public Company Accounting Oversight Board (PCAOB). 2011b. Order Instituting Disciplinary
Proceedings, Making Findings, and Imposing Sanctions. Release No. 105-2011-002. April 5. Available at:
http://pcaobus.org/Enforcement/Decisions/Documents/PW_India.pdf
Securities and Exchange Commission (SEC). 2011a. SEC Charges India-Based Affiliates of PWC for Role in Satyam
Accounting Fraud. SEC Press Release 2011-82. Downloaded from https://www.sec.gov/news/press/2011/2011-
82.htm
Securities and Exchange Commission (SEC). 2011b. Accounting and Auditing Enforcement. Release No.
3257. April 5. Available at: http://www.sec.gov/litigation/admin/2011/34-64184.pdf
Shapiro, C. 1983. Premiums for high quality products as returns to reputation. Quarterly Journal of Economics. 98: 659-
679.
Shipman, J., Q. Swanquist, and R. Whited. 2017. Propensity score matching in accounting research. The Accounting
Review, 92(1), 213-244.
Shu, S. 2000. Auditor resignations: Clientele effects and legal liability. Journal of Accounting and Economics. 29: 173-
205.
Simunic, D. A. 1980. The Pricing of Audit Services: Theory and Evidence. Journal of Accounting Research. 18 (1):
161–190.
Simunic, D., and M. Stein. 1987. Product differentiation in auditing: Auditor choice in the market for unseasoned new
issues. Canadian Certified General.
Skinner, D., and S. Srinivasan. 2012. Audit quality and auditor reputation: Evidence from Japan. The Accounting Review
87 (5), 1737-1765.
Sletten E., Y. Ertimur, J. Sunder, and J. Weber. 2018. When and why do IPO firms manage earnings? Review of
Accounting Studies. 23 (3): 872 – 906
Srinivasan, S., A. Wahid, and G. Yu. 2015. Admitting mistakes: Home country effect on the reliability of restatement
reporting. The Accounting Review. 90 (3): 1201–1240.
Subramanian, N.S. and S. Modak. 2016. Big Four earn bulk of audit fee from NSE firms. Business Standard. January
22, 2016.
Swanson, J. 2013. India seeks to overhaul a corporate world rife with fraud. The New York Times (August 15).
https://dealbook.nytimes.com/2013/08/15/india-seeks-to-overhaul-a-corporate-world-rife-with-fraud/
UK House of Common Report on Carillion. 2018. https://publications.parliament.uk/pa/cm201719/cmselect/cmworpen/769/769.pdf
Varottil, U., 2013. The Advent of Shareholder Activism in India. Journal on Governance. 1 (6): 582-628.
Weber, J., M. Willenborg, and J. Zhang. 2008. Does auditor reputation matter? The case of KPMG Germany and
ComROAD AG. Journal of Accounting Research 46 (4), 941–972.
Ye, M., and D. Simunic. 2017. The impact of PCAOB type regulations on auditors under different legal systems.
Ssrn.com.
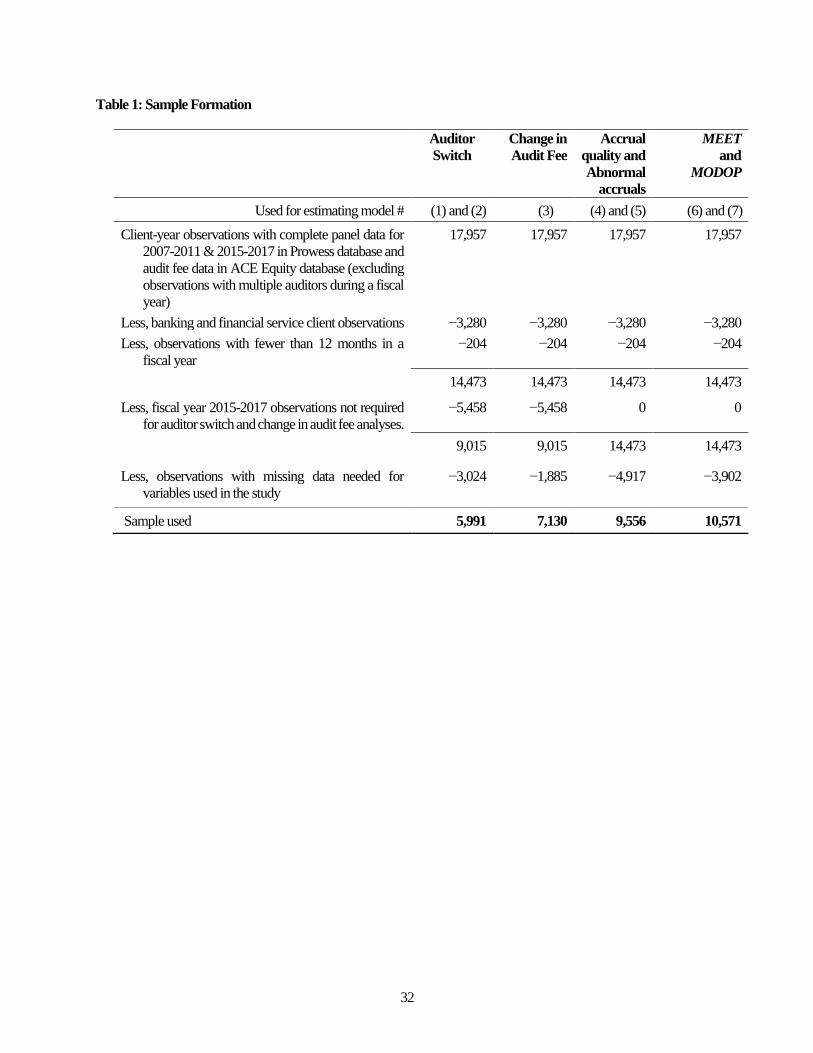
32
Table 1: Sample Formation
Auditor
Switch
Change in
Audit Fee
Accrual
quality and
Abnormal
accruals
MEET
and
MODOP
Used for estimating model # (1) and (2) (3) (4) and (5) (6) and (7)
Client-year observations with complete panel data for
2007-2011 & 2015-2017 in Prowess database and
audit fee data in ACE Equity database (excluding
observations with multiple auditors during a fiscal
year)
17,957 17,957 17,957 17,957
Less, banking and financial service client observations −3,280 −3,280 −3,280 −3,280
Less, observations with fewer than 12 months in a
fiscal year
−204 −204 −204 −204
14,473 14,473 14,473 14,473
Less, fiscal year 2015-2017 observations not required
for auditor switch and change in audit fee analyses.
−5,458 −5,458 0 0
9,015 9,015 14,473 14,473
Less, observations with missing data needed for
variables used in the study
−3,024 −1,885 −4,917 −3,902
Sample used 5,991 7,130 9,556 10,571
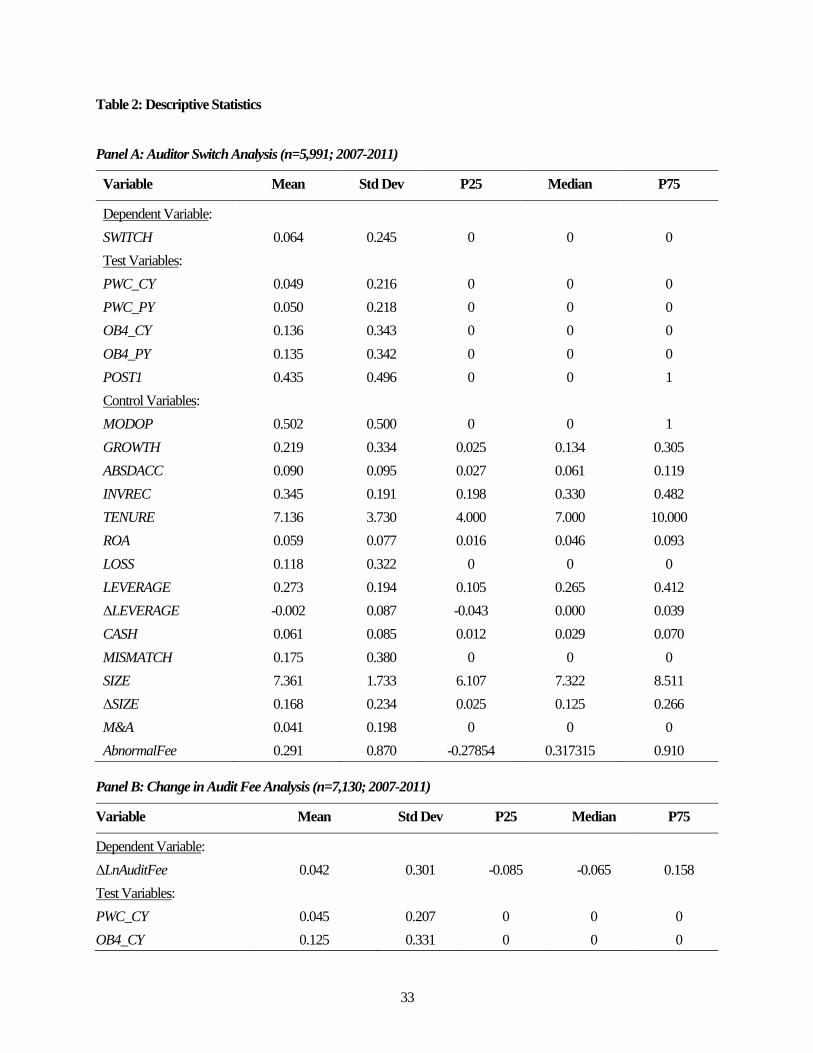
33
Table 2: Descriptive Statistics
Panel A: Auditor Switch Analysis (n=5,991; 2007-2011)
Variable Mean Std Dev P25 Median P75
Dependent Variable:
SWITCH 0.064 0.245 0 0 0
Test Variables:
PWC_CY 0.049 0.216 0 0 0
PWC_PY 0.050 0.218 0 0 0
OB4_CY 0.136 0.343 0 0 0
OB4_PY 0.135 0.342 0 0 0
POST1 0.435 0.496 0 0 1
Control Variables:
MODOP 0.502 0.500 0 0 1
GROWTH 0.219 0.334 0.025 0.134 0.305
ABSDACC 0.090 0.095 0.027 0.061 0.119
INVREC 0.345 0.191 0.198 0.330 0.482
TENURE 7.136 3.730 4.000 7.000 10.000
ROA 0.059 0.077 0.016 0.046 0.093
LOSS 0.118 0.322 0 0 0
LEVERAGE 0.273 0.194 0.105 0.265 0.412
ΔLEVERAGE -0.002 0.087 -0.043 0.000 0.039
CASH 0.061 0.085 0.012 0.029 0.070
MISMATCH 0.175 0.380 0 0 0
SIZE 7.361 1.733 6.107 7.322 8.511
ΔSIZE 0.168 0.234 0.025 0.125 0.266
M&A 0.041 0.198 0 0 0
AbnormalFee 0.291 0.870 -0.27854 0.317315 0.910
Panel B: Change in Audit Fee Analysis (n=7,130; 2007-2011)
Variable Mean Std Dev P25 Median P75
Dependent Variable:
ΔLnAuditFee 0.042 0.301 -0.085 -0.065 0.158
Test Variables:
PWC_CY 0.045 0.207 0 0 0
OB4_CY 0.125 0.331 0 0 0
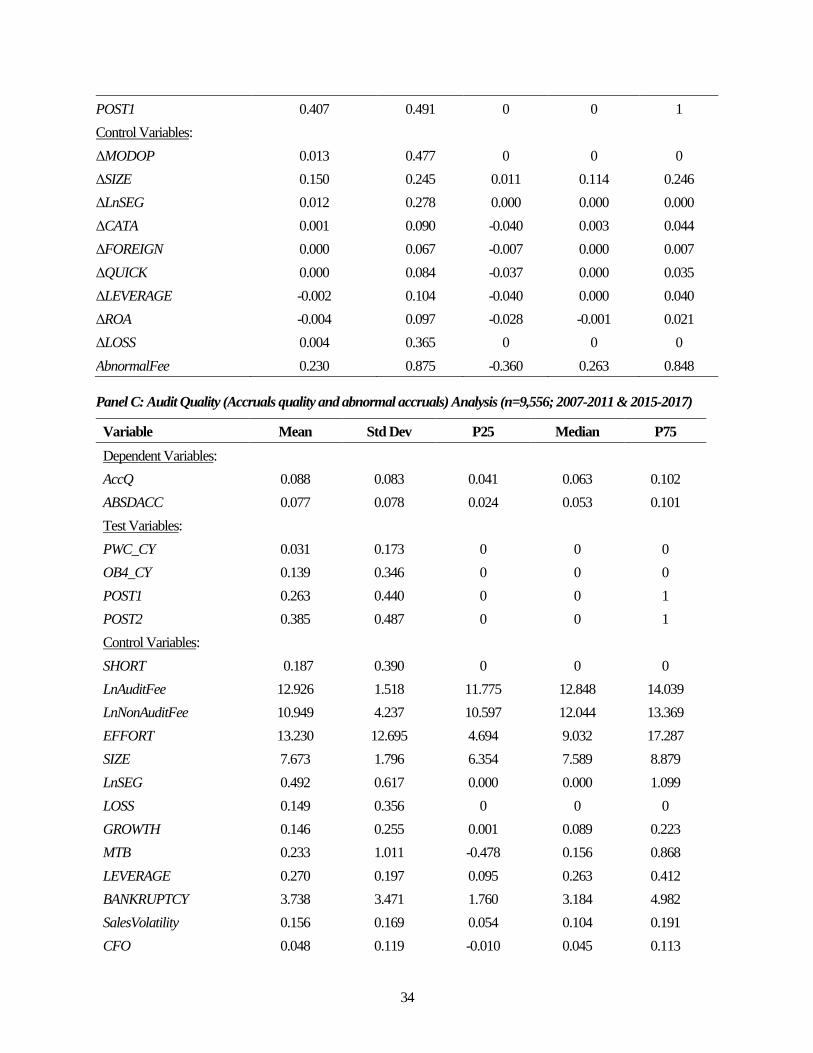
34
POST1 0.407 0.491 0 0 1
Control Variables:
ΔMODOP 0.013 0.477 0 0 0
ΔSIZE 0.150 0.245 0.011 0.114 0.246
ΔLnSEG 0.012 0.278 0.000 0.000 0.000
ΔCATA 0.001 0.090 -0.040 0.003 0.044
ΔFOREIGN 0.000 0.067 -0.007 0.000 0.007
ΔQUICK 0.000 0.084 -0.037 0.000 0.035
ΔLEVERAGE -0.002 0.104 -0.040 0.000 0.040
ΔROA -0.004 0.097 -0.028 -0.001 0.021
ΔLOSS 0.004 0.365 0 0 0
AbnormalFee 0.230 0.875 -0.360 0.263 0.848
Panel C: Audit Quality (Accruals quality and abnormal accruals) Analysis (n=9,556; 2007-2011 & 2015-2017)
Variable Mean Std Dev P25 Median P75
Dependent Variables:
AccQ 0.088 0.083 0.041 0.063 0.102
ABSDACC 0.077 0.078 0.024 0.053 0.101
Test Variables:
PWC_CY 0.031 0.173 0 0 0
OB4_CY 0.139 0.346 0 0 0
POST1 0.263 0.440 0 0 1
POST2 0.385 0.487 0 0 1
Control Variables:
SHORT 0.187 0.390 0 0 0
LnAuditFee 12.926 1.518 11.775 12.848 14.039
LnNonAuditFee 10.949 4.237 10.597 12.044 13.369
EFFORT 13.230 12.695 4.694 9.032 17.287
SIZE 7.673 1.796 6.354 7.589 8.879
LnSEG 0.492 0.617 0.000 0.000 1.099
LOSS 0.149 0.356 0 0 0
GROWTH 0.146 0.255 0.001 0.089 0.223
MTB 0.233 1.011 -0.478 0.156 0.868
LEVERAGE 0.270 0.197 0.095 0.263 0.412
BANKRUPTCY 3.738 3.471 1.760 3.184 4.982
SalesVolatility 0.156 0.169 0.054 0.104 0.191
CFO 0.048 0.119 -0.010 0.045 0.113
35
Variable Mean Std Dev P25 Median P75
CFOVolatility 0.083 0.085 0.032 0.057 0.103
ACCRUALS_Lag 0.011 0.125 -0.053 -0.005 0.052
ISSUE 0.351 0.477 0 0 1
Panel D: Audit quality (MEET and MODOP) Analysis (n=10,571; 2007-2011 & 2015-2017)
Variable Mean Std Dev P25 Median P75
Dependent Variables:
MEET 0.139 0.346 0 0 0
MODOP 0.527 0.499 0 1 1
Test Variables:
PWC_CY 0.032 0.175 0 0 0
OB4_CY 0.144 0.351 0 0 0
POST1 0.251 0.434 0 0 1
POST2 0.386 0.487 0 0 1
Control Variables:
MODOP_Lag 0.500 0.500 0 0 1
TENURE 8.746 5.323 4 9 12
EFFORT 13.322 13.197 4.488 8.775 17.378
SIZE 7.594 1.881 6.274 7.518 8.849
MTB 0.260 1.038 -0.474 0.186 0.927
GROWTH 0.154 0.296 -0.003 0.086 0.223
LOSS_Lag 0.154 0.361 0 0 0
CFO 0.045 0.134 -0.013 0.044 0.114
AGE 18.471 8.596 13 19 24
ROA 0.048 0.078 0.009 0.038 0.084
LEVERAGE 0.256 0.199 0.071 0.243 0.403
ΔLEVERAGE -0.003 0.081 -0.036 0.000 0.030
FISSUE 0.408 0.492 0 0 1
INVESTMENTS 0.070 0.103 0.011 0.029 0.081
BANKRUPTCY 4.737 8.103 1.807 3.294 5.273
Pl. see Appendix A for variable definitions. The prefix Δ represents the year-to-year change in the variable.
36
Table 3: Reputation loss differences-in-differences analysis for PWC-India vs. other-Big 4 (OB4) and non-Big 4
(NB4) firms following January 2009 revelation of Satyam failed audit [Pre-period is pre-revelation period 2007-
2009, POST1 is post-revelation period 2010-2011]
Panel A: Client Loss Analysis
SWITCHi,t = δ0 + δ1 PWC_PYi,t + δ2 POST1i,t + δ3 PWC_PYi,t×POST1i,t + Σ βk CONTROLi,t-1 + εi,t .............................................. (1)
DV = SWITCH PWC vs. Other-
Big4
PWC vs. Other-
Big4
PWC vs.
Non-Big4
PWC vs.
Non-Big4
(1) (2) (3) (4)
Test Variables:
PWC_PY -0.054* -0.054* -0.287*** -0.287***
[-2.15] [-2.14] [-6.86] [-6.87]
POST1 -0.051* 0.000 [-2.27] [0.03] PWC_PY×POST1 0.121* 0.062
[2.44] [1.04] Year2010 -0.067** -0.007
[-2.85] [-0.68]
Year2011 -0.034 0.007
[-1.25] [0.58]
PWC_PY×Year2010 0.147 0.054
[2.08] [0.98]
PWC_PY×Year2011 0.096** 0.070
[3.10] [0.96]
Control Variables:
MODOP 0.006 0.007 0.009 0.009
[0.86] [0.98] [1.28] [1.33]
GROWTH 0.160 0.162 0.047 0.047
[1.38] [1.42] [0.79] [0.80]
ABSDACC 0.303** 0.304** 0.047 0.048
[3.78] [3.89] [1.08] [1.10]
INVREC -0.001 0.002 0.017 0.017
[-0.01] [0.04] [0.76] [0.76]
TENURE 0.005 0.005 -0.005*** -0.006***
[1.93] [1.93] [-5.26] [-5.31]
ROA -0.264* -0.257* -0.123** -0.124**
[-2.38] [-2.40] [-1.98] [-1.99]
LOSS -0.036 -0.033 0.023* 0.024*
[-1.19] [-1.06] [1.65] [1.71]
LEVERAGE 0.112* 0.112* -0.049** -0.049**
[2.19] [2.20] [-2.11] [-2.10]
ΔLEVERAGE -0.091 -0.082 0.021 0.025
[-1.26] [-1.12] [0.51] [0.60]
CASH -0.068 -0.070 0.062 0.062
37
DV = SWITCH PWC vs. Other-
Big4
PWC vs. Other-
Big4
PWC vs.
Non-Big4
PWC vs.
Non-Big4
[-1.25] [-1.25] [1.22] [1.22]
MISMATCH -0.320*** -0.319*** 0.278*** 0.278***
[-6.39] [-6.38] [5.42] [5.43]
SIZE -0.062*** -0.062*** -0.006 -0.006*
[-4.62] [-4.67] [-1.65] [-1.66]
ΔSIZE -0.202 -0.205 -0.072 -0.074
[-1.12] [-1.16] [-0.84] [-0.86]
M&A -0.001 -0.001 -0.015 -0.015
[-0.05] [-0.07] [-0.78] [-0.77]
AbnormalFee -0.053** -0.053** -0.008 -0.008
[-3.55] [-3.54] [-1.43] [-1.39]
Intercept 0.903*** 0.901*** 0.144*** 0.144***
[6.26] [6.34] [5.22] [5.25]
Industry Fixed Effects Included Included Included Included
N 1,109 1,109 5,175 5,175
R2 0.328 0.329 0.073 0.073
Panel B: Client Gain Analysis
SWITCHi,t = δ0 + δ1 PWC_CYi,t + δ2 POST1i,t + δ3 PWC_CYi,t×POST1i,t + Σ βk CONTROLi,t-1 + εi,t ............................................. (2)
DV = SWITCH PWC vs. Other-
Big4
PWC vs. Other-
Big4
PWC vs.
Non-Big4
PWC vs.
Non-Big4
(1) (2) (3) (4)
Test Variables:
PWC_CY 0.002 0.002 -0.235*** -0.235***
[0.15] [0.14] [-3.11] [-3.12]
POST1 -0.022 0.005
[-0.89] [0.62]
PWC_CY×POST1 0.013 -0.057***
[0.70] [-5.60]
Year2010 -0.035 -0.002
[-1.96] [-0.20]
Year2011 -0.009 0.012
[-0.28] [1.06]
PWC_CY×Year2010 0.026 -0.057***
[2.07] [-4.88]
PWC_CY×Year2011 0.000 -0.058***
[0.01] [-4.74]
Control Variables:
MODOP 0.002 0.004 0.008 0.008
[0.25] [0.39] [1.12] [1.16]
GROWTH 0.155 0.156 0.051 0.052
[1.26] [1.29] [0.84] [0.85]
38
DV = SWITCH PWC vs. Other-
Big4
PWC vs. Other-
Big4
PWC vs.
Non-Big4
PWC vs.
Non-Big4
ABSDACC 0.284** 0.284** 0.046 0.047
[4.15] [4.27] [1.07] [1.08]
INVREC -0.005 -0.002 0.018 0.018
[-0.10] [-0.05] [0.80] [0.80]
TENURE 0.005 0.005 -0.005*** -0.005***
[2.06] [2.05] [-5.12] [-5.17]
ROA -0.266 -0.262 -0.122** -0.122**
[-1.78] [-1.78] [-1.96] [-1.97]
LOSS -0.037 -0.034 0.022 0.023*
[-1.07] [-1.01] [1.61] [1.68]
LEVERAGE 0.115* 0.115* -0.052** -0.052**
[2.26] [2.27] [-2.31] [-2.31]
ΔLEVERAGE -0.102 -0.095 0.016 0.020
[-1.31] [-1.21] [0.38] [0.46]
CASH -0.065 -0.066 0.066 0.066
[-1.07] [-1.06] [1.27] [1.28]
MISMATCH -0.322*** -0.322*** 0.274*** 0.274***
[-7.32] [-7.31] [3.02] [3.03]
SIZE -0.062*** -0.062*** -0.006 -0.006
[-5.04] [-5.05] [-1.63] [-1.64]
ΔSIZE -0.187 -0.187 -0.076 -0.078
[-0.99] [-1.01] [-0.86] [-0.88]
M&A -0.003 -0.003 -0.016 -0.016
[-0.26] [-0.25] [-1.02] [-1.02]
AbnormalFee -0.053** -0.053** -0.008 -0.008
[-3.16] [-3.10] [-1.50] [-1.47]
Intercept 0.892*** 0.890*** 0.140*** 0.140***
[6.28] [6.30] [4.78] [4.80]
Industry Fixed Effects Included Included Included Included
N 1,109 1,109 5,175 5,175
R2 0.315 0.316 0.073 0.073
Panel C: Change in Audit Fee Analysis
ΔLnAuditFeei,t = δ0 + δ1 PWC_CYi,t + δ2 POST1i,t + δ3 PWC_CYi,t×POST1i,t + Σ βk CONTROLi,t + εi,t .................................... (3)
DV = ΔLnAuditFee PWC vs.
Other-Big4
PWC vs.
Other-Big4
PWC vs.
Non-Big4
PWC vs.
Non-Big4
(1) (2) (3) (4)
Test Variables:
PWC_CY 0.004 0.004 -0.066*** -0.066***
[0.37] [0.34] [-6.93] [-6.95]
POST1 -0.042* -0.035***
[-2.31] [-5.02]
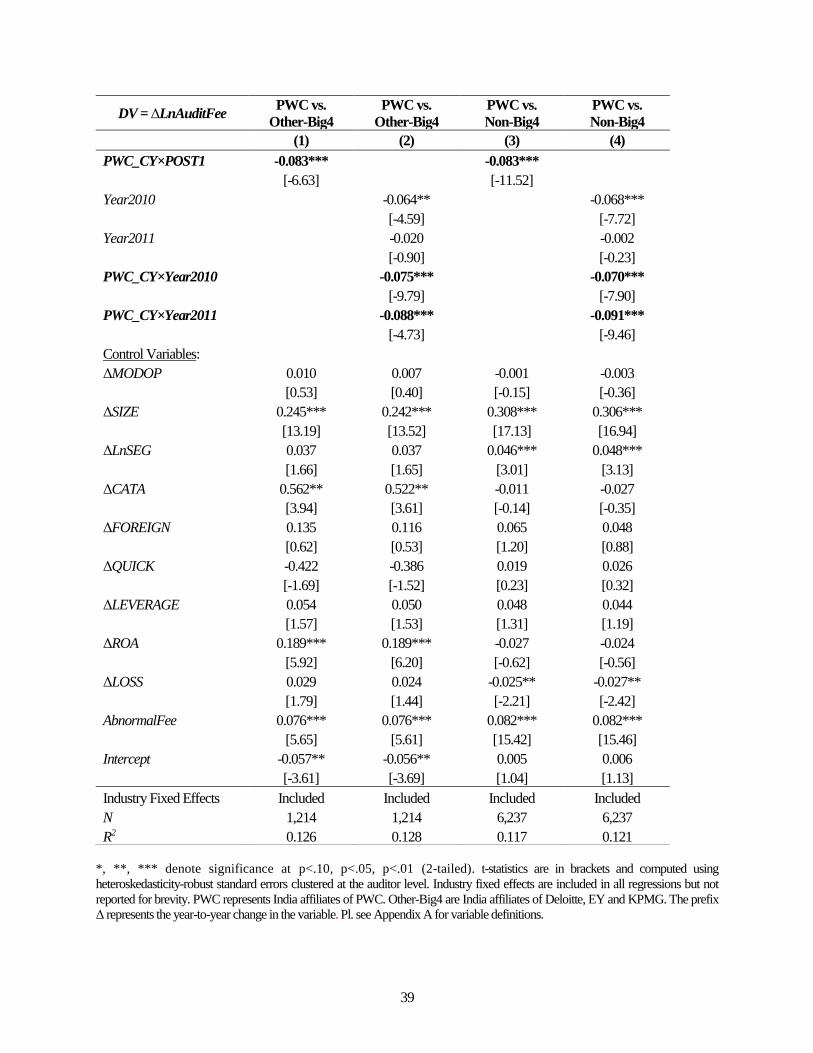
39
DV = ΔLnAuditFee PWC vs.
Other-Big4
PWC vs.
Other-Big4
PWC vs.
Non-Big4
PWC vs.
Non-Big4
(1) (2) (3) (4)
PWC_CY×POST1 -0.083*** -0.083***
[-6.63] [-11.52]
Year2010 -0.064** -0.068***
[-4.59] [-7.72]
Year2011 -0.020 -0.002
[-0.90] [-0.23]
PWC_CY×Year2010 -0.075*** -0.070***
[-9.79] [-7.90]
PWC_CY×Year2011 -0.088*** -0.091***
[-4.73] [-9.46]
Control Variables:
ΔMODOP 0.010 0.007 -0.001 -0.003
[0.53] [0.40] [-0.15] [-0.36]
ΔSIZE 0.245*** 0.242*** 0.308*** 0.306***
[13.19] [13.52] [17.13] [16.94]
ΔLnSEG 0.037 0.037 0.046*** 0.048***
[1.66] [1.65] [3.01] [3.13]
ΔCATA 0.562** 0.522** -0.011 -0.027
[3.94] [3.61] [-0.14] [-0.35]
ΔFOREIGN 0.135 0.116 0.065 0.048
[0.62] [0.53] [1.20] [0.88]
ΔQUICK -0.422 -0.386 0.019 0.026
[-1.69] [-1.52] [0.23] [0.32]
ΔLEVERAGE 0.054 0.050 0.048 0.044
[1.57] [1.53] [1.31] [1.19]
ΔROA 0.189*** 0.189*** -0.027 -0.024
[5.92] [6.20] [-0.62] [-0.56]
ΔLOSS 0.029 0.024 -0.025** -0.027**
[1.79] [1.44] [-2.21] [-2.42]
AbnormalFee 0.076*** 0.076*** 0.082*** 0.082***
[5.65] [5.61] [15.42] [15.46]
Intercept -0.057** -0.056** 0.005 0.006
[-3.61] [-3.69] [1.04] [1.13]
Industry Fixed Effects Included Included Included Included
N 1,214 1,214 6,237 6,237
R2 0.126 0.128 0.117 0.121
*, **, *** denote significance at p<.10, p<.05, p<.01 (2-tailed). t-statistics are in brackets and computed using
heteroskedasticity-robust standard errors clustered at the auditor level. Industry fixed effects are included in all regressions but not
reported for brevity. PWC represents India affiliates of PWC. Other-Big4 are India affiliates of Deloitte, EY and KPMG. The prefix
Δ represents the year-to-year change in the variable. Pl. see Appendix A for variable definitions.
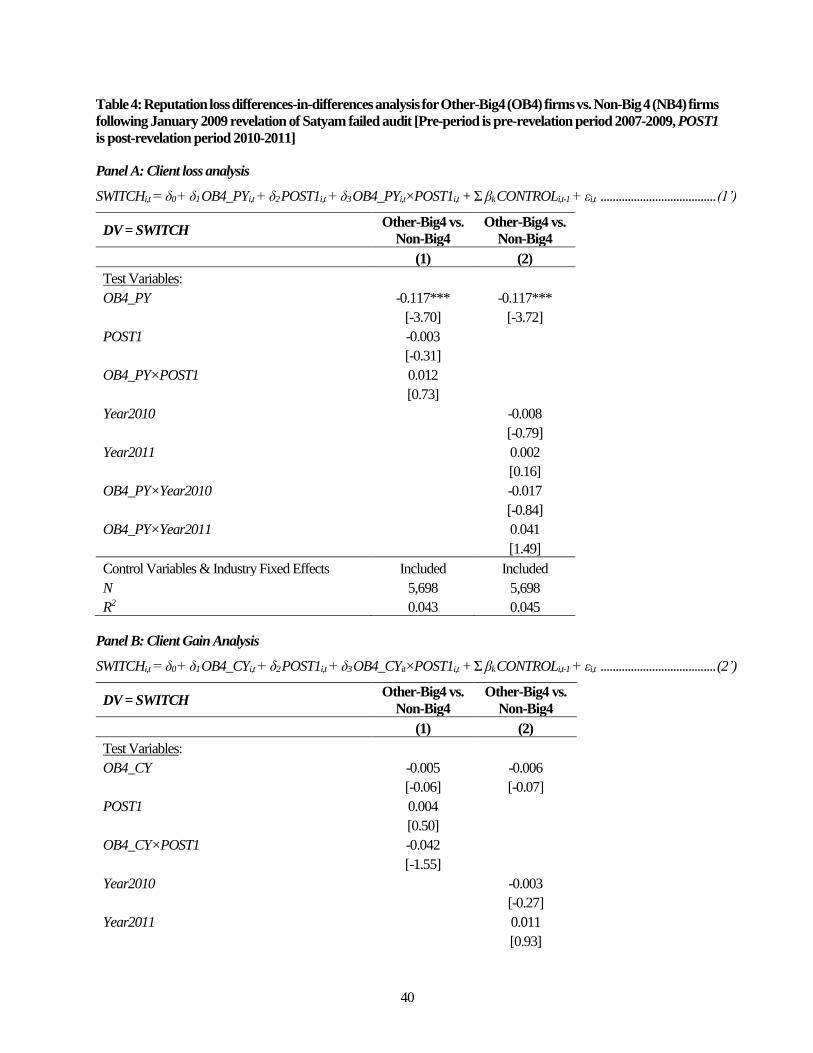
40
Table 4: Reputation loss differences-in-differences analysis for Other-Big4 (OB4) firms vs. Non-Big 4 (NB4) firms
following January 2009 revelation of Satyam failed audit [Pre-period is pre-revelation period 2007-2009, POST1
is post-revelation period 2010-2011]
Panel A: Client loss analysis
SWITCHi,t = δ0 + δ1 OB4_PYi,t + δ2 POST1i,t + δ3 OB4_PYi,t×POST1i,t + Σ βk CONTROLi,t-1 + εi,t ...................................... (1’)
DV = SWITCH Other-Big4 vs.
Non-Big4
Other-Big4 vs.
Non-Big4
(1) (2)
Test Variables:
OB4_PY -0.117*** -0.117***
[-3.70] [-3.72]
POST1 -0.003
[-0.31]
OB4_PY×POST1 0.012
[0.73]
Year2010 -0.008
[-0.79]
Year2011 0.002
[0.16]
OB4_PY×Year2010 -0.017
[-0.84]
OB4_PY×Year2011 0.041
[1.49]
Control Variables & Industry Fixed Effects Included Included
N 5,698 5,698
R2 0.043 0.045
Panel B: Client Gain Analysis
SWITCHi,t = δ0 + δ1 OB4_CYi,t + δ2 POST1i,t + δ3 OB4_CYit×POST1i,t + Σ βk CONTROLi,t-1 + εi,t ...................................... (2’)
DV = SWITCH Other-Big4 vs.
Non-Big4
Other-Big4 vs.
Non-Big4
(1) (2)
Test Variables:
OB4_CY -0.005 -0.006
[-0.06] [-0.07]
POST1 0.004
[0.50]
OB4_CY×POST1 -0.042
[-1.55]
Year2010 -0.003
[-0.27]
Year2011 0.011
[0.93]
41
DV = SWITCH Other-Big4 vs.
Non-Big4
Other-Big4 vs.
Non-Big4
OB4_CY×Year2010 -0.059***
[-3.32]
OB4_CY×Year2011 -0.026
[-0.67]
Control Variables & Industry Fixed Effects Included Included
N 5,698 5,698
R2 0.039 0.040
Panel C: Change in Audit Fee Analysis
ΔLnAuditFeei,t = δ0 + δ1 OB4_CYi,t + δ2 POST1i,t + δ3 OB4_CYi,t×POST1i,t + Σ βk CONTROLi,t + εi,t .............................. (3’)
DV = ΔLnAuditFee Other-Big4 vs.
Non-Big4
Other-Big4 vs.
Non-Big4
(1) (2)
Test Variables:
OB4_CY -0.082*** -0.082***
[-5.51] [-5.50]
POST1 -0.035***
[-5.11]
OB4_CY×POST1 -0.002
[-0.20]
Year2010 -0.068***
[-7.78]
Year2011 -0.003
[-0.30]
OB4_CY×Year2010 0.004
[0.41]
OB4_CY×Year2011 -0.008
[-0.46]
Control Variables & Industry Fixed Effects Included Included
N 6,809 6,809
R2 0.111 0.115 *, **, *** denote significance at p<.10, p<.05, p<.01 (2-tailed). t-statistics are in brackets and computed using
heteroskedasticity-robust standard errors clustered at the auditor level. Control variables and industry fixed effects are included in all
regressions but not reported for brevity. PWC represents India affiliates of PWC. Other-Big4 are India affiliates of Deloitte, EY and
KPMG. Pl. see Appendix A for variable definitions.
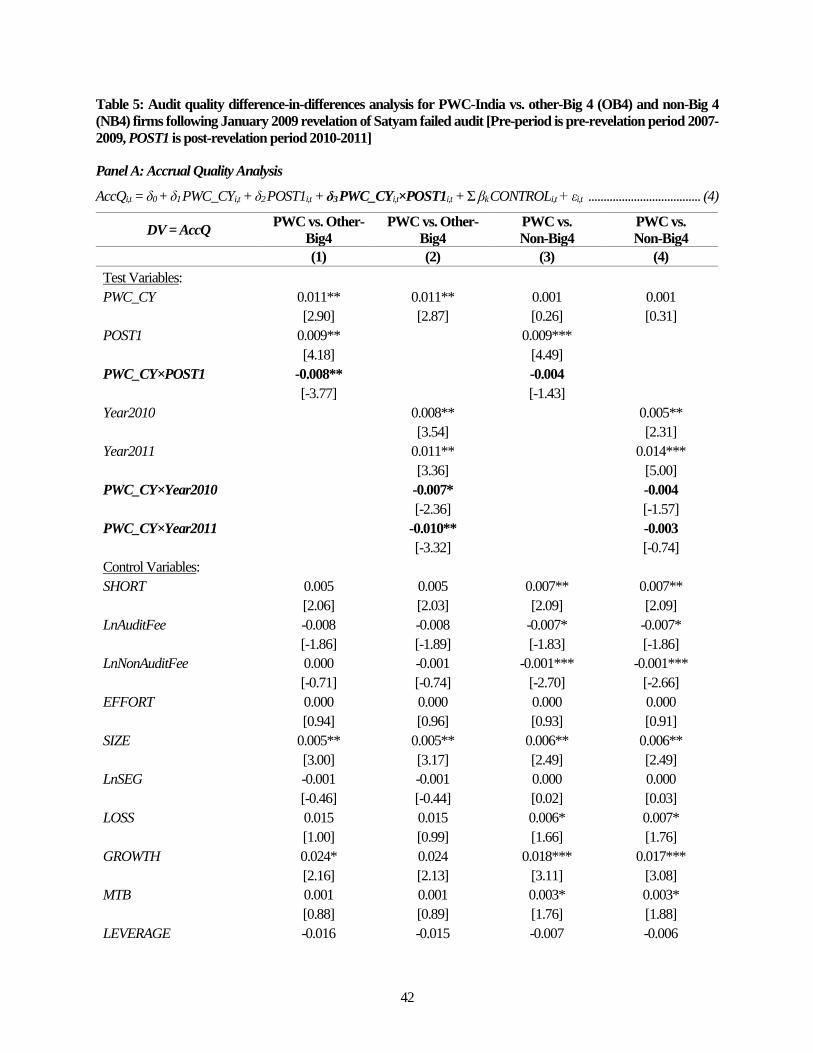
42
Table 5: Audit quality difference-in-differences analysis for PWC-India vs. other-Big 4 (OB4) and non-Big 4
(NB4) firms following January 2009 revelation of Satyam failed audit [Pre-period is pre-revelation period 2007-
2009, POST1 is post-revelation period 2010-2011]
Panel A: Accrual Quality Analysis
AccQi,t = δ0 + δ1 PWC_CYi,t + δ2 POST1i,t + δ3 PWC_CYi,t×POST1i,t + Σ βk CONTROLi,t + εi,t ..................................... (4)
DV = AccQ PWC vs. Other-
Big4
PWC vs. Other-
Big4
PWC vs.
Non-Big4
PWC vs.
Non-Big4
(1) (2) (3) (4)
Test Variables:
PWC_CY 0.011** 0.011** 0.001 0.001
[2.90] [2.87] [0.26] [0.31]
POST1 0.009** 0.009***
[4.18] [4.49]
PWC_CY×POST1 -0.008** -0.004
[-3.77] [-1.43]
Year2010 0.008** 0.005**
[3.54] [2.31]
Year2011 0.011** 0.014***
[3.36] [5.00]
PWC_CY×Year2010 -0.007* -0.004
[-2.36] [-1.57]
PWC_CY×Year2011 -0.010** -0.003
[-3.32] [-0.74]
Control Variables:
SHORT 0.005 0.005 0.007** 0.007**
[2.06] [2.03] [2.09] [2.09]
LnAuditFee -0.008 -0.008 -0.007* -0.007*
[-1.86] [-1.89] [-1.83] [-1.86]
LnNonAuditFee 0.000 -0.001 -0.001*** -0.001***
[-0.71] [-0.74] [-2.70] [-2.66]
EFFORT 0.000 0.000 0.000 0.000
[0.94] [0.96] [0.93] [0.91]
SIZE 0.005** 0.005** 0.006** 0.006**
[3.00] [3.17] [2.49] [2.49]
LnSEG -0.001 -0.001 0.000 0.000
[-0.46] [-0.44] [0.02] [0.03]
LOSS 0.015 0.015 0.006* 0.007*
[1.00] [0.99] [1.66] [1.76]
GROWTH 0.024* 0.024 0.018*** 0.017***
[2.16] [2.13] [3.11] [3.08]
MTB 0.001 0.001 0.003* 0.003*
[0.88] [0.89] [1.76] [1.88]
LEVERAGE -0.016 -0.015 -0.007 -0.006
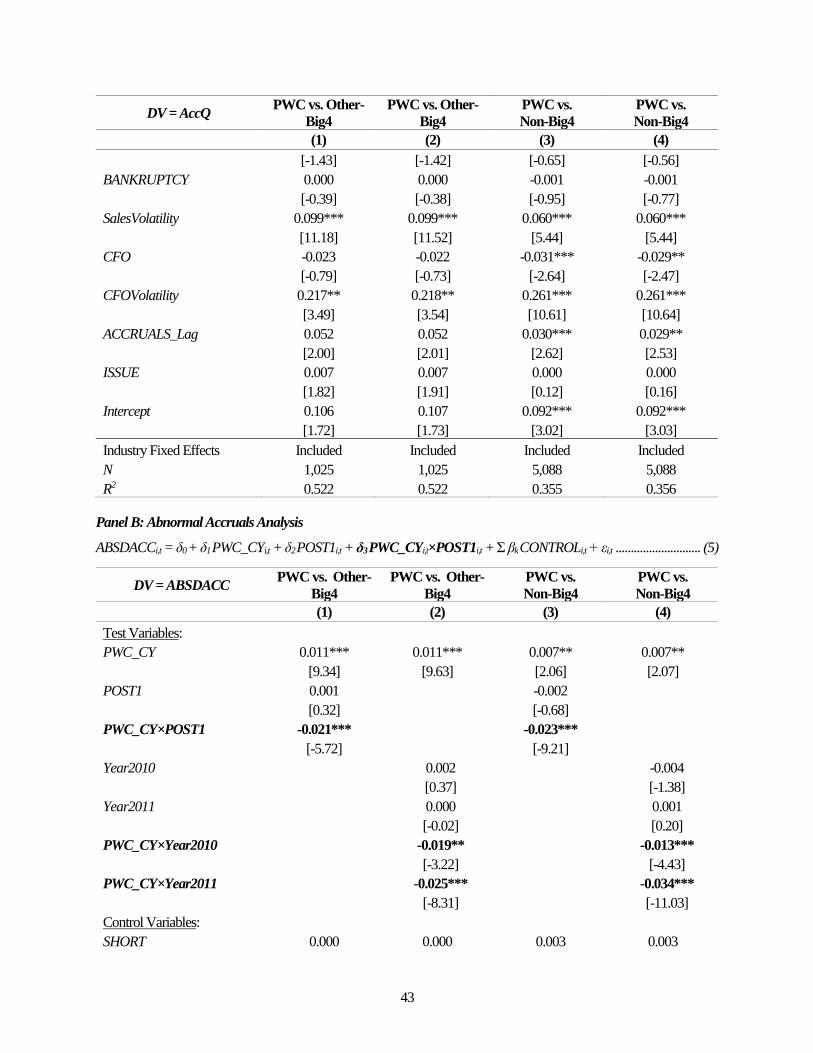
43
DV = AccQ PWC vs. Other-
Big4
PWC vs. Other-
Big4
PWC vs.
Non-Big4
PWC vs.
Non-Big4
(1) (2) (3) (4)
[-1.43] [-1.42] [-0.65] [-0.56]
BANKRUPTCY 0.000 0.000 -0.001 -0.001
[-0.39] [-0.38] [-0.95] [-0.77]
SalesVolatility 0.099*** 0.099*** 0.060*** 0.060***
[11.18] [11.52] [5.44] [5.44]
CFO -0.023 -0.022 -0.031*** -0.029**
[-0.79] [-0.73] [-2.64] [-2.47]
CFOVolatility 0.217** 0.218** 0.261*** 0.261***
[3.49] [3.54] [10.61] [10.64]
ACCRUALS_Lag 0.052 0.052 0.030*** 0.029**
[2.00] [2.01] [2.62] [2.53]
ISSUE 0.007 0.007 0.000 0.000
[1.82] [1.91] [0.12] [0.16]
Intercept 0.106 0.107 0.092*** 0.092***
[1.72] [1.73] [3.02] [3.03]
Industry Fixed Effects Included Included Included Included
N 1,025 1,025 5,088 5,088
R2 0.522 0.522 0.355 0.356
Panel B: Abnormal Accruals Analysis
ABSDACCi,t = δ0 + δ1 PWC_CYi,t + δ2 POST1i,t + δ3 PWC_CYi,t×POST1i,t + Σ βk CONTROLi,t + εi,t ............................ (5)
DV = ABSDACC PWC vs. Other-
Big4
PWC vs. Other-
Big4
PWC vs.
Non-Big4
PWC vs.
Non-Big4
(1) (2) (3) (4)
Test Variables:
PWC_CY 0.011*** 0.011*** 0.007** 0.007**
[9.34] [9.63] [2.06] [2.07]
POST1 0.001 -0.002
[0.32] [-0.68]
PWC_CY×POST1 -0.021*** -0.023***
[-5.72] [-9.21]
Year2010 0.002 -0.004
[0.37] [-1.38]
Year2011 0.000 0.001
[-0.02] [0.20]
PWC_CY×Year2010 -0.019** -0.013***
[-3.22] [-4.43]
PWC_CY×Year2011 -0.025*** -0.034***
[-8.31] [-11.03]
Control Variables:
SHORT 0.000 0.000 0.003 0.003
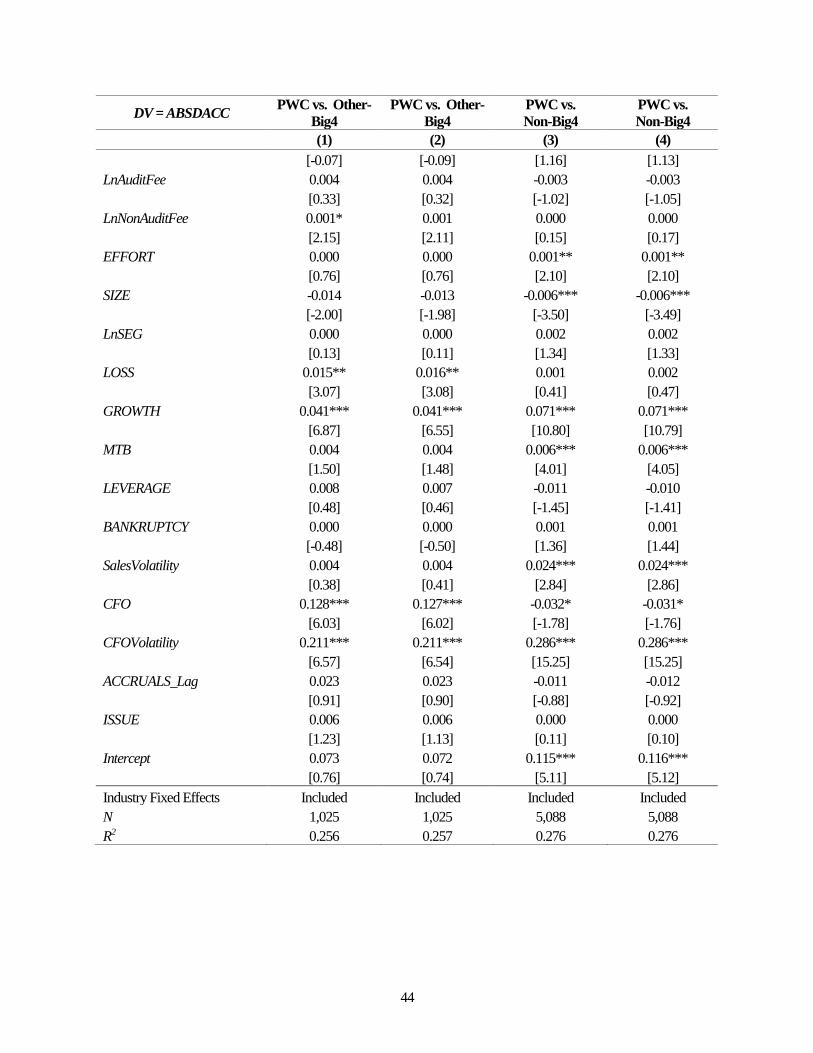
44
DV = ABSDACC PWC vs. Other-
Big4
PWC vs. Other-
Big4
PWC vs.
Non-Big4
PWC vs.
Non-Big4
(1) (2) (3) (4)
[-0.07] [-0.09] [1.16] [1.13]
LnAuditFee 0.004 0.004 -0.003 -0.003
[0.33] [0.32] [-1.02] [-1.05]
LnNonAuditFee 0.001* 0.001 0.000 0.000
[2.15] [2.11] [0.15] [0.17]
EFFORT 0.000 0.000 0.001** 0.001**
[0.76] [0.76] [2.10] [2.10]
SIZE -0.014 -0.013 -0.006*** -0.006***
[-2.00] [-1.98] [-3.50] [-3.49]
LnSEG 0.000 0.000 0.002 0.002
[0.13] [0.11] [1.34] [1.33]
LOSS 0.015** 0.016** 0.001 0.002
[3.07] [3.08] [0.41] [0.47]
GROWTH 0.041*** 0.041*** 0.071*** 0.071***
[6.87] [6.55] [10.80] [10.79]
MTB 0.004 0.004 0.006*** 0.006***
[1.50] [1.48] [4.01] [4.05]
LEVERAGE 0.008 0.007 -0.011 -0.010
[0.48] [0.46] [-1.45] [-1.41]
BANKRUPTCY 0.000 0.000 0.001 0.001
[-0.48] [-0.50] [1.36] [1.44]
SalesVolatility 0.004 0.004 0.024*** 0.024***
[0.38] [0.41] [2.84] [2.86]
CFO 0.128*** 0.127*** -0.032* -0.031*
[6.03] [6.02] [-1.78] [-1.76]
CFOVolatility 0.211*** 0.211*** 0.286*** 0.286***
[6.57] [6.54] [15.25] [15.25]
ACCRUALS_Lag 0.023 0.023 -0.011 -0.012
[0.91] [0.90] [-0.88] [-0.92]
ISSUE 0.006 0.006 0.000 0.000
[1.23] [1.13] [0.11] [0.10]
Intercept 0.073 0.072 0.115*** 0.116***
[0.76] [0.74] [5.11] [5.12]
Industry Fixed Effects Included Included Included Included
N 1,025 1,025 5,088 5,088
R2 0.256 0.257 0.276 0.276
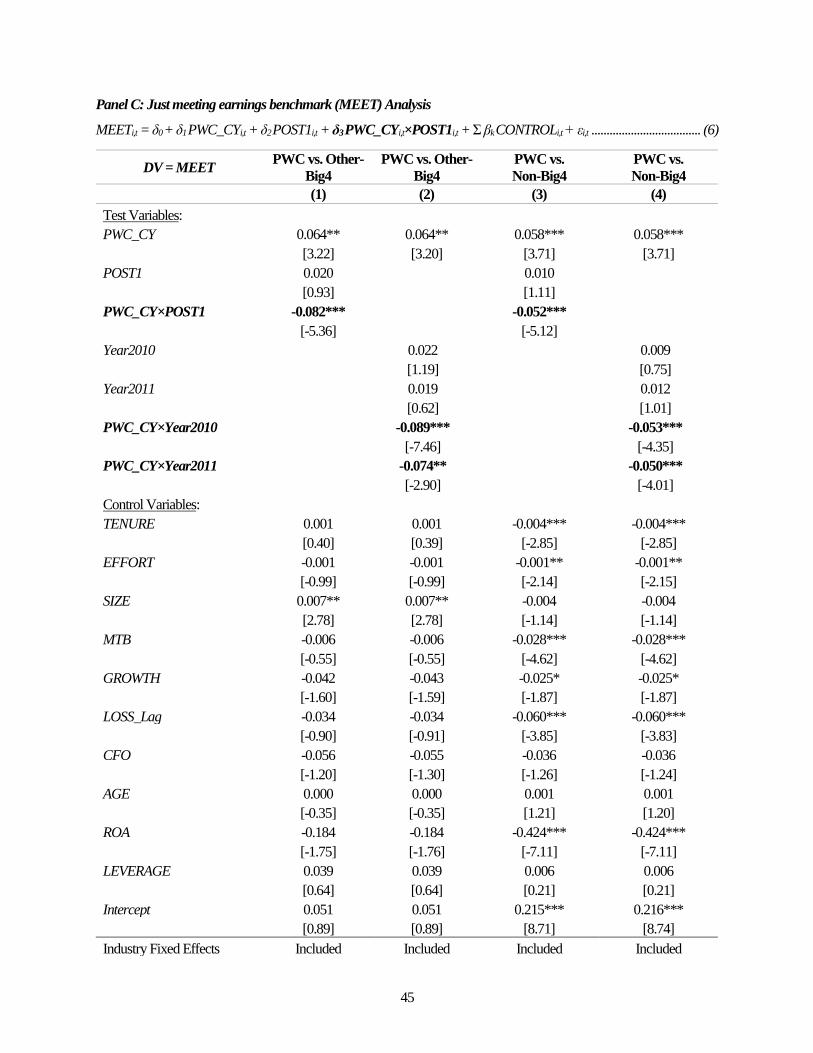
45
Panel C: Just meeting earnings benchmark (MEET) Analysis
MEETi,t = δ0 + δ1 PWC_CYi,t + δ2 POST1i,t + δ3 PWC_CYi,t×POST1i,t + Σ βk CONTROLi,t + εi,t .................................... (6)
DV = MEET PWC vs. Other-
Big4
PWC vs. Other-
Big4
PWC vs.
Non-Big4
PWC vs.
Non-Big4
(1) (2) (3) (4)
Test Variables:
PWC_CY 0.064** 0.064** 0.058*** 0.058***
[3.22] [3.20] [3.71] [3.71]
POST1 0.020 0.010
[0.93] [1.11]
PWC_CY×POST1 -0.082*** -0.052***
[-5.36] [-5.12]
Year2010 0.022 0.009
[1.19] [0.75]
Year2011 0.019 0.012
[0.62] [1.01]
PWC_CY×Year2010 -0.089*** -0.053***
[-7.46] [-4.35]
PWC_CY×Year2011 -0.074** -0.050***
[-2.90] [-4.01]
Control Variables:
TENURE 0.001 0.001 -0.004*** -0.004***
[0.40] [0.39] [-2.85] [-2.85]
EFFORT -0.001 -0.001 -0.001** -0.001**
[-0.99] [-0.99] [-2.14] [-2.15]
SIZE 0.007** 0.007** -0.004 -0.004
[2.78] [2.78] [-1.14] [-1.14]
MTB -0.006 -0.006 -0.028*** -0.028***
[-0.55] [-0.55] [-4.62] [-4.62]
GROWTH -0.042 -0.043 -0.025* -0.025*
[-1.60] [-1.59] [-1.87] [-1.87]
LOSS_Lag -0.034 -0.034 -0.060*** -0.060***
[-0.90] [-0.91] [-3.85] [-3.83]
CFO -0.056 -0.055 -0.036 -0.036
[-1.20] [-1.30] [-1.26] [-1.24]
AGE 0.000 0.000 0.001 0.001
[-0.35] [-0.35] [1.21] [1.20]
ROA -0.184 -0.184 -0.424*** -0.424***
[-1.75] [-1.76] [-7.11] [-7.11]
LEVERAGE 0.039 0.039 0.006 0.006
[0.64] [0.64] [0.21] [0.21]
Intercept 0.051 0.051 0.215*** 0.216***
[0.89] [0.89] [8.71] [8.74]
Industry Fixed Effects Included Included Included Included
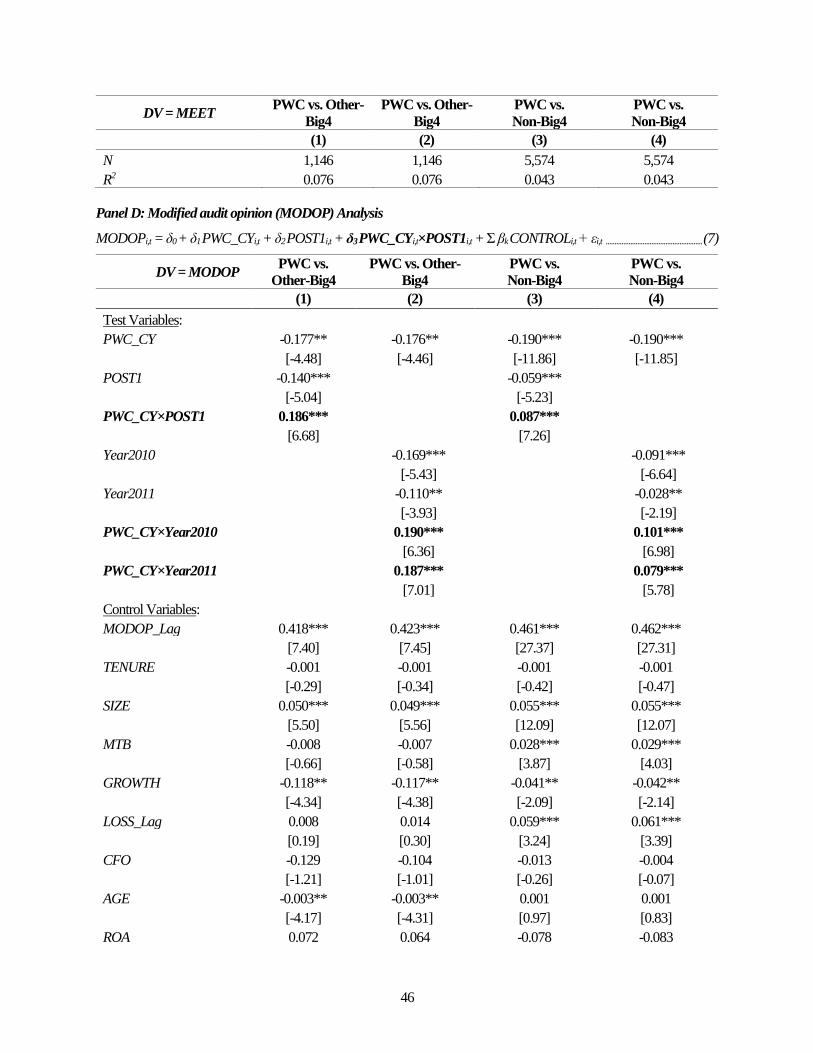
46
DV = MEET PWC vs. Other-
Big4
PWC vs. Other-
Big4
PWC vs.
Non-Big4
PWC vs.
Non-Big4
(1) (2) (3) (4)
N 1,146 1,146 5,574 5,574
R2 0.076 0.076 0.043 0.043
Panel D: Modified audit opinion (MODOP) Analysis
MODOPi,t = δ0 + δ1 PWC_CYi,t + δ2 POST1i,t + δ3 PWC_CYi,t×POST1i,t + Σ βk CONTROLi,t + εi,t ....................................................... (7)
DV = MODOP PWC vs.
Other-Big4
PWC vs. Other-
Big4
PWC vs.
Non-Big4
PWC vs.
Non-Big4
(1) (2) (3) (4)
Test Variables:
PWC_CY -0.177** -0.176** -0.190*** -0.190***
[-4.48] [-4.46] [-11.86] [-11.85]
POST1 -0.140*** -0.059***
[-5.04] [-5.23]
PWC_CY×POST1 0.186*** 0.087***
[6.68] [7.26]
Year2010 -0.169*** -0.091***
[-5.43] [-6.64]
Year2011 -0.110** -0.028**
[-3.93] [-2.19]
PWC_CY×Year2010 0.190*** 0.101***
[6.36] [6.98]
PWC_CY×Year2011 0.187*** 0.079***
[7.01] [5.78]
Control Variables:
MODOP_Lag 0.418*** 0.423*** 0.461*** 0.462***
[7.40] [7.45] [27.37] [27.31]
TENURE -0.001 -0.001 -0.001 -0.001
[-0.29] [-0.34] [-0.42] [-0.47]
SIZE 0.050*** 0.049*** 0.055*** 0.055***
[5.50] [5.56] [12.09] [12.07]
MTB -0.008 -0.007 0.028*** 0.029***
[-0.66] [-0.58] [3.87] [4.03]
GROWTH -0.118** -0.117** -0.041** -0.042**
[-4.34] [-4.38] [-2.09] [-2.14]
LOSS_Lag 0.008 0.014 0.059*** 0.061***
[0.19] [0.30] [3.24] [3.39]
CFO -0.129 -0.104 -0.013 -0.004
[-1.21] [-1.01] [-0.26] [-0.07]
AGE -0.003** -0.003** 0.001 0.001
[-4.17] [-4.31] [0.97] [0.83]
ROA 0.072 0.064 -0.078 -0.083
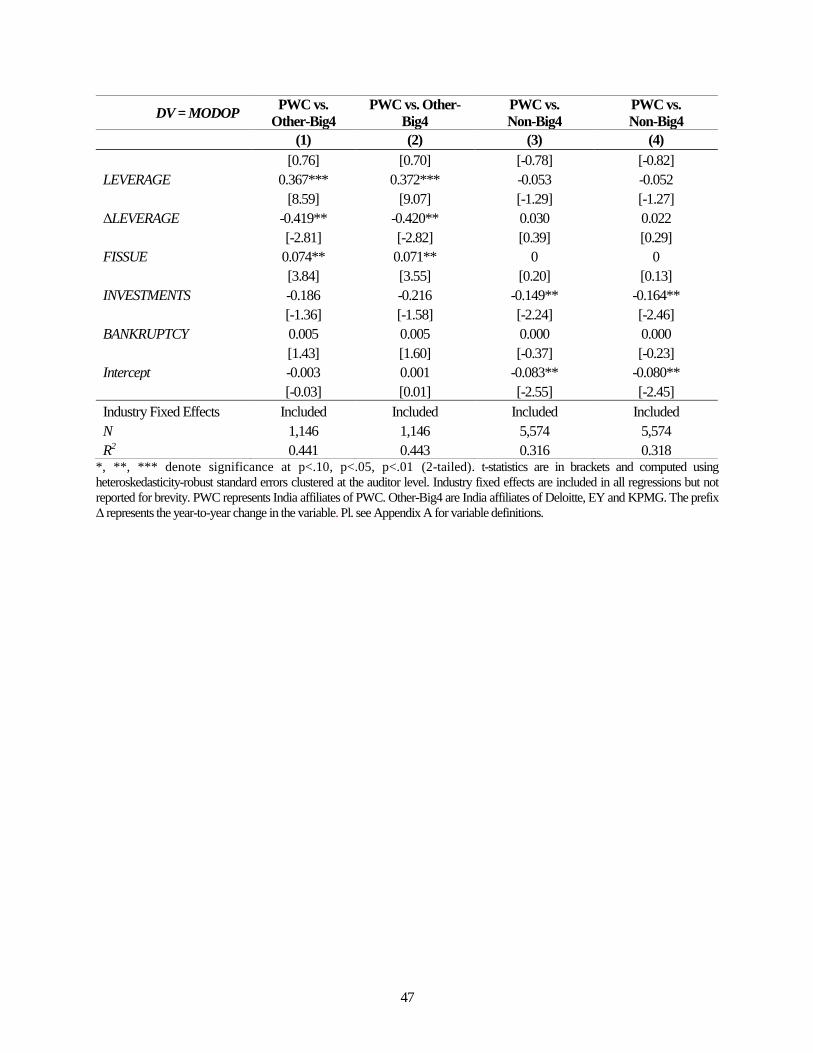
47
DV = MODOP PWC vs.
Other-Big4
PWC vs. Other-
Big4
PWC vs.
Non-Big4
PWC vs.
Non-Big4
(1) (2) (3) (4)
[0.76] [0.70] [-0.78] [-0.82]
LEVERAGE 0.367*** 0.372*** -0.053 -0.052
[8.59] [9.07] [-1.29] [-1.27]
ΔLEVERAGE -0.419** -0.420** 0.030 0.022
[-2.81] [-2.82] [0.39] [0.29]
FISSUE 0.074** 0.071** 0 0
[3.84] [3.55] [0.20] [0.13]
INVESTMENTS -0.186 -0.216 -0.149** -0.164**
[-1.36] [-1.58] [-2.24] [-2.46]
BANKRUPTCY 0.005 0.005 0.000 0.000
[1.43] [1.60] [-0.37] [-0.23]
Intercept -0.003 0.001 -0.083** -0.080**
[-0.03] [0.01] [-2.55] [-2.45]
Industry Fixed Effects Included Included Included Included
N 1,146 1,146 5,574 5,574
R2 0.441 0.443 0.316 0.318 *, **, *** denote significance at p<.10, p<.05, p<.01 (2-tailed). t-statistics are in brackets and computed using
heteroskedasticity-robust standard errors clustered at the auditor level. Industry fixed effects are included in all regressions but not
reported for brevity. PWC represents India affiliates of PWC. Other-Big4 are India affiliates of Deloitte, EY and KPMG. The prefix
Δ represents the year-to-year change in the variable. Pl. see Appendix A for variable definitions.
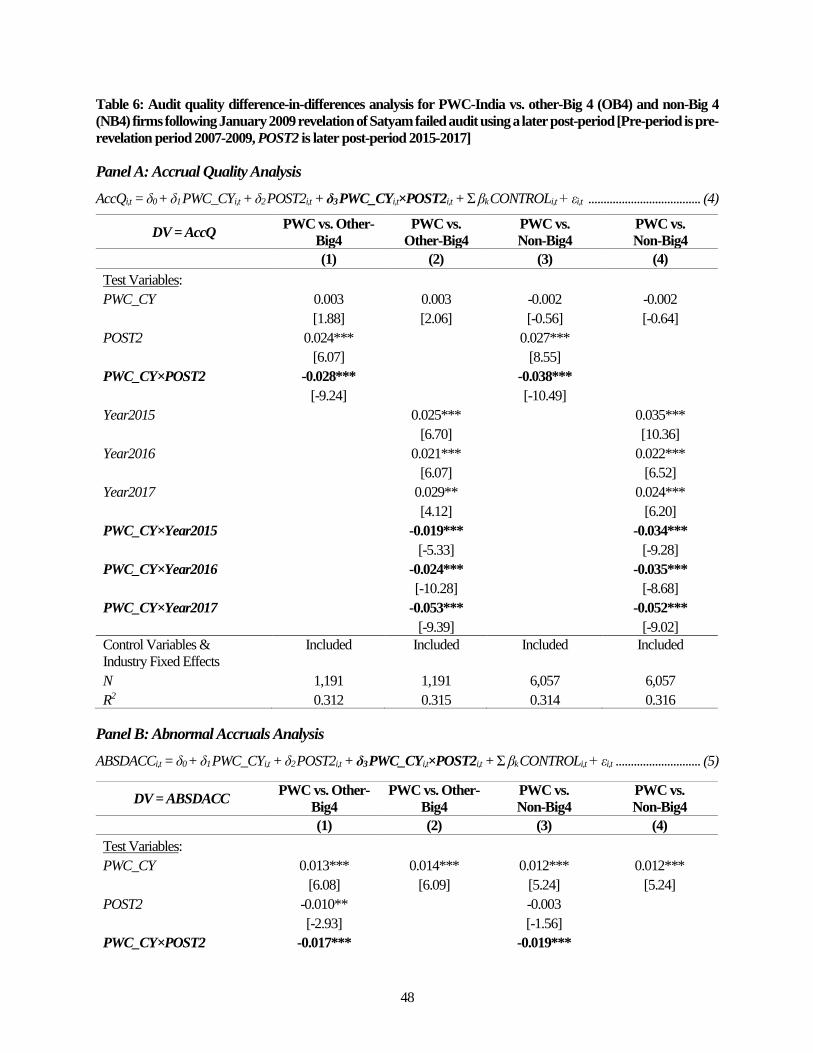
48
Table 6: Audit quality difference-in-differences analysis for PWC-India vs. other-Big 4 (OB4) and non-Big 4
(NB4) firms following January 2009 revelation of Satyam failed audit using a later post-period [Pre-period is pre-
revelation period 2007-2009, POST2 is later post-period 2015-2017]
Panel A: Accrual Quality Analysis
AccQi,t = δ0 + δ1 PWC_CYi,t + δ2 POST2i,t + δ3 PWC_CYi,t×POST2i,t + Σ βk CONTROLi,t + εi,t ..................................... (4)
DV = AccQ PWC vs. Other-
Big4
PWC vs.
Other-Big4
PWC vs.
Non-Big4
PWC vs.
Non-Big4
(1) (2) (3) (4)
Test Variables:
PWC_CY 0.003 0.003 -0.002 -0.002
[1.88] [2.06] [-0.56] [-0.64]
POST2 0.024*** 0.027***
[6.07] [8.55]
PWC_CY×POST2 -0.028*** -0.038***
[-9.24] [-10.49]
Year2015 0.025*** 0.035***
[6.70] [10.36]
Year2016 0.021*** 0.022***
[6.07] [6.52]
Year2017 0.029** 0.024***
[4.12] [6.20]
PWC_CY×Year2015 -0.019*** -0.034***
[-5.33] [-9.28]
PWC_CY×Year2016 -0.024*** -0.035***
[-10.28] [-8.68]
PWC_CY×Year2017 -0.053*** -0.052***
[-9.39] [-9.02]
Control Variables &
Industry Fixed Effects
Included
Included
Included
Included
N 1,191 1,191 6,057 6,057
R2 0.312 0.315 0.314 0.316
Panel B: Abnormal Accruals Analysis
ABSDACCi,t = δ0 + δ1 PWC_CYi,t + δ2 POST2i,t + δ3 PWC_CYi,t×POST2i,t + Σ βk CONTROLi,t + εi,t ............................ (5)
DV = ABSDACC PWC vs. Other-
Big4
PWC vs. Other-
Big4
PWC vs.
Non-Big4
PWC vs.
Non-Big4
(1) (2) (3) (4)
Test Variables:
PWC_CY 0.013*** 0.014*** 0.012*** 0.012***
[6.08] [6.09] [5.24] [5.24]
POST2 -0.010** -0.003
[-2.93] [-1.56]
PWC_CY×POST2 -0.017*** -0.019***
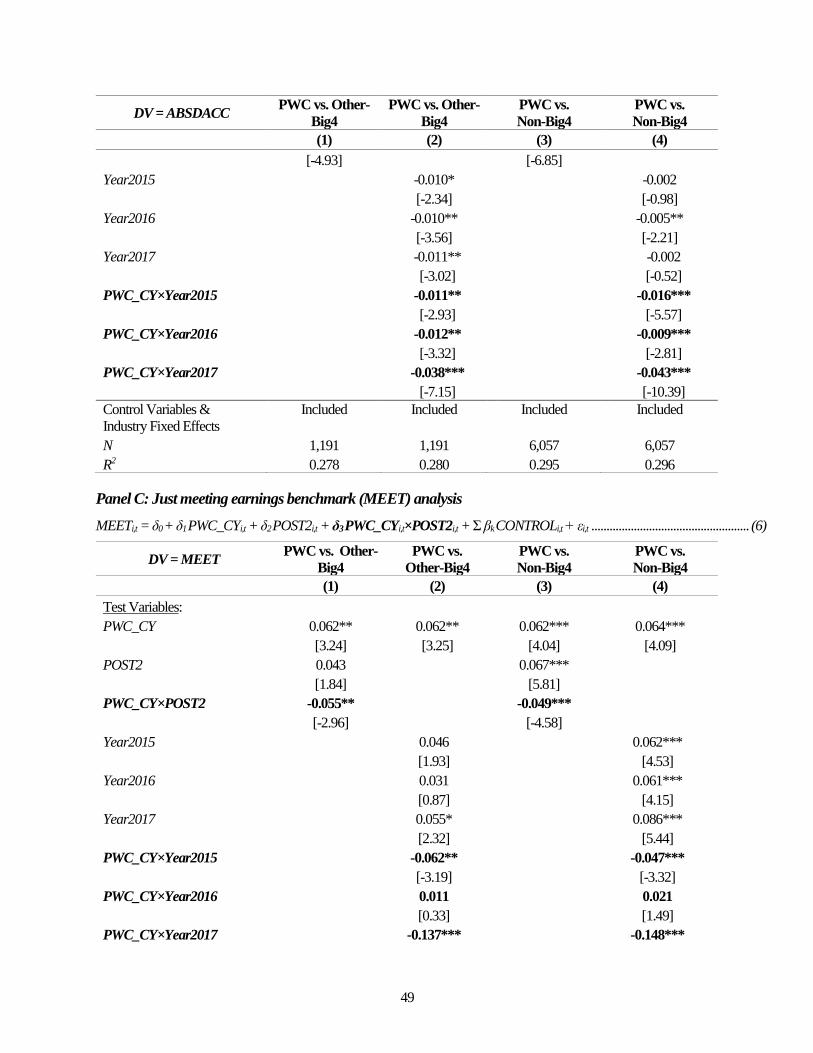
49
DV = ABSDACC PWC vs. Other-
Big4
PWC vs. Other-
Big4
PWC vs.
Non-Big4
PWC vs.
Non-Big4
(1) (2) (3) (4)
[-4.93] [-6.85]
Year2015 -0.010* -0.002
[-2.34] [-0.98]
Year2016 -0.010** -0.005**
[-3.56] [-2.21]
Year2017 -0.011** -0.002
[-3.02] [-0.52]
PWC_CY×Year2015 -0.011** -0.016***
[-2.93] [-5.57]
PWC_CY×Year2016 -0.012** -0.009***
[-3.32] [-2.81]
PWC_CY×Year2017 -0.038*** -0.043***
[-7.15] [-10.39]
Control Variables &
Industry Fixed Effects
Included
Included
Included
Included
N 1,191 1,191 6,057 6,057
R2 0.278 0.280 0.295 0.296
Panel C: Just meeting earnings benchmark (MEET) analysis
MEETi,t = δ0 + δ1 PWC_CYi,t + δ2 POST2i,t + δ3 PWC_CYi,t×POST2i,t + Σ βk CONTROLi,t + εi,t .................................................... (6)
DV = MEET PWC vs. Other-
Big4
PWC vs.
Other-Big4
PWC vs.
Non-Big4
PWC vs.
Non-Big4
(1) (2) (3) (4)
Test Variables:
PWC_CY 0.062** 0.062** 0.062*** 0.064***
[3.24] [3.25] [4.04] [4.09]
POST2 0.043 0.067***
[1.84] [5.81]
PWC_CY×POST2 -0.055** -0.049***
[-2.96] [-4.58]
Year2015 0.046 0.062***
[1.93] [4.53]
Year2016 0.031 0.061***
[0.87] [4.15]
Year2017 0.055* 0.086***
[2.32] [5.44]
PWC_CY×Year2015 -0.062** -0.047***
[-3.19] [-3.32]
PWC_CY×Year2016 0.011 0.021
[0.33] [1.49]
PWC_CY×Year2017 -0.137*** -0.148***
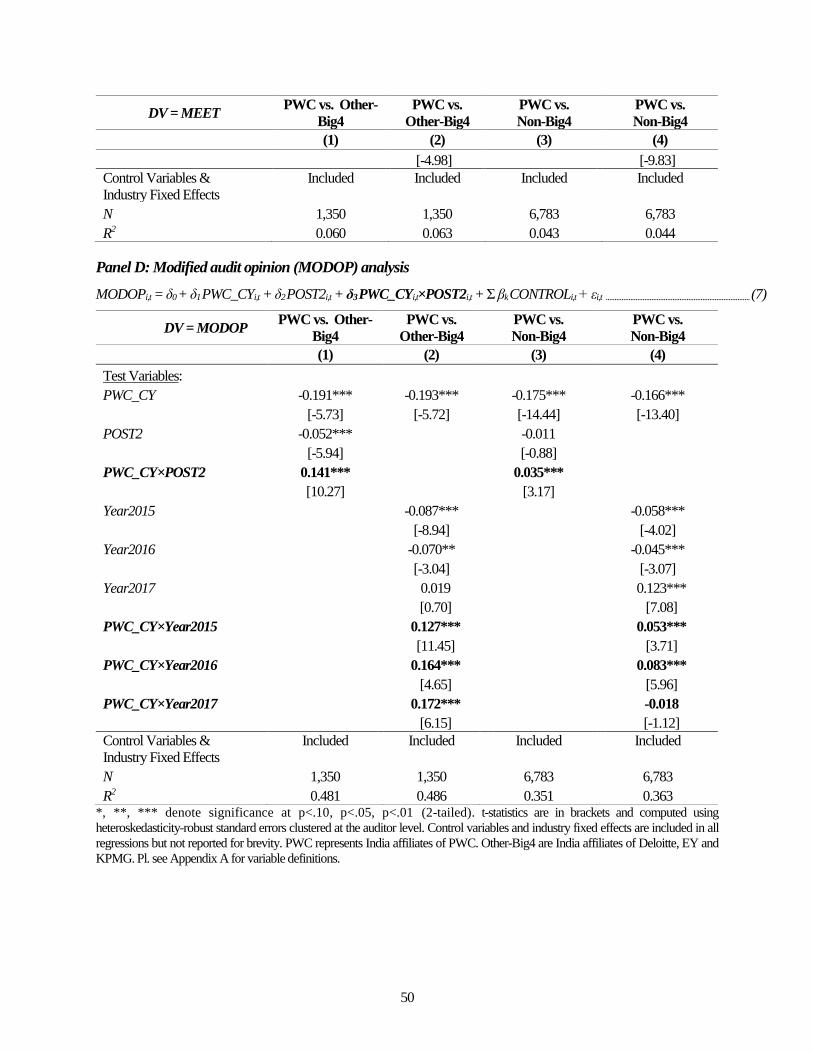
50
DV = MEET PWC vs. Other-
Big4
PWC vs.
Other-Big4
PWC vs.
Non-Big4
PWC vs.
Non-Big4
(1) (2) (3) (4)
[-4.98] [-9.83]
Control Variables &
Industry Fixed Effects
Included
Included
Included
Included
N 1,350 1,350 6,783 6,783
R2 0.060 0.063 0.043 0.044
Panel D: Modified audit opinion (MODOP) analysis
MODOPi,t = δ0 + δ1 PWC_CYi,t + δ2 POST2i,t + δ3 PWC_CYi,t×POST2i,t + Σ βk CONTROLi,t + εi,t .................................................................................. (7)
DV = MODOP PWC vs. Other-
Big4
PWC vs.
Other-Big4
PWC vs.
Non-Big4
PWC vs.
Non-Big4
(1) (2) (3) (4)
Test Variables:
PWC_CY -0.191*** -0.193*** -0.175*** -0.166***
[-5.73] [-5.72] [-14.44] [-13.40]
POST2 -0.052*** -0.011
[-5.94] [-0.88]
PWC_CY×POST2 0.141*** 0.035***
[10.27] [3.17]
Year2015 -0.087*** -0.058***
[-8.94] [-4.02]
Year2016 -0.070** -0.045***
[-3.04] [-3.07]
Year2017 0.019 0.123***
[0.70] [7.08]
PWC_CY×Year2015 0.127*** 0.053***
[11.45] [3.71]
PWC_CY×Year2016 0.164*** 0.083***
[4.65] [5.96]
PWC_CY×Year2017 0.172*** -0.018
[6.15] [-1.12]
Control Variables &
Industry Fixed Effects
Included
Included
Included
Included
N 1,350 1,350 6,783 6,783
R2 0.481 0.486 0.351 0.363 *, **, *** denote significance at p<.10, p<.05, p<.01 (2-tailed). t-statistics are in brackets and computed using
heteroskedasticity-robust standard errors clustered at the auditor level. Control variables and industry fixed effects are included in all
regressions but not reported for brevity. PWC represents India affiliates of PWC. Other-Big4 are India affiliates of Deloitte, EY and
KPMG. Pl. see Appendix A for variable definitions.
51
Table 7: Audit quality difference-in-differences analysis for Other-Big4 (OB4) firms vs. non-Big 4 (NB4) firms
following January 2009 revelation of Satyam failed audit using a later post-period [Pre-period is pre-revelation
period 2007-2009, POST2 is later post-period 2015-2017]
Panel A: Accrual Quality Analysis
AccQi,t = δ0 + δ1 OB4_CYi,t + δ2 POST2i,t + δ3 OB4_CYi,t×POST2i,t + Σ βk CONTROLi,t + εi,t ........................................ (4’)
DV = AccQ Other-Big4 vs.
Non-Big4
Other-Big4 vs.
Non-Big4
(1) (2)
Test Variables:
OB4_CY 0.000 0.000
[0.08] [0.01]
POST2 0.028***
[8.89]
OB4_CY×POST2 -0.005
[-1.62]
Year2015 0.035***
[10.56]
Year2016 0.022***
[6.77]
Year2017 0.025***
[6.75]
OB4_CY×Year2015 -0.012***
[-3.21]
OB4_CY×Year2016 -0.002
[-0.76]
OB4_CY×Year2017 0.000
[0.04]
Control Variables &
Industry Fixed Effects
Included
Included
N 6,842 6,842
R2 0.316 0.318
Panel B: Abnormal Accruals Analysis
ABSDACCi,t = δ0 + δ1 OB4_CYi,t + δ2 POST2i,t + δ3 OB4_CYi,t×POST2i,t + Σ βk CONTROLi,t + εi,t .............................. (5’)
DV = ABSDACC Other-Big4 vs.
Non-Big4
Other-Big4 vs.
Non-Big4
(1) (2)
Test Variables:
OB4_CY -0.004 -0.004
[-1.35] [-1.36]
POST2 -0.004*
[-1.89]
OB4_CY×POST2 -0.003
52
DV = ABSDACC Other-Big4 vs.
Non-Big4
Other-Big4 vs.
Non-Big4
(1) (2)
[-1.23]
Year2015 -0.003
[-1.26]
Year2016 -0.006**
[-2.54]
Year2017 -0.002
[-0.72]
OB4_CY×Year2015 -0.004
[-1.23]
OB4_CY×Year2016 0.001
[0.50]
OB4_CY×Year2017 -0.006**
[-2.12]
Control Variables &
Industry Fixed Effects
Included
Included
N 6,842 6,842
R2 0.284 0.285
Panel C: Just meeting earnings benchmark (MEET) analysis
MEETi,t = δ0 + δ1 OB4_CYi,t + δ2 POST2i,t + δ3 OB4_CYi,t×POST2i,t + Σ βk CONTROLi,t + εi,t ...................................................... (6’)
DV = MEET Other-Big4 vs.
Non-Big4
Other-Big4 vs.
Non-Big4
(1) (2)
Test Variables:
OB4_CY -0.011 -0.010
[-0.41] [-0.36]
POST2 0.060***
[5.25]
OB4_CY×POST2 0.010
[0.49]
Year2015 0.055***
[4.10]
Year2016 0.053***
[3.66]
Year2017 0.077***
[4.93]
OB4_CY×Year2015 0.013
[0.55]
OB4_CY×Year2016 0.007
[0.23]
OB4_CY×Year2017 0.009
53
DV = MEET Other-Big4 vs.
Non-Big4
Other-Big4 vs.
Non-Big4
(1) (2)
[0.36]
Control Variables &
Industry Fixed Effects
Included
Included
N 7,695 7,695
R2 0.044 0.045
Panel D: Modified audit opinion (MODOP) analysis
MODOPi,t = δ0 + δ1 OB4_CYi,t + δ2 POST2i,t + δ3 OB4_CYi,t×POST2i,t + Σ βk CONTROLi,t + εi,t ...................................................................................... (7’)
DV = MODOP Other-Big4 vs.
Non-Big4
Other-Big4 vs.
Non-Big4
(1) (2)
Test Variables:
OB4_CY 0.040 0.048
[1.24] [1.50]
POST2 -0.003
[-0.20]
OB4_CY×POST2 -0.090***
[-6.69]
Year2015 -0.052***
[-3.60]
Year2016 -0.039***
[-2.59]
Year2017 0.133***
[7.35]
OB4_CY×Year2015 -0.058***
[-3.97]
OB4_CY×Year2016 -0.059***
[-2.69]
OB4_CY×Year2017 -0.170***
[-5.17]
Control Variables &
Industry Fixed Effects
Included
Included
N 7,695 7,695
R2 0.358 0.370 *, **, *** denote significance at p<.10, p<.05, p<.01 (2-tailed). t-statistics are in brackets and computed using
heteroskedasticity-robust standard errors clustered at the auditor level. Control variables and industry fixed effects are included in all
regressions but not reported for brevity. PWC represents India affiliates of PWC. Other-Big4 are India affiliates of Deloitte, EY and
KPMG. Pl. see Appendix A for variable definitions.
54
Table 8: Audit quality (AQ) comparison of PWC-India, other-Big 4 (OB4), and non-Big 4 (NB4) firms based on
number of audit quality metrics (pre-revelation period 2007-2009 vs. post-period 2015-2017).
The information below is based on the audit quality (AQ) analysis in Tables 6 and 7. Note that in Tables 6 and 7 panels
A though C, the higher the metric, the lower the audit quality; by contrast, in panel D, the higher the metric, the higher
the audit quality. We assess whether audit quality is higher, similar (not different), or lower based on the sign and
significance (or lack thereof) of each of our four audit quality metrics.
Below, for PWC vs. OB4 audit quality comparison: (a) For pre-revelation period 2007-2009, the assessment is based on
the coefficient on PWC_CY in Table 6 column 1 panels A through D; (b) For post-revelation period 2015-2017, the
assessment is based on the sum of the coefficients of PWC_CY and PWC_CY×POST2 in Table 6 column 1 panels A
through D.
For PWC vs. NB4 audit quality comparison: (a) For pre-revelation period 2007-2009, the assessment is based on the
coefficient on PWC_CY in Table 6 column 3 panels A through D; (b) For post-revelation period 2015-2017, the
assessment is based on the sum of the coefficients of PWC_CY and PWC_CY×POST2 in Table 6 column 3 panels A
through D.
For OB4 vs. NB4 audit quality comparison: (a) For pre-revelation period 2007-2009, the assessment is based on the
coefficient on OB4_CY in Table 7 column 1 panels A through D; (b) For post-revelation period 2015-2017, the
assessment is based on the sum of the coefficients of OB4_CY and OB4_CY×POST2 in Table 7 column 1 panels A
through D.
Row Comparison Period Number of Audit Quality Metrics
PWC AQ Higher than
OB4 AQ
PWC AQ not different
from OB4 AQ
PWC AQ Lower
than OB4 AQ
(1) PWC vs OB4 2007-2009 0 1 3
(2) PWC vs OB4 2015-2017 1 3 0
PWC AQ Higher than
NB4 AQ
PWC AQ not different
from NB4 AQ
PWC AQ Lower
than NB4 AQ
(3) PWC vs NB4 2007-2009 0 1 3
(4) PWC vs NB4 2015-2017 2 1 1
OB4 AQ Higher than
NB4 AQ
OB4 AQ not different
from NB4 AQ
OB4 AQ Lower
than NB4 AQ
(5) OB4 vs NB4 2007-2009 0 4 0
(6) OB4 vs NB4 2015-2017 1 2 1
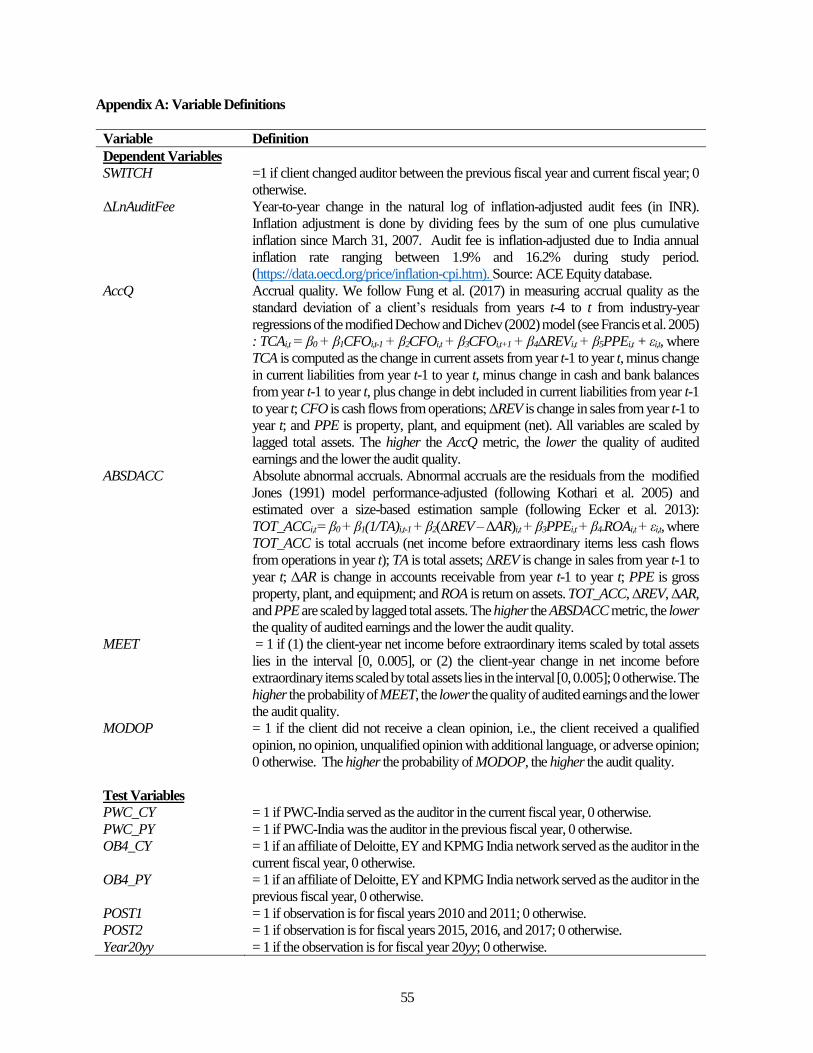
55
Appendix A: Variable Definitions
Variable Definition
Dependent Variables
SWITCH =1 if client changed auditor between the previous fiscal year and current fiscal year; 0
otherwise.
ΔLnAuditFee Year-to-year change in the natural log of inflation-adjusted audit fees (in INR).
Inflation adjustment is done by dividing fees by the sum of one plus cumulative
inflation since March 31, 2007. Audit fee is inflation-adjusted due to India annual
inflation rate ranging between 1.9% and 16.2% during study period.
(https://data.oecd.org/price/inflation-cpi.htm). Source: ACE Equity database.
AccQ Accrual quality. We follow Fung et al. (2017) in measuring accrual quality as the
standard deviation of a client’s residuals from years t-4 to t from industry-year
regressions of the modified Dechow and Dichev (2002) model (see Francis et al. 2005)
: TCAi,t = β0 + β1CFOi,t-1 + β2CFOi,t + β3CFOi,t+1 + β4ΔREVi,t + β5PPEi,t + εi,t, where
TCA is computed as the change in current assets from year t-1 to year t, minus change
in current liabilities from year t-1 to year t, minus change in cash and bank balances
from year t-1 to year t, plus change in debt included in current liabilities from year t-1
to year t; CFO is cash flows from operations; ΔREV is change in sales from year t-1 to
year t; and PPE is property, plant, and equipment (net). All variables are scaled by
lagged total assets. The higher the AccQ metric, the lower the quality of audited
earnings and the lower the audit quality.
ABSDACC Absolute abnormal accruals. Abnormal accruals are the residuals from the modified
Jones (1991) model performance-adjusted (following Kothari et al. 2005) and
estimated over a size-based estimation sample (following Ecker et al. 2013):
TOT_ACCi,t = β0 + β1(1/TA)i,t-1 + β2(ΔREV – ΔAR)i,t + β3PPEi,t + β4-ROAi,t + εi,t, where
TOT_ACC is total accruals (net income before extraordinary items less cash flows
from operations in year t); TA is total assets; ∆REV is change in sales from year t-1 to
year t; ∆AR is change in accounts receivable from year t-1 to year t; PPE is gross
property, plant, and equipment; and ROA is return on assets. TOT_ACC, ∆REV, ∆AR,
and PPE are scaled by lagged total assets. The higher the ABSDACC metric, the lower
the quality of audited earnings and the lower the audit quality.
MEET = 1 if (1) the client-year net income before extraordinary items scaled by total assets
lies in the interval [0, 0.005], or (2) the client-year change in net income before
extraordinary items scaled by total assets lies in the interval [0, 0.005]; 0 otherwise. The
higher the probability of MEET, the lower the quality of audited earnings and the lower
the audit quality.
MODOP = 1 if the client did not receive a clean opinion, i.e., the client received a qualified
opinion, no opinion, unqualified opinion with additional language, or adverse opinion;
0 otherwise. The higher the probability of MODOP, the higher the audit quality.
Test Variables
PWC_CY = 1 if PWC-India served as the auditor in the current fiscal year, 0 otherwise.
PWC_PY = 1 if PWC-India was the auditor in the previous fiscal year, 0 otherwise.
OB4_CY = 1 if an affiliate of Deloitte, EY and KPMG India network served as the auditor in the
current fiscal year, 0 otherwise.
OB4_PY = 1 if an affiliate of Deloitte, EY and KPMG India network served as the auditor in the
previous fiscal year, 0 otherwise.
POST1 = 1 if observation is for fiscal years 2010 and 2011; 0 otherwise.
POST2 = 1 if observation is for fiscal years 2015, 2016, and 2017; 0 otherwise.
Year20yy = 1 if the observation is for fiscal year 20yy; 0 otherwise.
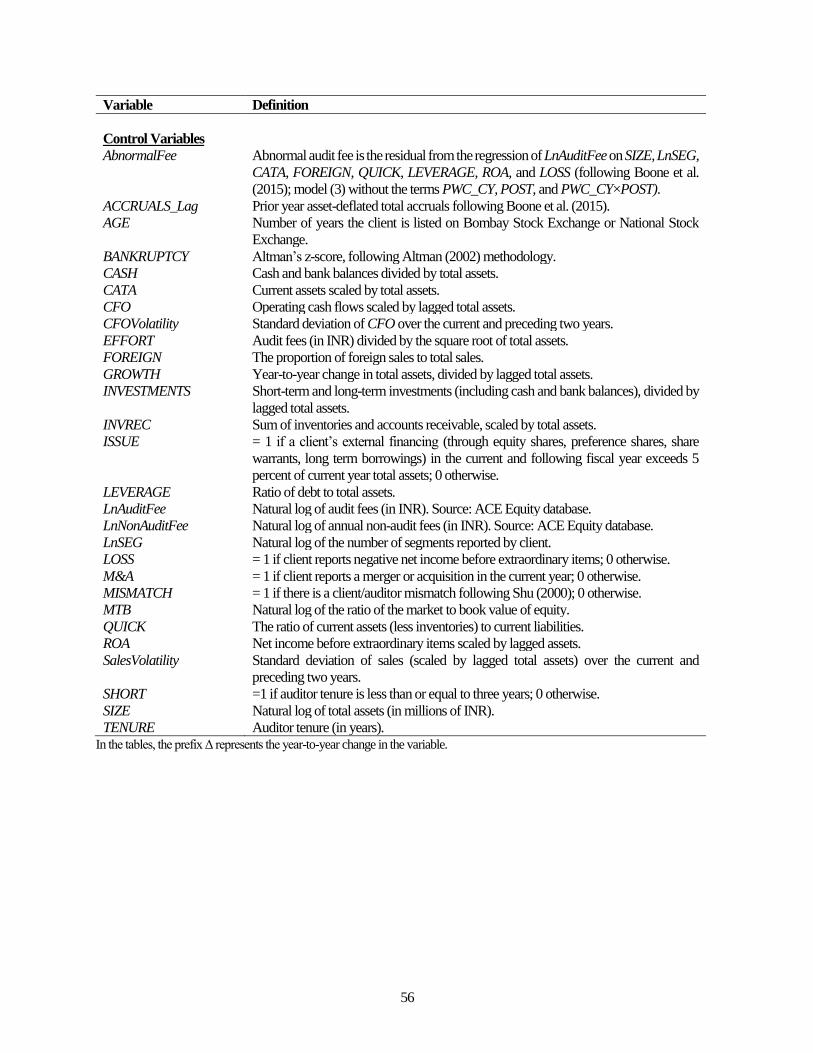
56
Variable Definition
Control Variables
AbnormalFee Abnormal audit fee is the residual from the regression of LnAuditFee on SIZE, LnSEG,
CATA, FOREIGN, QUICK, LEVERAGE, ROA, and LOSS (following Boone et al.
(2015); model (3) without the terms PWC_CY, POST, and PWC_CY×POST).
ACCRUALS_Lag Prior year asset-deflated total accruals following Boone et al. (2015).
AGE Number of years the client is listed on Bombay Stock Exchange or National Stock
Exchange.
BANKRUPTCY Altman’s z-score, following Altman (2002) methodology.
CASH Cash and bank balances divided by total assets.
CATA Current assets scaled by total assets.
CFO Operating cash flows scaled by lagged total assets.
CFOVolatility Standard deviation of CFO over the current and preceding two years.
EFFORT Audit fees (in INR) divided by the square root of total assets.
FOREIGN The proportion of foreign sales to total sales.
GROWTH Year-to-year change in total assets, divided by lagged total assets.
INVESTMENTS Short-term and long-term investments (including cash and bank balances), divided by
lagged total assets.
INVREC Sum of inventories and accounts receivable, scaled by total assets.
ISSUE = 1 if a client’s external financing (through equity shares, preference shares, share
warrants, long term borrowings) in the current and following fiscal year exceeds 5
percent of current year total assets; 0 otherwise.
LEVERAGE Ratio of debt to total assets.
LnAuditFee Natural log of audit fees (in INR). Source: ACE Equity database.
LnNonAuditFee Natural log of annual non-audit fees (in INR). Source: ACE Equity database.
LnSEG Natural log of the number of segments reported by client.
LOSS = 1 if client reports negative net income before extraordinary items; 0 otherwise.
M&A = 1 if client reports a merger or acquisition in the current year; 0 otherwise.
MISMATCH = 1 if there is a client/auditor mismatch following Shu (2000); 0 otherwise.
MTB Natural log of the ratio of the market to book value of equity.
QUICK The ratio of current assets (less inventories) to current liabilities.
ROA Net income before extraordinary items scaled by lagged assets.
SalesVolatility Standard deviation of sales (scaled by lagged total assets) over the current and
preceding two years.
SHORT =1 if auditor tenure is less than or equal to three years; 0 otherwise.
SIZE Natural log of total assets (in millions of INR).
TENURE Auditor tenure (in years). In the tables, the prefix Δ represents the year-to-year change in the variable.
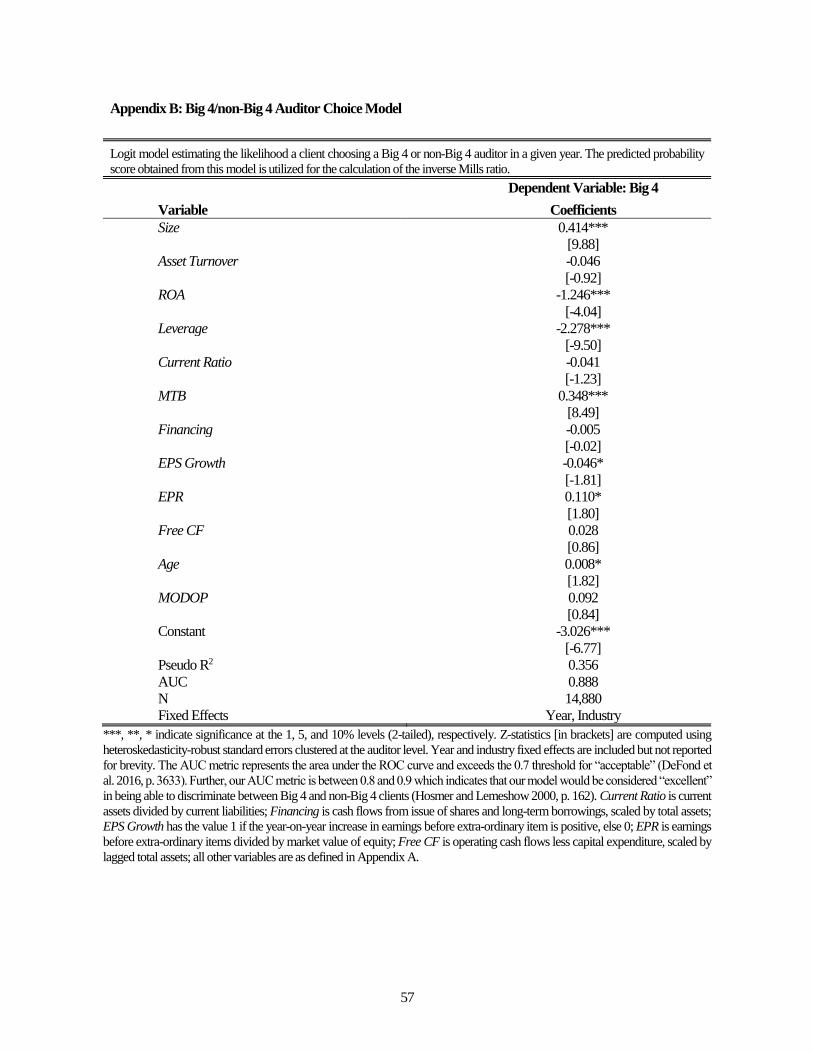
57
Appendix B: Big 4/non-Big 4 Auditor Choice Model
Logit model estimating the likelihood a client choosing a Big 4 or non-Big 4 auditor in a given year. The predicted probability
score obtained from this model is utilized for the calculation of the inverse Mills ratio.
Dependent Variable: Big 4
Variable Coefficients
Size 0.414***
[9.88]
Asset Turnover -0.046
[-0.92]
ROA -1.246***
[-4.04]
Leverage -2.278***
[-9.50]
Current Ratio -0.041
[-1.23]
MTB 0.348***
[8.49]
Financing -0.005
[-0.02]
EPS Growth -0.046*
[-1.81]
EPR 0.110*
[1.80]
Free CF 0.028
[0.86]
Age 0.008*
[1.82]
MODOP 0.092
[0.84]
Constant -3.026***
[-6.77]
Pseudo R2 0.356
AUC 0.888
N 14,880
Fixed Effects Year, Industry
***, **, * indicate significance at the 1, 5, and 10% levels (2-tailed), respectively. Z-statistics [in brackets] are computed using
heteroskedasticity-robust standard errors clustered at the auditor level. Year and industry fixed effects are included but not reported
for brevity. The AUC metric represents the area under the ROC curve and exceeds the 0.7 threshold for “acceptable” (DeFond et
al. 2016, p. 3633). Further, our AUC metric is between 0.8 and 0.9 which indicates that our model would be considered “excellent”
in being able to discriminate between Big 4 and non-Big 4 clients (Hosmer and Lemeshow 2000, p. 162). Current Ratio is current
assets divided by current liabilities; Financing is cash flows from issue of shares and long-term borrowings, scaled by total assets;
EPS Growth has the value 1 if the year-on-year increase in earnings before extra-ordinary item is positive, else 0; EPR is earnings
before extra-ordinary items divided by market value of equity; Free CF is operating cash flows less capital expenditure, scaled by
lagged total assets; all other variables are as defined in Appendix A.