does colonialism exert a long term economic impact on adult literacy?
TRANSCRIPT

8/12/2019 Does Colonialism Exert A Long Term Economic Impact On Adult Literacy?
http://slidepdf.com/reader/full/does-colonialism-exert-a-long-term-economic-impact-on-adult-literacy 1/24
QEH Working Paper Series – QEHWPS176 Page 1
Working Paper Number 176
Does Colonialism Exert A Long Term Economic Impact On Adult
Literacy?
Arusha Cooray*
Examining the reason for differences in adult literacy rates across countries, thisstudy finds that colonialism exerts a long term negative economic impact on literacyrates of the colonised. Investigating in particular, the effects of the French and
British colonisation policies, the results of this study indicate that the coloniallegacy remained long after independence, slowing down improvements in literacyrates in the former colonies. In conclusion it is noted that the implementation of
policies that will ensure equal access to education for all is important.
February 2009
* Corresponding author: Arusha Cooray, School of Economics, University of Wollongong, NorthfieldsAvenue, NSW 2522, Australia, Tel: 61-2-4221-4017, Email: [email protected]. This is paper waswritten while I was a visiting research fellow at Queen Elizabeth House, Oxford. I owe a specialacknowledgement to Zaki Wahhaj for the helpful discussions and insightful comments whichinfluenced my thinking in the direction of the topic covered in this study. I also wish to thank AndrewMilner of the Bodleian Library for help with access to data sources and Leelananda de Silva forhelpful comments. The funding provided to me by the Faculty of Commerce, University ofWollongong to undertake this research is gratefully acknowledged. I wish to thank in particular, SimonVille and Shirely Leitch for their support.

8/12/2019 Does Colonialism Exert A Long Term Economic Impact On Adult Literacy?
http://slidepdf.com/reader/full/does-colonialism-exert-a-long-term-economic-impact-on-adult-literacy 2/24
QEH Working Paper Series – QEHWPS176 Page 2
1. Introduction
This study offers a new perspective on the reason as to why some countries have lowliteracy rates. It is argued that certain colonial experiences have a long termeconomic impact on literacy. This connection may seem surprising given that it ismany years since colonial rule ended. This however, is consistent with the historicalevidence of that era, in which the legacy of colonialism led to large metropolitan-ruraldifferences in education. “…..in the colonial situation the school was detached fromindigenous cultures in the languages and the social values they taught. Colonialschools were set up as alternatives rather than complements to the colonized’seducational practices” (Altbach and Kelly 1978). Consequently this led to the
polarization of the masses with a small educated elite. This in turn implied that thetransfer of literacy by older generations to future generations was low, slowingdown improvements in literacy.
A large literature on literacy has been undertaken by UNESCO which views literacynot only as a positive outcome of the development process but also as an instrumentfor achieving social progress. The growing emphasis on the Millennium DevelopmentGoals (MDGs) and the objective of achieving education for all, has called attention tothe issue of literacy in the recent past. Among the studies undertaken on literacy arethose by Sundaram and Vanneman (2008) – literacy and gender, Cascio, Clark andGordon (2008) – literacy and assessment, Ortega and Rodriguez (2008) - literacy andgovernment policy in Venezuela, Maddox (2008) – literacy and human development,Finnie and Meng (2005) – literacy and labour market outcomes.
This study contributes to the literature by examining adult literacy from a historical
perspective. A literature has recently developed on the effects of colonialism on thesubsequent economic progress of the developing nations. Acemoglu et al . (2001) andBertocchi and Canova (2002) examine the effects of colonialism on economic growth,Engerman and Sokoloff (2002) and Angles (2007) the impact of colonialism oninequality in income, La Porta et al . (1999) emphasize the importance of colonialheritage as a determinant of the legal systems in countries, Grier (1999) shows thatthe identity and duration of the colonising power has a long term impact on economicgrowth. Alam (2000) examines the effects of sovereignty on literacy among othervariables such as exports, industry, years of schooling and economic growth. Heobserves that colonialism had a negative impact on all of these variables includingliteracy. Examining the colonial legacies of Britain, France and Spain, Grier notes that
a longer period of colonisation is better than a shorter period as it permits thecolonizer to establish institutions, infrastructure and educational systems in thecolony. Moreover, he shows that the level of education at the time of independenceexplains a large proportion of the divergence in development between the French andBritish colonies, with the British colonies performing better on the average.Acemoglu et al . show that different colonization policies pursued by the Europeansin different colonies have resulted in different institutions which have persisted to the
present.
The line of reasoning provided by this study is analogous to that of Acemoglu et al .Grier and Alam. The present study also suggests that the colonial legacy persistedeven after de-colonisation as in Acemoglu et al . and that different colonialexperiences led to differences in education and literacy as in Grier and Alam. The

8/12/2019 Does Colonialism Exert A Long Term Economic Impact On Adult Literacy?
http://slidepdf.com/reader/full/does-colonialism-exert-a-long-term-economic-impact-on-adult-literacy 3/24
QEH Working Paper Series – QEHWPS176 Page 3
objective of the present study is, in addition, to identify the literacy challenges facingcertain countries in the context of their colonial past and addresses the issue of howthey can be overcome. Post-colonial countries face particular challenges in, on the onehand, restoring their indigenous languages and on the other, facilitating thedevelopment of the languages introduced to them by former colonizers. In achieving
the objective of education for all, UNESCO has advocated an universal education policy for all countries. This study draws attention to the fact that education policymust be evaluated in the context of the colonial legacy and a ‘one size fit all’approach is not sufficient. This study finds that colonialism had a negative impact onliteracy. It should be noted that it is difficult to establish causal patterns in this type ofanalysis. Moreover, whether econometric cross-country estimation does justice to anissue as complex as colonialism is another question.
The paper is structured as follows. The following section presents the motivation forthe study. Section 3 states the hypothesis and describes the colonial legacy. Section 4describes the data. The model and empirical results are presented in Section 5.Section 6 provides a discussion of the results and conclusions are summarised in thelast Section.
2. Motivation
Per Capita Income, Government Expenditure and Adult LiteracyTheory states that a high ALR should be associated with a high per capita income(UNESCO 1957, Verner 2005). In 1950, UNESCO found that of 16 countries withlow illiteracy rates, all except for Japan had relatively high per capita incomes.Therefore, per capita income is included as an explanatory variable in the empirical
analysis that follows. Fi gure 1 depicts the relationship between the ALR in 2005 andGDP per capita in 1990 1. An examination of the data confirms the prediction thatthere exists a positive association between adult literacy and GDP per capita.
Although this preliminary analysis suggests that a high per capita income is associatedwith a high ALR, many of the South Asian, West African and some of the MiddleEastern economies fall below the regression represented by the fitted line in Figure 1.
1 Note that GDP per capita in 1990 is used for the preliminary analysis as data for the countries that belonged to the former Soviet Union are not available for 1950.

8/12/2019 Does Colonialism Exert A Long Term Economic Impact On Adult Literacy?
http://slidepdf.com/reader/full/does-colonialism-exert-a-long-term-economic-impact-on-adult-literacy 4/24
QEH Working Paper Series – QEHWPS176 Page 4
Algeria
BahrainIranJordan Libya
Morocco
OmanSaudi ArabiaSyriaTunisia
UAE
Yemen
Albania BelarusEstoniaLatviaLithuania USSRUkraine Armenia Azerbaijan KazakstanKyrgyzstanMongoliaTajikistan
Turkey
Turkmenistan
Cambodia
China Indonesia
Japan
Lao
MalaysiaP hilippines Thailand
Bangladesh
India
Maldives
NepalPakistan
Sri Lanka
Benin
Botswana
Chad
Comoros
Congo
GhanaMalawi
Mauritania
Mauritius
Niger
NigeriaRwanda
SenegalSierra Leone
South Africa
Sudan
Swaziland
Tanzania
Togo
UgandaZambia
Zimbab we
Argentina
Bolivia BrazilChileColombia
Cuba
Dominican RepublicEcuador
Guatemala
JamaicaNicaragua
PanamaPara guayPeru
Trinidad and TobagoUruguay Australia AustriaBelgiumCanadaDenmarkFranceItalyNetherlandsNew Z ealandNorwaySwedenSwitzerlandUnited KingdomUnited States
3
3 . 5
4
4 . 5
5
6 7 8 9 10Log GDP Per Capita 1990
Log Adult Literacy Rate 2005 Fitted values
Figure 1: Adult Literacy Rate 2005 and GDP Per Capita 1990
Note: The regression represented by the fitted line reports a coefficient of 0.18 (Robust SE = 0.03), N= 93, R 2 = 0.37 from a regression of log ALR 2005 on log per capita income 1990.
Removing the influence of the level of GDP per capita, Figure 2 plots the error termfrom the above equation on government expenditure on education as a % of GDP.
Cascio et al . (2008) show that the supply of education depends upon the degree ofgovernment involvement. According to them, the higher the proportion ofexpenditure by the government on education, the greater will be the supply leading toincreases in literacy. An interesting observation emerges from this Figure. The resultsindicate that the residuals from the first equation are also not explained bygovernment expenditure for the same group of countries. Of course, other factors inaddition to per capita income and investment in education influence the adult literacyrate. These other factors appear to have played a relatively large role in South Asia,Africa and the Middle East.

8/12/2019 Does Colonialism Exert A Long Term Economic Impact On Adult Literacy?
http://slidepdf.com/reader/full/does-colonialism-exert-a-long-term-economic-impact-on-adult-literacy 5/24
QEH Working Paper Series – QEHWPS176 Page 5
AlgeriaBahrain
IranJordan
Libya
Morocco
Oman Saudi Arabia
SyriaTunisia
UAE
Yemen
Albania
BelarusEstoniaLatvia
Lithuania
USSR
Ukraine
Armenia Azer baijanKazakstan
Kyrgyzstan MongoliaTajikistan
Turkey
Turkmenistan
Cambodia
ChinaIndonesia
JapanLao Malaysia
Philippines
Thailand
Bangladesh
India
Maldives
Nepal
Pakistan
Sri Lanka
Benin
Botswana
Chad
ComorosCongo
Ghana
Malawi
Mauritania
Mauritius
Niger
Nigeria Rwanda
SenegalSierra Leon e
South AfricaSwaziland
Tanzania
Togo
UgandaZambia
Zimbabwe
Argentina
Bolivia
BrazilChileColombia
Cuba
Dominican RepublicEcuador
Guatemala
JamaicaNicaraguaPanama
ParaguayPeru
Trinidad and TobagoUruguay
Australia AustriaBelgiumCanada DenmarkFranceItaly NetherlandsNew Zealand
NorwaySwedenSwitzerlandUnited Kin gdom
United States
- 1
- . 5
0
. 5
0 .5 1 1.5 2 2.5Log Public Expenditure on Education as % of GDP 1990
Residual Fitted values
Figure 2: Adult Literacy Rate 2005 and Public Expenditure on Education as % of GDP 1990
Note: The regression represented by the fitted line reports a coefficient of 0.18 (Robust SE = 0.06), N= 97, R 2 = 0.09 from a regression of log ALR 2005 on log public expenditure on education as % GDP1990.
As a step towards understanding the reason for this in a country specific context, thenext section examines the effects of the colonial legacy.
3. The Hypothesis
This study hypothesises that different colonial experiences have led to differences inadult literacy rates across countries. It is useful at this stage to define the concept ofcolonialism as meant by this study. “Colonialism” is defined as those countries that,although independent of a former colonising power, are still bound by the politicaland social structures imposed on them by a ruling elite originating from the colonising
power. Based upon Acemoglu et al . this theory relies on the assumptions that:1) Different colonization policies led to differences in education systems acrossregions/ countries. For example, the British colonisation policies of Asia and Africadiffered from the French colonisation policies of Africa and the Spanish and Russiancolonisation policies (discussed below).2) The colonial legacy remained long after independence.‘The result has been internal, indigenous colonialism, under which the Western-oriented, urban-centred, governmental and managerial class dominates and exploitsthe rural villagers, who lack Western education and, thus, political power to makethemselves felt (Mugomba and Nyaggah 1977).
8/12/2019 Does Colonialism Exert A Long Term Economic Impact On Adult Literacy?
http://slidepdf.com/reader/full/does-colonialism-exert-a-long-term-economic-impact-on-adult-literacy 6/24
QEH Working Paper Series – QEHWPS176 Page 6
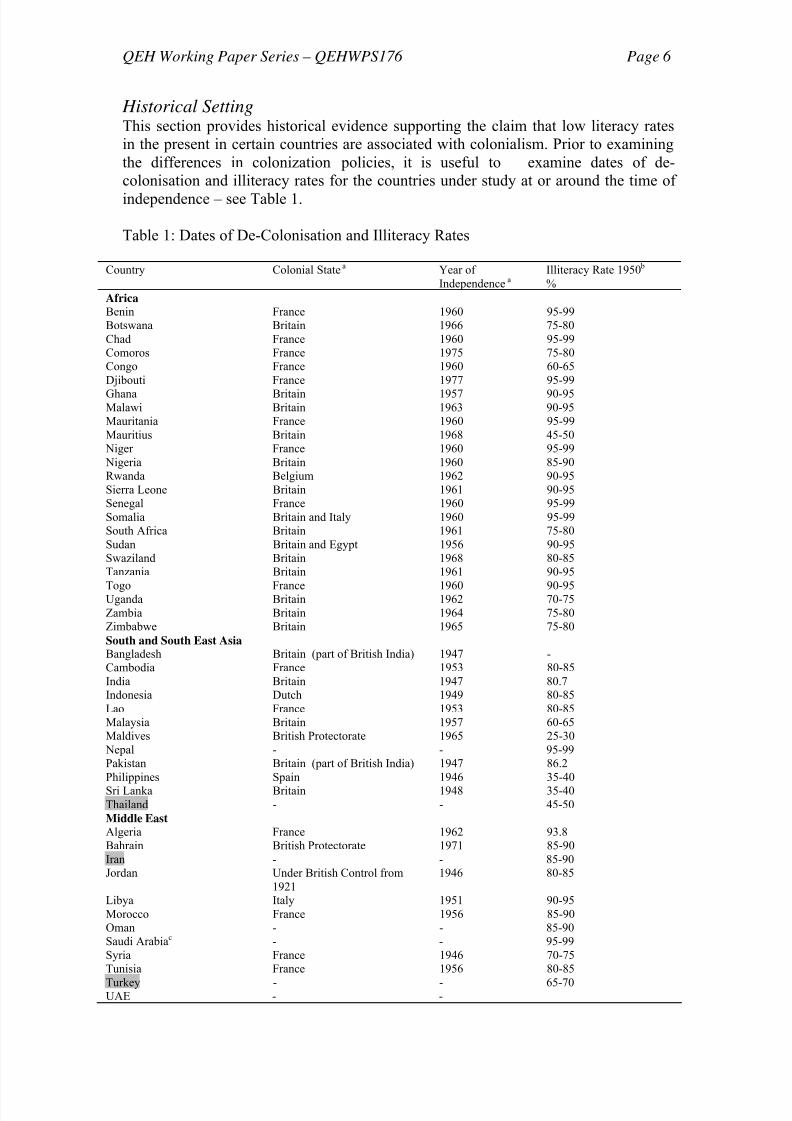
Historical SettingThis section provides historical evidence supporting the claim that low literacy ratesin the present in certain countries are associated with colonialism. Prior to examiningthe differences in colonization policies, it is useful to examine dates of de-colonisation and illiteracy rates for the countries under study at or around the time ofindependence – see Table 1.
Table 1: Dates of De-Colonisation and Illiteracy Rates
Country Colonial State a Year ofIndependence a
Illiteracy Rate 1950 b %
AfricaBenin France 1960 95-99Botswana Britain 1966 75-80Chad France 1960 95-99Comoros France 1975 75-80Congo France 1960 60-65Djibouti France 1977 95-99Ghana Britain 1957 90-95Malawi Britain 1963 90-95Mauritania France 1960 95-99Mauritius Britain 1968 45-50
Niger France 1960 95-99 Nigeria Britain 1960 85-90Rwanda Belgium 1962 90-95Sierra Leone Britain 1961 90-95Senegal France 1960 95-99Somalia Britain and Italy 1960 95-99South Africa Britain 1961 75-80Sudan Britain and Egypt 1956 90-95Swaziland Britain 1968 80-85Tanzania Britain 1961 90-95
Togo France 1960 90-95Uganda Britain 1962 70-75Zambia Britain 1964 75-80Zimbabwe Britain 1965 75-80South and South East AsiaBangladesh Britain (part of British India) 1947 -Cambodia France 1953 80-85India Britain 1947 80.7Indonesia Dutch 1949 80-85Lao France 1953 80-85Malaysia Britain 1957 60-65Maldives British Protectorate 1965 25-30
Nepal - - 95-99Pakistan Britain (part of British India) 1947 86.2Philippines Spain 1946 35-40Sri Lanka Britain 1948 35-40Thailand - - 45-50Middle EastAlgeria France 1962 93.8Bahrain British Protectorate 1971 85-90Iran - - 85-90Jordan Under British Control from
19211946 80-85
Libya Italy 1951 90-95Morocco France 1956 85-90Oman - - 85-90Saudi Arabia c - - 95-99Syria France 1946 70-75Tunisia France 1956 80-85
Turkey - - 65-70UAE - -

8/12/2019 Does Colonialism Exert A Long Term Economic Impact On Adult Literacy?
http://slidepdf.com/reader/full/does-colonialism-exert-a-long-term-economic-impact-on-adult-literacy 7/24
QEH Working Paper Series – QEHWPS176 Page 7
Yemen British controlled South part ofYemen
1967 95.99
South America and the WestIndiesArgentina Spain 1816 13.6Bolivia Spain 1825 67.9Brazil Portugal 1822 50.6Chile Spain 1818 19.9Colombia Spain 1819 45-50Cuba Spain 1898 20-25Dominican Republic Spain and Haiti 1821, 1844 55-60Ecuador Spain 1822 44.3Guatemala - - 70.6
Nicaragua Spain 1838 61.6Panama Spain 1811 30-35Trinidad & Tobago Britain 1962 26.2Uruguay Spain 1830 15-20Eastern EuropeAlbania - -Belarus Soviet Union 1991Bulgaria - - 20-25
Croatia Yugoslavia 1991 27.2f
Estonia Soviet Union 1991Latvia Soviet Union 1991Lithuania Soviet Union 1991Poland d - -USSR e - - 5-10Slovania Yugoslavia 1991 27.2 f Central AsiaArmenia Soviet Union 1991Azerbaijan Soviet Union 1991China - - 50-55Kazakstan Soviet UnionKyrgyztan Soviet Union 1991Mongolia Soviet Union 1924Tajikistan Soviet UnionTurkmenistan Soviet UnionHigh Income OECDAustralia - - 3.3Austria - - 1-2Belgium - - 3-4Canada - - 2-3Denmark - - 1-2France - - 3.6Germany - - 1-2Italy - - 10-15Japan - - 2-3
Netherlands - - 1-2 New Zealand - - 1-2 Norway - - 1-2Sweden - - 1-2Switzerland - - 1-2United Kingdom - - 1-2United States - - 3-4
Sources: a: Freedom House: http://www.freedomhouse.org/template.cfm?page=35&year=2005 (downloaded November 2008).
b: UNESCO (1957) World Illiteracy at Mid-Century: A Statistical Study, Geneva. Note Ghana formerly called Togoland, Congo – Belgian Congo, Malawi - Nyasaland, Rwanda -Ruanda, Somalia – Somaliland, Djbouti – French Somaliland, Togo – Togoland, Tanzania –Tanganyika, , and Mauritania, Senegal, Niger Benin part of former French West Africa . Bangladesh
part of East Pakistan until 1972.c: Saudi Arabia’s foreign policy was under the control of the British until 1971d: A Soviet satellite state until 1989.
e: Figure for 20 countries.f: Figure for Yugoslavia
8/12/2019 Does Colonialism Exert A Long Term Economic Impact On Adult Literacy?
http://slidepdf.com/reader/full/does-colonialism-exert-a-long-term-economic-impact-on-adult-literacy 8/24
QEH Working Paper Series – QEHWPS176 Page 8
The evidence presented in Table 1 suggests that it is not unreasonable to infer thatcolonialism had some effect on the education systems and literacy rates of the Asian,African and Middle Eastern countries. The figures in the last column depict the extentof illiteracy at independence or immediately prior to independence in Africa, theMiddle East and South and South East Asia. The countries that were British and
French colonies, and Rwanda which was a Belgian colony exhibit very high rates ofilliteracy compared to the Spanish colonies. The countries that were part of the formerSoviet Union and Yugoslavia perform well.
The British and French Education PoliciesBoth colonial powers were driven by economic gain. However, historical evidencesuggests that under French colonialism the requirement for teaching French wasarticulated very differently to the need for teaching English under British colonialism.According to Grier, “ Very few Africans received the benefits of a colonial educationand those that did were isolated and alienated from their original cultures….Studentswere required to speak French and all vernacular languages were forbidden, whichresulted in large numbers of the population receiving any kind of literacy.” Corbett(1972), further states that by the end of the 1960s, over 95% of the population inFrances former African colonies were illiterate. This is evidenced by the statistics
presented in Table 1. Taking the case of Algeria for example, at the time ofindependence only 3% of Algerians were literate in Literary Arabic due to the gradual
phasing out of Arabic teaching schools in the first forty years of the French rule andreplacing them with French teaching schools (Gallagher 1968, Khanna 2008). TheFrench were more rigid with regard to the establishment and expansion of schools incontrast to the British who adopted a more laissez faire policy.
The British were concerned with educating a minority who could mediate betweenthe British ruling class and the natives. In British India for example, Chaudhary(2007) shows that while the British recognized the need to improve the levels ofschooling, it was aimed at a small minority (the Brahmans or higher castes) andhence failed to increase literacy among the overall population. Chaudhary furthernotes that according to the census of 1911 in India, almost 30 percent of Brahmanswere able to read and write as compared to less than 2 percent of lower castes andaboriginal tribes. This gap in literacy between the Brahmans and lower castes has
persisted to date with the literacy estimates from the census of 1991, showing that theaverage literacy rate in India for the former lower castes and aboriginal tribes beingwell below the national average, 37 percent and 30 percent respectively as compared
to the average literacy rate in India of 52 percent.
Under the French rule, schools were controlled and run by the government, whereasunder the British rule Christian missionaries were responsible for the establishmentand expansion of schools. Not only were there fewer schools, they were also of lowerquality in terms of trained teachers in the French colonies than in the British colonies.“In 1934 in French West Africa there were 265 government village schools and 13urban schools, usually with only one teacher…..” (Crowder 1970). Crowder furthernotes that there were less than six hundred pupils at government secondary and post-secondary schools in French West Africa in 1934. British West Africa had a betterrecord comparatively, however, the numbers at school were also very small. InGambia only 0.5% of children of school going age attended school in 1938 and in

8/12/2019 Does Colonialism Exert A Long Term Economic Impact On Adult Literacy?
http://slidepdf.com/reader/full/does-colonialism-exert-a-long-term-economic-impact-on-adult-literacy 9/24
QEH Working Paper Series – QEHWPS176 Page 9
Sierra Leone only 9,828 children attended school out of a school going age cohort of9,828. These statistics show how low the priority given to education was by thecolonial governments.
Colonial LegacyThese policies had opposing effects on the subsequent development of indigenouslanguages, for example, the Yoruba language spoken by those in Nigeria and Benin(formerly Dahomey). In Benin which was a French colony, Yoruba names were castin French spellings which changed both the pronunciation of the words and theirmeanings 2 . In Nigeria which was a British colony Yoruba was officially recognised.Consequently, the elite in Benin were literate only in French while their Nigeriancounterparts spoke in both Yoruba and English. This created problems for the Yorubacommunity on the Benin-Nigeria boundary as they could not communicate with oneanother. This problem assumed greater proportions after independence (Asiwaju2001).
In British India, the English language continues to be viewed as the path toemployment and upward mobility. Educational policy continues to reflect theobjectives of the elite with rural-urban disparities and geographic inequality of accessto education.
Other Colonial PoliciesLatin America like Africa and Asia was subject to European colonialism. The de-colonisation of the Latin American countries occurred in the early 19 th century (seeTable 1) and by the mid 19 th century illiteracy was still above 90%. The last columnof Table 1 provides figures for illiteracy rates in 1950. Except in the case of
Argentina, Cuba and Uruguay, the numbers for the rest of the countries remain veryhigh even 100-130 years after independence. As pointed out by Grier and Acemogluet al. the Spanish colonisation policy was extractive as well. Despite the fact thatthese countries have been marred by political instability and violence sinceindependence, education has been acknowledged as necessary for the overalldevelopment of the region in the past 100 years or so. These countries in accordancewith the UNESCO Charter have introduced a compulsory universal primary education
programme under which primary education is provided free of charge. Twelve ofthe nineteen Latin American republics devoted over half of total public expenditure to
primary education in the years up to 1960 which has led to large increases in primaryschool enrolments (Gale 1969).
As opposed to other colonizers, the Soviet Union provided universal primaryeducation to all children irrespective of income or region. High priority was placed bythe government to investment in education. Unfortunately many of the Soviet breakaway states are finding it difficult to maintain these standards amid growing economichardship. For example investment in education has dropped in Tajikistan from 9.7%in 1990 to 3.5% in 2005 and Khazakstan from3.2% to 2.3% in the same period(UNESCO 2008).
2 Words such as Sabe, Ketu, Ohori came to be known as Save, Ketou, Holli respectively. Personalnames were similarly transformed (Asiwaju 2001).

8/12/2019 Does Colonialism Exert A Long Term Economic Impact On Adult Literacy?
http://slidepdf.com/reader/full/does-colonialism-exert-a-long-term-economic-impact-on-adult-literacy 10/24
QEH Working Paper Series – QEHWPS176 Page 10
The focus of this analysis however, is on the countries that currently face low literacyrates. These are countries that were former colonies of the British and French.
4. Data
Data sources are provided in the data appendix. The sample comprises 100 countriescovering South and East Asia, South America, Central Asia and Eastern Europe,Africa and Western Europe. The model is tested by using data for 1950, 1990, and2005. The ALR in 2005 is the dependent variable. The change in ALR 1950-2005 isalso considered. Given the arguments above, per capita income and governmentexpenditure on education are included as explanatory variables. Per capita income isPPP adjusted. Government expenditure on education is not available for manycountries for 1950. Therefore the 1990 value is used (as it is available in this year forthe countries of the former Soviet Union). Overseas development aid, the enrolmentratio, employment in industry as a percentage of total employment and a democracyindex are used as control variables. Given that the increase in bi-lateral aid toeducation almost trebled between 1998 and 2003 (UNESCO 2005), overseasdevelopment aid for 1998 is added as an explanatory variable. The primary enrolmentratio has been found to positively affect the literacy rate and is therefore included as acontrol variable (UNESCO 1957, Verner 2005). Kim and Park (2008) show thatSouth Koreas rapid industrialisation under the Japanese colonial regime led to itseconomic progress. Moreover, UNESCO (1957) shows that countries that are moreindustrialised have higher rates of literacy and Alam (2000) finds a positive relation
between sovereignty and industrialisation. Therefore employment in industry as a %of total employment is also included in the regression analysis. Recently a literature
has developed on democracy and economic growth (Acemoglu et al . 2008, Barro1999, Easterly and Levine 2003). Therefore the democracy index from the Polity IVProject for 2005 is also considered as an explanatory variable. This index takes on avalue of 0-10 with 0 representing a zero level of democracy and 10 representing thehighest level of democracy.
Table 2 reports summary statistics for the main variables used in the study.Table 2: Summary Descriptive Statistics
Variable Obs. Mean StandardDeviation
Minimum Maximum
Full SampleGDP per capita (in $) 1950 65 804.97 1,871.15 67.2 15,161GDP per capita (in $) 2005 99 10,813.1 11,070.12 667 41,890Adult Literacy Rate (% aged 15years and older) 1950
90 47.05 35.50 2.5 98.5
Adult Literacy Rate (% aged 15years and older) 2005
100 82.80 19.72 25.7 99.9
Government Spending onEducation (as percent of GDP)1990
81 4.25 1.94 1 10.6
Government Spending onEducation (as percent of GDP)2005
98 4.49 1.89 0.9 9.6
a: Includes Africa, South and South East Asia, Central Asia and Eastern Europe, Latin America. Allcountries listed as colonies in Table 1.Sources: See Appendix
8/12/2019 Does Colonialism Exert A Long Term Economic Impact On Adult Literacy?
http://slidepdf.com/reader/full/does-colonialism-exert-a-long-term-economic-impact-on-adult-literacy 11/24
QEH Working Paper Series – QEHWPS176 Page 11
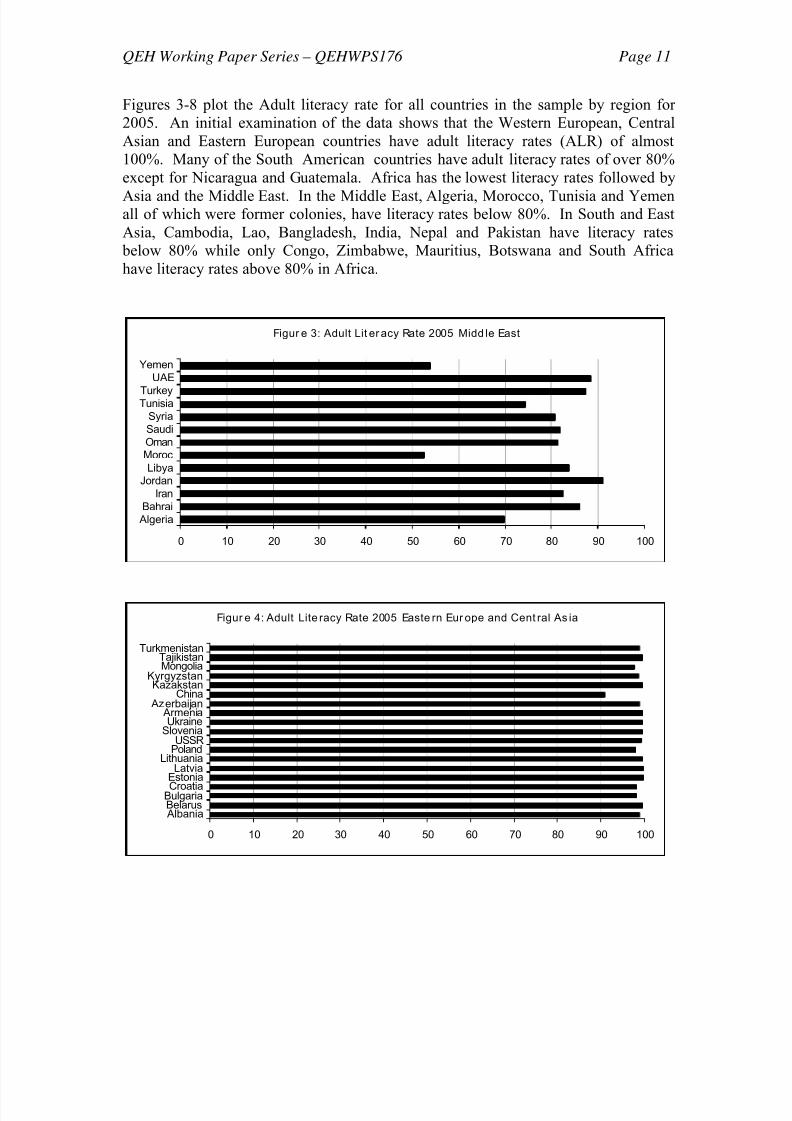
Figures 3-8 plot the Adult literacy rate for all countries in the sample by region for2005. An initial examination of the data shows that the Western European, CentralAsian and Eastern European countries have adult literacy rates (ALR) of almost100%. Many of the South American countries have adult literacy rates of over 80%except for Nicaragua and Guatemala. Africa has the lowest literacy rates followed by
Asia and the Middle East. In the Middle East, Algeria, Morocco, Tunisia and Yemenall of which were former colonies, have literacy rates below 80%. In South and EastAsia, Cambodia, Lao, Bangladesh, India, Nepal and Pakistan have literacy rates
below 80% while only Congo, Zimbabwe, Mauritius, Botswana and South Africahave literacy rates above 80% in Africa.
Figur e 3: Adult Lit er acy Rate 2005 Midd le East
0 10 20 30 40 50 60 70 80 90 100
AlgeriaBahrai
IranJordan
LibyaMorocOmanSaudiSyria
TunisiaTurkey
UAEYemen
Figur e 4: Adult Lite racy Rate 2005 Easte rn Eur ope and Cent ral As ia
0 10 20 30 40 50 60 70 80 90 100
AlbaniaBelarusBulgariaCroatiaEstonia
LatviaLithuania
PolandUSSR
SloveniaUkraine
Armenia Azerbaijan
ChinaKazakstan
KyrgyzstanMongoliaTajikistan
Turkmenistan

8/12/2019 Does Colonialism Exert A Long Term Economic Impact On Adult Literacy?
http://slidepdf.com/reader/full/does-colonialism-exert-a-long-term-economic-impact-on-adult-literacy 12/24
QEH Working Paper Series – QEHWPS176 Page 12
Figur e 5: Adult L iter acy Rate 2005 Sout h and East A si a
0 10 20 30 40 50 60 70 80 90 100
CambodiaIndonesia
LaoMalaysia
PhilippinesThailand
BangladeshIndia
MaldivesNepal
PakistanSri Lanka
Figur e 6: Adult L iter acy Rate 2005 Afr ica
0 10 20 30 40 50 60 70 80 90 100
BeninBotsw anaChad
ComorosCongo
DjiboutiGhanaMalawi
MauritaniaMauritius
Niger Nigeria
Rw andaSenegal
Sierra LeoneSomalia
South Af ricaSudan
Sw azilandTanzania
TogoUgandaZambia
Zimbabw e
Figure 7: Adult L iteracy Rate 2005 Latin America
0 10 20 30 40 50 60 70 80 90 100
ArgentinaBolivia
BrazilChile
ColombiaCuba
Dominican RepublicEcuador
GuatemalaJamaica
NicaraguaPanama
ParaguayPeru
Trinidad and TobagoUruguay

8/12/2019 Does Colonialism Exert A Long Term Economic Impact On Adult Literacy?
http://slidepdf.com/reader/full/does-colonialism-exert-a-long-term-economic-impact-on-adult-literacy 13/24
QEH Working Paper Series – QEHWPS176 Page 13
Figu re 8: Adu lt L ite racy Rate 2005 High Incom e OECD
0 10 20 30 40 50 60 70 80 90 100
Australia AustriaBelgiumCanada
DenmarkFrance
GermanyItaly
JapanNetherlandsNew Zealand
Norw aySw eden
Sw itzerlandUnited Kingdom
United States
Source: UNESCO: http://stats.uis.unesco.org/unesco/ReportFolders/ReportFolders.aspx (downloaded
November 2008).
5. Empirical Estimation
Having provided the justification for the use of certain variables in the estimation inSection 4, the following model will be the basis of this study:
log ALR it = α + η log ALR it-1 + γ log Y it-1 + φ log G it-1 + x i-1t + δ d + ε (1)
where ALR it is the adult literacy rate (ALR) in country i in period t. The adult literacyrate in 2005 is the measure of economic outcome. The lagged value of the ALR in
1950, is included as an explanatory variable to test the degree of persistence in adultliteracy (see Acemoglu et al . 2008) 3. This variable would help to identify if the ALRin 1950 explains the ALR in 2005. Y i-1 denotes the lagged value of GDP per capita.G it-1 represents government expenditure on education as a % of GDP. All othercontrol variables are captured by the vector x i-1 t. These variables include, overseasdevelopment aid (ODA), the primary enrolment ratio, employment in industry as a
percentage of total employment and a democracy index. The variable of interest isthe colonial dummy variable, d . Two colonial dummies are defined for Britain andFrance with the rest of the countries, “other”, as the benchmark group. The model isalso estimated in first differences.
Some simple regressions are estimated to confirm the idea that colonialismcontributed significantly to lower adult literacy rates in the French and Britishcolonies. A common problem encountered in this type of model is endogeneity. Thiscould occur if the exogenous variables were also a function of adult literacy, givingrise to OLS estimates that are biased and inconsistent. In order to correct for anyendogeneity bias that may be present in the models, the equations are also estimatedusing the General Method of Moments (GMM). OLS and GMM estimates for thesample are presented in Table 3. The dependent variable is the ALR in 2005.
3
Using the same analogy as Acemoglu et al. (2008) who include the lagged value of the democracyscore of a country on the right hand side of the equation to capture the degree of persistence indemocracy and mean reversion.
8/12/2019 Does Colonialism Exert A Long Term Economic Impact On Adult Literacy?
http://slidepdf.com/reader/full/does-colonialism-exert-a-long-term-economic-impact-on-adult-literacy 14/24
QEH Working Paper Series – QEHWPS176 Page 14
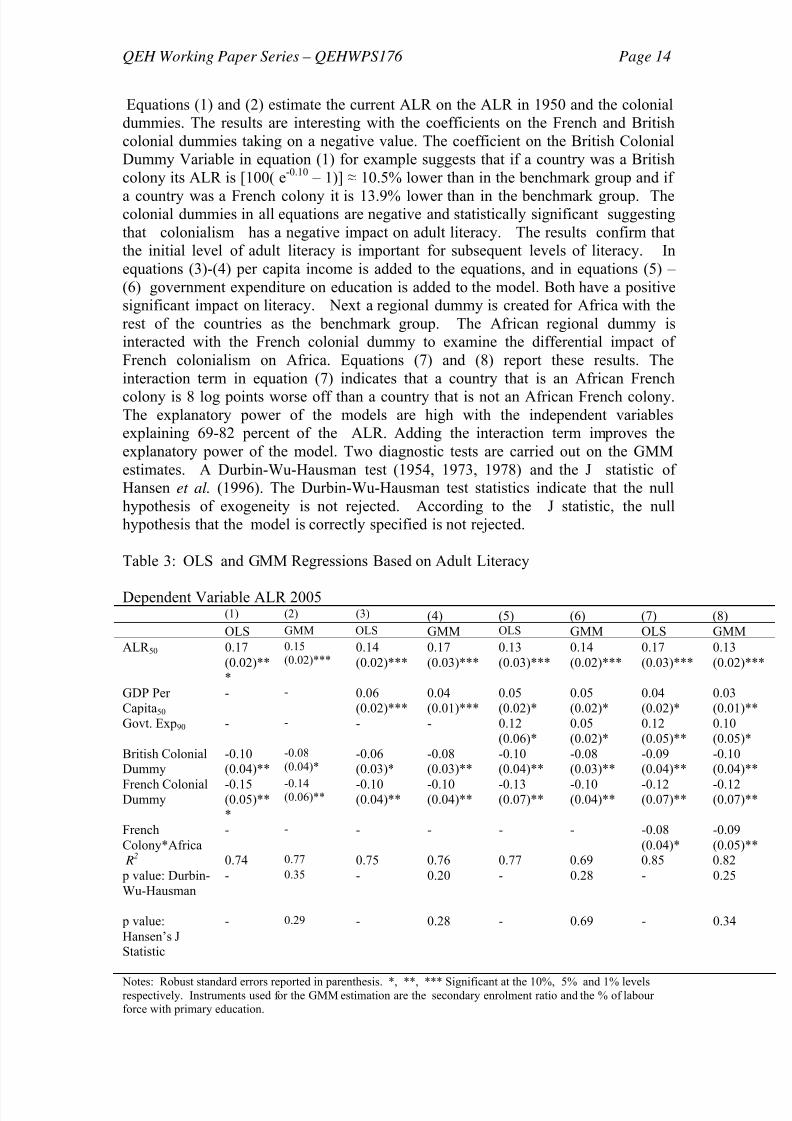
Equations (1) and (2) estimate the current ALR on the ALR in 1950 and the colonialdummies. The results are interesting with the coefficients on the French and Britishcolonial dummies taking on a negative value. The coefficient on the British ColonialDummy Variable in equation (1) for example suggests that if a country was a Britishcolony its ALR is [100( e -0.10 – 1)] ≈ 10.5% lower than in the benchmark group and if
a country was a French colony it is 13.9% lower than in the benchmark group. Thecolonial dummies in all equations are negative and statistically significant suggestingthat colonialism has a negative impact on adult literacy. The results confirm thatthe initial level of adult literacy is important for subsequent levels of literacy. Inequations (3)-(4) per capita income is added to the equations, and in equations (5) – (6) government expenditure on education is added to the model. Both have a positivesignificant impact on literacy. Next a regional dummy is created for Africa with therest of the countries as the benchmark group. The African regional dummy isinteracted with the French colonial dummy to examine the differential impact ofFrench colonialism on Africa. Equations (7) and (8) report these results. Theinteraction term in equation (7) indicates that a country that is an African Frenchcolony is 8 log points worse off than a country that is not an African French colony.The explanatory power of the models are high with the independent variablesexplaining 69-82 percent of the ALR. Adding the interaction term improves theexplanatory power of the model. Two diagnostic tests are carried out on the GMMestimates. A Durbin-Wu-Hausman test (1954, 1973, 1978) and the J statistic ofHansen et al. (1996). The Durbin-Wu-Hausman test statistics indicate that the nullhypothesis of exogeneity is not rejected. According to the J statistic, the nullhypothesis that the model is correctly specified is not rejected.
Table 3: OLS and GMM Regressions Based on Adult Literacy
Dependent Variable ALR 2005(1) (2) (3) (4) (5) (6) (7) (8)OLS GMM OLS GMM OLS GMM OLS GMM
ALR 50 0.17(0.02)***
0.15(0.02)***
0.14(0.02)***
0.17(0.03)***
0.13(0.03)***
0.14(0.02)***
0.17(0.03)***
0.13(0.02)***
GDP PerCapita 50
- - 0.06(0.02)***
0.04(0.01)***
0.05(0.02)*
0.05(0.02)*
0.04(0.02)*
0.03(0.01)**
Govt. Exp 90 - - - - 0.12(0.06)*
0.05(0.02)*
0.12(0.05)**
0.10(0.05)*
British ColonialDummy
-0.10(0.04)**
-0.08(0.04)*
-0.06(0.03)*
-0.08(0.03)**
-0.10(0.04)**
-0.08(0.03)**
-0.09(0.04)**
-0.10(0.04)**
French ColonialDummy
-0.15(0.05)***
-0.14(0.06)** -0.10(0.04)**
-0.10(0.04)**
-0.13(0.07)**
-0.10(0.04)**
-0.12(0.07)**
-0.12(0.07)**
FrenchColony*Africa
- - - - - - -0.08(0.04)*
-0.09(0.05)**
R2 0.74 0.77 0.75 0.76 0.77 0.69 0.85 0.82 p value: Durbin-Wu-Hausman
- 0.35 - 0.20 - 0.28 - 0.25
p value:Hansen’s JStatistic
- 0.29 - 0.28 - 0.69 - 0.34
Notes: Robust standard errors reported in parenthesis. *, **, *** Significant at the 10%, 5% and 1% levelsrespectively. Instruments used for the GMM estimation are the secondary enrolment ratio and the % of labourforce with primary education.

8/12/2019 Does Colonialism Exert A Long Term Economic Impact On Adult Literacy?
http://slidepdf.com/reader/full/does-colonialism-exert-a-long-term-economic-impact-on-adult-literacy 15/24
QEH Working Paper Series – QEHWPS176 Page 15
Table 4 reports results for the change in adult literacy rate over the 1950 to 2005 period. The initial level of adult literacy is negative and statistically significant in allequations suggesting that countries starting off with lower levels of literacy areimproving at a faster rate. As before, the colonial dummies are negative andsignificant. The coefficients on the colonial dummy variables in equation (2) for
example indicate that the ALR in a country that was a British colony is [100(e-0.09
–1)] ≈ 8.6% lower than in the benchmark group and the ALR in a French colony is13.01% lower. Both the change in income and government expenditure have a
positive effect on the change in adult literacy. The explanatory power of the modelsare 0.97. The results strongly support the argument that colonialism exerts a negativeeffect on adult literacy.
Table 4: OLS and GMM Regressions Based on the Change in Adult Literacy
Dependent Variable ΔALR 1990-2005(1) (2) (3) (4) (5) (6) (7) (8)OLS GMM OLS GMM OLS GMM OLS GMM
ALR 50 -0.83(0.10)***
-0.84(0.02)***
-0.80(0.02)***
-0.82(0.02)***
-0.81(0.02)***
-0.83(0.02)***
-0.80(0.02)***
-0.84(0.02)***
ΔGDP PerCapita 50-05
- - 0.02(0.02)
0.04(0.04)
0.03(0.02)
0.04(0.02)*
0.02(0.02)
0.03(0.01)**
ΔGovt. Exp 90-05 - - - - 0.05(0.03)*
0.06(0.05)
0.02(0.01)*
0.04(0.04)
British ColonialDummy
-0.10(0.04)**
-0.09(0.04)*
-0.04(0.01)***
-0.07(0.04)*
-0.05(0.02)**
-0.09(0.04)**
-0.09(0.04)**
-0.08(0.02)***
French ColonialDummy
-0.14(0.03)***
-0.14(0.06)**
-0.14(0.04)***
-0.11(0.07)*
-0.12(0.04)***
-0.08(0.03)**
-0.07(0.03)**
-0.14(0.05)***
Africa *FrenchColony
- - - - - - -0.13(0.04)***
-0.12(0.04)***
p Value: JointSt. Significancefor Region
- - - - - - - -
R2 0.97 0.97 0.97 0.97 0.97 0.97 0.97 0.97 p value: Durbin-Wu-Hausman
- 0.23 - 0.15 - 0.14 - 0.16
p value:Hansen’s JStatistic
- 0.34 - 0.25 - 0.22 - 0.19
Notes: Robust standard errors reported in parenthesis. *, **, *** Significant at the 10%, 5% and 1% levelsrespectively. Instruments used for the GMM estimation are the secondary enrolment ratio and the % of labourforce with primary education.
Robustness Checks A number of tests are carried out to check if the results obtained above are robust tothe estimation procedure and use of alternative variables.
GMM EstimationThe study has been carried out using GMM estimation in addition to OLS to correct
for any potential endogenity bias (explained above) – see Tables 3 and 4. It can beargued that the results are robust to the estimation technique. The Durbin-Wu-

8/12/2019 Does Colonialism Exert A Long Term Economic Impact On Adult Literacy?
http://slidepdf.com/reader/full/does-colonialism-exert-a-long-term-economic-impact-on-adult-literacy 16/24
QEH Working Paper Series – QEHWPS176 Page 16
Hausman test suggests the absence of any statistically significant difference betweenthe OLS and GMM estimates and the J statistic of Hansen suggests that theinstruments used are valid.
Robust Regression
According to Temple (1998), outliers that arise from measurement error, omittedvariables or parameter heterogeneity can bias the results of parameter estimates.Therefore in order to address the issue of omitted variables and influential outliers,the equations are re-estimated using the robust regression technique which givesminimum weight to outlying observations. The results are reported in Table 5. Theestimates are consistent with the OLS and GMM estimates suggesting that theestimates are not unduly influenced by influential outliers. The colonial dummywhich is the variable of interest continues to take a negative value.
Table 5: Robust Regression (1) (2) (3) (4) (5) (6)
Dependent Variable ALR 2005 Dependent Variable ΔALR19 1950-2005 ALR 50 0.16
(0.004)***0.16(0.004)***
0.15(0.004)***
-0.83(0.003)***
-0.83(0.003)***
-0.83(0.003)***
GDP PerCapita 50
- 0.04(0.02)*
0.06(0.03)*
- -
Govt. Exp 90 - - 0.01(0.01)
- - -
ΔGDP PerCapita 50-05
- - - - 0.008(0.004)*
0.006(0.005)
ΔGovt. Exp 90-05 - - - - - 0.005(0.004)
British ColonialDummy
-0.10(0.02)***
-0.05(0.03)*
-0.03(0.009)***
-0.04(0.01)
-0.02(0.007)***
-0.02(0.007)***
French ColonialDummy
-0.15(0.03)***
-0.09(0.04)*
0.12(0.03)***
-0.11(0.02)***
-0.12(0.02)***
-0.10(0.02)***
R2 0.95 0.95 0.97 0.97 0.97 0.97 Notes: Standard errors reported in parenthesis. *, **, *** Significant at the 10%, 5% and 1% levelsrespectively.
Alternative RegressorsThe models are re-estimated with a number of different control variables describedabove to ensure that the results are robust to alternative regressors - overseas
development aid, the primary enrolment ratio, employment in industry as a % of totalemployment and a democracy index. The results are reported in Table 6.

8/12/2019 Does Colonialism Exert A Long Term Economic Impact On Adult Literacy?
http://slidepdf.com/reader/full/does-colonialism-exert-a-long-term-economic-impact-on-adult-literacy 17/24
QEH Working Paper Series – QEHWPS176 Page 17
Table 6: Regressions with Control Variables(1) (2) (3) (4) (5) (6) (7) (8) (9) (10)
Dependent Variable ALR 2005 Dependent Variable ΔALR19 1950-2005 ALR 50 0.17
(0.02) *** 0.18(0.03 )***
0.20(0.03) ***
0.11(0.02) ***
0.11(0.02)***
-0.82(0.02) ***
-0.80(0.04) ***
-0.77(0.03) ***
-0.76(0.03)***
-0.80(0.04)***
GDP PerCapita 50
0.05(0.02)*
0.04(0.01) ***
0.04(0.01)***
-0.03(0.01)**
0.001(0.02)**
- - - - -
Govt. Exp 90 0.14(0.04)**
0.13(0.06)*
0.09(0.06)
0.03(0.03)
0.07(0.04)
- - - - -
ΔGDP PerCapita 50-05
- - - - - 0.02(0.02)
0.06(0.05)
0.02(0.03)
0.03(0.02)
0.03(0.03)
ΔGovt.Exp 90-05
- - - - - 0.01(0.04)
0.001(0.06)
0.02(0.05)
0.02(0.01)*
0.02(0.01)*
BritishColonialDummy
-0.04(0.01) ***
-0.10(0.04)**
-0.09(0.03)***
-0.08(0.03)**
-0.05(0.01)***
-0.05(0.02)**
-0.04(0.01)***
-0.05(0.02)**
-0.05(0.02)**
-0.04(0.01)***
French
ColonialDummy
-0.10
(0.03)***
-0.11
(0.05)**
-0.12
(0.05)**
-0.10
(0.04)**
-0.11
(0.05)**
-0.12
(0.05)**
-0.06
(0.02)***
-0.10
(0.07)*
-0.10
(0.04)**
-0.08
(0.03)**
PrimaryEnrolmentRatio 90
0.42(0.06)***
- - - 0.33(0.11)***
- - - - -
ODA 98 -0.001(0.001)
- - 0.01(0.01)
- - - -
Εmploymentin Industry 90
0.08(0.03)**
0.16(0.05)**
- -
ΔPrimaryEnrolmentRatio 90-05
- - - - - 0.01(0.02)
- - - 0.02(0.01)
Δ ODA 98-05 - - - - - - 0.04(0.03)
- - 0.04(0.03)
DemocracyIndex 05 - - 0.03(0.02) - - - - 0.03(0.01)* - 0.01(0.01)Δ Εmploy-ment inIndustry 90-05
0.07(0.03)**
0.05(0.02)**
R2 0.88 0.65 0.74 0.78 0.83 0.97 0.95 0.96 0.96 0.96 Notes: Robust standard errors reported in parenthesis. *, **, *** Significant at the 10%, 5% and 1% levelsrespectively.
Again, the initial level of ALR is statistically significant suggesting that the initiallevel of literacy is important for subsequent levels of literacy. The initial level ofGDP per capita is significant, however, the growth in GDP per capita is not
significant. The primary enrolment ratio is significant in the levels equations however,not significant in the first difference equations. This variable is significant at the 1%level in equation (1) suggesting that primary enrolment is important for adult literacy.The coefficient on Overseas Development Aid is not statistically significant. Thedemocracy index is significant only in equations (4) and (7) at the 10% level. Thecoefficient on employment in industry is significant in all equations suggesting thatincreased industrialisation leads to higher literacy rates. The addition of thesevariables to the models however, do not change the overall results suggesting that theresults are robust to the choice of regressors.
8/12/2019 Does Colonialism Exert A Long Term Economic Impact On Adult Literacy?
http://slidepdf.com/reader/full/does-colonialism-exert-a-long-term-economic-impact-on-adult-literacy 18/24
QEH Working Paper Series – QEHWPS176 Page 18
6. Discussion
ChallengesThe question that arises next is, why these economies have not advanced rapidly afterde-colonisation? The evidence presented in this study suggests that although de-colonisation has led to improvements in literacy, the rates are still below average inmany of the former colonies. It can be argued that the lack of mass education
programmes during the colonial era made it difficult for these countries to establishsuch structures after de-colonisation. It can be speculated that the initial preoccupationof these countries would have been on teacher training and setting up the necessaryinfrastructure to re-instate their own native languages rather than on teaching thelanguage itself. Students would then have been confronted with the dual task of re-learning their own native language which was “foreign” to them. Achieving thenecessary literacy standards under such circumstances is not an easy task. In Tunisia,Algeria and Morocco for example, nationalising a system that was designed to teach
in French proved to be a major challenge. Many teachers were trained only to teach inFrench and the necessary Arabic textbooks were not available in the periodimmediately following de-colonisation. By the 1980s the shift to Arabic st illremained incomplete and some instruction was still being given in French 4 .Moreover, education at the secondary level in the Arab states with the exception ofLebanon is controlled and administered by a central ministry. These ministries areoften subject to administrative inefficiencies. The position in Africa and Asia weremuch the same. Asiwaju (2001) observes that, “African states and their leaders areevidently aware of the need to change the structure of the educational system
bequeathed by former colonial masters as this is increasingly discovered to beinadequate for the purposes of the new societies. However, the hold of establishment,
in this case, the colonial heritage, remains very stubborn.”
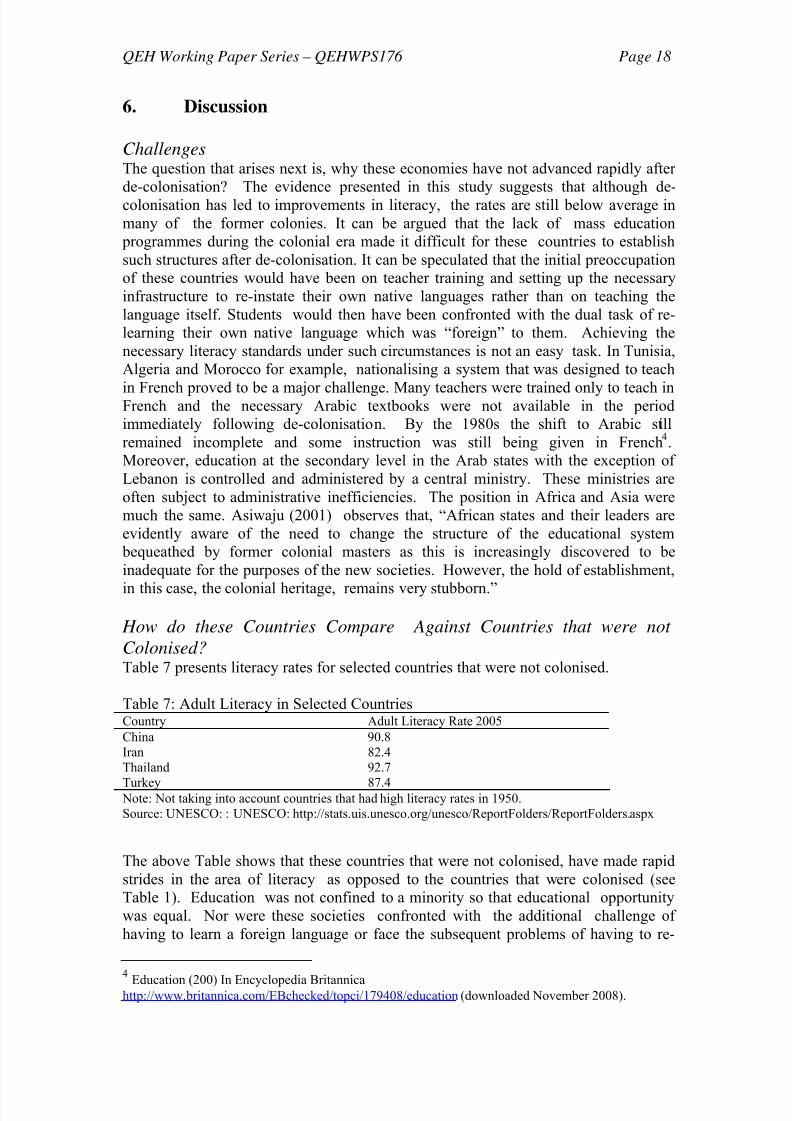
How do these Countries Compare Against Countries that were notColonised? Table 7 presents literacy rates for selected countries that were not colonised.
Table 7: Adult Literacy in Selected CountriesCountry Adult Literacy Rate 2005China 90.8Iran 82.4Thailand 92.7
Turkey 87.4 Note: Not taking into account countries that had high literacy rates in 1950.Source: UNESCO: : UNESCO: http://stats.uis.unesco.org/unesco/ReportFolders/ReportFolders.aspx
The above Table shows that these countries that were not colonised, have made rapidstrides in the area of literacy as opposed to the countries that were colonised (seeTable 1). Education was not confined to a minority so that educational opportunitywas equal. Nor were these societies confronted with the additional challenge ofhaving to learn a foreign language or face the subsequent problems of having to re-
4
Education (200) In Encyclopedia Britannicahttp://www.britannica.com/EBchecked/topci/179408/education (downloaded November 2008).

8/12/2019 Does Colonialism Exert A Long Term Economic Impact On Adult Literacy?
http://slidepdf.com/reader/full/does-colonialism-exert-a-long-term-economic-impact-on-adult-literacy 19/24
QEH Working Paper Series – QEHWPS176 Page 19
instate and learn their own native languages. Therefore their trajectory has beenupward. Many of these countries have introduced literacy programmes targeted ateliminating illiteracy in the rural areas, for example the Iranian programme of 1962,the Compulsory Education Law of 1986 in China. These programmes are not withouttheir own problems however, these countries have been able to invest in education
for the masses without having to face the additional problems of the colonized.
OutliersHow have some countries that were colonised succeeded in improving their literacyrates? African countries such as Congo, South Africa, Botswana and Zimbabwe havemade significant advances in literacy since 1950. According to Fieldhouse (1981)Congo had several factors that made it unique, contributing to its industrialisation – alarge population, the mining industry, communication infrastructure and it engaged infree trade. The result was the growth and increase in productivity in the industrialsector. Unlike other Asian and West African countries which relied heavily on the
plantation sector, Congo was not constrained by the lack of industrial capital. Theempirical results above support the argument that there exists a positive relation
between industrialisation and literacy. It is possible that industrialisation paved theway for Congo to develop the necessary infrastructure for education. WhileBotswana, South Africa and Zimbabwe were also endowed with some of thesefactors, these countries were also settler colonies. Settler colonies enjoyedconsiderable internal self government (Alam 2000). It is possible that education wasmore de-centralised in these countries than in those that were not settler colonies.
The experience of Singapore and Malaysia for example (formerly Malaya),demonstrates that countries with strong nationalist leaders have been more successful
in carrying out educational reforms. Th e percentage that was illiterate in Malaya(including Singapore) was 60.3% in 1950 5. After 1963 education policy in Malaysiahas successfully established Malay as the medium of instruction and English istaught only as a second language. In Singapore on the contrary, English is themedium of instruction and all are required to learn a second language. These twocountries have thereby been able to centralise education and build a nationalconsciousness among the different ethnic groups.
In Sri Lanka and Mauritius (see Table 1) on the other hand, literacy rates wererelatively high at the time of independence. Sri Lanka, India and Mauritius obtained acertain degree of self government prior to independence. In Sri Lanka, the colonial
government introduced the Donoughmore Constitution in 1931 which gave theresponsibility of certain areas including education to the State Council. In 1939 theState Council passed The Education Ordinance No. 31 under which the educationsystem was re-structured and in 1945 a Free Education System was introduced fromKindergarten to university level. The free education system in Sri Lanka is operativeto date which explains the reason for the high literacy rates in Sri Lanka from the timeof independence. Similarly, in Mauritius a law was passed in 1944 providing freeeducation at the primary level which can be attributed to the high literacy levels.While Sri Lanka and Mauritius were able to use the self government given to them totheir advantage, India was not. Given the size of India, literacy was not a central
5 UNESCO (1957) World Illiteracy at Mid-Century: A Statistical Study, Geneva.
8/12/2019 Does Colonialism Exert A Long Term Economic Impact On Adult Literacy?
http://slidepdf.com/reader/full/does-colonialism-exert-a-long-term-economic-impact-on-adult-literacy 20/24
QEH Working Paper Series – QEHWPS176 Page 20
government subject. This has led to differences in literacy rates among the differentstates.
A key implication of this is that there can be no simple separation betweencolonialism and de-colonisation. It is evident from Table 1 that the effects of
colonialism on the education systems of the Latin American countries were felt 100-120 years after de-colonisation. It is possible to speculate from the experience ofLatin America that these countries too would achieve literacy rates above 80% fiftyyears hence.
7. Conclusion
This study examines the reason for differences in adult literacy rates across countries.Colonialism is shown to slow down improvements in literacy in the former colonieswith these countries still lagging behind. The results are consistent with the historicalevidence which shows that the education systems of countries under the colonial rulewere alien and irrelevant to the masses catering to the needs of a small elite.
The next question is, what should these countries do to overcome the literacychallenges imposed on them by the colonial rule? Many of these countries have beenmarred by political unrest since independence which is often cited as a reason for thelack of progress. Education should be used as an instrument for achieving the goals ofsocial unity, political stability and equality of employment. In order to achieve this,there is a need for an educational system that is deeply entrenched in the cultural lifeof the community and one that is relevant to the masses. Centralising education can
only be done by policy makers together with other national institutions. Manycountries have realised the importance of investing in education. Governmentexpenditure should initially be channelled towards primary education as a meanstowards improving literacy.
Progress has been made in the area of primary enrolments in Asia, Africa and theMiddle East. An universal primary education for all framework modelled along thelines of the South American experience or a free education system as in Sri Lankawould enable these countries to progress more rapidly.
A well targeted non-formal education programme for primary school leavers can be
provided through village polytechnics comparable to those in Kenya. These polytechnics would offer skills not offered at the school level for those planning toundertake agriculture and other skill related activities.
In conclusion, it should be noted that achieving increases in literacy is not anobjective that can be achieved within a short space of time. It is a challenging taskthat requires the implementation of policies that will ensure equal access to educationfor all.

8/12/2019 Does Colonialism Exert A Long Term Economic Impact On Adult Literacy?
http://slidepdf.com/reader/full/does-colonialism-exert-a-long-term-economic-impact-on-adult-literacy 21/24
QEH Working Paper Series – QEHWPS176 Page 21
AppendixThe data used in the empirical estimation come from the following sources:- Adult Literacy Rate 1990, 2005: UNESCO Literacy statistics
http://stats.uis.unesco.org/unesco/ReportFolders/ReportFolders.aspx and Human Development Reports.
- Adult Literacy Rate 1950 – Calculated as 100% less Illiteracy Rate 1950 (Where adata range is given for the illiteracy rate, the mid point is taken): UNESCO (1957)World Illiteracy at Mid-Century: A Statistical Study. Geneva.
- GDP per Capita 1990, 2005 (PPP adjusted): World Development Indicators andWorld Development Reports.
- GDP per Capita 1950 (PPP adjusted): Heston A, Summers R and Aten B (2002).Penn World Tables Version 6.1. Philadelphia: Centre for InternationalComparisons at the University of Pennsylvania.The 1950 figures were unavailable for all countries. Figures for China, Chile,Colombia, Dominican Republic, Ecuador, Ghana, Jamaica, Jordan, Malaysia,Panama, Sri Lanka, Zambia are 1955 figures. Those for Algeria, Benin, Chad,Comoros, Congo, Indonesia, Nepal, Niger, Syria, Tanzania and Tunisia are 1960figures.
- Public on Education as % of GDP 1990, 2005: UNESCO and Human DevelopmentReports. Barro R and Lee J (2000). International Data on Educational Attainment:Updates and Implications. Centre for International Development Working Paper42-2000.
- Primary Enrolment Ratio 1990 and 2005: UNESCO and Human DevelopmentReports.
- Secondary Enrolment Ratio 1990, 2005 (used as instrument in the GMMestimation): UNESCO and Human Development Reports.
- Percentage of Labour Force with Primary Education 2005 (used as instruments inthe GMM estimation): World Development Indicators and World Bank EducationStatistics.
- Employment in industry as a % of total employment 1990 and 2005: HumanDevelopment Reports.
- Overseas Development Aid 1998 and 2005: Human Development Reports.- Democracy Index: Marshall M and Jaggers K (2006). Polity IV Country Reports
2006. http://www.systemicpeace.org/polity/polity06.htm#nam (downloadedDecember 2008)

8/12/2019 Does Colonialism Exert A Long Term Economic Impact On Adult Literacy?
http://slidepdf.com/reader/full/does-colonialism-exert-a-long-term-economic-impact-on-adult-literacy 22/24
QEH Working Paper Series – QEHWPS176 Page 22
ReferencesAcemoglu D, Johnson S, Robinson J and Yared P (2008). Income and Democracy.
American Economic Review , 91, 808-842.Acemoglu D, Johnson S, Robinson J (2001). The Colonial Origins of Comparative
Development: An Empirical Investigation. American Economic Review , 91,1369 – 1401.
Alam M (2000). Poverty from the Wealth of Nations: Integration and Polarization Ithe Global Economy since 1760. Palgrave, NY.
Altbach P and Kelly G (1978). Education and Colonialism. Longman Inc. NewYork.
Angeles L (2007). Income Inequality and Colonialism. European Economic Review ,51, 1155- 1176.
Asiwaju A (2001). West African Transformations: Comparative Impacts of Frenchand British Colonialism. Malthouse Press Ltd, Nigeria.
Barro R and Lee J (2000). International Data on Educational Attainment: Updatesand Implications. Centre for International Development Working Paper 42-2000.
Barro R (1999). Determinants of Democracy. Journal of Political Economy , 107,S158-183.
Bertocchi G and Canova F (2002). Did Colonization Matter for Growth? AnEmpirical Exploration into the Historical Causes of Africa’s Underdevelopment.
European Economic Review , 46, 1851-1871.Cascio E, Clark D and Gordon N (2008). Symposia: Investment in Children:
Education and the Age Profile of Literacy into Adulthood. Journal of EconomicPerspectives , 22, 47-70.
Chaudhary L (2007). Essays on Education and Social Divisions in Colonial India. Journal of Economic History , 67, 500- 503.
Corbett E (1972). The French Presence in Black Africa. Black Orpheus Press,Washington DC.Crowder M (1970). West Africa Under Colonial Rule. Hutchinson and Co, London.
Durbin J (1954). Errors in Variables. Review of the International Statistical Institute ,22, 23-32.
Easterly W and Levine R (1997). Africa’s Growth Tragedy: Politics and EthnicDivisions. Quarterly Journal of Economics , 112, 1203-1250.
Education (200) In Encyclopaedia Britannica(http://www.britannica.com/EBchecked/topci/179408/education ) downloaded
November 2008.
Engerman S and Sokoloff K (2005). Colonialism, Inequality, and Long Run Paths ofDevelopment, National Bureau of Economic Research, Inc, NBER WorkingPapers: 11057.
Fieldhouse D (1981). Colonialism 1870-1945. Weidenfeld and Nicolson, London.Finnie R and Meng R (2005). Literacy and Labour Market Outcomes: Self-
Assessment versus Test Score Measures. Applied Economics , 37, 1935-1951. Freedom House (2008), Freedom of the World:
(http://www.freedomhouse.org/template.cfm?page=22&country=7460&year=2008) downloaded November 2008.
Gale L (1969). Education and Development in Latin America. Routledge and KeganPaul, London.
Gallagher, C. F. (1968). North African problems and prospects: Language andidentity. In J. A. Fishman, C. A. Ferguson & J. Das Gupta (Eds), Language
8/12/2019 Does Colonialism Exert A Long Term Economic Impact On Adult Literacy?
http://slidepdf.com/reader/full/does-colonialism-exert-a-long-term-economic-impact-on-adult-literacy 23/24
QEH Working Paper Series – QEHWPS176 Page 23
Problems of Developing Nations (pp. 129–150). New York: John Wiley & Sons.Grier R (1999). Colonial Legacies and Economic Growth. Public Choice , 98, 317-
335Hansen L, Heaton J and Yaron A (1996). Finite Sample Properties of Some
Alternative GMM Estimators. Journal of Business and Economic Statistics , 14,
262-280. Hausman J (1978). Specification Tests in Econometrics. Econometrica , 46, 1251-
1271. Heston A, Summers R and Aten B (2002). Penn World Tables Version 6.1.
Philadelphia: Centre for International Comparisons at the University ofPennsylvania.
Khanna R (2008). Algeria Cuts : Women and Representation, 1830 to the Present.Stanford University Press, CA.
Kim D and Park K (2008). Colonialism and Industrialisation: Factory LabourProductivity of Colonial Korea 1913-37, Australian Economic History Review ,48, 26- 46.
La Porta R, Lopez-de-Silanes F, Shleifer A and Vishny R (1999). The Quality ofGovernment. Journal of Law, Economics and Organization , 15, 222-278.
Marshall M and Jaggers K (2006). Polity IV Country Reports 2006.http://www.systemicpeace.org/polity/polity06.htm#nam (downloaded December2008)
Maddox B (2008). What Good Is Literacy? Insights and Implications of theCapabilities Approach. Journal of Human Development , 9, 185-206.
Mitchell B (2007). International Historical Statistics: Africa, Asia and Oceania 1750-2005. Fifth Edition, Palgrave Macmillan, NY.
Mugomba A and Nyaggah M (eds) (1977). Independence without Freedom: ThePolitical Economy of Colonial Education in Southern Africa. Clio Press Ltd,Oxford.
Ortega D and Rodriguez F (2008). Freed from Illiteracy? A Closer Look atVenezuela's Mision Robinson Literacy Campaign, Economic Development andCultural Change , 57, 1-30.
Sanyal B, Diyasena W, Gunatilleke G, Wijemanna E, Bastiampillai B, Wijetunga W,Wilson P, Philipupillai A, Sundar S (1983). University Education and GraduateEmployment in Sri Lanka, Marga Institute, Sri Lanka.
Sundaram A and Vanneman R (2008). Gender Differentials in Literacy in India:The Intriguing Relationship with Women's Labor Force Participation. World
Development, 36, 128-43.Temple J (1998). Robustness Tests of the Augmented Solow Model. Journal of Applied Econometrics , 13, 361-375
UNESCO (1957). World Illiteracy at Mid-Century: A Statistical Study. Geneva.UNESCO (2005). The EEA Global Monitory Report, UNESCO, Geneva.
UNESCO (2008). Literacy Statistics
http://stats.uis.unesco.org/unesco/ReportFolders/ReportFolders.aspx (downloaded November 2008).
Verner D (2005). What Factors Influence World Literacy? Is Africa Different?
World Bank Policy Research Working Paper Series: 3496, Washington.

8/12/2019 Does Colonialism Exert A Long Term Economic Impact On Adult Literacy?
http://slidepdf.com/reader/full/does-colonialism-exert-a-long-term-economic-impact-on-adult-literacy 24/24
QEH Working Paper Series – QEHWPS176 Page 24
Wu D (1973). Alternative Tests of Independence between Stochastic Regressors andDisturbances. Econometrica , 41, 733 - 750
Young C (1994). The African Colonial State in Comparative Perspective, YaleUniversity Press. London.