does decentralization increase government responsiveness...
TRANSCRIPT
www.elsevier.com/locate/econbase
Journal of Public Economics 88 (2004) 867–893
Does decentralization increase government
responsiveness to local needs?
Evidence from Bolivia
Jean-Paul Faguet
Centre for Economic Performance and Development Studies Institute, London School of Economics,
Houghton Street, London WC2A 2AE, UK
Received 22 March 2001; received in revised form 8 August 2002; accepted 14 August 2002
Abstract
This paper examines whether decentralization increases the responsiveness of public investment
to local needs using a unique database from Bolivia. Empirical tests show that investment patterns in
human capital and social services changed significantly after decentralization. These changes are
strongly and positively related to objective indicators of need. Nationally, these changes were driven
by the smallest, poorest municipalities investing devolved funds in their highest-priority projects.
The findings contradict common claims that local government is too corrupt, institutionally weak, or
prone to interest-group capture to improve upon central government’s allocation of public resources.
D 2002 Published by Elsevier B.V.
JEL classification: D72; D73; H41; H42; H72; O18
Keywords: Decentralization; Local government; Participation; Targeting; Bolivia
1. Introduction
Over the past two decades decentralization has become one of the broadest movements,
and most debated policy issues, in the world of development.1 It is at the center of reform
efforts throughout Latin America and many parts of Asia and Africa; and under the guises
of subsidiarity, devolution and federalism is also central to policy discourse in the European
Union, United Kingdom and United States. A key argument used by its proponents (see, for
examples, Shah, 1998; Wallis and Oates, 1988; World Bank, 1994; UNDP, 1993) is that
decentralization makes government more responsive to local needs by ‘tailoring levels of
0047-2727/$ - see front matter D 2002 Published by Elsevier B.V.
doi:10.1016/S0047-2727(02)00185-8
E-mail address: [email protected] (J.-P. Faguet).1 Manor (1997) refers to ‘a quiet fashion of our time’ while Campbell (2001) calls it The Quiet
Revolution.
J.-P. Faguet / Journal of Public Economics 88 (2004) 867–893868
consumption to the preferences of smaller, more homogeneous groups’.2 Opponents (see
for example, Crook and Sverrisson, 1999; Smith, 1985) counter that local government’s
lack of human, financial and technical resources will prevent it from providing appropriate
public services under decentralization, and thus power should remain in the hands of central
governments that are relatively resource rich. Despite going to the heart of the decentral-
ization debate, these claims have not been extensively tested. What evidence does exist is
largely anecdotal and/or inconclusive. This paper seeks to answer the question of
responsiveness clearly and convincingly for one remarkable case: Bolivia. I examine
how decentralization changed local investment patterns across all Bolivian municipalities,
and the extent to which these changes were related to objective measures of local need.
The decentralization literature is enormous, spanning five decades and scores of
countries. That part relating to government responsiveness is happily smaller, and falls into
two general categories: small and large sample studies. The former rely mostly on qualitative
evidence and descriptive statistics, adopt a case study approach, and focus usually on a
single country, or develop comparisons between a small number of countries. The level of
analysis is usually more nuanced than large sample work, but the conclusions that emerge
often suffer from a low level of generality. Most of the existing evidence on responsiveness
can be found here.
Results relating to responsiveness are limited, as broad surveys by Piriou-Sall (1998)
and Smoke (2001) make clear. Case studies reported in Rondinelli et al. (1983) find that
decentralization made government more responsive to local needs in Papua New Guinea
by improving the capacity of provincial administrators, and improved the access of people
in neglected rural areas to central government resources and institutions ‘perceptibly’ in
Indonesia, Morocco, Pakistan, Thailand and Tunisia. Manor (1999) finds evidence that
decentralization enhanced the responsiveness of government in the Philippines, India and
Cote d’Ivoire. And a World Bank (1995) case study of Colombia shows that satisfaction
with government and local services improved notably after decentralization. On the other
hand, Samoff (1990) finds the evidence on responsiveness strongly negative, asserting that
decentralization schemes around the world have largely failed to work. They have neither
enhanced local capacities nor improved local programs, in large part because they were
neutralized by elaborate mechanisms of central supervision and control. Slater (1989)
supports this view with a detailed example from Tanzania.
Large sample studies, by contrast, benefit from the consistency, empirical transparency
and high degree of generality that econometrics provides. But this stream of research is
still quite new, and significant problems with measurement and data comparability across
diverse countries (or regions), as well as the possibility of omitted variables, raise
important concerns.3 Perhaps because of such difficulties, most econometric studies have
addressed the question of responsiveness only tangentially, or at a very general level.
Noting that the effects of decentralization are complex, Zax (1989) finds that electoral
considerations lead to significantly higher levels of spending in US states and municipal-
ities which permit initiatives. Humplick and Moini-Araghi (1996) find that unit costs of
road maintenance are lower and roads of better quality where maintenance is decentral-
2 Wallis and Oates (1988, p. 5).3 Estache and Sinha (1995) discuss data problems in detail.
J.-P. Faguet / Journal of Public Economics 88 (2004) 867–893 869
ized. Fisman and Gatti (2000) find that fiscal decentralization is consistently associated
with lower measured corruption across a sample of countries. For a sample of 80 countries,
Huther and Shah (1998) find positive correlations between decentralization and indices of
political participation, social development, a quality index of economic management, and
an overall quality of government index, from all of which they infer causal relationships.
And finally, Galasso and Ravallion (2000) use careful econometrics to show that pro-poor
program benefits increased with decentralization in Bangladesh.
The sum of these and many other findings is that 50 years of research has failed to
establish clearly whether decentralization makes government more or less responsive to its
citizens. This study seeks to combine the strengths of the two approaches outlined above in
order to answer the question for a provocative recent natural experiment. I combine the
rigor and generality of a data intensive, econometric approach with a one-country focus
which allows me to avoid problems of data comparability and control for external shocks,
political regime, institutions, and other exogenous factors. In this way I examine the effects
of decentralization carefully through the length and breadth of Bolivia. The characteristics
of Bolivian reform—a very significant change in policy at a discrete point in time—make
this case particularly well-suited for study. The data I use are of surprising scope and
quality, including political, institutional, administrative and even procedural (good-gov-
ernment type) indicators for all 311 municipalities. The use of such variables constitutes an
innovation of this paper.
The remainder of the paper is organized as follows. Section 2 explains Bolivia’s
decentralization program and examines the changes in national resource flows which it
brought about. Section 3 formalizes the main features of the policy debate mentioned
above in a model that analyzes the trade-off between local government’s knowledge of
local needs vs. central government’s technical and organizational advantage in the
provision of public services in districts with heterogeneous preferences. Section 4
discusses the empirical methodology, tests whether decentralization changed public
investment patterns across Bolivia’s 311 municipalities, and then examines the determi-
nants of this change, focusing on variables of need. Section 5 concludes.
2. Decentralization in Bolivia
2.1. Popular participation and the decentralization reform
Bolivia entered the 1990s with one of the most centralized states in the region, a
product of its 1952 revolution when the ascendant Nationalist Revolutionary Movement
expropriated the ‘commanding heights’ of the economy and embarked upon a state-led
modernization strategy. Governing elites in La Paz sought initially to use the state to erase
the social relations of the past and create a new, more egalitarian society.4 Forty years of
military coups punctuated by episodes of civilian rule exacerbated this tendency, leaving
the reins of political and economic power firmly in the hands of the President and his
cabinet. Against this general background, decentralization was announced in 1994. The
4 Klein (1993, pp. 236–240), author’s translation.
J.-P. Faguet / Journal of Public Economics 88 (2004) 867–893870
scale of the change in resource flows and political power that it brought about were
considerable. The core of the decentralization reform consists of four points.5
1. The share of national tax revenues devolved from central government to municipalities
was doubled to 20%. More importantly, whereas before these funds were apportioned
according to ad hoc, highly political criteria, after decentralization they are allocated on
a strict per capita basis (see below).
2. Title to all local health, education, roads, irrigation, culture and sports infrastructure was
transferred to municipalities free of charge, along with the responsibility to administer,
maintain and equip it, and invest in new infrastructure.
3. Local Oversight Committees (Comites de Vigilancia) were established to oversee
municipal spending of Popular Participation funds, and propose new projects. These
consist of representatives from local, grass-roots groups who can freeze disbursements
from central government, effectively paralyzing the vast majority of local governments,
if they judge that funds are being misused. These committees report directly to local
grass-roots organizations, and thus represent an alternative channel by which popular
demand enters into local policy-making.
4. One hundred and ninety-eight new municipalities—64% of the total—were created,
and existing ones expanded to include suburbs and surrounding rural areas.
The reform heralded a new era of municipal government for the overwhelming majority
of Bolivian towns and cities. In many parts of Bolivia where before the state was present,
if at all, in the form of a local schoolhouse, health post, or perhaps military garrison or
customs office, each reporting to its respective ministry, there was now for the first time
elected local government accountable only to local voters.
2.2. Descriptive statistics
The extent of the change is perhaps best appreciated by examining the changes in
resource flows it catalyzed. Fig. 1 shows that before decentralization 308 Bolivian
municipalities divided amongst them a mere 14% of all devolved funds, while the three
main cities took 86%. After decentralization their shares reversed to 73% and 27%,
respectively. The per capita criterion resulted in a massive shift of resources in favor of
smaller, poorer districts.
A more important and telling change was to the composition of investment. Fig. 2
shows central and local government investment by sector for the periods 1991–1993 and
1994–1996. The differences are large. In the years leading up to reform, central
government invested most in transport, hydrocarbons, multisectoral6 and energy, which
together accounted for 73% of public investment during 1991–1993. After decentraliza-
tion local governments invest most heavily in education, urban development, and water
and sanitation, together accounting for 79% of municipal investment. Of the sectors
5 Secretarıa Nacional de Participacion Popular (1994). Ley de Participacion Popular.6 A hodgepodge, including feasibility studies, technical assistance and emergency relief, that is difficult to
categorize.
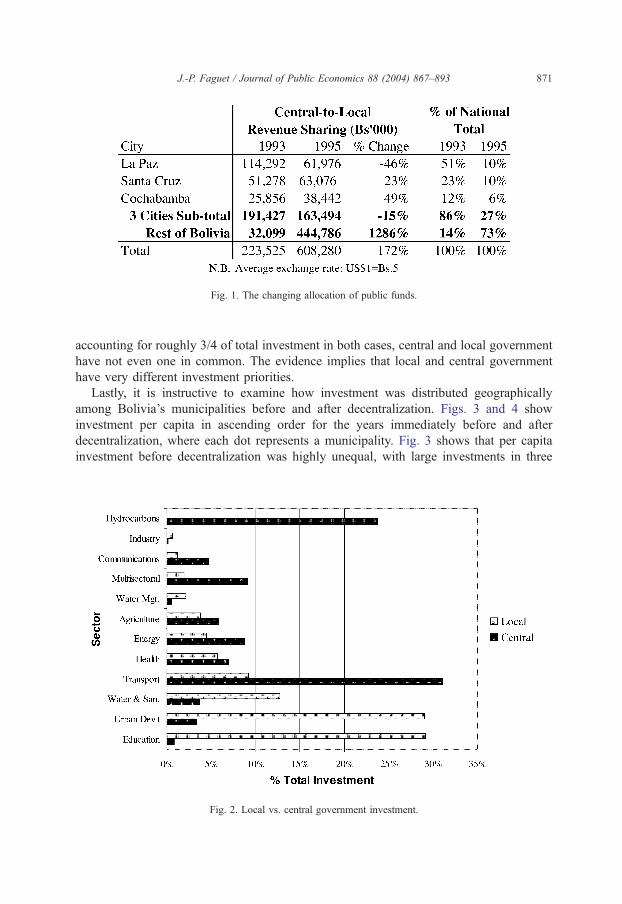
Fig. 1. The changing allocation of public funds.
J.-P. Faguet / Journal of Public Economics 88 (2004) 867–893 871
accounting for roughly 3/4 of total investment in both cases, central and local government
have not even one in common. The evidence implies that local and central government
have very different investment priorities.
Lastly, it is instructive to examine how investment was distributed geographically
among Bolivia’s municipalities before and after decentralization. Figs. 3 and 4 show
investment per capita in ascending order for the years immediately before and after
decentralization, where each dot represents a municipality. Fig. 3 shows that per capita
investment before decentralization was highly unequal, with large investments in three
Fig. 2. Local vs. central government investment.
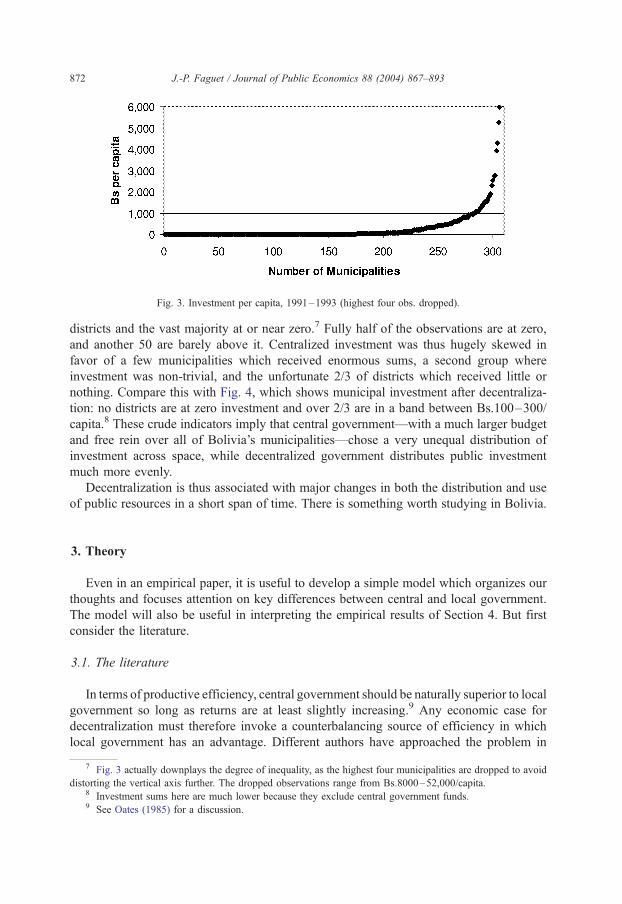
Fig. 3. Investment per capita, 1991–1993 (highest four obs. dropped).
J.-P. Faguet / Journal of Public Economics 88 (2004) 867–893872
districts and the vast majority at or near zero.7 Fully half of the observations are at zero,
and another 50 are barely above it. Centralized investment was thus hugely skewed in
favor of a few municipalities which received enormous sums, a second group where
investment was non-trivial, and the unfortunate 2/3 of districts which received little or
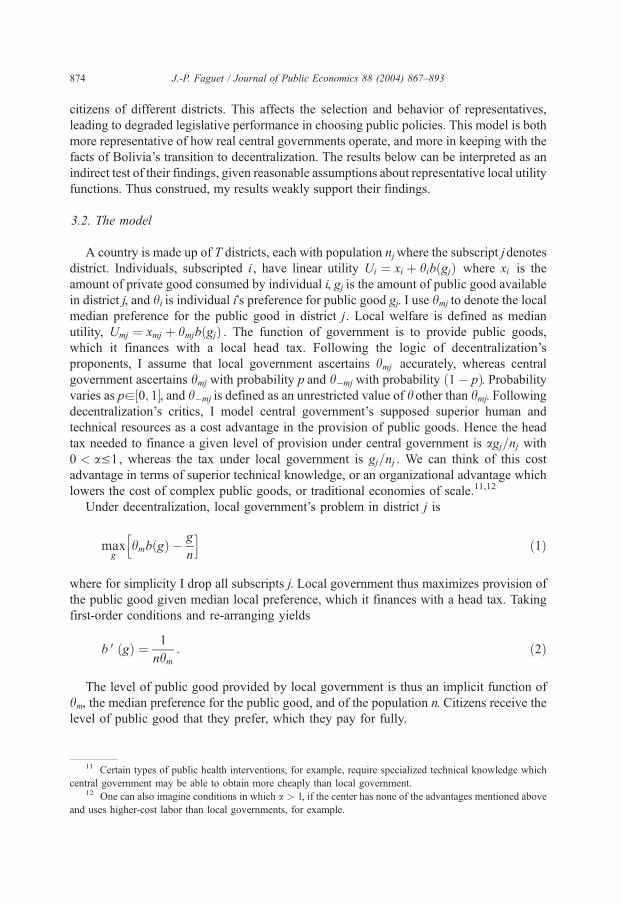
nothing. Compare this with Fig. 4, which shows municipal investment after decentraliza-
tion: no districts are at zero investment and over 2/3 are in a band between Bs.100–300/
capita.8 These crude indicators imply that central government—with a much larger budget
and free rein over all of Bolivia’s municipalities—chose a very unequal distribution of
investment across space, while decentralized government distributes public investment
much more evenly.
Decentralization is thus associated with major changes in both the distribution and use
of public resources in a short span of time. There is something worth studying in Bolivia.
3. Theory
Even in an empirical paper, it is useful to develop a simple model which organizes our
thoughts and focuses attention on key differences between central and local government.
The model will also be useful in interpreting the empirical results of Section 4. But first
consider the literature.
3.1. The literature
In terms of productive efficiency, central government should be naturally superior to local
government so long as returns are at least slightly increasing.9 Any economic case for
decentralization must therefore invoke a counterbalancing source of efficiency in which
local government has an advantage. Different authors have approached the problem in
7 Fig. 3 actually downplays the degree of inequality, as the highest four municipalities are dropped to avoid
distorting the vertical axis further. The dropped observations range from Bs.8000–52,000/capita.8 Investment sums here are much lower because they exclude central government funds.9 See Oates (1985) for a discussion.
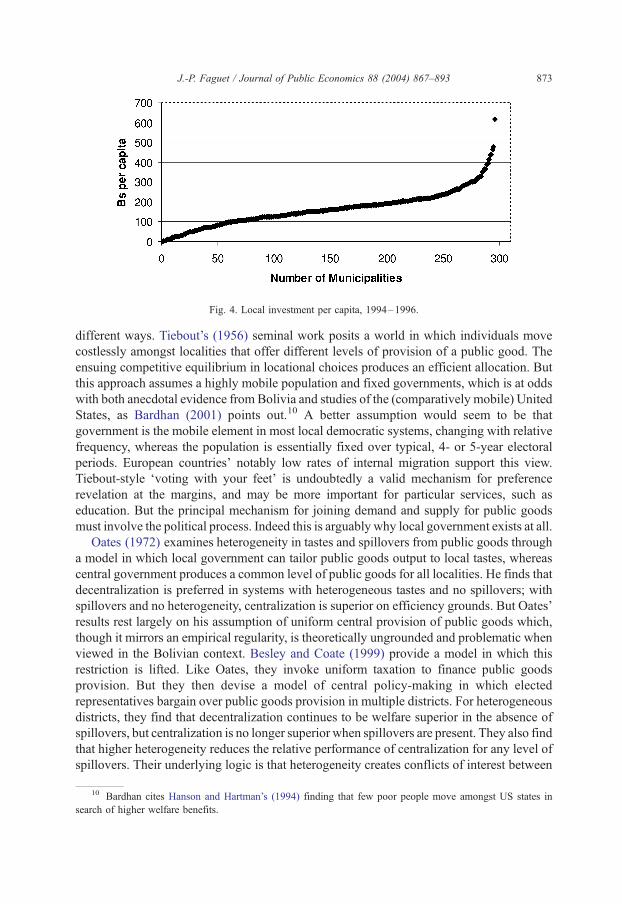
Fig. 4. Local investment per capita, 1994–1996.
J.-P. Faguet / Journal of Public Economics 88 (2004) 867–893 873
different ways. Tiebout’s (1956) seminal work posits a world in which individuals move
costlessly amongst localities that offer different levels of provision of a public good. The
ensuing competitive equilibrium in locational choices produces an efficient allocation. But
this approach assumes a highly mobile population and fixed governments, which is at odds
with both anecdotal evidence from Bolivia and studies of the (comparatively mobile) United
States, as Bardhan (2001) points out.10 A better assumption would seem to be that
government is the mobile element in most local democratic systems, changing with relative
frequency, whereas the population is essentially fixed over typical, 4- or 5-year electoral
periods. European countries’ notably low rates of internal migration support this view.
Tiebout-style ‘voting with your feet’ is undoubtedly a valid mechanism for preference
revelation at the margins, and may be more important for particular services, such as
education. But the principal mechanism for joining demand and supply for public goods
must involve the political process. Indeed this is arguably why local government exists at all.
Oates (1972) examines heterogeneity in tastes and spillovers from public goods through
a model in which local government can tailor public goods output to local tastes, whereas
central government produces a common level of public goods for all localities. He finds that
decentralization is preferred in systems with heterogeneous tastes and no spillovers; with
spillovers and no heterogeneity, centralization is superior on efficiency grounds. But Oates’
results rest largely on his assumption of uniform central provision of public goods which,
though it mirrors an empirical regularity, is theoretically ungrounded and problematic when
viewed in the Bolivian context. Besley and Coate (1999) provide a model in which this
restriction is lifted. Like Oates, they invoke uniform taxation to finance public goods
provision. But they then devise a model of central policy-making in which elected
representatives bargain over public goods provision in multiple districts. For heterogeneous
districts, they find that decentralization continues to be welfare superior in the absence of
spillovers, but centralization is no longer superior when spillovers are present. They also find
that higher heterogeneity reduces the relative performance of centralization for any level of
spillovers. Their underlying logic is that heterogeneity creates conflicts of interest between
10 Bardhan cites Hanson and Hartman’s (1994) finding that few poor people move amongst US states in
search of higher welfare benefits.
J.-P. Faguet / Journal of Public Economics 88 (2004) 867–893874
citizens of different districts. This affects the selection and behavior of representatives,
leading to degraded legislative performance in choosing public policies. This model is both
more representative of how real central governments operate, and more in keeping with the
facts of Bolivia’s transition to decentralization. The results below can be interpreted as an
indirect test of their findings, given reasonable assumptions about representative local utility
functions. Thus construed, my results weakly support their findings.
3.2. The model
A country is made up of T districts, each with population njwhere the subscript jdenotes
district. Individuals, subscripted i , have linear utility Ui ¼ xi þ hibðgjÞ where xi is the
amount of private good consumed by individual i, gj is the amount of public good available
in district j, and hi is individual i’s preference for public good gj. I use hmj to denote the localmedian preference for the public good in district j. Local welfare is defined as median
utility, Umj ¼ xmj þ hmjbðgjÞ . The function of government is to provide public goods,
which it finances with a local head tax. Following the logic of decentralization’s
proponents, I assume that local government ascertains hmj accurately, whereas central
government ascertains hmj with probability p and h�mj with probability ð1� pÞ. Probabilityvaries as pa½0; 1�, and h�mj is defined as an unrestricted value of hother than hmj. Followingdecentralization’s critics, I model central government’s supposed superior human and
technical resources as a cost advantage in the provision of public goods. Hence the head
tax needed to finance a given level of provision under central government is agj=nj with0 < aV1, whereas the tax under local government is gj=nj . We can think of this cost
advantage in terms of superior technical knowledge, or an organizational advantage which
lowers the cost of complex public goods, or traditional economies of scale.11,12
Under decentralization, local government’s problem in district j is
maxg
hmbðgÞ �g
n
h ið1Þ
where for simplicity I drop all subscripts j. Local government thus maximizes provision of
the public good given median local preference, which it finances with a head tax. Taking
first-order conditions and re-arranging yields
b VðgÞ ¼ 1
nhm: ð2Þ
The level of public good provided by local government is thus an implicit function of
hm, the median preference for the public good, and of the population n. Citizens receive the
level of public good that they prefer, which they pay for fully.
11 Certain types of public health interventions, for example, require specialized technical knowledge which
central government may be able to obtain more cheaply than local government.12 One can also imagine conditions in which a > 1, if the center has none of the advantages mentioned above
and uses higher-cost labor than local governments, for example.
J.-P. Faguet / Journal of Public Economics 88 (2004) 867–893 875
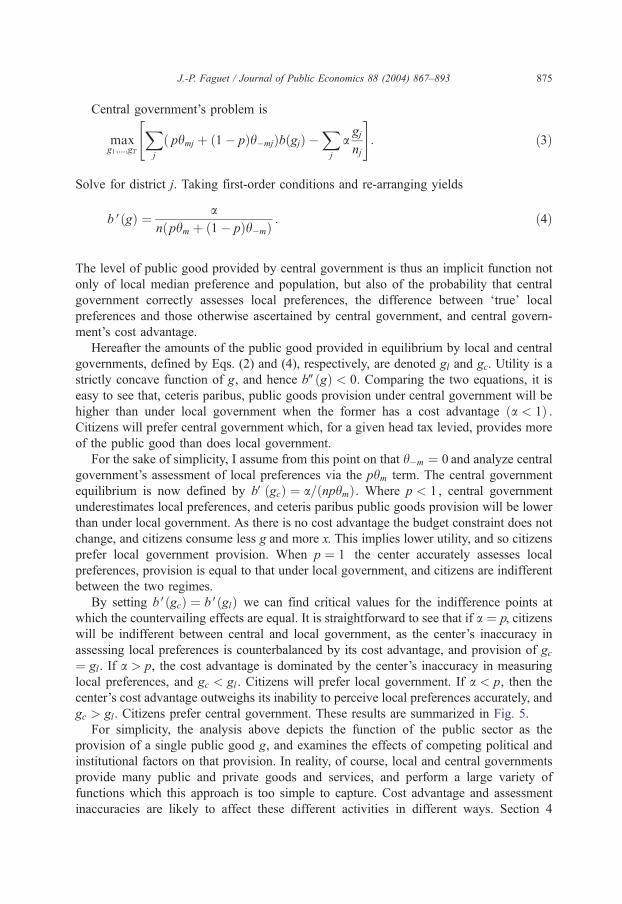
Central government’s problem is
maxg1;...;gT
Xj
ð phmj þ ð1� pÞh�mjÞbðgjÞ �Xj
agj
nj
" #: ð3Þ
Solve for district j. Taking first-order conditions and re-arranging yields
b VðgÞ ¼ an phm þ 1� pð Þh�mð Þ : ð4Þ
The level of public good provided by central government is thus an implicit function not
only of local median preference and population, but also of the probability that central
government correctly assesses local preferences, the difference between ‘true’ local
preferences and those otherwise ascertained by central government, and central govern-
ment’s cost advantage.
Hereafter the amounts of the public good provided in equilibrium by local and central
governments, defined by Eqs. (2) and (4), respectively, are denoted gl and gc. Utility is a
strictly concave function of g, and hence bWðgÞ < 0. Comparing the two equations, it is
easy to see that, ceteris paribus, public goods provision under central government will be
higher than under local government when the former has a cost advantage ða < 1Þ .Citizens will prefer central government which, for a given head tax levied, provides more
of the public good than does local government.
For the sake of simplicity, I assume from this point on that h�m ¼ 0 and analyze central
government’s assessment of local preferences via the phm term. The central government
equilibrium is now defined by bVðgcÞ ¼ a=ðnphmÞ. Where p < 1 , central government
underestimates local preferences, and ceteris paribus public goods provision will be lower
than under local government. As there is no cost advantage the budget constraint does not
change, and citizens consume less g and more x. This implies lower utility, and so citizens
prefer local government provision. When p ¼ 1 the center accurately assesses local
preferences, provision is equal to that under local government, and citizens are indifferent
between the two regimes.
By setting bVðgcÞ ¼ bVðglÞ we can find critical values for the indifference points at
which the countervailing effects are equal. It is straightforward to see that if a ¼ p, citizens
will be indifferent between central and local government, as the center’s inaccuracy in
assessing local preferences is counterbalanced by its cost advantage, and provision of gc¼ gl . If a > p, the cost advantage is dominated by the center’s inaccuracy in measuring
local preferences, and gc < gl . Citizens will prefer local government. If a < p, then the
center’s cost advantage outweighs its inability to perceive local preferences accurately, and
gc > gl. Citizens prefer central government. These results are summarized in Fig. 5.
For simplicity, the analysis above depicts the function of the public sector as the
provision of a single public good g, and examines the effects of competing political and
institutional factors on that provision. In reality, of course, local and central governments
provide many public and private goods and services, and perform a large variety of
functions which this approach is too simple to capture. Cost advantage and assessment
inaccuracies are likely to affect these different activities in different ways. Section 4
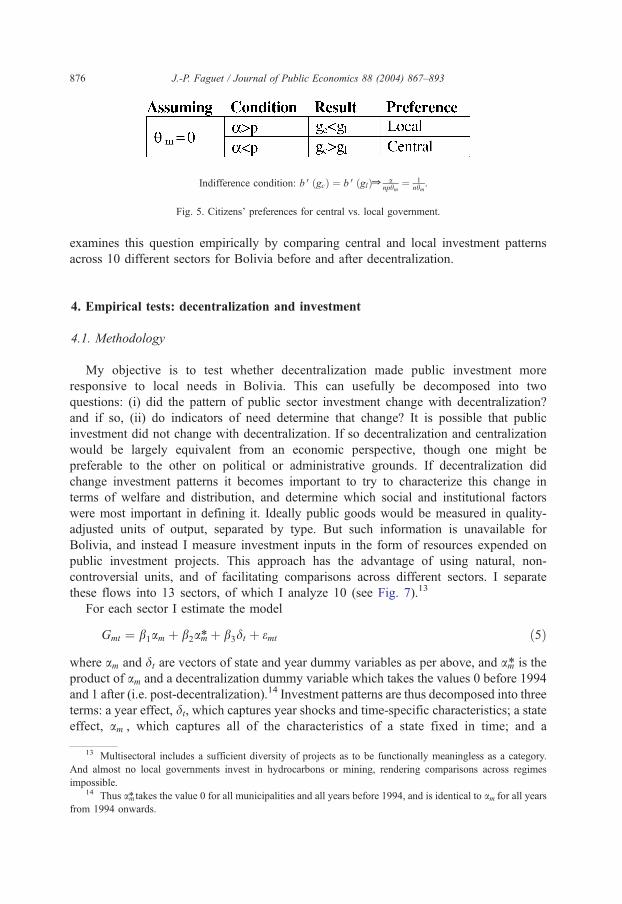
Indifference condition: b VðgcÞ ¼ b VðglÞZ anphm
¼ 1nhm
.
Fig. 5. Citizens’ preferences for central vs. local government.
J.-P. Faguet / Journal of Public Economics 88 (2004) 867–893876
examines this question empirically by comparing central and local investment patterns
across 10 different sectors for Bolivia before and after decentralization.
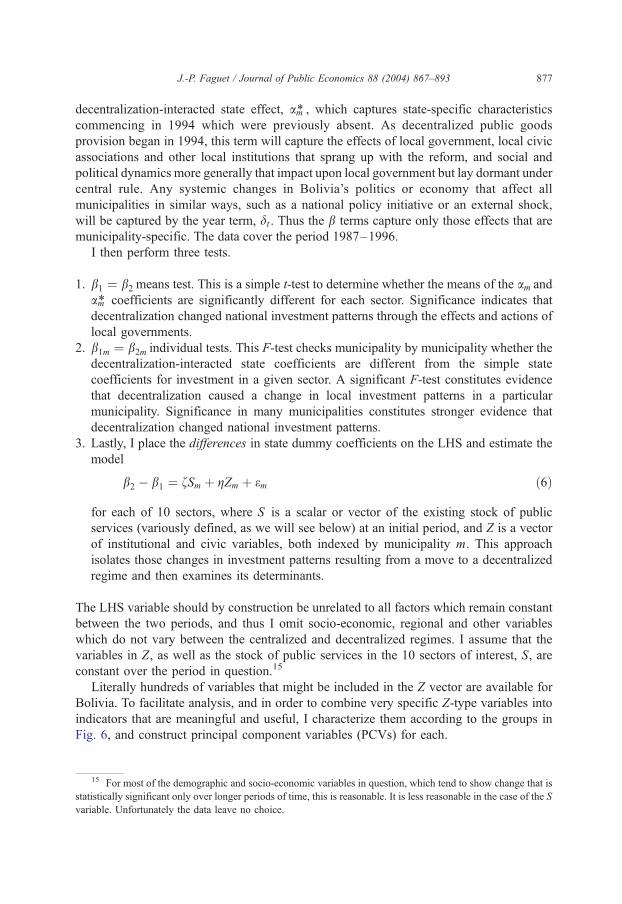
4. Empirical tests: decentralization and investment
4.1. Methodology
My objective is to test whether decentralization made public investment more
responsive to local needs in Bolivia. This can usefully be decomposed into two
questions: (i) did the pattern of public sector investment change with decentralization?
and if so, (ii) do indicators of need determine that change? It is possible that public
investment did not change with decentralization. If so decentralization and centralization
would be largely equivalent from an economic perspective, though one might be
preferable to the other on political or administrative grounds. If decentralization did
change investment patterns it becomes important to try to characterize this change in
terms of welfare and distribution, and determine which social and institutional factors
were most important in defining it. Ideally public goods would be measured in quality-
adjusted units of output, separated by type. But such information is unavailable for
Bolivia, and instead I measure investment inputs in the form of resources expended on
public investment projects. This approach has the advantage of using natural, non-
controversial units, and of facilitating comparisons across different sectors. I separate
these flows into 13 sectors, of which I analyze 10 (see Fig. 7).13
For each sector I estimate the model
Gmt ¼ b1am þ b2am*þ b3dt þ emt ð5Þ
where am and dt are vectors of state and year dummy variables as per above, and am* is the
product of am and a decentralization dummy variable which takes the values 0 before 1994
and 1 after (i.e. post-decentralization).14 Investment patterns are thus decomposed into three
terms: a year effect, dt, which captures year shocks and time-specific characteristics; a state
effect, am , which captures all of the characteristics of a state fixed in time; and a
13 Multisectoral includes a sufficient diversity of projects as to be functionally meaningless as a category.
And almost no local governments invest in hydrocarbons or mining, rendering comparisons across regimes
impossible.14 Thus am* takes the value 0 for all municipalities and all years before 1994, and is identical to am for all years
from 1994 onwards.
J.-P. Faguet / Journal of Public Economics 88 (2004) 867–893 877
decentralization-interacted state effect, am* , which captures state-specific characteristics
commencing in 1994 which were previously absent. As decentralized public goods
provision began in 1994, this term will capture the effects of local government, local civic
associations and other local institutions that sprang up with the reform, and social and
political dynamics more generally that impact upon local government but lay dormant under
central rule. Any systemic changes in Bolivia’s politics or economy that affect all
municipalities in similar ways, such as a national policy initiative or an external shock,
will be captured by the year term, dt . Thus the b terms capture only those effects that are
municipality-specific. The data cover the period 1987–1996.
I then perform three tests.
1. b1 ¼ b2 means test. This is a simple t-test to determine whether the means of the am andam* coefficients are significantly different for each sector. Significance indicates that
decentralization changed national investment patterns through the effects and actions of
local governments.
2. b1m ¼ b2m individual tests. This F-test checks municipality by municipality whether the
decentralization-interacted state coefficients are different from the simple state
coefficients for investment in a given sector. A significant F-test constitutes evidence
that decentralization caused a change in local investment patterns in a particular
municipality. Significance in many municipalities constitutes stronger evidence that
decentralization changed national investment patterns.
3. Lastly, I place the differences in state dummy coefficients on the LHS and estimate the
model
b2 � b1 ¼ fSm þ gZm þ em ð6Þ
for each of 10 sectors, where S is a scalar or vector of the existing stock of public
services (variously defined, as we will see below) at an initial period, and Z is a vector
of institutional and civic variables, both indexed by municipality m. This approach
isolates those changes in investment patterns resulting from a move to a decentralized
regime and then examines its determinants.
The LHS variable should by construction be unrelated to all factors which remain constant
between the two periods, and thus I omit socio-economic, regional and other variables
which do not vary between the centralized and decentralized regimes. I assume that the
variables in Z, as well as the stock of public services in the 10 sectors of interest, S, are
constant over the period in question.15
Literally hundreds of variables that might be included in the Z vector are available for
Bolivia. To facilitate analysis, and in order to combine very specific Z-type variables into
indicators that are meaningful and useful, I characterize them according to the groups in
Fig. 6, and construct principal component variables (PCVs) for each.
15 For most of the demographic and socio-economic variables in question, which tend to show change that is
statistically significant only over longer periods of time, this is reasonable. It is less reasonable in the case of the S
variable. Unfortunately the data leave no choice.
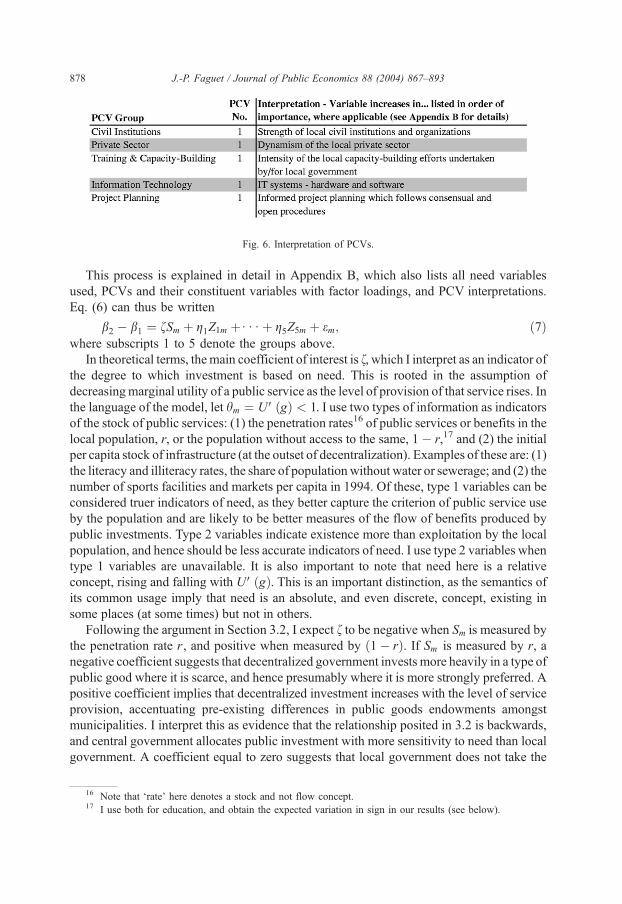
Fig. 6. Interpretation of PCVs.
J.-P. Faguet / Journal of Public Economics 88 (2004) 867–893878
This process is explained in detail in Appendix B, which also lists all need variables
used, PCVs and their constituent variables with factor loadings, and PCV interpretations.
Eq. (6) can thus be written
b2 � b1 ¼ fSm þ g1Z1m þ : : : þ g5Z5m þ em; ð7Þwhere subscripts 1 to 5 denote the groups above.
In theoretical terms, the main coefficient of interest is f, which I interpret as an indicator ofthe degree to which investment is based on need. This is rooted in the assumption of
decreasingmarginal utility of a public service as the level of provision of that service rises. In
the language of the model, let hm ¼ UVðgÞ < 1. I use two types of information as indicators
of the stock of public services: (1) the penetration rates16 of public services or benefits in the
local population, r, or the population without access to the same, 1� r,17 and (2) the initial
per capita stock of infrastructure (at the outset of decentralization). Examples of these are: (1)
the literacy and illiteracy rates, the share of population without water or sewerage; and (2) the
number of sports facilities and markets per capita in 1994. Of these, type 1 variables can be
considered truer indicators of need, as they better capture the criterion of public service use
by the population and are likely to be better measures of the flow of benefits produced by
public investments. Type 2 variables indicate existence more than exploitation by the local
population, and hence should be less accurate indicators of need. I use type 2 variables when
type 1 variables are unavailable. It is also important to note that need here is a relative
concept, rising and falling with UVðgÞ. This is an important distinction, as the semantics of
its common usage imply that need is an absolute, and even discrete, concept, existing in
some places (at some times) but not in others.
Following the argument in Section 3.2, I expect f to be negative when Sm is measured by
the penetration rate r, and positive when measured by ð1� rÞ. If Sm is measured by r, a
negative coefficient suggests that decentralized government invests more heavily in a type of
public good where it is scarce, and hence presumably where it is more strongly preferred. A
positive coefficient implies that decentralized investment increases with the level of service
provision, accentuating pre-existing differences in public goods endowments amongst
municipalities. I interpret this as evidence that the relationship posited in 3.2 is backwards,
and central government allocates public investment with more sensitivity to need than local
government. A coefficient equal to zero suggests that local government does not take the
16 Note that ‘rate’ here denotes a stock and not flow concept.17 I use both for education, and obtain the expected variation in sign in our results (see below).
J.-P. Faguet / Journal of Public Economics 88 (2004) 867–893 879
existing stock of public goods into account in making its investment decisions, implying that
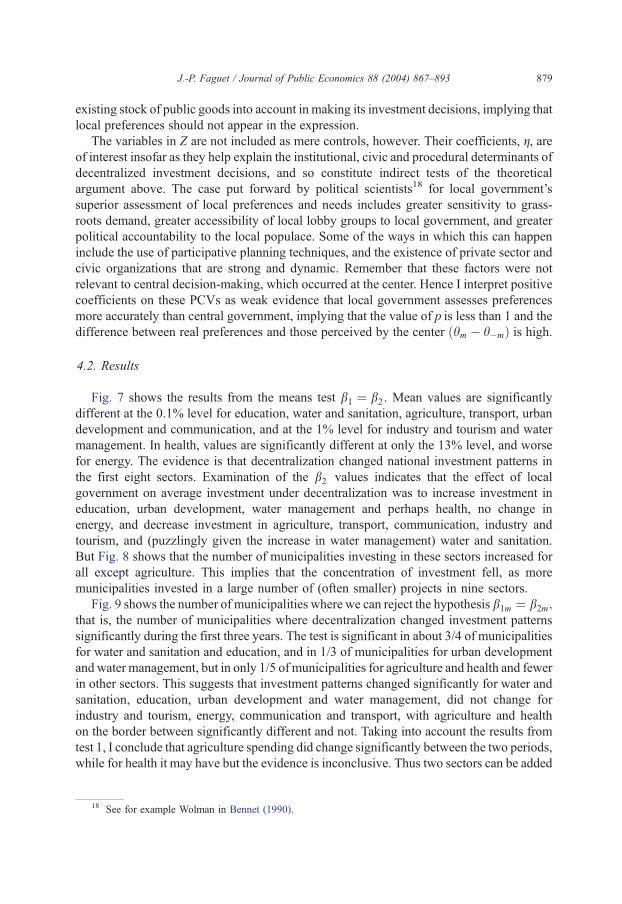
local preferences should not appear in the expression.
The variables in Z are not included as mere controls, however. Their coefficients, g, areof interest insofar as they help explain the institutional, civic and procedural determinants of
decentralized investment decisions, and so constitute indirect tests of the theoretical
argument above. The case put forward by political scientists18 for local government’s
superior assessment of local preferences and needs includes greater sensitivity to grass-
roots demand, greater accessibility of local lobby groups to local government, and greater
political accountability to the local populace. Some of the ways in which this can happen
include the use of participative planning techniques, and the existence of private sector and
civic organizations that are strong and dynamic. Remember that these factors were not
relevant to central decision-making, which occurred at the center. Hence I interpret positive
coefficients on these PCVs as weak evidence that local government assesses preferences
more accurately than central government, implying that the value of p is less than 1 and the
difference between real preferences and those perceived by the center ðhm � h�mÞ is high.
4.2. Results
Fig. 7 shows the results from the means test b1 ¼ b2 . Mean values are significantly
different at the 0.1% level for education, water and sanitation, agriculture, transport, urban
development and communication, and at the 1% level for industry and tourism and water
management. In health, values are significantly different at only the 13% level, and worse
for energy. The evidence is that decentralization changed national investment patterns in
the first eight sectors. Examination of the b2 values indicates that the effect of local
government on average investment under decentralization was to increase investment in
education, urban development, water management and perhaps health, no change in
energy, and decrease investment in agriculture, transport, communication, industry and
tourism, and (puzzlingly given the increase in water management) water and sanitation.
But Fig. 8 shows that the number of municipalities investing in these sectors increased for
all except agriculture. This implies that the concentration of investment fell, as more
municipalities invested in a large number of (often smaller) projects in nine sectors.
Fig. 9 shows the number of municipalities where we can reject the hypothesis b1m ¼ b2m;that is, the number of municipalities where decentralization changed investment patterns
significantly during the first three years. The test is significant in about 3/4 of municipalities
for water and sanitation and education, and in 1/3 of municipalities for urban development
and water management, but in only 1/5 of municipalities for agriculture and health and fewer
in other sectors. This suggests that investment patterns changed significantly for water and
sanitation, education, urban development and water management, did not change for
industry and tourism, energy, communication and transport, with agriculture and health
on the border between significantly different and not. Taking into account the results from
test 1, I conclude that agriculture spending did change significantly between the two periods,
while for health it may have but the evidence is inconclusive. Thus two sectors can be added
18 See for example Wolman in Bennet (1990).
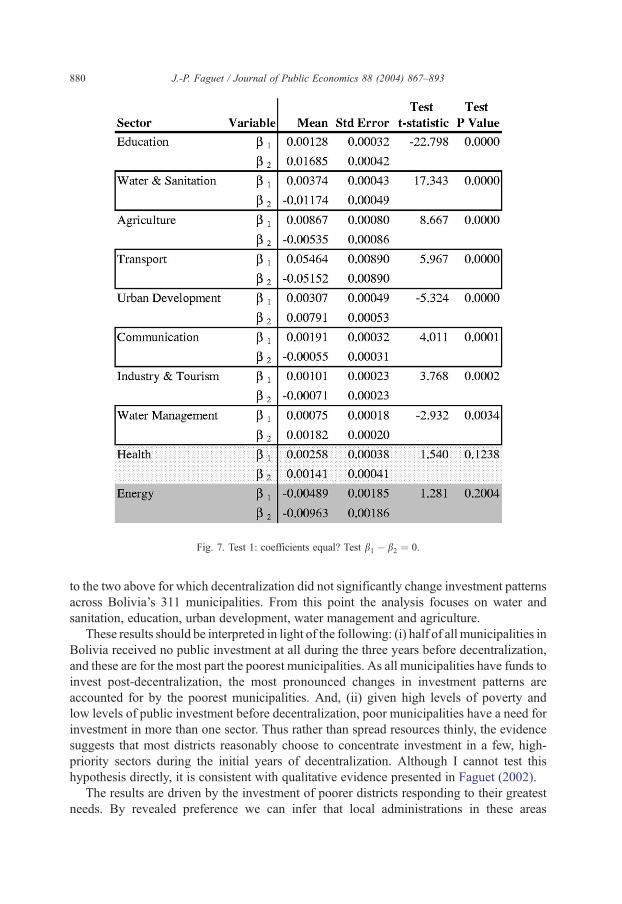
Fig. 7. Test 1: coefficients equal? Test b1 � b2 ¼ 0.
J.-P. Faguet / Journal of Public Economics 88 (2004) 867–893880
to the two above for which decentralization did not significantly change investment patterns
across Bolivia’s 311 municipalities. From this point the analysis focuses on water and
sanitation, education, urban development, water management and agriculture.
These results should be interpreted in light of the following: (i) half of all municipalities in
Bolivia received no public investment at all during the three years before decentralization,
and these are for the most part the poorest municipalities. As all municipalities have funds to
invest post-decentralization, the most pronounced changes in investment patterns are
accounted for by the poorest municipalities. And, (ii) given high levels of poverty and
low levels of public investment before decentralization, poor municipalities have a need for
investment in more than one sector. Thus rather than spread resources thinly, the evidence
suggests that most districts reasonably choose to concentrate investment in a few, high-
priority sectors during the initial years of decentralization. Although I cannot test this
hypothesis directly, it is consistent with qualitative evidence presented in Faguet (2002).
The results are driven by the investment of poorer districts responding to their greatest
needs. By revealed preference we can infer that local administrations in these areas

Fig. 8. Number of municipalities receiving investment, by sector (in municipality-years).
J.-P. Faguet / Journal of Public Economics 88 (2004) 867–893 881
prioritize basic social service projects above productive projects, and productive (i.e.
income-enhancing) projects in turn above economic infrastructure. Hence they will tend to
invest in education and water before agriculture, and agriculture before transport or
communication. Because only a few years of post-decentralization data are available, the
F-test is expected to fail in low-priority sectors, as poor municipalities received little or no
investment under central government and continue to invest little under decentralization.
In high-priority sectors, however, investment will leap upwards from a very low base if
decentralization matters. This is indeed what happens. Decentralization leads to an
increase in investment in water and sanitation and education in 3/4 of all municipalities,
and urban development and water management in 1/3. There are moderate changes in
investment patterns in agriculture and health, and very little change in transport,
communication, energy and industry and tourism. In conclusion, decentralization did
Fig. 9. Test 2: coefficients equal? Test b1m � b2m ¼ 0.
J.-P. Faguet / Journal of Public Economics 88 (2004) 867–893882
change the pattern of Bolivian public investment, and this difference was strongest in the
social services and urban development.
Test 3 investigates the determinants of the difference in dummy state variables, b2 � b1,
equivalent to the increase in investment due to decentralization. Results are examined
sector-by-sector, beginning with education.
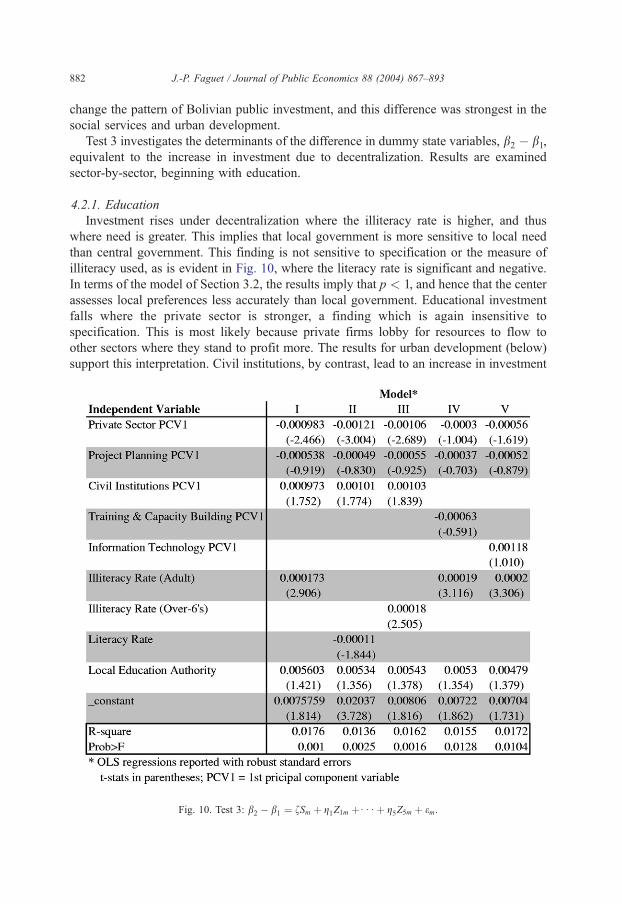
4.2.1. Education
Investment rises under decentralization where the illiteracy rate is higher, and thus
where need is greater. This implies that local government is more sensitive to local need
than central government. This finding is not sensitive to specification or the measure of
illiteracy used, as is evident in Fig. 10, where the literacy rate is significant and negative.
In terms of the model of Section 3.2, the results imply that p < 1, and hence that the center
assesses local preferences less accurately than local government. Educational investment
falls where the private sector is stronger, a finding which is again insensitive to
specification. This is most likely because private firms lobby for resources to flow to
other sectors where they stand to profit more. The results for urban development (below)
support this interpretation. Civil institutions, by contrast, lead to an increase in investment
Fig. 10. Test 3: b2 � b1 ¼ fSm þ g1Z1m þ : : : þ g5Z5m þ em.

J.-P. Faguet / Journal of Public Economics 88 (2004) 867–893 883
after decentralization, suggesting grass roots support for education (i.e. parents worried
about their children). Participative planning methodologies have no effect on investment,
nor do information technology or local training and capacity-building activities.
4.2.2. Water and sanitation
Investment rises under decentralization where more people have no sewerage (Fig. 11).
It also rises where the share of population without access to drinking water increases,
though this finding is sensitive to specification and drops out when other variables are
included in the model. Thus local governments invest more where need is greatest. This
implies that p < 1 in the model above. Participative planning methodologies are significant
and negative, thus decreasing investment, and the private sector and civil institutions are
both insignificant. The latter is surprising given the positive effect of civil institutions on
investment in education.
4.2.3. Water management
The water management sector is related to water and sanitation but is broader in scope,
including reservoirs and wastewater treatment lagoons, levees, and storm drainage works
(Fig. 12). In general the degree of overlap between the two sectors is high, and similar
indicators of need are used for both. Investment in water management is lowest where the
share of population with no access to water is highest, rises as more people have access to
public and private standpipes, and falls again as internal plumbing becomes widespread.
Fig. 11. Test 3: b2 � b1 ¼ fSm þ g1Z1m þ : : : þ g5Z5m þ em.
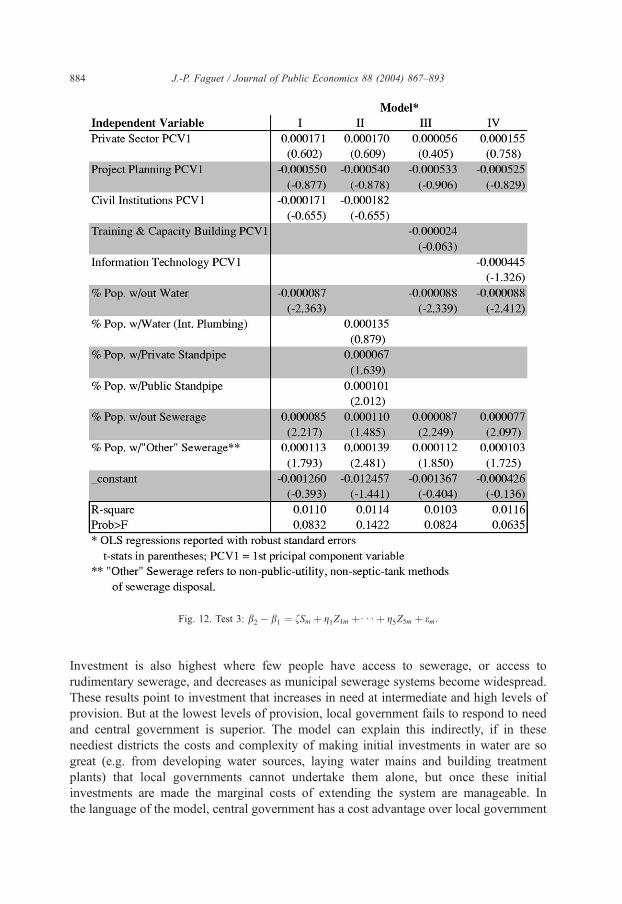
Fig. 12. Test 3: b2 � b1 ¼ fSm þ g1Z1m þ : : : þ g5Z5m þ em.
J.-P. Faguet / Journal of Public Economics 88 (2004) 867–893884
Investment is also highest where few people have access to sewerage, or access to
rudimentary sewerage, and decreases as municipal sewerage systems become widespread.
These results point to investment that increases in need at intermediate and high levels of
provision. But at the lowest levels of provision, local government fails to respond to need
and central government is superior. The model can explain this indirectly, if in these
neediest districts the costs and complexity of making initial investments in water are so
great (e.g. from developing water sources, laying water mains and building treatment
plants) that local governments cannot undertake them alone, but once these initial
investments are made the marginal costs of extending the system are manageable. In
the language of the model, central government has a cost advantage over local government
J.-P. Faguet / Journal of Public Economics 88 (2004) 867–893 885
for initial investments, a < 1. But at intermediate and higher levels of provision p < 1 and
local government’s needs-orientation dominates. Perhaps surprisingly, civic and institu-
tional variables appear to have no effect on investment—only variables of need matter.
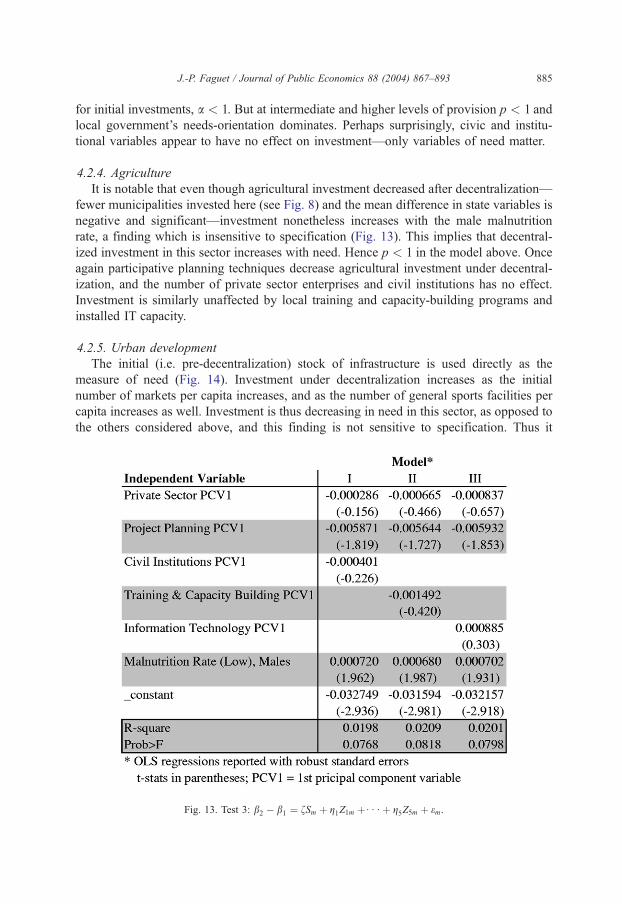
4.2.4. Agriculture
It is notable that even though agricultural investment decreased after decentralization—
fewer municipalities invested here (see Fig. 8) and the mean difference in state variables is
negative and significant—investment nonetheless increases with the male malnutrition
rate, a finding which is insensitive to specification (Fig. 13). This implies that decentral-
ized investment in this sector increases with need. Hence p < 1 in the model above. Once
again participative planning techniques decrease agricultural investment under decentral-
ization, and the number of private sector enterprises and civil institutions has no effect.
Investment is similarly unaffected by local training and capacity-building programs and
installed IT capacity.
4.2.5. Urban development
The initial (i.e. pre-decentralization) stock of infrastructure is used directly as the
measure of need (Fig. 14). Investment under decentralization increases as the initial
number of markets per capita increases, and as the number of general sports facilities per
capita increases as well. Investment is thus decreasing in need in this sector, as opposed to
the others considered above, and this finding is not sensitive to specification. Thus it
Fig. 13. Test 3: b2 � b1 ¼ fSm þ g1Z1m þ : : : þ g5Z5m þ em.
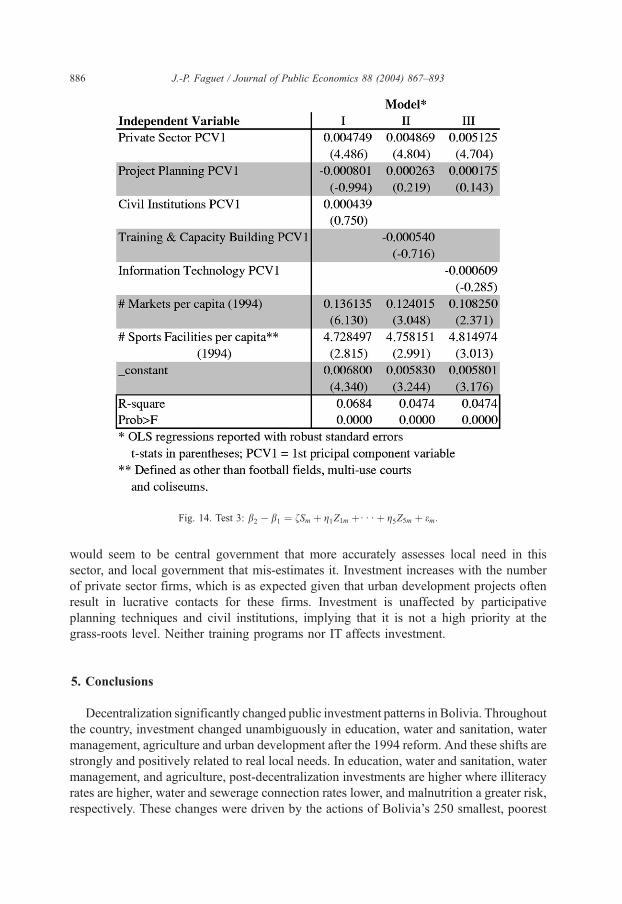
Fig. 14. Test 3: b2 � b1 ¼ fSm þ g1Z1m þ : : : þ g5Z5m þ em.
J.-P. Faguet / Journal of Public Economics 88 (2004) 867–893886
would seem to be central government that more accurately assesses local need in this
sector, and local government that mis-estimates it. Investment increases with the number
of private sector firms, which is as expected given that urban development projects often
result in lucrative contacts for these firms. Investment is unaffected by participative
planning techniques and civil institutions, implying that it is not a high priority at the
grass-roots level. Neither training programs nor IT affects investment.
5. Conclusions
Decentralization significantly changed public investment patterns in Bolivia. Throughout
the country, investment changed unambiguously in education, water and sanitation, water
management, agriculture and urban development after the 1994 reform. And these shifts are
strongly and positively related to real local needs. In education, water and sanitation, water
management, and agriculture, post-decentralization investments are higher where illiteracy
rates are higher, water and sewerage connection rates lower, and malnutrition a greater risk,
respectively. These changes were driven by the actions of Bolivia’s 250 smallest, poorest
J.-P. Faguet / Journal of Public Economics 88 (2004) 867–893 887
municipalities investing newly devolved public funds in their highest-priority projects.
Decentralization thus led to higher investment in human capital and social services as the
poorest regions of the country chose projects according to their greatest needs. In terms of the
model of Section 3.2, this implies that decentralized provision dominated central provision
in these sectors through local government’s superior sensitivity to local needs. These results
are consistent with evidence elsewhere (see Faguet, 2002, Chapter 3) that examines the
broader determinants of central vs. local investment separately.
In econometric terms, the most interesting feature of the results is that no terms other
than need are consistently significant across the five principal sectors analyzed. Relation-
ships of need are robust and insensitive to specification. By contrast social, institutional
and procedural variables are infrequently significant across sectors, and seem to account
for little total variation.
Indeed, the only apparent effect of private sector firms is to transfer resources from
education to urban development. Civil institutions are significant only for education, where
they increase investment, and insignificant everywhere else. Training, capacity-building and
IT are insignificant for all sectors. This implies that the differences in investment patterns
chronicled above are not related to the number of private enterprises or civil institutions, or
driven exogenously by training programs or information technology, but are instead
determined by local needs. That decentralization in Bolivia led to investment increases in
precisely those districts with the worst demographic indicators and infrastructure endow-
ments runs counter to what numerous researchers, using mostly case studies and qualitative
approaches, have found in the past. And it directly contradicts the common argument that
decentralization leads to poor-quality government in communities that are deprived.
The data presented in this paper are from one of the poorest countries in the Western
hemisphere, and took years to collect, clean and organize. But its quality is sufficient to
permit significant and counter-intuitive results. This suggests that the application of a similar
methodology—detailed econometric analysis of the local political economy—to more
developed countries could prove quite fruitful. The increasing trend toward decentralization
is also bound to provide more natural experiments for researchers to study. Lastly, the above
analysis leaves open the question of how political power is distributed in a central
government, the institutional mechanisms by which governments sense and take up local
demand for public services, and the precise nature of the organizational or technical
advantages or scale economies which might benefit one level of government over another.
That is, p; hm and a are all exogenous here. Further research is needed to understand these
processes and endogenize them in our models of public goods provision.19
Acknowledgements
A longer version of this paper is published asWorld Bank Policy Research working paper
no. 2516. This is taken from chapter 2 of my Ph.D. dissertation. The research in this paper
was financed by a grant from the World Bank Research Committee. An ORS award and
additional financial support were kindly provided by the ESRC. I am very grateful to my
19 I examine these questions elsewhere for the case of Bolivia; see Faguet (2002).
J.-P. Faguet / Journal of Public Economics 88 (2004) 867–893888
advisers Tim Besley and Teddy Brett for invaluable criticism, advice and encouragement
through the numerous iterations of this work. I also wish to thank Roli Asthana, Pranab
Bardhan, Monica Baumgarten, Shanta Devarajan, Gunnar Eskeland, Carol Graham,Markus
Haacker, Dilip Mookherjee, James Putzel, James Snyder, Nick Stern, seminar participants at
the IDB, LSE, World Bank, and at the LACEA99 and LACEA-PEG/NIP 2001 conferences,
and two anonymous referees for their thoughtful comments and suggestions. All remaining
errors are my own.
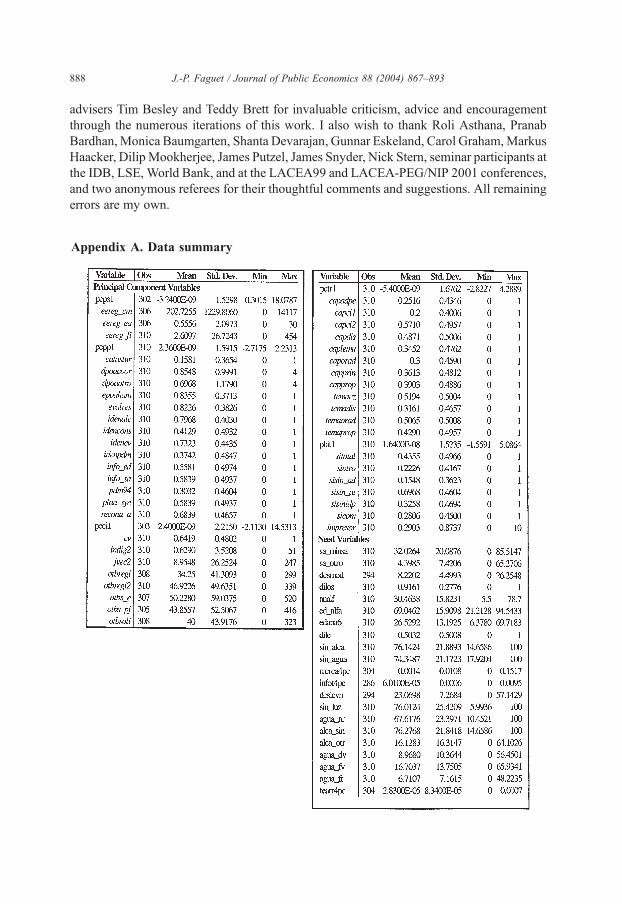
Appendix A. Data summary
J.-P. Faguet / Journal of Public Economics 88 (2004) 867–893 889
Appendix B. Methodology, including principal component analysis and
interpretation
The surprisingly large amount of information available for Bolivia during the period
1987–1996 demands a strategy for choosing, from among 1200+ variables, those which
are most appropriate and most closely related to the underlying concepts I wish to test. In
particular, a number of measures in which I am interested are present in my dataset as
multiple, finely differentiated variables. I have data on, for example, 16 varieties of
capacity-building exercises undertaken by municipalities, and 13 different local actors who
assisted in drafting municipal development plans. The challenge is to reduce such groups
to at most one indicator each without loss of information.
My empirical strategy is iterative, and begins by finding the best idiosyncratic model of
public investment for each of the 10 sectors of interest. I fit the equation
Gm ¼ fSm þ gZ þ em; ðB:1Þ
separately for central public investment (1991–1993) and local public investment
(1994–1997) where Gm is aggregate investment per capita in the public good
subscripted by municipality, Sm is a scalar or vector of the existing stock of public
goods of that type (variously defined) at an initial period, and Z is a vector of socio-
economic, demographic, regional, political, institutional, administrative and procedural
variables which might affect investment decisions. The use of the Z term follows the
literature on the demand for public goods exemplified by Bergstrom and Goodman
(1973) and Rubinfeld et al. (1987) within the context of the available data. In
particular, no income data are available at the municipal level in Bolivia, and so I
substitute several alternative indicators of income and wealth, for example type of
cooking fuel, and housing size, quality and related characteristics. But I expand the
scope of the Z vector considerably compared to previous authors by including
measures of the strength of local political forces as well as municipal institutional
capacity. This innovation allows me to investigate the micropolitical basis of local
government decision-making, explored in detail in Faguet (2002).
No constraints across sectors are allowed on the particular variables admissible in Z. I
use the Huber/White estimator of variance to produce consistent standard errors in the
presence of non-identically distributed residuals. This produces 10 different models of
public sector investment, one for each sector. Individually these models are quite
satisfactory, with high R2 and few variables insignificant. But because of large variation in
the specification of the Z vector, comparison across sectors is problematic. Additionally,
on a theoretical level these models would seem to assert that public investment in different
sectors happens according to different processes, in which different variables intervene.
This is evidently unsatisfying.
In a second iteration I re-estimate Eq. (B.1) holding the Z vector constant across all
sectors. But I take advantage of the previous stage by using only those variables found
significant there; in this sense the previous stage constitutes a method for reducing the
1200+ indicators to a subset of 197. But a dimensionality problem persists even so. I then
J.-P. Faguet / Journal of Public Economics 88 (2004) 867–893890
employ a method of forward and backward substitution and elimination in order to reduce
this subset to 22 variables encompassing the 13 categories of Z, in specifications of 23–30
variables overall. These models benefit from being readily comparable across sectors. The
ratio of significant to insignificant variables drops sharply compared to the first stage,
however, and R2 values are somewhat lower.
The insignificance of the variables chosen is not entirely separable from the issue
of comparability, however. In these results none of the variables is significant in most
of the sectors, and many are significant in only 2 or 3. How do we interpret a given
variable across sectors, knowing that an alternative one from the same group would
produce a different pattern of significance and insignificance? For example, how do
we interpret the insignificance of training and capacity-building variables in most
models when we know from stage 1 that there is at least one alternative such variable
that is significant in each sector? We evidently cannot assert for any sector that
capacity building does not matter; we must conclude that the comparability constraint
forces us to omit from our models information that is important in explaining
investment behavior.
Indeed, given that there are 197 variables, many of them quite specific, which have
explanatory power over the dependent variable, any subset of 20, 30, or even 100 will omit
valuable information. We require a solution that allows us to retain the full breadth of
information, and yet produce a specification which is both comparable and parsimonious. I
turn to principal component analysis, a data reduction technique in which the objective is
to find the unit-length combinations of explanatory variables with the highest variance. I
follow Maddala (1977) in calculating variables z1 to zk where z is a linear combination of
the x variables
z1 ¼ a1x1 þ a2x2 þ : : : þ aLxL
z2 ¼ b1x1 þ b2x2 þ : : : þ bLxL etc:20
ranked in order of variance, with highest first. Principal component analysis regresses y on
z1; z2; . . . ; zk, where k < L and z’s are constructed so as to be orthogonal. So long as the z’s
chosen represent combinations of variables that have economic meaning and can be
interpreted, this provides a method for estimating parsimonious models with limited loss
of information.
I calculate a set of principal component variables (PCVs) based on the raw variables
retained in stage 1. I discard all those with low eigenvalues, as per normal procedure, and
then find the remaining subset which optimally estimate Eq. (B.1), where Z is a vector of
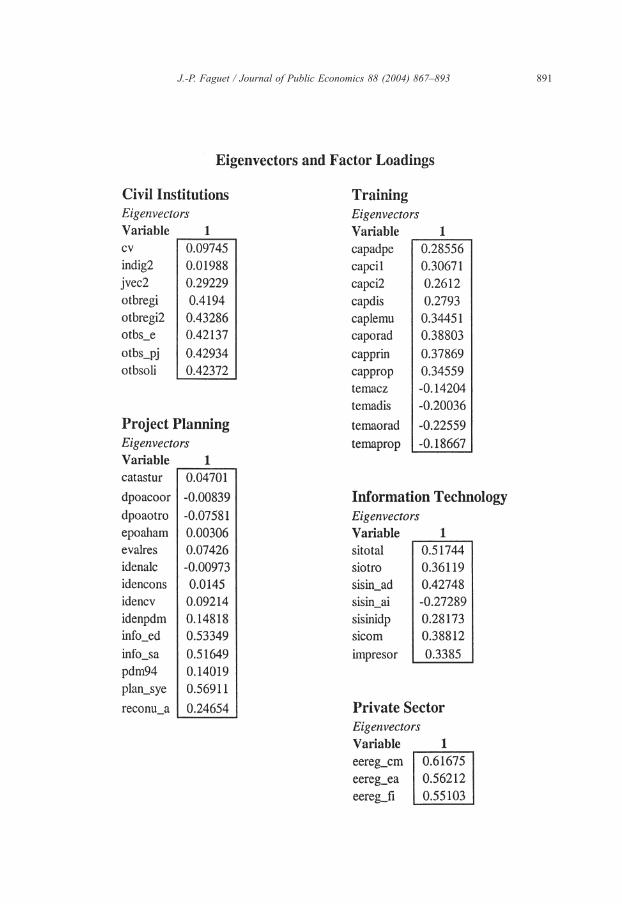
PCVs. The eigenvectors associated with each of the PCVs used in this article are listed
below; factor loadings on the raw variables can be read vertically down each column.
Detailed interpretations of each PCV follow.
20 For further treatment of this topic, see also Greene (1997).
J.-P. Faguet / Journal of Public Economics 88 (2004) 867–893 891
J.-P. Faguet / Journal of Public Economics 88 (2004) 867–893892
Interpretation of PCVS
Civil institutions: this is an indicator of the number of organizations and institutions of
local civil society. It rises in all the variables, especially in the more general measures. I
interpret it as a proxy for the strength of local civil institutions.
Private sector: this PCV rises in the number of private businesses registered locally. I
construe it as an indicator of the dynamism of the local private sector.
Training: this variable rises in categories of training (i.e. institutional strengthening)
received by the municipality and falls in those requested but not yet received. Hence I
interpret it as a measure of the intensity of capacity-building efforts undertaken by/for
local government.
Information technology: this PCV rises in the IT systems—hardware and software
(especially software)—at the disposal of each municipality.
Project planning: this PCV loads positively where municipalities use information on
education and health when planning projects, where sectoral regulations are followed in
water and sanitation, where a Municipal Development Plan exists, and where councilmen
and oversight committees identify investment projects using the MDP and urban cadaster.
It loads negatively where the mayor is the one who identifies investment projects, and
where problems arise with the Annual Operating Plan. This is thus a straightforward
indicator of informed project planning which follows consensual and open procedures.
References
Bardhan, P., 2001. Notes on Decentralization. Berkeley, Manuscript.
Bennett, R.J. (Ed.), 1990. Decentralization, Local Governments and Markets: Towards a Post-Welfare Agenda.
Clarendon Press, Oxford.
Bergstrom, T., Goodman, R., 1973. Private demand for public goods. American Economic Review 63, 280–296.
Besley, T., Coate, S., 1999. Centralized versus Decentralized Provision of Local Public Goods: A Political
Economy Analysis. National Bureau of Economic Research, Cambridge, MA, NBER working paper 7084.
Campbell, T., 2001. The Quiet Revolution: The Rise of Political Participation and Leading Cities with Decentral-
ization in Latin America and the Caribbean. University of Pittsburgh Press, Pittsburgh.
Crook, R.C., Sverrisson, A.S., 1999. To What Extent Can Decentralized Forms of Government Enhance the
Development of Pro-Poor Policies and Improve Poverty-Alleviation Outcomes, Manuscript.
Estache, A., Sinha, S., 1995. Does Decentralization Increase Spending on Public Infrastructure? World Bank,
Washington, DC. Policy research working paper 1457.
Faguet, J.P., 2002. Decentralizing the Provision of Public Services in Bolivia: Institutions, Political Competition
and the Effectiveness of Local Government. London School of Economics Ph.D. dissertation.
Fisman, R., Gatti, R., 2000. Decentralization and Corruption: Evidence across Countries. World Bank, Wash-
ington, DC. Working paper no. 2290.
Galasso, E., Ravallion, M., 2000. Distributional Outcomes of a Decentralized Welfare Program Manuscript.
Greene, W., 1997. Econometric Analysis. Prentice Hall, Upper Saddle River.
Hanson, R.L., Hartman, J.T., 1994. Do Welfare Magnets Attract? Institute for Research on Poverty, University of
Wisconsin at Madison, Madison.
Humplick, F., Moini-Araghi, A., 1996. Decentralized Structures for Providing Roads: A Cross-Country Compar-
ison. World Bank, Washington, DC, Policy research working paper 1658.
Huther, J., Shah, A., 1998. Applying a Simple Measure of Good Governance to the Debate on Fiscal Decentral-
ization. World Bank, Washington, DC Policy research working paper 1894.
Klein, H., 1993. Historia de Bolivia. Librerıa-Editorial Juventud, La Paz.
J.-P. Faguet / Journal of Public Economics 88 (2004) 867–893 893
Maddala, G.S., 1977. Econometrics. McGraw-Hill, New York.
Manor, J., 1997. Lecture given at Technical Consultation on Decentralization for Rural Development, Rome,
16–18 December.
Manor, J., 1999. The Political Economy of Democratic Decentralization. World Bank, Washington, DC.
Oates, W., 1972. Fiscal Federalism. New York: Harcourt Brace.
Oates, W., 1985. Searching for leviathan: an empirical study. American Economic Review 75, 748–757.
Piriou-Sall, S., 1998. Decentralization and Rural Development: A Review of Evidence, Manuscript.
Rondinelli, D.A., Cheema, G.S., Nellis, J., 1983. Decentralization in Developing Countries: A Review of Recent
Experience. World Bank, Washington, DC, Staff working paper no. 581.
Rubinfeld, D., Shapiro, P., Roberts, J., 1987. Tiebout bias and the demand for local public schooling. Review of
Economics and Statistics 69, 426–437.
Samoff, J., 1990. Decentralization: the politics of interventionism. Development and Change 21, 513–530.
Secretarıa Nacional de Participacion Popular, Ministerio de Desarrollo Sostenible y Medio Ambiente, 1994. Ley
de Participacion Popular, Reglamento de las Organizaciones Territoriales de Base. Secretarıa Nacional de
Participacion Popular, Ministerio de Desarrollo Sostenible y Medio Ambiente, La Paz.
Shah, A., 1998. Balance, Accountability and Responsiveness: Lessons about Decentralization. World Bank,
Washington DC Policy research working paper 2021.
Slater, D., 1989. Territorial power and the peripheral state: the issue of decentralization. Development and
Change 20, 501–531.
Smith, B.C., 1985. Decentralization: The Territorial Dimension of the State. George Allen & Unwin, London.
Smoke, P., 2001. Fiscal Decentralization in Developing Countries: A Review of Current Concepts and Practice.
UNRISD, Geneva Democracy, governance and human rights programme paper no. 2.
Tiebout, C.M., 1956. A pure theory of local expenditures. Journal of Political Economy 64, 416–424.
United Nations Development Program (UNDP), 1993. Informe Sobre Desarrollo Humano 1993. CIDEAL,
Madrid.
Wallis, J.J., Oates, W.E., 1988. Decentralization in the public sector: an empirical study of state and local
government. In: Rosen, H.S. (Ed.), Fiscal Federalism: Quantitative Studies. University of Chicago Press,
Chicago.
World Bank, 1994. World Development Report: Infrastructure for Development. Oxford University Press, New
York.
World Bank, 1995. Colombia Local Government Capacity: Beyond Technical Assistance. World Bank, Wash-
ington, DC, World Bank report 14085-C.
Zax, J.S., 1989. Initiatives and government expenditures. Public Choice 63, 267–277.