does democracy reduce corruption? - chr. michelsen … · funded by the royal norwegian embassy in...
TRANSCRIPT
Does democracy reduce corruption?
Ivar KolstadArne Wiig
WP 2011: 4
Chr. Michelsen Institute (CMI) is an independent, non-profit research institution and a major international centre in policy-oriented and applied development research. Focus is on development and human rights issues and on international conditions that affect such issues. The geographical focus is Sub-Saharan Africa, Southern and Central Asia, the Middle East and Latin America.
CMI combines applied and theoretical research. CMI research intends to assist policy formulation, improve the basis for decision-making and promote public debate on international development issues.
Does democracy reduce corruption?
Ivar Kolstad
Arne Wiig
WP 2011: 4

Project number 10057 Project title Democracy and corruption Funded by the Royal Norwegian Embassy in Bangladesh.
CMI WORKING PAPER DOES DEMOCRACY REDUCE CORRUPTION? WP 2011: 4
iii
Contents Abstract .......................................................................................................................................................... iv
1. Introduction ............................................................................................................................................. 1
2. Background and methodology ................................................................................................................. 3
2.1 A brief review of the literature on democracy and corruption ............................................................. 3 2.2 Estimation strategy ................................................................................................................................ 4 2.3 Democracy and conflict – a descriptive overview ................................................................................. 6
3. Data ......................................................................................................................................................... 9
4. Results ................................................................................................................................................... 12
4.1 Main results ......................................................................................................................................... 12 4.2 Robustness to additional covariates .................................................................................................... 14 4.3 Results using panel data ...................................................................................................................... 17
5. Concluding remarks ............................................................................................................................... 19
References ..................................................................................................................................................... 21
Appendix ........................................................................................................................................................ 23
Ivar Kolstad
Chr. Michelsen Institute, P.O. Box 6033 Bedriftssenteret, N-5892 Bergen, Norway. Phone: +47 47 93 81 22. Fax: +47 55 31 03 13. E-mail: [email protected]
Arne Wiig
Chr. Michelsen Institute, P.O. Box 6033 Bedriftssenteret, N-5892 Bergen, Norway. Phone: +47 47 93 81 23. Fax: +47 55 31 03 13. E-mail: [email protected].
CMI WORKING PAPER DOES DEMOCRACY REDUCE CORRUPTION? WP 2011: 4
iv
Abstract While democracy is commonly believed to reduce corruption, there are obvious endogeneity problems in measuring the impact of democracy on corruption. This paper addresses the endogeneity of democracy by exploiting the common observation that democracies seldom go to war against each other. We instrument for democracy using a dummy variable reflecting whether a country has been at war with a democracy in the period 1946-2009, while controlling for the extent to which countries have been at war in general. We find that democracy to a significant extent reduces corruption, and the effect is considerably larger than suggested by estimations not taking endogeneity into account. Democracy is hence more important in combating corruption than previous studies would suggest.
CMI WORKING PAPER DOES DEMOCRACY REDUCE CORRUPTION? WP 2011: 4
1
1. Introduction Does democracy reduce corruption? The answer may not be obvious. Take electoral democracy for instance. On the one hand, competitive elections are likely to reduce corruption as corrupt incumbents may be voted out of office. On the other hand, the need to finance political campaigns may induce politicians to trade political decisions for funding. At a simple descriptive level, there are countries that do not fit into a pattern of more democracy - less corruption. Singapore is frequently mentioned as an example of a relatively undemocratic country where corruption is low. Conversely, democratic countries like Mongolia, Paraguay or Nicaragua have high levels of corruption. There may of course be other variables that explain corruption levels in these countries. However, econometric studies also find very mixed results on the association between democracy and corruption. Some studies report a significantly negative relation between the two, others find no significant relation (see e.g. Lambsdorff (2005) for a review of previous studies).
Estimating the causal effect of democracy on corruption is complicated by the fact that democracy is endogenous. Both democracy and corruption are likely to be affected by third variables that may be hard to observe or quantify, such as culture. Moreover, there may be reverse causality, corruption may for instance undermine the confidence of voters in the democratic system, and hence trigger reversals. This means that ordinary least squares estimates of the effect of democracy are likely biased, as there is a selection on unobservables problem. Previous empirical studies have not addressed this problem, and as pointed to by Treisman (2007:236) “researchers have not found any convincing instruments for democratic institutions”. This is perhaps not surprising, as democracy is not typically introduced through natural experiments, nor is it easy to find a variable correlated with democracy but not with corruption. Nevertheless, it means that previous studies may have produced biased results on the effect of democracy.
This paper attempts to identify the causal impact of democracy on corruption by using an instrument based on the conflict history of countries. Specifically, the instrument for democracy is a dummy variable indicating whether a country has been at war with a democracy in the period 1946-2009. The relevance of the instrument is based on the observation that democracies seldom go to war against each other, hence you would expect a negative correlation between being a democracy and having been in conflict with a democracy. While there is a large literature debating this observation, we show that there is enough of a correlation for the instrument to work. The validity of our instrument is based on the idea that having been involved in conflict with a democracy does not affect corruption, when controlling for whether countries have been involved in conflict in general. In other words, while it is plausible that countries that have a history of conflict with other countries may have higher levels of corruption, there is no reason why having a history of conflict with democracies in particular would be related to corruption levels. Controlling for conflict in general, conflict with democracies should therefore be a valid instrument. Based on this assumption, our estimates capture a causal effect of democracy on corruption.
The instrument variable (IV) regression results show a significantly negative effect of democracy on corruption. In other words, democracy reduces corruption. The estimated effect is larger than comparable estimates not taking endogeneity into account, suggesting that democracy may be more important in combatting corruption than previous studies would suggest. The downward bias (in absolute terms) of ordinary least squares estimates may be one reason why previous studies have failed to find a robust relation between democracy and corruption. We also look into the question of which countries our estimates are relevant for. If effects of democracy on corruption are heterogeneous, it is possible that our IV estimates capture a local average treatment effects for some types of countries, rather than an average treatment effect across countries. The results indicate that our estimates identify the effect of democracy on corruption in developing countries, and at higher levels of democracy. In other words, our results indicate a substantive impact on corruption of incremental changes in democracy in relatively poor and somewhat democratic countries such as Malawi, Mozambique, Nepal, Sri Lanka or Bangladesh.
CMI WORKING PAPER DOES DEMOCRACY REDUCE CORRUPTION? WP 2011: 4
2
The paper is structured as follows. Section two briefly reviews the theoretical and empirical literature on democracy and corruption, before explaining the estimation strategy, and providing an in-depth description of the instrument variable. Section three presents the data used in the econometric analysis. Section four presents the main results, followed by a discussion of robustness and local average treatment effects. A separate subsection is also devoted to the issue of panel data estimation. Section five concludes.
CMI WORKING PAPER DOES DEMOCRACY REDUCE CORRUPTION? WP 2011: 4
3
2. Background and methodology
2.1 A brief review of the literature on democracy and corruption
Corruption is standardly defined as the abuse of public office for private gain, or the abuse of entrusted power for private gain. Various measures of corruption levels at the country level exist, from subjective perceptions indices to more objective experiential measures, and the pros and cons of these indices have been adequately explored elsewhere (Svensson, 2005; Treisman, 2007). For pragmatic reasons of country coverage, and in line with most previous empirical studies of corruption, we rely primarily on perceptions indices of corruption in our analysis (see section three for details). So, strictly speaking, we estimate the effect of democracy on corruption perceptions. The definition of democracy has been extensively debated in political science. Minimalist definitions see democracy as an institutional arrangement where citizens express their preferences through elections (Schumpeter, 1950). More extensive definitions also add conditions necessary for preferences to be effectively formulated, expressed, and fairly weighted in decisions, including civil liberties such as freedom of expression (Dahl, 1971). This has evolved into a characterization of democracy as various forms of government accountability. Vertical accountability denotes the accountability of government to the people through elections, horizontal accountability refers to checks and balances within government, and societal accountability refers to the existence of a free press, civil society and so on. While a number of democracy indices exist, we employ the most commonly used indices in previous studies of democracy and corruption. These capture primarily vertical and horizontal accountability, so strictly speaking we estimate the effect of these forms of accountability on perceived corruption.
From a theoretical perspective, there are several reasons why we might expect democracy to reduce corruption. Elections increase the probability that corrupt officials will be exposed and punished, as the opposition has an incentive to uncover corrupt activities by the incumbent, and voters have an interest in not reelecting politicians that favour their own private interests over those of the electorate. Moreover, competitive elections likely drive down the private rents that can be appropriated by officials, since offers of favourable treatment for special interests can be undercut by the opposition (Myerson, 1993; Ades and Tella 1999). Democracy can also entail a more open system of government, which means that private information on how the system works will become less prevalent, and information rents will go down. Effective checks and balances within government may similarly constrain the ability of officials to deviate from impartial practices. In other words, knowing someone in power becomes less valuable. Furthermore, democracy may affect the normative perceptions of corruption in a society, making corrupt activities less appealing as they carry a greater stigma, and possibly also affecting the type of individuals attracted to public office. In sum, democracy may reduce corruption by reducing private benefits of corrupt actions and increasing expected costs.
There are, however, also theoretical arguments to the contrary. Election campaigns require funding, and more competitive elections may make political parties and candidates vulnerable to pressure from funders (Rose-Ackerman, 1999). And as shown by Pani (2011), even a rational and informed median voter may choose to vote for a corrupt government for strategic reasons. In some societies, it has been argued that the introduction of democracy has served to reinforce existing patron-client relationships, leading to the democratization of corruption rather than its reduction. The effect of a more open government is also ambiguous, Bac (2001) argues that transparency makes it easier to identify which official to bribe, and shows that this effect may dominate a corruption detection effect for small changes in transparency. Moreover, institutions of horizontal accountability are often appointed or funded by the government, which may reduce incentives and capacities to address government corruption. In the worst case, these institutions may be used to persecute political opponents of the government, rather than hold the government accountable. Finally, if normative perceptions or the risk of getting caught in corrupt acts depend on the number of corrupt officials in a society, this means that there may be multiple equilibria with different levels of corruption, and small changes in norms or
CMI WORKING PAPER DOES DEMOCRACY REDUCE CORRUPTION? WP 2011: 4
4
behaviour brought about by democracy may be insufficient to dislodge a high corruption equilibrium. In total, these arguments imply that democracy may have no effect on corruption, or could in principle also increase corruption.
Whether democracy reduces corruption is in the end an empirical question. It is, however, hard to draw any conclusions on the impact of democracy on corruption from existing empirical studies. Treisman (2007) generally finds a significantly negative relation between the two, but notes that the result is sensitive to the democracy index used in estimations. An earlier study by Treisman (2000) suggests, however, that it is the duration of democracy that matters rather than democracy in itself. While Rock (2009) claims to find the same result, his index of democracy duration is in fact an index of regime duration, the inclusion of which makes the democracy index insignificant. In the analysis of Paldam (2002), adding income level as a covariate makes democracy insignificant. Others suggest that it is the degree of inequality in a society rather than democracy which determines corruption (Uslaner, 2008). In sum, and as reflected in the review of the corruption literature by Lambsdorff (2005), existing results on the relation between democracy and corruption are mixed.
A main problem that previous empirical studies do not address is the possibility that democracy is endogenous. In addition to controlling for observable covariates, an analysis of the causal impact of democracy on corruption needs a strategy for addressing the possibility that there are unobservable variables correlated with democracy that affect corruption. That previous studies have not done so is not due to a lack of awareness of the problem, but difficulties in finding a valid instrument, as reflected in the statement by Treisman (2007) quoted in the introduction. This results in biased estimates, where the direction of the bias is not clear a priori. Unobserved variables that are positively or negatively associated with both democracy and corruption will entail ordinary least squares estimates that are biased upwards, indicating that democracy reduces corruption less than is actually the case. An example of such a variable could be cultural traits of deference to authority, which could make people accepting of authoritarianism but not of corruption. Conversely, unobserved variables that affect democracy and corruption in opposite ways would result in ordinary least squares estimates that are biased downwards, suggesting a negative of no effect of democracy where in fact democracy may possibly increase corruption. While we control for the various observables included in previous studies, it is the problem of unobservables that this study attempts to address.
The focus of our analysis is on the causal impact of democracy per se on corruption. While there is a large literature discussing how different types or features of democracy affect corruption (see e.g. Kunicova (2006) for an overview), we do not address these issues here. Among others, Persson and Tabellini (2005) and Treisman (2007) distinguish between different forms of government (presidentialism versus parliamentarism) and electoral rules (district magnitude, electoral formula and ballot structure). Brunetti and Weder (2003) and Treisman (2007) study the relation between press freedom and corruption. Since societies do not randomly adopt different systems or features of democracy, the endogeneity problem arises again in these forms of analyses. Our instrument does not help us address these distinctions, and they are hence not our focus. For similar reasons, we do not address the question of whether the effect of democracy is conditional on other variables that are also likely to be endogenous. Dong and Torgler (2011), for instance, argue that the impact of democracy is conditional on income distribution and property rights protection. Finally, our instrument is not suited for the analysis of non-linear effects of democracy on corruption (cf. e.g. Mohtadi and Roe, 2003).
2.2 Estimation strategy
There is every reason to believe that endogeneity poses a real challenge in estimation the effect of democracy on corruption. These two variables are likely influenced by a number of the same variables, several of which are difficult to observe in practice. It is, for instance, difficult to control for all cultural or historical factors which have may have affected both the impartiality of the institutions in a country and the impartiality of the behaviour of its officials. In other words, there is a selection problem here, as countries self-select in to democracy on the basis of unobservable variables likely to
CMI WORKING PAPER DOES DEMOCRACY REDUCE CORRUPTION? WP 2011: 4
5
also affect corruption. Moreover, there is also likely reverse causality between the two variables; democracy may be harder to attain or sustain in corrupt countries. The likely correlation this produces between democracy and the error term means that ordinary least squares estimation does not capture a causal effect of democracy on corruption.
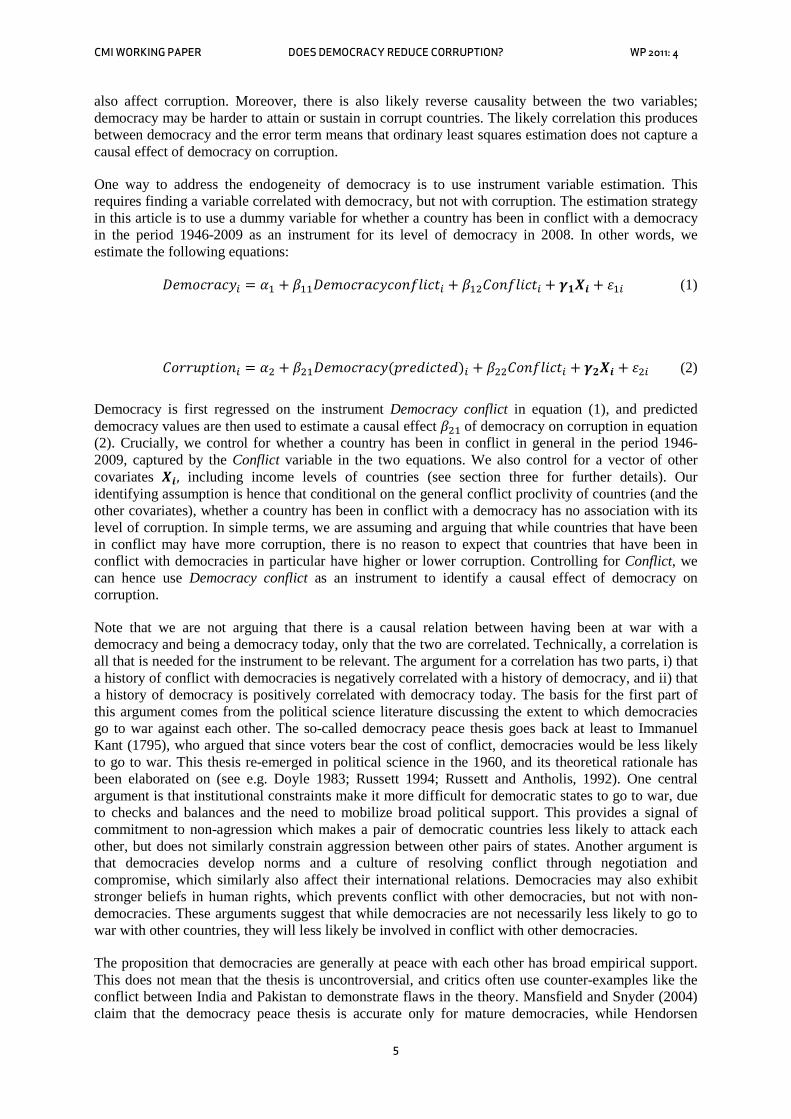
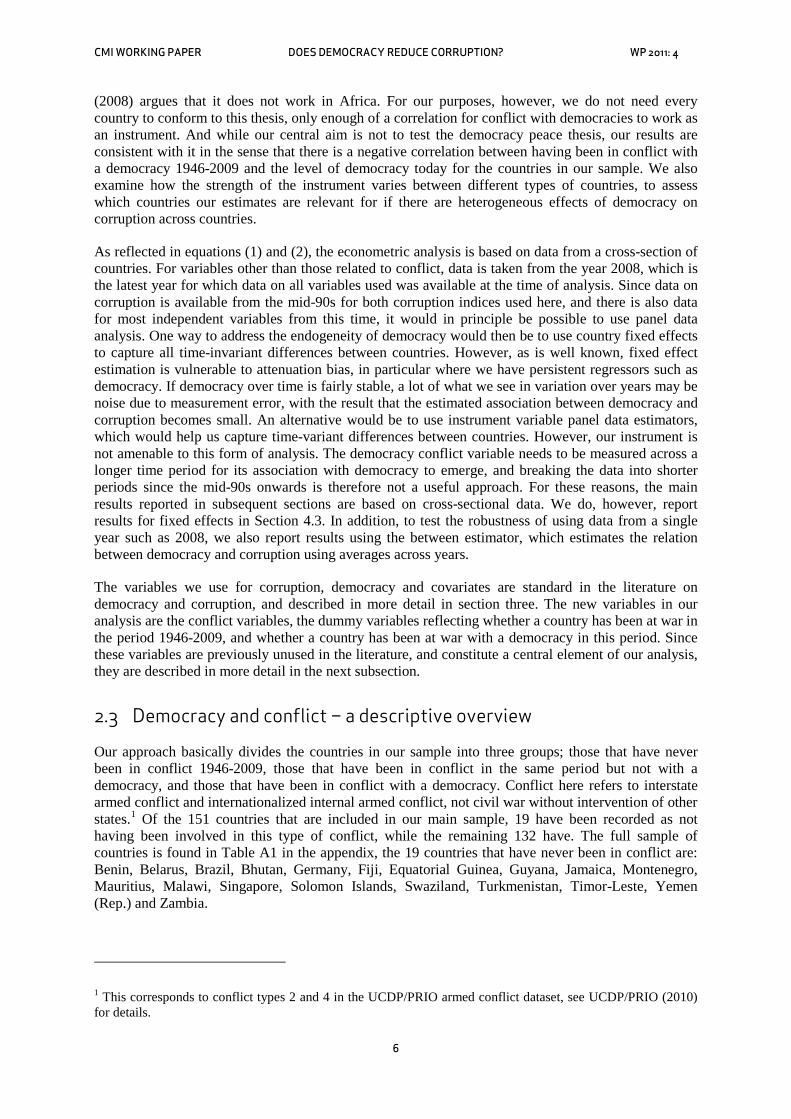
One way to address the endogeneity of democracy is to use instrument variable estimation. This requires finding a variable correlated with democracy, but not with corruption. The estimation strategy in this article is to use a dummy variable for whether a country has been in conflict with a democracy in the period 1946-2009 as an instrument for its level of democracy in 2008. In other words, we estimate the following equations:
𝐷𝑒𝑚𝑜𝑐𝑟𝑎𝑐𝑦𝑖 = 𝛼1 + 𝛽11𝐷𝑒𝑚𝑜𝑐𝑟𝑎𝑐𝑦𝑐𝑜𝑛𝑓𝑙𝑖𝑐𝑡𝑖 + 𝛽12𝐶𝑜𝑛𝑓𝑙𝑖𝑐𝑡𝑖 + 𝜸𝟏𝑿𝒊 + 𝜀1𝑖 (1)
𝐶𝑜𝑟𝑟𝑢𝑝𝑡𝑖𝑜𝑛𝑖 = 𝛼2 + 𝛽21𝐷𝑒𝑚𝑜𝑐𝑟𝑎𝑐𝑦(𝑝𝑟𝑒𝑑𝑖𝑐𝑡𝑒𝑑)𝑖 + 𝛽22𝐶𝑜𝑛𝑓𝑙𝑖𝑐𝑡𝑖 + 𝜸𝟐𝑿𝒊 + 𝜀2𝑖 (2)
Democracy is first regressed on the instrument Democracy conflict in equation (1), and predicted democracy values are then used to estimate a causal effect 𝛽21 of democracy on corruption in equation (2). Crucially, we control for whether a country has been in conflict in general in the period 1946-2009, captured by the Conflict variable in the two equations. We also control for a vector of other covariates 𝑿𝒊, including income levels of countries (see section three for further details). Our identifying assumption is hence that conditional on the general conflict proclivity of countries (and the other covariates), whether a country has been in conflict with a democracy has no association with its level of corruption. In simple terms, we are assuming and arguing that while countries that have been in conflict may have more corruption, there is no reason to expect that countries that have been in conflict with democracies in particular have higher or lower corruption. Controlling for Conflict, we can hence use Democracy conflict as an instrument to identify a causal effect of democracy on corruption.
Note that we are not arguing that there is a causal relation between having been at war with a democracy and being a democracy today, only that the two are correlated. Technically, a correlation is all that is needed for the instrument to be relevant. The argument for a correlation has two parts, i) that a history of conflict with democracies is negatively correlated with a history of democracy, and ii) that a history of democracy is positively correlated with democracy today. The basis for the first part of this argument comes from the political science literature discussing the extent to which democracies go to war against each other. The so-called democracy peace thesis goes back at least to Immanuel Kant (1795), who argued that since voters bear the cost of conflict, democracies would be less likely to go to war. This thesis re-emerged in political science in the 1960, and its theoretical rationale has been elaborated on (see e.g. Doyle 1983; Russett 1994; Russett and Antholis, 1992). One central argument is that institutional constraints make it more difficult for democratic states to go to war, due to checks and balances and the need to mobilize broad political support. This provides a signal of commitment to non-agression which makes a pair of democratic countries less likely to attack each other, but does not similarly constrain aggression between other pairs of states. Another argument is that democracies develop norms and a culture of resolving conflict through negotiation and compromise, which similarly also affect their international relations. Democracies may also exhibit stronger beliefs in human rights, which prevents conflict with other democracies, but not with non-democracies. These arguments suggest that while democracies are not necessarily less likely to go to war with other countries, they will less likely be involved in conflict with other democracies.
The proposition that democracies are generally at peace with each other has broad empirical support. This does not mean that the thesis is uncontroversial, and critics often use counter-examples like the conflict between India and Pakistan to demonstrate flaws in the theory. Mansfield and Snyder (2004) claim that the democracy peace thesis is accurate only for mature democracies, while Hendorsen
CMI WORKING PAPER DOES DEMOCRACY REDUCE CORRUPTION? WP 2011: 4
6
(2008) argues that it does not work in Africa. For our purposes, however, we do not need every country to conform to this thesis, only enough of a correlation for conflict with democracies to work as an instrument. And while our central aim is not to test the democracy peace thesis, our results are consistent with it in the sense that there is a negative correlation between having been in conflict with a democracy 1946-2009 and the level of democracy today for the countries in our sample. We also examine how the strength of the instrument varies between different types of countries, to assess which countries our estimates are relevant for if there are heterogeneous effects of democracy on corruption across countries.
As reflected in equations (1) and (2), the econometric analysis is based on data from a cross-section of countries. For variables other than those related to conflict, data is taken from the year 2008, which is the latest year for which data on all variables used was available at the time of analysis. Since data on corruption is available from the mid-90s for both corruption indices used here, and there is also data for most independent variables from this time, it would in principle be possible to use panel data analysis. One way to address the endogeneity of democracy would then be to use country fixed effects to capture all time-invariant differences between countries. However, as is well known, fixed effect estimation is vulnerable to attenuation bias, in particular where we have persistent regressors such as democracy. If democracy over time is fairly stable, a lot of what we see in variation over years may be noise due to measurement error, with the result that the estimated association between democracy and corruption becomes small. An alternative would be to use instrument variable panel data estimators, which would help us capture time-variant differences between countries. However, our instrument is not amenable to this form of analysis. The democracy conflict variable needs to be measured across a longer time period for its association with democracy to emerge, and breaking the data into shorter periods since the mid-90s onwards is therefore not a useful approach. For these reasons, the main results reported in subsequent sections are based on cross-sectional data. We do, however, report results for fixed effects in Section 4.3. In addition, to test the robustness of using data from a single year such as 2008, we also report results using the between estimator, which estimates the relation between democracy and corruption using averages across years.
The variables we use for corruption, democracy and covariates are standard in the literature on democracy and corruption, and described in more detail in section three. The new variables in our analysis are the conflict variables, the dummy variables reflecting whether a country has been at war in the period 1946-2009, and whether a country has been at war with a democracy in this period. Since these variables are previously unused in the literature, and constitute a central element of our analysis, they are described in more detail in the next subsection.
2.3 Democracy and conflict – a descriptive overview
Our approach basically divides the countries in our sample into three groups; those that have never been in conflict 1946-2009, those that have been in conflict in the same period but not with a democracy, and those that have been in conflict with a democracy. Conflict here refers to interstate armed conflict and internationalized internal armed conflict, not civil war without intervention of other states.1
1 This corresponds to conflict types 2 and 4 in the UCDP/PRIO armed conflict dataset, see UCDP/PRIO (2010) for details.
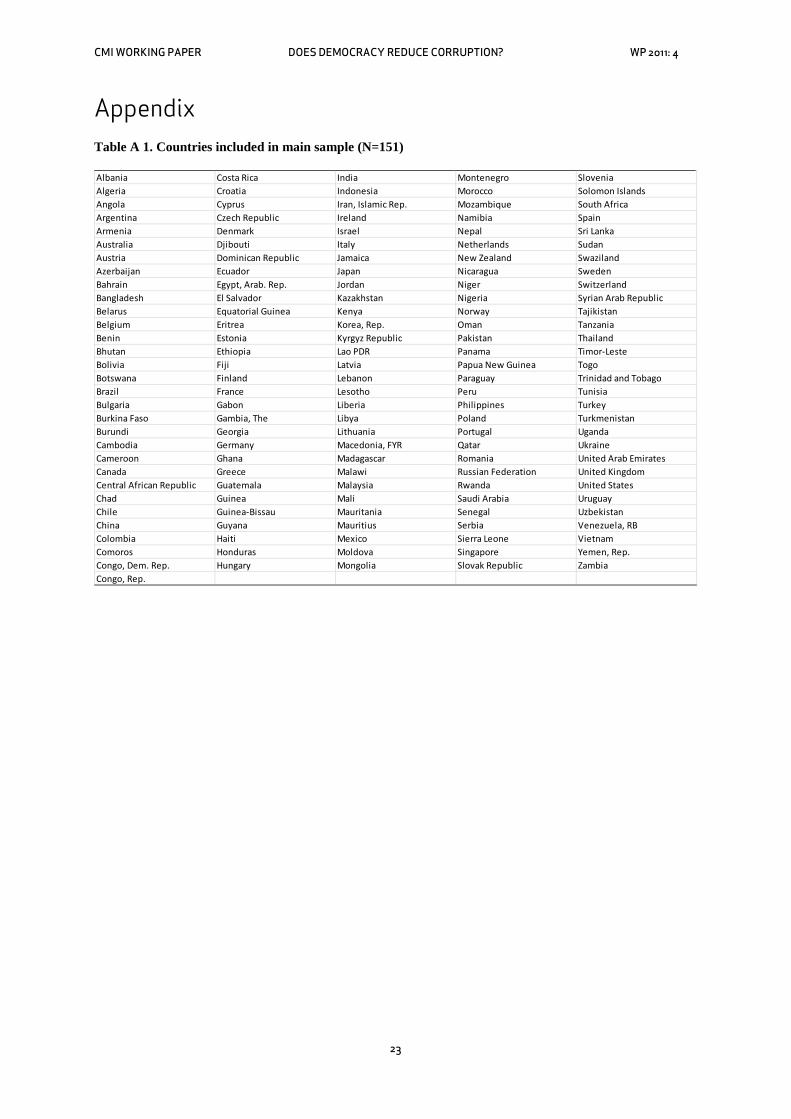
Of the 151 countries that are included in our main sample, 19 have been recorded as not having been involved in this type of conflict, while the remaining 132 have. The full sample of countries is found in Table A1 in the appendix, the 19 countries that have never been in conflict are: Benin, Belarus, Brazil, Bhutan, Germany, Fiji, Equatorial Guinea, Guyana, Jamaica, Montenegro, Mauritius, Malawi, Singapore, Solomon Islands, Swaziland, Turkmenistan, Timor-Leste, Yemen (Rep.) and Zambia.
CMI WORKING PAPER DOES DEMOCRACY REDUCE CORRUPTION? WP 2011: 4
7
The interesting distinction for our purposes is between countries that have been at war with a democracy, and countries that have been at war but not with a democracy. A closer look at the countries that have been at war with a democracy is therefore in order. There are of course different indices that can be used to assess the level of democracy in the opposing country of a conflict. The two most common indices of democracy used in the literature on democracy and corruption are the Polity IV democracy index (which runs from 0 to 10 with higher values signifying more democracy) and the Freedom House political rights index (which takes values 1 through 7 with higher values representing less democracy). For either of these indices, when assessing whether a country is democratic or not, the question is where to set the cut-off value. Since Polity IV has the best coverage in terms of years, which is a preferred quality in an index when you want to assess the conflict history of a country, this will be the main democracy variable in the subsequent analysis. We therefore employ a cut-off similar to that used in Polity IV documents, where countries with an index score of 6 or more are counted as democracies (Marshall and Cole, 2009). If we had rescaled the Freedom House political rights index to match that of the Polity IV index, a similar cutoff would be to characterize countries with scores of 3 or less on the original Freedom House index as democracies, and those with higher values as non-democracies.
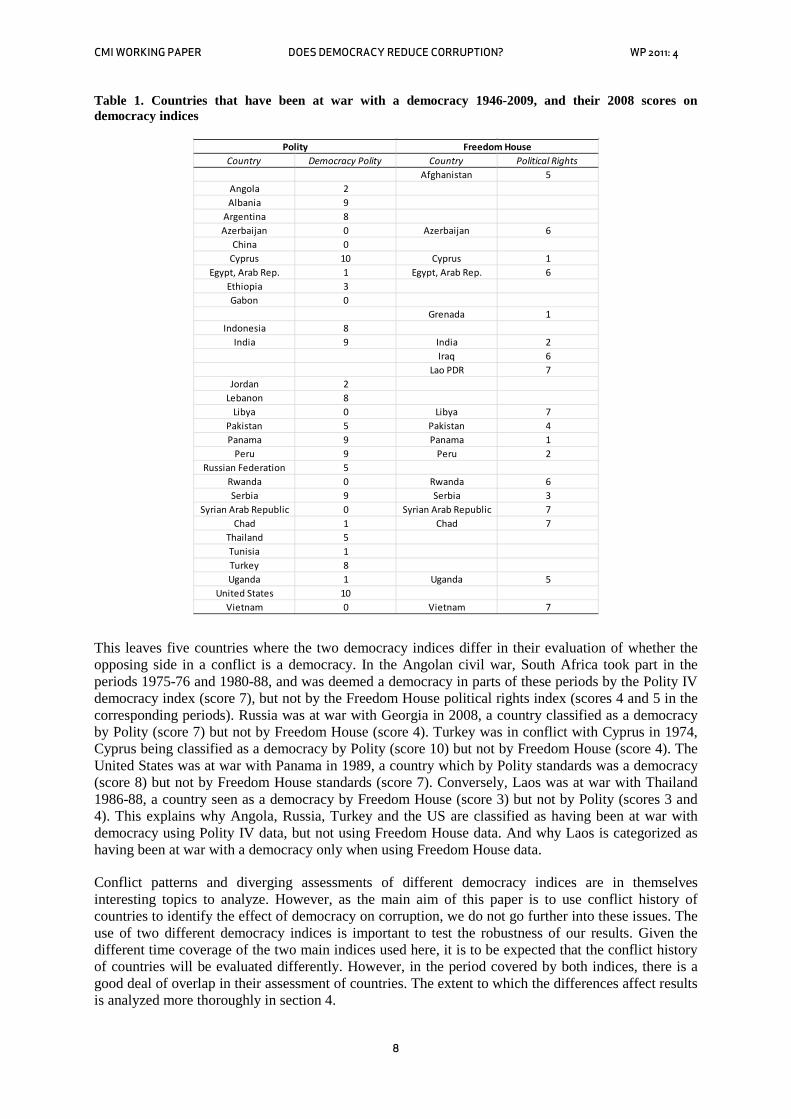
Based on these cutoff values, Table 1 lists the countries that have been at war with a democracy in the period 1946-2009 (for the Polity IV index) and the period 1972-2009 (for the Freedom House index which has shorter coverage). The first columns list countries that have been at war with a democracy, where the level of democracy in the opponent country has been evaluated using the Polity IV democracy index. The second column presents the democracy index score of the country in the first column. As the table shows, 16 of the 28 countries that have been at war with a democracy are non-democracies (have a score less than 6 on the democracy index). Though only a small majority, 13 of these countries have scores of 2 or less, and the subsequent analysis shows sufficient correlation to use a dummy for having been at war with a democracy as an instrument for democracy. The third and fourth columns show the countries classified as having been at war with a democracy using the Freedom House political rights index, and their corresponding score on this index. 12 of the 18 countries that have been at war with a democracy would qualify as non-democracies in this case.
There is a good deal of overlap in between the countries in columns one and three of Table 1. 14 of the countries characterized as having been at war with a democracy using the Freedom House index, are characterized in the same way using the Polity IV index. As noted, the Polity IV index has values dating back as far as our conflict data, to 1946, and can hence be used to classify opponents for a longer period than the Freedom House data, which goes back to 1972. The fact that Freedom House cannot be employed to conflicts occurring before 1972 explains why a number of countries in the first column are absent from the third column. This can be seen in Table A2 in the appendix, which gives full information on conflict names, conflict years, and democratic opponents of the countries in the first column of Table 1. Albania, China, Ethiopia, Gabon, Indonesia, Jordan, Lebanon, Thailand and Tunisia all had conflicts with democracies which ended prior to 1972, and are hence not in the list of countries having been at war with a democracy when using the Freedom House index. In addition, Freedom House curiously does not have data for the year 1982, the year of the Falklands war, which means that Argentina is classified as having been at war with a democracy (the United Kingdom) using the Polity IV index, but not using the Freedom House index. Missing data is also the reason why Afghanistan, Grenada and Iraq are included in the third column of Table 1 but not the first. For these three countries, Polity IV does not have a democracy score for 2008, which is the year used in the subsequent econometric analysis. These countries are therefore not in our main sample when using the Polity IV democracy index as an independent variable, which accounts for their absence from the first column in Table 1. See also Table A3 in the appendix for a full list of conflicts, years and democratic opponents using the Freedom House political rights index.
CMI WORKING PAPER DOES DEMOCRACY REDUCE CORRUPTION? WP 2011: 4
8
Table 1. Countries that have been at war with a democracy 1946-2009, and their 2008 scores on democracy indices
This leaves five countries where the two democracy indices differ in their evaluation of whether the opposing side in a conflict is a democracy. In the Angolan civil war, South Africa took part in the periods 1975-76 and 1980-88, and was deemed a democracy in parts of these periods by the Polity IV democracy index (score 7), but not by the Freedom House political rights index (scores 4 and 5 in the corresponding periods). Russia was at war with Georgia in 2008, a country classified as a democracy by Polity (score 7) but not by Freedom House (score 4). Turkey was in conflict with Cyprus in 1974, Cyprus being classified as a democracy by Polity (score 10) but not by Freedom House (score 4). The United States was at war with Panama in 1989, a country which by Polity standards was a democracy (score 8) but not by Freedom House standards (score 7). Conversely, Laos was at war with Thailand 1986-88, a country seen as a democracy by Freedom House (score 3) but not by Polity (scores 3 and 4). This explains why Angola, Russia, Turkey and the US are classified as having been at war with democracy using Polity IV data, but not using Freedom House data. And why Laos is categorized as having been at war with a democracy only when using Freedom House data.
Conflict patterns and diverging assessments of different democracy indices are in themselves interesting topics to analyze. However, as the main aim of this paper is to use conflict history of countries to identify the effect of democracy on corruption, we do not go further into these issues. The use of two different democracy indices is important to test the robustness of our results. Given the different time coverage of the two main indices used here, it is to be expected that the conflict history of countries will be evaluated differently. However, in the period covered by both indices, there is a good deal of overlap in their assessment of countries. The extent to which the differences affect results is analyzed more thoroughly in section 4.
Country Democracy Polity Country Political RightsAfghanistan 5
Angola 2Albania 9
Argentina 8Azerbaijan 0 Azerbaijan 6
China 0Cyprus 10 Cyprus 1
Egypt, Arab Rep. 1 Egypt, Arab Rep. 6Ethiopia 3Gabon 0
Grenada 1Indonesia 8
India 9 India 2Iraq 6
Lao PDR 7Jordan 2
Lebanon 8Libya 0 Libya 7
Pakistan 5 Pakistan 4Panama 9 Panama 1
Peru 9 Peru 2Russian Federation 5
Rwanda 0 Rwanda 6Serbia 9 Serbia 3
Syrian Arab Republic 0 Syrian Arab Republic 7Chad 1 Chad 7
Thailand 5Tunisia 1Turkey 8Uganda 1 Uganda 5
United States 10Vietnam 0 Vietnam 7
Polity Freedom House
CMI WORKING PAPER DOES DEMOCRACY REDUCE CORRUPTION? WP 2011: 4
9
3. Data
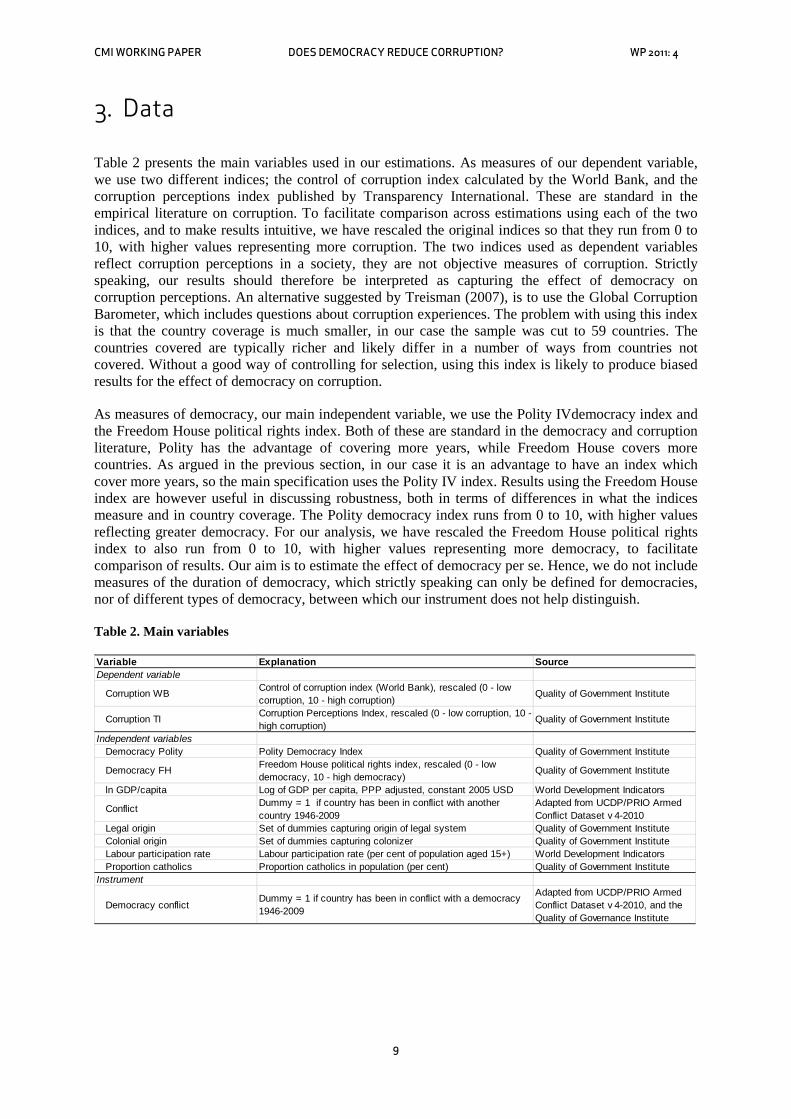
Table 2 presents the main variables used in our estimations. As measures of our dependent variable, we use two different indices; the control of corruption index calculated by the World Bank, and the corruption perceptions index published by Transparency International. These are standard in the empirical literature on corruption. To facilitate comparison across estimations using each of the two indices, and to make results intuitive, we have rescaled the original indices so that they run from 0 to 10, with higher values representing more corruption. The two indices used as dependent variables reflect corruption perceptions in a society, they are not objective measures of corruption. Strictly speaking, our results should therefore be interpreted as capturing the effect of democracy on corruption perceptions. An alternative suggested by Treisman (2007), is to use the Global Corruption Barometer, which includes questions about corruption experiences. The problem with using this index is that the country coverage is much smaller, in our case the sample was cut to 59 countries. The countries covered are typically richer and likely differ in a number of ways from countries not covered. Without a good way of controlling for selection, using this index is likely to produce biased results for the effect of democracy on corruption.
As measures of democracy, our main independent variable, we use the Polity IVdemocracy index and the Freedom House political rights index. Both of these are standard in the democracy and corruption literature, Polity has the advantage of covering more years, while Freedom House covers more countries. As argued in the previous section, in our case it is an advantage to have an index which cover more years, so the main specification uses the Polity IV index. Results using the Freedom House index are however useful in discussing robustness, both in terms of differences in what the indices measure and in country coverage. The Polity democracy index runs from 0 to 10, with higher values reflecting greater democracy. For our analysis, we have rescaled the Freedom House political rights index to also run from 0 to 10, with higher values representing more democracy, to facilitate comparison of results. Our aim is to estimate the effect of democracy per se. Hence, we do not include measures of the duration of democracy, which strictly speaking can only be defined for democracies, nor of different types of democracy, between which our instrument does not help distinguish.
Table 2. Main variables
Variable Explanation SourceDependent variable
Corruption WB Control of corruption index (World Bank), rescaled (0 - low corruption, 10 - high corruption)
Quality of Government Institute
Corruption TI Corruption Perceptions Index, rescaled (0 - low corruption, 10 - high corruption)
Quality of Government Institute
Independent variablesDemocracy Polity Polity Democracy Index Quality of Government Institute
Democracy FH Freedom House political rights index, rescaled (0 - low democracy, 10 - high democracy)
Quality of Government Institute
ln GDP/capita Log of GDP per capita, PPP adjusted, constant 2005 USD World Development Indicators
Conflict Dummy = 1 if country has been in conflict with another country 1946-2009
Adapted from UCDP/PRIO Armed Conflict Dataset v 4-2010
Legal origin Set of dummies capturing origin of legal system Quality of Government InstituteColonial origin Set of dummies capturing colonizer Quality of Government InstituteLabour participation rate Labour participation rate (per cent of population aged 15+) World Development IndicatorsProportion catholics Proportion catholics in population (per cent) Quality of Government Institute
Instrument
Democracy conflictDummy = 1 if country has been in conflict with a democracy 1946-2009
Adapted from UCDP/PRIO Armed Conflict Dataset v 4-2010, and the Quality of Governance Institute
CMI WORKING PAPER DOES DEMOCRACY REDUCE CORRUPTION? WP 2011: 4
10
We add as covariates a range of variables that have been previously used in the empirical literature on corruption. The variable most robustly related to corruption across empirical studies is the log of GDP per capita. Our main estimations include this variable, consistent with the main specifications of previous studies (Treisman, 2007; Svensson, 2005), adding the dummy variable for whether a country has been in conflict in the period 1946-2009. Subsequent specifications also add a number of other covariates found to matter for corruption. The legal origin of countries is captured by a set of dummies indicating whether the company law or commercial code in a country originates in English common law, French commercial code, socialist/communist law, German commercial code, or Scandinavian commercial code, and the classification is due to La Porta et al (1999). Colonial origin is similarly captured by dummy variables created from the ten category classification of Teorell and Hadenius (2005). We also include labour participation rates taken from the World Development Indicators, and the proportion of catholics in a country originally from La Porta et al (1999). In initial estimations we also added a number of other covariates that proved insignificant, and were hence dropped in the specifications reported here. These include schooling (average years of education and enrolment rates at different levels), GDP growth, trade (both as total volume to GDP and in specific industries including natural resources), bureaucratic barriers (cost and time to export, documents required to export, cost of business start up), infrastructure (telephone lines per 1000 people), labour market characteristics (participation rates, unemployment), population size and structure, land area, regime durability, fractionalization (ethnic, religious and linguistic), and proportions of other religions (protestant, muslim).
Our instrument is a dummy variable taking the value 1 if a country has been in conflict with an opposing country that at the time of conflict was a democracy, and 0 otherwise. This variable was constructed by combining conflict data from the UCDP/PRIO with democracy data from Polity and Freedom House. To remain consistent, two different variables were constructed with a basis in the two main democracy variables used in the analysis. In specifications where the Polity IV democracy index is included as an independent variable, the democracy conflict instrument indicates countries that have been at war with a country scoring 6 or higher on the Polity IV democracy index. Where the Freedom House political rights index is used as a dependent variable, the democracy conflict instrument captures countries at war with an opponent scoring 3 or lower on the original (before rescaling) Freedom House index. Due to different time coverage of the two democracy indices, the instrument captures conflict history for the period 1946-2009 in case where Polity data is used, and 1972-2009 in the case where Freedom House data is used. As noted earlier, the cutoff values for the two different democracy variables are consistent.
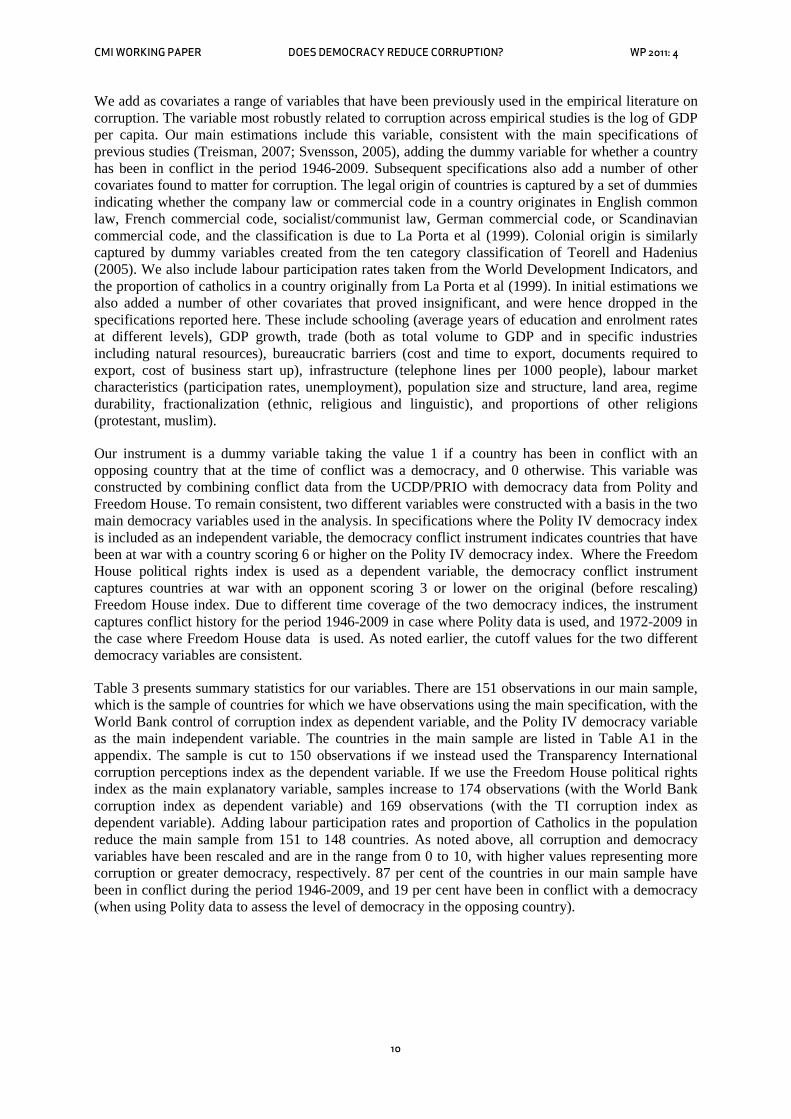
Table 3 presents summary statistics for our variables. There are 151 observations in our main sample, which is the sample of countries for which we have observations using the main specification, with the World Bank control of corruption index as dependent variable, and the Polity IV democracy variable as the main independent variable. The countries in the main sample are listed in Table A1 in the appendix. The sample is cut to 150 observations if we instead used the Transparency International corruption perceptions index as the dependent variable. If we use the Freedom House political rights index as the main explanatory variable, samples increase to 174 observations (with the World Bank corruption index as dependent variable) and 169 observations (with the TI corruption index as dependent variable). Adding labour participation rates and proportion of Catholics in the population reduce the main sample from 151 to 148 countries. As noted above, all corruption and democracy variables have been rescaled and are in the range from 0 to 10, with higher values representing more corruption or greater democracy, respectively. 87 per cent of the countries in our main sample have been in conflict during the period 1946-2009, and 19 per cent have been in conflict with a democracy (when using Polity data to assess the level of democracy in the opposing country).
CMI WORKING PAPER DOES DEMOCRACY REDUCE CORRUPTION? WP 2011: 4
11
Table 3. Summary statistics of main variables
Note: Corruption WB is the World Bank control of corruption index rescaled from 0 to 10, with higher values representing more corruption. Corruption TI is the Transparency International corruption perceptions index similarly rescaled. Democracy Polity is the Polity IV democracy index. Democracy FH is the Freedom House political rights index rescaled from 0 to 10, with higher values representing greater democracy. ln GDP/capita is the natural log of gross domestic product per capita, in PPP adjusted 2005 USD. Conflict is a dummy variable indicating whether a country has been in conflict with another country 1946-2009, and democracy conflict a dummy variable indicating whether a country has been in conflict with a democracy in this period. Labour participation rate is the percentage of the population aged 15 or older in the labour force. Proporation catholics is the percentage catholics in the population.
Variable Obs Mean Std. dev. Min MaxCorruption WB 151 5.19 1.96 0.31 8.24Corruption TI 150 6.04 2.08 0.70 8.60Democracy Polity 151 5.81 3.80 0.00 10.00Democracy FH 174 6.04 3.45 0.00 10.00ln GDP/capita 151 8.68 1.32 5.67 11.34Conflict 151 0.87 0.33 0.00 1.00Labour participation rate 148 64.86 9.97 36.40 89.40Proportion catholics 148 29.84 35.20 0.00 96.90Democracy conflict 151 0.19 0.39 0.00 1.00
CMI WORKING PAPER DOES DEMOCRACY REDUCE CORRUPTION? WP 2011: 4
12
4. Results
4.1 Main results
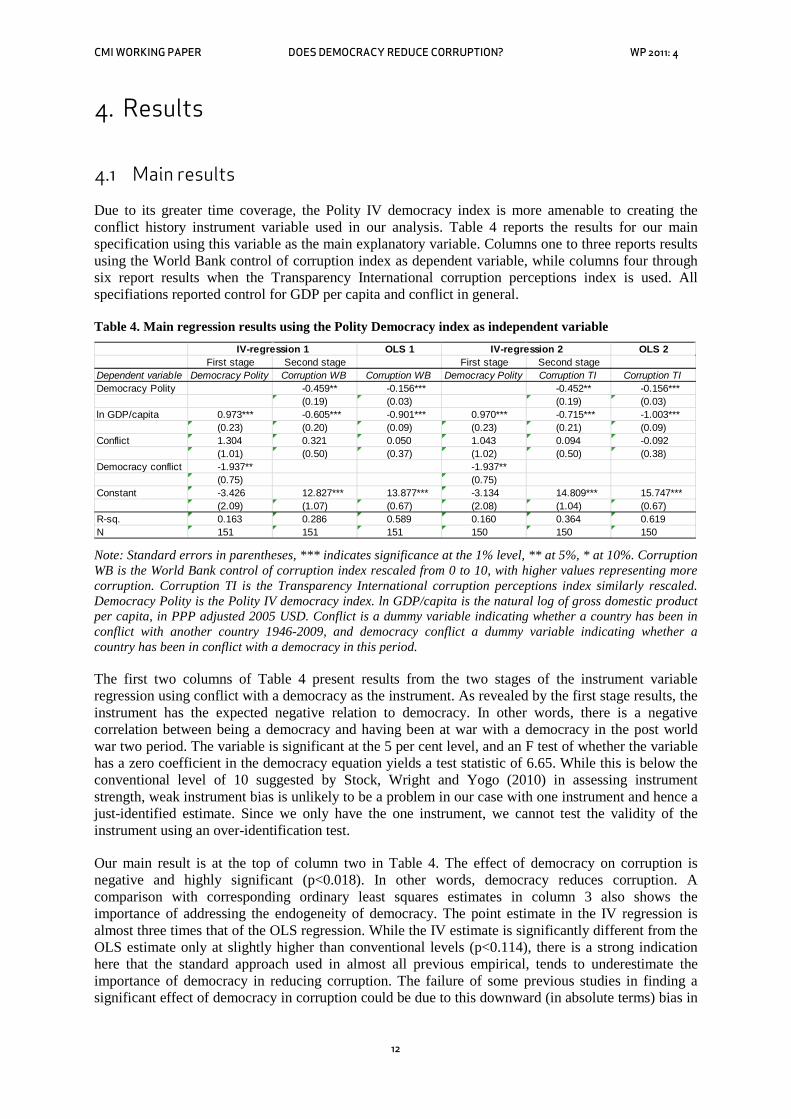
Due to its greater time coverage, the Polity IV democracy index is more amenable to creating the conflict history instrument variable used in our analysis. Table 4 reports the results for our main specification using this variable as the main explanatory variable. Columns one to three reports results using the World Bank control of corruption index as dependent variable, while columns four through six report results when the Transparency International corruption perceptions index is used. All specifiations reported control for GDP per capita and conflict in general.
Table 4. Main regression results using the Polity Democracy index as independent variable
Note: Standard errors in parentheses, *** indicates significance at the 1% level, ** at 5%, * at 10%. Corruption WB is the World Bank control of corruption index rescaled from 0 to 10, with higher values representing more corruption. Corruption TI is the Transparency International corruption perceptions index similarly rescaled. Democracy Polity is the Polity IV democracy index. ln GDP/capita is the natural log of gross domestic product per capita, in PPP adjusted 2005 USD. Conflict is a dummy variable indicating whether a country has been in conflict with another country 1946-2009, and democracy conflict a dummy variable indicating whether a country has been in conflict with a democracy in this period.
The first two columns of Table 4 present results from the two stages of the instrument variable regression using conflict with a democracy as the instrument. As revealed by the first stage results, the instrument has the expected negative relation to democracy. In other words, there is a negative correlation between being a democracy and having been at war with a democracy in the post world war two period. The variable is significant at the 5 per cent level, and an F test of whether the variable has a zero coefficient in the democracy equation yields a test statistic of 6.65. While this is below the conventional level of 10 suggested by Stock, Wright and Yogo (2010) in assessing instrument strength, weak instrument bias is unlikely to be a problem in our case with one instrument and hence a just-identified estimate. Since we only have the one instrument, we cannot test the validity of the instrument using an over-identification test.
Our main result is at the top of column two in Table 4. The effect of democracy on corruption is negative and highly significant (p<0.018). In other words, democracy reduces corruption. A comparison with corresponding ordinary least squares estimates in column 3 also shows the importance of addressing the endogeneity of democracy. The point estimate in the IV regression is almost three times that of the OLS regression. While the IV estimate is significantly different from the OLS estimate only at slightly higher than conventional levels (p<0.114), there is a strong indication here that the standard approach used in almost all previous empirical, tends to underestimate the importance of democracy in reducing corruption. The failure of some previous studies in finding a significant effect of democracy in corruption could be due to this downward (in absolute terms) bias in
OLS 1 OLS 2First stage Second stage First stage Second stage
Dependent variable Democracy Polity Corruption WB Corruption WB Democracy Polity Corruption TI Corruption TIDemocracy Polity -0.459** -0.156*** -0.452** -0.156***
(0.19) (0.03) (0.19) (0.03)ln GDP/capita 0.973*** -0.605*** -0.901*** 0.970*** -0.715*** -1.003***
(0.23) (0.20) (0.09) (0.23) (0.21) (0.09)Conflict 1.304 0.321 0.050 1.043 0.094 -0.092
(1.01) (0.50) (0.37) (1.02) (0.50) (0.38)Democracy conflict -1.937** -1.937**
(0.75) (0.75)Constant -3.426 12.827*** 13.877*** -3.134 14.809*** 15.747***
(2.09) (1.07) (0.67) (2.08) (1.04) (0.67)R-sq. 0.163 0.286 0.589 0.160 0.364 0.619N 151 151 151 150 150 150
IV-regression 1 IV-regression 2

CMI WORKING PAPER DOES DEMOCRACY REDUCE CORRUPTION? WP 2011: 4
13
OLS results, which makes it harder to reject a null hypothesis that democracy has no effect. In sum, our results suggest that democracy is more important than previous studies would have us believe.
This finding is robust to changes in the corruption index used. Columns four through six report results from corresponding estimations using the Transparency International corruption perceptions index as the dependent variable. Though we lose one observation, results are remarkably similar. Not surprisingly, the coefficient of the instrument in the democracy equation is the same, and the F-test of whether the coefficient is zero yields a statistics of 6.64. The estimated effect of democracy on corruption at the top of the fifth column is only marginally different from the effect estimated using the World Bank index. The OLS estimate is also the same, so the level at which the two are significantly different is very similar (p<0.128). The implications discussed above are therefore generally the same, regardless of the corruption measure used.
While we prefer the Polity IV democracy index for our analysis due to greater time coverage, we also test whether results are different when using the Freedom House political rights index. Table 5 reports results from the same specifications as in the previous table, but here the Freedom House index has been used instead of the Polity index. Again, the World Bank control of corruption index is used as dependent variable in column one to three, and the Transparency International corruption perceptions index has been used in columns four through six. We see that since the Freedom House index has greater country coverage, the number of observations are increased to 174 and 169, respectively.
Table 5. Main regression results using the Freedom House political rights index (rescaled) as independent variable
Note: Standard errors in parentheses, *** indicates significance at the 1% level, ** at 5%, * at 10%. Corruption WB is the World Bank control of corruption index rescaled from 0 to 10, with higher values representing more corruption. Corruption TI is the Transparency International corruption perceptions index similarly rescaled. Democracy FH is the Freedom House political rights index rescaled from 0 to 10, with higher values representing greater democracy. ln GDP/capita is the natural log of gross domestic product per capita, in PPP adjusted 2005 USD. Conflict is a dummy variable indicating whether a country has been in conflict with another country 1946-2009, and democracy conflict a dummy variable indicating whether a country has been in conflict with a democracy in the period 1972-2009.
Results from instrument variable regressions are very similar when replacing the Freedom House index for the Polity index, as seen in columns one and two, and columns four and five in Table 5. Conflict with a democracy has a significantly negative association with democracy, and the coefficient is of largely the same order as in previous estimations. The estimated impact of democracy on corruption is also very similar to that found when using the Polity index, and the coefficient is highly significant in both cases (p<0.026 and p<0.014 in columns two and five, respectively). One difference when using the Freedom House index is that the instrument becomes somewhat weaker. Testing whether its coefficient is zero in the democracy equation yields an F statistic of 3.83 for the specification in column one, and 5.56 for the specification in column four. Since the instrument is based on a shorter time period (1972-2009) when using the Freedom House political rights index, this is perhaps to be expected as it will then pick up fewer cases of conflict with democracies. Another
OLS 3 OLS 4First stage Second stage First stage Second stage
Dependent variable Democracy FH Corruption WB Corruption WB Democracy FH Corruption TI Corruption TIDemocracy FH -0.433** -0.236*** -0.406** -0.229***
(0.19) (0.03) (0.16) (0.03)ln GDP/capita 1.085*** -0.619*** -0.842*** 1.067*** -0.744*** -0.942***
(0.18) (0.22) (0.09) (0.18) (0.20) (0.09)Conflict -0.567 -0.055 0.100 -0.488 -0.264 -0.133
(0.67) (0.30) (0.24) (0.71) (0.32) (0.28)Democracy conflict -1.682* -2.000**
(0.86) (0.85)Constant -2.766* 13.157*** 13.778*** -2.681* 15.116*** 15.674***
(1.61) (0.88) (0.64) (1.61) (0.84) (0.64)R-sq. 0.206 0.568 0.664 0.215 0.602 0.671N 174 174 174 169 169 169
IV-regression 3 IV-regression 4
CMI WORKING PAPER DOES DEMOCRACY REDUCE CORRUPTION? WP 2011: 4
14
thing to notice from Table 5, is that the expansion of the sample increases the ordinary least squares estimates (in absolute terms) by about one half. Consequently, the instrument variable estimates are not close to being significantly different from the OLS estimates at conventional levels (p<0.303 when using the World Bank corruption index, and p<0.277 for the Transparency International index). On the whole, however, the results using the Freedom House political rights index support previous indications that democracy reduces corruption.
For the other variables included in the estimations presented in Tables 4 and 5, results conform roughly to expectations. Income levels measured by the log of GDP per capita has a positive association with levels of democracy, and a negative correlation with corruption. The estimates are highly significant and fairly stable across specifications using different corruption and democracy indices.2
4.2 Robustness to additional covariates
The dummy variable indicating whether a country has been in conflict in the period 1946-2009 is insignificant in both the democracy and corruption equations, across all estimations. Conflict in general hence does not seem to be systematically related to levels of corruption, but our approach of course does not permit testing of any causal relationship between conflict and corruption.
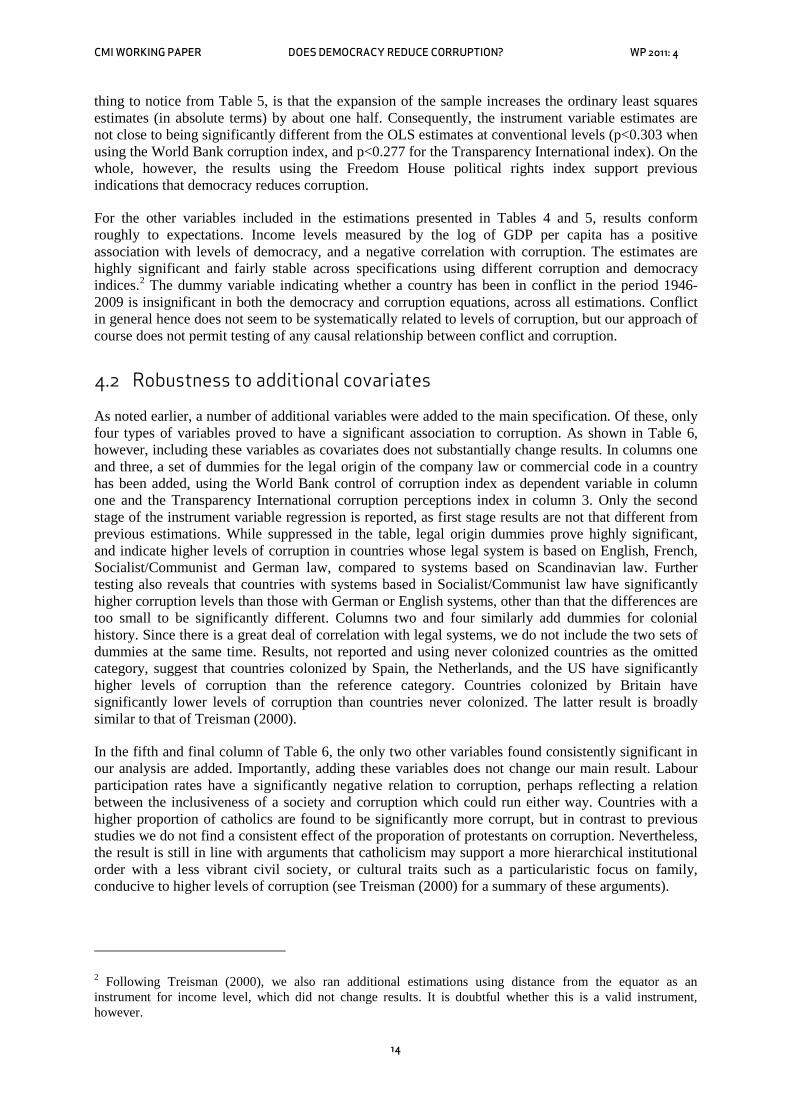
As noted earlier, a number of additional variables were added to the main specification. Of these, only four types of variables proved to have a significant association to corruption. As shown in Table 6, however, including these variables as covariates does not substantially change results. In columns one and three, a set of dummies for the legal origin of the company law or commercial code in a country has been added, using the World Bank control of corruption index as dependent variable in column one and the Transparency International corruption perceptions index in column 3. Only the second stage of the instrument variable regression is reported, as first stage results are not that different from previous estimations. While suppressed in the table, legal origin dummies prove highly significant, and indicate higher levels of corruption in countries whose legal system is based on English, French, Socialist/Communist and German law, compared to systems based on Scandinavian law. Further testing also reveals that countries with systems based in Socialist/Communist law have significantly higher corruption levels than those with German or English systems, other than that the differences are too small to be significantly different. Columns two and four similarly add dummies for colonial history. Since there is a great deal of correlation with legal systems, we do not include the two sets of dummies at the same time. Results, not reported and using never colonized countries as the omitted category, suggest that countries colonized by Spain, the Netherlands, and the US have significantly higher levels of corruption than the reference category. Countries colonized by Britain have significantly lower levels of corruption than countries never colonized. The latter result is broadly similar to that of Treisman (2000).
In the fifth and final column of Table 6, the only two other variables found consistently significant in our analysis are added. Importantly, adding these variables does not change our main result. Labour participation rates have a significantly negative relation to corruption, perhaps reflecting a relation between the inclusiveness of a society and corruption which could run either way. Countries with a higher proportion of catholics are found to be significantly more corrupt, but in contrast to previous studies we do not find a consistent effect of the proporation of protestants on corruption. Nevertheless, the result is still in line with arguments that catholicism may support a more hierarchical institutional order with a less vibrant civil society, or cultural traits such as a particularistic focus on family, conducive to higher levels of corruption (see Treisman (2000) for a summary of these arguments).
2 Following Treisman (2000), we also ran additional estimations using distance from the equator as an instrument for income level, which did not change results. It is doubtful whether this is a valid instrument, however.
CMI WORKING PAPER DOES DEMOCRACY REDUCE CORRUPTION? WP 2011: 4
15
Table 6. Additional estimations with more covariates
Note: Standard errors in parentheses, *** indicates significance at the 1% level, ** at 5%, * at 10%. Corruption WB is the World Bank control of corruption index rescaled from 0 to 10, with higher values representing more corruption. Corruption TI is the Transparency International corruption perceptions index similarly rescaled. Democracy Polity is the Polity IV democracy index. ln GDP/capita is the natural log of gross domestic product per capita, in PPP adjusted 2005 USD. Conflict is a dummy variable indicating whether a country has been in conflict with another country 1946-2009, and democracy conflict a dummy variable indicating whether a country has been in conflict with a democracy in this period. Labour participation rate is the percentage of the population aged 15 or older in the labour force. Proporation catholics is the percentage catholics in the population.
As noted in section 3, we included a number of additional covariates in our initial estimations which proved insignificant, these are therefore not included in the results reported here. Including these insignificant variables did not influence our results, with a few exceptions. Adding unemployment, the number of wage and salaried workers as a percentage of total employed, secondary school enrolment, tertiary school enrolment, or average years of schooling, and a democracy durability measure constructed from the Polity IV democracy data, made democracy insignificant. This is, however, due to the substantial reductions in sample incurred when these variables are included. This is seen by running the main specification on the reduced samples induced by the addition of these covariates. Since democracy becomes insignificant in these reduced samples, this indicates that the reduced sample is the problem, not the addition of covariates. Our main result on the effect of democracy on corruption can therefore be said to be robust to the inclusion of additional covariates.
Estimations of the main specification using reduced samples do, however, point to some interesting patterns. The strength of the instrument appears particularly sensitive to dropping certain observations of the main sample. If we include school enrolment rates, for instance, the countries dropped are typically low income countries, and this weakens the instrument. If instead we use average years of schooling variables, there seems to be less of a correlation between countries dropped and their income levels, and the instrument remains strong. It is therefore possible that our instrument identifies the effect of democracy on corruption in certain types of countries, such as low income countries. If there are heterogeneous effects of democracy on corruption across countries, our estimate may thus capture a local average treatment effect for the countries for which there is a strong association between levels of democracy and having been in conflict with a democracy, rather than an average treatment effect across all countries.
To analyze this, we split the sample down the middle according to income levels, and separately ran the first stage of the instrument variable regression for below median income countries and above median income countries. The results (not reported) show that the coefficient of the instrument is markedly greater (-2.4) for the below median income countries than for the above median income countries (-1.52). Our instrument therefore seems more closely related to levels of democracy in low income countries than in high income countries. Or, put differently, poor countries are overrepresented
IV-regression 5 IV-regression 6 IV-regression 7 IV-regression 8 IV-regression 9Second stage Second stage Second stage Second stage Second stage
Dependent variable Corruption WB Corruption WB Corruption TI Corruption TI Corruption WBDemocracy Polity -0.374** -0.549** -0.351** -0.536** -0.486**
(0.18) (0.25) (0.17) (0.25) (0.20)ln GDP/capita -0.630*** -0.812*** -0.741*** -0.935*** -0.850***
(0.17) (0.20) (0.17) (0.19) (0.16)Conflict 0.210 0.016 0.011 -0.145 0.533
(0.50) (0.52) (0.48) (0.53) (0.53)Labour participation rate -0.055***
(0.02)Proportion catholics 0.021***
(0.01)Constant 10.781*** 14.402*** 12.423*** 16.532*** 17.866***
(1.17) (1.98) (1.14) (1.86) (1.52)Legal origin dummies Yes No Yes No NoColonial dummies No Yes No Yes NoR-sq. 0.506 0.298 0.583 0.393 0.421N 148 151 147 150 148
CMI WORKING PAPER DOES DEMOCRACY REDUCE CORRUPTION? WP 2011: 4
16
among the countries where there is an association between conflict with a democracy and being a democracy. In other words, if there are heterogeneous effects of democracy on corruption, our results capture the effect of democracy in poorer countries.
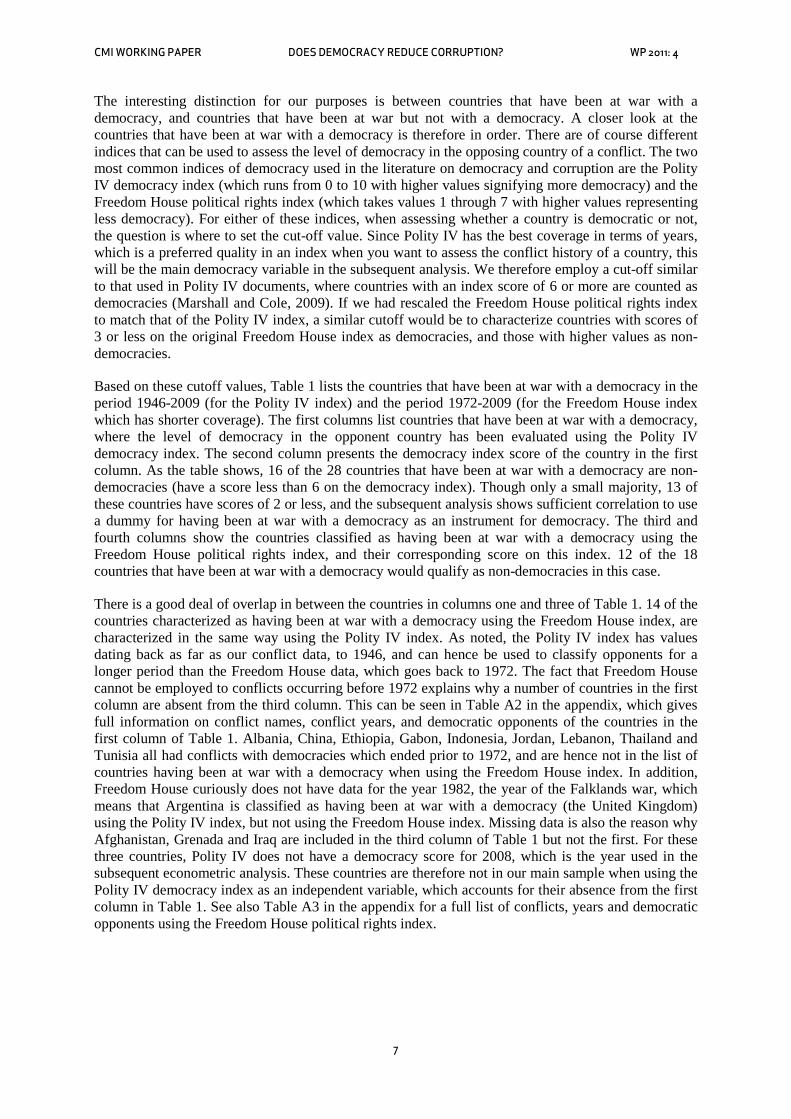
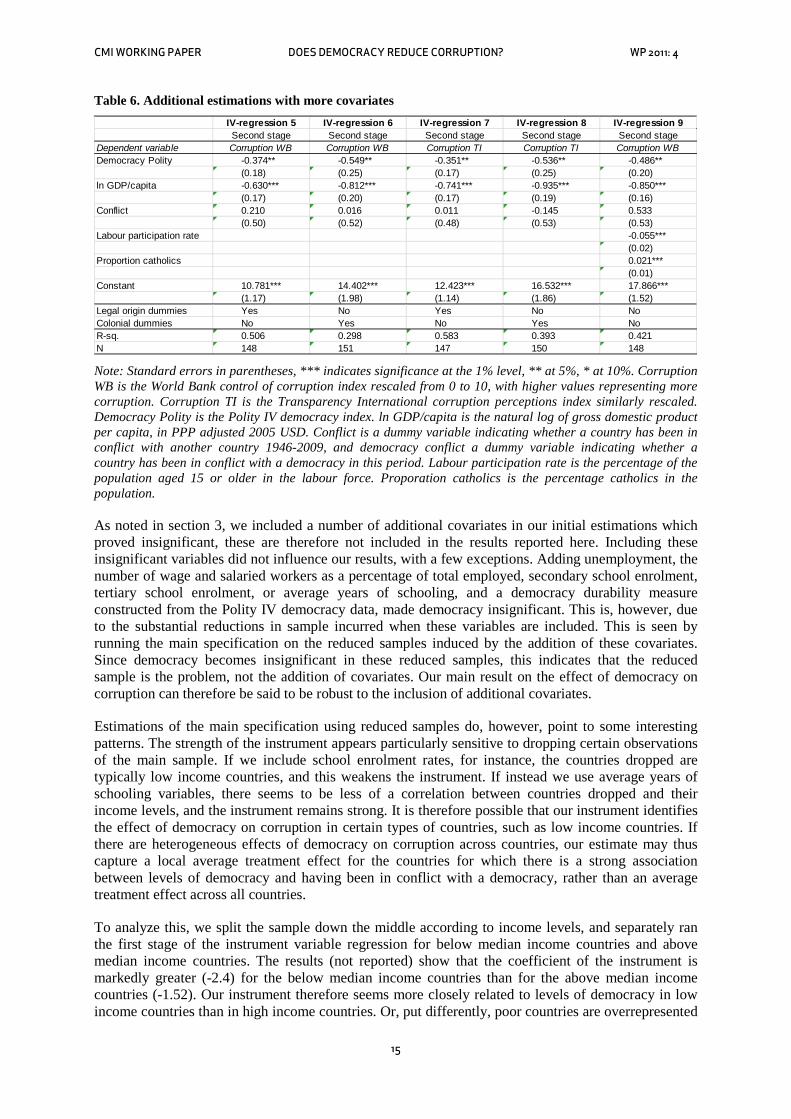
In addition to heterogeneity in effect across covariate groups, the fact that the democracy variables takes on multiple values, means that variable treatment intensity is an issue. In other words, the unit causal response of going from 1 to 2 on the democracy index, may be different from the unit causal response of going from 2 to 3. Our instrument variable estimates in this case captures a weighted average of these unit causal responses, where the weights reflect the extent two which the instrument is closely related to democracy for countries at different levels of democracy. To see where on the democracy scale our instrument creates the most action, and hence which returns to democracy our results are picking up, we apply the approach used in Acemoglu and Angrist (2000) and compare the cumulative density functions (CDF) of the endogenous variable with the instrument switched on and off. The solid line in Figure 1 represents this difference for different values of the Polity IV democracy index, and shows where the instrument has the greatest effect on predicted democracy levels. As the figure shows, the instrument does the most work at higher levels of democracy, specifically in the range of 7 to 8 on the democracy index. Our estimate therefore predominantly capture the returns from democracy in terms of reduced corruption at high levels of democracy.
Figure 1. Instrument-induced difference in democracy levels
Note: The figure shows the instrument-induced difference in probability (in percentage points) that democracy is greater than or equal to the value on the x-axis.
In sum, this means that if there are heterogeneous effects of democracy on corruption, our estimates capture effects for poor countries at higher levels of the democracy scale. In other words, our estimates suggest a substantive impact on corruption of incremental changes in democracy in countries such as Malawi and Mozambique (whose scores on the Polity democracy index were 6 in 2008), Nepal and Sri Lanka (scores 7 in 2008), and Bangladesh (which has consistently received score 6 on the democracy index in recent decades, with the exception of the years under the caretaker government, 2007 and 2008). In the presence of heterogeneous effects, our estimates tell us little about the effect of incremental changes in democracy in highly undemocratic countries such as Sudan (which scores 0 on the democracy index in recent years), Guinea (score 1) or Angola (score 2). This does not imply that the impact of democracy on corruption is necessarily smaller in these countries, it just means that the
-50
510
(1-C
DF)
Diff
eren
ce
2 4 6 8Democracy (Polity IV index)
CMI WORKING PAPER DOES DEMOCRACY REDUCE CORRUPTION? WP 2011: 4
17
impact is not identified through our particular instrument. Similarly, our estimate may not capture the effect of democracy on corruption in developed countries.
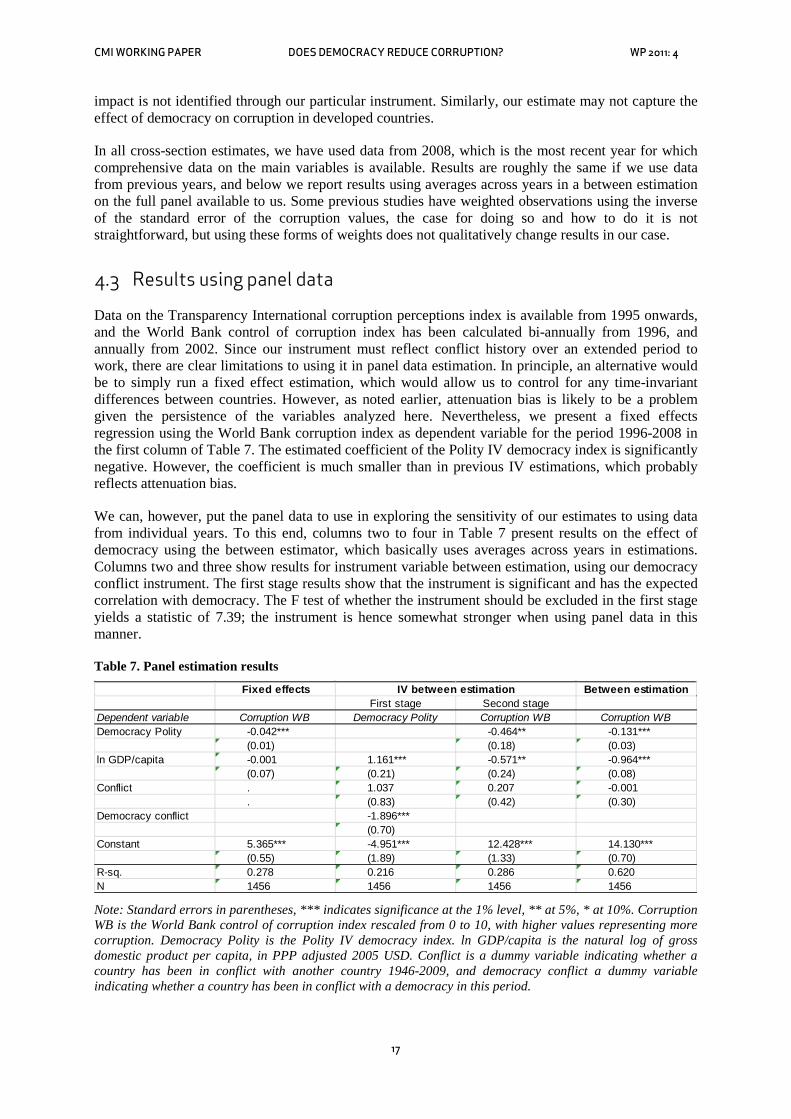
In all cross-section estimates, we have used data from 2008, which is the most recent year for which comprehensive data on the main variables is available. Results are roughly the same if we use data from previous years, and below we report results using averages across years in a between estimation on the full panel available to us. Some previous studies have weighted observations using the inverse of the standard error of the corruption values, the case for doing so and how to do it is not straightforward, but using these forms of weights does not qualitatively change results in our case.
4.3 Results using panel data
Data on the Transparency International corruption perceptions index is available from 1995 onwards, and the World Bank control of corruption index has been calculated bi-annually from 1996, and annually from 2002. Since our instrument must reflect conflict history over an extended period to work, there are clear limitations to using it in panel data estimation. In principle, an alternative would be to simply run a fixed effect estimation, which would allow us to control for any time-invariant differences between countries. However, as noted earlier, attenuation bias is likely to be a problem given the persistence of the variables analyzed here. Nevertheless, we present a fixed effects regression using the World Bank corruption index as dependent variable for the period 1996-2008 in the first column of Table 7. The estimated coefficient of the Polity IV democracy index is significantly negative. However, the coefficient is much smaller than in previous IV estimations, which probably reflects attenuation bias.
We can, however, put the panel data to use in exploring the sensitivity of our estimates to using data from individual years. To this end, columns two to four in Table 7 present results on the effect of democracy using the between estimator, which basically uses averages across years in estimations. Columns two and three show results for instrument variable between estimation, using our democracy conflict instrument. The first stage results show that the instrument is significant and has the expected correlation with democracy. The F test of whether the instrument should be excluded in the first stage yields a statistic of 7.39; the instrument is hence somewhat stronger when using panel data in this manner.
Table 7. Panel estimation results
Note: Standard errors in parentheses, *** indicates significance at the 1% level, ** at 5%, * at 10%. Corruption WB is the World Bank control of corruption index rescaled from 0 to 10, with higher values representing more corruption. Democracy Polity is the Polity IV democracy index. ln GDP/capita is the natural log of gross domestic product per capita, in PPP adjusted 2005 USD. Conflict is a dummy variable indicating whether a country has been in conflict with another country 1946-2009, and democracy conflict a dummy variable indicating whether a country has been in conflict with a democracy in this period.
Fixed effects Between estimationFirst stage Second stage
Dependent variable Corruption WB Democracy Polity Corruption WB Corruption WBDemocracy Polity -0.042*** -0.464** -0.131***
(0.01) (0.18) (0.03)ln GDP/capita -0.001 1.161*** -0.571** -0.964***
(0.07) (0.21) (0.24) (0.08)Conflict . 1.037 0.207 -0.001
. (0.83) (0.42) (0.30)Democracy conflict -1.896***
(0.70)Constant 5.365*** -4.951*** 12.428*** 14.130***
(0.55) (1.89) (1.33) (0.70)R-sq. 0.278 0.216 0.286 0.620N 1456 1456 1456 1456
IV between estimation
CMI WORKING PAPER DOES DEMOCRACY REDUCE CORRUPTION? WP 2011: 4
18
As seen at the top of column three, the estimated effect of democracy on corruption is almost the same as in previous estimations using data from 2008. The simple between estimate, shown in column four, is somewhat lower than previous OLS estimates. With a slightly more precise IV estimate, this means that the instrument variable estimate is significantly different from the between estimate (p<0.07). In this case, we can therefore conclude that not addressing the endogeneity of democracy yields biased results, the effect of democracy is underestimated. In sum, however, the panel data estimations largely confirm previous cross-sectional results. Results for the control variables are also qualitatively the same as in cross-section estimations. In addition to the panel data results reported in Table 7, we have run estimations using other combinations of corruption and democracy variables, as well as estimations including the covariates previously discussed, and in all cases the results are very close to the cross-sectional ones.
CMI WORKING PAPER DOES DEMOCRACY REDUCE CORRUPTION? WP 2011: 4
19
5. Concluding remarks
This paper attempts to estimate the causal impact of democracy on corruption, using an instrument reflecting whether countries have been in conflict with a democracy in recent history. The results suggest that democracy is far more effective in reducing corruption than indicated by estimates not taking the endogeneity of democracy into account. Whether there is heterogeneity in impacts of democracy on corruption we cannot say, as we have only one instrument. Nevertheless, our results suggest that there is a substantial effect of improving democracy in developing countries, where the problem of corruption is the most prevalent. While the indices of corruption employed capture perceived rather than actual corruption levels, this reflects limitations in data availability, not in analytical approach. The empirical approach used would be perfectly applicable to analysis using other corruption indices, should these attain wider country coverage.
From a policy point of view, this means that developing democratic institutions should be part of strategies to reduce corruption. Where previous results have been ambiguous on this issue, our analysis suggests that this may be due to selection bias. While our results provide a start to the question of democracy as an anti-corruption strategy, there are of course a number of more detailed issues that need to be addressed. Importantly, the effect of democracy on corruption likely varies across forms of democracy. Any analysis of the effectiveness of different forms of democracy runs into the same type of methodological problem described here; the form of democracy adopted by countries is likely endogenous. Estimating causal effects hence requires the use of an empirical strategy which addresses this challenge. However, as our instrument does not help us distinguish between different forms of democracy, this is a matter for further research.
CMI WORKING PAPER DOES DEMOCRACY REDUCE CORRUPTION? WP 2011: 4
20
CMI WORKING PAPER DOES DEMOCRACY REDUCE CORRUPTION? WP 2011: 4
21
References
Ades, A. and Di Tella, R. (1999), ‘Rents, Competition and Corruption’, American Economic Review 89 (4): 982-94.
Bac, M. (2001). Corruption, connections and transparency: Does a better screen imply a better scene? Public Choice, 107, 87–96.
Brunetti, A., and B. Weder. 2003. A free press is bad news for corruption. Journal of Public Economics 87 (7-8):1801-1824.
Dahl, R.D. 1971. Polyarchy: Participation and opposition Yale University Press, New Haven.
Dong, B, and Benno Torgler. 2011. Democracy, property rights, income equality, and corruption. February 10, 2011). Fondazione Eni Enrico Mattei Working Papers. Working Paper 559. http://www.bepress.com/feem/paper559
Doyle M., 1983. Kant, Liberal Legacies, and Foreign Affairs, Part 1", Philosophy and Public Affairs (1983), vol 12, no 3 pp 205-35,
Hendorson E. A. 2008. Disturbing the Peace: African Warfare, Political inversion and the universality of the democratic peace thesis. B.J.Pol.S. 39, 25–58
Kant, I. (1795), Perpetual Peace: A Philosophical Sketch
Kunicova, J. . 2006. Democratic institutions and corruption : incentives and constraints in politics. In International handbook on the economics of corruption, edited by S. Rose-Ackerman: Edward Elgar.
La Porta, R., López-de-Silanes, F., Shleifer, A.. and Vishny, R. 1999. The Quality of Government. Journal of Law, Economics and Organization, 15(1): 222-279.
Lambsdorff, J.G. (2005) ‘Consequences and Causes of Corruption: What Do We Know form a Cross Section of Countries?’ Discussion Paper No. V-34-05. Passau: University of Passau.
Mansfield E.D and J. Snyder. 2004. Why emerging democracies go to war. Cambridge. MIT
Marshall, M. G. and Cole, B. R. (2009), Global Report 2009 - Conflict, Governance, and State Fragility, Vienna, US: Center for Systemic Peace
Mohtadi, H., and T. L. Roe. 2003. Democracy, rent seeking, public spending and growth. Journal of Public Economics 87 (3-4):445-466.
Myerson, R. B. 1993. Effectiveness of electoral systems for reducing government corruption - a Game-Theoretic Analysis. Games and Economic Behavior 5 (1):118-132.
Paldam, M. 2002. The big pattern of corruption. Economics, culture and the seesaw dynamics. European Journal of Political Economy 18:215-40.
Pani, M. (2011), “Hold your nose and vote: corruption and public decisions in a representative democracy”, Public Choice, 148, 1-2, 163-196
Persson, T, G. Tabellini, and F. Trebbi. 2003. Electoral rules and corruption. Journal of Europen Economic Association 1 (4):958-89.
Rock, M. (2009), “Corruption and democracy”, Journal of development studies, 45, 1, 55-75
Rose-Ackerman, S. (1999), Corruption and Government: Causes, Consequences, and Reform, Cambridge, Mass: Cambridge University Press
Russet B. 1994. Grasping the Democratic Peace: Principles for a Post-Cold War World. Princeton University Press
CMI WORKING PAPER DOES DEMOCRACY REDUCE CORRUPTION? WP 2011: 4
22
Russett B., and W. Antholis 1992. Do Democracies Fight Each Other? Evidence from the Peloponnesian War. Journal of Peace Research, vol. 29, no. 4, pp. 415-434
Schumpeter, J. (1950). Capitalism, Socialism, and Democracy. Harper Perennial.
Stock, J. H., Wright, J. H. and Yogo, M. (2002), “A survey of weak instruments and weak identification in generalized method of moments”, Journal of Business & Economic Statistics, 20, 518-529
Svensson, J. (2005) ‘Eight Questions About Corruption’, Journal of Economic Perspectives 19 (3): 19-42
Teorell, J. and Hadenius, A. 2005 ”Determinants of Democratization: Taking Stock of the Large-N Evidence”, mimeo., Department of Government, Uppsala University
Treisman, D. (2000) ‘The Causes of Corruption: A Cross-national Study’, Journal of Public Economics 76 (3): 399-457.
Treisman, D. (2007), “What Have We Learned About the Causes of Corruption from Ten Years of Cross-National Empirical Research?”, Annual Review of Political Science, 10, 211-244
UCDP/PRIO (2010), UCDP/PRIO Armed Conflict Dataset Codebook, Version 4-2010, Uppsala: Uppsala Conflict Data Program
Uslaner, E. M. 2008. Corruption, inequality, and the rule of law: the bulging pocket makes the easy life: Cambridge University Press, Cambridge.
CMI WORKING PAPER DOES DEMOCRACY REDUCE CORRUPTION? WP 2011: 4
23
Appendix Table A 1. Countries included in main sample (N=151)
Albania Costa Rica India Montenegro SloveniaAlgeria Croatia Indonesia Morocco Solomon IslandsAngola Cyprus Iran, Islamic Rep. Mozambique South AfricaArgentina Czech Republic Ireland Namibia SpainArmenia Denmark Israel Nepal Sri LankaAustralia Djibouti Italy Netherlands SudanAustria Dominican Republic Jamaica New Zealand SwazilandAzerbaijan Ecuador Japan Nicaragua SwedenBahrain Egypt, Arab. Rep. Jordan Niger SwitzerlandBangladesh El Salvador Kazakhstan Nigeria Syrian Arab RepublicBelarus Equatorial Guinea Kenya Norway TajikistanBelgium Eritrea Korea, Rep. Oman TanzaniaBenin Estonia Kyrgyz Republic Pakistan ThailandBhutan Ethiopia Lao PDR Panama Timor-LesteBolivia Fiji Latvia Papua New Guinea TogoBotswana Finland Lebanon Paraguay Trinidad and TobagoBrazil France Lesotho Peru TunisiaBulgaria Gabon Liberia Philippines TurkeyBurkina Faso Gambia, The Libya Poland TurkmenistanBurundi Georgia Lithuania Portugal UgandaCambodia Germany Macedonia, FYR Qatar UkraineCameroon Ghana Madagascar Romania United Arab EmiratesCanada Greece Malawi Russian Federation United KingdomCentral African Republic Guatemala Malaysia Rwanda United StatesChad Guinea Mali Saudi Arabia UruguayChile Guinea-Bissau Mauritania Senegal UzbekistanChina Guyana Mauritius Serbia Venezuela, RBColombia Haiti Mexico Sierra Leone VietnamComoros Honduras Moldova Singapore Yemen, Rep.Congo, Dem. Rep. Hungary Mongolia Slovak Republic ZambiaCongo, Rep.
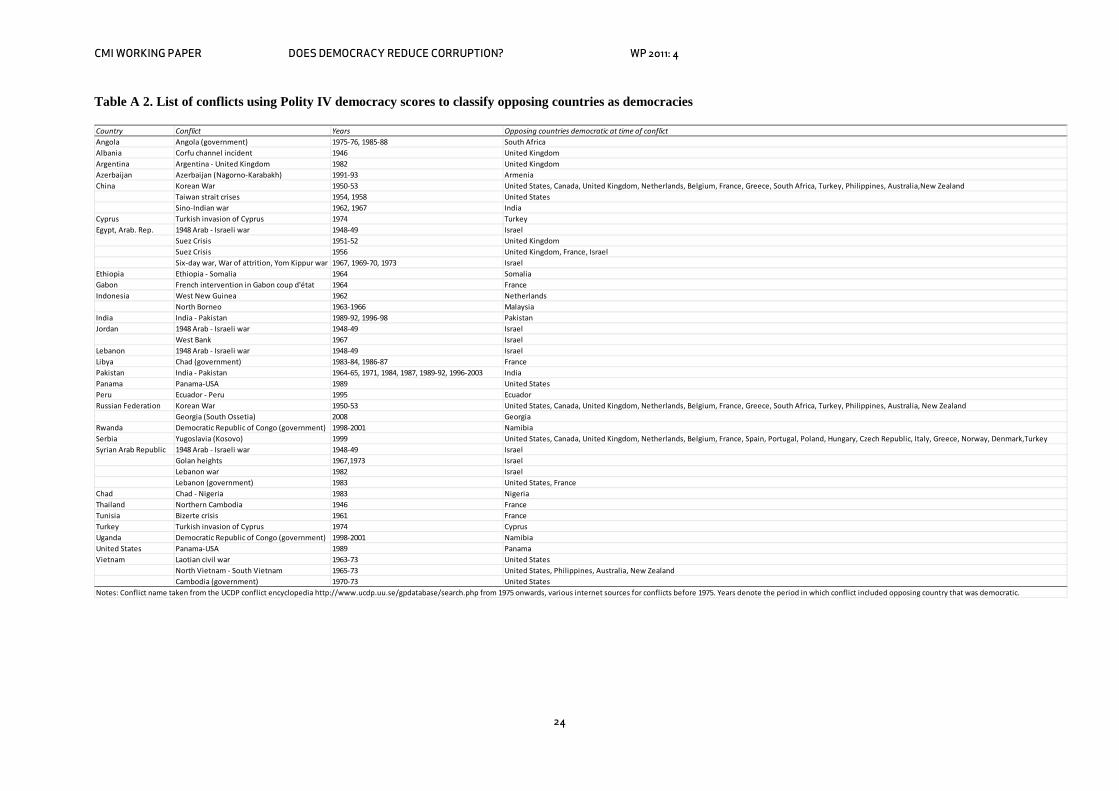
CMI WORKING PAPER DOES DEMOCRACY REDUCE CORRUPTION? WP 2011: 4
24
Table A 2. List of conflicts using Polity IV democracy scores to classify opposing countries as democracies
Country Conflict Years Opposing countries democratic at time of conflictAngola Angola (government) 1975-76, 1985-88 South AfricaAlbania Corfu channel incident 1946 United KingdomArgentina Argentina - United Kingdom 1982 United KingdomAzerbaijan Azerbaijan (Nagorno-Karabakh) 1991-93 ArmeniaChina Korean War 1950-53 United States, Canada, United Kingdom, Netherlands, Belgium, France, Greece, South Africa, Turkey, Philippines, Australia,New Zealand
Taiwan strait crises 1954, 1958 United StatesSino-Indian war 1962, 1967 India
Cyprus Turkish invasion of Cyprus 1974 TurkeyEgypt, Arab. Rep. 1948 Arab - Israeli war 1948-49 Israel
Suez Crisis 1951-52 United KingdomSuez Crisis 1956 United Kingdom, France, IsraelSix-day war, War of attrition, Yom Kippur war 1967, 1969-70, 1973 Israel
Ethiopia Ethiopia - Somalia 1964 SomaliaGabon French intervention in Gabon coup d'état 1964 FranceIndonesia West New Guinea 1962 Netherlands
North Borneo 1963-1966 MalaysiaIndia India - Pakistan 1989-92, 1996-98 PakistanJordan 1948 Arab - Israeli war 1948-49 Israel
West Bank 1967 IsraelLebanon 1948 Arab - Israeli war 1948-49 IsraelLibya Chad (government) 1983-84, 1986-87 FrancePakistan India - Pakistan 1964-65, 1971, 1984, 1987, 1989-92, 1996-2003 IndiaPanama Panama-USA 1989 United StatesPeru Ecuador - Peru 1995 EcuadorRussian Federation Korean War 1950-53 United States, Canada, United Kingdom, Netherlands, Belgium, France, Greece, South Africa, Turkey, Philippines, Australia, New Zealand
Georgia (South Ossetia) 2008 GeorgiaRwanda Democratic Republic of Congo (government) 1998-2001 NamibiaSerbia Yugoslavia (Kosovo) 1999 United States, Canada, United Kingdom, Netherlands, Belgium, France, Spain, Portugal, Poland, Hungary, Czech Republic, Italy, Greece, Norway, Denmark,TurkeySyrian Arab Republic 1948 Arab - Israeli war 1948-49 Israel
Golan heights 1967,1973 IsraelLebanon war 1982 IsraelLebanon (government) 1983 United States, France
Chad Chad - Nigeria 1983 NigeriaThailand Northern Cambodia 1946 FranceTunisia Bizerte crisis 1961 FranceTurkey Turkish invasion of Cyprus 1974 CyprusUganda Democratic Republic of Congo (government) 1998-2001 NamibiaUnited States Panama-USA 1989 PanamaVietnam Laotian civil war 1963-73 United States
North Vietnam - South Vietnam 1965-73 United States, Philippines, Australia, New ZealandCambodia (government) 1970-73 United States
Notes: Conflict name taken from the UCDP conflict encyclopedia http://www.ucdp.uu.se/gpdatabase/search.php from 1975 onwards, various internet sources for conflicts before 1975. Years denote the period in which conflict included opposing country that was democratic.
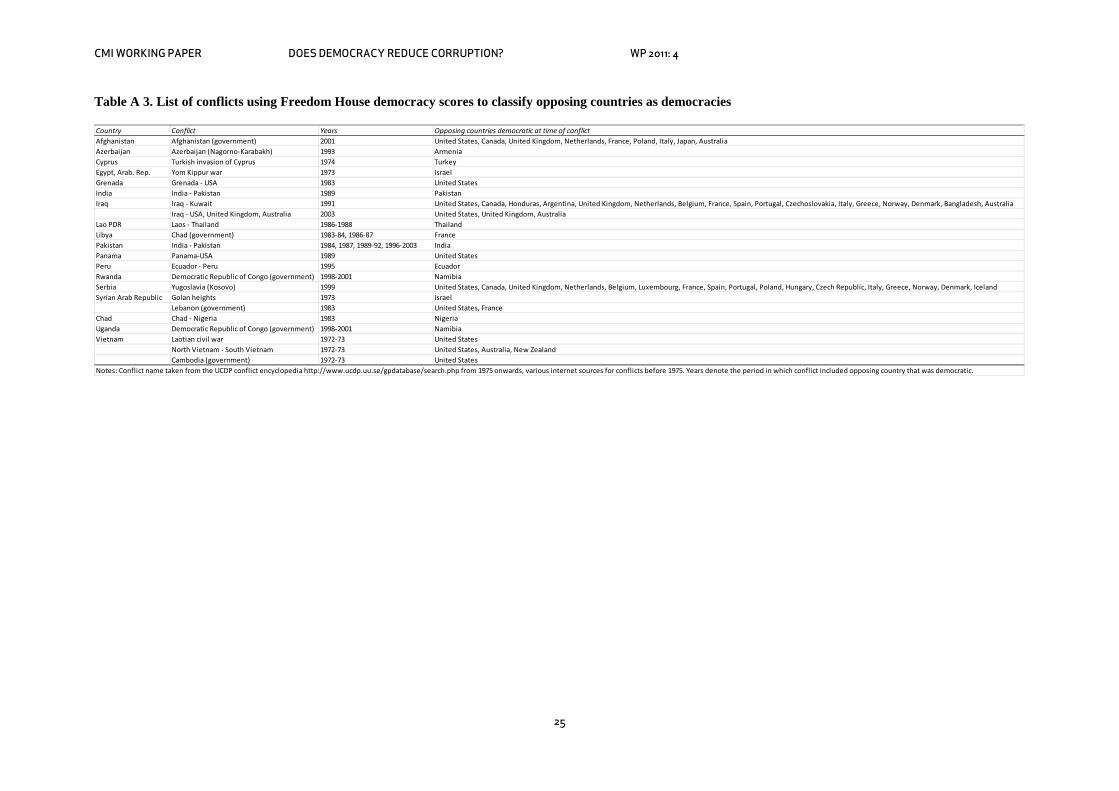
CMI WORKING PAPER DOES DEMOCRACY REDUCE CORRUPTION? WP 2011: 4
25
Table A 3. List of conflicts using Freedom House democracy scores to classify opposing countries as democracies
Country Conflict Years Opposing countries democratic at time of conflictAfghanistan Afghanistan (government) 2001 United States, Canada, United Kingdom, Netherlands, France, Poland, Italy, Japan, AustraliaAzerbaijan Azerbaijan (Nagorno-Karabakh) 1993 ArmeniaCyprus Turkish invasion of Cyprus 1974 TurkeyEgypt, Arab. Rep. Yom Kippur war 1973 IsraelGrenada Grenada - USA 1983 United StatesIndia India - Pakistan 1989 PakistanIraq Iraq - Kuwait 1991 United States, Canada, Honduras, Argentina, United Kingdom, Netherlands, Belgium, France, Spain, Portugal, Czechoslovakia, Italy, Greece, Norway, Denmark, Bangladesh, Australia
Iraq - USA, United Kingdom, Australia 2003 United States, United Kingdom, AustraliaLao PDR Laos - Thailand 1986-1988 ThailandLibya Chad (government) 1983-84, 1986-87 FrancePakistan India - Pakistan 1984, 1987, 1989-92, 1996-2003 IndiaPanama Panama-USA 1989 United StatesPeru Ecuador - Peru 1995 EcuadorRwanda Democratic Republic of Congo (government) 1998-2001 NamibiaSerbia Yugoslavia (Kosovo) 1999 United States, Canada, United Kingdom, Netherlands, Belgium, Luxembourg, France, Spain, Portugal, Poland, Hungary, Czech Republic, Italy, Greece, Norway, Denmark, IcelandSyrian Arab Republic Golan heights 1973 Israel
Lebanon (government) 1983 United States, FranceChad Chad - Nigeria 1983 NigeriaUganda Democratic Republic of Congo (government) 1998-2001 NamibiaVietnam Laotian civil war 1972-73 United States
North Vietnam - South Vietnam 1972-73 United States, Australia, New ZealandCambodia (government) 1972-73 United States
Notes: Conflict name taken from the UCDP conflict encyclopedia http://www.ucdp.uu.se/gpdatabase/search.php from 1975 onwards, various internet sources for conflicts before 1975. Years denote the period in which conflict included opposing country that was democratic.
CMI WORKING PAPERSThis series can be ordered from:
CMI (Chr. Michelsen Institute)Phone: +47 47 93 80 00 Fax: +47 47 93 80 01E-mail: [email protected]
P.O.Box 6033 Bedriftssenteret,N-5892 Bergen, NorwayVisiting address: Jekteviksbakken 31, Bergen
Web: www.cmi.no Angola Programme: www.cmi.no/angola
Price: NOK 50Printed version: ISSN 0804-3639Electronic version: ISSN 1890-5048Printed version: ISBN 978-82-8062-420-8Electronic version: ISBN 978-82-8062-421-5
This paper is also available at:www.cmi.no/publications
INDEXING TERMSDemocracyCorruptionConflictEndogeneity
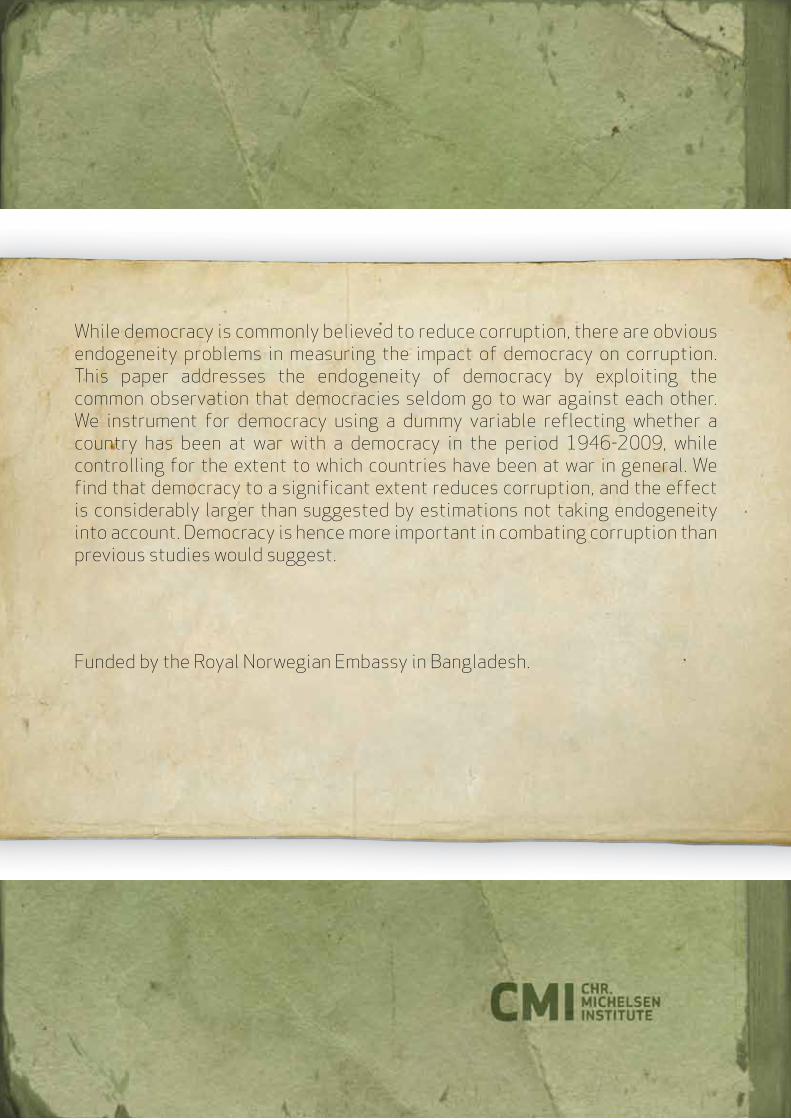
While democracy is commonly believed to reduce corruption, there are obvious endogeneity problems in measuring the impact of democracy on corruption. This paper addresses the endogeneity of democracy by exploiting the common observation that democracies seldom go to war against each other. We instrument for democracy using a dummy variable reflecting whether a country has been at war with a democracy in the period 1946-2009, while controlling for the extent to which countries have been at war in general. We find that democracy to a significant extent reduces corruption, and the effect is considerably larger than suggested by estimations not taking endogeneity into account. Democracy is hence more important in combating corruption than previous studies would suggest.
Funded by the Royal Norwegian Embassy in Bangladesh.