does fdi harm the host country’s environment? evidence from coastal and interior china helen feng...
TRANSCRIPT

Does FDI Harm the Host Country’s Environment?Evidence from Coastal and Interior China
Helen Feng Liang
University of California, BerkeleyApril 12, 2006

2
Why study trade and pollution? Environmental issues are global
global warming, ozone depletion, acid rain, etc.
Trade could have impact on environment WTO, NAFTA Are dirty industries moving to the South?
Trade could lead to growth, growth could be good or bad for the environment
Trade policy and environmental policy

3
What makes China an interesting unit of analysis?
Received a large amount of FDI in recent years
A popular destination of manufacturing outsourcing
Vast number of cities, large variety in location, economic development, access to foreign investment, and policy
Increasing pollution problems

4

5

6
Research Question?
What’s the impact of foreign direct investment on the environmental quality in China?
What are the channels of the impact?

7
Outline
Introduction Theory Foreign Direct Investment and Environment
in China Data, Measurement, and Empirical Strategy Result and Conclusion Discussion

8
How Does Trade Influence Pollution? Openness Growth Less or More Pollution
Trade More output More pollution: Scale Effect Trade Higher income Higher demand for environ: Income Effect
Environmental Kutznet Curve: an inverse-U shaped relation between per capita GDP and Pollution level
Grossman & Krueger 1993, 1995, Frankel & Romer 1999
Openness Tech Efficiency Less pollution: Technique Effect
Antweiler et al 2001, Frankel & Rose 2002 Wang & Jin 2002
Limitation of Cross Country studies: Endogeneity of Trade Policy and Environmental Policy
Contribution of my study: within-country study to overcome endogenous trade policy

9
Foreign Direct Investment in China: What’s driving the distribution of FDI?
Government policy 4 special economics zones and 14 coastal open cities
Geographic location Closeness to sea ports/trade hubs: Shanghai, Hong Kong, etc
FDI’s Effect on the Environment: FDI more pollution:
more output more pollution FDI less pollution:
FDI Tech Spillover Improve Energy Efficiency FDI Competition Crowd out less efficient firms Improve Overall Energy
Efficiency FDI Higher Income Higher Demand for Environment
Ambiguous: FDI could go to dirty or clean industries

10
Hypothesis
Hypothesis 1 EKC – Pollution level in China’s cities increases
with per capita GDP, but at a decreasing speed.
Hypothesis 2 Pollution level in China’s cities decreases with
foreign direct investment, for given industrial composition and the level of output.

11
Environmental issues in China: SO2 is a major source of pollution due to the structure of fuel
consumption
0
200
400
600
800
1,000
1,200
1,400
1,600
1980 1985 1990 1995 2000
Prim
ary
Con
sum
ptio
n (M
tce)
Primary Electricity
Natural Gas
Petroleum
Coal
Source: China Energy Databook V6.0 Figure 4.A.1

12
Environmental issues in China: China's Sulfur Dioxide Emission by Industry Sectors
China's Sulfur Dioxide Emission by Industry Sectors in 2002Source: China Statistic Yearbook 2003
Chemical Materials & Products, 4.71%
Nonmetal Mineral Products, 9.92%
Smelting and Rolling of Metals, 9.52%
Electricity&Water Production & Supply,
48.02%
Others, 27.83%
Source: China Statistic Yearbook 2003

13
Data Source
1996-2003 panel of 231 cities in China: city-year observations City level pollution
Estimated industrial SO2 emission: China Urban Statistics Yearbook 1997-2003
SO2 ambient concentration: China Energy Databook v6.0
Industry composition and ownership China National Bureau of Statistics
Other city social and economic variables China Urban Statistics Yearbook
Pollution intensity by industry sectors World Bank Industrial Pollution Projection System (IPPS)

14
Variables
Dependent Variables – Sulfur Dioxide Emission: Factory SO2 emission (tons)
Explanatory Variables: FDI sector: asset and employment of foreign invested plants Domestic sector: asset and employment of domestic plants Income: per capita GDP and per capita GDP square
Control Variables: Industrial output Estimated SO2 emission based on industry composition
Employment * SO2 emission per employee Land area, capital labor ratio Year effects, provincial dummies, city fixed effects

15
FDI v.s. Domestic Factories: Capital labor ratio FDI are more capital intensive

16
FDI v.s. Domestic Factories: Expected SO2 emission per employee based on industry composition FDI probably goes to “cleaner” industries

17
Empirical Strategy – A reduced form regression with IV SO2 it = β0 + β1* FDIit + β2*Domestic assetit +
β3*incomeit + γ*Xit + αi + Yeart + εit
Where, FDIit = ρ0 + ρ1* coastali + ρ2* distance to
sea portsi + µit
All the terms are in logs

18
Empirical Strategy – Geography and Trade policy as instruments for FDI
Challenge: Unobserved variables influencing openness and income at the same time,
and influencing pollution via income
Solution: Geography and central government policy influence FDI at city level, but not the other way around Similar technique used in Wei (2001) cross-city and Frankel and Rose
(2002) cross-country studies
Instruments: Coastal Open Policy dummies: coded 1 if the city is one of the 18 open
cities and special economic zones designated in the 1980s Distance to Sea Ports and hubs of incoming FDI, Shanghai, HongKong,
Dalian, QinHuangDao, and Taiwan

19
Cross-sectional Analysis
Dependent Variable: LogSO2 in tons
*** p<0.001, ** p<0.01, * p<0.05
All regressions include a constant, city level control variables, and year and provincial dummies.
OLS OLS OLS IV IV (1) (2) (3) (1) (2)
Log FDI asset -.0314 -.6264 * Log Domestic asset .3847† -.0221 Log FDI employment -.0901 -.7624 * Log domestic employment .7734** .5750 † Log expected SO2 Emission from FDI factories
-.1420**
Log expected SO2 Emission from domestic factories
.2571 *
Log per capita GDP 6.0812 ** 5.5370 ** 6.0814 * 6.9149 * 5.3650 ** Log per capita GDP squared -.3326** -.2991** -.3283 ** -.3801 ** -.2940 **
20
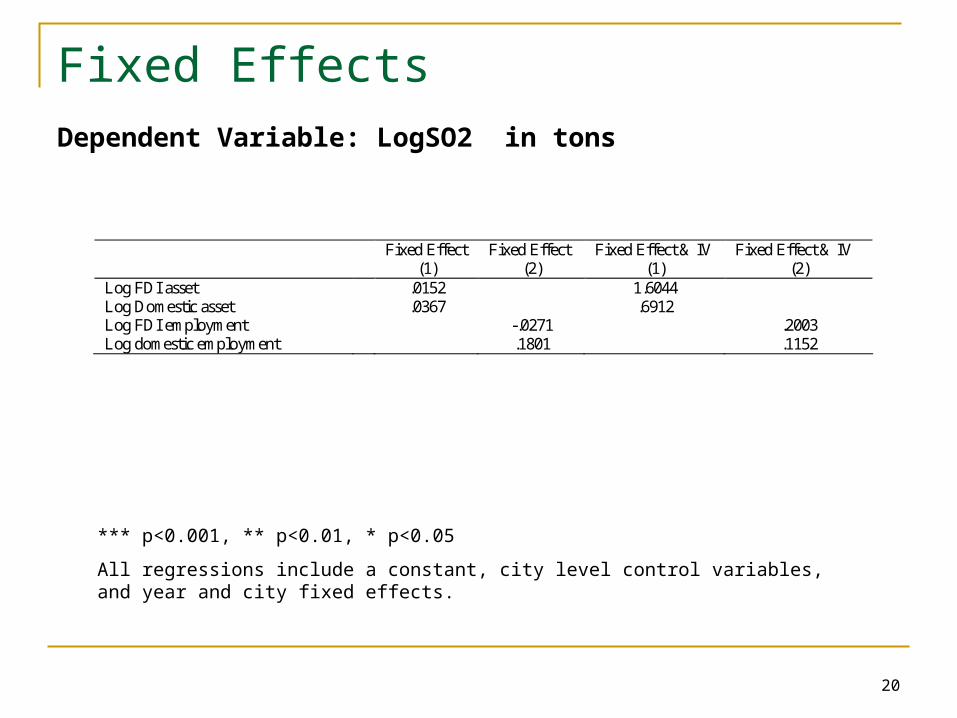
Fixed Effects Dependent Variable: LogSO2 in tons
*** p<0.001, ** p<0.01, * p<0.05
All regressions include a constant, city level control variables, and year and city fixed effects.
Fixed Effect Fixed Effect Fixed Effect & IV Fixed Effect & IV (1) (2) (1) (2)
Log FDI asset .0152 1.6044 Log Domestic asset .0367 .6912 Log FDI employment -.0271 .2003 Log domestic employment .1801 .1152

21
Conclusion and Caveats
Conclusion FDI
shows a negative effect on SO2 factory emission GDP
Supports Kutznet Curve, with all the cities on the left side of the hump
Caveats Other Pollutants: water, soil, etc

22
Future Research
Look for technology spillover effects Within industry sectors Between upstream-downstream sectors
Look for crowd-out effects Within industry sectors Export vs domestic market Labor supply and wage increase