does formal work pay? - izaconference.iza.org/conference_files/infoete2011/koettl_j6456.pdf ·...
TRANSCRIPT

1
Does formal work pay?
The role of labor taxation and social benefit design in providing disincentives for
formal work
Johannes Koettl (World Bank, ECSHD and IZA) and Michael Weber (World Bank, HDNSP)1
June 2011
1 Introduction
This paper asks the question if—given the high levels of informality and inactivity in some European
countries—it is actually “worthwhile” for the working age population to engage in income-generating
activities. And if so, what incentives have employers, the self-employed, and workers to actually register
these activities and pay taxes and contributions on the income that is generated?
There are a number of reasons why employers, the self-employed, and workers might decide not to
register their activities. First, regulations in the product and labor market—like product licensing,
employment protection legislation (EPL), and minimum wages—might be too stringent, so in order to
circumvent these regulations, people might decide to operate outside the formal economy. Second,
certain administrative procedures related to paying taxes, accounting, completing statistical
questionnaires, and so on, might deter people from operating in the formal sector. Third, people and
firms might want to avoid paying taxes on revenues, income, profit, or property and social security
contributions. Forth, formal income might lead to withdrawal of social benefits—like social assistance or
unemployment benefits—so that people might prefer informal or no work over formal work. Fifth,
enforcement of existing legislation on regulations and taxation might be weak, so the risks of
circumventing regulations and avoiding taxes might be low.
1 This paper has been prepared as part of a World Bank Economic and Sector Work on informal employment in the
New Member States and Croatia (Task Team Leader: Truman Packard, ECSHD). The paper greatly benefited from
research support by Isil Oral (ECSHD), comments by Truman Packard, and a close cooperation with Tatiana
Goridne, Herwig Immervoll, and Dominique Partout at the Social Policy Division of the Organisation for Economic
Co-operation and Development (OECD). All errors, though, are those of the authors.
The views and opinions expressed in this paper are solely those of the authors and do not represent the views and
opinions of the World Bank, its board of Executive Directors, or the countries they represent.
2
In answering the main question of this paper, the focus is put on the role of labor taxation and social
benefit design, how it relates to informal employment and—as a logical extension—to inactivity, and
what disincentives for formal work might be provided to people in working age so they choose to “exit”
into informality or inactivity. Bearing in mind that labor taxation and social benefit design are but two
pieces in the puzzle to explain informality and inactivity, the analysis presented below highlights how for
lower wage earners, the value of formal social security benefits that come with formal employment
would—at times—have to be enormously high to offset the opportunity costs. This leads to the
conclusion that formal (part-time) jobs at low wage levels—so-called mini-jobs and midi-jobs—are not
economically viable for low-wage earners in some countries. This lack of economic viability might
exclude a substantial part of the European working-age population from formal employment and social
security coverage. In this latter sense, informality and inactivity might not only be a deliberate choice of
exit, but are also a matter of “exclusion”.
The analysis starts from the question of what incentives or disincentives the inactive and the informally
employed face when considering formal work. For the inactive, starting to work formally or not will be
based on considerations of how any potential formal net wage and social security entitlements compare
to the alternative of not working. Not working, though, might imply being eligible to income-tested
benefits like social assistance, which they could (partially) lose when working formally, increasing the
opportunity costs of formal employment.
For informally employed, switching to formality will have a number of implications for both workers and
firms. First, it implies that workers and their employers will enter as contributors to social security. This
means that both the employer and the worker have to contribute to pension funds, health insurance
funds, and unemployment insurance funds. The decision on contributions will be importantly influenced
by the value that informal workers attach to being covered by social security. Second, workers will have
to pay personal income tax on their formal gross wages. This decision will be influenced by the value
informal workers put on public services and social norms about paying taxes (“tax morale”). Paying
social security contributions and income tax combined will decrease workers’ take-home pay when
compared to their informal wage. Third, just like the inactive, informal workers after formalizing might
not be eligible any more to a number of benefits that are income-tested. When having no formal income
on record, workers might be eligible to income-tested benefits like social assistance, family benefits, or
housing benefits. Once informal workers are formalizing, though, they might lose all or parts of these
benefits, reducing their formal income further and increasing the opportunity costs of formal work.
Firms, finally, which are formalizing informal workers, will have to generate additional formal revenues
by switching informal revenues to formal revenues. This implies paying additional taxes in the product
market, like sales or value-added taxes.
The analysis presented below starts by first looking at the levels of informality and inactivity in the New
Members States of Eastern Europe and Croatia (NMS) and makes the case that—given the future
challenges of aging—it is vital for these countries to increase formal employment. By looking at firms’
perceptions on the main obstacle of doing business, it is suggested that taxes could play a major role in
constraining formal job creation. Without answering the question of what the binding constraints for

3
formal job creation really are, it seems that a necessary condition is that formal jobs have to offer a
viable income opportunity for workers and employers—that is, formal jobs have to pay. The subsequent
section investigates these incentives further by looking into the tax and benefit systems of the NMS. This
section offers a new, innovative measurement of disincentives for informal work, the so-called
formalization tax rate (FTR). The FTR goes beyond the usual measurements of the tax wedge and the
marginal effective tax rate (METR) by combining both. It expresses the opportunity costs of formal
employment by measuring what share of informal income is being taxed away—in terms of income tax,
social security contributions and withdrawn benefits—when formalizing, and therefore how much
workers have to gain in return for formalization in terms of social security benefits and employment
protection. For this exercise, the World Bank partnered with the Organisation of Economic Co-operation
and Development (OECD) to extend the OECD’s Tax and Benefit model to the non-OECD NMS (the
Baltics, Bulgaria, and Romania) and the three Western Balkan countries (Bosnia and Herzegovina,
Macedonia, and Serbia). The subsequent section then relates the synthetic measurement of the FTR to
actual informality patterns by using the EU Survey of Income and Living Conditions (EU-SILC),
investigating the question if and how much these disincentives matter for informal employment. The
final section concludes.
2 Taxes and Benefits: a Necessary Condition?
In the NMS and Croatia, not only informality is high (see, for example, Montenegro 2011 and Hazans
2011), but also inactivity. When compared to other EU countries, most NMS display participation rates
below the EU average (see Figure 1). The demographic transition and aging—which is particularly severe
in the NMS—will considerably increases the need for participation in the formal sector in the future. For
the social contract of theses countries to survive, more people will need contribute through taxes and
social security contributions—that is, those who currently do not work and those who work informally
will need to be activated and convinced to participate in the formal sector of the labor market. One—
possibly necessary—pre-condition for participation in the formal sector is arguably that formal work has
to pay. In other words, the incentives for formal work that originate in the tax and benefit system of a
country have to be aligned to encourage formal work.
Incentives might arguably not be the binding constraint. Labor taxation and benefit design are but two
pieces in the puzzle to explain high levels of inactivity and informality among the working age population
of the NMS. Other reasons are related to regulations in the product and labor market, administrative
burden related to taxes, regulations, or accounting, and taxation on revenues, profit, tradable goods,
property, enforcement of laws, and so on. This paper is not trying to identify which of these potential
reasons are the main causes for high levels of informality and inactivity, but narrowly focuses on the
incentives and disincentives for formal employment provided by the labor taxation and benefit system.

4
Figure 1: Participation rates in the NMS and Croatia tend to be below EU average.
Note: Columns represent participation rates of the population aged 15 to 64 in the EU and EU Candidate countries (percent,
2009). Countries in red depict the NMS and Croatia.
Source: Author’s calculation based on Eurostat.
One indication, though, that at least taxation in general plays a prominent role in income-generating
activities comes from enterprise surveys. The World Bank Enterprise surveys reveal that on average, 45
percent of firms in the NMS and Croatia cite tax rates as a one of the major obstacle for doing business
in 2009 (see Figure 2). The question refers to all types of taxes, and not specifically labor taxes.
Nevertheless, the results indicate that employers perceive tax rates as high and as a greater obstacle to
doing business than regulations and administrative procedures. Tax administration (24 percent) and
competition from informal enterprises (23 percent) seem to play some role, but licensing (14 percent),
labor regulations (14 percent), and trade regulations (8 percent) figure less prominently as an obstacle
to doing business. Therefore, although the results of this enterprise survey are not a direct
measurement of obstacles to formal employment, they give an indication that tax rates could be a
constraint for creating new formal jobs.
Hence, there is some indication that disincentives—like high levels of taxation—could play an important
role in explaining high levels of inactivity and informality in the NMS. But many other factors, like
regulations, social norms and tax morale, the quality of institutions and governance, and so on, could
also play an import—maybe even more important—role. Therefore, fixing the incentives for formal
work might by no means be a sufficient condition to increase participation in the formal sector. Yet, if it
is not a sufficient condition, than at least it might be a necessary condition: no matter what the other
binding constraints are, at a minimum for more people to participate in the formal economy, formal
work has to pay.
0
10
20
30
40
50
60
70
80
90
100IS
CH
DK
NL
NO SE
DE
UK
AT FI
CY
EE
LV PT
ES SI
EU
27
FR IE CZ LT LU SK
GR
BG BE PL
MK
RO
HR IT
HU
MT
TR

Figure 2: Employers identify high tax rates as the main obstacle to doing business.
Note: The bars represent the percentage of firms that identify the
Averages are unweighted. Select EU-15 countries are Germany, Greece, Ireland, Portugal, and Spain.
Source: Author’s calculation based on World Bank Enterprise Surveys.
3 Disincentives for Formal Work
This section offers a closer investigation of the tax and benefit system
that for low-wage earners, the value of
are associated with formal employment have to be
employment. This is due to relative high labor taxation
and family benefits. Taken together, informal workers at low
amount of their informal wage in order to formalize, and it is unlikely that t
entitlement (and other benefits like formal employment protection legislation)
for formalization exceed these implicit costs.
work at low wage levels. In other words, so called
time jobs that pay less or just a little more
viable in the NMS. Hence, workers w
: Employers identify high tax rates as the main obstacle to doing business.
The bars represent the percentage of firms that identify the respective issue as a main obstacle to doing business.
15 countries are Germany, Greece, Ireland, Portugal, and Spain.
World Bank Enterprise Surveys.
ncentives for Formal Work
closer investigation of the tax and benefit systems in the NMS, which will suggest
wage earners, the value of the benefits secured through social security contributions that
are associated with formal employment have to be rather high to offset the opportunity costs of formal
relative high labor taxation, but also due to the design of social assistance
and family benefits. Taken together, informal workers at low wages have to give up a considerable
amount of their informal wage in order to formalize, and it is unlikely that the value of social security
(and other benefits like formal employment protection legislation) that they get in return
for formalization exceed these implicit costs. The same holds for the inactive when considering formal
In other words, so called-mini jobs and midi-jobs—that is, part
or just a little more than the full-time minimum wage—are hardly economically
. Hence, workers with low educational attainment and skills—like many of
5
as a main obstacle to doing business.
, which will suggest
social security contributions that
high to offset the opportunity costs of formal
, but also due to the design of social assistance
have to give up a considerable
he value of social security
that they get in return
The same holds for the inactive when considering formal
that is, part-time and full-
are hardly economically
many of the

6
informally employed and the inactive—might be priced out of the formal market in the sense that
formal net wages are too low when compared to informal wages and employers are unwilling to accept
higher formal labor costs when compared to informal labor costs, given the low productivity of informal
workers.
3.1 The Decision between Formal and Informal
How would a worker and his or her (potential) employer then decide about a formal or an informal job?
Ignoring other considerations related to regulations, administrative burden, enforcement, and so on, for
a low-paid (part-time) job both the employer and the worker have strong incentives to circumvent the
high labor taxation and make the job an informal one. Nevertheless, various factors have to be
considered when analyzing the decision between formal and informal work apart from labor taxes.
Labor taxes decrease workers’ take-home pay when compared to their informal wage, but also, just like
the inactive, informal workers after formalizing might not be eligible any more to a number of benefits
that are income-tested. When having no formal income on record, workers might be eligible to income-
tested benefits like social assistance or family benefits. Once informal workers are formalizing, though,
they might lose all or parts of these benefits, reducing their formal income further and increasing the
opportunity costs of formal work. In addition, firms that are formalizing informal workers will have to
generate additional formal revenues by switching informal revenues to formal revenues. This implies
paying additional taxes in the product market, like sales or value-added taxes.
The latter point regarding the need for firms to formalize revenues in response to formalizing workers is
beyond the scope of this paper. The following analysis will focus on the incentives and disincentives
provided by the labor tax and benefit system. In doing so, it will be useful to apply a more precise
measure on what the advantages and disadvantages of formal and informal work are for employers and
employees, not only at the extremely low wage level, but across the entire wage spectrum. This allows
to obtain a sense of how high the opportunity costs of formal labor are—expressed in terms of informal
wage and forgone income-tested benefits like social assistance. This in turn gives a sense of how the
value of social security entitlements and employment protection that come with formal employment at
least have to be to offset the opportunity costs of formal employment.
3.2 Labor Taxation
Labor taxes in the NMS are high at lower wage levels. A comparison with other EU, OECD, and
neighboring countries shows that the tax wedge on labor at lower wage levels (33 percent of average
wage) tend to be relatively high (see Figure 3).2 The tax wedge measures the difference between labor
costs and take-home pay of workers. It expresses the costs of social security contributions by employers
and employees and the personal income tax of employees as a share of total labor costs. These taxes
2 In many countries, full-time work at 33 percent of the average wage is below the legal minimum wage.
Nevertheless, the same tax wedge applies to someone receiving average wage, but working 33 percent part-time,
although there can be slight variations of the tax wedge for part-time workers when compared to full-time
workers.

7
vary depending on family type and wage level. For a single with no children who receives a gross wage
of 33 percent of the average wage, only few EU-15 countries—like Sweden, Germany, Belgium, and
Finland—charge higher taxes than most of the NMS.
Figure 3: Labor taxation tends to be relatively high for low-wage earners in the NMS
Note: Columns represent the tax wedge for low-income earners (singles with no children at 33 percent of average wage) in
2008 (for Bosnia, Macedonia, and Serbia, 2009). Countries in red depict the NMS.
Source: Author’s calculation based on OECD Tax and Benefit model.
Also, labor taxation in the NMS is not very progressive. While in most other countries, labor taxes
increase significantly with the wage level—for most EU-15 countries, by over 10 percentage points
between 33 and 100 percent of average wage level—in the NMS, labor taxes increase by less than 10
percentage points. Although countries with a high tax wedge at lower wage levels can be expected to
display less progressivity, the NMS display especially low levels of progressivity. All NMS except for
Hungary are below the trend line in a cross-county comparison (see Figure 4).3 In particular, for singles
without children, Bulgaria stands out with zero progressivity of labor taxes. This is important because
low progressivity means that there is some room for lowering the tax wedge for low-wage earners in a
fiscally neutral way by increasing progressivity.
3 The assumed relationship is that tax systems need to raise a certain fixed amount of resources, and those that
put higher taxes on lower wages have less of need to increase taxes at higher wages and hence display less
progressivity.
0%
5%
10%
15%
20%
25%
30%
35%
40%
45%
50%
Sw
ed
en
Hu
ng
ary
Ro
ma
nia
Bo
snia
-F
ed
era
tio
n
Se
rbia
Ge
rma
ny
Be
lgiu
m
Lith
ua
nia
Fin
lan
d
Cze
ch R
ep
ub
lic
Bu
lga
ria
Po
lan
d
Latv
ia
Gre
ece
Est
on
ia
Au
stri
a
Slo
ve
nia
Fra
nce
Ne
the
rla
nd
s
Ita
ly
Slo
va
k R
ep
ub
lic
Bo
snia
-R
ep
ub
lik
a S
rpsk
a
Ma
ced
on
ia
Po
rtu
ga
l
Sp
ain
No
rwa
y
Jap
an
Un
ite
d S
tate
s
Un
ite
d K
ing
om
Sw
itze
rla
nd
Ire
lan
d

Figure 4: In the NMS, the tax wedge tends to be
Note: Data points represent the tax wedge for low
wage; x-axis) in relation to a country’s progressivity of
33 and 100 percent of average wage; y-axis) in 2008
NMS.
Source: Author’s calculation based on OECD Tax and Benefit model
Nevertheless, with the exception of Bulgaria in
progressivity.4 A typical graph of the tax wedge over the wage level for the
in this case, for Estonia and Latvia. As can be seen, the tax wedge is lower for low
26 percent for Estonia and Latvia) and starts to significantly increase from a certain wage level onwards
(around 20 percent of average wage) to levels of abou
interesting, though, is that some countries display much lower tax wedges for low wage earners, as in
the case for Australia and the United Kingdom
low-wage earners, and only for wage level above 20 percent of average wage the tax wedge is
increasing significantly.
4 Exceptions are Hungary and the Netherlands, which have a social security contribution floor. Such a floor has to
be paid independent of actual wages earned and therefore increases the tax wedge significan
levels.
tends to be not very progressive
ax wedge for low-income earners (single person with no children at 33 percent of average
progressivity of the tax wedge (the percentage point increase of the tax w
axis) in 2008 (for Bosnia, Macedonia, and Serbia, 2009). Countries in red depict t
OECD Tax and Benefit model.
Nevertheless, with the exception of Bulgaria in all countries labor taxation displays some degree of
A typical graph of the tax wedge over the wage level for the NMS is depicted in
As can be seen, the tax wedge is lower for low-wage earners
and starts to significantly increase from a certain wage level onwards
(around 20 percent of average wage) to levels of about 40 to 45 percent of total labor costs
interesting, though, is that some countries display much lower tax wedges for low wage earners, as in
the case for Australia and the United Kingdom (see Figure 5). Both have a tax wedge of 0 percent for
wage earners, and only for wage level above 20 percent of average wage the tax wedge is
Exceptions are Hungary and the Netherlands, which have a social security contribution floor. Such a floor has to
be paid independent of actual wages earned and therefore increases the tax wedge significantly at lower wage
8
at 33 percent of average
the percentage point increase of the tax wedge between
Countries in red depict the
displays some degree of
is depicted in Figure 5—
wage earners (around
and starts to significantly increase from a certain wage level onwards
t 40 to 45 percent of total labor costs. What is
interesting, though, is that some countries display much lower tax wedges for low wage earners, as in
. Both have a tax wedge of 0 percent for
wage earners, and only for wage level above 20 percent of average wage the tax wedge is
Exceptions are Hungary and the Netherlands, which have a social security contribution floor. Such a floor has to
tly at lower wage

9
Figure 5: In Estonia and Latvia, the tax wedge for low-wage earners is higher than in Australia or the United Kingdom.
Note: Graphs show the tax wedge for single person with no children.
Source: Author’s calculation based on OECD Tax and Benefit model (2008).
Figure 6: In the NMS, the tax wedge for the lowest-wage earners tends to be high, and the wage level where the tax wedge
increases significantly is relative high.
Single person with no children One-earner couple with two children
Note: The scatter plot depicts the wage level where the tax wedge starts to increase (x-axis) versus the tax wedge at 1 percent of average
wages (y-axis). Hungary, the Netherlands, and Serbia featuer falling tax wedges at low-wage levels and are not depicted, just like Bulgaria
which has a flat tax wedge. Austria, Belgium, and Canada have partly negative tax wedges at low wage levels, especially for families, and are
also not included in the right scatter plot (Canada also in the left). The NMS are pictured in red.
Source: Author’s calculation based on OECD Tax and Benefit model (2008).
0%
5%
10%
15%
20%
25%
30%
35%
40%
45%
50%
1
10
19
28
37
46
55
64
73
82
91
10
0
10
9
11
8
12
7
13
6
14
5
15
4
16
3
17
2
18
1
19
0
19
9
Percent of average wageTax wedge (Estonia) Minmum wage (Estonia)
Tax wedge (Latvia) Minmum wage (Latvia)
0%
5%
10%
15%
20%
25%
30%
35%
40%
45%
50%
1
10
19
28
37
46
55
64
73
82
91
10
0
10
9
11
8
12
7
13
6
14
5
15
4
16
3
17
2
18
1
19
0
19
9
Percent of average wageTax wedge (Australia) Minimum wage (Australia)
Tax wedge (UK) Minimum wage (UK)
Australia
Austria
Belgium
Czech Republic
Estonia
Finland
France
Germany
Greece
Irland
Italy
Japan
Latvia
Lithuania
Macedonia
Norway
Poland
Portugal
Romania
Slovak Republic
Slovenia
Spain
Sweden
Switzerland
United Kingdom
United States
0
5
10
15
20
25
30
35
40
0 10 20 30 40 50 60 70
Ta
x w
ed
ge
at
1 p
erc
en
t o
f a
ve
rag
e w
ag
e
Wage level (percent of average wage) where tax wedge starts to
increase significantly
Australia
EstoniaFinland
France
Germany
Greece
Irland
Italy
Japan
LatviaLithuania
Macedonia
Norway
Poland
Portugal
Romania
Slovak Republic
Slovenia
SpainSweden
Switzerland
United Kingdom
United States
0
5
10
15
20
25
30
35
40
0 20 40 60 80 100 120 140
Ta
x w
ed
ge
at
1 p
erc
en
t o
f a
ve
rag
e w
ag
e
Wage level (percent of average wage) where tax wedge starts to
increase significantly

10
A closer look reveals that in the NMS, the tax wedge tends to be high for a relatively large spectrum of
low-wage earners. The wage level from where onwards the tax wedge starts to increase significantly is
also relatively high. In many high-income OECD countries, to the contrary, the tax wedge is low for the
lowest-wage earners, but the tax wedge also tends to increases across the whole wage spectrum (see
Figure 6). Figure A1 and A2 in the Annex give a more detailed picture of the tax wedge, country by
country.
3.3 Social Benefits
Aside from the tax wedge, the withdrawal of social benefits is the main contributor to the opportunity
costs of taking up formal work for individuals with low skills/earnings potential. Consider an informal
worker who earns a certain level of informal wage.5 If this worker were to work in the formal sector,
various implicit opportunity costs occur: First, assuming that the value of the marginal labor product
does not change because of formalization, total labor costs of the informal worker have to be the same
as for the formalized worker. For the informal worker, total labor costs are the informal wage. For the
formalized worker, total labor costs are the net wage plus the income tax and both the worker’s and the
employer’s social security contributions—in other words, the net wage plus the entire tax wedge.
Comparing the informal wage with the worker’s potential formal net wage, the entire tax wedge enters
as an opportunity cost of formal work for the informal worker. Second, informal workers also face
implicit opportunity costs because they might lose parts of certain income-tested benefits—most
importantly social assistance, housing benefits, and family benefits—once they have a formal income on
record. For example, if an informal worker receives a certain amount of social assistance, this benefit
will be decreased or completely withdrawn if the worker formalizes and has an official income on
record. This amount of the withdrawn benefit also enters as an opportunity cost of formal work.
Therefore, both of these losses—the tax wedge and withdrawn benefits—have to be taken into account
when considering the implicit opportunity costs of formalization. At the same time, though, informal
workers also gain from formalization: they gain a future right to an old-age pension, and they gain rights
with regard to disability insurance, workers compensation, health insurance, and unemployment
insurance.
Arguably, the most important of these potential gains are old-age pension and health insurance. With
regard to old-age pensions, though, one has to keep in mind that especially low-wage earners tend to
strongly discount future benefits because their concerns are focused on short-term income, and in cases
of poverty, day-to-day consumption. Also, any means-tested social pensions for the elderly might
further discount the value of a vested old-age pension.
5 Only worker who are not registered at all are considered; partially formal workers who underreport their wages
are not considered.

11
3.4 The Formalization Tax Rate
As discussed above, the implicit costs of formalization for informal workers are a measurement of the
necessary minimum value of social security benefits they receive in return for formalization. The value
of rights to pension and unemployment insurance—but also from formal employment protection
legislation—they gain from formalization must exceed their implicit opportunity costs from
formalization. The red and orange, solid graphs in Figure 7 expresses this implicit cost to the informal
worker as a share of informal income (the so-called formalization tax rate, FTR). That is, it measures the
difference between informal income (informal wage, social assistance, and family and housing benefits
at the level of no formal wage) and formal net income (formal net wage, in-work benefits, social
assistance, and family and housing benefits at formal wage level) as a share of informal income.6 It is
therefore the share of informal income that an informal worker has to give up to formalize.
Figure 7: For low-wage earners, the opportunity costs of formal work (formalization tax rate, FTR) are higher in Bulgaria and
Latvia than in Australia and the United States.
Note: Graphs show the formalization tax rate (FTR) for single person with no children.
Source: Author’s calculation based on OECD Tax and Benefit model (2008).
Consider the contrasting examples of Bulgaria and Romania on the one hand and Australia and the
United States on the other. For lower wage levels, the FTR in Bulgaria and Romania is higher than in
Australia and the United States. In Bulgaria, the FTR for a single person with no children peaks at around
70 percent (around 60 percent for Romania) at a wage level of about 10 percent of average wage. This
means that in Bulgaria, a single person with no children who earns less than the minimum wage in the
informal sector has to give up between 50 to up to 70 percent of income to formalize. By contrast, in
6 For a more detailed definition and discussion, see Koettl (2009).
0%
10%
20%
30%
40%
50%
60%
70%
80%
1
10
19
28
37
46
55
64
73
82
91
10
0
10
9
11
8
12
7
13
6
14
5
15
4
16
3
17
2
18
1
19
0
19
9
Percent of average wage
Minmum wage (Bulgaria) FTR (Bulgaria)
Minimum wage (Romania) FTR (Romania)
0%
10%
20%
30%
40%
50%
60%
70%
80%
1 9
17
25
33
41
49
57
65
73
81
89
97
10
5
11
3
12
1
12
9
13
7
14
5
15
3
16
1
16
9
17
7
18
5
19
3
Percent of average wage
Minimum wage (Australia) FTR (Australia)
Minimum wage (US) FTR (US)

12
Australia and the United States, the FTR peaks at a lower value—around 40 percent in Australia and 30
percent in the United States— and at a higher wage level of around 30 to 40 percent (although in the
case of the United States, the FTR continuous to increase at higher wage levels, yet at a slow rate).
A more comprehensive comparison shows that in the NMS the opportunity costs of formal work tend to
peak at lower wage levels than in high-income OECD countries. Figure 8 reveals that both for singles and
one-earner couples with two children, the costs of formalization in the New Members States generally
tend to be highest for low wage earners (less than 30 percent of average wage for singles). In some
countries, like Bulgaria, Hungary, and Romania, the FTR for singles is particularly high and peaks at
around 70 percent. For families, the FTR tends to be lower and peak at somewhat higher wage levels.
Figure 8: In the NMS, the opportunity costs of formal work tend to be highest at lower wage levels.
Single person with no children One-earner couple with two children
Note: The scatter plot depicts the wage level where the formalization tax rate (FTR) peaks (x-axis) versus the peak value of the FTR (y-axis).
Countries with a continuiously and significantly increasing FTR were omitted. In countries where the FTR froms a plateau and increases only
slightly with the wage level, the lowest wage level at which the FTR stopps to increase significantly was chosen as the peak. The NMS are
pictured in red.
Source: Author’s calculation based on OECD Tax and Benefit model (2008).
The main reasons for the high opportunity costs of formal work are labor taxation and the sudden
withdrawal of social assistance and family benefits at higher wage levels. Labor taxation has already
been discussed above as one of the main obstacles to formal employment at the lower wage levels. Also
the design of income-tested benefits plays an important role. Social assistance is often paid out as a top-
up to earned gross income to guarantee a minimum gross income. Any earned household gross income
is subtracted from social assistance that is paid out. This means that any formal mini-job at low wage
Australia
Austria
Belgium
Bulgaria
Canada
Czech RepublicEstonia
Finland
Germany
Hungary
Irland
Japan
Latvia
Lithuania
Macedonia
Netherlands
Norway
Poland
Portugal
Romania
Serbia
Slovak
RepublicSlovenia
SpainSweden
Switzerland
United
Kingdom
30
40
50
60
70
80
90
0 10 20 30 40 50 60
Pe
ak v
alu
e o
f F
TR
Percent of average wage where FTR peaks
Australia
Austria
Bulgaria
Canada
Czech Republic
Estonia
Finland
France
Germany
Irland
Japan
Latvia
Lithuania
Macedonia
NetherlandsNorway
Poland
PortugalRomania
Serbia
Slovak
Republic
Slovenia
Spain SwedenSwitzerland
United
Kingdom
United States
30
35
40
45
50
55
60
65
0 50 100 150 200
Pe
ak v
alu
e o
f F
TR
Wage level (percent of average wage) where FTR peaks

13
levels does not pay. Likewise, for higher-paid midi-jobs, the net gain in income might not be very high
because of the sudden loss of social assistance. A more phased-in withdrawal of social assistance
through (formal) income disregards for all household members could decrease this disincentive. Income-
tested family and housing benefits also contribute to the formalization tax rate if the formal income
would exceed the threshold for eligibility.
3.5 The Marginal Effective Tax Rate
The marginal effective tax rate (METR) also suggests that formal work does not pay at lower wage levels.
The METR measures at a given wage levels how much of an additional dollar earned in formal gross
wage is taxed away, either as labor tax or in the form of withdrawn benefits. It is therefore an indication
of how much it pays for workers to earn more gross income, either by increasing work hours or receiving
higher wages.
In many countries, at low wage levels (below 10 percent of average wage), every dollar earned is
subtracted from entitlements to social assistance; hence 100 percent of any additional dollar earned is
taxed away. For example, in the Czech Republic and Slovenia, every additional dollar earned in formal
income is 100 percent taxed away through withdrawal of social assistance at wage levels below 20
percent of average wage (see Figure 9). In other countries, like Portugal and the United States, this is not
the case. Incentives for formal work are better for low-wage earners in these countries: in Portugal, only
50 percent of every additional earned dollar is taxed away, and in the United States it is significantly less.
In the United States, this is mainly achieved though so-called in-work benefits and tax credits that
subsidies work at low wage levels.
Figure 9: For low-wage earners, the marginal effective tax rate (METR) is at 100 percent in the Czech Republic and Slovenia,
while it is much lower in Portugal and the United States.
Note: Graphs show the marginal effective tax rate for single with no children.
Source: Author’s calculation based on OECD Tax and Benefit model (2008).
0%
20%
40%
60%
80%
100%
120%
1 9
17
25
33
41
49
57
65
73
81
89
97
10
5
11
3
12
1
12
9
13
7
14
5
15
3
16
1
16
9
17
7
18
5
19
3
Percent of average wage
Minmum wage (Czech Republic) METR (Czech Republic)
Minmum wage (Slovenia) METR (Slovenia)
0%
20%
40%
60%
80%
100%
120%
1 9
17
25
33
41
49
57
65
73
81
89
97
10
5
11
3
12
1
12
9
13
7
14
5
15
3
16
1
16
9
17
7
18
5
19
3
Percent of average wage
Minmum wage (Portugal) METR (Portugal)
Minimum wage (United States) METR (United States)
14
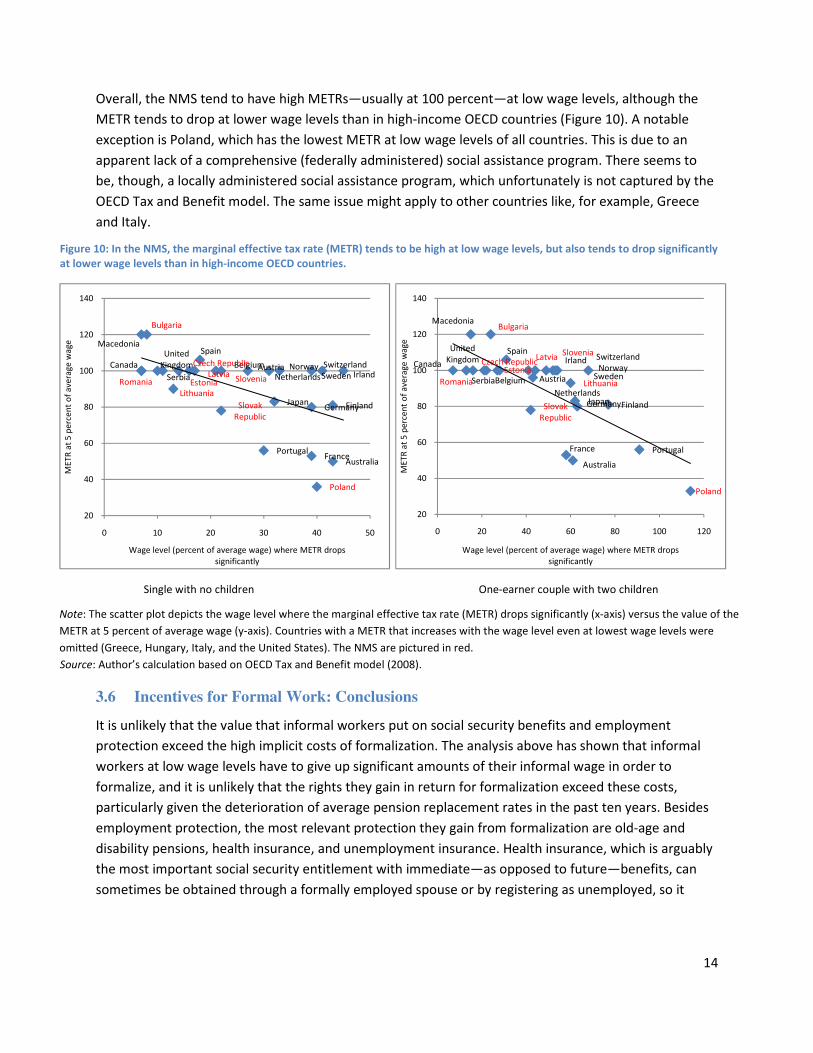
Overall, the NMS tend to have high METRs—usually at 100 percent—at low wage levels, although the
METR tends to drop at lower wage levels than in high-income OECD countries (Figure 10). A notable
exception is Poland, which has the lowest METR at low wage levels of all countries. This is due to an
apparent lack of a comprehensive (federally administered) social assistance program. There seems to
be, though, a locally administered social assistance program, which unfortunately is not captured by the
OECD Tax and Benefit model. The same issue might apply to other countries like, for example, Greece
and Italy.
Figure 10: In the NMS, the marginal effective tax rate (METR) tends to be high at low wage levels, but also tends to drop significantly
at lower wage levels than in high-income OECD countries.
Single with no children One-earner couple with two children
Note: The scatter plot depicts the wage level where the marginal effective tax rate (METR) drops significantly (x-axis) versus the value of the
METR at 5 percent of average wage (y-axis). Countries with a METR that increases with the wage level even at lowest wage levels were
omitted (Greece, Hungary, Italy, and the United States). The NMS are pictured in red.
Source: Author’s calculation based on OECD Tax and Benefit model (2008).
3.6 Incentives for Formal Work: Conclusions
It is unlikely that the value that informal workers put on social security benefits and employment
protection exceed the high implicit costs of formalization. The analysis above has shown that informal
workers at low wage levels have to give up significant amounts of their informal wage in order to
formalize, and it is unlikely that the rights they gain in return for formalization exceed these costs,
particularly given the deterioration of average pension replacement rates in the past ten years. Besides
employment protection, the most relevant protection they gain from formalization are old-age and
disability pensions, health insurance, and unemployment insurance. Health insurance, which is arguably
the most important social security entitlement with immediate—as opposed to future—benefits, can
sometimes be obtained through a formally employed spouse or by registering as unemployed, so it
Australia
AustriaBelgium
Bulgaria
Canada Czech Republic
Estonia
Finland
France
Germany
Irland
Japan
Latvia
Lithuania
Macedonia
Netherlands
Norway
Poland
Portugal
RomaniaSerbia
Slovak
Republic
Slovenia
Spain
Sweden
Switzerland
United
Kingdom
20
40
60
80
100
120
140
0 10 20 30 40 50
ME
TR
at
5 p
erc
en
t o
f a
ve
rag
e w
ag
e
Wage level (percent of average wage) where METR drops
significantly
Australia
AustriaBelgium
Bulgaria
Canada Czech RepublicEstonia
Finland
France
Germany
Irland
Japan
Latvia
Lithuania
Macedonia
Netherlands
Norway
Poland
Portugal
RomaniaSerbia
Slovak
Republic
SloveniaSpain
Sweden
SwitzerlandUnited
Kingdom
20
40
60
80
100
120
140
0 20 40 60 80 100 120
ME
TR
at
5 p
erc
en
t o
f a
ve
rag
e w
ag
e
Wage level (percent of average wage) where METR drops
significantly

15
might not enter not into the value of formal benefits. The value of vested old-age pensions could be
further discounted by non-contributory social assistance. The design of income-tested benefits like
social assistance and family benefits also discourage formal jobs as formal income could easily lead to
withdrawal of benefits.
In conclusion, formal mini-jobs and midi-jobs—that is, low-paying part-time jobs which earn less than
minimum wage—do not seem economically viable in many NMS. This could lead many low-educated
workers to either not work at all and be inactive, or work informally. Data analysis suggests that a
substantial part of the informal labor force has indeed low educational attainment and might work
exactly in these kinds of mini-jobs and midi-jobs.
4 Taxes and Benefits: a Sufficient Condition?
The previous section finds that there are considerable disincentives originating from tax and benefit
systems for formal work for low-wage earners. As already discussed, it seems that improving these
incentives and making work pay is a necessary condition to decrease informal employment. The
question, though, is it also a sufficient condition? To what extent do incentives play a role in the decision
to be informal? The paper cannot answer this question with certainty, but it can offer some additional
insights from data and econometric analysis.
First, by looking at informality rates across income, it seems clear that indeed informality rates are
considerably higher for low-income earners (see Figure 11). Yet, in order to determine more precise
correlations between the incentives provided by the tax and benefit system and informality, a more
detailed analysis is necessary. Therefore, the following subsection will present an econometric analysis
on household level that investigates how incentives correlate with informality, controlling for individual
characteristics like age, gender, education, geography, employment status of the spouse, citizenship,
income, and sector.
4.1 Data
For the analysis, the European Survey for Income and Living Conditions (EU-SILC) 2008 is used. The
survey covers a wide range of European countries and includes detailed questions on employment and
income, including on taxes and social security contributions. This allows to apply a comprehensive
definition of informal workers and self-employed for a number of countries. In particular, the survey
includes a question on the amount of social security contributions paid by the employer on behalf of the
interviewee. This question allows identifying those who are dependent employees, but for whom no
social security contributions are being paid as informal workers. In addition, unpaid family workers are
identified as informal. Finally, non-professional self-employed and employers who employ five or fewer
workers are also identified as informal.7
7 The definition of informality for the self-employed and employers follows Hazans 2011.

Figure 11: Low-income earners display higher informality rates
Note: Figure displays unweighted average, minimum, and maximum
Latvia, Poland, Slovakia, and Slovenia across income groups. Informality rate is defined as the number of informal wage earne
(not paying social security contributions) an
self-employed, calculated for 20 income groups
Source: Author’s calculation based on EU-SILC (2008)
Applying this definition of informality, Figure A1 in the annex displays the informality rates by income
level for two types of families (single persons and one
European countries. A more detailed profiling
same definition of informality can be found in Montenegro (2011).
The econometric analysis is presented for seven countries: Bulgaria, the Czech Republic, Estonia, Latvia,
Poland, Slovakia, and Spain. This yields a total sample size of 62,
identified as either formal or informal. The dichotomous formal/informal variable is the dependent
variable for the analysis presented below.
The independent variables for the regressi
employment status of the spouse, citizenship, income, and sector. The age variable is grouped into five
categories: age 15 to 24, 25 to 39, 40 to 54, 55 to 64, and 65 or older. Similarly, the educatio
grouped into three categories: high (post
education), or low (primary or pre-primary education). For geography, the three categories are densely,
intermediate, or sparsely populated area. Th
0%
10%
20%
30%
40%
50%
60%
70%
80%0 6
12
18
24
30
36
42
48
54
Info
rma
lity
ra
te (
pe
rce
nt)
income earners display higher informality rates
, minimum, and maximum of informality rates for Bulgaria, Czech Republic, Estonia,
Latvia, Poland, Slovakia, and Slovenia across income groups. Informality rate is defined as the number of informal wage earne
and self-employed (with low education or with small firms) over all
income groups from 0 to 200 percent of average wage.
SILC (2008)
Applying this definition of informality, Figure A1 in the annex displays the informality rates by income
level for two types of families (single persons and one-earner couples with two children) for
A more detailed profiling of the informally employed based on the same data and
same definition of informality can be found in Montenegro (2011).
The econometric analysis is presented for seven countries: Bulgaria, the Czech Republic, Estonia, Latvia,
This yields a total sample size of 62,231 employed individuals that are
identified as either formal or informal. The dichotomous formal/informal variable is the dependent
variable for the analysis presented below.
The independent variables for the regression are age, gender, education, geography (rural/urban),
employment status of the spouse, citizenship, income, and sector. The age variable is grouped into five
categories: age 15 to 24, 25 to 39, 40 to 54, 55 to 64, and 65 or older. Similarly, the educatio
grouped into three categories: high (post-secondary or tertiary education), medium (secondary
primary education). For geography, the three categories are densely,
intermediate, or sparsely populated area. The employment status of the spouse has four
60
66
72
78
84
90
96
10
2
10
8
11
4
12
0
12
6
13
2
13
8
14
4
15
0
15
6
16
2
16
8
17
4
Percent of average wage
Average Minimum Maximum
16
Bulgaria, Czech Republic, Estonia,
Latvia, Poland, Slovakia, and Slovenia across income groups. Informality rate is defined as the number of informal wage earners
over all wage earners and
Applying this definition of informality, Figure A1 in the annex displays the informality rates by income
earner couples with two children) for a number of
of the informally employed based on the same data and
The econometric analysis is presented for seven countries: Bulgaria, the Czech Republic, Estonia, Latvia,
231 employed individuals that are
identified as either formal or informal. The dichotomous formal/informal variable is the dependent
on are age, gender, education, geography (rural/urban),
employment status of the spouse, citizenship, income, and sector. The age variable is grouped into five
categories: age 15 to 24, 25 to 39, 40 to 54, 55 to 64, and 65 or older. Similarly, the education variable is
secondary or tertiary education), medium (secondary
primary education). For geography, the three categories are densely,
four categories,
18
0
18
6
19
2
19
8

17
namely formally employed, informally employed, inactive, or no spouse. Citizenship can either be the
same as the country of residence (local), or of another EU country, or a non-EU country. The sector
variable follows the NACE standard.8
Income groups are categorized based on income as a percentage of average wage of the country of
residence. That is, income (employee and self-employment cash or near cash income) is calculated as a
share of the official average wage. The average wage data is taken from OECD (2011). Note that for
unpaid family workers, income is 0, while for some self-employed, it can also be negative (in the case of
a loss from self-employment activities). Income groups are then defined as those earning (i) 0 or less; (ii)
more than 0 but less than 25 percent of average wage; (iii) 25 percent or more, but less than 50 percent
of average wage; (iv) 50 percent or more, but less than 100 percent of average wage; (v) 100 percent or
more, but less than 200 percent of average wage; and (vi) 200 percent of average wage or more.
The main innovation of this paper comes from the attempt to measure incentives and disincentives for
formal work that are being provided by the tax and benefit system on an individual level. That is, the
paper identifies the FTR and METR that have been discussed in the previous section for each individual
in the sample. This yields a synthetic measurement—purely based on de jure tax obligations and
entitlements—of incentives and disincentives for formal work on an individual level.
To this end, the paper uses the OECD Tax and Benefit model (OECD 2011) for the year 2008 for the
seven countries in the sample. The OECD Tax and Benefit model already provides the METR, and the FTR
is calculated using the same model and according to the methodology developed by Koettl (2009). Both
FTR and METR depend on three variables: (i) individual income, expressed as percent of average wage;
(ii) household type; and (ii) the income of the spouse, if applicable. First, individual income as percent of
average wage is calculated as outlined above, expressing the individual’s cash or near cash income from
dependent work and self-employment as a percent of average wage. The model is limited to the extent
that the OECD Tax and Benefit model only provides calculations up to a certain level of income—for
individuals, up to 200 percent of average wage, for certain types of families up to 367 percent of
average wage. Since FTR and METR vary mainly at lower wage levels and are fairly constant from a
certain income level onwards, the paper assumes that individuals with income above the limitations set
by the OECD Tax and Benefit model face the same incentives as those individuals at the boundary.9
Second, the OECD Tax and Benefit model is provided for 10 household types, from singles with or
without children to one- and two-earner couples with or without children. For the latter type, the model
is provided for three different income levels for the spouse.10
These 10 OECD household types are
8 NACE stands for “Nomenclature Generale des Activites Economiques dans I`Union Europeenne” and codes
economic activity into various sectors and subsectors. 9 This is obviously a simplifying assumption. Yet, the only variation that could occur at income levels beyond the
boundary are higher income tax brackets or ceilings on social security contributions, which could shift both the FTR
and METR to some limited extent. 10
More precisely, the OECD Tax and Benefit model is provided for: (i) single; (ii) single with two children; (iii) one-
earner couple with no children; (iv) one-earner couple with two children; (v) two earner couple with no children,

18
matched to the household types provided in the EU-SILC data set. Certain assumptions have to be made
in doing so. For example, the number of children is not taken into account: all individuals with children
are assumed to face the same incentives as those with two children. In households with children, a
couple, and additional adults, the children are matched to the couple while the additional adults are
assumed to be singles. Finally, in households with children, but no couples, children are matched to
those singles in a certain age group (35 to 45).
Third, for individuals with a spouse working in the formal sector, the spouse’s income also has to be
taken into account. The OECD Tax and Benefit model does so for three income levels of the spouse: 67,
100, and 167 percent of average wage. Spouse’s income is then matched to 67 percent of average wage
for all those earning more than 0 but less than 83.5 percent of average wage; to 100 percent of average
wage for all those earning more than 83.5 but less than 133.5 percent of average wage; and to 167
percent of average wage for all those earning mare than 133.5 percent of average wage. That is, the
paper assumes that all individual with at a certain income level face the same FTR and METR if their
spouse works in the formal sector and earns between 1 and 83.5 percent of average wage; and the
same incentives if their spouse works in the formal sector and earns between 83.5 and 133.5 percent of
average wage; and the same incentives if their spouse works in the formal sector and earns more than
133.5 percent of average wage.
Hence, for the econometric analysis the paper uses a sample of roughly 60,000 employed individuals
from seven European countries. The dependent variable is a dichotomous variable that yields 1 for
informally employed, and 0 for formally employed. The independent variables are a series of individual
characteristics like age, gender, education, geography, citizenship, income, sector, and a synthetic
measurement of the incentives or disincentives for formal work that the individual faces and that are
originating from the country’s tax and benefit system.
4.2 Econometric Analysis
To quantify the effects of the explanatory variables on the dichotomous outcome variable, a generalized
linear model with a probit link function was applied. For a binary outcome the probit equation is
( ) ( )iii
XFYP εβ +⋅== '1
with outcome variable Yi and explanatory variables Xi for respondend i. F(.) stands for the cumulative
distribution function of the standard normal (probit model) distribution.
Instead of standard coefficients, marginal effects were calculated. These marginal effects provide the
change in the probability of the outcome variable as a result of an infinitesimal change (like, for
spouse earning 67 percent of average wage; (vi) two earner couple with no children, spouse earning 100 percent of
average wage; (vii) two earner couple with no children, spouse earning 167 percent of average wage; (viii) two
earner couple with two children, spouse earning 67 percent of average wage; (ix) two earner couple with two
children, spouse earning 100 percent of average wage; and (x) two earner couple with two children, spouse
earning 167 percent of average wage;

19
example, a percentage point increase) of the independent metric or a discrete change of categorical
variables. Marginal effects (also “margins of derivatives of responses”) therefore describe changes in the
outcome (response) for a change in one covariate that can be reported as a derivative, elasticity, or
semi-elasticity. In calculating this marginal effect for one covariate, all other covariates are kept at
specified values, usually the mean.
A correlation analysis helped to detect pairwise collinearity. Moreover, multi-collinearity of the
explanatory variables was determined by variance inflation factors (VIFs; Fox and Monette, 1992). VIFs
measure the effect of multi-collinearity on the variance of the regression coefficient of an explanatory
variable. A higher but still acceptable degree of multi-collinearity is present in the dataset for a few
variables only. These are in particular the variables income and age group. The influence of these
variables and their collinearity on the overall probit model and the marginal effects is, however,
negligible. The variables were therefore not removed since they have a high explanatory value. The
pairwise collinearity for the other variables was not as severe.
The results of the regression are presented in Table 1 for the specification with country effects, and for
each country in Table A 1 to Table A 7 in the annex. Controlling for individual characteristics, job
characteristics (income and sector), and country effects, there is a significant correlation between FTR
and METR and the probability of being informal: in particular, a 1 percentage point increase in the FTR
(METR) increases the probability of being informal by 1.2 percent (0.3 percent). It’s important, though,
to point out that this effect varies considerably across countries (see annex). The correlation is not
always significant, and the sign is not always positive. For Poland and Slovakia, the correlations of both
FTR and METR with informality are significant and feature the expected positive relationship. For Latvia,
the same is true, but the correlation for the FTR is not significant. For Bulgaria, the Czech Republic, and
Spain, though, the correlation with FTR is negative and significant. For METR, on the overhand, the
correlation is significant and positive for all countries except Spain (negative). This suggests important
interactions between country effects—like the role and quality of institutions—and the impact of the
FTR and METR.
As for the individual characteristics, the correlation with sex stands clearly out as significant and
negative in all specifications. That is, women are clearly less likely to work informally. In terms of age,
the specification with country effects suggest a non-linear relationship: the 15 to 24 age group is most
likely to be informal, and the 40 to 54 the least likely. This relationship, though, is not significant in all
countries. Similarly, the low and medium educated are more likely to be informal when compared to the
highly educated, which is by and large also confirmed by the country regressions.11
The results regarding the employment status of the spouse are somewhat surprising: there is a clear
positive correlation between working informally and having an informally working spouse. This is not
only true in the specifications with country effects, but also in most country-specific regressions. This
11 In the Czech Republic and Slovakia, there are no low-educated individuals as defined above, and therefore the
low education level is dropped in the regression.
20
suggests that households do not make strategic decisions along the line of one partner working formally
(and receiving employment and social protection, including for dependents) while the other one works
informally. Regarding inactive spouses or being single, the results are more ambiguous. In Bulgaria, the
Czech Republic, and Spain, the correlation also seems to be positive and significant; in the other
countries, though, it seems either negative or insignificant.
Other individual characteristics like geography (rural or urban) and citizenship did not yield any
significant correlations.
Regarding job characteristics, agriculture consistently yields a significant and highly positive relationship
with being informal. Other sectors with similar results are construction, and trade and repair.

21
Table 1: D-Probit regression results with informality dummy as the dependent variable with country effects
Note: Regressions based on individual data from EU-SILC 2008 with matched data for individual FTR and METR from OECD Tax and Benefit model. Coefficients are
interpreted as follows: In the specification with FTR, an increase of 1 percentage point of the FTR increases the probability of being informal by 1.2 percent; living in the
Czech Republic decreases probability of being informal by 12 percent when compared to living in Bulgaria; being female decreases probability by 9 percent; having low
education increases probability by 11.6 percent when compared to someone with high education; and so on.
Probit regression, reporting marginal effects Number of obs = 27967
Wald chi2(37) = 3999
Prob > chi2 = 0.0000
Log pseudolikelihood = -13277.185 Pseudo R2 = 0.2504
dF/dxRobust Std.
Err. z P>|z| x-bar
MARGINAL EFFECTIVE TAX RATE 0.003 0.000 13.760 0.000 36.581 0.003 0.004
COUNTRY
Bulgaria*
Czech Republic -0.061 0.018 -3.150 0.002 0.098 -0.097 -0.025
Estonia -0.130 0.017 -6.370 0.000 0.015 -0.164 -0.096
Spain 0.100 0.021 4.860 0.000 0.375 0.059 0.141
Latvia -0.072 0.021 -3.170 0.002 0.023 -0.114 -0.031
Poland 0.215 0.019 11.320 0.000 0.377 0.177 0.253
Slovak Republic -0.086 0.018 -4.420 0.000 0.055 -0.121 -0.051
AGE GROUP
15-24*
25-39 -0.363 0.015 -15.580 0.000 0.202 -0.392 -0.333
40-54 -0.429 0.019 -17.770 0.000 0.340 -0.466 -0.391
55-64 -0.371 0.015 -17.790 0.000 0.240 -0.400 -0.342
65+ -0.228 0.036 -3.690 0.000 0.007 -0.298 -0.158
SEX
Male*
Female -0.095 0.010 -9.110 0.000 0.531 -0.115 -0.074
EDUCATION LEVEL
High*
Medium 0.106 0.013 7.840 0.000 0.689 0.081 0.131
Low 0.113 0.021 5.660 0.000 0.118 0.073 0.154
EMPLOYMENT STATUS OF SPOUSE
Formal*
Informal 0.234 0.017 14.100 0.000 0.146 0.200 0.268
Inactive 0.068 0.015 4.550 0.000 0.168 0.038 0.098
No spouse 0.009 0.012 0.750 0.453 0.377 -0.015 0.033
DEGREE OF URBANIZATION
Densly populated*
Intermediate 0.046 0.014 3.290 0.001 0.190 0.018 0.074
Thinnly populated 0.037 0.011 3.360 0.001 0.425 0.015 0.059
CITIZENSHIP
Local*
Other EU country -0.040 0.043 -0.890 0.372 0.015 -0.124 0.044
Others -0.050 0.025 -1.920 0.055 0.041 -0.099 -0.001
INCOME GROUP
0 % of AW or less*
1 to 24 % of AW -0.232 0.018 -10.080 0.000 0.164 -0.268 -0.196
25 to 49 % of AW 0.066 0.018 3.760 0.000 0.430 0.031 0.100
50 to 99 % of AW (dropped)
100 to 200 % of AW 0.246 0.131 1.940 0.053 0.003 -0.011 0.503
200 % of AW or more 0.135 0.151 0.940 0.347 0.001 -0.161 0.432
SECTOR
Health services*
Mining, manufacturing, utilities 0.034 0.026 1.330 0.183 0.209 -0.017 0.086
Construction 0.180 0.031 5.990 0.000 0.090 0.119 0.242
Trade and repair 0.163 0.028 6.020 0.000 0.179 0.108 0.218
Transport and storage 0.158 0.036 4.640 0.000 0.046 0.088 0.228
Accomodation and food services 0.097 0.033 3.060 0.002 0.056 0.032 0.162
ICT 0.101 0.057 1.840 0.066 0.017 -0.012 0.213
Financial services 0.141 0.050 3.000 0.003 0.017 0.044 0.238
Professional services 0.047 0.031 1.550 0.122 0.069 -0.014 0.109
Public sector 0.352 0.036 9.430 0.000 0.041 0.281 0.423
Education 0.157 0.037 4.400 0.000 0.053 0.084 0.231
Agriculture 0.423 0.028 14.190 0.000 0.103 0.368 0.477
Others 0.478 0.027 14.920 0.000 0.066 0.424 0.531
*Baseline category
[ 95% C.I. ]

22
5 Policies to Make Formal Work Pay
The two main policy tools to make formal work pay are to decrease labor taxation at the lower wage
levels and to reform benefit design for social assistance, housing, and family benefits. With regard to
lowering the tax wedge, Hungary seems to apply a minimum social security contribution at the very low
wage levels (less than 20 percent of average wage). Among the EU-15 countries, only the Netherlands
seems to have a similar floor, and also Serbia applies such a floor. Such a contribution floor increases the
tax burden considerably for those in low-paying part-time jobs. In almost all EU and OECD countries—
and also in other countries in the region, like Bosnia and Herzegovina and Macedonia—no such floor
exists, at least not above the minimum wage. For part-time work at the minimum wage, the floor is
usually adjusted by the actual hours worked, so that the tax wedge is not acting regressively at the lower
wage end.
Other options would be to introduce policies linked to wage subsidies, social security contribution
credits, or so-called in-work or employment-conditional benefits (cash benefits or refundable income
tax credits conditional on formal) for low-wage earners. On the former policies—wage and social
security subsidies—Germany has introduced a phased social security contribution schedule as part of
the Hartz IV reforms in the early 2000s. Monthly wages of less than EUR 400 are not subject to social
security contributions. For monthly incomes between EUR 401 and 800, the contribution rates rise
gradually to the full share. The drawback of such reforms is that they can have a certain amount of
stigmatization for workers who benefit. Also, they are fiscally expensive.
Another option is to channel credits or subsidies to workers via the personal income tax as tax credits. In
the United States, for example, there are various refundable (“non-wastable”) tax credits (“earned
income credit” and “making work pay” credit) available to low-wage earners and their families. For
example, for a taxpayer with one child, 34 percent of earned income of up to USD 9,000 is refundable,
which amounts to the equivalent of a “cash” benefit of about USD 3,000. This refundable credit is
phased out for an income of above USD 16,000. Similar benefits are available for other family types and
single persons at the low wage end.
With regard to reforming the design of social assistance, housing, and family benefits, the key is to keep
the marginal effective tax rate in mind when designing benefit withdrawal. In other words, beneficiaries
of social assistance, housing, and family benefits should gain from additional formal work—that is, any
additional formal wage should also increase their net income, including benefits. If this is not the case,
additional formal work does not pay, and beneficiaries will prefer to not work at all, or only informally,
or underreport earnings. Arguably, the role of social assistance in providing disincentives for formal
work for a large number of people might be limited in most NMS. Programs are usually tightly targeted
to a small group of beneficiaries, so coverage—even among the poorest—is small. In addition, benefits
are not overly generous. Categorical benefits like family benefits, though, seem to play a much more
important role in the NMS and Croatia.
23
In order to reform benefits along these lines, withdrawal of benefit has to phase in as income increases,
so no sudden drops in net income occur. Eligibility criteria that restrict, for example, family benefits to
those below a certain income threshold—often times around 50 percent of average wage—result in
very high METRs and a considerable drop in net income once the income threshold is crossed. The
German Hartz IV reforms offer again a good example on how this can be avoided and how phased
benefit withdrawal can be achieved (see also discussion above on social security subsidies).
Entitlements to free health insurance—if they exist—should be limited to the poor, and the entitlement
be based on a means test, not an income test. It is important that the poor have access to free health
insurance as sickness is a serious economic risk that can further deepen poverty. Yet, if free health
insurance is easily accessible also by those who can afford to contribute to health insurance, it decreases
the value of formal work and increases incentives to work informally. It is therefore important to base
the decision on who should have access to free health insurance on the means that a household has at
its disposal, and not formal income or formal employment status (like registered unemployment, as is
the case in some Balkan countries). This requires robust means-testing mechanisms as opposed to
income testing. This can either be done by proxy-means testing—like, for example, looking at electricity
consumption—or by frequent contacts between a social worker and the applicant.
Finally, it should be pointed out that most of the reforms discussed above have fiscal costs. Given the
current fiscal constraints, there might be little fiscal space available to push through these reforms. In
particular, reforms that aim at making work pay at the low wage end—like wake subsidies, tax credits,
and so on—can considerably reduce tax revenues, including social security contributions, or increase
public expenditures. In this regard, though, the NMS are in the favorable position: as shown above, their
tax systems are relatively non-progressive. Making the relatively non-progressive tax system more
progressive could make any future reforms along these lines fiscally neutral to a large extent.
In the long run, many other positive effects of increased formalization (fiscal, social contract, social
cohesion, participation in society, and so on). Crucial role of tax morale; requires good institution, good
governance, and accountability.
6 References
Fox, J. and Monette, G. (1992). “Generalized collinearity diagnostics.” Journal of the American Statistical
Association, Vol. 87, No. 417. pp. 178-183
Hazans, M. (2011). “Informal Workers across Europe: Evidence from 30 European Countries”. Prepared
for World Bank. Mimeo.
Koettl, J. (2009). “The Role of Income Taxes and Social Protection in Providing Incentives for Informality.
A First Glance at the Czech Republic, Hungary, Poland, and Slovakia. Prepared for World Bank.
Mimeo.

24
Montenegro, C. (2011).
Organisation for Economic Development and Co-operation (OECD, 2011). Tax/benefit policies: Detailed
descriptions and reforms since 2001. Online database. Available at
http://www.oecd.org/document/29/0,3746,en_2649_34637_39618653_1_1_1_1,00.html. Last
accessed June 6, 2011.

25
7 Annex

26
Figure A 1: Tax wedge, minimum wage, marginal effective tax rate (METR), formalization tax rate (FTR), and informality rate in select European countries (by family type)
Bulgaria: Single with no children
Czech Republic: Single with no children
Bulgaria: One-earner couple with two children
Czech Republic: One-earner couple with two children

27
Estonia: Single with no children
Greece: Single with no children
Estonia: One-earner couple with two children
Greece: One-earner couple with two children

28
Latvia: Single with no children
Netherlands: Single with no children
Latvia: One-earner couple with two children
Netherlands: One-earner couple with two children

29
Poland: Single with no children
Portugal: Single with no children
Poland: One-earner couple with two children
Portugal: One-earner couple with two children

30
Slovakia: Single with no children
Slovenia: Single with no children
Slovakia: One-earner couple with two children
Slovenia: One-earner couple with two children

31
Spain: Single with no children
Spain: One-earner couple with two children

32
Figure A 2: Tax wedge, minimum wage, marginal effective tax rate (METR), and formalization tax rate (FTR) in other select countries (by family type)
Australia: Single with no children
Austria: Single with no children
Australia: One-earner couple with two children
Austria: One-earner couple with two children

33
Belgium: Single with no children
Canada: Single with no children
Belgium: One-earner couple with two children
Canada: One-earner couple with two children

34
Finland: Single with no children
France: Single with no children
Finland: One-earner couple with two children
France: One-earner couple with two children

35
Germany: Single with no children
Hungary: Single with no children
Germany: One-earner couple with two children
Hungary: One-earner couple with two children

36
Ireland: Single with no children
Italy: Single with no children
Ireland: One-earner couple with two children
Italy: One-earner couple with two children

37
Japan: Single with no children
Lithuania: Single with no children
Japan: One-earner couple with two children
Lithuania: One-earner couple with two children

FYR Macedonia: Single with no children
Norway: Single with no children
no children
FYR Macedonia: One-earner couple with two children
Norway: One-earner couple with two children
38
earner couple with two children
earner couple with two children

Romania: Single with no children
Serbia: Single with no children
Romania: One-earner couple with two children
Serbia: One-earner couple with two children
39
earner couple with two children
earner couple with two children

40
Sweden: Single with no children
Switzerland: Single with no children
Sweden: One-earner couple with two children
Switzerland: One-earner couple with two children

41
United Kingdom: Single with no children
United States: Single with no children
United Kingdom: One-earner couple with two children
United States: One-earner couple with two children

42
Table A 1: D-Probit regression results with informality dummy as the dependent variable for Bulgaria

43
Table A 2: D-Probit regression results with informality dummy as the dependent variable for Czech Republic

44
Table A 3: D-Probit regression results with informality dummy as the dependent variable for Estonia

45
Table A 4: D-Probit regression results with informality dummy as the dependent variable for Latvia

46
Table A 5: D-Probit regression results with informality dummy as the dependent variable for Poland

47
Table A 6: D-Probit regression results with informality dummy as the dependent variable for Slovakia

48
Table A 7: D-Probit regression results with informality dummy as the dependent variable for Spain

49