does individual performance affect entrepreneurial
TRANSCRIPT
DOES INDIVIDUAL PERFORMANCE AFFECT ENTREPRENEURIAL MOBILITY?
EMPIRICAL EVIDENCE FROM THE FINANCIAL ANALYSIS MARKET
BORIS GROYSBERG Harvard Business School
Soldiers Field Road Boston, MA 02163
ASHISH NANDA Harvard Law School
23 Everett Street #G-24 Cambridge, MA 02138
M. JULIA PRATS IESE Business School
Avda. Pearson, 21 08034 Barcelona
SPAIN [email protected]
November 2007
We would like to thank George Baker, Adam Brandenburger, Robert Gibbons, Jerry Green, Paul Healy, Josh Lerner, Jackson
Nickerson, Nitin Nohria, Thomas Hellmann, Scott Stern, and Ezra Zuckerman as well as participants of the conferences/seminars
at 2007 NBER JEMS Entrepreneurship conference, 2007 Utah-BYU Winter Strategy Conference, Columbia Business School,
Harvard Business School, MIT, Stanford Business School, and University of Pennsylvania. Our gratitude to professionals at
Goldman Sachs, Institutional Investor magazine, Lehman Brothers, Merrill Lynch, and Sanford C. Bernstein for interviews and
comments on previous drafts. We also wish to thank Kathleen Ryan and James Schorr for research assistance. We gratefully
acknowledge the Division of Research at the Harvard Business School for providing financial support for this study.

2
DOES INDIVIDUAL PERFORMANCE AFFECT ENTREPRENEURIAL MOBILITY?
EMPIRICAL EVIDENCE FROM THE FINANCIAL ANALYSIS MARKET
Our paper contributes to the studies on the relationship between workers’ human capital and their
decision to become self-employed as well as their probability to survive as entrepreneurs.
Analysis from a panel data set of research analysts in investment banks over 1988-1996 reveals
that star analysts are more likely than non-star analysts to become entrepreneurs. Furthermore,
we find that ventures started by star analysts have a higher probability of survival than ventures
established by non-star analysts. Extending traditional theories of entrepreneurship and labor
mobility, our results also suggest that drivers of turnover vary by destination: (a) turnover to
entrepreneurship and (b) other turnover. In contrast to turnover to entrepreneurship, star analysts
are less likely to move to other firms than non-star analysts.
Key words Entrepreneurship, ability, professionals
3
1. Introduction
Are high performers more likely to become entrepreneurs than low performers? News
accounts are filled with anecdotes of talented professionals making it on their own. These
accounts emphasize ability as the key trigger for high performers becoming entrepreneurs and
the subsequent success of their ventures (Dorfman 1974; Milligan 1985; Kostigen 1990; Phillips
1997). Although casual observations abound, studies that shed light on the following issues are
lacking: (1) Are high performers more likely to become entrepreneurs than low performers? (2)
Are high performers more likely to survive as entrepreneurs than low performers? (3) Are there
differences between determinants of turnover to entrepreneurship and determinants of other
turnover? The focus of our investigation is the empirical phenomenon that, among professionals,
talent may be an important driver for starting one’s own firm.1
To address these questions, we studied turnover data for security analysts for the nine-
year period from 1988 through 1996. We matched samples of entrepreneurs and non-
entrepreneurs in the same decision-making setting, and thus avoided sample selection bias.
Further, having non-entrepreneurs in our data set allowed us to compare the determinants of
entrepreneurial turnover to factors that affect other turnover. The availability of detailed
individual and firm level data on equity analysts makes this labor market a particularly attractive
setting for our analysis. Institutional Investor magazine’s annual All-America analyst rankings
divide analysts into stars and non-stars enabling a clear distinction between high and low
performers.2 Analysts’ rankings are externally observable, which ensures that their performance
is visible to the market and makes it possible to compile rich data at five levels of analysis:
individual, department, firm, sectoral, and macro-economic. Collecting data at these various
levels enabled us to control for a large range of potential drivers of turnover. 3
4
Our multilevel longitudinal data set on equity analysts enables us to address two
criticisms commonly leveled against existing empirical research in entrepreneurship–that the
analysis is (a) cross-sectional and (b) single-level. Cross-sectional analysis is susceptible to self-
selection bias because it under represents individuals that attempt but fail in entrepreneurial
pursuits. Longitudinal observations identify more completely the expanse of entrepreneurial
initiatives (Evans and Leighton 1989). Data limitations have precluded prior studies from
controlling for both individual and situational variables as drivers of the entrepreneurial decision.
In particular, the advantage of this paper is that it uses variables that are more directly related to
the overall abilities of the potential entrepreneurs.
Whereas we used a number of econometric techniques (discussed later in the paper) to
check the robustness of the results, the limitation of our study is that a small percentage of
analysts in our sample became entrepreneurs (45 episodes). However, this paper and analysts’
data set allow us to better understand the entrepreneurial behavior among knowledge workers,
the relationship between workers’ talent and their decision to become self-employed and their
probability to survive as entrepreneur, as well as the process of business formation among
highly-skilled professionals.
By exploring the phenomenon of entrepreneurship within the context of a particular labor
market, we contribute to research in entrepreneurship (Knight 1921; Schumpeter 1934; Lucas
1978; Evans and Leighton 1989; Blanchflower and Oswald 1998; Dunn and Holtz-Eakin 2000),
talent allocation (Rosen 1981), and labor market competition (Lazear 1986). Finally, we shed
light on new venture creation among professionals, a subject that has been explored previously
only on related topics for physicians (Headen 1990; Wholey, et al. 1993), accountants (Pennings,
et al. 1998), and biotechnology scientists (Zucker, et al. 1998).4

5
2. Related Literature
Theoretical economic models of entrepreneurial choice have generated a number of
predictions. Knight (1921) suggested that the choice between operating a risky firm or working
for a riskless wage is influenced by (a) the availability of enough capital to guarantee the factors
their fixed remuneration, (b) a willingness to bear uncertainty, and (c) entrepreneurial ability.
Based on those suggestions, some theorists have modeled the occupational choice problem under
the assumptions of liquidity constraints (Evans and Jovanovic 1989), risk aversion (Kihlstrom
and Laffont 1979) and heterogeneous abilities (Lucas 1978; Jovanovic 1982; Holmes and
Schmitz 1990; Jovanovic and Nyarko 1996; Lazear 2002; Irigoyen 2002, Nanda and Sorensen
2004). In the last 25 years, these theorists have established a significant body of research on
entrepreneurship.
Central to this paper are studies that consider human capital a key factor in predicting
occupational choice. More specifically, our empirical study is guided by theoretical models that
point to one’s level of ability as the sorting mechanism to an individual selecting
entrepreneurship (Lucas 1978; Rosen 1981; Rosen 1982; Jovanovic and Nyarko 1996; Irigoyen
2002, Nanda and Sorensen 2004). In his static model of size-distribution of firms, Lucas (1978)
developed an equilibrium theory that assumed an allocation of productive factors over managers
of different ability so as to maximize output. Lucas characterizes “managerial (or
entrepreneurial) technology” by two elements: “variable skill or talent and an element of
diminishing returns to scale or to span of control” (Lucas 1978, p. 511). For efficient allocations,
he predicts, it will be the most talented only who manage new firms, and other agents under the

6
cutoff equilibrium level will remain employees. Similarly, Rosen (1982), in his model on the
distribution of earnings, attributes choice of position (as well as skewed differences in earnings)
to the latent talent possessed by each person.5 He writes, “. . . for efficiency, the scale economy
of management inputs requires that the most able personnel be assigned to top level positions in
very large firms” (Rosen 1982, p. 313). Jovanovic and Nyarko (1996) use the Stepping Stone
Model to discuss the concept of mobility. The Stepping Stone model says that “activities that are
informationally “close” will form a ladder, but the safer ones should come first: they are a
natural training ground because in such activities, mistakes imply smaller foregone
output.”(Jovanovic and Nyarko 1996, p.29). Finally, in his most recent model, Irigoyen (2002)
proposes a dynamic model in which the most able individuals will select into entrepreneurship
since their youth, whereas people in the middle of the distribution will work for someone else
during their early employment and then switch to entrepreneurship.6 Zucker et al. (1998)
provide empirical support for this prediction. They find that leading researchers establish their
companies to capture the rents to their intellectual capital. Summarizing, these models suggest
that more talented individuals will become entrepreneurs.
Likewise, there is a long tradition of empirical research in entrepreneurship that explores
factors that affect the chances of a firm’s survival during the ventures’ early years.7 Initial
economic endowments and financial access are key factors that explain new venture survival
(Evans and Jovanovic 1989; Evans and Leighton 1989; Holtz-Eakin, et al. 1994; Dunn and
Holtz-Eakin 2000). Other empirical models explore the effect of human capital variables on firm
survival. Age (as a proxy for human capital endowment of business founders), years of
schooling, years of experience (Evans and Leighton 1989), the founder’s social capital (Shane
and Stuart, 2002), university degrees (Burke, et al. 2000), prior self-employment experience,
7
leadership experience, and parental self-employment experience (Burke, et al. 2000) are
positively related to new venture success. However, we are not aware of any study that
associates a firm’s survival with an individual’s talent.
3. The Data, Variables and Aggregate Statistics
3.1 The data set
“Sell-side” analysts employed by brokerage houses to follow companies in a particular
industry sector or investment specialty generate information, such as earnings forecasts and stock
recommendations, and detailed research reports on the companies. Sell-side analysts’ clients are
the buy-side, meaning institutional investors, which include money management firms, mutual
funds, hedge funds, and pension funds. Every year in mid-October, Institutional Investor
magazine publishes an “All-America Research Team” list that ranks equity analysts by sector at
four levels: first, second, third, and runner-up. The editor's letter asks voters to rank the analysts
who "have been most helpful to you and your institution in researching U.S. equities over the
past twelve months." The identities of the survey respondents and the institutions they work for
are kept confidential. Survey respondents give one overall numerical score to every research
analyst in each industry sector. The votes are cumulated using weights based on the size of the
voting institution.8 An analyst can be ranked in more than one sector; however, only a small
percentage of analysts achieve rankings in multiple sectors. Some, but not all, star analysts in a
given year continue to be ranked in subsequent years. Siconolfi (1992) writes of the exhaustive
ranking process that “[t]here aren’t many other jobs in America where peoples’ performances are
externally rated so specifically.”

8
Because institutional clients make their own buy decisions, institutional investors, as they
search for specific pieces of information, value the work of an analyst on all six dimensions.
Clients want the analyst to add value to their decision-making process (Brenner 1991). When
analysts' clients were asked to rank, in order of importance, the factors that most attributed to a
successful security firm, industry knowledge emerged as a solid first, followed by stock
selection, written reports, special services, earnings estimates, servicing, quality of sales force,
and market making/execution (Institutional Investor 1998). The net result of this exhaustive
Institutional Investor ranking process is that the poll is a good representation of where customers
find value from research analysts (Siconolfi 1992). Hence, the rankings are a more complete and
comprehensive proxy of the analyst’s ability than the performance of stock recommendations
and/or the analysts' earnings forecast accuracy.
The market recognizes that ranked analysts perform better than their non-ranked
counterparts (Stickel 1992). All-American ranked analysts supply more accurate earnings
forecasts than other analysts and make recommendations that do not follow the crowd (Stickel
1990; Stickel 1992). Consequently, an Institutional Investor ranking can mean hundreds of
thousands of dollars in extra annual pay for analysts (Laderman 1998).9
From the annual issues of Institutional Investor magazine’s “All-America Research
Team” listings, we identified, for the nine-year period from 1988 through 1996, 3,513 ranked
equity analysts (analyst-year combinations) from 62 firms. We focused on the top 24 investment
banking firms that employed more than 15 ranked analysts over the nine years covered by the
study. These firms accounted for 3,408 ranked analyst names, which was 97 percent of all the
analysts ranked during this period. From the annual issues of the Nelson’s Directory of
Investment Research, published at the end of each calendar year, we identified 6,123 names of

9
unranked equity analysts belonging to the top 24 firms. These firms accounted for 38 percent of
the equity analysts (25,053) employed in the United States over the period covered by our data.
The total sample of 9,531 names (analyst-year combinations) represented 2,602 individual
analysts.10
Although 36 percent of the analysts in our sample of 24 firms are ranked, relative to the
entire security industry this proportion would be much smaller because analysts in smaller firms
primarily tend to be unranked. Although our selection approach biases our data in favor of
greater representation of ranked analysts, it helps us control for demographic, analyst
performance, departmental, firm, sector, and macroeconomic variables because such information
is more readily available for the top 24 firms. (Demographic and departmental characteristics
are often not available for research boutiques.) By focusing on the top 24 firms, we were able to
track individual analysts and identify different types of turnover: (a) moved to entrepreneurship,
(b) moved to competitors within the research industry, or (c) moved to companies outside the
research industry. We have made the trade-off in favor of richer information for the smaller
subset of the analysts belonging to the top 24 firms.
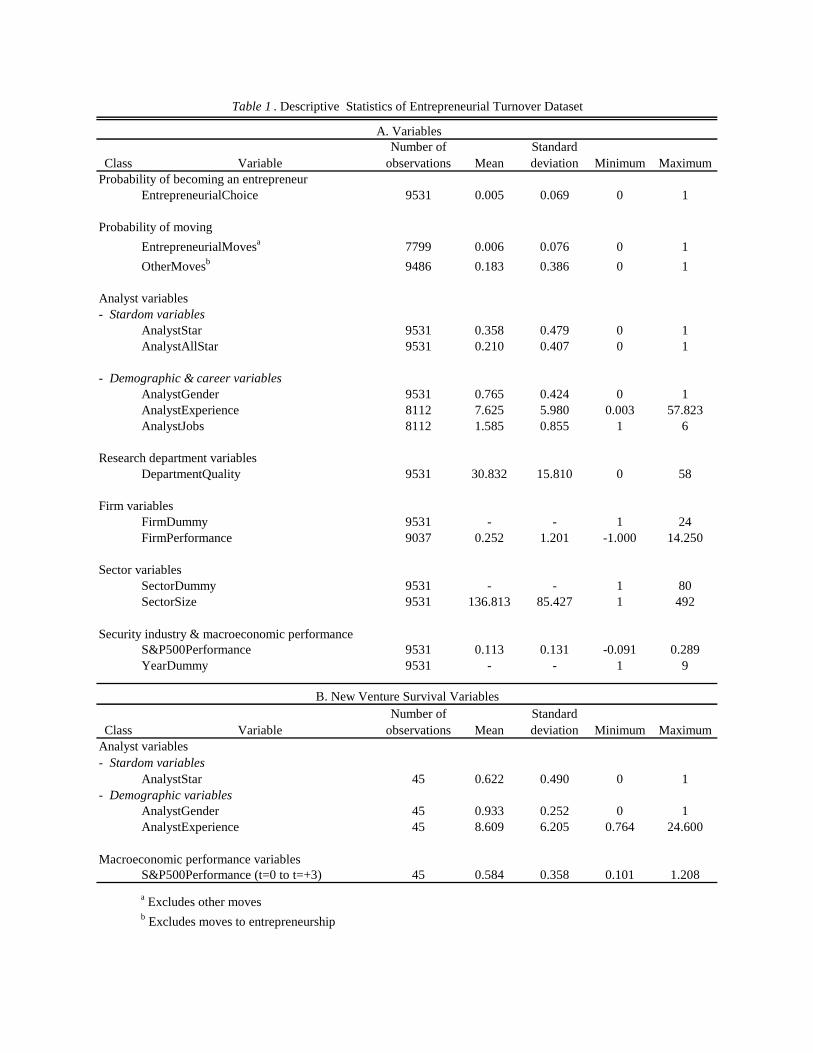
Independent variables are divided into five categories: individual variables; research
department variables; firm variables; sector variables; and macroeconomic variables. Summary
statistics for the variables used in the subsequent analysis are presented in panels A and B of
Table 1.
3.2 Dependent variables
By tracking ranked and unranked equity analysts in the subsequent year’s Nelson’s
Directory of Investment Research and Institutional Investor listings and searching during the
year the Lexis-Nexis, Institutional Brokers Estimate System (I/B/E/S), and the National
10
Association of Security Dealers data bases, we were able to identify, in each year from 1988
through 1996, whether analysts (a) stayed with their original firms, (b) moved to
entrepreneurship, (c) moved to competitors within the research industry, or (d) moved to
companies outside the research industry. We also identified 362 moves by analysts to other
responsibilities within the same firms. Because intra-firm mobility is difficult to distinguish
from inter-firm movement, prior research tends to include such moves in turnover figures.
Because such moves have complex dynamics (including aspects of promotion, demotion, and job
rotation) different from firm exits, we excluded these observations from our data set.
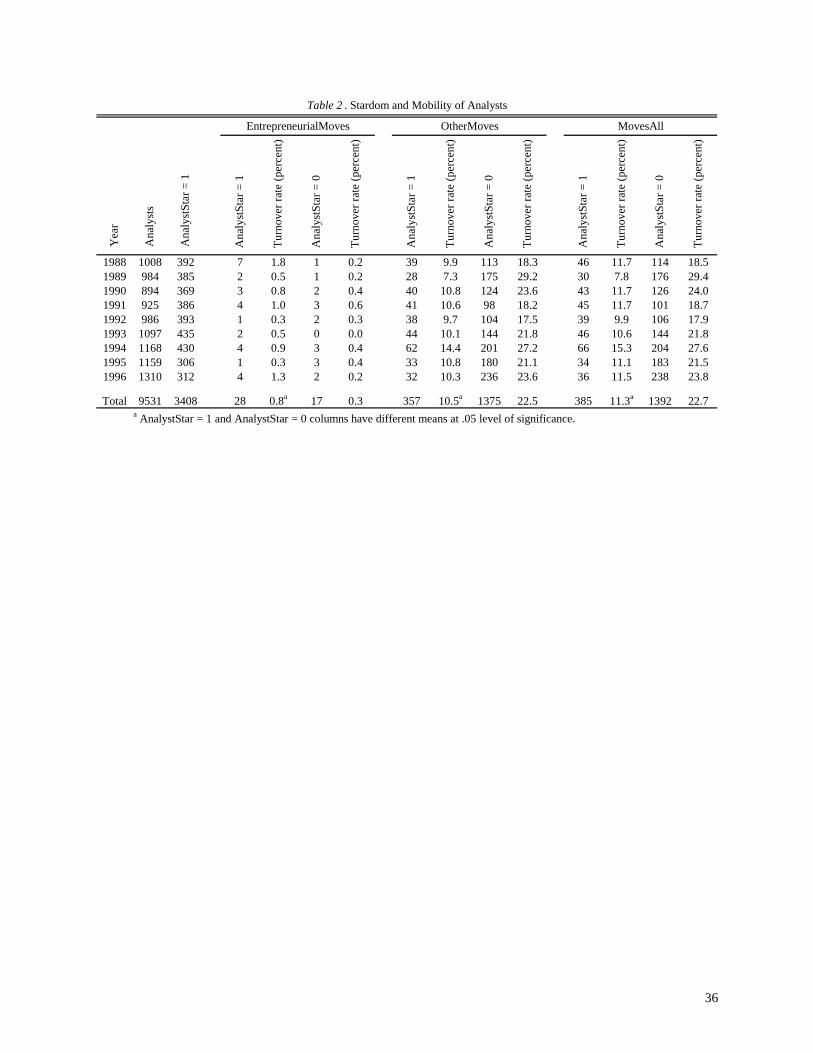
Over the nine-year period, we identified 1,777 total moves among the 9,531 analysts for a
turnover rate of 18.6 percent per annum. Of the analysts who moved, 45 made a transition to
entrepreneurship, 1,673 represented other turnover (moved to competitors, moved to buy-side,
laid off, retired, died, joined the firms they had been covering for years).11 There is no
discernible time trend in turnover. Summary statistics on mobility of the analysts are given in
Table 2.
The variable EntrepreneurialChoicei,t is 1 if analyst i became an entrepreneur during year
t, 0 otherwise. Using EntrepreneurialChoicei,t as a dependent variable confounds two different
types of non-entrepreneurs: non-entrepreneurs who stayed and non-entrepreneurs who moved.
Next, we distinguish between two types of moves: moves to entrepreneurship and other moves.
The variable Movesi,t is defined to take the value of “NoMovesi,t “ if analyst i did not move
during year t, “EntrepreneurialMovesi,t” if analyst i became an entrepreneur during year t, and
“OtherMovesi,t“ if the analyst i moved to non entrepreneurial position during year t .12 The two
dichotomies compare groups “EntrepreneurialMovesi,t” and “OtherMovesi,t“ to “NoMovesi,t”, to
test the general hypothesis that different types of turnover have different causal antecedents.
11
Turnover rate to competitors is 0.5 percent per annum: 0.8 percent per annum (28 out of
3,408) among ranked analysts; 0.3 percent per annum (17 out of 6,123) among non-ranked
analysts. Forty-four analysts founded money management firms, hedge funds, and research and
advisory companies; one star analyst founded an airline company. All new ventures were
established in the areas in which analysts specialized, suggesting that analysts attempt to
leverage sector-specific skills in their entrepreneurial ventures. The reasons why only a small
percentage of analysts became entrepreneurs can be found in the characteristics of their labor
market.13
Finally, we introduce the VentureSurvival variable to test whether the probability of the
new venture survival differs for high-ability analysts from that of low-ability analysts.
VentureSurvivali,t+3 is 1 if analyst i moved to self employment during year t and his/her new
venture still exists after three years, 0 if analyst i moved to self employment during year t and
his/her new venture does not exist after three years.
3.3 Individual variables
We examined a number of individual and contextual variables that are identified to be
important in theoretical mobility models and empirical tests (Lucas 1978; Jovanovic 1982;
Eccles and Crane 1988; Evans and Leighton 1989; Holmes and Schmitz 1990; Holtz-Eakin, et al.
1994; Blanchflower and Oswald 1998; Dunn and Holtz-Eakin 2000; Irigoyen 2002; Lazear
2002).
We researched issues of Institutional Investor as far back as 1972 (the first year of
rankings) to trace the number of years each analyst was ranked. Hence, our sample includes
analysts who have never been ranked as well as analysts who have appeared in the Institutional
Investor rankings for a quarter of a century. Four hundred and twenty of the 9,531 analysts (4.4

12
percent of the data set, 12.3 percent of the 3,408 ranked analysts) were ranked for the first time.
On average, analysts in our data set were ranked approximately thrice. Median star tenure was 0
years; 57.2 percent of the analysts have never been ranked. Focusing on ranked analysts only,
average star tenure was 7.2 years.
We collected analysts’ demographic and career characteristics (gender and number of
years of experience in the industry) by conducting searches on Lexis-Nexis, the National
Association of Securities Dealers web database, Institutional Brokers Estimate System, and Dow
Jones News. In our sample, 76.5 percent of analysts are male.14 On average, an analyst in our
sample had 7.62 years of experience, worked at the same firm for 5.27 years, and held 1.59 jobs.
The independent variable AnalystStari,t is 1 if analyst i is ranked in year t.
AnalystStarTenurei,t is the number of years analyst i has been ranked as of the end of year t. To
distinguish further between high- and low-ability analysts, we introduce another variable.
AnalystAllStar is 1 for analysts who have been stars for at least five years and are currently stars,
0 otherwise. To capture demographic and career characteristics, we define three other variables.
AnalystGenderi,t is 1 if analyst i is male, 0 if female. AnalystExperiencei,t is the total number of
years analyst i has worked as of October 15th of year t. AnalystJobsi,t is the number of career-
related jobs analyst i has held as of October 15th of year t.15
3.4 Research department variables
The quality of the research department is operationalized according to the Greenwich
Associates Institutional Research Services rankings of research departments. Every year,
interviews with approximately 3,000 investment professionals are used to produce the rankings
of the best research departments. Portfolio managers and buy-side analysts are asked to name
their top sources for investment ideas. Buy-side professionals are quizzed about service,

13
products, knowledge, and the performance of brokerage houses’ sales representatives.16
DepartmentQualityi,t is the percentage of institutional clients who rate the brokerage house as
having the best ten research department in analyst i’s research department in year t. An average
research department quality was 30.83.
3.5 Firm variables
To estimate firm performance for all the firms in our data set, we developed a profit
proxy–the sum of equity and debt underwriting and merger and acquisition fees during the year.
From Securities Data Corporation, we collected firms’ profit data based on U.S. merger and
acquisition fees (based on credit to target and acquirer advisers), U.S. equity underwriting gross
spreads (based on credit full to each lead manager), and U.S. debt underwriting gross spread
(credit full to each lead manager). These three figures are summed to generate the profit proxy
for a firm for a particular year. We calculate the proportion of total profits generated by each of
the 24 firms in our data set during a particular year. To estimate change in relative profit
performance, we calculate for each firm the proportionate change in this relative profit from one
year to the next. On average, relative profit increased during any given year by 25.2 percent;
median increase is 3.4 percent per annum. FirmPerformancei,t is the proportional change during
the year preceding time t in the ratio of analyst i’s firm profits from equity and debt underwriting
and merger and acquisition advisory fees to the total industry profits.17 In addition,
FirmDummyi,t controls for firm-level variation.
3.6 Sector variables
We grouped the sectors in 80 categories according to the Institutional Brokers Estimate
System. In cases where an analyst covers more than one sector, the sector was chosen based on
the number of firms an analyst tracks in one sector compared to another, as it appeared in the
14
Institutional Brokers Estimate System database. An average sector was followed by 137 equity
analysts in any given year, although there are wide variations in coverage. SectorSizei,t is the
total number of equity analysts following analyst i’s sector as of year t. SectorDummyi,t controls
for sector-level variation.18
3.7 Macroeconomic variables
We use proportionate change in the S&P 500 index (as a broad economic indicator) to
estimate macroeconomic performance in the years preceding each of the nine years. Our study
covers both a period of macroeconomic decline and a period of macroeconomic expansion. On
average, during any one year, the S&P index increased by 11.3 percent. S&P500Performance,t
is the proportional change in the S&P 500 index during the year preceding time t.
4. Models And Results
4.1 Stardom and Entrepreneurial Choice
We estimate the probability of an analyst becoming an entrepreneur as a function of
analyst stardom, individual, firm, sector and macroeconomic variables. We use the following
probit model specification:19
(1) P (EntrepreneurialChoicei,t+1 ) = α + β1 x AnalystStari,t + β2 x AnalystGenderi,t
+ β3 x AnalystExperiencei,t + β4 x AnalystExperience2i,t + β5 x AnalystJobsi,t + β6 x
FirmDummyi,t +β7 x SectorDummyi,t + β8 x YearDummyt + εi,t+1
Column (1) in Table 3 presents a regression that estimates the probability of becoming an
entrepreneur as a function of analyst stardom, individual, firm, sector, and macroeconomic
variables.20 The regression controls for all firm-specific, sector-specific, and intertemporal
variations by using firm, sector, and year dummies in the regressions. AnalystStar has a

15
significant positive coefficient (p < 0.01). Being ranked by Institutional Investor magazine
increases the probability of becoming an entrepreneur with a marginal effect of 0.7 percent over
the mean (0.5 percent). Being male increases the probability of becoming an entrepreneur (p <
0.05) at the mean by 0.5 percent. AnalystExperience and AnalystJobs have insignificant
coefficients.
Column (1) of Table 3 conducts a stringent test of the influence of stardom on the
probability of analyst turnover by using firm, sector, and year dummies in the regressions.
Column (2) estimates the probability of becoming an entrepreneur as a function of analyst
stardom, and a variety of department (the quality of the research department), firm (firm
performance), sector (sector size), and macroeconomic (macroeconomic performance) variables.
The estimating equation for column (2) is (2).
(2) P (EntrepreneurialChoicei,t+1 ) = α + β1 x AnalystStari,t + β2 x AnalystGenderi,t
+ β3 x AnalystExperiencei,t + β4 x AnalystExperience2i,t + β5 x AnalystJobsi,t + β6 x
DepartmentQualityi,t + β7 x FirmPerformancei,t + β8 x SectorSizei,t + β9 x
S&P500Performancet + εi,t+1
Results in column (2) of Table 3 for individual variables are; AnalystStar remains
positive significant (p < 0.01). The research department variable, DepartmentQuality, is not
significant. We also find that firm performance does not significantly influence the probability
of analyst turnover to entrepreneurship. The sector variable also does not have a significant
coefficient. At the macroeconomic level, we find that the probability of analyst entrepreneurial
turnover is not sensitive to the proportional change in the S&P 500 index.

16
Finally, to further distinguish between different analysts’ ability level, we substitute
AnalystStar by AnalystAllStar. Analysts who are repeatedly ranked by Institutional Investor
magazine are considered all-stars because they are able to sustain their performance over a
period of time. This is a stronger test on whether analysts’ performance affects their probability
of becoming an entrepreneur. Regression results are shown in column (3) of Table 3.
AnalystAllStar has a significant positive coefficient (p < 0.05). Hence, established all-star
performers tend to have a greater propensity to become self-employed. The predicted probability
of exit at the mean is 0.4 percent. Being an all-star increases the probability of turnover to
entrepreneurship by 0.6 percent at the mean. The results for other variables remain largely
unchanged.
Overall, our results suggest that analysts’ ability and gender (individual factors) influence
turnover to entrepreneurship. Entrepreneurship, however, is not driven by situational variables;
for example, at the department level by quality, at the firm level by performance, at the sector
level by size, or at the macroeconomic level by performance.21
Entrepreneurial analysts identified the following categories of motives for their
departures: the urge to broaden their account base (strict limitations at the former firms on what
clients cover); the desire to put their own stamp on the organization by building a firm based on
their values; to obtain the freedom of investment thought (independence from politics of the firm
on what stocks to recommend); the chance for the analysts to make more money and capitalize
on their talents; the burnout factor of their former research jobs (the long hours, the marketing
demands, the travel, the pressure to generate the investment banking deals); and personality
conflicts. Some ranked analysts indicate that they left because by achieving a star status, they
accomplished the highest honor in the research business and there was no room to grow. A

17
number of stars indicated that they decided to become entrepreneurs after evaluating their life
accomplishments, with many stating that they reached a point in their lives where they knew if
they didn't make the break, they never would and later would regret it.
In supplemental analysis, we also control for relative analyst accuracy, absolute analyst
accuracy, and visibility.
Relative Accuracy. We estimated analysts’ average earnings forecast accuracy during the
sample period using the same measure of relative forecast accuracy as Hong, Kubik and
Solomon (2000) and Hong and Kubik (2003). For each company and quarter that an analyst
issued an earnings forecast, we ranked the analyst on forecast accuracy relative to all other
analysts from the IBES dataset covering the same company and quarter. When an analyst issued
multiple forecasts for the same company-quarter, we selected the latest forecast to estimate
forecast accuracy ranking. Percentile ranks (ranging from a low of 0% for the least accurate
analyst to 100% for the most accurate analyst) were constructed the following:
100100 *1CoverageCompany
1RankRank Percentile
jt
ijtijt
⎪⎭
⎪⎬⎫
⎪⎩
⎪⎨⎧
−
−−=
where Rankijt is analyst j’s forecast accuracy rank for firm i in quarter t, and Company Coveragejt
is the number of analysts issuing forecasts for firm i in quarter t. The Percentile Rank estimates
are then averaged across firms and quarters covered by the analyst to provide an average
measure of an individual’s relative forecast accuracy. The IBES data is less complete than the
Nelson database. The number of observations drops as we try to match the IBES dataset to the
analyst observations. However, when this variable is included in our regressions, it is not
statistically significant.

18
Absolute Accuracy. We also constructed a measure of the absolute forecast accuracy of an
analyst following the Hong, Kubik and Solomon (2000) and Hong and Kubik (2003)
methodologies. We measured the analyst’s accuracy for a particular firm in a given year by
focusing on the absolute difference between her forecast and the actual earning per share number
of the firm. The absolute difference was scaled by the stock price. Because analysts follow
multiple firms, we aggregated this forecasting accuracy measure across all the firms that an
analyst covers. Similar to Hong, Kubik and Solomon (2000) and Hong and Kubik (2003), we
aggregate the average forecast errors for all firms for the three previous years compared to doing
it for one year because some analysts cover few firms and, therefore, these analysts’ measures
are noisy if they are done for one year. After including this measure in our regressions, it the
absolute accuracy variable is not statically significant.
Visibility. One alternative explanation is that star analysts are more visible and, therefore,
exposed to more business opportunities. We focused on press coverage to measure analysts’
visibility. All press searches were performed in Factiva, which covers all major wire services,
major, national, and regional publications. For each year and for every analyst, we obtained the
number of press articles. Examining the effect of the press coverage on entrepreneurial turnover,
we find that the relationship is not significant.
We show that an analyst's absolute and relative forecasting ability as well as visibility has
no effect on an analyst's decision to start a new firm. The stardom variable might be capturing
important dimensions that are significant for entrepreneurship: client service and accessibility,
industry knowledge, and the quality of written reports.
In the next section, we examine whether drivers of entrepreneurship turnover are
different from factors that determine other movements.
19
4.2 Stardom and All Moves
As we mentioned earlier, using EntrepreneurialChoice as a dependent variable
confounds two different types of non-entrepreneurs: non-entrepreneurs who stayed and non-
entrepreneurs who moved. In this section we conduct the analyses with a different dependent
variable: Moves. We assume three nominal outcomes: where “NoMoves“ = no turnover,
“EntrepreneurialMoves” = turnover to entrepreneurship, and “OtherMoves“ = turnover to non-
entrepreneurial position. The Moves variable allows us to test whether different types of
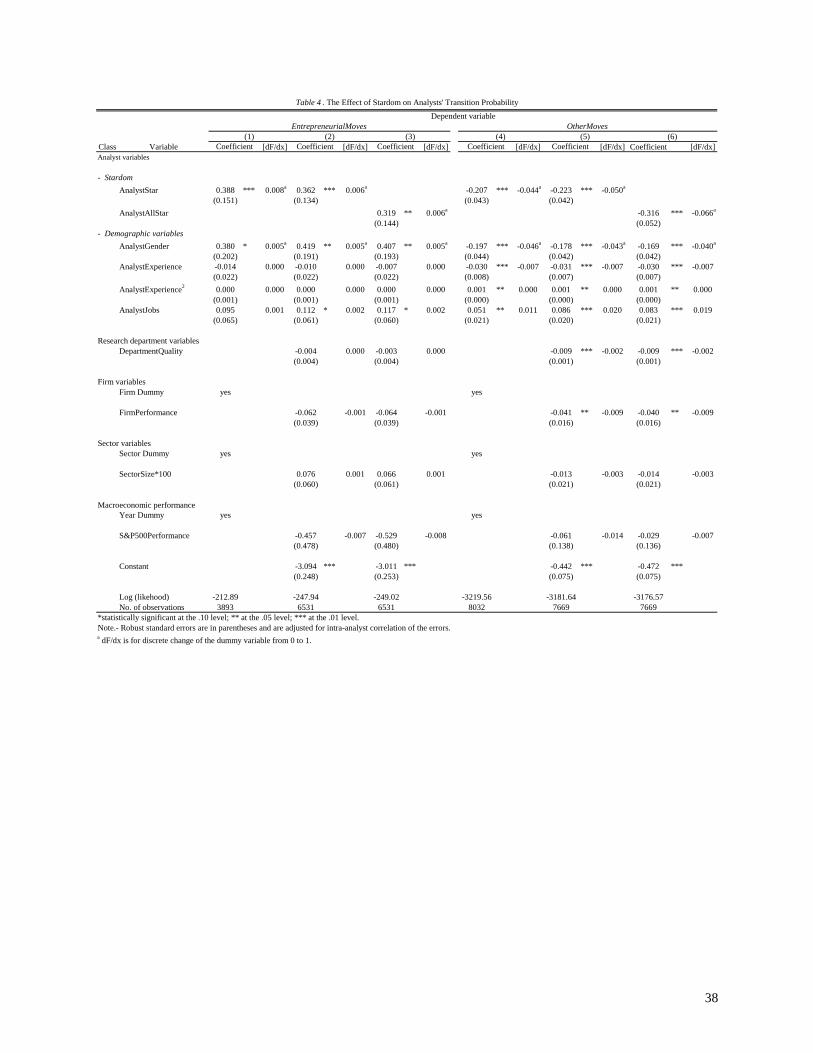
turnover have different causal antecedents. In Table 4, the estimating equations for columns (1)
through (6) are equations (1), (2), (3) of Table 3 respectively with the new dependent variable.22
An examination of turnover to entrepreneurship in columns (1) through (3) of Table 4
shows all variables having coefficients similar in significance and magnitude to those in Table 3.
However, examining other turnover (to non-entrepreneurial positions) in column (4), we find that
AnalystStar has a significant negative coefficient (p < 0.01). Being a star decreases the
probability of moving to another firm with a marginal effect of 4.4 percent over the mean (at
which predicted exit probability is 13.7 percent). Hence, in contrast with what we found for
movements to entrepreneurship, high performers are less likely to move to competitors than low
performers. AnalystExperience has a significant negative coefficient (p < 0.01), whereas
AnalystJobs has a significant positive coefficient (p < 0.05). Each additional year of experience
reduces the analyst's turnover probability by 0.6 percent at the mean. Analysts’ past movements
determine their current propensity to move. Each additional job that an analyst held in the past
increases the analyst's turnover probability by 1.1 percent at the mean. AnalystGender has a

20
significant negative coefficient (p < 0.05). Women have a greater propensity than men to exit
firms. Being male reduces the probability of turnover to another firm by 1.1 percent at the mean.
In examining other turnover in column (5) of Table 4, the results for individual variables
remain largely unchanged from column (4). In contrast with the results for movements to
entrepreneurship, the coefficient of DepartmentQuality is negative and significant (p < 0.01),
indicating that analysts working in a better department have a lower propensity to exit. A 1
percent increase in the percentage of institutional clients who rate the brokerage house as having
one of the best ten research departments reduces the probability of exit at the mean by 0.2
percent. At the firm level, in contrast to entrepreneurial turnover, firm performance significantly
influences the probability of analyst turnover. Good investment banking performance by a firm
in the preceding year (FirmPerformance) reduces the probability of analyst turnover (p < 0.05).
For a 10 percent negative change in the firm performance, the probability of analyst turnover
increases by 0.09 percent. Finally, as we found for moves to entrepreneurship, the sector and
macroeconomic variables do not have significant coefficients.
Finally, column (6) of Table 4, which presents the regression results of other moves,
yields very different results than the self-employed model in column (3) of Table 4.
AnalystAllStar has a significant negative coefficient (p < 0.01). Being an all-star reduces the
probability of turnover to competitors by 6.6 percent at the mean (14.5 percent). Hence,
established all-star performers are more likely to stay with their firms or choose
entrepreneurship.
Comparing entrepreneurial turnover with other turnover, we document that there are
differences in factors that drive these two different types of mobility. In fact, when
characteristics of these two types of turnover are examined, the same variables change signs
21
(ability and gender). Situational drivers (department, firm, sector, macro economy) do not drive
turnover to entrepreneurship; only ability and gender do. In contrast, situational drivers
(department and firm) as well as individual ones (ability, experience, prior mobility, and gender)
drive other turnover. Our findings suggest that studies that do not differentiate between different
types of mobility might be documenting less precise relationships between drivers of turnover
and workers’ mobility.
4.3 The Determinants of New Venture Survival
We estimate the probability of the new venture survival as a function of the independent
variable (performance) and three classes of control variables (demographic factors and
macroeconomic factors). We use the following probit model specification:23
(3) P (VentureSurvivali,t+3 ) = α + β1 x AnalystStari,t + β2 x AnalystGenderi,t
+ β3 x AnalystExperiencei,t + β4 x S&P500Performancet=0→3 + εi,t+3
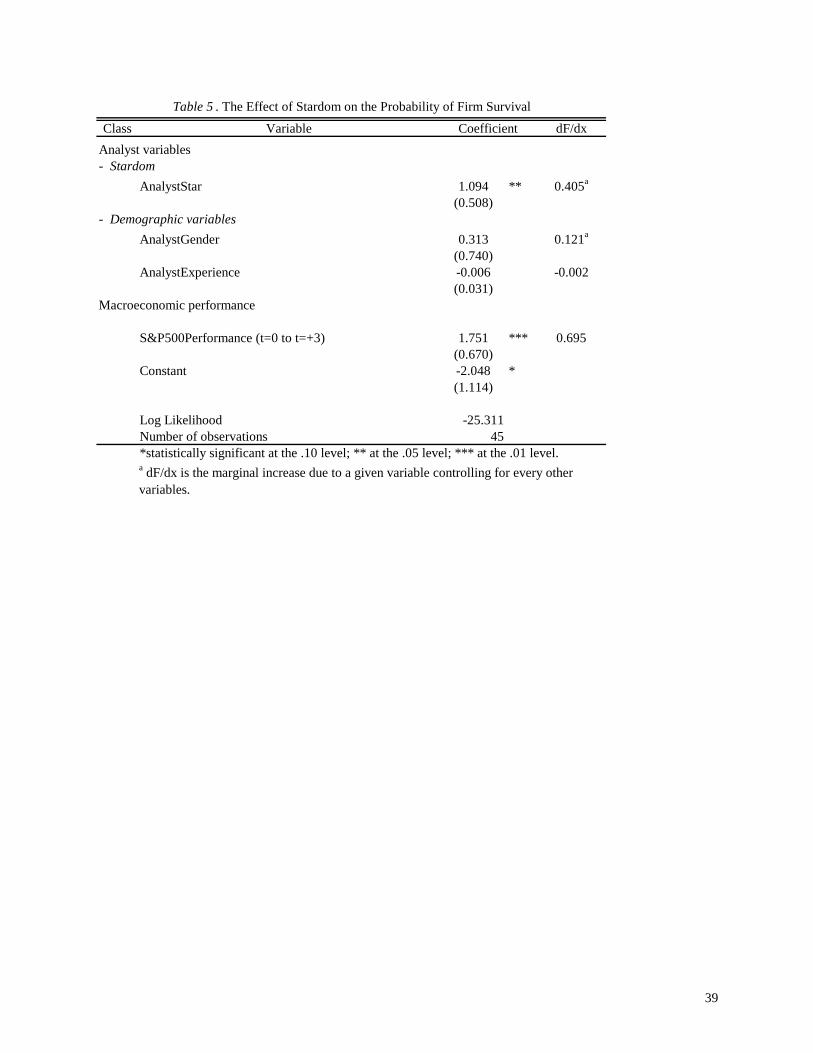
The model in Table 5 presents a regression that estimates the probability of survival in
three years as a function of analyst stardom, individual, and macroeconomic variables. The
estimated coefficient on Analyst star is positive and significant (p < 0.05). Hence, being ranked
by Institutional Investor increases the probability of the venture survival after an analyst
becomes an entrepreneur with a marginal effect of 40.5 percent over the mean (45.9 percent).24
New ventures found by more capable analysts have a higher probability to survive for three
years.25 Finally, we find that the greater the expansion of the U.S. economy, the higher the
probability of the venture survival after analysts become entrepreneurs. The estimated
coefficient for the S&P 500 performance (t=0 to t+3) variable is positive and significant (p <
0.01). For a 10 percent proportional positive change in the S&P 500 index during a particular
three-year period, the probability of an analyst’s entrepreneurial success increases by 7.0 percent
22
over the mean. Overall, our results suggest that analyst’s ability and performance of the
economy influence venture’s survival.
5. Summary and Conclusions
Many economists and social scientist agree that entrepreneurship has become an
important phenomenon in our society. However, few studies have examined empirically the
entrepreneurial activity in the professional service industries. Furthermore, no empirical studies
explore the effects of workers’ ability on entrepreneurial activity. In this paper, we examine the
effect of workers’ ability on (a) probability of their entrepreneurial turnover and (b) subsequent
survival of new ventures. We also control for other potential drivers of turnover besides
performance at five levels: demographic, departmental, firm, professional specialization, and
macroeconomic characteristics. We offer new evidence on the determinants of turnover to
entrepreneurship and the factors affecting survival of new ventures in the context of a
professional service industry.
Analysis of entrepreneurial efforts from a panel data set of equity research analysts in
investment banks over 1988-1996 reveals that star analysts are more likely than non-star analysts
to become entrepreneurs. We also find that ventures founded by star analysts have a higher
probability to survive in three years than non-star analysts, and the probability of survival is
procyclical with the performance of the economy.
Many empirical studies of employee turnover treat all exits from a firm alike. We have
found that turnover to entrepreneurship has different dynamics from other turnover. Hence,
theoretical models as well as empirical studies of turnover of workers should disentangle the
different types of turnover by destination. In contrast to entrepreneurial turnover, we find that

23
star analysts are less likely than their non-star counterparts to experience other turnover; more
experienced analysts are less likely to exit their firms than less experienced analysts; being male
decreases the probability of other turnover; analysts’ past movements increase their current
propensity to move; the probability of other turnover is greater for lower-rated research
departments; and other turnover is anticyclical with the performance of the firm.
This study contributes to several recent lines of research. Our results empirically support
Lucas’ (1978) theoretical prediction that the relatively more talented workers become
entrepreneurs. Furthermore, our findings are consistent with the works of (Zucker, et al. 1998)
that leading professionals found companies to earn rents on their intellectual capital. Also,
supporting prior studies (Blanchflower and Oswald 1998), we find that being male increases the
probability of turnover to entrepreneurship. By exploring the phenomenon of turnover within the
context of professionals in the labor market of equity security analysts, the paper also contributes
to research in talent allocation (Rosen 1981) and labor market competition (Lazear 1986).
One limitation of this paper is that the sample includes a restricted class of agents,
security analysts. Future research conducted in different settings would be helpful to confirm the
relationship between ability and entry and exit from entrepreneurship. Comparing the
entrepreneurial turnover pattern of equity analysts with the turnover dynamics of engineers,
software programmers, money managers, and other professionals could help test the
generalization of our conclusions across various professions.
Our findings have implications for the allocation of resources by policy-makers and other
institutions promoting entrepreneurial activity. Our findings have implications for human
resource practitioners as well. Whereas firms try to minimize turnover to competitors, at the
same time, they might be maximizing entrepreneurial turnover. To our knowledge, no study has

24
been able to establish what mobility is more damaging to the firm. We believe that it is an
important question for future research.

25
REFERENCES
Blanchflower, D. G. and A. J. Oswald. 1998, "What Makes an Entrepreneur," Journal of Labor
Economics, 16.1, 26-60.
Brenner, L., 1991, "The Bull and the Bear," United States Banker, January, 25-27.
Burke, A. E., F. R. FitzRoy and M. A. Nolan, 2000, "When Less Is More: Distinguishing
between Entrepreneurial Choice and Performance," Oxford Bulletin of Economics &
Statistics, 62, 565-87.
Dorfman, D., 1974, "The Rise of Entrepreneurial Analysts," Institutional Investor, July, 43-106.
Dorfman, J., 1991, "Analysts Devote More Time to Selling as Firms Keep Scorecard on
Performance," Wall Street Journal, October 29, C1.
Dunn, T. and D. Holtz-Eakin, 2000, "Financial Capital, Human Capital, and the Transition to
Self-Employment: Evidence from Intergenerational Links," Journal of Labor Economics,
18, 282-305.
Eccles, R. G. and D.B. Crane, 1988, Doing Deals, Cambridge, MA: Harvard Business School.
Evans, D. S. and B. Jovanovic, 1989, "An Estimated Model of Entrepreneurial Choice under
Liquidity Constraints," Journal of Political Economy, 97. 4, 808-27.
Evans, D. S. and L. Leighton, 1989, "Some Empirical Aspects of Entrepreneurship," The
American Economic Review, 79, 519-35.
Foster, A. and M. Rosensweig, 1995, "Learning by Doing and Learning from Others: Human
Capital and Technical Change in Agriculture," Journal of Political Economy, 6. 103,
1176-1209.
Greene, W. H., 2000, Econometric Analysis, Upper Saddle River, NJ: Prentice Hall.
26
Headen, A. E., 1990, "Wage, Returns to Ownership, and Fee Responses to Physician Supply,"
The Review of Economics and Statistics, 72.1, 30-37.
Holmes, T. J.and J. A. Schmitz, 1990, "A Theory of Entrepreneurship and Its Application to the
Study of Business Transfers," Journal of Political Economy, 982, 265-94.
Holtz-Eakin, D., D. Joulfaian and H. S. Rosen, 1994, "Entrepreneurial Decisions and Liquidity
Constraints," The Rand Journal of Economics, 23.2, 340-47.
Hong, H., J. D. Kubik and A. Solomon, 2000, "Security Analysts' Career Concerns and Herding
of Earnings Forecasts," RAND Journal of Economics, 31, 121-44.
Hong, H. and J. D. Kubik, 2003, "Analyzing the Analysts: Career Concerns and Biased Earning
Forecasts," The Journal of Finance, 58.1, 313-51.
Institutional Investor, 1998, "The 1998 All-America Research Team," Institutional Investor,
October, 99-106.
Irigoyen, C., 2002, "Where Do Entrepreneurs Come From?" Working paper, University of
Chicago.
Jovanovic, B., 1982, "Selection and the Evolution of Industry," Econometrica, 50, 649-70.
Jovanovic, B. and Y. Nyarko, 1996, "Stepping Stone Mobility," NBER Working Paper #5651.
Kihlstrom, R. E. and J. Laffont, 1979, "A General Equilibrium Entrepreneurial Theory of Firm
Formation Based on Risk Aversion," The Journal of Political Economy, 87.4, 719-48.
King, G. and L. Zeng, 1999, "Estimating Absolute, Relative, and Attributable Risks in Case-
Control Studies," Department of Government, Harvard University.
King, G. and L. Zeng, 1999, "Logistic Regression in Rare Events Data," Department of
Government Harvard University.
Knight, F., 1921, Risk, Uncertainty and Profit, New York: H H.

27
Kostigen, T., 1990, "Captain of Your Own Ship," Investment Dealers' Digest, February, 22-29.
Laderman, J., 1998, "Who Can You Trust? Wall Street's Spin Game," Business Week, October
5, 148-56.
Lazear, E.P., 1986. "Raids and Offer Matching." Research in Labor Economics, Vol. 8A, pp.
141-65.
Lazear, E. P., 2002, "Entrepreneurship," In NBER Working Paper Series 9109, 2002.
Lucas, R. E., 1978, "On the Size Distribution of Business Firms," Bell Journal of Economics, 9,
508-23.
Milligan, J. W., 1985, "The Boutiques Are Making It Big," Institutional Investor, November,
175-87.
Nanda, R. and J. B. Sorensen, 2004, "Labor Mobility and Entrepreneurship," Manuscript.
Pennings, J. M. K. Lee and A. van Wittelloostuijn, 1998, "Human Capital, Social Capital and
Firm Dissolution," Academy of Management Journal, 41.4, 425-40.
Phillips, B., 1997, "Free at Last?" Institutional Investor, August, 48-55.
Rosen, S., 1982, "Authority, Control and the Distribution of Earnings," Bell Journal of
Economics, 13, 311-23.
Rosen, S., 1981, "The Economics of Superstars," American Economic Review, 75, 845-58.
Schumpeter, J. A., 1934, The Theory of Economic Development, Cambridge, MA: Harvard
University Press.
Shane, S. and T. Stuart, 2002, "Organizational Endowment and the Performance of University
Start-Ups," Management Science, 48, 154-70.
Siconolfi, M., 1992, "Shearson Research Analysts Finish First on 'All -America Team' for Third
Year," The Wall Street Journal, October 13, C18.
28
Stickel, S. E., 1990, "Predicting Individual Analyst Earnings Forecast," Journal of Accounting
Research, 28, 409-17.
Stickel, S. E., 1992, "Reputation and Performance among Security Analysts," Journal of
Finance, 47.5, 1811-36.
Watson, J. and J.E. Everett, 1993, "Defining Small Business Failure," International Small
Business Journal, 11.3, 35-48.
Wholey, D. R., J. B. Christianson and S. M. Sanchez, 1993, "The Effect of Physician and
Corporate Interests on the Formation of Health Maintenance Organizations," American
Journal of Sociology, 99.1, 164-200.
Zucker, L. G., M. R. Darby and M. B. Brewer, 1998, "Intellectual Human Capital and the Birth
of U.S. Biotechnology Enterprises," The American Economic Review, 88.1, 209-306.
ENDNOTES
1 Throughout the paper we use entrepreneurship, entrepreneurial activity, self-employment or
entrepreneurial choice as equivalent expressions. Following Evans and Leighton (1989), the
self-employed category includes all sole proprietors, partners, and sole owners of incorporated
business.
2 Hereafter, we use the terms ranked analysts and star analysts interchangeably to refer to
analysts ranked by Institutional Investor magazine.

29
3 Following Schumpeter’s (1934) holistic perspective on entrepreneurship, we argue that the
probability of a professional becoming an entrepreneur and her chances of success are
simultaneously influenced by variables at different levels of analysis.
4 Wholey (1993) studies organization formation among physicians when interests of corporate
clients are strong and professional diversity leads professional groups to expand their jurisdiction
by organizing. In Headen (1990), the labor and entrepreneurial components of reported
physicians’ net income are separated in an analysis of input and output market performance.
Pennings et al. (1998) examine the effect of human and social capital upon firm dissolution with
data from a population of Dutch accounting firms. Finally, Zucker et al. (1998) find that the
timing and location of the birth of biotech enterprises is determined primarily by the local
number of highly productive 'star' scientists actively publishing genetic sequence discoveries.
5 Rosen (1981) has emphasized that “the phenomenon of superstars, wherein relatively small
numbers of people earn enormous amounts of money and dominate the activity in which they
engage” (p. 845) is becoming increasingly important in the modern society, particularly in the
worlds of sports, arts, music, literature, medicine, law, consulting, academics, science, show
business, and other professions. The combination of both the joint consumption technology and
imperfect substitution allows few superstars to command very large markets and large incomes.
The model might be interpreted that the individuals of extraordinary ability, superstars, are more
likely to set up their own firms and, thus, capture high rewards for their services that they were
not able to capture working for someone else.
6 Following Lucas (1978) and Rosen (1982), Irigoyen (2002) summarizes entrepreneurial
activities into two categories: management (human capital intensive) and supervision or
coordination (time intensive). More able entrepreneurs in this context are interpreted as better

30
managers that also have more effective time. In his model, skills or human capital is defined as
knowledge that can be innate or acquired through time.
7 The definition of survival varies enormously across studies (see Watson and Everett (1993) for
a good review), challenging comparability of results across research studies.
8 For instance, in October 1996, Institutional Investor magazine produced a ranking for each of
the 80 equity industry groups and investment specialties. The survey reflected the ratings of
around 1,300 customers, representing approximately 68 percent of the 300 largest institutions in
the United States, as well as other investment management institutions.
9 At most investment banks, a position on the All-America Research Team is one of the three
most important criteria for determining analyst pay (Dorfman 1991).
10 We identified 42 analysts whose names changed during the nine-year period, primarily
because of the addition or change of last names subsequent to a change in marital status, so as to
ensure that they were not double counted.
11 Although we specifically identify analysts’ moves, we have followed analysts that move
outside the industry for a year. It is possible that later on they would have moved to self-
employment. However, over the nine years, we are not aware of any such case.
12 Analysis on what drives each type of move within other moves (moved to competitors, moved
to buy-side, laid off, retired, died, joined the firms that they had been covering for years) lies
outside the scope of this paper.
13 A number of studies report that new entrepreneurs are driven by the desire to build some
equity. But analysts are able to extract their value from their employers because of the external
observability of their performance (stock recommendations, earnings forecasts, and research
reports). Some firms succeed in retaining their analysts by allowing them to operate as
31
independent franchises within the firm. Analysis of turnover across the 24 firms using firm
dummies (regressions are not reported) suggests significant inter-firm differences. We find that
analysts from UBS, Montgomery, and Kidder Peabody become entrepreneurs more frequently
than do those from DLJ, Lehman Brothers, Merrill Lynch, Salomon Brothers, and Sanford C.
Bernstein. Analysts’ entrepreneurial activity might depend on the firm’s structure and the
relationship between the firm and its employees. For example, at DLJ and Sanford C. Bernstein
the analysts are treated as entrepreneurs running their own franchises. In fact, these analysts
have their own individualized profit and loss statements. The authors would like to thank
George Baker and Robert Gibbons for offering this insight.
14 First, the Census data was used to distinguish analysts’ gender. Three hundred and seventy
nine analysts’ first names are used by both men and women. Thus, we looked up their
interviews, press releases, and other available public information to identify the gender of those
analysts.
15 Correlations among the independent and control variables highlight the following
relationships. We have age data for only 42 percent of the ranked analysts. For these, age is
highly correlated with analyst experience (0.55). AnalystExperiencei,t is also highly correlated
with analyst firm tenure (0.73). To avoid multicollinearity among independent variables, we use
AnalystExperiencei,t as not only a measure of analyst experience but also a proxy for analyst age.
16 The Greenwich Associates results are based on the total number of responses for each firm
given by the survey respondents, thus favoring larger staffs with broader coverage.
Departmental size is indeed highly correlated with quality (0.61).
17 We also collected firm performance data for publicly quoted investment banks by calculating
for the prior year change in stock price performance deflated by changes in the Dow Jones

32
Security Broker index. Information on stock price performance is available only for public firms
(46 percent analyst-year combinations). Therefore, we use the FirmPerformancei,t variable in all
subsequent analyses. Using deflated stock price performance instead yields similar regression
results although, because stock price performance is available for far fewer observations than is
investment banking performance, the predictive power of regressions is lower if it is used as the
proxy for relative firm performance.
18 Industry experts assert that turnover on Wall Street varies with the nature of the sectors
analysts cover; some sectors are “hot”, others are not (Institutional Investor 1997, 1998). As
sectors become “hot”– i.e. technological breakthrough, deregulation, globalization – the range of
opportunities increases for professionals. It becomes easier for analysts to set up their own
firms. To test this hypothesis, we calculate the sectors’ deflated stock market performance (the
proportionate change in the stock price of the sector followed deflated by the S&P 500 index),
which, on average, increases by 1.0 percent during any one year. Information on sector
performance is available only for the 76 percent analyst-year combinations. Our findings
contradict popular wisdom. We do not find an increase in analysts’ entrepreneurial activity
when sectors are “hot.”
19 We run a robust cluster probit regression model on the panel data set with individual analysts
as clusters. The probit robust cluster model regression is particularly robust to assumptions
about within-cluster correlation (Greene 2000). We have tested the alternative specification of
random effects for the probit regressions. The results of the two specifications are quite similar.
Because there are 45 moves to entrepreneurship among the 9,531 analyst-year
observations, we implemented the procedures suggested in King and Zeng (1999a; 1999b) for
generating approximately unbiased and lower-variance estimates of logit coefficients (available

33
only for logit models) and their variance-covariance matrix by correcting for small samples and
rare events. Regression results are similar to the robust cluster probit models (we only report the
latter).
20 The number of observations decreases with the introduction of the analyst demographic
variables (AnalystExperience and AnalystJobs). Even after using multiple sources to collect the
experience information, analyst experience and analyst job data were available for 8,112 analyst-
year combinations (85 percent). Thus, to properly test whether analyst stardom has an effect on
analysts’ mobility, we rerun models in columns (1) through (2) of Table 3 without the
AnalystExperience and AnalystJobs variables. The new regressions have similar results to the
respective models in Table 3.
21 Previous studies have found that the wealth of the agent affects the probability of becoming an
entrepreneur. Wealth would be positive related to riskier decisions such the one of becoming an
entrepreneur. However, other studies did not find that correlation. Indeed, in their study on
Indian farmers, Foster and Rosensweig (1995) find that change from one crop to a riskier crop
could not be explained by wealth effects. Instead, it is explained by their ability of dealing with
external markets. Although, our model does not include variables that capture the financial
position of the analyst (because there is no information available on the personal wealth of
analysts), we believe that the decision of becoming an entrepreneur in a talent based occupation
is closer to the idea of mastering the environment instead of triggered by the comfort of a
wealthy position. New ventures in a professional setting do not require great investments; it
requires a great deal of personal confidence and client/market understanding
22 A nominal dependent variable can be analyzed via multinomial logistic regression. Whereas
recent results on simulation of multinormal integrals have made the estimation of the

34
multinomial probit more feasible, the computational problems still persist. Although there are
theoretical differences between logit and probit methodologies, probit and logit yield results that
are essentially indistinguishable from each other, and the choice of one over the other appears to
make virtually no differences in practice (Greene 2000). We find that the estimates from the
binary regression are close to those from the multinomial logit model. Thus, we use a probit
model to estimate our equations with the reference group being analysts who did not move.
23 We find appropriate to use a probit model instead of a hazard rate model given the way we
have defined the survival variable. The hazard rate is the conditional likelihood that firm failure
occurs at duration time t, given that it has not occurred in the duration interval (0,t). In contrast,
a probit model considers the likelihood that firm failure occurs during the study period (ignoring
the duration of the interval). In other words, the probit model considers whether the firm will
fail during the study period, rather than when the firm will fail. We are interested on the
probability of survival of the firm three years after founding.
24 There were no acquisitions of new ventures by other companies. All exits of new ventures in
our study include the discontinuation of ventures, an indicator of business failure.
25 Selection effect mechanisms may be driving this result. That is, stars are in a position to select
more promising projects that had a priori higher chances to survive independent of analyst’s
ability per se. Further, high ability analysts may leverage their industry contacts to attract talent
to the new venture (traders, analysts, and salesmen) as well as clients. For instance, Dorfman
(1974) reports “When Andrew Zunser, a top rated insurance analysts, decided to set up his own
firm, he checked with his major accounts and 90 percent of them agreed to go along with him if
he went out on his own, with the remaining 10 percent not closing the doors.”
Probability of becoming an entrepreneurEntrepreneurialChoice 9531 0.005 0.069 0 1
Probability of movingEntrepreneurialMovesa 7799 0.006 0.076 0 1OtherMovesb 9486 0.183 0.386 0 1
Analyst variables- Stardom variables
AnalystStar 9531 0.358 0.479 0 1AnalystAllStar 9531 0.210 0.407 0 1
- Demographic & career variablesAnalystGender 9531 0.765 0.424 0 1AnalystExperience 8112 7.625 5.980 0.003 57.823AnalystJobs 8112 1.585 0.855 1 6
Research department variablesDepartmentQuality 9531 30.832 15.810 0 58
Firm variablesFirmDummy 9531 - - 1 24FirmPerformance 9037 0.252 1.201 -1.000 14.250
Sector variablesSectorDummy 9531 - - 1 80SectorSize 9531 136.813 85.427 1 492
Security industry & macroeconomic performanceS&P500Performance 9531 0.113 0.131 -0.091 0.289YearDummy 9531 - - 1 9
Analyst variables- Stardom variables
AnalystStar 45 0.622 0.490 0 1- Demographic variables
AnalystGender 45 0.933 0.252 0 1AnalystExperience 45 8.609 6.205 0.764 24.600
Macroeconomic performance variablesS&P500Performance (t=0 to t=+3) 45 0.584 0.358 0.101 1.208a Excludes other movesb Excludes moves to entrepreneurship
Table 1 . Descriptive Statistics of Entrepreneurial Turnover Dataset
A. Variables
Class VariableNumber of
observations MeanStandard deviation Minimum Maximum
B. New Venture Survival Variables
Class VariableNumber of
observations MeanStandard deviation Minimum Maximum
36
Ana
lyst
Star
= 1
Turn
over
rate
(per
cent
)
Ana
lyst
Star
= 0
Turn
over
rate
(per
cent
)
Ana
lyst
Star
= 1
Turn
over
rate
(per
cent
)
Ana
lyst
Star
= 0
Turn
over
rate
(per
cent
)
Ana
lyst
Star
= 1
Turn
over
rate
(per
cent
)
Ana
lyst
Star
= 0
Turn
over
rate
(per
cent
)
1988 1008 392 7 1.8 1 0.2 39 9.9 113 18.3 46 11.7 114 18.51989 984 385 2 0.5 1 0.2 28 7.3 175 29.2 30 7.8 176 29.41990 894 369 3 0.8 2 0.4 40 10.8 124 23.6 43 11.7 126 24.01991 925 386 4 1.0 3 0.6 41 10.6 98 18.2 45 11.7 101 18.71992 986 393 1 0.3 2 0.3 38 9.7 104 17.5 39 9.9 106 17.91993 1097 435 2 0.5 0 0.0 44 10.1 144 21.8 46 10.6 144 21.81994 1168 430 4 0.9 3 0.4 62 14.4 201 27.2 66 15.3 204 27.61995 1159 306 1 0.3 3 0.4 33 10.8 180 21.1 34 11.1 183 21.51996 1310 312 4 1.3 2 0.2 32 10.3 236 23.6 36 11.5 238 23.8
Total 9531 3408 28 0.8a 17 0.3 357 10.5a 1375 22.5 385 11.3a 1392 22.7a AnalystStar = 1 and AnalystStar = 0 columns have different means at .05 level of significance.
Yea
r
Ana
lyst
s
Ana
lyst
Star
= 1
EntrepreneurialMoves OtherMoves MovesAll
Table 2 . Stardom and Mobility of Analysts

37
Class Variable[dF/dx] [dF/dx] [dF/dx]
Analyst variables
- StardomAnalystStar 0.389 *** 0.007a 0.376 *** 0.005a
(0.150) (0.132)AnalystAllStar 0.338 ** 0.006a
(0.143)- Demographic variables
AnalystGender 0.386 ** 0.005a 0.430 ** 0.004a 0.416 ** 0.004a
(0.197) (0.187) (0.189)AnalystExperience -0.012 0.000 -0.008 0.000 -0.005 0.000
(0.022) (0.021) (0.022)AnalystExperience2 0.000 0.000 0.000 0.000 0.000 0.000
(0.001) (0.001) (0.001)AnalystJobs 0.089 0.001 0.103 * 0.001 0.107 * 0.001
(0.064) (0.060) (0.060)
Research department variablesDepartmentQuality -0.002 0.000 -0.002 0.000
(0.004) (0.003)
Firm variablesFirm Dummy yes
FirmPerformance -0.055 -0.001 -0.057 -0.001(0.039) (0.039)
Sector variablesSector Dummy yes
SectorSize 0.001 0.000 0.001 0.000(0.001) (0.001)
Macroeconomic performanceYear Dummy yes
S&P500Performance -0.437 -0.005 -0.517 -0.007(0.472) (0.474)
Constant -3.204 *** -3.115 ***(0.244) (0.248)
Log (likehood) -219.534 -254.482 -255.614No. of observations 4563 7712 7712
*statistically significant at the .10 level; ** at the .05 level; *** at the .01 level.
Note.- Robust standard errors are in parentheses and are adjusted for intra-analyst correlation of the errors. a dF/dx is for discrete change of the dummy variable from 0 to 1.
Table 3 . The Effect of Stardom on the Probability of Moving to Entrepreneurship
Coefficient Coefficient Coefficient(1) (2) (3)
38
[dF/dx] [dF/dx] [dF/dx] [dF/dx] [dF/dx] Coefficient [dF/dx]Analyst variables
- StardomAnalystStar 0.388 *** 0.008a 0.362 *** 0.006a -0.207 *** -0.044a -0.223 *** -0.050a
(0.151) (0.134) (0.043) (0.042)AnalystAllStar 0.319 ** 0.006a -0.316 *** -0.066a
(0.144) (0.052)- Demographic variables
AnalystGender 0.380 * 0.005a 0.419 ** 0.005a 0.407 ** 0.005a -0.197 *** -0.046a -0.178 *** -0.043a -0.169 *** -0.040a
(0.202) (0.191) (0.193) (0.044) (0.042) (0.042)AnalystExperience -0.014 0.000 -0.010 0.000 -0.007 0.000 -0.030 *** -0.007 -0.031 *** -0.007 -0.030 *** -0.007
(0.022) (0.022) (0.022) (0.008) (0.007) (0.007)AnalystExperience2 0.000 0.000 0.000 0.000 0.000 0.000 0.001 ** 0.000 0.001 ** 0.000 0.001 ** 0.000
(0.001) (0.001) (0.001) (0.000) (0.000) (0.000)AnalystJobs 0.095 0.001 0.112 * 0.002 0.117 * 0.002 0.051 ** 0.011 0.086 *** 0.020 0.083 *** 0.019
(0.065) (0.061) (0.060) (0.021) (0.020) (0.021)
Research department variablesDepartmentQuality -0.004 0.000 -0.003 0.000 -0.009 *** -0.002 -0.009 *** -0.002
(0.004) (0.004) (0.001) (0.001)
Firm variablesFirm Dummy yes yes
FirmPerformance -0.062 -0.001 -0.064 -0.001 -0.041 ** -0.009 -0.040 ** -0.009(0.039) (0.039) (0.016) (0.016)
Sector variablesSector Dummy yes yes
SectorSize*100 0.076 0.001 0.066 0.001 -0.013 -0.003 -0.014 -0.003(0.060) (0.061) (0.021) (0.021)
Macroeconomic performanceYear Dummy yes yes
S&P500Performance -0.457 -0.007 -0.529 -0.008 -0.061 -0.014 -0.029 -0.007(0.478) (0.480) (0.138) (0.136)
Constant -3.094 *** -3.011 *** -0.442 *** -0.472 ***(0.248) (0.253) (0.075) (0.075)
Log (likehood) -212.89 -247.94 -249.02 -3219.56 -3181.64 -3176.57No. of observations 3893 6531 6531 8032 7669 7669
*statistically significant at the .10 level; ** at the .05 level; *** at the .01 level.Note.- Robust standard errors are in parentheses and are adjusted for intra-analyst correlation of the errors. a dF/dx is for discrete change of the dummy variable from 0 to 1.
(3) (4)
Table 4 . The Effect of Stardom on Analysts' Transition Probability
Coefficient Coefficient Coefficient Coefficient CoefficientClass Variable
Dependent variable
(5) (6)OtherMovesEntrepreneurialMoves
(1) (2)
39
Class Variable dF/dxAnalyst variables- Stardom
AnalystStar 1.094 ** 0.405a
(0.508)- Demographic variables
AnalystGender 0.313 0.121a
(0.740)AnalystExperience -0.006 -0.002
(0.031)Macroeconomic performance
S&P500Performance (t=0 to t=+3) 1.751 *** 0.695(0.670)
Constant -2.048 *(1.114)
Log Likelihood -25.311Number of observations 45*statistically significant at the .10 level; ** at the .05 level; *** at the .01 level.a dF/dx is the marginal increase due to a given variable controlling for every other variables.
Table 5 . The Effect of Stardom on the Probability of Firm Survival
Coefficient