does monetary policy influence economic growth in...
TRANSCRIPT

African Economic and Business Review Vol. 12, No. 1, Spring 2014.
ISSN 1109-5609
© 2014 The African Education and Business Research Institute, Inc.
1
Does Monetary Policy Influence Economic
Growth in Nigeria?
*FASANYA, Ismail O., **ONAKOYA, Adegbemi B.O, ***AGBOLUAJE Mariam A. *University of Ibadan, **Tai Solarin University of Education, ***Fountain University,
Abstract
This study examines the impact of monetary policy on economic growth in Nigeria.
The study uses time-series data covering the range of 1975 to 2010. The effects of
stochastic shocks of each of the endogenous variables are explored using Error
Correction Model (ECM). The study shows that Long run relationship exists among
the variables. Also, the core finding of this study shows that inflation rate, exchange
rate and external reserve are significant monetary policy instruments that drive
growth in Nigeria. It is therefore recommended that the establishment of primary and
secondary government bond markets that can also increase the efficiency of monetary
policy and reduce the government’s need to rely on the central bank for direct
financing.
Introduction
Since its establishment in 1959, the Central Bank of Nigeria (CBN) has
continued to play the traditional role expected of a central bank, which is the
regulation of the stock of money in such a way as to promote the social welfare. This
role is anchored on the use of monetary policy that is usually targeted towards the
achievement of full-employment equilibrium, rapid economic growth, price stability,
and external balance. Over the years, the major goals of monetary policy have often
been the two later objectives. Thus, inflation targeting and exchange rate policy have
dominated CBN’s monetary policy focus based on assumption that these are essential
tools of achieving macroeconomic stability (Ajayi, 1999).
Folawewo and Osinubi (2006) describes monetary policy as a combination of
measures designed to regulate the value, supply and cost of money in an economy, in
consonance with the expected level of economic activity. For most economies, the
objectives of monetary policy include price stability, maintenance of balance of
payments equilibrium, promotion of employment and output growth, and sustainable

African Economic and Business Review Vol. 12, No. 1, Spring 2014.
ISSN 1109-5609
© 2014 The African Education and Business Research Institute, Inc.
2
development. These objectives are necessary for the attainment of internal and
external balance, and the promotion of long-run economic growth.
Evidence in the Nigerian economy has shown that since the 1980’s some
relationship exist between the stock of money and economic growth or economic
activity. Over the years, Nigeria has been controlling her economy through variation
in her stock of money. Consequent upon the effect of the collapse of oil price in 1981
and the B.O.P deficit experienced during this period, various methods of stabilization
ranging from fiscal to monetary policies were used. Interest rates were fixed and
these were said to be beneficial to big borrower farmers (Ojo, 1989). Ikhide and
Alawode (1993) while evaluating the effect of Structural Adjustment Programme
(SAP) concluded that reducing money stock through increased interest rates would
lower gross National product. Thus, the notion that stock of money varies with
economic activities applies to the Nigerian economy (Laidler, 1993).
Tradable economic activities are "special" in developing countries. These
activities suffer disproportionately from the institutional and market failures that keep
countries poor. Sustained real exchange rate depreciations increase the relative
profitability of investing in tradable, and act in second-best fashion to alleviate the
economic cost of these distortions. That is why episodes of undervaluation are
strongly associated with higher economic growth. There exist a unique long-run
relationship between interest rates and economic growth. Thus, interest rate is an
important determinant of economic growth in Nigeria. However, the deregulation of
interest rates in Nigeria may not optimally achieve its goals, if those other factors
which negatively effects investment in the country, as suggested by Guseh and
Oritsejafor (2007), are not tackled.
The main thrust of this study is to evaluate the effectiveness of the CBN’s
monetary policy over the years. This would go a long way in assessing the extent to
which the monetary policies have impacted on the growth process of Nigeria using
the major objectives of monetary policy as yardstick. The remainder of the paper is
organized as follows. Section two deals with the literature review. In Section three,
the methodological framework of the study is pursued while the empirical results are
discussed in section four. Section five concludes the paper.

African Economic and Business Review Vol. 12, No. 1, Spring 2014.
ISSN 1109-5609
© 2014 The African Education and Business Research Institute, Inc.
3
Literature Review
For middle-income economies, the empirical literature shows that monetary
policy shocks have some modest effects on economic parameters. Ganev et al. (2002)
for example, studied the effects of monetary shocks in ten Central and Eastern
European (CEE) countries and find no evidence that suggests that changes in interest
rates affect output, but find some indication that changes in the exchange rate does. In
the same spirit, Starr (2005) using an SVAR model with orthogonalized identification
find little evidence of real effects of monetary policy in five Commonwealth of
Independent States (CIS) with the notable exception that interest rate have a
significant impact on output in Russia.
The evidence that is inconsistent with theoretical expectations returned from
different investigations in different countries is what economist usually refers to as
“puzzles”. The three most common puzzles identified in the literature are; the
liquidity puzzle, the price puzzle and the exchange rate puzzle. The liquidity puzzle is
a finding that an increase in monetary aggregates is accompanied by an increase
(rather than a decrease) in interest rates. While the price puzzle is the finding that
contractionary monetary policy through positive innovations in the interest rate seems
to lead to an increase (rather than a decrease) in prices. And yet, the most common in
open economies is the exchange rate puzzle, which is a finding that an increase in
interest rate is associated with depreciation (rather than appreciation) of the local
currency. In contemporary studies, researchers have devised convenient ways of
eradicating these puzzles. Most of them now follow the framework set by Lucas
(1972) who recommended the incorporation of rational expectations in the studies of
the effects of monetary policy. Some recent investigations that follow this approach
include: Khan et al. (2002); Brument and Dincer (2008); Cochrane (1998); and Zhang
(2009).
In developed economies, such as the United States (U.S) and some core
European countries, there is substantial evidence of the effectiveness of monetary
policy innovations on real economic parameters (see also, Mishkin, (2002);
Christiano et al.,(1999); Rafiq and Mallick, 2008 and Bernake et al., (2005).
However, for developing countries like Nigeria, the evidence is weak and full of
“puzzles”. For example, Balogun (2007) used simultaneous equation models to test
the hypothesis of monetary policy ineffectiveness in Nigeria and find that, rather than
African Economic and Business Review Vol. 12, No. 1, Spring 2014.
ISSN 1109-5609
© 2014 The African Education and Business Research Institute, Inc.
4
promote growth; erstwhile domestic monetary policy was the source of stagnation
and persistent inflation. Similar evidence was also found for The Gambia, Guinea,
Ghana and Sierra Leone using the same models.
Ajisafe and Folorunso (2002) examined the relative effectiveness of
monetary and fiscal policy on economic activity in Nigeria using co-integration and
error correction modelling techniques and annual series for the period 1970 to 1998.
The study revealed that monetary rather than fiscal policy exerts a greater impact on
economic activity in Nigeria and concluded that emphasis on fiscal action by the
government has led to greater distortion in the Nigerian economy. Adebiyi (2006)
investigated financial sector reforms, interest rate policy and the manufacturing sub-
sector in Nigeria, using vector auto-regression and error correction mechanism
(ECM) technique with quarterly time series spanning 1986:1 to 2002:4. Unit root and
co-integration test were also performed. The study revealed that the real deposit rate
and inflation rate are significant for the growth of the manufacturing sub-sector in
Nigeria. In addition, the study revealed that the predominant sources of fluctuation in
the index of manufacturing production are due largely to own shock and to a lesser
extent, to real deposit rate. The study also showed that in the long run the index of
manufacturing production is insensitive to inflation rate, commercial banks’ credit to
the manufacturing sector, interest rate spread and exchange rate. Folawewo and
Osinubi (2006) examined the efficacy of monetary policy in controlling inflation rate
and exchange instability. The analysis performed was based on a rational expectation
framework that incorporates the fiscal role of exchange rate. Using quarterly data
spanning over 1980:1 to 2000:4 and applying times series test on the data used, the
study showed that the effects of monetary policy at influencing the finance of
government fiscal deficit through the determination of the inflation-tax rate affects
both the rate of inflation and exchange rate, thereby causing volatility in their rates.
The study revealed that inflation affects volatility in its own rate, as well as the rate of
real exchange. Bogunjoko (1997) analyzed the efficacy of monetary policy as a
stabilization tool, using modified St. Louis model to take account of the peculiarity of
the Nigeria economy. Using an error correction model and data covering the period
1970 to 1993; the study found that money matters in Nigeria economy and the
appropriate monetary target is the domestic credit of the banking sector.

African Economic and Business Review Vol. 12, No. 1, Spring 2014.
ISSN 1109-5609
© 2014 The African Education and Business Research Institute, Inc.
5
A recent study by Chimobi and Uche (2010) examined the relationship
between Money, Inflation and Output in Nigeria. The study adopted co-integration
and granger-causality test analysis. The co-integrating result of the study showed that
the variables used in the model exhibited no long run relationship among each other.
Nevertheless money supply was seen to granger cause both output and inflation. The
result of the study suggested that monetary stability can contribute towards price
stability in the Nigerian economy since the variation in price level is mainly caused
by money supply and concluded that inflation in Nigeria is to an extent a monetary
phenomenon. Furthermore, the findings of the study support the money-prices-output
hypothesis for Nigerian economy. Obviously, the empirical studies on monetary
policy and real output growth in Nigeria is still scanty.
Methodology and Data
The Keynesian IS-LM function serves as a platform on which the empirical
model is formulated as follows. Following McCallum (1991), the following equation
is then derived;
RGDPt = αo + α1M2t + α2IR t+ α3Inf t+ α4REERt + α5ERt + et (1)
Where RGDP refers to real gross domestic product; M2 is money supply; IR is
interest rate; INF is inflation rate; REER is real exchange rate; ER is external reserve;
e is the error term.
In order to develop strong, robust and reliable models that capture the
relationship between monetary policy variables and economic growth, the research
work adopts the econometric techniques of the Error Correction Term (ECT) as the
estimation technique. The method of ECT is extensively used in regression analysis
primarily because it is initiatively appealing and mathematically much simpler than
any other econometric technique (Gujarati, 2003). The error correction term indicates
the speed of the adjustment which restores equilibrium in the dynamic model.
∆𝑅𝐺𝐷𝑃𝑡 = 𝛼0 + ∑ 𝛼1𝑖𝑗𝑖=1 ∆𝑅𝐺𝐷𝑃𝑡−𝑖 + ∑ 𝛼2𝑖
𝑗𝑖=1 ∆𝑀2𝑡−𝑖 + ∑ 𝛼3𝑖
𝑗𝑖=1 ∆𝐼𝑅𝑡−𝑖 +
∑ 𝛼4𝑖𝑗𝑖=1 ∆𝐼𝑁𝐹𝑡−𝑖 + ∑ 𝛼5𝑖
𝑗𝑖=1 ∆𝑅𝐸𝐸𝑅𝑡−𝑖 + ∑ 𝛼6𝑖
𝑗𝑖=1 ∆𝐸𝑅𝑡−𝑖 + 𝛼7𝑖𝐸𝐶𝑀𝑡−1 + 𝑈𝑡 (2)
As this study involves time series data, the ordinary least square (OLS)
method cannot be applied unless it is established that the variables concerned are
stationary. For this paper, we have applied unit root test to check the stationarity of
the variables under study. Specifically, the Augmented Dickey-Fuller (ADF) and
African Economic and Business Review Vol. 12, No. 1, Spring 2014.
ISSN 1109-5609
© 2014 The African Education and Business Research Institute, Inc.
6
Phillip-Perron test (PP) are used; the ADF and PP are used to avoid spurious
regression thereby subjecting each of the variables used to unit root test so as to
determine their orders of integration since unit root problem is a common feature of
most time series data.
In order to test the implications of our model, we collected an aggregate data on
variables of interest on Nigeria. The entire data set of Nigeria for which all relevant
variables are reported over the 1975–2010 period. The data used are obtained from
the Central Bank of Nigeria (CBN) statistical bulletin 2010.
Empirical Result
Descriptive Statistics
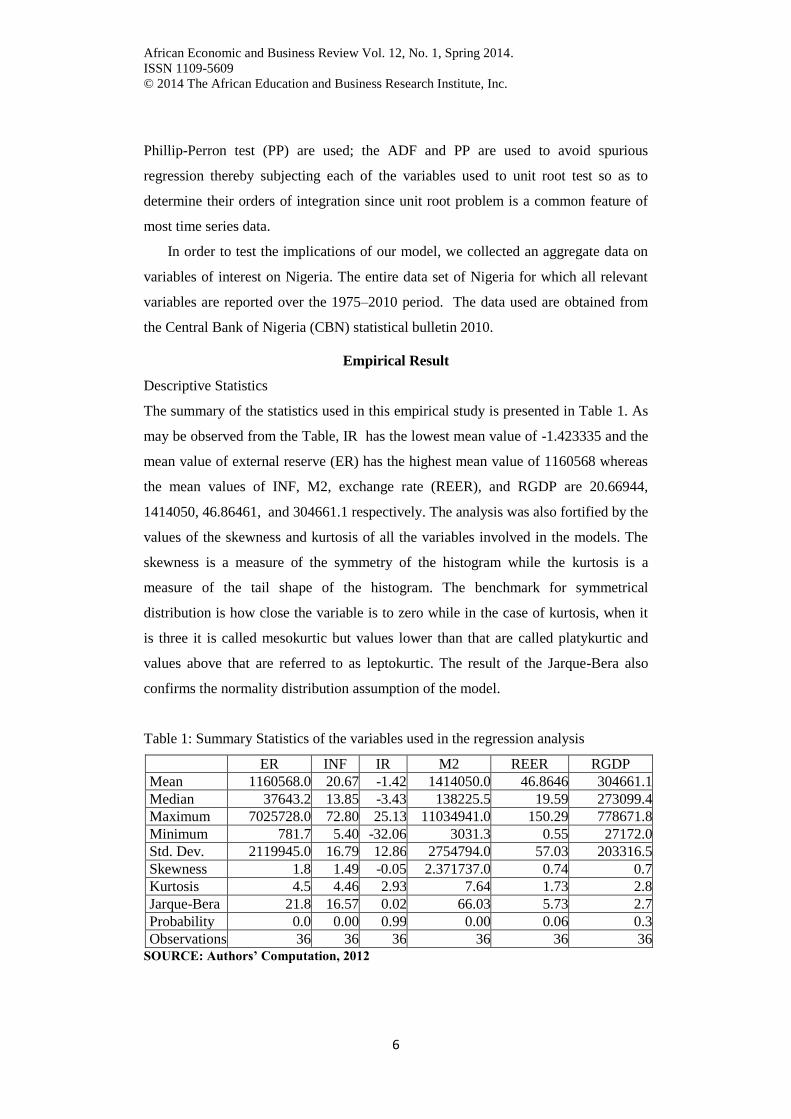
The summary of the statistics used in this empirical study is presented in Table 1. As
may be observed from the Table, IR has the lowest mean value of -1.423335 and the
mean value of external reserve (ER) has the highest mean value of 1160568 whereas
the mean values of INF, M2, exchange rate (REER), and RGDP are 20.66944,
1414050, 46.86461, and 304661.1 respectively. The analysis was also fortified by the
values of the skewness and kurtosis of all the variables involved in the models. The
skewness is a measure of the symmetry of the histogram while the kurtosis is a
measure of the tail shape of the histogram. The benchmark for symmetrical
distribution is how close the variable is to zero while in the case of kurtosis, when it
is three it is called mesokurtic but values lower than that are called platykurtic and
values above that are referred to as leptokurtic. The result of the Jarque-Bera also
confirms the normality distribution assumption of the model.
Table 1: Summary Statistics of the variables used in the regression analysis
ER INF IR M2 REER RGDP
Mean 1160568.0 20.67 -1.42 1414050.0 46.8646 304661.1
Median 37643.2 13.85 -3.43 138225.5 19.59 273099.4
Maximum 7025728.0 72.80 25.13 11034941.0 150.29 778671.8
Minimum 781.7 5.40 -32.06 3031.3 0.55 27172.0
Std. Dev. 2119945.0 16.79 12.86 2754794.0 57.03 203316.5
Skewness 1.8 1.49 -0.05 2.371737.0 0.74 0.7
Kurtosis 4.5 4.46 2.93 7.64 1.73 2.8
Jarque-Bera 21.8 16.57 0.02 66.03 5.73 2.7
Probability 0.0 0.00 0.99 0.00 0.06 0.3
Observations 36 36 36 36 36 36 SOURCE: Authors’ Computation, 2012

African Economic and Business Review Vol. 12, No. 1, Spring 2014.
ISSN 1109-5609
© 2014 The African Education and Business Research Institute, Inc.
7
Table 2: Augmented-Dickey Fuller (ADF) Test
Variables
ADF Values
Mackinnon Critical
Values
Order of
Integration
RGDP -5.0684* -3.6394 I(1)
M2 -8.5592* -3.6463 I(2)
IR -4.7782* -3.6329 1(0)
INF -3.0159** -2.9484 I(0)
REER -5.4396* -3.6394 I(1)
ER -3.0267** -2.9810 I(0) Source: Computed by the Authors’, 2012
Note: One, two and three asterisk denotes rejection of the null hypothesis at 1%, 5%
and10% respectively based on Mackinnon critical values.
Table 2 shows that real GDP and exchange rate variables are stationary at
first difference and inflation, interest rate and external reserve are stationary at levels
except for money supply that was stationary at second difference. This means all the
variables are integrated of order 0 and 1.
Table 3: Phillip-Perron Test (PP)
Variables/Coefficients
PP Values
Mackinnon
Critical Values
Order of
Integration
RGDP -5.0647* -3.6394 I(1)
M2 -8.9644* -3.6463 I(2)
IR -4.7566* -3.6329 I(0)
INF -3.0822** -2.9484 I(0)
REER -5.4387* -3.6394 I(1)
ER -4.1411* -3.6394 I(1) Source: Computed by the Authors’, 2012
Note: One, two and three asterisk denotes rejection of the null hypothesis at 1%, 5%
and10% respectively based on Mackinnon critical values
Co integration Analysis Result and Interpretation
In determining the number of cointegrating vectors, trace test and maximum
eigenvalue test using the more recent critical values of Mackinon-Haug-Michelis
(1999) was applied. The assumption of no deterministic trend and restricted constant
was for all the variables. The choice was tested using (AIC) and Schwartz
Information Criterion (SIC). The result for both trace test and maximum eigenvalue
for unrestricted cointegration rank test are presented in Table 4.

African Economic and Business Review Vol. 12, No. 1, Spring 2014.
ISSN 1109-5609
© 2014 The African Education and Business Research Institute, Inc.
8
Table 4: Johansen-Juselius Cointegration Test Results
Hypothesized
No. of CE(s)
Eigen
value
Max-Eigen
value
Critical
value
Trace
statistic
Critical
Value
5 percent 5 percent
None 0.906137 80.44125* 40.07 196.2915* 95.75
At most 1 0.767217 49.56007* 33.87 115.8502* 69.81
At most 2 0.659370 36.61662* 27.58 66.29013* 47.85
At most 3 0.457218 20.77562 21.13 29.67352 29.79
At most 4 0.192329 7.262419 14.26 8.897894 15.49
At most 5 0.046964 1.635474 3.84 1.635474 3.84
Source: Computed by the Authors’, 2012
*(*) denotes rejection of the hypothesis at the 5 % (0.05) level
It can be observed from Table 4 that both Trace test statistic and the Max-
Eigenvalue test indicate three cointegrating equation at 5% level of significance.
Based on the evidence above, we can safely reject the null hypothesis (H0) which says
that there are no cointegrating vectors and conveniently accept the alternative
hypothesis of the presence of cointegrating vectors. Thus, we can conclude that a long
run relationship exists among the variables. This result means that in Nigeria’s case,
the hypothesis of no cointegration among the variables should be rejected.
Model Estimation Issues and Discussion of Result
The result of the cointegration test reveals that more than one cointegrating
vectors exist among the variables of interest. This means that we can estimate the
Error Correction Model. An Error Correction Model is designed for use with non-
stationary series that are known to be cointegrated. The ECM has cointegration
relations built into the specification so that it restricts the long-run behavior of the
endogenous variables to converge to their cointegrating relationships while allowing
for short-run adjustment dynamics. The use of the methodology of cointegration and
ECM add more quality, flexibility and versatility to the econometric modeling of
dynamic systems and the integration of short-run dynamics with the long-run
equilibrium. The Error Correction Models were evaluated using the conventional
diagnostic tests and the Akaike Information Criterion (AIC) was adopted in choosing
the appropriate lag length. The model with the lowest (AIC) was adopted. The results
are of the cointegrating relationship amongst the variables within the ECM
framework are presented in Table 5 below:

African Economic and Business Review Vol. 12, No. 1, Spring 2014.
ISSN 1109-5609
© 2014 The African Education and Business Research Institute, Inc.
9
Table 5: Parsimonious Error Correction Estimates
Dependent Variable: D(LOG(RGDP))
Method: Least Squares
Variable Coefficient Std. Error t-Statistic Prob.
D(LOG(RGDP(-1))) 0.290213 0.221697 1.309050 0.2047
D(LOG(RGDP(-2))) 0.536475 0.224863 2.385791* 0.0145
D(LOG(M2(-2))) -0.259121 0.336113 -0.770934 0.4493
D(IR(-1)) -0.004496 0.004885 -0.920426 0.3678
D(IR(-2)) -0.001595 0.005116 -0.311660 0.7584
D(INF(-1)) 0.011361 0.005179 2.193713** 0.0396
D(INF(-2)) 0.003184 0.004364 0.729591 0.4737
D(LOG(REER(-1))) -0.255454 0.187875 -1.359705 0.1883
D(LOG(REER(-2))) -0.371610 0.230463 -1.612451*** 0.1018
D(LOG(ER(-1))) 0.420007 0.125403 3.349270* 0.0030
D(LOG(ER(-2))) 0.379324 0.118384 3.204173* 0.0043
ECM(-1) -0.594604 0.210949 -2.818715* 0.0103
R-squared 0.435358
Adjusted R-squared 0.139592
Durbin-Watson stat 2.046864
Source: Computed by the Authors’, 2012
Note: One, two and three asterisk denotes rejection of the null hypothesis at 1%, 5% and 10%
respectively.
Given the results of the cointegration test which revealed the existence of
cointegration among variables in the economic growth models, dynamic error
correction model (ECM) is considered appropriate for the analysis. This analysis on
the effect of monetary policy on economic growth is presented in the table above. The
result obtained from the dynamic model indicates that the overall coefficient of
determination (R2) shows that 43.53 percent of growth rate of RGDP is explained by
the variables in the equation. As the adjusted (R2) tends to purge the influence of the
number of included explanatory variables, the adjusted R2 of 0.1395 shows that
having removed the influence of the explanatory variables, the dependent variable is
still explained by the equation with 13.95 percent. The Durbin Watson (D.W)
statistics of 2.04 was not substantially farther away from the traditional benchmark of
2.0 in the mode, the study can conclude that there is no of sign auto- correlation or
serial correlation in the model specification; hence the assumption of linearity is not
violated.
In terms of the signs and magnitude of the coefficients which signify the
effect of monetary policy on economic growth, it was observed from the model that
interest rate (IR), external reserve (ER) and exchange rate (REER) had their expected

African Economic and Business Review Vol. 12, No. 1, Spring 2014.
ISSN 1109-5609
© 2014 The African Education and Business Research Institute, Inc.
10
signs while money supply (M2) and inflation rate (INF) had signs contrary to a’priori
theoretical expectation. In addition to the above, the coefficient of individual
variables is examined to determine the nature of the relationship between monetary
policy and other macroeconomic variables. The co-efficient of external reserve was
observed to be positive and significant while the coefficient of interest rate and
exchange rate was observed to be negative and significant.
From the table, a unit change in previous RGDP brings about 53.6 percent
growth increases in present RGDP at 1% significance level. Also, a unit change in
inflation brings about 1 percent increase in output level at 5% significance level
which showed a positive impact on economic growth but does not conform to the
theoretical expectation. A unit change in exchange rate brings about 37.1 percent
decrease in economic growth and it is significant at 10% while a unit change in
external reserve brings about an increase in real GDP at a significant level of 1%.
Contrary to the above, the coefficients of both money supply and inflation
rate were observed to be insignificant. The significant relationship between interest
rate, exchange rate and external reserve reflect the potency of the variables as an
important conduct in transmitting monetary policy impulses to the aggregate
economy. In contrast, the insignificant relationship between money supply and
inflation in Nigeria, suggest that monetary policy as a policy option had been inactive
in influencing these macroeconomic variables. This could step from the dominance of
fiscal measures especially government expenditures in stimulating such
macroeconomic variables. More so, the insignificant relationship between these
variables could be explained by the underdeveloped nature of the financial
institutions in transmitting monetary policy to the ultimate variables in the economy
which is usually economic growth and price stability. The insignificant effect of
inflation is a consequence of the autonomy that is granted monetary authority in the
management of price instability in Nigeria and also the various policy initiatives that
have been adopted (such as financial regulation, interest rate and exchange rate
deregulation and inflation targeting) to mitigate price instability in Nigeria.
The results confirm that growth of RGDP in Nigeria has an automatic
mechanism and that RGDP growth in Nigeria responds to deviations from
equilibrium in a balancing manner. A value of (-0.5946) for the ECM coefficients
suggests that a fast speed of adjustment strategy of roughly 59.46%. Empirical

African Economic and Business Review Vol. 12, No. 1, Spring 2014.
ISSN 1109-5609
© 2014 The African Education and Business Research Institute, Inc.
11
analysis result also supports growing evidence that monetary policy exerts significant
effect on interest rate, exchange rate, external reserve according to the confirmed
result earlier by Asogu (1998) and Ubogu (1985), making the assumption that the
Central Bank cannot observe unexpected changes in output level within the same
period.
Conclusion
It has been established in this study that monetary policies implemented in
Nigeria depended on major policy instrument such as interest rates, exchange rate,
external reserve, and monetary base. This study also evaluates the impact of monetary
policy variables within the institutional framework and basic theoretical model on
economic growth.
Overall, the study found evidence that monetary policy innovations have both
real and nominal effects on economic parameter depending on the policy variable
selected. The study notes that monetary policy implementation in a developing
country like Nigeria faces additional challenges that are not present in developed
economies; such has fiscal dominance and the treat of currency substitution.
This study conclude therefore that the inability of monetary policies to
effectively maximize its policy objective most times is as a result of the shortcomings
of the policy instruments used in Nigeria as such limits its contribution to growth
even though monetary policies had brought impressive contribution over the years.
References
Adebiyi, M. A. (2006). Financial sector reforms and the transmission mechanism of
monetary policy in Nigeria: A Vector Auto-regression Mechanism, China
Finance Research Network (CFRN).
Ajayi, I. (1999). Evolution and functions of Central Banks. Central Bank of Nigeria
Economic and Financial Review, 37(4): 11-27.
Ajisafe, R. A., & Folorunso, B. (2002). The relative effectiveness of fiscal and
monetary policy in macroeconomic management in Nigeria, The African
Economic and Business Review, 3(1), 23-40.
Asogu, J. O. (1998). An econometric analysis of relative potency of monetary policy
in Nigeria. Economic Financial Review, 30-63.

African Economic and Business Review Vol. 12, No. 1, Spring 2014.
ISSN 1109-5609
© 2014 The African Education and Business Research Institute, Inc.
12
Balogun, E. (2007). Monetary policy and economic performance of West African
Monetary Zone countries. MPRA Paper No. 3408.
Bernanke, B., Boivin, J., & Eliasz, P. S. (2005). Measuring the effects of monetary
policy: A factor-augmented vector autoregressive (FAVAR) approach. The
Quarterly Journal of Economics, 120(1), 287-422.
Berument, H., & Dincer, N. (2008). Measuring the effects of monetary policy for
Turkey. Journal of Economics Cooperation 29(1) 83-110.
Bogunjoko, J. O. (1997). Monetary dimension of the Nigeria economic crisis.
empirical evidence from a co-integrated paradigm. Nigeria Journal of
Economics and Social Studies, 39(2), 145 – 167.
Central Bank of Nigeria. (2010). Statistical Bulletin. Online edition retrieved from
www.cenbank.org.
Chimobi, O. P., & Uche, U. C. (2010). Money, price and output: A causality test for
Nigeria. American Journal of Scientific Research, 8, 78-87.
Christiano, L., Martin, E., & Charles, E. (1999). Monetary policy shocks: What have
we learned and to what end? In Woodford, M., & John, T. (Eds). The
Handbook of Macroeconomics Vol. 1 North-Holland, Amsterdam, 65 148.
Cochrane, J. (1998). What do the VARS mean? Measuring the output effects of
monetary policy. Journal of Monetary Economics, 41(2), 277-300.
Folawewo, A. O., & Osinubi, T. S. (2006). Monetary policy and macroeconomic
instability in Nigeria: A rational expectation approach. Journal of Social
Sciences, 12(2), 93-100.
Ganev, G., Krisztina, M., Krzysztof, R., & Prsemyslaw, W. (2002). Transmission
mechanism of monetary policy in central and eastern Europe. Report No. 52.
Centre for Social and Economic Research (CASE), Warsaw.
Gujarati, D. N. (2003). Basic Econometrics, 4th ed. New York: McGraw-Hill Higher
Education.
Guseh, J. S., & Oritsejafor, E. (2007). Government size, political freedom and
economic growth in Nigeria, 1960-2000. Journal of Third World Studies.
Ikhide, S. I., & Alawode, A. A. (1993). Financial sector reforms, macroeconomic
instability and the order of economic liberalization: Evidence from Nigeria.
AERC Workshop Paper, Nairobi. May 28-June 4.

African Economic and Business Review Vol. 12, No. 1, Spring 2014.
ISSN 1109-5609
© 2014 The African Education and Business Research Institute, Inc.
13
Kahn, M., Shmuel K., & Oded, S. (2002). Real and nominal effects of central bank
monetary policy. Journal of Monetary Economics. (49), 1493-1519.
Laidler DEW (1993). The Demand for Money: Theories, Evidence and Problems. 4th
Edition, New York: Harper Collins.
Lucas, R. (1972). Expectations and the neutrality of money. Journal of Economic
Theory. 4(2), 103-144.
McCallum, J. (1991). Credit rationing and the monetary transmission mechanism.
American Economic Review, 81(4), 946-51.
MacKinnon, J. (1991). Critical Values for Cointegration Tests in Long-Run
Economic Relationships, edited by R.F. Engle and Granger, Oxford University
Press, pp. 267-76.
Mishkin, F. S. (2002). The role of output stabilization in the conduct of monetary
policy. Working Paper No. 9291. NBER.
Moser, G. (1995). The main determinants of inflation in Nigeria. IMF Staff Papers
42.
Ojo, M. O. (1989). Analysis of some prison data. Journal of Applied Statistics, 16(6),
377-383.
Rafiq, M. S., & Mallick, S. K. (2008). The effect of monetary policy on output in
EMU: A sign restriction approach. Journal of Macroeconomics, 30, 1756-
1791.
Starr, M. (2005). Does money matter in the CIS? Effects of monetary policy on
output and prices. Journal of Comparative Economics, 33, 441-461.
Ubogu, R. E. (1985). Potency of monetary and fiscal policy instruments on economic
activities of African countries. Finafrica: Savings Dev, 9, 440-457.
Zhang, W. (2009). China’s Monetary Policy: Quantity versus Price Rules. Journal of
Macroeconomics. 31, 473-484.

African Economic and Business Review Vol. 12, No. 1, Spring 2014.
ISSN 1109-5609
© 2014 The African Education and Business Research Institute, Inc.
14
Government Spending and Economic Growth: A Revisit of the Nigerian Experience
Maxwell Ekor and Oluwatosin Adeniyi
Centre for the Study of the Economies of Africa, Nigeria
Abstract
Given the continued debate surrounding the effectiveness and efficiency of
government spending in Nigeria, this study adopts a modified Autoregressive
Distributed Lag Model in order to investigate the impact of federal government
spending on economic growth between 1961 and 2010. The main findings are that
government total expenditure and recurrent expenditure have insignificant effect on
real GDP growth irrespective of the lag period. However, capital expenditure has
significant positive effect in the second lagged period. Nevertheless the long run
multiplier of government spending whether total expenditure, capital expenditure
or recurrent expenditure, is negative. This means that in the long run real GDP
growth is slowed by the negative government expenditure multiplier. The policy
implication of the findings is that the quality and efficiency of government spending
remains an issue in Nigeria as theory posits that the multiplier effect of government
spending should be positive even if it is, as usual, lower than private sector
investment multiplier.
Introduction
The effectiveness and efficiency of government spending in Nigeria remains
a topical issue since the public sector remains a key driver of the economy. The
formulation and implementation of the federal government budget, apart from
helping to provide the platform on which government provides the necessary public
goods, also helps the private sector to plan its activities in line with government’s
fiscal policies. Although there is the debate as to the optimum level of government’s
spending needed to boost growth, the consensus is that at some level of
development, the government is needed to facilitate developmental process

African Economic and Business Review Vol. 12, No. 1, Spring 2014.
ISSN 1109-5609
© 2014 The African Education and Business Research Institute, Inc.
15
especially by way of infrastructure provision. Given the developmental challenges
facing Nigeria as a nation, the government’s drive at encouraging private sector
participation through its various reforms should be complemented with effective
and efficient public sector spending. Figure 1 shows that change in total government
expenditure between 1961 and 2010 averaged 27.2%, higher than average inflation
rate of 17.3% in same period. Similarly, the change in total government capital
expenditure averaged 29.5% which is also higher than the average inflation rate in
the period. This implies that in real terms government spending has increased
between 1961 and 2010.
Despite this real increase in government spending Nigeria still faces huge
infrastructure challenges. Therefore, because some aspects of government spending
may affect the economy with a lag, this study aims to empirically investigate the
impact of government expenditure on economic growth using a modified
Autoregressive Distributed Lag Model. This approach differs from most empirical
studies on Nigeria that were reviewed in this study as they mostly applied the
cointegration and causality methodologies. A key brickbat of these approaches
remains the implicit assumption of an instantaneous response mechanism of
economic growth to variations in public expenditure. Hence, a more nuanced view,
which we empirically pursue in this paper, is that economic activity reacts to fiscal
policy stimulus in a rather delayed manner. Thus, contemporaneous output
realizations are more likely linked to immediate historical rather than current
spending patterns. To dig further into this line of thought, therefore, the crux of our
paper is to re-investigate the government spending-economic growth nexus in
Nigeria, while inventively making allowance for possible delay effects.
Sequel to this opening section, the rest of the paper is mapped out as
follows. Section two discusses the empirical literature review on the most recent
and entirely Nigerian studies. The methodology is what section three summarizes
while section four presents the results. Section five discusses the policy implications
of the findings.

African Economic and Business Review Vol. 12, No. 1, Spring 2014.
ISSN 1109-5609
© 2014 The African Education and Business Research Institute, Inc.
16
Empirical literature review
This section reviews some of the studies that have been conducted on the
relationship between government spending and economic growth in Nigeria. As
obtains in the wider literature, the conclusions from the studies on Nigeria remain
inconclusive as the rest of this section demonstrates.
Chimobi (2009) conducted causality and cointegration tests and found no
long-run relationship between government expenditure and national income, while
causality runs from government expenditure to national Income. Babalola and
Aminu (2011) also applied the cointegration approach and investigated the impact
of fiscal policy on economic growth in Nigeria in the period 1977 to 2009. Their key
finding was that productive expenditure positively impacted economic growth with
a long-run relationship existing between them as confirmed by the cointegration
test. Usman (2011) employed a reduced form model in addition to Beta coefficient,
Theil’s inequality and Root Means Square Error (RMSE) techniques to investigate the
stability and effectiveness of fiscal policy in Nigeria. The results reveal that
government spending is a major factor which influences macroeconomic activity in
Nigeria.
Taiwo and Abayomi (2011) examined the trends as well as effects of
government spending on the growth rate of real GDP in Nigeria using the Ordinary
Least Square (OLS) technique. The study found that there is a positive relationship
between real GDP growth and government spending. Olaiya et al. (2012) examined
the causal relationships among economic growth, government expenditure and
inflation rate in Nigeria in the period 1970 to 2010. The study found evidence of co-
integration among the variables, while there is bi-directional causality between
government expenditures and economic growth both in the short run and in the
long run. Also, it was revealed that in the short run a unidirectional causality existed
from economic growth and government expenditure to inflation rate while no
feedback from inflation rate was observed.
While looking at specific government spending, Nurudeen and Usman
(2010) investigated the effect of government expenditure on economic growth by
employing a disaggregated analysis. The results reveal that government total capital

African Economic and Business Review Vol. 12, No. 1, Spring 2014.
ISSN 1109-5609
© 2014 The African Education and Business Research Institute, Inc.
17
expenditures, total recurrent expenditures and government expenditure on
education have negative effect on economic growth. The effect of rising government
expenditure on transport and communication and health results in an increase in
economic growth. Similarly, Usman et al. (2011) investigated the effect of
expenditure on a disaggregated level by focusing on education, health, transport,
and administration using a multivariate time series framework. The results showed
that in the short run public spending has no impact on growth but the cointegration
show that there is long run relationship between public expenditure and growth.
Amassoma et al. (2011) also examined the relationship between the
components of government expenditure (agriculture; education; health and
transport and communication) and economic growth. They found that expenditure
on agriculture had a significant influence on economic growth while expenditure on
education, health and transport and communication had insignificant influence on
economic growth. Nasiru (2012) employed the Bounds test approach to co-
integration based on unrestricted error correction model and pair wise granger
causality tests. The results indicate that there exists no long-run relationship
between government expenditure and economic growth in Nigeria. In addition, the
causality results reveal that government capital expenditure granger causes
economic growth, while no causal relationship was observed between government
recurrent expenditure and economic growth.
In summary, the review of some of the studies on Nigeria with respect to
government spending and economic growth shows mixed results. Therefore, this
study aims to contribute to the literature and the methodological approach to doing
this is explained in the next section.
Methodology and data sources
This sections business center on briefly explicating the adopted
methodology for the purpose of capturing the influence of lagged effects in
economic relationships in the first instance. Thereafter, brisk comments on model
variables, estimation procedure and data sources make an appearance.

African Economic and Business Review Vol. 12, No. 1, Spring 2014.
ISSN 1109-5609
© 2014 The African Education and Business Research Institute, Inc.
18
To kick-off, an explanatory variable may affect a dependent variable with a
time lag while the dependent variable may also be correlated with lags of itself,
suggesting that lags of the dependent variable should also be included in the
regression. These considerations motivate the application of the Autoregressive
Distributed Lag (ARDL) model which includes lags of both the dependent and the
explanatory variables as follows:
Yt = α + ∂t + Ф1Yt-1 +…+ ФpYt-p + β0Xt + β1Xt-1 +…+ βqXt-q + et (1)
In this model the dependent variable Y depends on p lags of itself, the
current value of an explanatory variable X, as well as q lags of X. The model also
allows for a deterministic trend ∂t. Therefore, since the model contains p lags of Y
and q lags of X we denote it by ARDL (p, q). Koop (2009) explained that a variant of
the ARDL model can be estimated as stated in equation (2) below;
ΔYt = α + ∂t + βYt-1 + λ1ΔYt-1 +…+ λp-1ΔYt-p+1 + ØXt
+ θ1ΔXt +…+ θɋΔXt-ɋ+1 + et (2)
Where:
ΔYt = first difference of the dependent variable
Yt-1 = the lagged value of the dependent variable
ΔYt-1 = the lagged value of the first difference of the dependent variable
Xt = the explanatory variable at time t
ΔXt = first difference of the explanatory variable at time t
ΔXt-1 = the lagged value of the first difference of the explanatory variable
∂t = the deterministic time trend
A key advantage of this variant of the ARDL (p, q) model is that the problem
of multicollinearity is minimized. Both the marginal and long-run effects of the
coefficients can be interpreted using the concept of the multiplier. The long-run
multiplier which measures the effect of a change in the explanatory variable on the
dependent variable can be established by the ratio of the coefficients of Xt and Yt-1
which is - Ø/β.
Estimation of this model depends on whether the series are stationary or
not. We therefore apply the Augmented Dickey–Fuller (ADF) test to ensure that the
variables do not have unit root. The variables of interest in estimating the model are

African Economic and Business Review Vol. 12, No. 1, Spring 2014.
ISSN 1109-5609
© 2014 The African Education and Business Research Institute, Inc.
19
real GDP growth (RGDPG) which is the dependent variable and total government
expenditure (TEXP), total capital expenditure (CAPEX) as well as total recurrent
expenditure (RECU) which are the explanatory variables. However, each of the
variables enters the model separately in order to provide a more focused impact
analysis on their effect on real GDP growth. While there is no general convention
about lag selection (Koop 2009:165), we think the estimation of the ARDL model up
to three lags for each of the explanatory variables will provide an insight into the
effectiveness of government spending. The estimation of up to two and three lags
will not reduce significantly the degree of freedom since the study uses annual data
from 1961 to 2010 and are sourced mainly from the Central Bank of Nigerian (CBN)
statistical bulletin.
Results
The result section covers mainly the treatment of stationarity and the
growth impact regressions of aggregate, capital and recurrent expenditures in that
order. Precisely, the results of the Augmented Dickey Fuller (ADF) mean-reversion
test and the various ARDL models of the growth-spending association are presented
and then discussed, while also pointing out the reliability of estimated models via a
series of standard regression diagnostics.
Unit root test
Table 1: Augmented Dickey Fuller test
Level 1st Difference
Variables Intercept Intercept and trend Intercept Intercept and trend
RGDPG 0.0001 0.0019 0.0013 0.0001
TEXP 0.1080 0.1034 0.0088 0.0023
CAPEX 0.2923 0.1826 0.0072 0.0033
RECU 0.1303 0.1669 0.0303 0.0074
Note: Only the probability values are reported here.

African Economic and Business Review Vol. 12, No. 1, Spring 2014.
ISSN 1109-5609
© 2014 The African Education and Business Research Institute, Inc.
20
Effects of total expenditures on real GDP growth
One of the conditions for estimating the variant of the ADRL (p, q) model
described in the previous section is that the variables must be stationary. Therefore,
using the Augmented Dickey Fuller (ADF) test, table 1 shows that TEXP, CAPEX and
RECU all have unit roots at level. However, all the variables become stationary after
first differencing.
Table 2 shows the results of the first estimated ARDL model in which the
dependent variable is the real GDP growth while the explanatory variables are the
lagged value of real GDP growth, lagged value of the first difference of real GDP
growth, total government expenditure, first difference of total government
expenditure and lagged value of the first difference of total government
expenditure. The R-square shows that the model is able to explain approximately
38% of the variation in real GDP while the DW statistic of 1.9478 indicates that the
model does not suffer from the problem of autocorrelation. With respect to the
specific impacts of TEXP on real GDP, the coefficients have mixed signs and are all
insignificant.
Table 2: Real GDP growth and total expenditure (1-lag model)
Coefficient Std. Error t-ratio p-value
const 5.5601 3.9715 1.4000 0.1694
RGDPGt-1 -0.8223 0.1768 -4.6502 0.0004
ΔRGDPGt-1 0.2559 0.1546 1.6563 0.1057
TEXPt -0.1498 0.1967 -0.7617 0.4508
ΔTEXPt 0.0480 0.2482 0.1935 0.8476
ΔTEXPt-1 0.0269 0.2262 0.1191 0.9058
time 0.0155 0.0825 0.1876 0.8522
R-squared 0.3773
Adj. R-sq 0.2815
DW 1.9478
*Dependent variable is real GDP growth

African Economic and Business Review Vol. 12, No. 1, Spring 2014.
ISSN 1109-5609
© 2014 The African Education and Business Research Institute, Inc.
21
The long-run multiplier effect of total spending on real GDP growth is given
by the ratio of TEXPt and RGDPGt-1 which is -0.18. This means that TEXP has a
negative multiplier effect on real GDP growth. Because real GDP growth averaged
4.17% in the period (see summary statistics in Appendix A), in the long-run real GDP
growth should increase by 4.17% plus the long-run multiplier of -0.18 which is
3.99%. In other words the negative multiplier will reduce average real GDP growth
from 4.17% to 3.99%.
The validity of these results is tested by conducting three post estimation
tests which include normality test, specification test using the Ramsey’s RESET test
and heteroskedasticity test using White’s (1980) test. The rationale for using White’s
test is that it eliminates the problems associated with other tests such as the
Breusch-Pagan test. This is because it does not depend on the normality assumption
Table 3: Real GDP growth and total expenditure (2-lag model)
*Dependent variable is real GDP growth
Coefficient Std. Error t-ratio p-value
const 5.8174 4.3268 1.3445 0.1867
RGDPGt-1 -0.8395 0.1772 -4.7373 0.0000
ΔRGDPGt-1 0.2705 0.1553 1.7422 0.0897
TEXPt -0.2224 0.2129 -1.0444 0.3031
ΔTEXPt 0.1467 0.2587 0.5671 0.5741
ΔTEXPt-1 0.2128 0.2597 0.8195 0.4178
ΔTEXPt-2 0.3332 0.2283 1.4593 0.1529
time 0.0541 0.0872 0.6206 0.5387
R-squared 0.4093
Adj. R-squared 0.2975
Durbin-Watson 1.9155

African Economic and Business Review Vol. 12, No. 1, Spring 2014.
ISSN 1109-5609
© 2014 The African Education and Business Research Institute, Inc.
22
and also does not assume prior knowledge of heteroskedasticity. The results of the
tests in Appendix 1B shows that we fail to reject the null hypotheses that the errors
are normally distributed. Moreover, the specification is adequate and that there is
no heteroskedasticity.
Given that a one year lag may not be sufficient for government spending to
start impacting economic growth in some cases, we take the second lag of total
government expenditure. The results as shown in table 3 are not significantly
different from the earlier estimation. This is because the coefficients of total
government expenditure remain insignificant. However, the explanatory power of
the model improved with R-square of approximately 41%. The negative long-run
multiplier of -0.26 suggests that, in the long-run, real GDP will only increase by the
sample average of 4.17% plus the long-run multiplier. This amounts to some 3.91%.
Therefore, as in the earlier estimation the negative multiplier slows down long run
real GDP growth. Appendix 2B confirms the validity of these results as we again fail
to reject the null hypotheses with respect to normality, specification and
heteroskedasticity tests.
We probe further into the lagged effect of total government expenditure on
real GDP by taking a third lag. Again, the results as shown in table 4 depict
insignificant effect of total government expenditure on the real GDP growth. The
negative long-run multiplier of 0.27 means that average real GDP growth will slow to
3.9% from 4.17% between 1961 and 2010. Table 3, in appendix B, also shows that
we fail to reject the null hypotheses that the errors are normally distributed,
specification is adequate and there is no presence of heteroskedasticity.
Given that total government expenditure includes both capital and recurrent
expenditure, the earlier results may not tell us the specific effect of each of these on
economic growth. Therefore, the need to have a disaggregated estimation becomes
necessary. Table 5 shows that the coefficients of CAPEX are mixed and insignificant.
The long-run multiplier given by the ratio -(-0.4788/-0.8647) is -0.55 and implies that
average real GDP growth of 4.17% in the period will slow to 3.62%. Table 1 in
appendix B shows that while this model fails the normality test, we accept the null
hypotheses of adequate specification and absence of heteroskedasticity.

African Economic and Business Review Vol. 12, No. 1, Spring 2014.
ISSN 1109-5609
© 2014 The African Education and Business Research Institute, Inc.
23
Table 4: Real GDP growth and total expenditure (3-lag model)
Effects of capital expenditures on real GDP growth
We take the second lag of CAPEX in order to ascertain the effect on real GDP
since capital projects take some time to be completed. Table 6 shows that the
explanatory power of the model improved with R-square and adjusted R-square of
Table 5: Real GDP growth and capital expenditure (1-lag model)
Coefficient Std. Error t-ratio p-value
Const 6.2879 4.8209 1.3043 0.2007
RGDPGt-1 -0.8300 0.1842 -4.5067 0.0000
ΔRGDPGt-1 0.2751 0.1597 1.7227 0.0938
TEXPt -0.2264 0.2351 -0.9633 0.3419
ΔTEXPt 0.1289 0.2868 0.4498 0.6556
ΔTEXPt-1 0.1917 0.2837 0.6760 0.5035
ΔTEXPt-2 0.2975 0.2735 1.0875 0.2843
ΔTEXPt-3 -0.0634 0.2435 -0.2604 0.7961
Time 0.0401 0.0965 0.4156 0.6803
R-squared 0.4095
Adj. R-squared 0.2746
Durbin-Watson 1.9243
Coefficient Std. Error t-ratio p-value
const 6.8354 3.0586 2.2348 0.0312
RGDPGt-1 -0.8647 0.1797 -4.8119 0.0000
ΔRGDPGt-1 0.2681 0.1503 1.7823 0.0825
CAPEXt -0.4788 0.2769 -1.7290 0.0917
ΔCAPEXt 0.0756 0.3858 0.1960 0.8456
ΔCAPEXt-1 -0.1729 0.3477 -0.4971 0.6219
time 0.0087 0.0777 0.1124 0.9111
R-squared 0.4321
Adj. R-squared 0.3447
Durbin-Watson 1.8855

African Economic and Business Review Vol. 12, No. 1, Spring 2014.
ISSN 1109-5609
© 2014 The African Education and Business Research Institute, Inc.
24
Table 6: Real GDP growth and capital expenditure (2-lag model)
approximately 50% and 40% respectively, while the DW test also improved. The
coefficient of CAPEX after second lag is positive and significant. The long-run
multiplier of -0.74% implies that real GDP growth in the long run will slow by 0.74%
from average 4.17% to 3.43%. Table 2 in appendix C equally shows that while this
model also fails the normality test, we accept the null hypotheses of adequate
specification and absence of heteroskedasticity.
When we consider the third lag of capital expenditure, Table 7 shows that
the model is again able to explain approximately 50% of the variation in real GDP.
Also, the effect of the second lag of capital expenditure remains positive and
significant while the third lag has insignificant negative effect. The long-run
multiplier given by the ratio of the coefficients -(-0.6370/-0.8916) is -0.72% and
implies that real GDP growth in the long run will slow to 3.45% from the average
4.17% recorded in the period 1961 to 2010. Appendix 3C shows that while this
model also fails the normality test, we accept the null hypotheses of adequate
specification and absence of heteroskedasticity.
Coefficient Std. Error t-ratio p-value
const 7.3673 3.1462 2.3417 0.0247
RGDPGt-1 -0.9032 0.1746 -5.1721 0.0000
ΔRGDPGt-1 0.3503 0.1505 2.3288 0.0254
CAPEXt -0.6651 0.2849 -2.3340 0.1251
ΔCAPEXt 0.2279 0.3782 0.6026 0.5505
ΔCAPEXt-1 0.2666 0.3882 0.6868 0.4965
ΔCAPEXt-2 0.7531 0.3357 2.2434 0.0309
time 0.0467 0.0787 0.5946 0.5557
R-squared 0.4973
Adj. R-squared 0.4022
Durbin-Watson 1.9131

African Economic and Business Review Vol. 12, No. 1, Spring 2014.
ISSN 1109-5609
© 2014 The African Education and Business Research Institute, Inc.
25
Table 7: Real GDP growth and capital expenditure (3-lag model)
Effects of recurrent expenditures on real GDP growth
The recurrent expenditure is that component of government spending that
is mostly used for payments of wages and salaries and other settlements. The result
of the estimation as presented in the table 8 shows that the model is able to explain
approximately 41% of the variation in real GDP. However, while the signs of the
coefficients of RECU are mixed, they generally have insignificant effects on the real
GDP as expected. The long run multiplier which is given by the ratio -(-0.4858/-
0.8563) is -0.75. This implies that in the long run, the average real GDP of 4.17%
recorded in the period under review will slow to 3.42%. Appendix 1D shows that
model passed the normality, specification and heteroskedasticity tests.
Taking the second lag did not significantly affect the pattern of the result as
the effects of recurrent expenditure still has mixed signs and insignificant effects on
real GDP as shown in table 9. The model however is able to explain approximately
Coefficient Std. Error t-ratio p-value
Const 7.7084 3.4019 2.2659 0.0297
RGDPGt-1 -0.8916 0.1794 -4.9713 0.0000
ΔRGDPGt-1 0.3656 0.1552 2.3558 0.0242
CAPEXt -0.6370 0.3115 -2.0452 0.1484
ΔCAPEXt 0.1819 0.3996 0.4552 0.6518
ΔCAPEXt-1 0.2276 0.4037 0.5636 0.5766
ΔCAPEXt-2 0.6602 0.3867 1.7072 0.0966
ΔCAPEXt-3 -0.1816 0.3445 -0.5271 0.6015
time 0.0269 0.0847 0.3171 0.7530
R-square 0.5026
Adj. R-squared 0.3889
Durbin-
Watson
1.9253

African Economic and Business Review Vol. 12, No. 1, Spring 2014.
ISSN 1109-5609
© 2014 The African Education and Business Research Institute, Inc.
26
Table 8: Real GDP growth and recurrent expenditure (1-lag model)
Table 9: Real GDP growth and recurrent expenditure (2-lag model)
Table 10: Real GDP growth and recurrent expenditure (3-lag model)
Coefficient Std. Error t-ratio p-value
Const -1.4742 4.2535 -0.3466 0.7308
RGDPGt-1 -0.8563 0.1799 -4.7598 0.0003
ΔRGDPGt-1 0.2562 0.1523 1.6824 0.1005
RECUt 0.4858 0.4209 1.1542 0.2555
ΔRECUt -0.1875 0.5108 -0.3661 0.7162
ΔRECUt-1 0.3829 0.4913 0.7794 0.4405
Time 0.0047 0.0798 0.0587 0.9535
R-squared 0.4130
Adj. R-squared 0.3226
Durbin-Watson 1.8855
Coefficient Std. Error t-ratio p-value
Const -3.1839 4.8258 -0.6598 0.5135
RGDPGt-1 -0.8628 0.1823 -4.7327 0.0003
ΔRGDPGt-1 0.2448 0.1563 1.5653 0.1263
RECUt 0.5915 0.4758 1.2433 0.2216
ΔRECUt -0.2256 0.5343 -0.4223 0.6752
ΔRECUt-1 0.3756 0.5191 0.7236 0.4739
ΔRECUt-2 0.0765 0.5057 0.1513 0.8805
Time 0.0254 0.0848 0.2989 0.7667
R-squared 0.4254
Adj. R-squared 0.3166
Durbin-Watson 1.9507

African Economic and Business Review Vol. 12, No. 1, Spring 2014.
ISSN 1109-5609
© 2014 The African Education and Business Research Institute, Inc.
27
43% of the variation in real GDP. The long run multiplier effect on real GDP,
given by the ratio – (-0.5915/-0.8628) is -0.68. This implies that in the long run real
GDP growth will slow to 3.49% from 4.17%. Appendix 2D shows that model passed
the normality and heteroskedasticity tests but failed the specification test.
Again, as shown in Table 10, taking the third lag of recurrent expenditure
also shows that the effects on real GDP growth are insignificant with the coefficients
having mixed signs. This model explains approximately 43% of the variation in the
real GDP growth. The long run multiplier of -0.81 implies that the average real GDP
growth of 4.17% in the period slows to 3.36% in the long run. Appendix 3D shows
that model passed the normality, specification and heteroskedasticity tests.
Conclusion and policy implications of findings
The study investigated the impact of government spending on real GDP
growth in Nigeria over the period 1961 to 2010 using a special variant of the ARDL
model. The main findings are that total government spending has insignificant effect
Coefficient Std. Error t-ratio p-value
Const -4.4443 5.5396 -0.8023 0.4278
RGDPGt-1 -0.8706 0.1908 -4.5618 0.0006
ΔRGDPGt-1 0.2427 0.1607 1.5108 0.1398
RECUt 0.7064 0.5371 1.3153 0.1969
ΔRECUt -0.31816 0.5861 -0.5428 0.5906
ΔRECUt-1 0.31778 0.5463 0.5817 0.5645
ΔRECUt-2 0.0293 0.5363 0.0546 0.9567
ΔRECUt-3 -0.1322 0.5147 -0.2569 0.7987
Time 0.0289 0.0910 0.3185 0.7520
R-squared 0.4273
Adj. R-squared 0.2964
Durbin-Watson 1.9160

African Economic and Business Review Vol. 12, No. 1, Spring 2014.
ISSN 1109-5609
© 2014 The African Education and Business Research Institute, Inc.
28
on real GDP even when lags are taken for up to three periods. However, when
disaggregated into capital and recurrent expenditure, the former had significant
positive effect after second lag while the latter expectedly had insignificant effects
on real GDP. In the long run, real GDP growth is slowed down by the negative
multiplier effect of total government spending on one hand and the disaggregated
capital and recurrent expenditures components on the other. However, on average,
recurrent spending has the most negative multiplier effect of -0.75% on real GDP
growth.
The broad policy implication of the findings is that government spending
has not improved economic growth in Nigeria despite the enormous amounts that
have been expended. Factors responsible for this may include the high proportion of
recurrent component of the budget, poor capital budget implementation and
associated leakages and the market distortion cost as government financing of its
spending hinder resource allocation oftentimes. It therefore means that there is
need for government to be more prudent and efficient in its spending as this will
ensure provision of basic infrastructure that will boost rather than slow real GDP
growth.
To strengthen the budget implementation process, the Nigerian fiscal
authorities have gravitated towards performance-based budgeting as against the
erstwhile line budgeting, while attempts have also been made in recent times to link
the budget estimates of ministries, departments and parastatals with clearly
outlined sectorial priorities through a medium term expenditure framework (MTEF).
These, along with other ongoing fiscal reforms, should work to ensure that the
potential positive effects of government spending on economic growth materialise
in line with Nigeria’s aspiration to break into the league of the biggest global
economic players (top 20) by the year 2020.
References
Adesoye, A., Olukayode, M., & Akinwande, A. (2010). Dynamic analysis of
government spending and economic growth in Nigeria. Journal of
Management and Society, 1(2), 27-37.

African Economic and Business Review Vol. 12, No. 1, Spring 2014.
ISSN 1109-5609
© 2014 The African Education and Business Research Institute, Inc.
29
Amassoma, D., Nwosa, P., & Ajisafe, R. (2011). Components of government spending
and economic growth in Nigeria: An error correction modelling. Journal of
Economics and Sustainable Development, 2(4), 219-237.
Babalola, S., & Aminu, U. (2011). Fiscal policy and economic growth relationship in
Nigeria. International Journal of Business and Social Science, 2(1), 244-249.
Central Bank of Nigeria Statistical Bulletins: Various editions
Chimobi, O. P. (2011). Government expenditure and national income: A causality
test for Nigeria. Retrieved from http://ejeps.fatih.edu.tr/docs/articles/30.pdf
Koop, G. (2009). Analysis of economic data, 3rd ed. Wiley & Sons.
Nasiru, I. (2012). Government expenditure and economic growth in Nigeria:
Cointegration analysis and causality testing. Academic Research
International, 2(3), 718-723.
Nurudeen, A., & Usman, A. (2010). Government expenditure and economic growth
in Nigeria, 1970-2008: A disaggregated analysis. Retrieved from
http://astonjournals.com/manuscripts/Vol2010/BEJ-4_Vol2010.pdf.
Ogbulu, O., & Torbira, L. (2012). Budgetary operations and economic growth: The
Nigerian perspective. British Journal of Arts and Social Sciences, 4(2), 180-
194.
Olaiya, S., Nwosa P., & Amassoma, D. (2012). A trivariate causality test among
economic growth, government expenditure and inflation rate: Evidence
from Nigeria. Research Journal of Finance and Accounting, 3(1), 65-72.
Taiwo, M., & Taiwo A. (2011). Government expenditure and economic development:
empirical evidence from Nigeria. European Journal of Business and
Management, 3(9), 18-28.
Usman, A, Mobolaji, H., Kilishi, A., Yaru, M., & Yakubu, T. (2011). Public expenditure
and economic growth in Nigeria. Asian Economic and Financial Review, 1(3),
104-113.
Usman, O. (2011). Econometric evaluation of government spending, system of
government and economic growth in Nigeria 1970 – 2007. Journal of
Economics and Sustainable Development, 2(4), 252-263.

African Economic and Business Review Vol. 12, No. 1, Spring 2014.
ISSN 1109-5609
© 2014 The African Education and Business Research Institute, Inc.
30
Appendices
Appendix A: Summary Statistics
Appendix B1: Post estimation tests for ARDL for total expenditure
Appendix B2: Post estimation tests for ARDL for total expenditure
Appendix B3: Post estimation tests for ARDL for total expenditure
Mean Median Minimum Maximum
RGDPG 4.1736 4.7556 -15.7436 25.0072
TEXP 17.3041 17.2694 6.4475 30.5161
CAPEX 7.2875 6.6500 2.3000 20.0000
RECU 9.6083 9.9177 3.9887 14.8696
Null hypothesis P-value Decision
Normality test Specification test Heteroskedasticity test
Error is normally distributed Specification is adequate No presence of heteroskedasticity
0.1306
0.2563
0.5317
Accept null hypothesis Accept null hypothesis Accept null hypothesis
Null hypothesis P-value Decision
Normality test Specification test Heteroskedasticity test
Error is normally distributed Specification is adequate No presence of heteroskedasticity
0.2561
0.3198
0.7485
Accept null hypothesis
Accept null hypothesis
Accept null hypothesis
Null hypothesis P-value Decision
Normality test Specification test Heteroskedasticity test
Error is normally distributed
Specification is adequate
No presence of heteroskedasticity
0.2545
0.3367
0.1538
Accept null hypothesis
Accept null hypothesis
Accept null hypothesis

African Economic and Business Review Vol. 12, No. 1, Spring 2014.
ISSN 1109-5609
© 2014 The African Education and Business Research Institute, Inc.
31
Appendix C1: Post estimation tests for ARDL for capital expenditure
*Reject null hypothesis at 5% level of significance Appendix C2: Post estimation tests for ARDL for capital expenditure
*Reject null hypothesis at 10% level of significance
Appendix C3: Post estimation tests for ARDL for capital expenditure
*Reject null hypothesis at 10% level of significance
Appendix D1: Post estimation tests for ARDL for recurrent expenditure
Null hypothesis P-value Decision
Normality test Specification test Heteroskedasticity test
Error is normally distributed Specification is adequate No presence of heteroskedasticity
0.0285*
0.6579
0.4966
Reject null hypothesis
Accept null hypothesis
Accept null hypothesis
Null hypothesis P-value Decision
Normality test Specification test Heteroskedasticity test
Error is normally distributed Specification is adequate No presence of heteroskedasticity
0.0759*
0.6251
0.7708
Reject null hypothesis
Accept null hypothesis
Accept null hypothesis
Null hypothesis P-value Decision
Normality test Specification test Heteroskedasticity test
Error is normally distributed Specification is adequate No presence of heteroskedasticity
0.0723*
0.4921
0.1629
Reject null hypothesis
Accept null hypothesis
Accept null hypothesis
Null hypothesis P-value Decision
Normality test Specification test Heteroskedasticity test
Error is normally distributed Specification is adequate No presence of heteroskedasticity
0.2486
0.1585
0.3069
Accept null hypothesis
Accept null hypothesis
Accept null hypothesis

African Economic and Business Review Vol. 12, No. 1, Spring 2014.
ISSN 1109-5609
© 2014 The African Education and Business Research Institute, Inc.
32
Appendix D2: Post estimation tests for ARDL for recurrent expenditure
*Reject null hypothesis at 10% level of significance Appendix D3: Post estimation tests for ARDL for recurrent expenditure
Null hypothesis P-value Decision
Normality test Specification test Heteroskedasticity test
Error is normally distributed Specification is adequate No presence of heteroskedasticity
0.2555
0.0980*
0.3467
Accept null hypothesis
Reject null hypothesis
Accept null hypothesis
Null hypothesis P-value Decision
Normality test Specification test Heteroskedasticity test
Error is normally distributed Specification is adequate No presence of heteroskedasticity
0.22366
0.665242
0.233056
Accept null hypothesis
Accept null hypothesis
Accept null hypothesis