does preservation accelerate neighborhood change? · designated brooklyn heights as the city’s...
TRANSCRIPT

Problem, research strategy, and fi ndings: A number of studies have examined the property value impacts of historic preservation, but few have consid-ered how preservation shapes neighbor-hood composition. In this study, we ask whether the designation of historic districts contributes to changes in the racial compo-sition and socioeconomic status of New York City neighborhoods. Bringing to-gether data on historic districts with a panel of census tracts, we study how neighborhoods change after the designation of a historic district. We fi nd little evidence of changes in the racial composition of a neighborhood, but report a signifi cant increase in socioeconomic status following historic designation. Takeaway for practice: Our research offers empirical evidence on changes in the racial composition and socioeconomic status of neighborhoods following the designation of a historic district. It sug-gests that historic preservation can con-tribute to economic revitalization in urban neighborhoods, but that these changes risk making neighborhoods less accessible to lower-income residents. Planners should consider ways that the city government can work to preserve the highly valued amenities of historic neighborhoods while mitigating the potential for residential displacement. Keywords: historic preservation, neighbor-hood change, gentrifi cationAbout the authors: Brian J. McCabe ([email protected]) is an assistant
Does Preservation Accelerate Neighborhood Change?
Examining the Impact of Historic Preservation in New York City
Brian J. McCabe and Ingrid Gould Ellen
In 1965, the New York City Landmarks Preservation Commission (LPC) designated Brooklyn Heights as the city’s fi rst historic district. Today, fi ve decades after the designation, it is one of New York City’s wealthiest
neighborhoods. Like many other neighborhoods that are designated as historic districts, Brooklyn Heights houses higher-income, more educated residents than the surrounding communities. In general, across the city, the population of New Yorkers living in historic districts differs starkly from the population living outside of them.1
In this study, we investigate the roots of these differences. Specifi cally, we study whether neighborhoods designated as historic districts were already more prosperous (or on their way to becoming more prosperous) than other neighborhoods before designation, or whether historic designation itself con-tributed to their relative prosperity. Drawing on an analysis of census tracts in New York City—a city with a long history of historic preservation (Allison, 1996; Wood, 2007)—we focus on three types of neighborhood changes. First, we examine whether the socioeconomic status of a census tract rises relative to other neighborhoods following the designation of a historic district. We use the household income, poverty rate, and share of residents with college degrees to capture socioeconomic status. Next, we investigate whether historic designation contributes to changes in the racial composition of a census tract. Finally, we examine changes in housing market characteristics to understand the mechanisms behind any population changes. Specifi cally, we ask whether rents rise or the homeownership rate increases relative to that of other neighborhoods after the designation of a historic district.
134
professor of sociology at Georgetown Univer-sity. Ingrid Gould Ellen ([email protected]) is the Paulette Goddard Professor of Urban Policy and Planning at New York University, director of the Urban Planning Program at NYU Wagner, and faculty director
of the Furman Center for Real Estate and Urban Policy.
Journal of the American Planning Association,
Vol. 82, No. 2, Spring 2016
DOI 10.1080/01944363.2015.1126195
© American Planning Association, Chicago, IL.
RJPA_A_1126195.indd 134RJPA_A_1126195.indd 134 26/02/16 7:37 PM26/02/16 7:37 PM
Dow
nloa
ded
by [
New
Yor
k U
nive
rsity
] at
08:
45 0
5 A
pril
2016

McCabe and Ellen: Does Preservation Accelerate Neighborhood Change? 135
From our comparison of the changes that occur after designation in census tracts that become historic districts with nearby census tracts that do not, we fi nd consistent evidence that the relative socioeconomic status of neighborhoods im-proves following designation. On average, after a district is designated, the share of college-educated residents and the mean household income rise, and the poverty rate falls relative to surrounding census tracts. We also fi nd a post-designation increase in homeownership rates. However, we fi nd no change in reported rents and little evidence of racial turnover in neighborhoods after the designation of a historic district. In sum, historic preservation in New York City appears to accelerate some of the changes associated with gentrifi cation and neighborhood revitalization, but not others.
We organize our article in fi ve parts. In the next section, we briefl y describe the process of historic designation in New York City. Then, we review existing research on the way historic preservation affects cities and communities, and lay out our expectations about changes in a community follow-ing the designation of a historic district. In the third section, we present the data and methods used to identify the types of changes taking place in historic neighborhoods. We then describe our fi ndings in the next section. We conclude by arguing that planners and policymakers should consider the unintended neighborhood changes that result from policies designed to protect historic neighborhoods. We suggest that planners identify strategies to maintain neighborhood diver-sity and mitigate residential displacement after neighborhoods are designated as historic districts.
The Preservation of Historic Neighborhoods in New York City
New York City has a long history of historic preserva-tion, dating back to the early 1960s when the construction of the Brooklyn–Queens Expressway posed an imminent threat to the Brooklyn Heights neighborhood, a historic community of stately 19th-century brownstones. Along with the demolition of the Beaux Arts Penn Station in Manhattan, this threat galvanized city residents behind preservation poli-cies, leading to the creation of the Landmarks Preservation Commission (LPC) in 1965 (Gratz 2011; Wood 2007). The LPC was empowered to designate both individual proper-ties as historic landmarks as well as entire neighborhoods as historic districts. Our focus is on the creation of these districts, beginning with the designation of the Brooklyn Heights historic district.
One of the primary rationales for allowing the designa-tion of historic districts was that such designations could help stabilize declining neighborhoods.2 By the 1960s, many
communities in New York City had experienced dramatic population declines. While preservationists sought to pre-serve historic assets, the preamble to the landmarks preser-vation law also identifi ed historic preservation as a tool to spur neighborhood upgrading, attract additional residents, and stabilize property values, a goal with a very different connotation in the context of contemporary concerns about gentrifi cation.
Between 1965 and 2009—the fi nal year of our data—the LPC designated exactly 100 historic districts and approved 13 extensions to the original boundaries of historic districts. The pace of these designations was relatively consistent across decades, although there was a slight uptick in the last decade of our data. Notably, these historic districts cover a substantial portion of the parcels in New York City. By 2009, about 5% of residential units citywide—and 12% of those in Manhattan—were located within a designated historic district (Been et al., 2011).
The process of designating a historic district brings to-gether both community actors and city agencies. Typically, the fi rst step in the designation process involves the submission of a request for evaluation (RFE) to the LPC. These evalu-ations are generally supported with extensive material from civic organizations and community groups. To move forward with the designation, the LPC votes to “calendar” a proposed historic district. The Commission then holds a public hearing to allow property owners and other interested parties to offer their opinions on the district. A majority of commissioners on the LPC must then approve the district, and fi nal approval is required by the City Council (New York City Landmarks Preservation Commission, 2015a).
The city government changes the street signs from green to brown following the designation of a historic district. These public markers help demarcate the boundaries of historic districts in New York City. In addition, the city im-poses a series of restrictions on construction and renovation activity within the district that may affect the attractiveness of the neighborhood to various groups. Property owners who want to undertake construction work must receive approval from the Department of Buildings and the LPC before beginning construction. While this approval process ensures the continuity of historic amenities in the neighbor-hood, it may also make it more burdensome for property owners to upgrade and maintain their buildings (New York City LPC, 2015b). For renovations or maintenance on existing buildings, the LPC considers whether the changes would affect external architectural features of the building. In the case of new construction, the Commission considers whether the proposed building harmonizes with the exist-ing buildings in the district (Been, Ellen, Gedal, Glaeser, & McCabe, in press).3
RJPA_A_1126195.indd 135RJPA_A_1126195.indd 135 26/02/16 7:37 PM26/02/16 7:37 PM
Dow
nloa
ded
by [
New
Yor
k U
nive
rsity
] at
08:
45 0
5 A
pril
2016

136 Journal of the American Planning Association, Spring 2016, Vol. 82, No. 2
Preservation, Gentrifi cation, and Neighborhood Change
By focusing on the population changes that occur after the designation of a historic district, our study contributes to a body of research that examines the consequences of his-toric preservation for neighborhoods and cities. Over the last few decades, much of this research has evaluated the role of preservation policies in the economic development of a city as a whole (Gilderbloom, Hanka, & Ambrosius, 2009; Ilja, Ryberg, Rosentraub, & Bowen, 2011; Listokin, Listokin, & Lahr, 1998; Mason, 2005; Ryberg-Webster & Kinahan, 2014; Sohmer & Lang, 1998; Wojno 1991). This research often draws on comparative case studies from American cities to demonstrate the economic benefi ts of preservation. For example, in a study of 10 cities across the country, Ryberg-Webster (2014) shows that the federal rehabilitation tax credit for properties on the National Register of Historic Places con-tributes to the economic redevelopment of downtowns. She contends that these federal tax credits have helped to create mixed-use offi ce buildings and new housing units, contrib-uting to the economic revitalization of downtown America.
One way that the preservation of historic neighborhoods can further economic development is through the promotion of tourism, one of the stated aims of the law establishing the LPC in New York City.4 Visitors may fl ock to the most iconic neighborhoods in a city, and the preservation of culturally or aesthetically important neighborhoods can help rebrand the image of the city (Dinnie 2011; Gotham 2007; Greenberg 2009). Yet, in a case study of New Orleans, Gotham (2005) warns about “tourism gentrifi cation,” or the transformation of once-middle-class urban neighborhoods into commercial attractions for tourists. In concerns prescient to our own study, he notes that this transformation raises the specter of displacement as well as the possibility that promoting tour-ism through the preservation of historic neighborhoods will harm local residents.
While many studies linking preservation to economic development examine the citywide impact of these policies, our interest lies in understanding the impact of historic designation on the trajectory of individual neighborhoods. Although some prior studies aim to shed light on how historic designation affects individual neighborhoods, rather than the city as a whole, these studies tend to focus on property values (Asabere, Huffman, & Mehdian, 1994; Coulson & Lahr, 2005; Coulson & Leichenko, 2001; Leichenko, Coulson, & Listokin, 2001; Noonan & Krupka, 2011; Zahirovic-Herbert & Gibler, 2012). Many report that residential property val-ues are higher inside historic districts than outside of them. However, they often rely on cross-sectional comparisons that make it impossible to control for preexisting price differ-
ences between properties inside and outside historic districts. Studies using longitudinal data to evaluate prices before and after designation report more mixed results (Heintzelman & Altieri, 2011; Noonan & Krupka, 2011).
In a recent analysis using longitudinal data in New York City, Been et al. (in press) fi nd that the designation of historic districts increases the value of properties within districts, at least in relatively lower-density and lower-valued neighbor-hoods outside of Manhattan, where owners give up less-valuable development rights. Been et al. also report positive spillover effects on the blocks immediately surrounding the historic district, suggesting that homes located right outside a historic district sell for a premium following the designa-tion of a district.
This burgeoning research on the property value impacts of preservation are important to our research because they offer clues about how the demographic composition of neighborhoods is likely to change following the designation of a historic district. If property values increase after the designation of a neighborhood, then historic neighborhoods may become too expensive for low-income buyers. Likewise, if rents rise along with property values, then low-income renters may be less likely to enter neighborhoods designated as historic districts, and those that are already there may fi nd it more diffi cult to stay.
Even absent a large increase in property values or rents, the designation of a historic district could attract more educated and high-income residents by signaling the pres-ence—and preservation—of historic amenities that they value. The benefi ts of living in these communities may be largely symbolic, with a certain cultural resonance akin to living in “trendy” neighborhoods (e.g., SoHo).
Finally, these studies hint at the possibility that historic district designation restricts the supply of housing, decreas-ing the availability of affordable rental housing for low- and moderate-income households. In many cities, including New York City, the designation of historic districts places restric-tions on demolition and new construction, and may make it particularly diffi cult to build new multifamily housing. Further, the protections against changes to the built environ-ment that historic districts provide may attract homeowners, who likely value such certainty more than renters. In response, property owners may convert two- to four-family rental build-ings into single-family homes. Such conversions naturally reduce the supply of rental housing and may specifi cally reduce the supply of low-rent units, as owners of apartments in small buildings tend to charge lower rents (Furman Center for Real Estate and Urban Policy, 2013).
Despite these theoretical reasons to expect an increase in socioeconomic status following the designation of historic districts, there is remarkably little research examining patterns
RJPA_A_1126195.indd 136RJPA_A_1126195.indd 136 26/02/16 7:37 PM26/02/16 7:37 PM
Dow
nloa
ded
by [
New
Yor
k U
nive
rsity
] at
08:
45 0
5 A
pril
2016

McCabe and Ellen: Does Preservation Accelerate Neighborhood Change? 137
of demographic or racial change following such designations. In a case study of Fort Worth (TX), Coulson and Leichenko (2004) investigate whether the designation of individual historic properties (not districts) results in socioeconomic changes in Fort Worth neighborhoods.5 They include both a dichotomous indicator identifying whether any of the properties in a census tract are designated as historic and a count measure identifying the number of such properties in a census tract. After noting that neighborhoods with historic property designations are, on average, slightly worse off than other neighborhoods in the city, they fi nd no evidence that the designation of historic properties affects the homeownership rate, the median income, or the ethnic composition of the population in these neighborhoods. But again, they study the designation of individual landmarks, not historic districts.
Even absent substantial empirical evidence on shifts in neighborhood composition, critics have expressed concerns that preservation policies are likely to hasten residential turnover, or to make housing unaffordable for neighborhood residents (Smith 1998; Werwath, 1998). In their evaluation of the APA’s Great Neighborhoods program, Talen, Menozzi, and Schaefer (2015) underscore the challenges of maintain-ing affordability and promoting social inclusion in historic communities. Talen et al. (2015) report that the historic neighborhoods in the Great Neighborhoods program are often less inclusive and more expensive than the surround-ing communities. To the extent that preservation leads to residential turnover in neighborhoods, or makes housing less affordable for neighborhood residents, these land use policies may exacerbate concerns about gentrifi cation, especially in high-priced cities like New York. Indeed, some have explicitly cautioned that the preservation of historic neighborhoods may displace low-income residents as housing values rise (Smith, 1998).
While these mechanisms—the higher price of hous-ing, the increased social status of neighborhoods, and the reduction in the number of affordable rental units—are plausible mechanisms to explain increases in neighborhood income and education levels following the designation of a historic district, it is possible that the causality runs in the opposite direction. For example, it is possible that after new, higher-income homeowners move to a neighborhood, they may begin to advocate for public policies, including zoning changes or historic district designation, as a protection against changes that could undermine their housing investments (Been, Madar, & McDonnell, 2014; McCabe, 2013, 2016).
Similarly, newcomers to neighborhoods may bring with them stronger political networks or greater social capital to start the preservation process. When college-educated, high-income residents move into a neighborhood, they may bring a better knowledge of the planning process or the levers of city
governance. They may be more likely to advocate for historic preservation, recognizing the fi nancial or social benefi ts as-sociated with living in designated neighborhoods; and if they are more politically active than previous residents, or have stronger social connections, they may be more successful in securing a historic district designation.6
Assessing the Impact of Historic Designation
To assess the impact of historic district designations on changes in the characteristics of New York City neighbor-hoods, we bring together data from the U.S. Census Bureau, the New York City Department of City Planning, and the Landmarks Preservation Commission.
Data on Neighborhoods and Historic Preservation
Consistent with previous research, we use census tracts to identify neighborhoods. We rely on data from the decennial census and the American Community Survey to describe the socioeconomic status, racial composition and housing characteristics of New York City’s census tracts.
A key challenge in studying neighborhood change is that the boundaries of census tracts change over time. To ad-dress this issue, we use the Neighborhood Change Database (NCDB), a tract-level dataset developed by Geolytics and the Urban Institute. For all metropolitan areas in the country, the NCDB uses underlying census block data to provide demographic and housing data for 1970, 1980, 1990, 2000, and 2010 for fi xed-boundary census tracts, using the tract boundaries defi ned in 2010.7
We restrict our sample to census tracts that are located within the 32 community districts in the city that have at least one tax lot (or parcel) in a historic district by 2010. We also restrict our sample to census tracts with more than 100 residents in each of our census years. This leaves us with 1,001 census tracts in 32 community districts.8 With just a few exceptions, each of these tracts is observed fi ve times (1970, 1980, 1990, 2000, and 2010), producing a nearly balanced panel with 4,998 tract-year observations.9
Because the boundaries of historic districts do not follow census geographies, we rely on the primary land use tax lot output (PLUTO) data from the Department of City Plan-ning to identify the penetration of historic districts into a neighborhood. The PLUTO data set includes one record for each tax lot, or parcel, in New York City. It includes an indicator identifying whether the lot is located within a his-toric district, and if so, it indicates the name of the historic district. By linking these records to administrative data from
RJPA_A_1126195.indd 137RJPA_A_1126195.indd 137 26/02/16 7:37 PM26/02/16 7:37 PM
Dow
nloa
ded
by [
New
Yor
k U
nive
rsity
] at
08:
45 0
5 A
pril
2016

138 Journal of the American Planning Association, Spring 2016, Vol. 82, No. 2
the LPC identifying the designation date for each historic district, we can then identify the share of tax lots in each census tract located within a historic district in a particular year. For each tract, we can also identify the share of lots that will be located within a historic district by 2010.
In Figure 1, we illustrate our strategy of identifying the share of parcels in historic districts using a map of the Upper West Side/Central Park historic district. The area shaded in gray is the historic district overlaid atop individual parcels in the neighborhood. The areas bounded by the bolded black lines are census tracts. The large, rectangular white portion of the fi gure is Central Park. The map highlights the non-contiguous geography of census tracts and historic districts to show that district boundaries sometimes cut across census tracts, leaving tracts partially included in the historic district.
Using this information, we assign each census tract in each decade to one of the following four mutually exclusive categories depending on the share of parcels within a historic district: 0% in a historic district; 1% to 24% in a historic district; 25% to 75% in a historic district; and more than 75% in a historic district. In Figure 1, for example, tract D is categorized as having more than 75% of parcels located
in a historic district, tract C falls in the group of tracts with between 25% and 75% of parcels located in a district, and tract B falls in the group with at least one but fewer than 25% of parcels in a district. None of the parcels in tract A is located in a historic district.
In 2010, 814 of our sample census tracts (81%) had no parcels in a historic district. In 71 tracts (7%) at least one parcel but fewer than 25% of parcels were in a historic district, and in 83 tracts (8%), between 25% and 75% of parcels were in a historic district. In the remaining 33 tracts (3%), more than 75% of parcels were part of a historic district.
In our analysis, we consider two key aspects of the resi-dential composition of a neighborhood: socioeconomic status and racial composition. We use three variables to capture the socioeconomic status of a neighborhood: the poverty rate, the log of mean household income, and the percentage of residents with college degrees. We use two measures to depict the racial composition of a neighborhood: the percentage of tract residents who are non-Hispanic White (which we label as percentage White) and the percentage who are Black.
To shed light on the mechanisms of neighborhood change, we also examine changes in local housing conditions, looking
Figure 1. Historic district and census tract map of the Upper West Side, New York City.
RJPA_A_1126195.indd 138RJPA_A_1126195.indd 138 26/02/16 7:37 PM26/02/16 7:37 PM
Dow
nloa
ded
by [
New
Yor
k U
nive
rsity
] at
08:
45 0
5 A
pril
2016

McCabe and Ellen: Does Preservation Accelerate Neighborhood Change? 139
at both the neighborhood homeownership rate and the log of median rent. While the homeownership rate straightforwardly captures the share of households living in owner-occupied housing, the rent variable reported by the U.S. Census has substantial limitations. It captures only self-reported rents, and therefore may be measured with error. It also reports rents without adjusting for the quality and composition of the rental housing stock in a neighborhood. Moreover, it is reported back only to 1980, creating a more limited time series for our analysis. Still, taken together, these eight outcomes shed considerable light on the link between historic designations and the characteristics of New York City neighborhoods.
Table 1 compares the initial (1970) characteristics of census tracts that would not have any properties located in a historic district in 2010 with the characteristics of tracts in which at least 75% of properties would be included in a historic district in 2010.
The tracts that would, over the course of the next four decades, have parcels included in a designated historic dis-trict differed systematically from those that would not. On average, the tracts that would be included in historic districts had larger proportions of both White residents and college-educated residents in 1970 compared with those that would not become part of historic districts. They also had higher incomes and lower poverty rates. Perhaps surprisingly, the tracts that would become part of historic districts had lower rates of homeownership in 1970 than the tracts that would never be part of a district.
Methods of AnalysisThe central goal of our research is to identify how the
socioeconomic status, racial composition, and housing characteristics of a neighborhood change following the designation of a historic district. Identifying whether these changes are actually the result of designation is challenging because the neighborhoods designated as historic districts are likely to differ from other neighborhoods in the city in ways we cannot measure. These unobserved attributes, such
Table 1. Characteristics of tracts in 1970 by historic district status.
Census tracts with no parcels in
historic districts (N = 814) by 2010Census tracts with > 75% of parcels in historic districts (N = 33) by 2010
M SD M SD
Proportion Black 0.217 0.298 0.113 0.166
Proportion White 0.764 0.298 0.865 0.171
Proportion poverty 0.153 0.117 0.126 0.077
Proportion college degree 0.095 0.105 0.305 0.123
Proportion owner occupied 0.404 0.342 0.167 0.197
Mean household income $56,118 $26,497 $79,401 $41,304
as unique architectural features, might make a neighborhood more expensive or attractive to higher-status residents, even absent designation. Through a difference-in-difference ap-proach, which we describe below, we are able to account for these unmeasured differences between neighborhoods. The Technical Appendix offers additional details on each of our regression models.
The basic intuition of the difference-in-difference model is to control for the initial differences between tracts—in this case, those that would be designated as historic districts and those that would not—and then to evaluate whether those differences grow or shrink after designation. In the fi rst models, reported in column 1 of the tables in the following section, the variable HDEver captures baseline difference between neighborhoods that will become historic districts, and those that will not. The variable HDPost identifi es how the neighborhoods that comprise historic districts change relative to surrounding areas after their designation.
In the second set of models, reported in column 2, we estimate our regression with census tract fi xed effects to more fully control for baseline differences between census tracts with parcels in historic districts and those without such parcels.10 This specifi cation allows us to more precisely esti-mate how tracts with parcels in historic districts change after designation relative to nearby tracts that are located in the same community district but do not experience a designation.
In the third model, reported in column 3, we control for the possibility that prior demographic trends in census tracts that later become part of historic districts differ from trends in other tracts in the same community district. Specifi cally, we include a counter variable, HDTrend, which identifi es the number of years before or after designation that we observe the tract for those tracts that become part of historic districts.
In this model, we also include a set of TPost variables to allow the impact of designation to evolve over time. Specifi -cally, this variable identifi es the number of years after des-ignation that we observe a tract and captures the difference between the actual changes that took place after designation
RJPA_A_1126195.indd 139RJPA_A_1126195.indd 139 26/02/16 7:37 PM26/02/16 7:37 PM
Dow
nloa
ded
by [
New
Yor
k U
nive
rsity
] at
08:
45 0
5 A
pril
2016

140 Journal of the American Planning Association, Spring 2016, Vol. 82, No. 2
Table 2. Regression of mean household income (logged) on historic districts.
(1) (2) (3) (4)
HDPost: 1%–24% 0.025 0.020 –0.012 –0.004
(0.037) (0.025) (0.028) (0.033)
HDPost: 25%–75% 0.139*** 0.121*** 0.057* 0.092***
(0.041) (0.027) (0.032) (0.032)
HDPost: 76%–100% 0.099 0.100** 0.032 0.156***
(0.078) (0.039) (0.042) (0.051)
HDEver: 1%–24% 0.084*
(0.045)
HDEver: 25%–75% 0.161***
(0.039)
HDEver: 76%– 100%
0.436***
(0.076)
HDTrend 0.000***
(0.000)
TPost: 1%–24% 0.004***
(0.001)
TPost: 25%–75% 0.006***
(0.001)
TPost: 76%–100% 0.006***
(0.002)
Constant 10.901*** 11.066*** 10.808*** 10.990***
(0.009) (0.025) (0.023) (0.019)
Observations 4,998 4,998 4,998 3,598
Tract FE no yes yes yes
CD × Decade FE yes yes yes yes
Adj. R2 0.712 0.906 0.907 0.891
Notes: Robust standard errors clustered by census tract.*p < .1, **p < .05, ***p < .01.
and the changes that would have occurred regardless of desig-nation (assuming that the composition of a tract continued to change at the same rate it was changing prior to designation).
Finally, after estimating our models for the full universe of tracts in New York City, we then reestimate them for the set of tracts outside of Manhattan: the 716 census tracts in our sample in the boroughs of Queens, Brooklyn, the Bronx, and Staten Island. These boroughs have an average population density that is one-third the density of Manhattan, and many more of their neighborhoods are composed of one- to four-unit buildings, making them more comparable to other urban neighborhoods nationwide. Thus, results from regressions on this outer-borough sample may be more generalizable to other cities. To conserve space, we report only results from census tract fi xed effects models for the outer-borough sample.
Neighborhood Change After the Designation of a Historic District
The analysis below summarizes our fi ndings about how the socioeconomic status, racial composition, and housing market conditions of a neighborhood change after the des-ignation of a historic district.
Socioeconomic StatusIn Tables 2, 3, and 4, we show the results from regression
analysis of neighborhood socioeconomic status. In general, we fi nd that the socioeconomic status of a neighborhood increases following historic district designation, and the in-creases tend to be greater in census tracts that have a greater share of parcels included in historic districts.
For example, the fi rst column of Table 2 shows that in census tracts in which between 25% and 75% of parcels are designated as part of a historic district, household income increases by approximately 14% following designation rela-tive to census tracts in the same community district without historic districts. The results are very similar in column 2, when we estimate models that more tightly control for baseline neighborhood characteristics through census tract fi xed effects.
As noted, the third model accounts for preexisting trends and allows the impact of historic designation to change over time. We see an immediate boost of about 6% in the average household income for census tracts in which between 25% and 75% of parcels are designated relative to nearby neighbor-hoods without any designated parcels (Table 2, column 3). In addition, neighborhood incomes grow steadily in the years after designation—by about 4% to 6% per decade—relative to the surrounding community district.
The fi ndings are similar when we turn to the share of college-educated residents. In tracts in which at least 25% of
parcels are designated as part of a historic district, the percent-age of college-educated residents climbs by an average of 5 to 10 percentage points after the designation relative to other nearby neighborhoods (Table 3, columns 1 and 2). When we control for prior trends and allow effects to evolve over time, we fi nd short-term relative increases of three and fi ve percentage points following designation (Table 3, column 3) and further relative increases of about two percentage points per decade.
Finally, we fi nd that the poverty rate declines after a neigh-borhood is designated. In tracts in which at least a quarter of parcels are in historic districts, the percentage of residents living below the poverty line falls by two to four percentage points following designation relative to the surrounding community district (Table 4, columns 1 and 2). We fi nd less evidence that the relative poverty rate falls further over time.
RJPA_A_1126195.indd 140RJPA_A_1126195.indd 140 26/02/16 7:37 PM26/02/16 7:37 PM
Dow
nloa
ded
by [
New
Yor
k U
nive
rsity
] at
08:
45 0
5 A
pril
2016

McCabe and Ellen: Does Preservation Accelerate Neighborhood Change? 141
Table 4. Regression of poverty rate in historic districts.
(1) (2) (3) (4)
HDPost: 1%–24% –0.007 –0.000 0.009 –0.010
(0.010) (0.008) (0.009) (0.011)
HDPost: 25%– 75%
–0.028*** –0.023*** –0.022*** –0.026***
(0.009) (0.007) (0.008) (0.010)
HDPost: 76%– 100%
–0.043*** –0.030*** –0.031*** –0.054**
(0.014) (0.010) (0.011) (0.021)
HDEver: 1%–24% –0.021**
(0.010)
HDEver: 25%– 75%
–0.037***
(0.008)
HDEver: 76%– 100%
–0.059***
(0.014)
HDTrend –0.000***
(0.000)
TPost: 1%–24% –0.001**
(0.000)
TPost: 25%–75% –0.000
(0.000)
TPost: 76%–100% –0.000
(0.000)
Constant 0.211*** 0.215*** 0.287*** 0.230***
(0.003) (0.009) (0.011) (0.013)
Observations 4,998 4,998 4,998 3,598
Tract FE no yes yes yes
CD × Decade FE yes yes yes yes
Adj. R2 0.632 0.839 0.839 0.849
Notes: Robust standard errors clustered by census tract.*p < .1, **p < .05, ***p < .01.
Together, these analyses tell a consistent story. Neighbor-hoods that comprise historic districts in New York City have seen relative increases in socioeconomic status following des-ignation compared with other nearby neighborhoods, either by attracting higher-income and more educated residents, or by pricing out low-income residents.11
To address potential concerns that these results are not generalizable beyond New York City, we estimate our models for census tracts outside of Manhattan, which are more com-parable to neighborhoods in other cities in the United States. Our results (shown in column 4 of each table) suggest that, if anything, the socioeconomic changes following designation were even greater in lower-density neighborhoods outside of Manhattan. For example, we fi nd that tracts outside of Manhattan that saw the designation of at least 25% of their parcels experienced a boost in average household income of 9% to 16% relative to nearby tracts following designation
(Table 2, column 4) and a relative increase in the share of college-educated residents of between 8 and 11 percentage points (Table 3, column 4).12
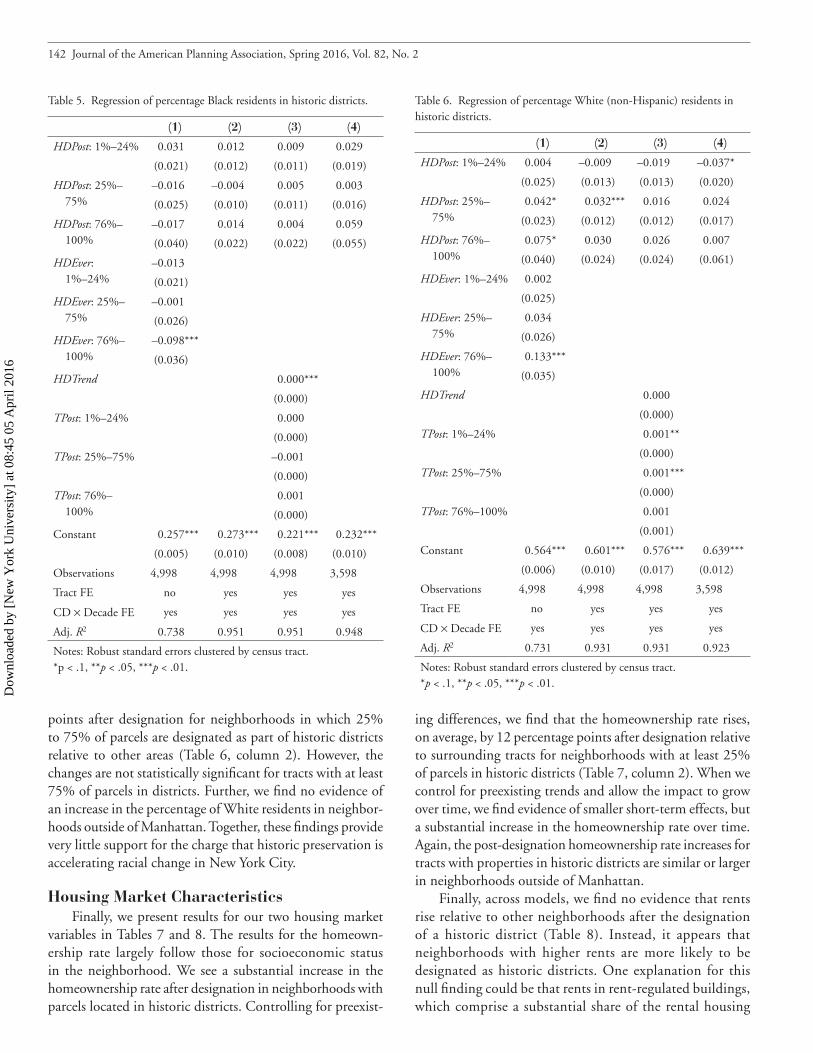
Racial CompositionIn contrast to our consistent fi ndings regarding socioeco-
nomic status, Table 5 shows no evidence of a change in the share of residents who are Black following designation. Across models, none of the coeffi cients on HDPost are statistically signifi cant, which suggests that the share of Black residents does not change relative to that of other nearby neighbor-hoods following the designation of a historic district.
When we look at the share of White residents, we see evidence of a modest increase relative to other nearby tracts after historic designation. In the model with census tract fi xed effects, we fi nd that the percentage of White residents in a census tract grows on average by about three percentage
Table 3. Regression of percentage of college-educated residents in historic districts.
(1) (2) (3) (4)
HDPost: 1%–24% 0.035** 0.018 0.004 0.023
(0.016) (0.011) (0.013) (0.016)
HDPost: 25%–75% 0.056*** 0.056*** 0.033** 0.083***
(0.017) (0.012) (0.014) (0.017)
HDPost: 76%– 100%
0.102*** 0.073*** 0.051*** 0.112***
(0.024) (0.016) –0.017 (0.025)
HDEver: 1%–24% 0.031*
(0.016)
HDEver: 25%–75% 0.063***
(0.015)
HDEver: 76%– 100%
0.132***
(0.022)
HDTrend –0.000***
(0.000)
TPost: 1%–24% 0.001***
(0.001)
TPost: 25%–75% 0.002***
(0.001)
TPost: 76%–100% 0.002***
(0.001)
Constant 0.232*** 0.294*** 0.363*** 0.241***
(0.004) (0.009) (0.014) (0.009)
Observations 4,998 4,998 4,998 3,598
Tract FE no yes yes yes
CD × Decade FE yes yes yes yes
Adj. R2 0.744 0.899 0.900 0.827
Notes: Robust standard errors clustered by census tract.*p < .1, **p < .05, ***p < .01.
RJPA_A_1126195.indd 141RJPA_A_1126195.indd 141 26/02/16 7:37 PM26/02/16 7:37 PM
Dow
nloa
ded
by [
New
Yor
k U
nive
rsity
] at
08:
45 0
5 A
pril
2016
142 Journal of the American Planning Association, Spring 2016, Vol. 82, No. 2
Table 5. Regression of percentage Black residents in historic districts.
(1) (2) (3) (4)
HDPost: 1%–24% 0.031 0.012 0.009 0.029
(0.021) (0.012) (0.011) (0.019)
HDPost: 25%– 75%
–0.016 –0.004 0.005 0.003
(0.025) (0.010) (0.011) (0.016)
HDPost: 76%– 100%
–0.017 0.014 0.004 0.059
(0.040) (0.022) (0.022) (0.055)
HDEver: 1%–24%
–0.013
(0.021)
HDEver: 25%– 75%
–0.001
(0.026)
HDEver: 76%– 100%
–0.098***
(0.036)
HDTrend 0.000***
(0.000)
TPost: 1%–24% 0.000
(0.000)
TPost: 25%–75% –0.001
(0.000)
TPost: 76%– 100%
0.001
(0.000)
Constant 0.257*** 0.273*** 0.221*** 0.232***
(0.005) (0.010) (0.008) (0.010)
Observations 4,998 4,998 4,998 3,598
Tract FE no yes yes yes
CD × Decade FE yes yes yes yes
Adj. R2 0.738 0.951 0.951 0.948
Notes: Robust standard errors clustered by census tract.*p < .1, **p < .05, ***p < .01.
Table 6. Regression of percentage White (non-Hispanic) residents in historic districts.
(1) (2) (3) (4)
HDPost: 1%–24% 0.004 –0.009 –0.019 –0.037*
(0.025) (0.013) (0.013) (0.020)
HDPost: 25%– 75%
0.042* 0.032*** 0.016 0.024
(0.023) (0.012) (0.012) (0.017)
HDPost: 76%– 100%
0.075* 0.030 0.026 0.007
(0.040) (0.024) (0.024) (0.061)
HDEver: 1%–24% 0.002
(0.025)
HDEver: 25%– 75%
0.034
(0.026)
HDEver: 76%– 100%
0.133***
(0.035)
HDTrend 0.000
(0.000)
TPost: 1%–24% 0.001**
(0.000)
TPost: 25%–75% 0.001***
(0.000)
TPost: 76%–100% 0.001
(0.001)
Constant 0.564*** 0.601*** 0.576*** 0.639***
(0.006) (0.010) (0.017) (0.012)
Observations 4,998 4,998 4,998 3,598
Tract FE no yes yes yes
CD × Decade FE yes yes yes yes
Adj. R2 0.731 0.931 0.931 0.923
Notes: Robust standard errors clustered by census tract.*p < .1, **p < .05, ***p < .01.
points after designation for neighborhoods in which 25% to 75% of parcels are designated as part of historic districts relative to other areas (Table 6, column 2). However, the changes are not statistically signifi cant for tracts with at least 75% of parcels in districts. Further, we fi nd no evidence of an increase in the percentage of White residents in neighbor-hoods outside of Manhattan. Together, these fi ndings provide very little support for the charge that historic preservation is accelerating racial change in New York City.
Housing Market Characteristics Finally, we present results for our two housing market
variables in Tables 7 and 8. The results for the homeown-ership rate largely follow those for socioeconomic status in the neighborhood. We see a substantial increase in the homeownership rate after designation in neighborhoods with parcels located in historic districts. Controlling for preexist-
ing differences, we fi nd that the homeownership rate rises, on average, by 12 percentage points after designation relative to surrounding tracts for neighborhoods with at least 25% of parcels in historic districts (Table 7, column 2). When we control for preexisting trends and allow the impact to grow over time, we fi nd evidence of smaller short-term effects, but a substantial increase in the homeownership rate over time. Again, the post-designation homeownership rate increases for tracts with properties in historic districts are similar or larger in neighborhoods outside of Manhattan.
Finally, across models, we fi nd no evidence that rents rise relative to other neighborhoods after the designation of a historic district (Table 8). Instead, it appears that neighborhoods with higher rents are more likely to be designated as historic districts. One explanation for this null fi nding could be that rents in rent-regulated buildings, which comprise a substantial share of the rental housing
RJPA_A_1126195.indd 142RJPA_A_1126195.indd 142 26/02/16 7:37 PM26/02/16 7:37 PM
Dow
nloa
ded
by [
New
Yor
k U
nive
rsity
] at
08:
45 0
5 A
pril
2016

McCabe and Ellen: Does Preservation Accelerate Neighborhood Change? 143
Table 8. Regression of median household rent (logged) in historic districts.
(1) (2) (3) (4)
HDPost: 1%–24% 0.011 –0.041 –0.049* –0.033
(0.039) (0.027) (0.028) (0.037)
HDPost: 25%– 75%
0.048 –0.026 –0.026 0.018
(0.032) (0.024) (0.026) (0.024)
HDPost: 76%– 100%
–0.050 –0.047 –0.038 –0.009
(0.067) (0.041) (0.042) (0.092)
HDEver: 1%–24% 0.022
(0.038)
HDEver: 25%– 75%
0.049*
(0.027)
HDEver: 76%– 100%
0.264***
(0.071)
HDTrend –0.000
(0.000)
TPost: 1%–24% 0.001
(0.001)
TPost: 25%–75% 0.000
(0.001)
TPost: 76%–100% –0.001
(0.001)
Constant 6.750*** 6.813*** 6.852*** 6.839***
(0.008) (0.014) (0.035) (0.017)
Observations 3,979 3,979 3,979 2,864
Tract FE no yes yes yes
CD × Decade FE yes yes yes yes
Adj. R2 0.656 0.897 0.897 0.885
Notes: Robust standard errors clustered by census tract.*p < .1, * *p < .05, ***p < .01.
stock in New York City, are insensitive to changes in the historic status of a neighborhood. While this is a plausible explanation for our fi ndings, we cannot test it with the data currently available.
Recommendations for Planners and Practitioners
Between 1965 and 2009, the New York City Landmarks Preservation Commission designated 100 historic neighbor-hoods and approved extensions to 13 of those districts. While some critics contend that such districts fuel gentrifi cation, we have had—until now—very little evidence on how the socioeconomic characteristics and racial composition of neighborhoods change after districts are designated.
The story we uncover about the relationship between historic preservation and neighborhood change is likely to invite mixed reactions. We fi nd that, on average, neighbor-hoods that comprise historic districts experience an increase in socioeconomic status relative to other nearby neighbor-hoods after designation. Some may welcome this result as offering new evidence that historic districts spur investment in neighborhoods. Yet others may view our fi ndings as sup-porting the charge that the designation of historic districts can lead to gentrifi cation and residential displacement.
Although our research design does not enable us to say with certainty that the historic district designation actually causes these changes, it does allow us to rule out most of the alternative stories. Any plausible explanation for these fi nd-ings (beyond the designation of the district itself ) would have to identify a factor unrelated to designation that consistently
Table 7. Regression of homeownership rate in historic districts.
(1) (2) (3) (4)
HDPost: 1%–24% 0.059*** 0.087*** 0.068*** 0.037*
(0.022) (0.023) (0.026) (0.021)
HDPost: 25%–75% 0.097*** 0.119*** 0.073*** 0.098***
(0.022) (0.023) (0.023) (0.017)
HDPost: 76%– 100%
0.061 0.119*** 0.018 0.193***
(0.037) (0.040) (0.039) (0.037)
HDEver: 1%–24% –0.054***
(0.017)
HDEver: 25%– 75%
–0.040*
(0.023)
HDEver: 76%– 100%
0.000
(0.034)
HDTrend –0.000***
(0.000)
TPost: 1%–24% 0.003**
(0.001)
TPost: 25%–75% 0.004***
(0.001)
TPost: 76%–100% 0.008***
(0.001)
Constant 0.268*** 0.256*** 0.549*** 0.320***
(0.005) (0.016) (0.016) (0.019)
Observations 4,998 4,998 4,998 3,598
Tract FE no yes yes yes
CD × Decade FE yes yes yes yes
Adj. R2 0.463 0.672 0.677 0.767
Notes: Robust standard errors clustered by census tract.*p < .1, **p < .05, ***p < .01.
RJPA_A_1126195.indd 143RJPA_A_1126195.indd 143 26/02/16 7:37 PM26/02/16 7:37 PM
Dow
nloa
ded
by [
New
Yor
k U
nive
rsity
] at
08:
45 0
5 A
pril
2016

144 Journal of the American Planning Association, Spring 2016, Vol. 82, No. 2
led to demographic changes within districts immediately after designation, but had no impact on the neighborhoods immediately surrounding those districts. Alternatively, it is possible that districts tend to be designated at precisely the time when they are starting to see a growth in income and so-cioeconomic status. In other work, however, we see no evident pre-designation trends in housing prices (Been et al., in press).
While we fi nd clear evidence of changes in a neighbor-hood following designation, our research design only hints at the mechanisms leading to these changes. One possibility is that higher housing prices exclude low-income residents and attract high-income households. Although our failure to fi nd any increase in neighborhood rents raises questions about this story, previous research often reports a bump in property values after the designation of a historic district.
It is also possible that incomes rise and poverty falls after designation because the number of housing units available to rent within a district declines. We do fi nd that homeownership rates increase after a neighborhood has been designated as part of a historic district, perhaps as a result of the conversion of multifamily dwellings into single-family homes, or the sale of rental units to homebuy-ers. Given that low-income households disproportionately rent their housing units, a decline in rental units means fewer housing options for low-income households.
Finally, the upgrade in socioeconomic status of a neigh-borhood may result from differences in the taste for pres-ervation. Certain groups—for example, college-educated residents—that place a premium on living in historic districts may be willing to outbid others for homes in designated neighborhoods.
Regardless of the precise mechanism, our fi ndings present a dilemma for planners concerned about balancing the many benefi ts of historic preservation with the realities of socioeco-nomic change. The challenge for planners is to consider how city governments can work to preserve the historic amenities of neighborhoods—which may attract higher-income, college-educated residents in to the community—while ensuring that longstanding residents are not pushed out (Birch & Roby, 1984; Fein, 1985). Cities should make sure that preserva-tion offi cials coordinate with affordable housing agencies and organizations as they make land use decisions to ensure that affordable housing options are preserved within or near these historic neighborhoods. Mitigating the potentially negative impact of preservation on low-income populations would help to allay the concerns of critics who argue that preservation is simply gentrifi cation by another name.
AcknowledgmentWe would like to thank Gerard Torrats-Espinosa for his excellent
research assistance with this article.
Notes1. In an initial comparison of neighborhoods designated as historic districts to those not designated, we fi nd stark differences in neighbor-hood characteristics. In 2010, the average census tract in a district was 80% White and 9.5% Black, but the average census tract not in a historic district was only 43% White and almost 30% Black. More than 90% of residents living in tracts located in historic districts hold a college degree in 2010, compared with only 33% in tracts outside historic districts. These comparisons are between tracts with at least 75% of the parcels located within a historic district, and those tracts that do not include any parcels in a designated historic district.2. The administrative code associated with the landmarks preservation law mandates one of the key purposes of the legislation is to “…stabilize and improve property values in the district” (Title 25: Land Use, Chapter 3: Landmarks Preservation and Historic Districts, § 25-301).3. For additional information on the restrictions imposed on property owners, see Been et al. (in press).4. Again, in the justifi cation to the law, the city identifi ed one goal to “…protect and enhance the city’s attractions to tourists and visitors” (Title 25: Land Use, Chapter 3: Landmarks Preservation and Historic Districts, § 25-301).5. Coulson and Leichenko (2004) identify 1,338 residential properties designated by the National Register of Historic Places, the Texas Histori-cal Commission, and local preservation boards. 6. Describing the transformation of downtown Brooklyn, Kasinitz (1988) tells the story of preservation efforts in Boerum Hill, a commu-nity in the heart of brownstone Brooklyn. As they moved into the neighborhood in the 1960s, newcomers touted the historic nature of their community as a tool for neighborhood preservation, hoping that the recognition of a historic community would save their neighborhood from the shovels of urban redevelopment. Savvy about their social and political connections, Kasinitz (1988) argues that residents used historic preservation as a tool to protect their neighborhood from exogenous forces of redevelopment, suggesting that demographic shifts predated historic district designation in Boerum Hill. These early activists helped to improve the public image of Boerum Hill through the preservation process, ultimately speeding the pace of neighborhood change as homeowners replaced renters.7. The geography of census tracts is a common proxy for neighbor-hoods. While block groups could allow for a more fi ne-grained analysis of neighborhood-level change, the Neighborhood Change Database does not include a longitudinal panel of block groups. 8. New York City includes 59 community districts in total, but only 32 of those districts include tracts located within a historic district.9. Seven tract-years are missing, leaving a total of 4,998 for most of our regressions. For median rent, we only have data for 1980 through 2010, so the sample size is smaller.10. Rather than controlling for average differences between tracts with parcels in historic districts and those without, which we do with the HDEver variables in our fi rst model, the second model controls for fi xed attributes of the individual census tracts themselves. 11. At the suggestion of one reviewer, we also estimate models for the total population in a tract, the population living below the poverty line, and the share of households with children. These fi ndings corroborate the story presented in this study. We fi nd evidence of a decline in the total population and the number of people living below the poverty line. There is a positive impact of preservation on the share of families with children for tracts with 75% of parcels in a historic district. 12. We reestimate the full set of models for the tracts located in the outer boroughs. For each of the outcomes, we fi nd that the results are
RJPA_A_1126195.indd 144RJPA_A_1126195.indd 144 26/02/16 7:37 PM26/02/16 7:37 PM
Dow
nloa
ded
by [
New
Yor
k U
nive
rsity
] at
08:
45 0
5 A
pril
2016

McCabe and Ellen: Does Preservation Accelerate Neighborhood Change? 145
consistent with the results from the full set of tracts. We choose to show the results for Model 2, which do not include the TPost or trends variables, because these models provide a more straightforward interpre-tation of the impact of historic preservation on neighborhoods.
ReferencesAllison, E. (1996). Historic preservation in a development-dominated city: The passage of New York City’s landmark preservation legislation. Journal of Urban History, 22, 350–376. doi:10.1177/009614429602200304Asabere, P. K., Huffman, F. E., & Mehdian, S. (1994) The adverse impacts of local historic districts: The case of small apartment buildings in Philadelphia. Journal of Real Estate Finance and Economics, 8, 225–234. doi:10.1007/BF01096993Been, V., Ellen, I. G., Dastrup, S., Gross, B., Hayashi, A., Latham, S.,…Williams, M. (2011). State of New York City’s housing and neighbor-hood. New York, NY: Furman Center.Been, V., Ellen, I. G., Gedal, M., Glaeser, E., & McCabe, B. J. (in press). Preserving history or restricting development? The heterogeneous effects of historic districts on local housing markets in New York City. Journal of Urban Economics.Been, V., Madar, J., & McDonnell, S. (2014). Urban land-use regulation: Are homevoters overtaking the growth machine? Journal of Empirical Legal Studies, 11(2), 227–265. doi:10.1111/jels.12040Birch, E. L., & Roby, D. (1984). The planner and the preservationist: An uneasy alliance. Journal of the American Planning Association, 50(2), 194–207. doi:10.1080/01944368408977175Coulson, N. E., & Lahr, M. L. (2005). Gracing the land of Elvis and Beale Street: Historic designation and property values in Memphis. Real Estate Economics, 33(3), 487–507. doi:10.1111/j.1540-6229.2005.00127.xCoulson, N. E., & Leichenko, R. M. (2001). The internal and external impact of historical designation on property values. Journal of Real Estate Finance and Economics, 23(1), 113–124. doi:10.1023/A:1011120908836Coulson, N. E., & Leichenko, R. M. (2004). Historic preservation and neighbourhood change. Urban Studies, 41(8), 1587–1600. doi:10.1080/0042098042000227028Dinnie, K. (2011) City branding: Theory and cases. London, UK: Palgrave McMillan. Fein, D. B. (1985). Historic districts: Preserving city neighborhoods for the privileged. New York University Law Review, 60, 64–104. http://www.nyulawreview.orgFurman Center for Real Estate and Urban Policy. (2013). Mainte-nance and investment in small rental properties: fi ndings from New York City and Baltimore. Retrieved from http://furmancenter.org/fi les/MaintenanceandInvestmentSmallRentalProperties_WorkingPaper_15NOV2013.pdfGilderbloom, J. I., Hanka, M. J., & Ambrosius, J. D. (2009). Historic preservation’s impact on job creation, property values, and environmen-tal sustainability. Journal of Urbanism: International Research on Place-making and Urban Sustainability, 2(2), 83–101. doi:10.1080/17549170903056821Gotham, K. F. (2005). Tourism gentrifi cation: The case of New Orleans’ Vieux Carre (French Quarter). Urban Studies 42(7), 1099–1121. doi:10.1080/00420980500120881Gotham, K. F. (2007). (Re)branding the Big Easy: Tourism rebuilding in post-Katrina New Orleans. Urban Affairs Review 42(6), 823–850. doi:10.1177/1078087407300222Gratz, R. B. (2011). The battle for Gotham: New York in the shadow of Robert Moses and Jane Jacobs. New York, NY: Nation Books.
Greenberg, M. (2009). Branding New York: How a city in crisis was sold to the world. New York, NY: Routledge. Heintzelman, M., & Altieri, J. (2011). Historic preservation: Preserving value? Journal of Real Estate and Economics, 46(3), 543–563. doi:10.1007/s11146-011-9355-7Ilja, A., Ryberg, S., Rosentraub, M. S., & Bowen, W. (2011). Historical designation and the rebuilding of neighborhoods: New evidence of the value of an old policy tool. Journal of Urbanism: International Research on Placemaking and Urban Sustainability, 4(3), 263–284. doi:10.1080/17549175.2011.635262Kasinitz, P. (1988). The gentrifi cation of “Boerum Hill”: Neighbor-hood change and confl icts over defi nitions. Qualitative Sociology, 11(3), 163–182. doi:10.1007/BF00988953.Leichenko, R. M., Coulson, N. E., & Listokin, D. (2001). Historic preservation and residential property values: an analysis of Texas cities. Urban Studies, 38(11), 1973–1987. doi:10.1080/00420980120080880Listokin, D., Listokin, B., & Lahr, M. (1998). The contributions of historic preservation to housing and economic development. Housing Policy Debate, 9(3), 431–478. doi:10.1080/10511482.1998.9521303Mason, R. (2005). Economics and historic preservation: A guide and review of the literature. Washington, DC: Brookings Institute Metropoli-tan Policy Program. McCabe, B. J. (2013). Are homeowners better citizens? Homeowner-ship and community participation in the United States. Social Forces, 91(3), 929–954. doi:10.1093/sf/sos185McCabe, B. J. (2016). No place like home: Wealth, community and the politics of homeownership. New York, NY: Oxford University Press.New York City Landmarks Preservation Commission. (2015a). FAQs: The designation process. Retrieved from http://www.nyc.gov/html/lpc/html/propose/process.shtmlNew York City Landmarks Preservation Commission. (2015b). FAQs: Permitting and making alterations. Retrieved from http://www.nyc.gov/html/lpc/html/faqs/alterations.shtml.Noonan, D. S., & Krupka, D. J. (2011). Making—or picking—win-ners: Evidence of internal and external price effects in historic preserva-tion policies. Real Estate Economics, 39(2), 379–407. doi:10.1111/j.1540-6229.2010.00293.xRyberg-Webster, S. (2014). Preserving downtown America: Federal rehabilitation tax credits and the transformation of U.S. cities. Journal of the American Planning Association, 79(4), 266–279. doi:10.1080/01944363.2014.903749Ryberg-Webster, S., & Kinahan, K. L. (2014). Historic preservation and urban revitalization in the twenty-fi rst century. Journal of Planning Literature, 29(2), 119–139. doi:10.1177/0885412213510524Smith, N. (1998). Comment on David Listokin, Barbara Listokin, and Michael Lahr’s “The contributions of historic preservation to housing and economic development”: Historic preservation in a neoliberal age. Housing Policy Debate, 9(3), 479–485. doi:10.1080/10511482.1998.9521304Sohmer, R. R., & Lang, R. E. (1998). Beyond this old house: Historic preservation in community development. Housing Policy Debate, 9(3), 425–430. doi:10.1080/10511482.1998.9521302Talen, E., Menozzi, S., & Schaefer, C. (2015). What is a “Great Neighborhood”? An analysis of APA’s top-rated places. Journal of the American Planning Association, 81(2), 121–141. doi:10.1080/01944363.2015.1067573Werwath, P. (1998). Comment on David Listokin, Barbara Listokin, and Michael Lahr’s “The contributions of historic preservation to housing and economic development.” Housing Policy Debate, 9(3), 487–495. doi:10.1080/10511482.1998.9521305
RJPA_A_1126195.indd 145RJPA_A_1126195.indd 145 26/02/16 7:37 PM26/02/16 7:37 PM
Dow
nloa
ded
by [
New
Yor
k U
nive
rsity
] at
08:
45 0
5 A
pril
2016

146 Journal of the American Planning Association, Spring 2016, Vol. 82, No. 2
out, we estimate a second model with census tract fi xed effects. Rather than controlling for average differences between tracts with parcels in historic districts and those without, this model controls for fi xed attributes of the individual census tracts themselves, allowing us to more precisely estimate how those tracts with parcels in districts change after the designation of districts when compared with nearby tracts in the same community district that do not see an increase in parcels in historic districts. Specifi cally, we estimate the following regression model:
Pndt = α + γc Wc + δdt Idt + θHDnt + εit, (2)
which is identical to the fi rst model with the exception of the addition of Wc, a series of census tract fi xed effects, and the omission of the HDEver variables, which cannot be estimated together with census tract fi xed effects.
While this model controls for differences in average characteristics between tracts with historic districts and those without, it does not control for differences in prior trends in neighborhoods with districts and those without. It is possible that tracts with parcels that were designated as part of a historic district were already experiencing trends in neighborhood characteristics prior to designation that dif-fered from those occurring in other nearby neighborhoods. Our fi nal model controls for any such trends by including a counter variable, HDTrend, that is measured only for census tracts that have at least one parcel that is or will become part of a historic district. This variable measures the number of years since designation, taking on negative values for census years prior to designation. For example, if all parcels in a tract are designated as a historic district in 1983, then HDTrend would take on a value of –13 in 1970, –3 in 1980, +7 in 1990, +17 in 2000, and +27 in 2010. The coeffi cient on this variable captures the extent to which trends in census tracts that eventually become part of historic districts differ from trends in other tracts in the same community district.
In this last model, we also include TPost, which equals the number of years after the designation of a historic district. For tracts that have parcels that will be included in a historic district, the TPost variable is coded 0 in decades prior to des-ignation. For census tracts that include no parcels that will be included in a historic district, the TPost variable is always coded 0. The coeffi cient on the TPost variable thus shows how the impact of designation unfolds over time, indicat-ing the difference between the actual changes that occurred after designation (relative to the community district) and the changes that would have occurred regardless of designation had the composition of a tract continued to change at the same rate it was changing prior to designation.
Wojno, C. T. (1991). Historic preservation and economic development. Journal of Planning Literature, 5(3), 296–306. doi:10.1177/088541229100500305Wood, A. (2007). Preserving New York: Winning the right to protect a city’s landmarks. New York, NY: Routledge.Zahirovic-Herbert, V., & Gibler, K. M. (2012). Historic district infl u-ence on house prices and marketing duration. Journal of Real Estate Finance and Economics, 48(1), 112–131. doi:10.1007/s11146-012-9380-1
Technical Appendix
Our basic methodological strategy estimates a difference-in-difference panel regression model that assesses the extent to which preexisting differences between neighborhoods that become historic districts and other nearby neighborhoods that do not grow or shrink following district designation. Throughout the analysis, each observation is a census tract observed in a particular decade (e.g., 1970, 1980, etc.)
We start with a simple difference-in-difference model in which the dependent variable captures an attribute of the census tract n in decade t, for example, the poverty rate. Specifi cally, we estimate the following equation:
Pndt = α + δdt Idt + θHDnt + εit, (1)
where Pndt is the poverty rate of census tract n, in community district d, and in year t; Idt are a series of dummy variables indicating the year and community district, which allow us to control for economic and demographic trends within the community district; and HDnt is our vector of historic district variables. We report standard errors clustered at the census tract level.
Within the vector HD, we fi rst include a set of dummy variables that capture whether a census tract will have par-cels located in a historic district by 2010. Specifi cally, we include three such variables: HDEver1-24, HDEver25-75, and HDEver76-100, which respectively take on a value of 1 if at least 1% but less than 25%, 25% to 75%, or more than 75% of a tract’s parcels are within a historic district in 2010. These variables capture baseline, unmeasured dif-ferences between neighborhoods with properties in historic districts and those without any historic districts. We also include a set of time-varying variables that take on the value of 1 if 1% to 24%, 25% to 75%, or more than 75% of a tract’s parcels are within a designated historic district in that particular year: HDPost1-24, HDPost25-75, and HDPost76-100. The coeffi cients on these variables capture the impact of designation.
To more fully control for baseline differences between census tracts with parcels in historic districts and those with-
RJPA_A_1126195.indd 146RJPA_A_1126195.indd 146 26/02/16 7:37 PM26/02/16 7:37 PM
Dow
nloa
ded
by [
New
Yor
k U
nive
rsity
] at
08:
45 0
5 A
pril
2016