does ridesourcing increase or decrease vehicle kilometers
TRANSCRIPT

Does ridesourcing increase or decrease vehicle kilometers
traveled (VKT)? A simulation approach for the case
of Santiago, Chile
Autores: Alejandro Tirachini
Andres Gomez-Lobo
Santiago, Noviembre de 2017
SDT 457

1
Does ridesourcing increase or decrease vehicle kilometers traveled (VKT)? A simulation approach for the case of Santiago,
Chile
Alejandro Tirachini (*) Transport Engineering Division Civil Engineering Department Universidad de Chile [email protected] Andres Gomez-Lobo Faculty of Economics and Business Universidad de Chile [email protected] (*) Corresponding author November 10th, 2017
Abstract Many authors have pointed out the importance of determining the impact of ridesourcing on vehicle kilometers traveled (VKT), and thus on transport externalities like congestion. However, to date there is scant evidence on this subject. In this paper we use survey results on Uber use by residents of Santiago, Chile, and information from other studies to parameterize a model to determine whether the advent of ridesourcing applications increases or decreases the number of VKT. Given the intrinsic uncertainty on the value of some model parameters, we use a Monte Carlo simulation for a range of possible parameter values. Our results indicate that unless ridesourcing applications substantially increase average occupancy rate of trips and become ridesharing, the impact is an increase in VKT. We discuss these results in light of current empirical research in this area. Keywords: ridesourcing, ride-hailing, taxi, transportation network companies, sharing economy, vehicle-kilometers, VKT

2
1. Introduction The advent of ridesourcing technologies is rapidly changing the urban mobility patterns and the passenger transport industry in many cities around the world. We follow Rayle et al. (2016) and refer to ridesourcing services as profit motivated on-demand ride services through a smartphone application, as opposed to non-profit ride-sharing or car-pooling services and traditional taxi services. As summarized by Henao (2017), in the literature there are several names to refer to ridesourcing platforms, such as ride-hailing, e-dispatching, ride-booking, on-demand rides and Transportation Network Companies (TNCs), among others. Regulators in many jurisdictions are grappling with the legal and policy implications of these new services as they clearly violate existing taxi regulations but are nonetheless highly valued by users. Ridesourcing services raise many issues including their impact on passenger safety, universal accessibility requirements, insurance liability, driver labor protection and privacy of information. They are also an opportunity to improve service quality, mobility and the incidence of “driving while intoxicated” (DWI) felonies1. In many large cities with already high congestion levels, the impact of ridesourcing applications on vehicle kilometers or miles traveled (VKT or VMT) is of paramount importance. In general, a key to understand the effect of ridesourcing application on transportation externalities is to estimate which modes are being substituted. An analysis of the most common cases will illustrate these ideas. When comparing ridesourcing with traveling with one’s own car, there are two arguments by which ridesourcing platforms can reduce VKT: first, ridesourcing significantly reduces or eliminates altogether the time and distance traveled in search of parking, a relevant issue as this cruising for parking behavior is a major contributor to congestion in several cities (Shoup, 2006). Second, when someone owns a car, they pay a high fixed cost of capital (acquisition of the vehicle), relative to which the marginal cost for the use of the vehicle is very low. Therefore, some people will tend to make more motorized and/or longer trips if they own a car, relative to the trips made by a person who relies on ridesourcing, where the entire transport cost is associated with the trips made and their length. On the other hand, there is a factor that counteracts these two arguments: a car trip is generally door-to-door (except for the cruising for parking phenomenon), while ridesourcing trips include the extra travel made by the driver from somewhere else to the passenger's starting point, plus the passenger-free traffic the car adds at the end of the trip (when it travels to look for another passenger). Then, the net effect of ridesourcing applications on externalities such as congestion, pollution and accidents, compared to the private car, depends on the size of these opposing effects. Compared to traditional taxis, ridesourcing platforms have the advantage of reducing the number of kilometers that drivers travel without passengers. Finally, in comparison with
1 On this last issue see Greenwood and Wattal (2015) who provide evidence using data from California that Uber reduces alcohol/DWI homicides. See also Dills and Mulholland (2016).

3
public transportation, cycling or walking, a substitution towards ridesourcing increases vehicle kilometers on the street, unless the substitution of local bus trips is more than compensated by an increased number of trips that combine ridesourcing with longer rail or express bus services, in replacement of car trips (the so-called ‘last mile problem’)2. Therefore, taking all these effects into account, it is impossible to predict ex-ante the effect of ridesourcing platforms on transport externalities. What is clear though is that such effects are not constant throughout the day, calling for flexible regulation of these services, including the possibility of introducing a fee on ridesourcing that is related to the number of vehicle kilometers added in different time-period and locations. There is a small but growing literature on the impact of ridesourcing applications on congestion. Henao (2017) cites the reluctance of commercial ridesourcing companies to share meaningful data as one of the reasons behind the scarcity of academic studies on the subject. The review carried out in New York (City of New York, 2016) finds that e-dispatch services do not appear to be driving the increasing severity of vehicle congestion in the Central Business District (CBD). However, it also recognizes that this may change in the future and the impact will depend on the proportion of passengers that substitute from car-based modes as opposed to public transit.3 The lack of data explains why various authors have not been able to conclusively answer the question of whether ridesourcing applications increase or reduce congestion. For example, a study undertaken for the city of Vancouver (Ngo, 2015) states that there is inconclusive evidence as to whether these applications increase or decrease vehicle kilometers traveled and thus congestion. Rayle et al. (2016) also remain neutral as to the impact of these applications on congestion. However, their intercept survey of San Francisco during May and June 2014 indicates that --up to that date-- there was no evidence that these services had influenced car ownership behavior. Their results also indicate that a small amount of travel has been induced by ridesourcing applications. More troubling was their finding that 33% of users declared that they would have otherwise used bus or rail to make their surveyed ridesourcing trip, evidence that would imply a negative impact of ridesourcing applications on traffic externalities such as air pollution and congestion. Rayle et al. (2016) conclude that more research is required and that the impact of these applications on congestion should consider the “induced travel effect, travel made by drivers without passengers, potential substitution from public transit, and the impact of ridesourcing on users' driving.”
2 An optimization approach to integrate ridesourcing with public transportation is introduced and applied by Chen and Nie (2017). 3 City of New York (2016) does recognize that ridesourcing applications have eroded an important source of transit funding (special levy on taxi rides) in spite of the fact that ridesourcing trips are subject to an 8,875% sales tax, 0.375% of which go directly to the Metropolitan Transit Authority.

4
Hensher (2017) also points out at the potential negative effects of substitution away from mass transit, with no quantitative data to measure the size of this effect. He also makes the point that an impact of these applications on car ownership may not reduce congestion. In the end, a trip in a small vehicle is an addition of vehicle kilometers traveled (VKT) irrespective of who owns the vehicle. However, ridesourcing does have an impact on reducing the demand for parking, as previously discussed, which in turn is an opportunity to relocate parking spaces, for example, to mixed land uses (Henao and Marshall, 2017). A roundtable discussion by OECD/ITF (2016) concluded that ridesourcing applications represent only a small fraction of overall vehicle kilometers and thus it does not make sense to target this policy issue if overall vehicle congestion was not also addressed. However, this may change in the future and OECD/ITF (2016) recognize that addressing the issue of the impact of ridesourcing applications on congestion may be important in certain areas and time periods. More rigorous empirical evidence is provided by Hall et al. (2017) and Li et al. (2016). Hall et al. (2017) note that ridesourcing applications can solve the last mile problem, related to access to and from transit services. As such, these two services may be complementary rather that substitute. By using a difference in difference econometric approximation for the United States, Hall et al. (2017) estimate that, on average, there is an increase in public transportation use thanks to Uber, with heterogeneity noted as Uber reducing public transportation ridership by 5.7 percent in smaller cities while increasing public transit ridership by 0.8 percent in the larger cities. Therefore, the predominance of the complementary or substitute nature of the relationship between Uber and public transportation is context dependent. The much lower fare of public transportation relative to Uber is suggested as one of the reasons for travelers using both modes as complements. However, Clewlow and Mishra (2017) estimate an average reduction of 6% in transit use due to ridesourcing in seven major US cities, and that buses and light rail lose demand, while commuter rail increases ridership due to ridesourcing use. The potential of ridesourcing to integrate with mass transit is further discussed at length by Iacobucci et al. (2017) and Dinning and Weisenberger (2017). Li et al. (2016) use a difference in difference estimator approach on annual traffic data of US urban areas. They find that the appearance of Uber is associated with a reduction in traffic congestion at a metropolitan scale. As an underlying explanation, they conjecture that ridesourcing applications such as Uber have the potential to reduce car ownership, increase car occupancy rates due to ride sharing and delay trips during peak hours (due to surge pricing). However, the separate effect of the standard Uber standard and Uberpool (the carpooling alternative that exist in some cities) could not be disentitled and the results do not preclude the possibility that in some periods and areas within cities (peak times in financial or commercial districts) ridesourcing use may indeed increase congestion.

5
Clewlow and Mishra (2017) conjecture that ridesourcing has most likely increasing VKT in major American cities, as they find that between 49% and 61% of ridesourcing trips would not have been made at all or would have been made by walking, cycling or public transportation. However, the authors recognize that net VKT changes are unknown. They also correctly note that to quantify this impact one must know the mode ridesourcing applications are substituting from (driving, transit, walking, cycling), the number of passenger miles in ridesourcing trips, and the additional kilometers traveled without passengers by cars linked to these applications. These effects are considered in this paper as discussed further below. Finally, Henao (2017) estimates a notorious increase of 84.6% in VKT due to ridesourcing in Denver, Colorado, based on 308 ridesourcing trips driven and surveyed by the author himself. The link between ridesourcing applications and congestion is not only an academic matter. It has important policy implications. Several cities, including Seattle, Chicago, and Portland in the US and Mexico City, charge special levies on ridesourcing application services to finance special accessibility or mobility funds (Ngo, 2015). NYC is also considering introducing such a levy (City of New York, 2016). More interesting, there is a growing tendency to link these charges to congestion. This is the case of Sao Paulo, Brazil, where the municipal authorities recently introduced a charge to application based services according to the number of kilometers traveled. The stated purpose of the municipal authorities is to differentiate this charge according to the congestion caused by zone and time of day. Similar legislation has been proposed in Chile. A bill currently in congress would legalize ridesourcing applications but would levy a kilometer based charge based on traffic conditions by geographical zone and time of day. Thus, a deeper and more precise understanding of the link between ridesourcing applications and congestion will be paramount to guide these new regulatory frameworks worldwide. The aim of the present paper is to expand the nascent literature on the effect ridesourcing applications on travel behavior and traffic externalities along two lines. First, we present a multimodal model to analyze the different parameters that determine the impact of these new application-based services on VKT. The literature has discussed several different channels whereby these services can affect total VKT, such as the passenger occupancy rates among alternative transport modes, substitution from high occupancy modes such as public transportation, induced travel, vehicle kilometers in taxi and ridesourcing services without passengers, the impact of private vehicles searching for parking, among others. We hope to clearly spell out how each of these factors interacts to determine the overall impact on VKT. Second, we parameterize this model using the information gathered from an online survey regarding travel patterns and use of Uber in Chile. There were 1,600 respondents, 91% of which were from Santiago. Although this was a voluntary response survey and therefore the sample is not random and potential biases may be present, further below we contrast the data with the 2012 Origin Destination Survey for Santiago. Furthermore, in the simulation approach used in this paper we introduce ways to tackle potential biases. Our

6
sample is much larger than the interception survey of Rayle et al. (2016) and it covers all time periods.4 The survey in-itself reveals interesting information regarding the motivation and evaluation of Uber by Chilean users, and that ridesourcing has different effects on travel behavior at day and night. And to our knowledge it is the first-time information of this kind is presented from a country or city outside the United States. We use the survey results from Santiago to parameterize the model. However, some parameters are not covered by the survey and are borrowed from the literature. Since there is uncertainty regarding most parameters, we assume a range of values for each case and undertake a Monte Carlo simulation in order to examine the likely impact of ridesourcing applications on VKT in Santiago. Besides providing survey results for a case outside the United States, the model developed in this paper allows for a more detailed understanding of what could be driving the aggregate results of papers such as Li et al. (2016). The paper is organized as follows. The next section presents the model. We then describe the survey and results. Following that we explain how the model was parameterized and we present the Monte Carlo results. The paper ends with a summary of our main conclusions, policy implications and areas for further research.
2. Conceptual analysis of the impact of ride sharing applications on vehicle kilometers traveled
We model the effect of ridesourcing on of the number of vehicle kilometers traveled (VKT) by different transport modes, as the most common traffic externalities -like congestion, pollution and accidents- are directly related to VKT. We define Va as the number of trips in private car use, Vapp as the number of trips in ridesourcing services, Vt as the number of trips in taxis, and Vb as the number of trips in bus.5 There are certain specificities of each mode that must be taken into account in order to transform trips into vehicle kilometers. For the private car mode, the number of VKT will have to consider the length of the average trip (La) and the average occupancy rate in this mode (Oa). In addition, private cars also congest the roads when looking for a parking space (e.g., Arnott and Inci, 2006; Shoup, 2006). We take this effect into account by using
a multiplier (>0) on the average car trip length. Thus, total vehicle kilometers in the car mode will be:
𝑉𝐾𝑎 = (1 + 𝜃) ∙ 𝐿𝑎 ∙𝑉𝑎
𝑂𝑎 (1)
4 Rayle et al. (2016) obtain 380 completed responses and their interception survey was undertaken during two months on two weekdays (later three) evenings and Saturday evenings. 5 We assume that other modes such as cycling or walking do not cause congestion.

7
Where the number of cars traveling is 𝑉𝑎 𝑂𝑎⁄ . The analogous relationship for taxi vehicle kilometers is:
𝑉𝐾𝑡 = (1 + 𝜇𝑡) ∙ 𝐿𝑡 ∙𝑉𝑡
𝑂𝑡 (2)
where t is a parameter that accounts for kilometers traveled empty while looking for passengers (as a proportion of kilometers traveled with passengers on board). Bus vehicle kilometers is given by:
𝑉𝐾𝑏 = 𝛽 ∙ 𝐿𝑏 ∙𝑉𝑏
𝑂𝑏 (3)
where β is an equivalence factor between buses and light vehicles. This parameter will be greater than 1 and reflects the fact that one bus will use the space equivalent to several cars, depending on its size (for example, 1 bus=2 pcu – passenger car units). Vehicle kilometers using a ridesourcing application are given by:
𝑉𝐾𝑎𝑝𝑝 = (1 + 𝜇𝑎𝑝𝑝) ∙ 𝐿𝑎𝑝𝑝 ∙𝑉𝑎𝑝𝑝
𝑂𝑎𝑝𝑝 (4)
where app is as in the case of taxis a parameter that considers that vehicles will circulate without passengers some extent. We expect this parameter to be lower than in the case of taxis (i.e., 𝜇𝑎𝑝𝑝 < 𝜇𝑡), owing to the use of an application to find customers
rather than cruising the streets looking for them, and to GPS-based shortest path routing.6 An average trip has an origin-destination shortest path distance �̅�. However, the actual number of kilometers traveled between the origin and destination will differ between each mode. For example, in a bus, it is probable that the trip will be longer since buses run on fixed routes and these will probably not coincide exactly with the shortest path between the origin and destination of the trip.7 Therefore, the number of kilometers traveled by bus will be:
𝐿𝑏 = (1 + 𝜏𝑏) ∙ �̅� (5)
where b is a parameter reflecting the extra vehicle kilometers in bus trips above the shortest path of the trip.
6 As traditional taxis also incorporate smartphone based applications to contact costumers, as it is occurring in many cities (e.g., the app Easy Taxi in Chile), these two parameters will tend to converge. 7 However, this may imply more walking to and from bus stops rather that an increase in the number of vehicle kilometers.

8
Likewise, for private car travel, since users pay a fixed cost rather than a variable charge per kilometer and that not all drivers GPS or similar devices for routing, it may be that trip length is longer. Therefore, the trip length is:
𝐿𝑎 = (1 + 𝜏𝑎) ∙ �̅� (6) In the case of taxis, since they do not all use application based GPS systems, at least in Santiago, we also expect trip length to be somewhat higher than the shortest distance between origin and destination:
𝐿𝑡 = (1 + 𝜏𝑡) ∙ �̅� (7) For ridesourcing services we assume that they take the shortest route possible and assume it is equal to �̅�. With these assumptions, the total number of vehicle kilometers traveled will be:
𝑉𝐾𝑡𝑜𝑡 = 𝑉𝐾𝑎𝑝𝑝 + 𝑉𝐾𝑡 + 𝑉𝐾𝑝 + 𝑉𝐾𝑏 (8)
or,
𝑉𝐾𝑡𝑜𝑡 = �̅� ∙ [(1+𝜇𝑎𝑝𝑝)∙𝑉𝑎𝑝𝑝
𝑂𝑎𝑝𝑝+(1+𝜇𝑡)∙(1+𝜏𝑡)∙𝑉𝑡
𝑂𝑡+(1+𝜃)∙(1+𝜏𝑎)∙𝑉𝑎
𝑂𝑎+ 𝛽 ∙
(1+𝜏𝑏)∙𝑉𝑏
𝑂𝑏] (9)
Taking the derivative of expression (9) with respect to the number of ridesourcing trips, Vapp, will indicate how total vehicle kilometers change when ridesourcing applications increase ridership, at the expense of other modes:
𝑑𝑉𝐾𝑡𝑜𝑡𝑑𝑉𝑎𝑝𝑝
= �̅� ∙(1 + 𝜇𝑎𝑝𝑝)
𝑂𝑎𝑝𝑝⏟ 𝑟𝑖𝑑𝑒𝑠𝑜𝑢𝑟𝑐𝑖𝑛𝑔 𝑒𝑓𝑓𝑒𝑐𝑡
+ �̅� ∙(1 + 𝜇𝑡) ∙ (1 + 𝜏𝑡)
𝑂𝑡∙𝑑𝑉𝑡𝑑𝑉𝑎𝑝𝑝⏟
𝑡𝑎𝑥𝑖 𝑒𝑓𝑓𝑒𝑐𝑡
+ �̅� ∙(1 + 𝜃) ∙ (1 + 𝜏𝑎)
𝑂𝑎∙𝑑𝑉𝑎𝑑𝑉𝑎𝑝𝑝⏟
𝑐𝑎𝑟 𝑒𝑓𝑓𝑒𝑐𝑡
+ �̅� ∙ 𝛽 ∙(1 + 𝜏𝑏)
𝑂𝑏∙𝑑𝑉𝑏𝑑𝑉𝑎𝑝𝑝⏟
𝑏𝑢𝑠 𝑒𝑓𝑓𝑒𝑐𝑡
(10) Equation (10) can be interpreted as the change in total VKT due to the addition of one extra trip by ridesourcing. On the one hand, there is an increase in VKT given by the average number of vehicle kilometers added by the ridesourcing vehicle used in the trip, which is named as ‘ridesourcing effect’ (the first term of the right-hand side). This direct increase in VKT is counterbalanced with a reduction in the expected number of kilometers in the competing modes taxi, private car and bus. These taxi, car and bus effects are equal to the average number of kilometers that a single trip on these modes add to the streets,

9
times the substitution rates 𝑑𝑉𝑡
𝑑𝑉𝑎𝑝𝑝,
𝑑𝑉𝑎
𝑑𝑉𝑎𝑝𝑝 and
𝑑𝑉𝑏
𝑑𝑉𝑎𝑝𝑝 between trips in ridesourcing
applications and trips in taxi, car and bus, respectively. The modal substitution rates in equation (10) are expected to be negative, because the increase in VKT by ridesourcing will come from a reduction in VKT by other road modes. Moreover, the absolute value of the summation of these three substitution rates is less than one;
|𝑑𝑉𝑡
𝑑𝑉𝑎𝑝𝑝+
𝑑𝑉𝑎
𝑑𝑉𝑎𝑝𝑝+
𝑑𝑉𝑏
𝑑𝑉𝑎𝑝𝑝| < 1 (11)
because some trips in ridesourcing applications are new trips or come from modes that do not increase VKT, like metro (subway), walking and cycling. The fact that a combined ridesourcing-subway trip may replace a trip previously made fully by private car (therefore increasing metro ridership and reducing VKT) is numerically included in a scenario of Section 4. Thus, the last three terms of the right-hand side of equation (10) will be negative while the first term is positive. If expression (10) is positive (negative), ridesourcing applications increase (reduce) total vehicle kilometers. Average trip lengths and occupancy rates of all modes play a key role in the final outcome. Equation (10) assumes that there are supply changes in taxis and buses as customers substitute trips towards ridesourcing applications, in a way that average occupancy rates in taxis and buses remain constant. Thus, it is a medium-run evaluation of the impacts of ridesourcing applications on vehicle kilometers. In the short-run, if the same number of taxis and buses are circulating (and only private car car kilometers are saved by ridesourcing use), then the probability that ridesourcing applications increase VKT is much higher than what equation (10) would predict. 3. Uber use survey Next we describe the data used to parameterize the model. We first present the survey results, while other parameter values are discussed and shown in Section 4. An online survey to understand patterns of Uber use in Chile was undertaken between 11th and 20th January 2017. The questionnaire was made in Google Forms and was distributed online through email lists, social media and internet forums. It was addressed to Uber users, this being the first and most widely used ridesourcing application in Chile, although results are extensible to other ridesourcing applications. In total, there were 1,600 completed surveys, 91% of which were from people residing in Santiago (Table 1). This is expected since Uber was first introduced in the capital and Santiago is by far Chile’s most populated city.

10
Table 1: Survey responses by city residence
City of Residence Observations Percentage
Santiago 1,458 91%
Greater Valparaiso 58 4%
Greater Concepción 45 3%
Other 39 2%
Total 1,600 100%
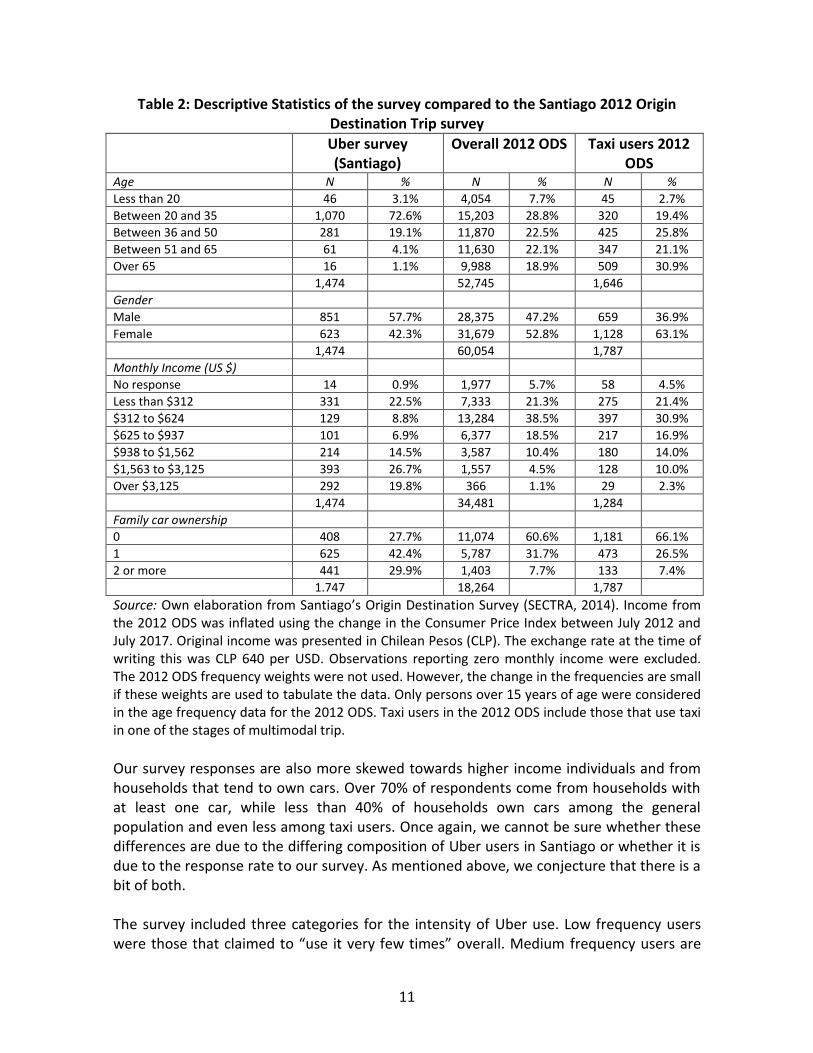
Table 2 presents descriptive statistics of the responses and compares them to information from the 2012 Origin Destination Survey (ODS) of Santiago8 (SECTRA, 2014; Muñoz et al., 2015), both overall and among taxi users. In order to make the comparison meaningful only survey observations from Santiago are used. From Table 2 we can see that survey respondents were overwhelmingly young, over 75% less than 36 years old. This does not reflect the overall age composition of the 2012 ODS for Santiago. Even if only people taking taxi trips are considered, the age distribution is very different. Among taxi users in the 2012 ODS over 50% are 51 years or older. This age composition, if it were representative of Uber users, mirrors findings from the Unites States (Rayle et al., 2016, Clewlow and Mishra, 2017; Henao, 2017), where ridesourcing apps are mainly used by younger people with higher income than the average population. In our case, age composition may also be influenced by the sampling method, as younger people are more familiar with modern digital technology and they are also more likely to use social media and thus answer our survey. The fact that the sampling method may overrepresent students and young users is accounted for in a scenario in Section 4. Our survey results also indicate a higher response among male users while the 2012 ODS is more balanced gender wise. It is interesting to note that females are more intense taxi users compared to males (63% to 37%), perhaps due to security concerns in other transport modes.
8 In Santiago, origin destination surveys that cover the whole metropolitan area have been conducted by the government every 10 years.
11
Table 2: Descriptive Statistics of the survey compared to the Santiago 2012 Origin Destination Trip survey
Uber survey (Santiago)
Overall 2012 ODS Taxi users 2012 ODS
Age N % N % N %
Less than 20 46 3.1% 4,054 7.7% 45 2.7%
Between 20 and 35 1,070 72.6% 15,203 28.8% 320 19.4%
Between 36 and 50 281 19.1% 11,870 22.5% 425 25.8%
Between 51 and 65 61 4.1% 11,630 22.1% 347 21.1%
Over 65 16 1.1% 9,988 18.9% 509 30.9%
1,474 52,745 1,646
Gender
Male 851 57.7% 28,375 47.2% 659 36.9%
Female 623 42.3% 31,679 52.8% 1,128 63.1%
1,474 60,054 1,787
Monthly Income (US $)
No response 14 0.9% 1,977 5.7% 58 4.5%
Less than $312 331 22.5% 7,333 21.3% 275 21.4%
$312 to $624 129 8.8% 13,284 38.5% 397 30.9%
$625 to $937 101 6.9% 6,377 18.5% 217 16.9%
$938 to $1,562 214 14.5% 3,587 10.4% 180 14.0%
$1,563 to $3,125 393 26.7% 1,557 4.5% 128 10.0%
Over $3,125 292 19.8% 366 1.1% 29 2.3%
1,474 34,481 1,284
Family car ownership
0 408 27.7% 11,074 60.6% 1,181 66.1%
1 625 42.4% 5,787 31.7% 473 26.5%
2 or more 441 29.9% 1,403 7.7% 133 7.4%
1.747 18,264 1,787
Source: Own elaboration from Santiago’s Origin Destination Survey (SECTRA, 2014). Income from the 2012 ODS was inflated using the change in the Consumer Price Index between July 2012 and July 2017. Original income was presented in Chilean Pesos (CLP). The exchange rate at the time of writing this was CLP 640 per USD. Observations reporting zero monthly income were excluded. The 2012 ODS frequency weights were not used. However, the change in the frequencies are small if these weights are used to tabulate the data. Only persons over 15 years of age were considered in the age frequency data for the 2012 ODS. Taxi users in the 2012 ODS include those that use taxi in one of the stages of multimodal trip.
Our survey responses are also more skewed towards higher income individuals and from households that tend to own cars. Over 70% of respondents come from households with at least one car, while less than 40% of households own cars among the general population and even less among taxi users. Once again, we cannot be sure whether these differences are due to the differing composition of Uber users in Santiago or whether it is due to the response rate to our survey. As mentioned above, we conjecture that there is a bit of both. The survey included three categories for the intensity of Uber use. Low frequency users were those that claimed to “use it very few times” overall. Medium frequency users are

12
those that said to “use it very few times per month”, while high frequency users where those that claimed to “use it every week, almost every day or every day”. Figure 1 shows the intensity of use by income groups. It can be seen that the intensity of use increases with income. This may be due to the larger cost of an Uber trip relative to the public transport fare in Santiago (around 1 US dollar), lower access to smartphones with an active data account among lower income households and probably because in Chile lower income individuals do not have access to credit cards (although in 2016 Uber started to accept cash for their service). However, it is striking that there are many lower and middle-income individuals (relative to the survey sample) that are high or medium intensive users of this application; it is expected that tertiary education students are in this group.
Figure 1: Frequency of ridesourcing use versus personal income
Figure 2 shows the answers to the question “What are your reasons to use Uber?” in which respondents could answer more than one alternative. The most important reasons for using Uber are the ease of payment9, trip cost, the transparency of the charging system compared to taxi-meters, and the possibility of identifying the driver and rating his/her performance. Other important motives include short waiting times, lack of convenient public transportation, not having to drive after drinking alcohol and the perception of the service being more secure than other modes.
9 Ease of payment was also the number one reason to use ridesourcing apps in the San Francisco survey reported by Rayle et al. (2016).

13
Figure 2: Respondents’ reasons to use Uber
The next question is about trip purposes for which respondents use Uber. Figure 3 depicts that more than 70% of respondents use Uber for social and recreational purposes like going to bars, restaurants and parties, while Uber is used by less than 30% of respondents for compulsory activities, like trips to work or study. This finding is in line with the actual timing of Uber trips in Santiago, as the weekly peak of Uber use is on Fridays and Saturdays between 9 PM and 12 AM, according to detailed trip timing information given by Uber to a local newspaper10. This period is the usual time in which people go out on weekends in Santiago.
10 “Uber detecta mayor aumento de viajes entre zonas periféricas y el centro en horas punta”, El Mercurio newspaper, March 4th, 2017, http://impresa.elmercurio.com/Pages/NewsDetail.aspx?dt=2017-03-04&dtB=04-03-2017%200:00:00&PaginaId=9&bodyid=3, accessed October 17th, 2017.

14
Figure 3: Purpose of trips made by Uber
The questionnaire also asked for the last trip made using Uber. In Santiago, there were 1,474 responses. Regarding trip length of the last trip made, 58% of trips are shorter than 6 km and 84% are shorter than 10 km, as reported by users. One of the key parameters for our model is the transport mode that would have been used in the counterfactual scenario that Uber was unavailable. In total, close to 41% of users say they would have taken a traditional taxi in their last trip (Figure 4). Thus, this application is clearly a substitute for traditional cab services, however, the majority of trips seem to come from other modes. What looks more problematic in terms of VKT effects is that 32,5% of users said they would have taken public transportation and only 12.1% would have taken an automobile. Walking and cycling do not seem to have a high substitution rate with Uber. When we analyze the substitute mode for the last trip made during weekdays and weekends or holidays (Figure 5) we see that 35,8% of Uber users would have used public transportation during a weekday trip. This is of some concern given that it was shown above that most Uber trips during weekdays are taken during or very close to congested rush hour times (7 AM to 9 AM and 6 PM to 8 PM are the rush hour times in Santiago).

15
Figure 4: Ridesourcing modal substitution
Figure 5: Ridesourcing modal substitution by type of day

16
If we look in more detail to Uber trips taken during weekdays (891 observations) we see that during peak times more than 50% of Uber trips would have been taken otherwise using public transportation, bicycle, walking or using a shared taxi (see Table 3). This points to a potential impact on negative externalities such as congestion, pollution and accidents of the introduction of ridesourcing platforms such as Uber. Further below we will use this information to simulate the potential effects of ridesourcing on VKT.
Table 3: Ridesourcing substitution by time of day - weekdays Mode Day - peak Day - off
peak Night 1 (8 PM-12PM)
Night 2 (12 PM–6
AM)
Total
Taxi 36% 42% 39% 38% 39%
Car 11% 11% 12% 13% 12%
Public transportation: bus 42%
17% 35%
12% 35%
19% 27%
24% 36%
17%
Public transportation: bus-metro 17% 14% 8% 2% 11%
Public transportation: metro 9% 9% 8% 2% 8%
Shared taxi (colectivo) 1% 2% 1% 2% 1%
Bicycle 4% 0% 3% 1% 2%
Walking 3% 3% 0% 2% 2%
I would have not traveled 1% 1% 5% 12% 3%
Another mode 2% 5% 5% 5% 4%
Total 100% 100% 100% 100% 100%
Number of observations 224 323 216 128 891
Table 4 presents the same information as Table 3 for weekend and holiday trips (574 observations). Once again over 50% of trips come from modes different from traditional taxis and is consistent with the results of Rayle et al. (2016). Figure 6 disaggregate the alternative mode of travel by income level. As expected higher income households substitute more from taxi and private car use while lower income households substitute more from public transportation.
Table 4: Ridesourcing substitution by time of day – weekends and public holidays Mode Day Night 1 Night 2 Total
Taxi 39% 42% 47% 44% Car 10% 21% 10% 13% Public transportation: bus
42%
20% 29%
14% 20%
17% 28%
17% Public transportation: bus-metro 20% 11% 2% 9% Public transportation: metro 2% 3% 1% 2% Shared taxi (colectivo) 2% 1% 3% 2% Bicycle 1% 1% 0% 1% Walking 2% 3% 2% 2% I would have not traveled 2% 4% 14% 8%

17
Another mode 1% 0% 4% 2% Total 100% 100% 100% 100% Number of observations 139 157 278 574
Figure 6: Ridesourcing substitution versus personal income
Figure 7: Ridesourcing substitution versus car ownership

18
Figure 7 shows that car ownership does not affect much the substitute mode except of course as concerns the alternative use of a private car. In the survey, 79 respondents (5.4% of the total) said that without Uber they would have not made the trip. It is worth analyzing the time of day of those trips induced by Uber. Results show that 90% of these trips were made at night, with a majority of them being made late at night (from midnight to 6 AM). Moreover, Figure 6 shows that most of these new trips come from lower income users. Therefore, ridesourcing apps are allowing the engagement on activities that otherwise would have not been undertaken (or not for the desired duration), especially late at night and for lower income users, which are more dependent on public transport that is scarce at night (the Metro service closes before midnight in Santiago).
Figure 8: Induced ridesourcing trips by time period
4. Monte Carlo simulation 4.1 Input parameters Monte Carlo is a simulation technique that uses randomly generated numbers to simulate processes subject to uncertainty. In this work, we perform Monte Carlo simulations to estimate the probability that expression (10) is positive or negative, i.e., if there an increase or reduction in total VKT due to the addition of ridesourcing trips. A simulation method seems appropriate given the elements that introduce uncertainty on the value of the parameters of expression (10), including the substitution of other modes by ridesourcing, which is based on the results of the survey described in Section 3. In the absence of known probability distributions for the random parameters, we apply a simple approach in which random parameters are assumed to follow a uniform

19
distribution on an interval [a,b], where a and b need to be estimated from available data. These input parameters are summarized in Table 5 and explained next. First, regarding occupancy rates, in SECTRA (2013) the occupancy rate of vehicles was measured in 406 spots across Santiago. Taking the average for all observations, results show that public buses carry between 28 and 65 passengers, that car occupancy rate is between 1.4 and 1.5 passengers per vehicle, and that, when used, taxi occupancy rate is between 1.3 and 1.4 (without counting the driver). However, taxis had only the driver between 45% and 58% of the observations. The large number of times in which taxis run empty of passengers is in the order of estimations made in other cities. The time taxis move without passengers as a rate of the total driving time has been estimated as 41.6% for Berlin (Bischoff et al., 2015), 50-52% for New York (Cramer and Krueger, 2016) and 61-62% for Seattle (Cramer and Krueger, 2016). With self-collected data in Denver, Henao (2017) estimates that ridesourcing deadheading distance is between 34.6% and 40.8%, depending on whether the distance to travel from/to home at the beginning/end of the work shift is considered. The deadheading time rate is reported to be larger than the deadheading distance rate (Henao, 2017). Cramer and Krueger (2016) also report the distance rate in which taxis and Uber vehicles drive without passengers, the figures are 59.1% and 61.9% (taxi), 35.8% and 44.8% (Uber) for Los Angeles and Seattle, respectively. Therefore, the distance rate traveled without passengers for Uber is between 60% and 74% the distance without passengers for taxis, a measure of the efficiency induced by the matching between supply and demand that is achieved with ridesourcing applications. We will use these parameters in the simulation as follows:
𝜇𝑎𝑝𝑝 = 𝐺𝑜𝜇𝑡
𝑂𝑎𝑝𝑝 = 𝐹𝑜𝑂𝑡
Parameter 𝐺𝑜 is the ratio between the percentage of empty kilometers by ridesourcing to the percentage of empty kilometers by taxi, we assume 𝐺0 ∈ [0.60,0.74] based on Cramer and Krueger (2016). Parameter 𝐹𝑜 is the ratio between the mean ridesourcing occupancy and the mean taxi occupancy, it should be larger than 1 because ridesourcing may make it easier for relatives, friends and acquaintances to travel together, we assume 𝐹0 ∈[1.0,1.3]. For the average trip length, we assume �̅� ∈ [4.0, 8.0], following the answers to the survey. We further include that average trip length by private car and taxi is up to 10% larger than average trip length by ridesourcing, assuming that all ridesourcing drivers use GPS navigation for optimal routing, but not all car and taxi drivers do so. As bus routes in general deviate from shortest paths, we assume 𝜏𝑏 ∈ [0.1,0.3]. Regarding cruising for parking, there is no study of this issue in Santiago. It is assumed in the simulation that the average distance searching for parking is between 1% and 10% of the average trip length, with which we obtain an average cruising for parking distance of

20
340 meters. Bus equivalency factor goes between 1.5 bus/car (for a 8-metre long bus) and 3 bus/car (for a 18-meter articulated bus), which is the range of bus equivalency factors typically used in Chile (MDS-SECTRA, 2013).
Finally, with respect to the substitution rates 𝑑𝑉𝑡
𝑑𝑉𝑎𝑝𝑝,
𝑑𝑉𝑝
𝑑𝑉𝑎𝑝𝑝 and
𝑑𝑉𝑏
𝑑𝑉𝑎𝑝𝑝 , for the uniform
distribution we assume a symmetrical range around the mean values found in the survey
(40.7% for taxi, 27.1% for bus, 12.1% for car), that is 50% wide, i.e., if 𝑑𝑉𝑖
𝑑𝑉𝑎𝑝𝑝= 𝑐 on the
survey, for the simulation we assume 𝑑𝑉𝑖
𝑑𝑉𝑎𝑝𝑝 ~𝑈(0.75𝑐, 1.25𝑐). Later, a sensitivity analysis
is performed over this parameter.
Table 5: Input parameters, base case
Parameter Unit Min Max
Trip length �̅� Km 4.0 8.0
Occupancy taxi 𝑂𝑡 Pax/veh 1.3 1.4
Occupancy car 𝑂𝑎 Pax/veh 1.4 1.5
Occupancy bus 𝑂𝑏 Pax/veh 28 66
Extra distance rate auto 𝜏𝑎 - 0.0 0.1
Extra distance rate taxi 𝜏𝑡 - 0.0 0.1
Extra distance rate bus 𝜏𝑏 - 0.1 0.3
Increased occupancy rate ridesourcing 𝐹𝑜 - 1.0 1.3
Extra distance rate parking 𝜃 - 0.01 0.1
Reduced rate of empty kilometers 𝐺𝑜 - 0.60 0.74
Rate of taxi empty kilometers 𝜇𝑡 - 0.45 0.58
Bus equivalency factor 𝛽 bus/car 1.5 3.0
Substitution rate car - -0.09 -0.15
Substitution rate taxi - -0.31 -0.51
Substitution rate bus - -0.20 -0.34
4.2 Base results
We perform a Monte Carlo simulation of equation (10) with 20,000 replications11. Assuming that parameters of Equation 7 follow a uniform distribution with minimum and maximum values as in Table 5, we obtain that in the base case the probability that ridesourcing reduces VKT is zero. That is to say, in none of the 20,000 replications of equation (10), its value was negative. The ridesourcing effect in equation (10) is 5.24
11 We used the well-known sample size formula for the estimation of a mean that is normally distributed (see, e.g., Chapter 7 in Roess et al., 2011). First, with 10,000 replications a standard deviation of 0.68 km was obtained. Then, for a 95% confidence interval and a desired margin of error of 0.01 km/trip, we obtain a sample size of 18,570 iterations.

21
km/trip on average, whereas average taxi, car and bus effects are -2.88, -0.56, -0.10 km/trip, respectively (see equation 10). Therefore, for each new ridesourcing trip, there is an average increase of 1.70 km. To put it differently, on average, an increase 1000 meters driven in ridesourcing is associated with an average reduction of 550 meters of taxi driving, 106 meters of car driving and 19 meters of bus (on car-equivalent driving). In sum, the average reduction of kilometers in car, taxi and bus combined only amounts to 68% of the average addition of VKT by ridesourcing. Although we assumed ridesourcing to be more efficient than taxis in two ways (fewer empty kilometers and a larger mean passenger occupancy rate per trip), the result of an increase in VKT is explained by the substitution of trips previously made by public transportation (bus and/or metro), by the addition of new trips (generated demand by ridesourcing) and, to a lesser extent, by the substitution of trips on other modes like walking and cycling. The finding of an increase of VKT due to ridesourcing is in line with the deterministic analysis of Henao (2017) who estimates an increase of 84.6% in VKT due to ridesourcing in Denver, Colorado. Other authors like Rayle et al. (2016) have not been conclusive on this issue, while Clewlow and Mishra (2017) conclude that ridesourcing has likely increased VKT in the seven cities in which they collected data. In the next section we perform an analysis of alternative scenarios, by means of introducing new assumptions into specific parameter values of the model. 4.3 Analysis of scenarios 4.3.1 Increased ridesourcing occupancy rate. A key variable to the base result of an increased total VKT is the occupancy rate of ridesourcing vehicles. In the simulation, average ridesourcing occupancy rate, while in passenger service, is 1.55 pax/veh in the base scenario. Now we run the simulation assuming two alternative cases in which mean occupancy rate in ridesourcing is increased to 2.0 and 2.4 pax/veh. When mean ridesourcing occupancy is 2.0, the probability of reducing VKT is 14.6%, and only when the mean occupancy rate is 2.4 pax/veh, the probability of reducing VKT is 50%. Figure 9 depicts both cases, in Figure 9a it is shown the histogram of the 20,000 replications for the simulation of equation 7 (which is on the horizontal axis). Alternatively, Figure 9b shows the cumulative probability of the cases with 2.0 and 2.4 pax/veh, for the range of values of total VKT effect (expression 10). In summary, we find that ridesourcing apps should have an occupancy rate that is between 60 and 70% larger than current taxi occupancy rate in order to have a 50% probability of reducing VKT, once randomness on the relevant parameters is included in the analytical framework.

22
(a) Histogram
(b) Cumulative probability
Figure 9: Expected result on VKT for different ridesourcing occupancy rates
23
4.3.2 Increased attraction of taxi trips and reduced attraction of public transportation trips Because of the way the survey was distributed, there might be an overrepresentation of young lower income users among respondents. Different income groups have different modal substitution rates as shown in Figure 7. We simulate a scenario in which average substitution rates are those of a higher income group, to correct for this potential bias due to the survey sampling method. Using the substitution rates for the second highest income group as the average rates for the simulation, we assume mean substitution rates to be 50.6% for taxi, 18.8% for bus and 10.7% for car (see Figure 7), the parameters are again assumed to follow a uniform distribution between 0.75 and 1.25 times the mean value. The result of this scenario is that the probability of reducing VKT increases from zero to 2.0%, i.e., it continues to be negligible without an increase of the ridesourcing occupancy rate. 4.3.3 The last-mile problem In the survey there are no question on the use of Uber as a complement of mass public transportation like the subway (metro) system in Santiago. If a trip that used to be made with a feeder mode (say bus, taxi, private car) in combination with metro, is replaced by a trip Uber-metro, there is no bias in the analysis already performed because the effect on VKT is already accounted for. However, if an entire trip by private car is replaced by a combination Uber-metro, in this case there is a likely reduction of VKT, which is not correctly internalized in the previous analysis. A simple way to account for this effect is to increase the average length of the car trips that are being substituted. In order to do so, we assume that car trips are between 2 and 4 times larger than the ridesourcing stage of the ridesourcing-metro that replace full car trips, and that 20% of total ridesourcing trips are on this situation. With this, average car trip length replaced by ridesourcing is between 20 and 60% larger than the average ridesourcing trip length, a value that is likely overestimating the impact on the last-mile effect on replacing full car trips. Even with this assumption, the simulation result is that the probability of reducing VKT with ridesourcing is zero. 4.3.4 Scenarios 4.3.2 and 4.3.3 combined We then run a scenario with the assumptions of scenarios 4.3.2 and 4.3.3 combined. In this case, the probability of ridesourcing to reduce VKT is 4.5%. In summary, with our preferred set of parameters, we find that ridesourcing increases VKT by a large margin, and that including scenarios that account for expected extra benefits of ridesourcing is unlikely to change this output, unless the occupancy rate of vehicles

24
increases significantly (Scenario 4.3.1). This finding corroborates similar results from the recent literature; for example Truong et al. (2017) estimate that autonomous vehicles (AV) in Victoria, Australia, will not increase VKT only if AV occupancy rates are larger than current car occupancy rates, in the context of the growing literature that attempt to estimate the effect of AV carsharing and ridesharing on VKT and energy consumption (e.g., Brown et al., 2014; Fagnant and Kockelman, 2014; Wadud et al., 2016; Kröger and Kichhöfer, 2017). This issue directs us to analyze the effect of the introduction of ridesharing in our framework.
4.4 Ridesharing We include in the simulation framework the case of ridesharing, i.e., shared ridesourcing services, in which the same car is shared by multiple users who are not traveing together. A first issue that needs attention is finding a range of expected values for the mean occupancy rate of ridesharing vehicles. Alonso-Mora et al. (2017) simulated the operation of a fleet of shared ridesourcing vehicles in New York City; depending on fleet size and maximum acceptable waiting time, the optimization model shows that mean occupancy rate of ridesharing vehicles with capacity of 4 passengers, goes from around 1.1 pax/h (larger fleet, shorter waiting time) to around 3.2 pax/veh (smaller fleet, longer waiting time). For example, a fleet of 3,000 vehicles (around 22% of current active taxis in New York City) could serve 98% of the taxi demand with an excess travel time of 2.3 min (compared to the shortest-path travel time) and mean occupancy rates up to 2.5 passengers per vehicle. A simulation of shared autonomous taxis in the city of Lisbon (OECD/ITF, 2015) shows average occupancy rates between 2.1 and 2.8 pax/veh, depending on time-of-day. In Santiago, current average occupancy rates of colectivos (shared taxis running on fixed routes) is between 2.2 and 3.512, i.e., while used, colectivos have an occupancy rate that is between 2.0 and 2.8 times the occupancy rates of taxis. Moreover, colectivos were observed without passengers between 3% and 30% of the times, compared to taxis that did not have passengers between 45% and 58% of observations. Alonso-Mora et al. (2017) only study the substitution between current taxi trips and on-demand ridesharing services to conclude that such a move would provide large savings in fleet size and congestion. However, as ridesharing will also attract passengers from mass public transportation, this conclusion is not evident. With ridesharing, we assume that empty kilometers are between 20% and 70% of the empty kilometers of ridesourcing and that mean occupancy rate, while used, is between 2.0 and 3.5 pax/veh (similar to the values of colectivos in Santiago). Based on the Lisbon simulation by OECD/ITF (2015), we further assume that mean travel distance by ridesharing is between 20% and 60% larger than the shortest path travel distance. Results shows that with these assumptions, probability of reducing VKT in this case is 37.5%.
12 Own calculation based on SECTRA (2013)

25
Therefore, having ridesharing services is a key to the impact of the new mobility technologies on VKT. Next, we do a sensibility analysis of the probability of reducing VKT as a function on the mean occupancy rate of ridesharing services, as shown in Figure 10. The result of ridesharing on VKT is quite sensitive on the mean occupancy rate achieved by ridesharing. With 2.6 passengers per vehicle in average, there is a probability of 24% of reducing VKT, while with 3 passengers per vehicle, that probability is 55%.
Figure 10: Probability of reducing VKT by the introduction of ridesharing
5. Conclusions Many authors have pointed out the importance of determining the impact of ridesourcing on vehicle kilometers traveled VKT (or vehicle miles traveled VMT) and thus on externalities such as congestion (Rayle et al., 2016; Clewlow and Mishra, 2017; Henao, 2017). However, to date there is scant evidence on this subject. In this paper we use survey results on Uber use by residents of Santiago, Chile, and information from other studies to parameterize a model to determine whether the advent of ridesourcing applications such as Uber increases or decreases the number of VKT. Given uncertainty regarding some the parameters, we use a Monte Carlo simulation using a range of possible parameter values to study this issue.

26
Our base scenario indicates that ridesourcing applications have increased VKT. This occurs because many trips made using ridesourcing services come from mass transit or are new trips (induced demand). However, as the occupancy rate of ridesourcing trips increases, the possibility that ridesourcing decreases VKT is higher. If ridesourcing becomes truly ridesharing, there is a probability larger than 50% of reducing VKT if mean occupancy rate is 2.9 pax/veh or superior. Thus, the average occupancy rate among ridesourcing users is a key parameter that determines the impact on VKT. It is probable that our results are conservative in terms of the positive impact of ridesourcing on VKT. Our model assumes that as users switch from transit or taxis to ridesourcing services, the supply of buses and taxis is adjusted to the new demand conditions. If this is not the case, then it is even more likely that ridesourcing applications increase VKT and thus congestion, at least until there is a supply adjustment of the other modes. However, in this case, as least for buses, there will be a negative impact on users that depend on mass transit (for example, if they cannot afford the ridesourcing fare) since frequency or route coverage will decrease13. This raises issues not only on the efficiency effects of ridesourcing, but also on the equity impacts of these new mobility technologies. Our findings point to the need to study the potential and take-up of ridesharing applications (such as Uber Pool). In Chile some non-profit ridesharing applications are already in use (“All Ride” for example). However, to date they have had limited use among the population. We conjecture that the prior existence of a shared taxi industry, privacy and security considerations of traveling with unknown passengers, plus the absence of high-occupancy vehicle lanes in Chile (that may provide incentives for such applications elsewhere), may limit the adoption and popularity of ridesharing applications. Further research needs to be undertaken on this issue given that, according to our results, it is crucial to increase average occupancy rates of ridesourcing applications if these are to have beneficial externality effects. Our results may seem at odds with those of Li et al. (2016), who find a negative correlation between congestion and the appearance of Uber in US metropolitan areas. However, they conjecture that ridesourcing applications such as Uber have the potential to reduce car ownership, increase car occupancy rates due to ridesharing and delay trips during peak hours (due to surge pricing). Further research should try to reveal whether different parameter values, particularly for ridesharing occupancy rates, might explain their results as compared to ours.
13 The effect of service frequency on reducing passenger waiting time and therefore encouraging public transportation use is known as the ‘Mohring effect’ (Mohring, 1972).

27
There are other areas for further research. Large differences in door-to-door travel time between ridesourcing and traveling by private cars do exist (Henao and Marshall, 2017), with parking time as a key factor on this outcome. The implications of ridesourcing on the need for parking infrastructure and parking fees are still to be explored; seminal results on the effect of shared AVs on parking demand are promising (Zhang et al., 2015). The effect of ridesourcing applications on long-run vehicle ownership decisions and their impact on externalities is another relevant open question. Acknowledgements This research is supported by the Complex Engineering Systems Institute (CONICYT: FB0816) References Alonso-Mora, J., S. Samaranayake, A. Wallar, E. Frazzoli and D. Rus (2017). On-demand high-capacity ride-sharing via dynamic trip-vehicle assignment. Proceedings of the National Academy of Sciences 114(3): 462-467. Arnott, R. and E. Inci (2006). An integrated model of downtown parking and traffic congestion. Journal of Urban Economics 60(3): 418-442. Bischoff, J., M. Maciejewski and A. Sohr (2015). Analysis of Berlin’s taxi services by exploring GPS traces. Models and Technologies for Intelligent Transportation Systems (MT-ITS), 3-5. June 2015. Budapest, Hungary. Brown, A., J. Gonder and B. Repac (2014). An Analysis of Possible Energy Impacts of Automated Vehicle. Road Vehicle Automation. G. Meyer and S. Beiker. Cham, Springer International Publishing: 137-153. Chen, P. and Y. Nie (2017). Connecting e-hailing to mass transit platform: Analysis of relative spatial position. Transportation Research Part C: Emerging Technologies 77: 444-461. City of New York (2016). For-Hire Vehicle Transportation Study’. Bill de Blasio, Mayor, Office of the Mayor, January. Clewlow, R. R. and G. S. Mishra (2017). Disruptive Transportation: The Adoption, Utilization, and Impacts of Ride-Hailing in the United States. Research Report – UCD-ITS-RR-17-07, UC Davis Institute of Transportation. Cramer, J. and A. B. Krueger (2016). Disruptive change in the taxi business: the case of Uber. NBER Working Paper 22083.

28
Dills, A. K. and S. E. Mulholland (2016). Ride-Sharing, Fatal Crashes, and Crime. SSRN Scholarly Paper ID 2783797, Social Science Research Network, Rochester, NY, May. Dinning, M. and T. Weisenberger (2017). Multimodal Transportation Payments Convergence—Key to Mobility. Disrupting Mobility: Impacts of Sharing Economy and Innovative Transportation on Cities. G. Meyer and S. Shaheen. Cham, Springer International Publishing: 121-133. Fagnant, D. J. and K. M. Kockelman (2014). The travel and environmental implications of shared autonomous vehicles, using agent-based model scenarios. Transportation Research Part C: Emerging Technologies 40(Supplement C): 1-13. Greenwood, B. and S. Wattal (2015). Show Me The Way To Go Home: An Empirical Investigation of Ride Sharing and Alcohol Related Motor Vehicle Homicides. Fox School of Business Research Paper No. 15-054. Hall, J., C. Palsson and J. Price (2017). Is Uber a substitute or complement to public transit? Working paper, University of Toronto. Henao, A. (2017). Impacts of ridesourcing –LYFT and UBER—on transportation including VMT, Mode replacement, parking and Travel Behavior. Ph.D. Thesis, University of Colorado. Henao, A. and W. Marshall (2017). A Framework for Understanding the Impacts of Ridesourcing on Transportation. In: Meyer G., Shaheen S. (eds) Disrupting Mobility. Lecture Notes in Mobility. Springer, Cham. Hensher, D. (2017). Future bus transport contracts under a mobility as a service (MaaS) regime in the digital age: Are they likely to change? Transportation Research Part A 98: 86-96. Iacobucci, J., K. Hovenkotter and J. Anbinder (2017). Transit Systems and the Impacts of Shared Mobility. Disrupting Mobility: Impacts of Sharing Economy and Innovative Transportation on Cities. G. Meyer and S. Shaheen. Cham, Springer International Publishing: 65-76. Kröger, L. and B. Kichhöfer (2017). Autonomous car- and ridesharing systems: Simulation-based analysis of potential impacts on the mobility market. Symposium of the European Association for Research in Transportation (hEART), Haifa, Israel, September 2017. Li, Z., Y. Hong and Z. Zhang (2016). An empirical analysis of on-demand ride sharing and traffic congestion. Thirty Seventh International Conference on Information Systems, Dublin.

29
MDS-SECTRA (2013). Manual de Evaluación Social de Proyectos de Vialidad Urbana (MESPIVU). Available at http://www.sectra.gob.cl, accessed Nov 4th, 2017. Mohring, H. (1972). Optimization and scale economies in urban bus transportation. American Economic Review 62(4): 591-604. Muñoz, V., A. Thomas, C. Navarrete and R. Contreras (2015). Encuesta Origen Destino de Santiago 2012: Resultados y validaciones. Ingeniería de Transporte 19(1): 21-36. Ngo, V. (2015). Transportation Network Companies and the Ridesourcing Industry: A Review of Impacts and Emerging Regulatory Frameworks for Uber. Report prepared for the City of Vancouver, October. OECD/ITF (2015). Urban mobility system upgrade: How shared self-driving cars could change city traffic. International Transport Forum. OECD/ITF (2016). App-Based Ride and Taxi Services: Principles for Regulation. International Transport Forum. Rayle, L., D. Dai, N. Chan, R. Cervero and S. Shaheen (2016). Just a better taxi? A survey-based comparison of taxis, transit, and ridesourcing services in San Francisco. Transport Policy 45: 168–178. Roess, R. P., E. S. Prassas and W. R. McShane (2011). Traffic Engineering. Fourth Edition, Pearson. SECTRA (2013). Mediciones de aforos de tráfico y perfiles de carga en servicios troncales en el Gran Santiago. Report prepared by DICTUC. SECTRA (2014). Encuesta de Origen y Destino de Viajes Santiago 2012. Report and database available at www.sectra.gob.cl. Shoup, D. C. (2006). Cruising for parking. Transport Policy 13: 479-486. Truong, L. T., C. De Gruyter, G. Currie and A. Delbosc (2017). Estimating the trip generation impacts of autonomous vehicles on car travel in Victoria, Australia. Transportation. Wadud, Z., D. MacKenzie and P. Leiby (2016). Help or hindrance? The travel, energy and carbon impacts of highly automated vehicles. Transportation Research Part A: Policy and Practice 86: 1-18. Zhang, W., S. Guhathakurta, J. Fang and G. Zhang (2015). Exploring the impact of shared autonomous vehicles on urban parking demand: An agent-based simulation approach. Sustainable Cities and Society 19: 34-45.