does transparency and openness pay when the … · market is uncertain? evidence from disclosure on...
TRANSCRIPT
Academy of Accounting and Financial Studies Journal Volume 21, Number 3, 2017
1 1528-2635-21-3-126
DOES TRANSPARENCY AND OPENNESS PAY WHEN THE
MARKET IS UNCERTAIN? EVIDENCE FROM
DISCLOSURE ON SECURITIZATION LOSSES
Michele Fabrizi, Università Degli Studi di Padova
ABSTRACT
This study uses the unfolding of the subprime mortgage crisis as a research setting to
investigate whether the market rewards openness and transparency in a highly uncertain environment.
Using a sample of 79 U.S. banks and 28 event dates I document that i) banks experienced negative
market returns around event dates leading to the subprime crisis, ii) the investors’ negative market
reaction was significantly stronger for banks with large exposure to securitizations compared to banks
with few securitization transactions, iii) investors reacted less negatively in the presence of disclosure
about securitization losses, regardless of whether banks disclosed high or low losses on securitizations.
Overall, results suggest that in the presence of high uncertainty, transparency and openness is
ultimately rewarded by the market.
Keywords: Disclosure, Securitization, Market Reaction, Transparency
INTRODUCTION
This paper investigates whether during the unfolding of the subprime mortgage crisis the
market rewarded banks that were transparent in disclosing information about securitization losses.
Theoretical research suggests that enhanced disclosure can reduce the adverse selection component of
the bid-ask spread (Amihud and Mendelson, 1986) and the non-diversifiable estimation risk (Klein and
Bawa 1976; Barry and Brown 1985; Coles and Loewenstein 1988; Handa and Linn 1993). Nonetheless,
disclosing information can be costly for firms, in particular when being open and transparent to the
market means communicating negative news. Indeed, Skinner (1994) shows that the market responds
negatively to bad news disclosure, and Kasznik and Lev (1995) find that returns of firms that warn
about earnings shortfall are significantly lower than returns of those that likely anticipate an earnings
shortfall but do not warn. This finding has been interpreted as a market penalty for openness. Tucker
(1995) challenges this viewpoint and shows that, after controlling for self-selection, openness is
penalized by investors in the short-term but not in the long-term. Therefore, the economic impact of
openness and transparency is a currently debated issue with proponents and opponents of the view that
openness is penalized by the market.
In this paper, I use the unique research setting of securitization disclosure of U.S. financial
institutions to investigate whether the market - during the unfolding of the subprime mortgage crisis –
rewarded those financial institutions that were transparent in disclosing losses on securitized assets.
Securitization transactions, which consist of converting illiquid assets into liquid securities,
were the engine of financial innovation in the pre-crisis years and gave rise to exotic financial
instruments that found their way, either directly or indirectly, onto commercial and investment banks’
balance sheets. When the subprime mortgage market collapsed, these financial instruments revealed
their high risk and swamped the financial industry (Cerbioni et al., 2015). One of the major issues
related to securitization transactions was the lack of information available to investors about the risks

Academy of Accounting and Financial Studies Journal Volume 21, Number 3, 2017
2 1528-2635-21-3-126
undertaken by banks. Indeed, the near absence of information available has made it difficult for banks’
investors to control and discipline the process of originating and securitizing risky loans (see Barth and
Landsman 2010). In early 2007, the risks undertaken by banks through securitization transactions
started becoming evident, with media and business press reporting an increasing number of news about
the severe and negative consequences of banks’ subprime mortgage positions. Given the poor
disclosure offered by banks about the nature of their securitization transactions, investors were left with
the uncertainty about the potential risks embedded in the securitization transactions undertaken by
banks. Specifically, although very important to evaluate the potential risk of securitization transactions
(Cerbioni et al., 2015), the amount of losses recorded on securitized assets was often not disclosed.
Indeed, even if SFAS 140 required financial institutions to disclose information about losses on
securitized assets, there was ample variation among banks on the extent to which such disclosure was
provided.
In a context of high uncertainty, in which investors assist to the unfolding of the subprime crisis
and become aware of the risks embedded in securitizations, the market might react to disclosure about
securitization losses in two ways: i) either by penalizing banks that communicate losses, or ii) by
rewarding them because of their transparency and openness. This is the empirical question I investigate
in this paper.
To empirically address the research question, I use hand-collected data on securitization
disclosure for a sample of 79 U.S. financial institutions and abnormal market returns around 28 event
dates that marked the unfolding of the subprime crisis according to three information sources (USA
Today, BBC News, Wall Street Journal). In the analysis, I document three main findings: 1) banks
experienced negative market returns around event dates leading to the subprime crisis; 2) the investors’
negative market reaction was significantly stronger for banks with large exposure to securitizations
compared to banks with few securitization transactions; 3) investors reacted less negatively in the
presence of disclosure about securitization losses, regardless of whether banks disclosed positive or
negative news. Overall, these results suggest that investors imposed lower penalties on banks that
openly disclosed the amount and nature of their losses, thereby indicating that transparency and
openness are welcome by investors even when they entail communicating bad news. In additional
analyses, I show that results reported in the paper are not driven by the underlying riskiness of
securitization transactions.
This study mainly contributes to extant research on disclosure with a specific focus on the
economic consequences of disclosing bad news (Skinner, 1994; Kasznik and Lev, 1995; Tucker, 1995).
Specifically, I use a particular research setting in which there is high market uncertainty to document
that investors appreciate openness and disclosure in the presence of bad news. I also add to research
that focuses on disclosure in the banking industry (e.g. Nier and Baumann, 2006; Frolov, 2007;
Pérignon and Smith, 2010). Nier and Baumann (2006) document that discipline resulting from
uninsured liabilities and disclosure creates incentives for banks to limit their risk of insolvency, by
choosing a larger capital buffer for given risk and provide new insights on the effects of disclosing bad
news. Frolov (2007) suggests that mandated disclosure rules for banks are a consequence of the
government policy of financial safety net, while Pérignon and Smith (2010) - using panel data over the
period 1996–2005 document an overall upward trend in the quantity of information released to the
public by commercial banks. I add to these results by providing insights on the consequences of bad
news disclosure by banks.
The paper proceeds as follows. Section II reviews related literature and develops the research
question investigated in the paper; Section III describes the methodology used; Section IV reports and
discusses the main findings; Sections V concludes.

Academy of Accounting and Financial Studies Journal Volume 21, Number 3, 2017
3 1528-2635-21-3-126
RELATED LITERATURE AND RESEARCH QUESTION
Prior Research
Disclosure is one of the most debated research topics that spans at least three literatures
(Verrecchia, 2001): accounting, finance and economics. One reason of such fervid debate around
disclosure is due to the absence of a comprehensive and unified theory of disclosure (Verrecchia,
2001). Indeed, there is no central paradigm that gives rise to all subsequent research on the topic
(Verrecchia, 2001). As Botosan (1997) points out, there is no consensus on whether firms benefit from
increased disclosure, although many asset pricing models suggest that increased disclosure can reduce
cost of equity capital. From a theoretical viewpoint, there are two main channels through which
increased disclosure can benefit firms by reducing cost of equity capital. The first argument is that
greater disclosure enhances stock market liquidity and thus reduces cost of equity capital through
reduced transaction costs and increased demand for a company’s stocks (Botosan, 1997). The second
channel, instead, is the reduced estimation risk arising from investors’ estimates of the parameters of an
asset’s return as a consequence of increased disclosure (Botosan, 1997). Research on the economic
consequences of disclosure is vast and many contributions support a negative association between
disclosure level and cost of equity capital (Diamond and Verrecchia, 1991; Coles et al., 1995; Clarkson
et al., 1996).
A related stream of research narrows the scope of the investigation to managers’ attitude to
disclose bad news to the market (Skinner, 1994; Kasznik and Lev, 1995; Tucker, 1995). The intriguing
research question asked by those studies relates to the potential benefits and costs of being transparent
and open to investors and stakeholders even when this entails disclosing negative news. Prior research
argues that disclosing bad news reduces expected legal costs in two ways (Skinner, 1994): i) if the
information is disclosed prior to the mandated release date, it is difficult to argue that managers
withheld information, ii) disclosing early limits the nondisclosure period, and thus the potential damage
that one could claim against the firm. Managers are also likely to have reputational incentives to
disclose negative news since in many circumstances they cannot realistically claim of being unware of
the bad news (Skinner, 1994).
Although the potential benefits of openness discussed in the literature, empirical evidence
suggests that investors impose penalties on firms that disclose negative news. Specifically, Kasznik and
Lev (1995) investigate management's discretionary disclosures prior to a large earnings surprise and
show that the combined reaction to the warning and the subsequent earnings announcement is
significantly more negative for firms that warned investors of bad news than the reaction to the
earnings announcement of the non-warning firms. This finding has been interpreted by scholars and the
business press as a penalty for openness (Tucker, 2007). In a related paper, Tucker (2007) starts from
results reported in Kasznik and Lev (1995) and further investigates the penalties imposed by investors
on firms that disclose bad news. Specifically, Tucker (2007) finds that, on average, warning firms have
a larger amount of other bad news than non-warning firms, such as discontinuation of new product
development, plans for store closings, trouble with alliances. After controlling for other bad news,
Tucker (2007) finds that warning firms’ returns remain lower than those of non-warning firms in a
short-term window but - in the long-term - warning and non-warning firms exhibit similar returns.
Thus, Tucker (2007) concludes that openness is ultimately not penalized by investors. Many other
researchers have examined whether investors appreciate firms being transparent and open when this
means disclosing negative news, but conclusions on investors’ reaction to bad news disclosure are far
from being unanimous (Atiase et al., 2006; Shu, 2003; Xu, 2003).

Academy of Accounting and Financial Studies Journal Volume 21, Number 3, 2017
4 1528-2635-21-3-126
In this paper, I aim at contributing to the debate on the desirability of firms’ openness by
investigating managers’ disclosure on securitization losses during the U.S. subprime crisis. As I discuss
in the following, this research setting allows me to investigate whether investors penalize or reward
banks that disclose negative news (losses on securitizations) in a situation in which market uncertainty
and information asymmetry are particularly high.
Securitization transactions
The issuance of exotic financial instruments played a prominent role in the recent financial
crisis because it induced the financial sector to misallocate resources to real estate (Diamond and
Rajan, 2009). “Securitization transactions, which consist of converting illiquid assets into liquid
securities, were the engine of financial innovation in the pre-crisis years and gave rise to exotic
financial instruments that found their way, either directly or indirectly, onto commercial and
investment bank balance sheets. When the subprime mortgage market collapsed in 2007, these
financial instruments revealed their high risk and swamped the financial industry” (Cerbioni, 2015, p.
155). The risky nature of such transactions is also testified by empirical research documenting that
executives incentivized on risk engaged into securitization transactions to a larger extent than
executives with low risk incentives (Fabrizi and Parbonetti, 2015). Moreover, using a sample of bank
holding companies, Cheng et al. (2011) document that banks involved into securitizations face greater
information uncertainty. This is because market participants have difficulty in assessing the true extent
of securitization recourse because of the complexity and lack of transparency associated with asset
securitization transactions (Cheng et al., 2011).
Overall, one of the major issue related to securitizations was the lack of information available to
investors about the risks underlying such transactions. The near absence of information available on the
riskiness of securitizations has made it difficult for investors to control and discipline the process of
originating and securitizing risky loans (Cerbioni et al., 2015). In this context of lack of transparency
and disclosure, some banks undertook steps towards a more open and transparent approach, and
provided investors with detailed information on the amount of losses on securitizations incurred by the
bank during the unfolding of the subprime crisis. Given the existing evidence in the literature, this
strategy is potentially a double-edged sword because on one hand investors could appreciate
transparency and openness, while on the other hand the market could penalize the disclosure of bad
news. Given the contrasting evidence from prior research on the economic consequences of disclosing
negative news, whether the market penalizes or rewards openness and transparency in the securitization
setting is an empirical question that I investigate in this study.
METHODOLOGY
Event Dates
The empirical strategy used in this study relies on the analysis of abnormal stock returns for a
sample of U.S. financial institutions around event dates that marked the unfolding of the subprime
crisis. To identify such dates I searched three news providers: USA Today, BBC News, and Wall Street
Journal. I identified 28 event dates over the period 2007-2008. The first event date is April, 2nd
2007
when the subprime mortgage lender New Century Financial filed for bankruptcy-court protection and
the last event date is March, 14th
2008 when Bear Stearns received emergency funding, after its
exposure to mortgage-backed investments undermined confidence in the bank. In order to identify
which dates to include in the analysis, I decided to retain those dates that were mentioned by at least
Academy of Accounting and Financial Studies Journal Volume 21, Number 3, 2017
5 1528-2635-21-3-126
two news providers as milestones in the unfolding of the US financial crisis. Appendix 1 reports the
event dates used in this study and the corresponding news provider.
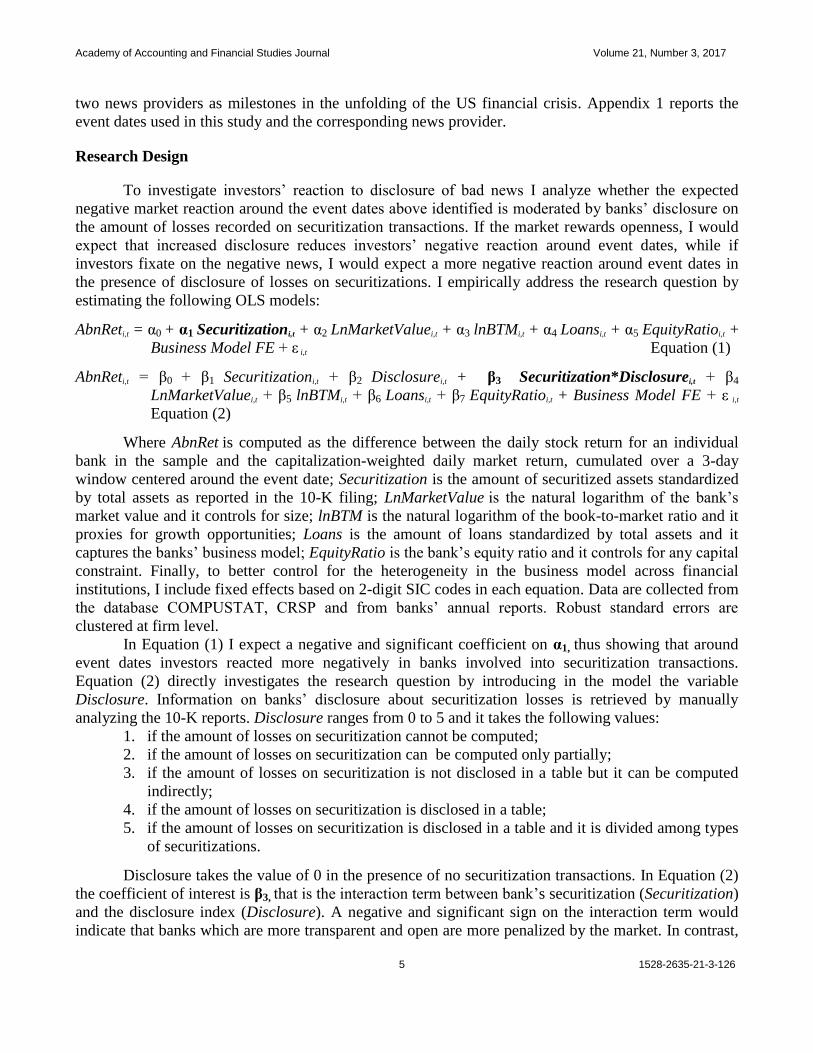
Research Design
To investigate investors’ reaction to disclosure of bad news I analyze whether the expected
negative market reaction around the event dates above identified is moderated by banks’ disclosure on
the amount of losses recorded on securitization transactions. If the market rewards openness, I would
expect that increased disclosure reduces investors’ negative reaction around event dates, while if
investors fixate on the negative news, I would expect a more negative reaction around event dates in
the presence of disclosure of losses on securitizations. I empirically address the research question by
estimating the following OLS models:
AbnReti,t = α0 + α1 Securitizationi,t + α2 LnMarketValuei,t + α3 lnBTMi,t + α4 Loansi,t + α5 EquityRatioi,t +
Business Model FE + ε i,t Equation (1)
AbnReti,t = β0 + β1 Securitizationi,t + β2 Disclosurei,t + β3 Securitization*Disclosurei,t + β4
LnMarketValuei,t + β5 lnBTMi,t + β6 Loansi,t + β7 EquityRatioi,t + Business Model FE + ε i,t
Equation (2)
Where AbnRet is computed as the difference between the daily stock return for an individual
bank in the sample and the capitalization-weighted daily market return, cumulated over a 3-day
window centered around the event date; Securitization is the amount of securitized assets standardized
by total assets as reported in the 10-K filing; LnMarketValue is the natural logarithm of the bank’s
market value and it controls for size; lnBTM is the natural logarithm of the book-to-market ratio and it
proxies for growth opportunities; Loans is the amount of loans standardized by total assets and it
captures the banks’ business model; EquityRatio is the bank’s equity ratio and it controls for any capital
constraint. Finally, to better control for the heterogeneity in the business model across financial
institutions, I include fixed effects based on 2-digit SIC codes in each equation. Data are collected from
the database COMPUSTAT, CRSP and from banks’ annual reports. Robust standard errors are
clustered at firm level.
In Equation (1) I expect a negative and significant coefficient on α1, thus showing that around
event dates investors reacted more negatively in banks involved into securitization transactions.
Equation (2) directly investigates the research question by introducing in the model the variable
Disclosure. Information on banks’ disclosure about securitization losses is retrieved by manually
analyzing the 10-K reports. Disclosure ranges from 0 to 5 and it takes the following values:
1. if the amount of losses on securitization cannot be computed;
2. if the amount of losses on securitization can be computed only partially;
3. if the amount of losses on securitization is not disclosed in a table but it can be computed
indirectly;
4. if the amount of losses on securitization is disclosed in a table;
5. if the amount of losses on securitization is disclosed in a table and it is divided among types
of securitizations.
Disclosure takes the value of 0 in the presence of no securitization transactions. In Equation (2)
the coefficient of interest is β3, that is the interaction term between bank’s securitization (Securitization)
and the disclosure index (Disclosure). A negative and significant sign on the interaction term would
indicate that banks which are more transparent and open are more penalized by the market. In contrast,
Academy of Accounting and Financial Studies Journal Volume 21, Number 3, 2017
6 1528-2635-21-3-126
a positive and significant sign on β3 would suggest that openness is not penalized but actually investors
reward banks that disclose more.
Sample
I started the analysis by identifying the 100 largest financial institutions included in the database
COMPUSTAT. For these companies, I retrieved data on securitization transactions and disclosure on
securitization losses from the 10-K filings for fiscal years 2006-2007-2008 and I merged such data with
COMPUSTAT and CRSP to compute all variables needed to estimate equations (1) and (2). Abnormal
returns around event dates are merged with accounting data based on the most recent financial
statement publicly available at the time of the event. Overall, I was able to collect full data for 79
unique banks and I estimate the regression models using a pooled sample of 2,133 observations.
RESULTS
Descriptive Statistics and Univariate Analysis
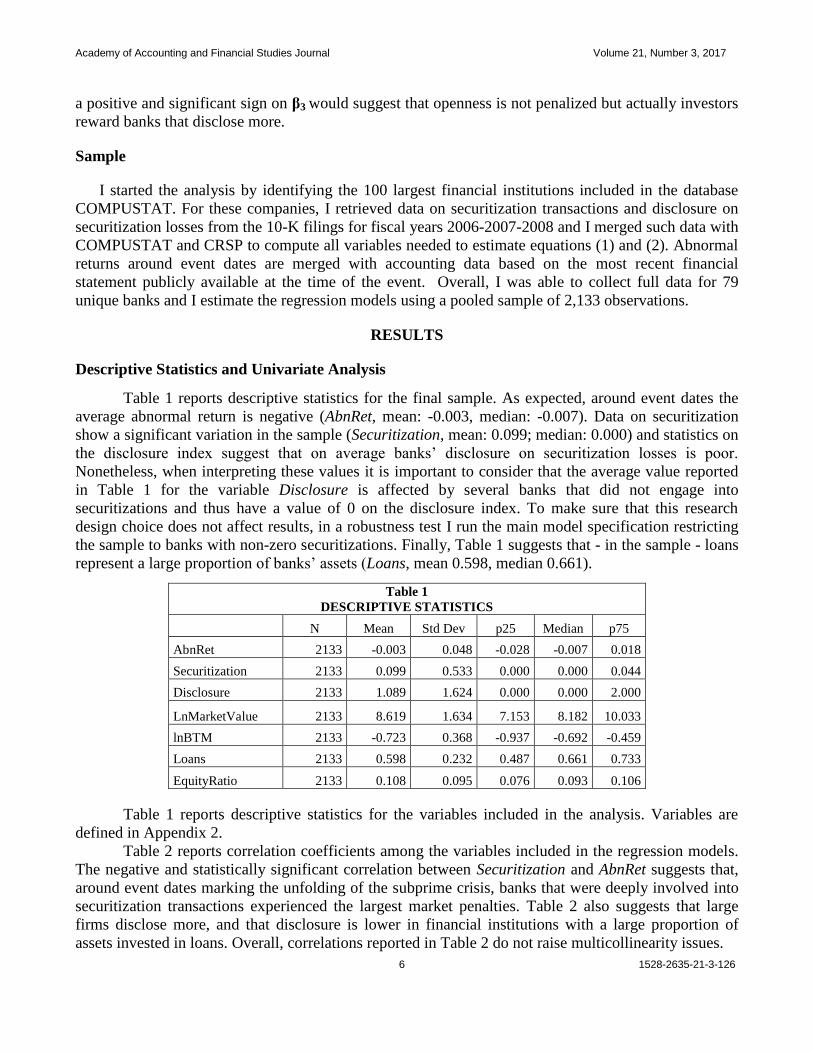
Table 1 reports descriptive statistics for the final sample. As expected, around event dates the
average abnormal return is negative (AbnRet, mean: -0.003, median: -0.007). Data on securitization
show a significant variation in the sample (Securitization, mean: 0.099; median: 0.000) and statistics on
the disclosure index suggest that on average banks’ disclosure on securitization losses is poor.
Nonetheless, when interpreting these values it is important to consider that the average value reported
in Table 1 for the variable Disclosure is affected by several banks that did not engage into
securitizations and thus have a value of 0 on the disclosure index. To make sure that this research
design choice does not affect results, in a robustness test I run the main model specification restricting
the sample to banks with non-zero securitizations. Finally, Table 1 suggests that - in the sample - loans
represent a large proportion of banks’ assets (Loans, mean 0.598, median 0.661).
Table 1
DESCRIPTIVE STATISTICS
N Mean Std Dev p25 Median p75
AbnRet 2133 -0.003 0.048 -0.028 -0.007 0.018
Securitization 2133 0.099 0.533 0.000 0.000 0.044
Disclosure 2133 1.089 1.624 0.000 0.000 2.000
LnMarketValue 2133 8.619 1.634 7.153 8.182 10.033
lnBTM 2133 -0.723 0.368 -0.937 -0.692 -0.459
Loans 2133 0.598 0.232 0.487 0.661 0.733
EquityRatio 2133 0.108 0.095 0.076 0.093 0.106
Table 1 reports descriptive statistics for the variables included in the analysis. Variables are
defined in Appendix 2.
Table 2 reports correlation coefficients among the variables included in the regression models.
The negative and statistically significant correlation between Securitization and AbnRet suggests that,
around event dates marking the unfolding of the subprime crisis, banks that were deeply involved into
securitization transactions experienced the largest market penalties. Table 2 also suggests that large
firms disclose more, and that disclosure is lower in financial institutions with a large proportion of
assets invested in loans. Overall, correlations reported in Table 2 do not raise multicollinearity issues.

Academy of Accounting and Financial Studies Journal Volume 21, Number 3, 2017
7 1528-2635-21-3-126
Table 2
CORRELATION MATRIX
(1) (2) (3) (4) (5) (6)
(1) AbnRet 1
(2) Securitization -0.105*** 1
(3) Disclosure -0.033 0.057** 1
(4) LnMarketValue -0.028 0.027 0.521*** 1
(5) lnBTM -0.033 0.070** 0.114*** -0.163*** 1
(6) Loans 0.012 -0.162*** -0.112*** -0.423*** 0.347*** 1
(7) EquityRatio 0.028 -0.057** 0.026 -0.046* -0.113*** 0.147***
The table reports the Pearson correlation coefficients among the variables used in the analyses.
*,**,*** indicate statistical significance at 10%, 5%, 1% level, respectively. Variables are defined in
Appendix 2.
Multivariate Analysis
Table 3
MARKET REACTION, SECURITIZATION, AND DISCLOSURE
(1) (2)
AbnRet
Securitization -0.007*** -0.029***
[-5.905] [-3.792]
Disclosure
-0.002**
[-2.294]
Securitization*Disclosure
0.023***
[2.747]
LnMarketValue -0.000 -0.000
[-0.622] [-0.444]
lnBTM -0.004 -0.004
[-1.357] [-1.490]
Loans -0.003 -0.002
[-0.327] [-0.276]
EquityRatio 0.017 0.020*
[1.325] [1.807]
Constant -0.010 -0.015
[-0.858] [-1.230]
SIC Fixed Effects YES YES
Observations 2,133 2,133
R-squared 0.016 0.019
The table reports regression results obtained from estimating Equation (1) and Equation (2).
*,**,*** indicate statistical significance at 10%, 5%, 1% level, respectively. . P-values are two tailed.
Robust t-statistics are reported in brackets and are based on standard errors clustered at bank level.
Variables are defined in Appendix 2.
Table 3 reports the main results. Column (1) in Table 3 presents results from estimating
Equation (1) while Column (2) shows results obtained from Equation (2). In Column (1) the coefficient
on Securitization is negative and significant at 1% level, thereby indicating that the larger the amount
of securitizations, the stronger the market penalty around event dates. This result is consistent with the
Academy of Accounting and Financial Studies Journal Volume 21, Number 3, 2017
8 1528-2635-21-3-126
univariate analysis reported in Table 2. Importantly, Column (2) shows that the interaction term
between Securitization and Disclosure is positive and significant (1% level), thus indicating that when
banks increase their disclosure on the amount of securitization losses, investors impose lower penalties
on the bank. Therefore, investors seem to appreciate and reward transparency and openness, even when
it implies communicating bad news such as losses on securitizations. Untabulated results indicate that
the sum of the coefficients on Securitization and Securitization*Disclosure is negative and significant
(p-value <0.00). This implies that around event dates, in the presence of disclosure on securitization
losses, investors still penalize banks that engaged into securitizations but significantly less compared to
non-disclosing banks.
Additional Analyses
In this section, I further investigate the research question to corroborate the support to the
intuition that investors reward transparency and openness. A critical research design choice in all event
studies is the selection of the window over which to compute abnormal returns. A small window may
cause a loss of information due to some anticipation effects, while a long window might capture market
reactions that are not related to the event analyzed. To make sure that the results are not driven by the
selection of a specific event window, Table 4 replicates Equation (1) and Equation (2) by computing
abnormal returns over a window of five days instead to three days. Results reported under this
alternative specifications are qualitatively similar to those reported in the main analyses and do not
affect conclusions.
Table 4
DIFFERENT ESTIMATION WINDOWS
(1) (2)
AbnRet (5days)
Securitization -0.007*** -0.033***
[-3.749] [-2.649]
Disclosure
-0.003***
[-2.843]
Securitization*Disclosure
0.027**
[2.002]
LnMarketValue -0.000 0.000
[-0.388] [0.222]
lnBTM -0.008* -0.007
[-1.807] [-1.610]
Loans -0.010 -0.009
[-0.629] [-0.554]
EquityRatio 0.043** 0.048**
[2.020] [2.525]
Constant -0.021 -0.030
[-1.054] [-1.500]
SIC Fixed Effects YES YES
Observations 2,133 2,133
R-squared 0.019 0.023
The table reports regression results obtained from estimating Equation (1) and Equation (2)
using a 5-day window around the event date. *,**,*** indicate statistical significance at 10%, 5%, 1%
level, respectively. . P-values are two tailed. Robust t-statistics are reported in brackets and are based
on standard errors clustered at bank level. Variables are defined in Appendix 2.
Academy of Accounting and Financial Studies Journal Volume 21, Number 3, 2017
9 1528-2635-21-3-126
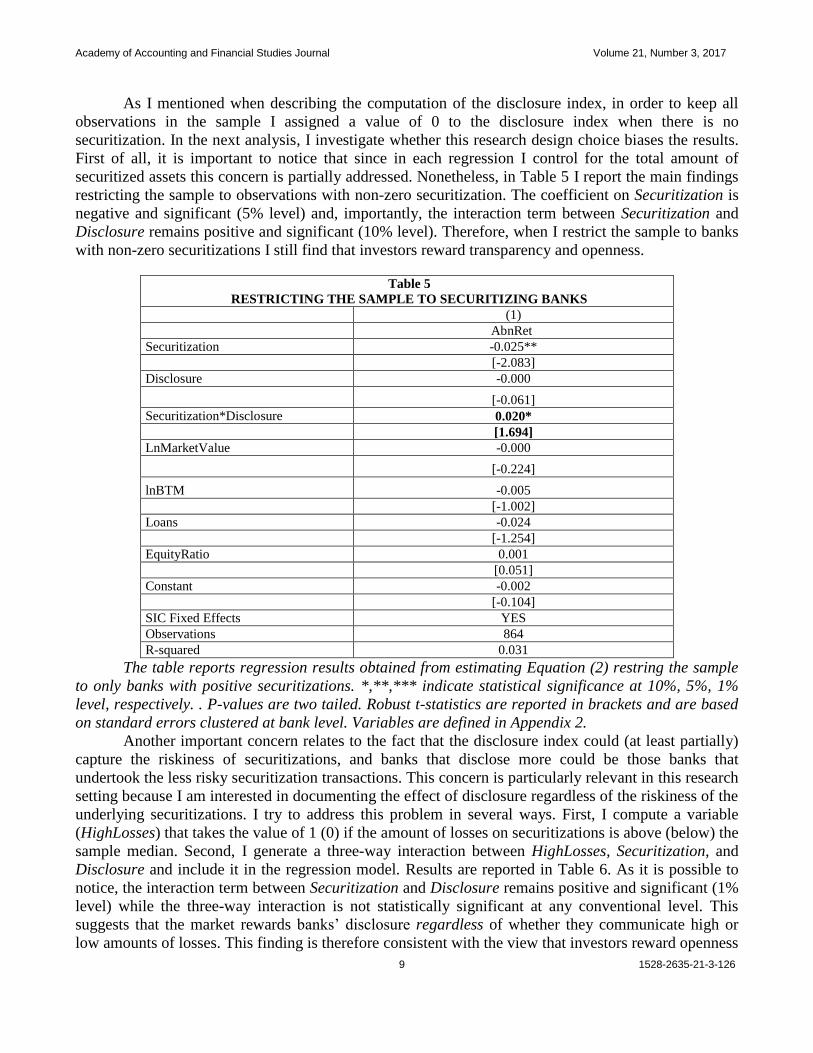
As I mentioned when describing the computation of the disclosure index, in order to keep all
observations in the sample I assigned a value of 0 to the disclosure index when there is no
securitization. In the next analysis, I investigate whether this research design choice biases the results.
First of all, it is important to notice that since in each regression I control for the total amount of
securitized assets this concern is partially addressed. Nonetheless, in Table 5 I report the main findings
restricting the sample to observations with non-zero securitization. The coefficient on Securitization is
negative and significant (5% level) and, importantly, the interaction term between Securitization and
Disclosure remains positive and significant (10% level). Therefore, when I restrict the sample to banks
with non-zero securitizations I still find that investors reward transparency and openness.
Table 5
RESTRICTING THE SAMPLE TO SECURITIZING BANKS
(1)
AbnRet
Securitization -0.025**
[-2.083]
Disclosure -0.000
[-0.061]
Securitization*Disclosure 0.020*
[1.694]
LnMarketValue -0.000
[-0.224]
lnBTM -0.005
[-1.002]
Loans -0.024
[-1.254]
EquityRatio 0.001
[0.051]
Constant -0.002
[-0.104]
SIC Fixed Effects YES
Observations 864
R-squared 0.031
The table reports regression results obtained from estimating Equation (2) restring the sample
to only banks with positive securitizations. *,**,*** indicate statistical significance at 10%, 5%, 1%
level, respectively. . P-values are two tailed. Robust t-statistics are reported in brackets and are based
on standard errors clustered at bank level. Variables are defined in Appendix 2.
Another important concern relates to the fact that the disclosure index could (at least partially)
capture the riskiness of securitizations, and banks that disclose more could be those banks that
undertook the less risky securitization transactions. This concern is particularly relevant in this research
setting because I am interested in documenting the effect of disclosure regardless of the riskiness of the
underlying securitizations. I try to address this problem in several ways. First, I compute a variable
(HighLosses) that takes the value of 1 (0) if the amount of losses on securitizations is above (below) the
sample median. Second, I generate a three-way interaction between HighLosses, Securitization, and
Disclosure and include it in the regression model. Results are reported in Table 6. As it is possible to
notice, the interaction term between Securitization and Disclosure remains positive and significant (1%
level) while the three-way interaction is not statistically significant at any conventional level. This
suggests that the market rewards banks’ disclosure regardless of whether they communicate high or
low amounts of losses. This finding is therefore consistent with the view that investors reward openness
Academy of Accounting and Financial Studies Journal Volume 21, Number 3, 2017
10 1528-2635-21-3-126
also when it requires disclosing bad news. Obviously, this analysis can only be performed on the
subsample of banks for which I am able to retrieve data on securitization losses and this significantly
reduces the sample.
Table 6
DISCLOSING HIGH SECURITIZATION LOSSES
(1)
AbnRet
Securitization -0.566**
[-2.583]
Disclosure -0.012***
[-3.325]
Securitization*Disclosure 0.192***
[3.405]
HighLosses*Securitization*Disclosure -0.005
[-0.470]
HighLosses -0.001
[-0.236]
LnMarketValue -0.005***
[-8.268]
lnBTM -0.021***
[-3.643]
Loans -0.065***
[-5.846]
EquityRatio 0.427***
[19.450]
Constant 0.037**
[2.573]
SIC Fixed Effects YES
Observations 351
R-squared 0.026
The table analyzes the effect of disclosing high losses on securitizations. *,**,*** indicate
statistical significance at 10%, 5%, 1% level, respectively. . P-values are two tailed. Robust t-statistics
are reported in brackets and are based on standard errors clustered at bank level. Variables are defined
in Appendix 2.
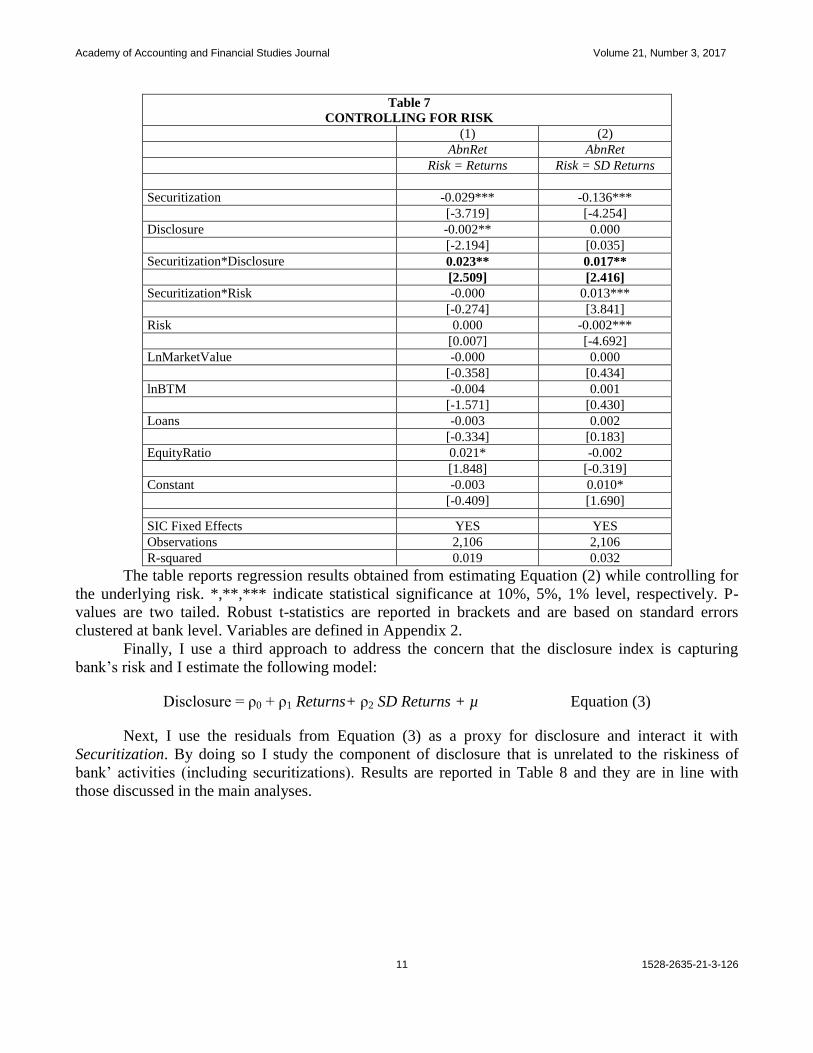
To further make sure that the disclosure index does not capture the underlying riskiness of the
bank, I compute banks’ abnormal returns (Returns) and the standard deviation of banks’ returns (SD
Returns) during the sample period and I generate a ranking variable (Risk) with the decile distribution
of either Returns or SD Returns. The underlying assumption is that riskier bank activities, including
securitizations, translated into lower returns and higher volatility during the subprime crisis. In Table 7,
I interact the variable Risk with Securitization in the attempt to better control for the potentially
confounding effect of the riskiness of the bank’ activity and securitization transactions. In Column (1)
of Table 7 I use Returns to compute the ranking variable Risk, while in Column (2) the variable Risk is
based on SD Returns. Regardless of the model specification used, the coefficient on Securitization
remains negative and significant (1% level) and the interaction term Securitization*Disclosure remains
positive and significant (5% level). Therefore, results from this additional analysis are consistent with
those previously reported.
Academy of Accounting and Financial Studies Journal Volume 21, Number 3, 2017
11 1528-2635-21-3-126
Table 7
CONTROLLING FOR RISK
(1) (2)
AbnRet AbnRet
Risk = Returns Risk = SD Returns
Securitization -0.029*** -0.136***
[-3.719] [-4.254]
Disclosure -0.002** 0.000
[-2.194] [0.035]
Securitization*Disclosure 0.023** 0.017**
[2.509] [2.416]
Securitization*Risk -0.000 0.013***
[-0.274] [3.841]
Risk 0.000 -0.002***
[0.007] [-4.692]
LnMarketValue -0.000 0.000
[-0.358] [0.434]
lnBTM -0.004 0.001
[-1.571] [0.430]
Loans -0.003 0.002
[-0.334] [0.183]
EquityRatio 0.021* -0.002
[1.848] [-0.319]
Constant -0.003 0.010*
[-0.409] [1.690]
SIC Fixed Effects YES YES
Observations 2,106 2,106
R-squared 0.019 0.032
The table reports regression results obtained from estimating Equation (2) while controlling for
the underlying risk. *,**,*** indicate statistical significance at 10%, 5%, 1% level, respectively. P-
values are two tailed. Robust t-statistics are reported in brackets and are based on standard errors
clustered at bank level. Variables are defined in Appendix 2.
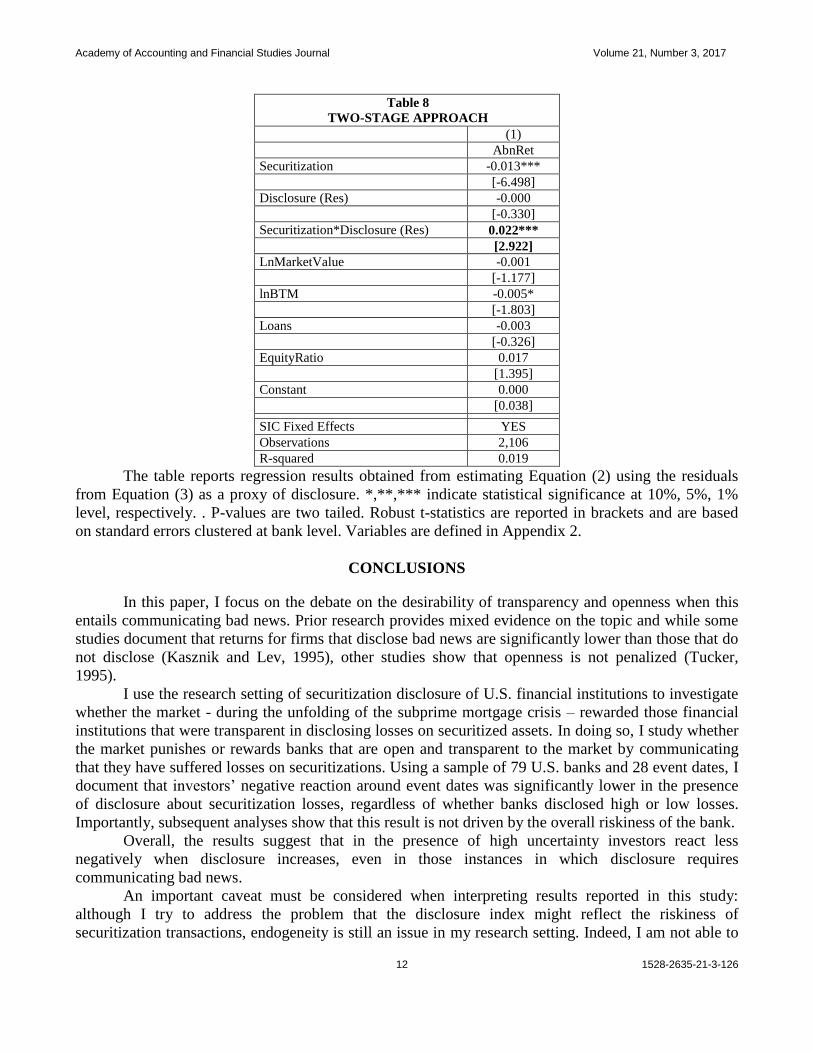
Finally, I use a third approach to address the concern that the disclosure index is capturing
bank’s risk and I estimate the following model:
Disclosure = ρ0 + ρ1 Returns+ ρ2 SD Returns + µ Equation (3)
Next, I use the residuals from Equation (3) as a proxy for disclosure and interact it with
Securitization. By doing so I study the component of disclosure that is unrelated to the riskiness of
bank’ activities (including securitizations). Results are reported in Table 8 and they are in line with
those discussed in the main analyses.
Academy of Accounting and Financial Studies Journal Volume 21, Number 3, 2017
12 1528-2635-21-3-126
Table 8
TWO-STAGE APPROACH
(1)
AbnRet
Securitization -0.013***
[-6.498]
Disclosure (Res) -0.000
[-0.330]
Securitization*Disclosure (Res) 0.022***
[2.922]
LnMarketValue -0.001
[-1.177]
lnBTM -0.005*
[-1.803]
Loans -0.003
[-0.326]
EquityRatio 0.017
[1.395]
Constant 0.000
[0.038]
SIC Fixed Effects YES
Observations 2,106
R-squared 0.019
The table reports regression results obtained from estimating Equation (2) using the residuals
from Equation (3) as a proxy of disclosure. *,**,*** indicate statistical significance at 10%, 5%, 1%
level, respectively. . P-values are two tailed. Robust t-statistics are reported in brackets and are based
on standard errors clustered at bank level. Variables are defined in Appendix 2.
CONCLUSIONS
In this paper, I focus on the debate on the desirability of transparency and openness when this
entails communicating bad news. Prior research provides mixed evidence on the topic and while some
studies document that returns for firms that disclose bad news are significantly lower than those that do
not disclose (Kasznik and Lev, 1995), other studies show that openness is not penalized (Tucker,
1995).
I use the research setting of securitization disclosure of U.S. financial institutions to investigate
whether the market - during the unfolding of the subprime mortgage crisis – rewarded those financial
institutions that were transparent in disclosing losses on securitized assets. In doing so, I study whether
the market punishes or rewards banks that are open and transparent to the market by communicating
that they have suffered losses on securitizations. Using a sample of 79 U.S. banks and 28 event dates, I
document that investors’ negative reaction around event dates was significantly lower in the presence
of disclosure about securitization losses, regardless of whether banks disclosed high or low losses.
Importantly, subsequent analyses show that this result is not driven by the overall riskiness of the bank.
Overall, the results suggest that in the presence of high uncertainty investors react less
negatively when disclosure increases, even in those instances in which disclosure requires
communicating bad news.
An important caveat must be considered when interpreting results reported in this study:
although I try to address the problem that the disclosure index might reflect the riskiness of
securitization transactions, endogeneity is still an issue in my research setting. Indeed, I am not able to

Academy of Accounting and Financial Studies Journal Volume 21, Number 3, 2017
13 1528-2635-21-3-126
control for all omitted correlated variables that can jointly affect disclosure and investors’ reaction
around event dates.
APPENDIX
Appendix 1
EVENT DATES
Date USA Today BBC News WSJ
2-April-07 x x
14-June-07
x x
22-June-07
x x
13-July-07
x x
20-July-07
x x
31-July-07 x x
6-August-07 x x x
10- August -07
x x
16- August -07 x x x
23- August -07
x x
19-September-07
x x
20- September -07
x x
1-October-07
x x
16- October -07
x x
17- October 07
x x
8-November-07
x x
14-November-07
x x
15-November-07
x x
27-November-07
x x
11-December-07
x x
7-January-08
x x
11- January -08 x x
15- January -08
x x
21- January -08
x x
22- January -08
x x
3-March-08
x x
11-March-08
x x
14-March-08 x x

Academy of Accounting and Financial Studies Journal Volume 21, Number 3, 2017
14 1528-2635-21-3-126
Appendix 2
VARIABLE DEFINITION
Name Definition
AbnRet
Difference between the daily stock return for an individual bank in the sample
and the capitalization-weighted daily market return, cumulated over a 3-day
window centered around the event date
Securitization Amount of securitized assets standardized by total assets as reported in the 10-K
filing
Disclosure Quality of disclosure on securitization losses computed as describe in Section III
LnMarketValue Natural logarithm of the bank’s market value
lnBTM Natural logarithm of the book-to-market ratio
Loans Amount of loans standardized by total assets
EquityRatio Bank’s equity ratio
HighLosses Dummy variable that takes the value of 1 (0) is the amount of losses on
securitizations is above (below) the sample median.
Returns Bank's abnormal returns cumulated over the sample period
SD Returns Standard deviation of banks’ returns computed over the sample period
Risk Ranking variable containing the decile distribution of either Return Crisis or SD
Returns
ENDNOTE
1. Similarly to previous studies on securitization (e.g. Amiram et al. 2011), the sample includes banks as well as other
financial institutions and I use the terms interchangeably throughout.
2. As robustness test, I run the main model by excluding each event date one by one. Untabulated results are
unchanged. Evidence from this test suggests that the results documented in the paper are not driven by a specific
event date.
REFERENCES
Amihud, Y. & Mendelson, H. (1986). Asset pricing and the bid-ask spread. Journal of Financial Economics. 17 (2): 223-
249.
Amiram, D., Landsman, W.R., Peasnell, K.V. & Shakespeare, C. ( 2011). Market reaction to securitization retained interest
impairments during the financial crisis of 2007-2008: Are implicit guarantees worth the paper they’re not written
on? SSRN Working Paper.
Atiase, R.K., Supattarakul, S. & Tse, S. (2006). Market reaction to earnings surprise warnings: The incremental role of
shareholder litigation risk on the warning effect. Journal of Accounting, Auditing and Finance. 21 (2): 191–222.
Barry, C. & Brown, S. (1985). Equilibrium information and security market equilibrium. Journal of Financial and
Quantitative Analysi. 20(4), 407–422.
Barth, M.E. & Landsman, W.R. (2010). How did financial reporting contribute to the financial crisis? European Accounting
Review, 19 (3): 399-423.
Botosan, C.A. (1997). Disclosure level and the cost of equity capital. The Accounting Review, 72 (3): 323-349.
Cerbioni, F., Fabrizi, M. & Parbonetti, A. (2015). Securitizations and the financial crisis: Is accounting the missing link?
Accounting Forum, 39 (3): 155-175.
Cheng, M., Dhaliwal, D.S. & Neamtiu, M. (2011). Asset securitization, securitization recourse, and information uncertainty.
The Accounting Review, 86 (2): 541–568.
Clarkson, P., Guedes, J. & Thompson, R. (1996). On the diversification, observability, and measurement of estimation risk.
Journal of Financial and Quantitative Analysis, 31(1): 69-84.
Coles, J.L. & Loewenstein, U. (1988). Equilibrium pricing and portfolio composition in the presence of uncertain
parameters. Journal of Financial Economics, 22 (2): 279-303.
Coles, J., Loewenstein, U. & Suay, J. (1995). On equilibrium pricing under parameter uncertainty. Journal of Financial and
Quantitative Analysis, 30 (3): 347-364.
Diamond, D.W. & Verrecchia, R.E. (1991). Disclosure, liquidity, and the cost of capital. The Journal of Finance, 46 (4):
1325-1359.
Academy of Accounting and Financial Studies Journal Volume 21, Number 3, 2017
15 1528-2635-21-3-126
Diamond, D.W. & Rajan, R. (2009). The credit crisis: Conjectures about causes and remedies. NBER Working Paper No.
14739.
Fabrizi, M. & Parbonetti, A. (2015). CEO risk incentives and the riskiness of securitisation transactions in the financial
industry, International Journal of Banking, Accounting and Finance, 6 (2),122-150.
Frolov, M. (2007). Why do we need mandated rules of public disclosure for banks? Journal of Banking Regulation.8
(2),177-191.
Handa, P. & Linn, S.C. (1993). Arbitrage pricing with estimation risk. Journal of Financial and Quantitative Analysis, 28
(1).81-100.
Kasznik, R. & Lev, B. (1995). To warn or not to warn: Management disclosures in the face of an earnings surprise. The
Accounting Review.70 (1),113-134.
Klein, R. & Bawa, V. (1976). The effect of estimation risk on optimal portfolio choice. Journal of Financial Economics. 3
(3),215–231.
Nier, E. & Baumann, U. (2006). Market discipline, disclosure and moral hazard in banking. Journal of Financial
Intermediation. 15(3).332-361.
Pérignon, C. & Smith, D.R. (2010). The level and quality of Value-at-Risk disclosure by commercial banks. Journal of
Banking & Finance. 34(2),362-377.
Shu, S. (2003). Why do firms issue earnings in the face of earnings disappointments? A self-selection analysis. Working
paper, Boston College.
Skinner, D.J.(1994). Why firms voluntarily disclose bad news. Journal of Accounting Research.32(1),38-60.
Tucker, J.W. (2007). Is openness penalized? Stock returns around earnings warnings. The Accounting Review, 82 (4): 1055-
1087.
Verrecchia, R.E. (2001). Essays on disclosure. Journal of Accounting and Economics. 32(1),97-180.
Xu, W. (2003). Market reaction to warnings of negative earnings surprises: Further evidence. Working paper, University of
Vanderbilt.