dog river pipeline replacement - usda
TRANSCRIPT

0
Dog River Pipeline Replacement
Environmental Assessment
USDA Forest Service
Barlow Ranger District
Mt. Hood National Forest
Hood River County, Oregon T.1S., R.10E., S.34
T.2S.,R.10E., S2,3,4,9,10,11; Willamette Meridian
Vic Anderson and Paul Weigelt
at Dog River Pipeline Head Gate (8/19/1923)
United States Department of Agriculture
Forest Service
Mt. Hood National Forest
Barlow Ranger District
June 2020

2
Lead Agency: U.S. Forest Service
Responsible Official: Richard Periman, Forest Supervisor Mt. Hood National Forest
Information Contact: Kameron Sam
District Ranger (541) 461-5101 [email protected]
Project Website: https://www.fs.usda.gov/project/?project=34721
In accordance with Federal civil rights law and U.S. Department of Agriculture (USDA) civil rights
regulations and policies, the USDA, its Agencies, offices, and employees, and institutions participating in or
administering USDA programs are prohibited from discriminating based on race, color, national origin, religion, sex, gender identity (including gender expression), sexual orientation, disability, age, marital
status, family/parental status, income derived from a public assistance program, political beliefs, or reprisal
or retaliation for prior civil rights activity, in any program or activity conducted or funded by USDA (not all
bases apply to all programs). Remedies and complaint filing deadlines vary by program or incident.
Persons with disabilities who require alternative means of communication for program information (e.g.,
Braille, large print, audiotape, American Sign Language, etc.) should contact the responsible Agency or USDA's TARGET Center at (202) 720-2600 (voice and TTY) or contact USDA through the Federal Relay
Service at (800) 877-8339. Additionally, program information may be made available in languages other
than English.
To file a program discrimination complaint, complete the USDA Program Discrimination Complaint Form, AD-3027, found online at https://www.ascr.usda.gov/filing-program-discrimination-complaint-usda-
customer and at any USDA office or write a letter addressed to USDA and provide in the letter all of the
information requested in the form. To request a copy of the complaint form, call (866) 632-9992. Submit your completed form or letter to USDA by: (1) mail: U.S. Department of Agriculture, Office of the
Assistant Secretary for Civil Rights, 1400 Independence Avenue, SW, Washington, D.C. 20250-9410; (2)
fax: (202) 690-7442; or (3) email: [email protected]
USDA is an equal opportunity provider, employer, and lender.

3
Table of Contents List of Figures .......................................................................................................................6 List of Tables .........................................................................................................................8
Chapter 1 – Introduction ........................................................................................................................ 12
1.1 Document Structure ................................................................................................12 1.2 Background ..............................................................................................................12 1.3 Purpose and Need for Action ..................................................................................13 1.4 Management Direction ............................................................................................13
Mt. Hood National Forest Land and Resource Management Plan ................................................... 13 Northwest Forest Plan ................................................................................................................... 15 1912 Cooperative Agreement & 1972 Memorandum of Understanding ......................................... 17
1.5 Public Involvement ..................................................................................................17 1.6 Issues .......................................................................................................................17
Water Rights ................................................................................................................................. 18 City Plans for Future Water Use .................................................................................................... 18 Current Pipeline and Seepage ........................................................................................................ 18 Fish and Fish Habitat..................................................................................................................... 18
1.7 Differences between the Preliminary Environmental Assessment and the Environmental Assessment .........................................................................................................................18
Chapter 2 – Alternatives ........................................................................................................................ 19
2.1 No Action Alternative ..............................................................................................19 2.2 Proposed Action Alternative ...................................................................................19 2.3 Project Design Criteria and Mitigation Measures ..................................................20
2.3.1 Aquatic Conservation Measures ............................................................................................ 21 2.3.2 Transportation/Engineering .................................................................................................. 26 2.3.3 Wildlife ................................................................................................................................ 28 2.3.4 Fuels .................................................................................................................................... 28 2.3.5 Recreation ............................................................................................................................ 28 2.3.6 Visuals ................................................................................................................................. 29 2.3.7 Soils ..................................................................................................................................... 29 2.3.8 Invasive Plants ..................................................................................................................... 29 2.3.9 Cultural ................................................................................................................................ 30
Chapter 3 – Environmental Consequences ............................................................................................. 31
3.1 Vegetation Resources .............................................................................................32 3.1.1 Existing Condition ............................................................................................................ 32 3.1.2 Effects Analysis................................................................................................................ 33 3.1.3 Consistency Determination ............................................................................................... 33 3.1.4 Summary of Effects .......................................................................................................... 34
3.2 Soil Productivity ............................................................................................................35 3.2.1 Existing Condition ............................................................................................................ 35 3.2.2 Effects Analysis................................................................................................................ 35 3.2.3 Consistency Determination ............................................................................................... 37 3.2.4 Summary of Effects .......................................................................................................... 37
3.3 Hydrology .................................................................................................................38 3.3.1 Existing Condition ............................................................................................................ 38 3.3.2 Effects Analysis.................................................................................................................... 74 3.3.3 Consistency Determination ............................................................................................. 126
3.4 Fisheries and Aquatic Fauna ................................................................................ 129

4
3.4.1 Existing Condition .......................................................................................................... 129 3.4.2 Effects Analysis.............................................................................................................. 146 3.4.3 Consistency Determination ................................................................................................. 183
3.5 Visual Qualities............................................................................................................ 187 3.5.1 Existing Condition .......................................................................................................... 187 3.5.2 Effects Analysis.............................................................................................................. 189 3.5.3 Consistency Determination ............................................................................................. 190 3.5.4 Summary of Effects ........................................................................................................ 193
3.6 Wildlife .................................................................................................................... 194 3.6.1 Threatened, Endangered and Proposed Species – Northern Spotted Owl ......................... 194 3.6.2 Northern Spotted Owl Critical Habitat ............................................................................ 197 3.6.3 Region 6 Sensitive Species – Gray Wolf, Fringed Myotis, Western Bumblebee, Johnson’s Hairstreak
199 3.6.4 Management Indicator Species – Deer, Elk, Pileated Woodpecker, American Marten, Wild Turkey,
Western Gray Squirrel ................................................................................................................. 205 3.6.5 Snag and Down Log Associated Species ......................................................................... 211 3.6.6 Neotropical Migratory Birds ........................................................................................... 213
3.7 Botany .......................................................................................................................... 215 3.7.1 Existing Condition .......................................................................................................... 215 3.7.2 Effects Analysis.............................................................................................................. 215 3.7.3 Consistency Determination ............................................................................................. 216 3.7.4 Summary of Effects ........................................................................................................ 216
3.8 Invasive Plant Species .......................................................................................... 216 3.8.1 Existing Condition .......................................................................................................... 216 3.8.2 Effects Analysis.............................................................................................................. 217 3.8.3 Consistency Determination ............................................................................................. 218 3.8.4 Summary of Effects ........................................................................................................ 218
3.9 Recreation .............................................................................................................. 218 3.9.1 Existing Condition .......................................................................................................... 218 3.9.2 Effects Analysis.............................................................................................................. 220 3.9.3 Consistency Determination ............................................................................................. 221 3.9.4 Summary of Effects ........................................................................................................ 223
3.10 Cultural Resources.................................................................................................... 224 3.10.1 Existing Condition .......................................................................................................... 224 3.10.2 Effects Analysis.............................................................................................................. 226 3.10.3 Consistency Determination ............................................................................................. 228 3.10.4 Summary of Effects ........................................................................................................ 228
3.11 Climate Change ...................................................................................................... 231 3.11.1 Existing Condition .......................................................................................................... 231 3.11.2 Effects Analysis.............................................................................................................. 231
3.12 Congressionally Designated Areas ...................................................................... 232 3.13 Environmental Justice and Civil Rights ............................................................... 232 3.14 Other Required Disclosures .................................................................................. 233
3.14.1 Conflicts with Plans, Policies or Other Jurisdictions ........................................................ 233 3.14.2 Floodplains and Wetlands ............................................................................................... 233 3.14.3 Air Quality ..................................................................................................................... 233 3.14.4 Treaty Resources and Reserved Indian Rights ................................................................. 235 3.14.5 Prime Farmlands, Rangelands, and Forestlands ............................................................... 235 3.14.6 Potential or Unusual Expenditures of Energy .................................................................. 235 3.14.7 Irreversible and Irretrievable Commitments of Resources ............................................... 235 3.14.8 Conflicts with Plans, Policies, or Other Jurisdictions ....................................................... 235

5
Chapter 4 – Consultation and Coordination .......................................................................................... 236
4.1 Federal, State and Local Agencies ......................................................................................... 236 4.2 Tribes .................................................................................................................................... 236
References........................................................................................................................................... 237
Vegetation Resources ....................................................................................................... 237 Soil Productivity ................................................................................................................ 237 Hydrology .......................................................................................................................... 237 Fisheries and Aquatic Fauna ............................................................................................ 240 Visual Qualities ................................................................................................................. 243 Wildlife ............................................................................................................................... 243 Botany ................................................................................................................................ 247 Invasive Plant Species ...................................................................................................... 247 Recreation ......................................................................................................................... 248 Cultural Resources ........................................................................................................... 248 Climate Change ................................................................................................................. 249

6
List of Figures
Figure 1. Vicinity Map of Dog River Pipeline Replacement Planning Area ............................................. 11 Figure 2. Forest Plan Land Use Allocations within Dog River Pipeline Replacement Planning Area ....... 14
Figure 3. Northwest Forest Plan Land Allocations within the Dog River Pipeline Replacement Area ...... 16 Figure 4. Dog River Pipeline Project Subwatersheds and Catchments. ..................................................... 40
Figure 5. Dog River Diversion Pipeline Project Surveyed Stream Reaches in the Affected Area.............. 45 Figure 6. Mean daily discharge (cfs) for Dog River from water years 1961 to 1967 at RM 6.0, upstream of
the Dog River pipeline diversion...................................................................................................... 52 Figure 7. Mean daily discharge (cfs) for Dog River near RM 0, just upstream of the confluence with East
Fork Hood River. ............................................................................................................................. 53 Figure 8. Estimated mean daily discharge (cfs) for South Fork Mill Creek for water years 1960 to 1967
upstream of Wicks Treatment Plant, naturalized by subtracting inputs of diverted water from Dog
River. .............................................................................................................................................. 56
Figure 9. Hydrograph of South Fork Mill Creek above the Wicks water treatment plant intake. ............... 57 Figure 10. Mean daily discharge (cfs) summary of an average water year that is diverted into the City of
The Dalles pipeline during 2012 through 2018 compared to the mean daily discharge of Dog River
above the diversion. ......................................................................................................................... 60
Figure 11. The amount of mean daily streamflow that bypassed the pipeline diversion down Dog River
(undiverted flow), expressed as a percentage of total available streamflow for water years 2012 to
2018. ............................................................................................................................................... 62 Figure 12. Mean monthly fill and drawdown trends during the period 2005 to 2015. ............................... 63
Figure 13. Comparison of mean monthly spill and release during the period 2005 to 2015. ..................... 64 Figure 14. Comparison of the proportion of the different source water supply with current and projected
ASR demand. .................................................................................................................................. 65 Figure 15. Daily average temperature data for Dog River upstream of the confluence of the East Fork
Hood River. ..................................................................................................................................... 67 Figure 16. Seven-day-minimum and maximum temperatures in South Fork Mill Creek (elevation of 2,000
feet) at the USFS boundary (MHNF 1999) 4 miles below Crow Creek Reservoir. ........................... 69 Figure 17. Summer average daily temperature for South Fork Mill Creek (elevation of 2,500 feet), just
below Crow Creek Reservoir. .......................................................................................................... 70 Figure 18. Mean daily discharge (cfs) summary of an average water year that was diverted into the City of
The Dalles pipeline during 2012 through 2018 compared to the mean daily discharge of Dog River
above the diversion .......................................................................................................................... 76
Figure 19. Instantaneous Discharge measured near the mouth of Dog River spring through late-summer of
2019 ................................................................................................................................................ 77 Figure 20. A comparison of average streamflow and diverted flow from 2011 through 2018 above the Dog
River diversion to illustrate the amount of spring peak flows that would bypass to lower Dog River.
........................................................................................................................................................ 78
Figure 21. The amount of mean daily streamflow that bypassed (undiverted flow) the pipeline diversion
down Dog River, expressed as a percentage of total available streamflow for water years 2012 to
2018. ............................................................................................................................................... 79 Figure 22. Mean daily flow in South Fork Mill Creek above the Wicks water treatment plant intake
exhibiting the estimated increase in streamflow above the natural flow regime. ............................... 81 Figure 23. Mean monthly fill and drawdown trends during the period 2005 to 2015. ............................... 82
Figure 24. Comparison of mean monthly spill and release during the period 2005 to 2015 (CTD 2017c).
Note: Spill is not recorded continuously, so missing data has been interpreted by the graphed line. . 82

7
Figure 25. Comparison of the proportion of the different source water supply with current and projected
ASR demand. .................................................................................................................................. 83
Figure 26. Daily average temperature data observed in Dog River upstream of the confluence of the East
Fork Hood River. ............................................................................................................................. 89
Figure 27. Seven-day-minimum and maximum temperatures in South Fork Mill Creek at the USFS
boundary (MHNF 1999) below Crow Creek Reservoir. ................................................................... 91
Figure 28. Summer average daily temperature for South Fork Mill Creek (elevation of 2,500 feet),
downstream of Crow Creek Reservoir near the Forest boundary. ..................................................... 92
Figure 29. Mean daily discharge summary of an average water year that was diverted into the City’s
pipeline during 2012 through 2018, minus 0.5 cfs bypass flow to be offered 8/1 through 10/31,
compared to mean daily discharge of Dog River above diversion .................................................... 97 Figure 30. Instantaneous Discharge measured near the mouth of Dog River spring through late-summer of
2019, with additional proposed bypass flow of 0.5 cfs exhibited. ..................................................... 98 Figure 31. A comparison of average streamflow and diverted flow from 2011 through 2018 above the Dog
River diversion to illustrate the amount of spring peak flows that would bypass to lower Dog River.
........................................................................................................................................................ 99
Figure 32. The amount of mean daily streamflow that bypassed (undiverted flow) the pipeline diversion
down Dog River, expressed as a percentage of total available streamflow for water years 2012 to
2018* ............................................................................................................................................ 100 Figure 33. Mean daily flow in South Fork Mill Creek above the Wicks water treatment plant intake
exhibiting the estimated increase in streamflow above the natural flow regime. ............................. 102 Figure 34. Mean monthly fill and drawdown trends during the period 2005 to 2015. ............................. 103
Figure 35. Comparison of mean monthly spill and release during the period 2005 to 2015. ................... 103 Figure 36. Comparison of the proportion of the different source water supply with current and projected
ASR demand. ................................................................................................................................ 104 Figure 37. Daily average temperature data observed in Dog River upstream of the confluence of the East
Fork Hood River. ........................................................................................................................... 111 Figure 38. Seven-day-minimum and maximum temperatures in South Fork Mill Creek at the USFS
boundary (MHNF 1999) below Crow Creek Reservoir. ................................................................. 113 Figure 39. Summer average daily temperature for South Fork Mill Creek (elevation of 2,500 feet),
downstream of Crow Creek Reservoir near the Forest boundary. ................................................... 113 Figure 40. ESA action area and extent of Critical Habitat. Note: Red dot with “x” is location of Dog River
Falls and upper extent of Listed Fish Habitat. ................................................................................ 131 Figure 41. Mt. Hood National Forest (MHNF) stream temperature monitoring data (1994-2002) in Dog
River just upstream of the Highway 35 culvert (near mouth). ......................................................... 134 Figure 42. Daily average temperature data for Dog River upstream of the Highway 35 culvert (CTWS
2017). ............................................................................................................................................ 135 Figure 43. Seven-day-minimum and maximum temperatures in South Fork Mill Creek at the USFS
boundary 2.7 miles downstream of Crow Creek Reservoir (MHNF 1999). ..................................... 135 Figure 44. Average monthly flow for Dog River immediately upstream of the Dog River Diversion, from
1961 to 1971. ................................................................................................................................. 140 Figure 45. Project Area including pipeline location, staging areas, and culvert replacement. .................. 151
Figure 46. Top row photos: USFS Road 1700-014 road crossing ford at Brooks Meadow Creek. Middle
row photos: Existing Diversion Structure on Dog River at RM 6.0. Bottom row photos: Existing
Pipeline Intake at Diversion Structure on Dog River at RM 6.0...................................................... 152

8
List of Tables
Table 1. Projects that the IDT considered in analyses. ............................................................................. 31 Table 2 Existing Acres by Plant Association within Proposed Project Area. ............................................ 32
Table 3. Select Channel Characteristics of the Dog River Subwatershed. ................................................. 46 Table 4. Number of in-channel woody debris and woody debris density (total of both medium and large
size classes) observed in the 2000 Dog River stream survey. ........................................................... 47 Table 5. Number of in-channel woody debris and where it was located either as isolated pieces (single) or
in debris jams observed in the 2000 Dog River stream survey. ......................................................... 47 Table 6. Select Channel Characteristics of the South Fork Mill Creek Subwatershed. .............................. 49
Table 7. Existing Number of In-channel Woody Debris and Woody Debris Density (total of both medium
and large size classes) observed in the 2011 South Fork Mill Creek stream survey. ......................... 50
Table 8. Existing number of in-channel woody debris and where it was located either as isolated pieces
(single) or in debris jams.................................................................................................................. 50
Table 9. Estimated mean monthly natural streamflow (cfs) of Dog River at the mouth (50% exceedance
level). .............................................................................................................................................. 51
Table 10. Comparison of Discharge (cfs) in Dog River Measured Above and Below the Diversion on
Select Dates. .................................................................................................................................... 54
Table 11. Road Density and Watershed Impact Areas in the Dog River Subwatershed in 2015. ............... 55 Table 12. Road Density and Watershed Impact Areas in the South Fork Mill Creek Subwatershed in 2012.
........................................................................................................................................................ 58 Table 13. Estimated Percent of Mean daily discharge (cfs) of Dog River Diverted May through October. 60
Table 14. Estimated maximum naturalized inflow into Crow Creek Reservoir not including diverted flows
from Dog River. .............................................................................................................................. 62
Table 15. Beneficial Use Designations for the Hood Basin (includes Mill Creek) from ODEQ. ............... 66 Table 16. Surface Water Rights in the Dog River and South Fork of Mill Creek subwatersheds that are
designated for municipal use by the Oregon Water Resources Department. ..................................... 72 Table 17. In-stream surface water rights in the Dog River and South Fork Mill Creek subwatersheds and
the maximum monthly allocation protected by OWRD for instream use. ......................................... 73 Table 18. Estimated Percent of Mean daily discharge (cfs) of Upper Dog River Diverted May through
October............................................................................................................................................ 76 Table 19. Comparison of Discharge (cfs) in Dog River Measured Above and Below the Diversion on
Select Dates. .................................................................................................................................... 77 Table 20. Road Density and Watershed Impact Areas in the Dog River Subwatershed in 2015. No changes
are expected in these indicators under the No Action alternative. ..................................................... 80 Table 21. Road Density and Watershed Impact Areas in the South Fork Mill Creek Subwatershed in 2012.
No changes are expected in these indicators under the No Action alternative. .................................. 84
Table 22. Observations of Select Channel Characteristics of Dog River from the 2000 Stream Survey
Compared to LRMP and NMFS Standards and Guidelines. ............................................................. 85
Table 23. In-channel woody debris and woody debris density amounts (total of both medium and large
size classes) observed in the 2000 Dog River stream survey. ........................................................... 86
Table 24. Existing number of in-channel woody debris and where it was located either as isolated pieces
(single) or in debris jams.................................................................................................................. 86
Table 25. Observations of Select Channel Characteristics of South Fork Mill Creek from the 2011 Stream
Survey Compared to LRMP and NMFS Standards and Guidelines. ................................................. 87
Table 26. In-channel woody debris and woody debris density amounts (total of both medium and large
size classes) observed in the 2011 stream survey.............................................................................. 88

9
Table 27. Existing number of in-channel woody debris and where it was located either as isolated pieces
(single) or in debris jams.................................................................................................................. 88
Table 28. Surface Water Right Certificates for Dog River and South Fork of Mill Creek that are
designated for municipal use. ........................................................................................................... 94
Table 29. In-stream surface water rights in the Dog River and South Fork Mill Creek subwatersheds and
the maximum monthly allocation protected by OWRD for instream use. ......................................... 95
Table 30. Estimated Percent of Mean daily discharge (cfs) of Upper Dog River Diverted May through
October under the Proposed Action. ................................................................................................ 97
Table 31. Comparison of Discharge (cfs) in Dog River Measured Above and Below the Diversion on
Select Dates. .................................................................................................................................... 98
Table 32. Road Density and Watershed Impact Areas in the Dog River Subwatershed in 2015. No changes
are expected in these indicators under the Proposed Action. ........................................................... 101
Table 33. Road Density and Watershed Impact Areas in the South Fork Mill Creek Subwatershed in 2012.
No changes are expected in these indicators under the No Action alternative. ................................ 105
Table 34. Observations of Select Channel Characteristics of Dog River from the 2000 Stream Survey
Compared to LRMP and NMFS Standards and Guidelines. ........................................................... 106
Table 35. In-channel woody debris and woody debris density amounts (total of both medium and large
size classes) observed in the 2000 Dog River stream survey. ......................................................... 107
Table 36. Existing number of in-channel woody debris and where it was located either as isolated pieces
(single) or in debris jams................................................................................................................ 108
Table 37. Observations of Select Channel Characteristics of South Fork Mill Creek from the 2011 Stream
Survey Compared to LRMP and NMFS Standards and Guidelines. ............................................... 109
Table 38. In-channel woody debris and woody debris density amounts (total of both medium and large
size classes) observed in the 2011 South Fork Mill Creek stream survey. ....................................... 109
Table 39. Existing number of in-channel woody debris and where it was located either as isolated pieces
(single) or in debris jams................................................................................................................ 110
Table 40. Surface Water Right Certificates for Dog River and South Fork of Mill Creek that are
designated for municipal use. ......................................................................................................... 115
Table 41. In-stream surface water rights in the Dog River and South Fork Mill Creek subwatersheds and
the maximum monthly allocation protected by OWRD for instream use. ....................................... 116
Table 42. Ongoing and Future Activities Considered in the Cumulative Effects Analysis for Hydrology.
...................................................................................................................................................... 117
Table 43. Summary of cumulative effects on water quantity and quality resulting from past, current and
future projects in the Dog River Pipeline EA action area. Only activities that have a potential for
cumulative effect are addressed in this table. ................................................................................. 119 Table 44. Assessment of Consistency with Forest Plan Standards and Guidelines that Address Water
Quality and Water Quantity. .......................................................................................................... 126 Table 45. Consistency with Key Standards and Guidelines from the Northwest Forest Plan for Key
Watersheds and Riparian Reserves. ............................................................................................... 128 Table 46. Stream Survey Data from the 2000 MHNF Dog River Stream Survey.................................... 133
Table 47. The percent of surface fine sediment measured by Wolman pebble counts in streams within the
Dog River Pipeline Project action area. .......................................................................................... 136
Table 48. The in stream large wood summary for surveyed streams in the Dog River Pipeline Project
action area. .................................................................................................................................... 137

10
Table 49. Pool habitat summary for surveyed streams found within the Dog River Pipeline Project action
area, including total pools per mile; primary pools (pools ≥3ft. deep) per mile, and the AP standard
(pools per mile). ............................................................................................................................ 138 Table 50. StreamStats Low Flow Statistics Estimates for Sites within the Dog River Watershed (values are
cfs). ............................................................................................................................................... 140 Table 51. Monthly Average Flow for Dog River and the Dog River Pipeline. ........................................ 141
Table 52. StreamStats Low Flow Statistics Estimates for Sites within South Fork Mill Creek Watershed.
...................................................................................................................................................... 141
Table 53. Region 6 (R6) special status species either documented or suspected to occur within the Mt.
Hood National Forest and within the Dog River Pipeline Project action area (Yes, No, Assumed,
Unknown)...................................................................................................................................... 146 Table 54. The length of proposed new pipeline in various streamside zones. ......................................... 149
Table 55. Summary of effects of project elements on aquatic habitat indicators. .................................... 170 Table 56. Analytical process project effects determination key for species and designated critical habitat
...................................................................................................................................................... 170 Table 57. The Dog River Pipeline Project effects determination summary for ESA listed species,
designated critical habitat and essential habitat, and Region 6 Regional Forester’s Sensitive Species.
...................................................................................................................................................... 171
Table 58. Summary of past, present, and reasonably foreseeable future actions which may contribute to
cumulative effects to aquatic fauna and habitat for the no action and proposed action alternatives . 172
Table 59. ACS Objective Indicators in the EA. ...................................................................................... 185 Table 60. ACS Objective Indicators for each Alternative. ...................................................................... 186
Table 65. Visual Quality Objectives (VQOs 1) by Management Area. ................................................... 187 Table 66. Consistency with Forest Plan Standards and Guidelines. ........................................................ 190
Table 61. Disturbance and Disruption Distances for Northern Spotted Owls. ......................................... 195 Table 62. Approximate Acres Impacted within Territories. .................................................................... 196
Table 63. Trails within Project Area. ..................................................................................................... 219 Table 64. Consistency with Forest Plan Standards and Guidelines. ........................................................ 222
Table 67. Dog River Head Works Historic District ................................................................................ 229 Table 68. Summary of Effects, Dog River Head Works ......................................................................... 229

11
Figure 1. Vicinity Map of Dog River Pipeline Replacement Planning Area

Dog River Pipeline Replacement | Environmental Assessment
12
Chapter 1 – Introduction
The Forest Service has prepared this Environmental Assessment in compliance with the National
Environmental Policy Act (NEPA) and other relevant Federal and State laws and regulations.
1.1 Document Structure
This Environmental Assessment discloses the direct, indirect, and cumulative environmental effects that
would result from the No Action (baseline) and Proposed Action alternatives. The document is organized
into four parts:
• Introduction: The section includes information on the background of the project and the purpose
and need for action. This section also includes how the Forest Service informed the public and
other interested parties of the proposal.
• Alternatives, including the Proposed Action: This section provides a description of the No Action
and Proposed Action alternatives, project design criteria, and mitigation measures that were
added as a result of environmental analysis.
• Environmental Consequences: This section describes the environmental effects of the No Action alternative as well as the trade-offs and effects of implementing the Proposed Action alternative.
This analysis is organized by resource area. Within each section, the existing environment is
described first, followed by the estimated effects of the alternatives.
• Consultation and Coordination: This section provides information on agencies consulted during
the development of the Environmental Assessment.
Additional documentation, including more detailed analyses of planning area resources, may be found on
the project’s website (https://www.fs.usda.gov/project/?project=34721) and in the project record at the
Barlow Ranger District office in Dufur, Oregon.
1.2 Background
The existing Dog River pipeline, which is an important component of The City of the Dalles’ public
drinking water supply, was constructed in the early 20th century. It consists of milled pieces of fir that
were assembled in a circular shape and wrapped with heavy-gauge galvanized wire and coated with tar. Over the past 100 years, this pipe has deteriorated, is leaking, and is no longer conveying water
efficiently. Because the pipe is in poor condition, the City of The Dalles has requested the pipeline be
replaced with a 24-inch-diameter pipe.
The existing pipeline follows topographic contours along a circuitous route around Dog River Mountain to maintain gravity flow. Specifically, the pipeline travels north along the Dog River gauging station
access road 4,000 linear feet to Forest Service Road (FSR) 44. It traverses to the west and then to the
north along the base of Dog River Mountain, approximately 13,700 linear feet. The pipeline then travels
2,000 linear feet through a small hill by way of a 40-foot-deep hand-excavated notch. The pipeline crosses FSR 1700 and parallels the existing access road south of the Mill Creek gauging station, where it
discharges into South Fork Mill Creek.
The legal description for the project area is: Township 1 South, Range 10 East, Section 34; and,
Township 2 South, Range 10 East, Sections 2, 3, 4, 9, 10, 11; Willamette Meridian.

Dog River Pipeline Replacement | Environmental Assessment
13
1.3 Purpose and Need for Action
The purpose of this project is to replace the existing Dog River pipeline. There is a need for action
because the pipeline has become so deteriorated that it no longer provides the most efficient way of
conveying water to the City of The Dalles municipal water supply to continue to fulfill the commitment
under an existing Memorandum of Understanding (MOU).
1.4 Management Direction
This Environmental Assessment has been completed in accordance with direction contained in the
National Forest Management Act, the National Environmental Policy Act, the Council on Environmental Quality regulations, Clean Water Act, the Endangered Species Act and all other applicable laws, policies
and regulations. This Environmental Assessment is tiered to the Mt. Hood National Forest Land and
Resource Management Plan (Forest Plan) (USDA Forest Service 1990). In addition, management
direction for the area is provided in the following Forest Plan amendments:
• The Northwest Forest Plan (NWFP) – Record of Decision for Amendments to Forest Service and
Bureau of Land Management Planning Documents Within the Range of the Northern Spotted
Owl and Standards and Guidelines for Management of Habitat for Late-Successional and Old-
Growth Forest Related Species Within the Range of the Northern Spotted Owl (USDA and USDI
1994);
• Survey and Manage – Record of Decision and Standards and Guidelines for Amendments to the
Survey and Manage, Protection Buffer, and other Mitigation Measures Standards and Guidelines
(USDA Forest Service et al. 2001); and,
• Invasive Plants – Pacific Northwest Invasive Plant Program Preventing and Managing Invasive
Plants Record of Decision (USDA Forest Service 2005); and Site-Specific Invasive Plant Treatments for Mt. Hood National Forest and Columbia Gorge Scenic Area in Oregon (USDA
Forest Service 2008).
Mt. Hood National Forest Land and Resource Management Plan
There are three land use allocations (LUAs) as designated by the Forest Plan within the planning area:
Scenic Viewshed (B2), Special Emphasis Watershed (B6), and Timber Emphasis (C1) (Figure 2).
B2-Scenic Viewshed (Forest Plan, pages 4-218 through 4-220): The goal for this LUA is to provide
attractive, visually appealing forest scenery with a wide variety of natural appearing landscape features.
The major characteristics are for the visual character of the landscape resulting from prescribed visual
quality objectives within distance zones from selected viewer positions. For this project, Dufur Mill Road
serves as the main viewer position.
B6-Special Emphasis Watershed (Upper Dog River) (Forest Plan, pages 4-246 through 4-252): The Upper
Dog River Special Emphasis Watershed was designated for the City of The Dalles Municipal Watershed.
The goal of this area is maintain or improve watershed, riparian, and aquatic habitat conditions and water
quality for municipal uses and/or long-term fish production. A secondary goal is to maintain a healthy
forest condition through a variety of timber management practices.
C1-Timber Emphasis (Forest Plan, pages 4-289 through 4-290): This LUA includes approximately half of
the planning area and the main pipe storage areas. The goal for this land is to provide lumber, wood fiber,

Dog River Pipeline Replacement | Environmental Assessment
14
and other forest products on a fully regulated basis, based on the capability and suitability of the land. A
secondary goal is to enhance other resource uses and values that are compatible with timber production.
Chapter 3 (Environmental Consequences) evaluates the Proposed Action’s consistency with the Forest
Plan Standards and Guidelines associated with these LUAs.
Figure 2. Forest Plan Land Use Allocations within Dog River Pipeline Replacement Planning Area

Dog River Pipeline Replacement | Environmental Assessment
15
Northwest Forest Plan
There are three Northwest Forest Plan land use allocations included within the planning area, which are:
Riparian Reserves, Late-Successional Reserves (LSR), and Matrix (Figure 3).
Riparian Reserves include areas along rivers, streams, wetlands, ponds, lakes, and unstable or potentially
unstable areas where the conservation of aquatic and riparian-dependent terrestrial resources receives
primary emphasis.
Late-Successional Reserves, in combination with other allocations and standards and guidelines, are to
maintain a functional, interactive, late-successional forest ecosystem. The Surveyors Ridge LSR
Assessment for this area includes The Dalles Municipal Watershed Pipeline Replacement Project as a
detailed project proposal (USDA Forest Service 1997, p. 86).
Matrix areas consists of lands outside of designated areas (i.e., Congressionally Reserved Areas, LSRs,
Adaptive Management Areas, Administratively Withdrawn Areas, and Riparian Reserves).
Chapter 3 (Environmental Consequences) evaluates the Proposed Action’s consistency with the
Northwest Forest Plan Standards and Guidelines associated with these land use allocations, including
consistency with Aquatic Conservation Strategy (ACS) objectives.

Dog River Pipeline Replacement | Environmental Assessment
16
Figure 3. Northwest Forest Plan Land Allocations within the Dog River Pipeline Replacement Area

Dog River Pipeline Replacement | Environmental Assessment
17
1912 Cooperative Agreement & 1972 Memorandum of Understanding
Because much of the municipal water supply originates from National Forest System lands, a cooperative
agreement was signed between the United States Department of Agriculture and the City of The Dalles in
1912 for the purpose of conserving and protecting it within a specified area that includes both Federal and
non-federal ownership. The intent of the 1912 Agreement was formalized again in 1972 as per Forest Service Manual 2542 with a Memorandum of Understanding (MOU) between the City of The Dalles and
the Mt. Hood National Forest to maintain and protect the quality and quantity of water originating from
National Forest System lands for municipal use. It included management direction and a ten-year
management plan for both Federal and City-owned lands.
The intent of the 1972 MOU was carried forth into the Forest Plan according to Forest Service direction
(Forest Service Manual 2542, 2007), and National Forest System lands were designated further as a
Special Emphasis Watershed, with specific management standards and guidelines.
1.5 Public Involvement
A scoping letter was shared with the public in 2012. One commenter responded. A second scoping letter
was sent to the public in March 2016. Dog River was listed in the Mt. Hood National Forest quarterly
planning newsletter (Schedule of Proposed Action [SOPA]) as an ongoing project in spring 2016. Five commenters responded during the second public scoping period. Scoping comments and responses are
included in the project record.
In August 2016, a field trip to the project area included Forest Service staff and representatives from the
NOAA National Marine Fisheries Service (NMFS), City of The Dalles, and the Confederated Tribes of
Warm Springs. The intent of this field trip was to discuss issues and understand the City’s operation of
the pipeline and diversion.
A Preliminary Environmental Assessment was published on November 10, 2018 and a 30-day comment
period concluded on December 10, 2018. Five commenters responded. Comments and responses are
included in Appendix A. After the comment period ended, Forest Service staff met with the Confederated Tribes of Warm Springs (February 2019) and a representative from the City of the Dalles (March 2019).
The purpose of these meetings was to discuss project concerns and next steps in anticipation of
developing this Environmental Assessment.
1.6 Issues
Issues serve to highlight effects or unintended consequences that may occur from the Proposed Action,
giving opportunities during the analysis to reduce adverse effects and compare trade-offs for the
Responsible Official and public to understand. Issues are best identified during scoping early in the process to help set the scope of the actions, alternatives, and effects to consider; but, due to the iterative
nature of the NEPA process, additional issues may come to light at any time. Issues are statements of
cause and effect, linking environmental effects to actions, including the Proposed Action (Forest Service Handbook 1909.15, 12.4). Issues are used to generate additional action alternatives to the Proposed
Action.
Several concerns and recommendations raised during the scoping and comment periods were addressed as
either modifications to the Proposed Action, changes to the project design criteria, or as reason to conduct
additional research and analysis. The following highlights some of the common concerns raised by

Dog River Pipeline Replacement | Environmental Assessment
18
comments on the Preliminary Environmental Assessment, but all comments were considered and are responded to in Appendix A. While concerns were considered throughout the NEPA process, none were
identified as issues for the purpose of formulating fully developed alternatives.
Since most of the comments received on the Preliminary Environmental Assessment pertained to
hydrology and fisheries, the entirety of the Final Hydrology Report and Final Fisheries and Aquatic
Fauna Biological Evaluation are included in this Environmental Assessment. In addition, the Biological Assessment submitted to National Marine Fisheries Service (NMFS) for this project can be found on the
project website: https://www.fs.usda.gov/project/?project=34721.
Water Rights
Some comments expressed concern about water rights. Therefore, additional research and analysis was
conducted to address water rights more fully, which is included in the hydrology section (Section 3.3) of
this document.
City Plans for Future Water Use
Some comments expressed concern about the City’s plans for future water use, within the context of
current use and water rights. The hydrology section (Section 3.3) of this document provides more
background, data, and analysis of the City’s future plans.
Current Pipeline and Seepage
Some comments expressed concern about quantifying the amount of water lost to seepage under current
conditions, and how that could be considered to inform the effects analysis of the Proposed Action. More
information was added to Section 3.3 of this document to better address the expected effects of pipeline
replacement, and the enhanced efficiency of water conveyance.
Fish and Fish Habitat
Some comments expressed concern about how the Proposed Action might affect threatened, endangered, and sensitive fish and other aquatic species, as well as native resident fish and other aquatic populations.
The fisheries and aquatic fauna section (Section 3.4) of this document addresses projected effects to
aquatic resources.
1.7 Differences between the Preliminary Environmental Assessment and the Environmental Assessment
The Proposed Action has been updated to show that the City of the Dalles will include 0.5 cubic feet per
second (cfs) bypass flow below the point of diversion during August, September, and October, instead of only September and October as described in the Preliminary EA. Additional data were considered and
further analyses were conducted for the hydrology and fisheries reports. Additional data included stream
flow records from the City of The Dalles, USGS, USFS, and OWRD for Dog River, the South Fork of Mill Creek, and the Crow Creek reservoir. The Mt. Hood National Forest also collected data over the
spring through summer of 2019. Effects were addressed more comprehensively, and refinements were
made to Sections 3.3 and 3.4 of this Environmental Assessment to better describe effects. Also, consultation with the National Marine Fisheries Service (NMFS) was completed, which included all new
and supplemental data. Lastly, project design criteria were refined to better protect cultural and natural
resources.

Dog River Pipeline Replacement | Environmental Assessment
19
Chapter 2 – Alternatives This chapter is intended to describe the alternatives and how they were formulated for this project. This
chapter provides readers and the Responsible Official with a description of the Proposed Action components, project design criteria/mitigation measures, monitoring requirements, and regulatory
framework. Two alternatives were considered: the No Action Alternative and the Proposed Action
Alternative. No other alternatives were considered for this project.
2.1 No Action Alternative
Under the No Action Alternative, current management plans would continue to guide management of the
area. The existing pipeline would remain in place and would continue to degrade and leak. Additionally,
the current diversion would remain in place, and no fish screens or diversion structures would be
installed. This diversion would continue to serve as a barrier to aquatic and semi-aquatic fish passage.
In the long term, the pipeline would continue to degrade and would likely lose additional water as
growing vegetation would continue to compromise the integrity of the wooden pipeline. At some point,
the pipeline may suffer a catastrophic failure and no longer provide the City of The Dalles with this
portion of their municipal water supply.
The No Action Alternative would not repair any crossings, and the unimproved ford crossing at Brooks
Meadow Creek would remain in place. The current use pattern and crossing would not change, and the
unimproved crossing would continue to serve as a potential barrier to aquatic and semi-aquatic organisms.
Administrative use on this road system would not change. No action would mean that current minimal
road maintenance would occur, and no road reconstruction would occur.
2.2 Proposed Action Alternative
The Proposed Action is the replacement of the existing pipeline with a new pipeline, allowing the City of The Dalles to utilize more efficiently the water being diverted from Dog River. The existing 3.4 mile
antiquated pipeline would be abandoned in place. A seam-sealed 24-inch-diameter pipe would be
constructed parallel and next to the existing alignment as much as possible. The existing pipeline would
continue to be used to convey water to South Fork Mill Creek until the new pipeline is constructed.
In addition to pipeline replacement, the project would repair and improve the diversion structure and
install fish screens and a fish passage structure. A new culvert would also be constructed under the service
road (Forest Service Road (FSR) 1700-014) that crosses Brooks Meadow Creek to provide passage for
aquatic organisms. Summer low flows in lower Dog River would be improved by adding 0.5 cubic feet per second (cfs) bypass flow below the point of diversion during August, September, and October.
Implementation of the Proposed Action would include best management practices (BMPs) and project
design criteria (PDCs), which are discussed in the following section, to minimize effects to natural and
cultural resources.
Existing trees and dead wood would be cut and removed within a 25-foot corridor. Approximately 438
live trees ranging in size from six to 48 inches DBH would be removed. Of these 438 trees, approximately
twelve trees are larger than 24 inches DBH, 170 trees are between 12 and 14 inches DBH, and the
remaining trees are 11 inches DBH and smaller. In addition to the live trees, approximately 198 standing dead trees would be cut. Of these, over half are between 11 and 20 inches DBH, roughly three dead trees

Dog River Pipeline Replacement | Environmental Assessment
20
are over 30 inches DBH, 22 dead trees are between 20 to 30 inches DBH, and the remainder of the dead
standing trees are under 11 inches DBH.
A trench for the pipeline would be excavated and would be approximately 4-feet deep by 3 to 4-feet wide.
Spoils would be stockpiled to either side of the trench to be used to re-bury and cover the trench after the
pipe has been laid in the ground. Gravel and/or sand would be brought to the trench and staged within
reach for use as bedding and backfill. The pipe would be placed on top of the bedding emplaced in the bottom of the trench. Then the trench and pipe would be backfilled and overlaid with more gravel and/or
sand before being buried and covered using the removed spoils. The pipe inlet, discharge structure, and
flow measuring facilities would also be replaced. The construction corridor would be accessed along the existing service road (FSR 1700-014) and would avoid operating over the old pipeline. Where the
pipeline intersects Brooks Meadow Creek, it would be buried under the stream and the channel over it
would be restored.
FSR 1700-014 would be used as the main access for the length of the pipeline. This road is currently a
rough, native and gravel surface, single-lane road that crosses Brooks Meadow Creek at an unimproved ford. The project would first install a cement prefabricated open box culvert that would provide passage
for aquatic organisms prior to pipeline construction, eliminating the need for a ford crossing. During the
construction, the stream would be re-routed around the work area as the culvert is being installed using a temporary bypass line. During construction activities, FSR 1700-014 would be temporarily closed to the
public.
There are several staging areas and a main staging area identified for use during the construction period
(Figure 2). The main one-acre staging area would be located along the FSR 1700-014 west of the crossing at Brooks Meadow Creek, and would accommodate the transport of pipe to the construction corridor. It
would also act as a temporary storage area for the trees and logs removed from the corridor. Minor
realignment of FSR 1700-014 between Brooks Meadow Creek and the main staging area would be
completed to allow for construction vehicle traffic. There are several other locations identified for storing pipe, gravel, and sand: 1) on either side of FSR 1700-691 where it intersects with FSR 1700-690; 2) along
FSR 4400-011 at the junction with FSR 4400; or, 3) at an old landing off of FSR 1700. Gravel and sand
may also be stored at the junction of FSRs 1700 and 700-680 roads (Figure 2). All of the staging areas
would be rehabilitated upon completion of the project.
The new pipeline would continue to be maintained and operated as it conventionally has for many
decades, conveying water diverted from upper Dog River to South Fork Mill Creek for municipal use by
the City of The Dalles in accordance with existing state and federal authorizations. Pipeline operations
would remain unchanged. In most years, the headworks at the pipeline inlet would be operated to increase diverted flow in the late fall and early winter to re-fill Crow Creek reservoir, typically by early or mid-
February. Once full, the amount of diversion would be reduced to a maintenance flow that would
supplement South Fork Mill Creek and contribute to storage in order to meet variations in seasonal
demand.
2.3 Project Design Criteria and Mitigation Measures
The National Environmental Policy Act defines “mitigation” as avoiding, minimizing, rectifying, reducing, eliminating or compensating project impacts. The following project design criteria (PDC), best
management practices (BMPs), and mitigation measures are an integral part of this project and would be
carried out if the Proposed Action is implemented. BMPs are specified in The National Best Management
Practices for Water Quality Management on National Forest System Lands - Volume 1: National Core BMP Technical Guide (April 2012). The effects analysis in Chapter 3 is based on these PDC, BMPs, and

Dog River Pipeline Replacement | Environmental Assessment
21
mitigation measures being implemented.
2.3.1 Aquatic Conservation Measures
2.3.1.1. Technical Skill and Planning Requirements
A. Any project element that will be designed or implemented by the City of The Dalles or their designee (contractor) must be reviewed by qualified Forest Service staff (e.g., fisheries
biologist, hydrologist, engineer, silviculturist, fire/fuels specialist). A Forest Service fisheries
biologist or hydrologist will be involved in the planning and design review of all instream elements of the project. For all contracted work, planning and design includes field
evaluations and site-specific surveys, which may include reference-reach evaluations that
describe the appropriate geomorphic context in which to implement the project.
B. A Forest Service Permit Administrator or their designee would monitor the implementation of
the PDCs during construction and operations on a regular basis and will have the authority to
provide direction and/or take action if construction or operations are not conducted according
to the project design criteria.
2.3.1.2 In-water Work Period
A. Follow the appropriate state (ODFW 2008) or most recent guidelines for timing of in-water work (July 15-August 30). If in-water work needs to occur outside of this window, the Forest
Service will request exceptions to the in-water work window with the Oregon Department of
Fish and Wildlife, as well as through the Level 1 NMFS representative
2.3.1.3 Water Quantity
A. Maintain 0.5 cfs of bypass flow of water in-stream at the point of diversion between August 1
and October 31.
B. The City of The Dalles will monitor continuous streamflow in Dog River, both above and
below their diversion structure. Instrumentation will be installed, operated, and maintained by the City. The streamflow data will also be collected, stored, and maintained by the City, and
provided to the Forest Service upon request, such as at regular agreed-to dates.
2.3.1.4 Fish Passage
A. Fish passage will be provided for any adult or juvenile fish likely to be present in the action
area during construction. Temporary stream isolation and dewatering at Brooks Meadow
Creek will be necessary and will follow fish capture and release described below. After construction, adult and juvenile passage that meets ODFW’s fish passage criteria will be
provided for the life of the project.
2.3.1.5 Pollution and Erosion Control Measures
A. Identify a project contact (name, phone number, an address) that will be responsible for
implementing pollution and erosion control measures.
B. List and describe any hazardous materials that would be used at the project site, including
procedures for inventory, storage, handling, and monitoring; notification procedures; specific
clean-up and disposal instructions for different products available on the site; proposed
methods for disposal of spilled material; and employee training for spill containment.

Dog River Pipeline Replacement | Environmental Assessment
22
C. Temporarily store any waste liquids generated at the staging areas under cover on an
impervious surface, such as tarpaulins, until such time they can be properly transported to and
treated at an approved facility for treatment of hazardous materials.
D. Procedures based on best management practices to confine, remove, and dispose of
construction waste, including every type of debris, discharge water, concrete, cement, grout,
washout facility, welding slag, petroleum product, or other hazardous materials generated, used, or stored on-site.
E. Procedures to contain and control a spill of any hazardous material generated, used or stored on-site, including notification of proper authorities. Ensure that materials for emergency
erosion and hazardous materials control are onsite (e.g., silt fence, straw bales, oil-absorbing
floating boom whenever surface water is present).
F. Best management practices to confine vegetation and soil disturbance to the minimum area,
and minimum length of time, as necessary to complete the action, and otherwise prevent or
minimize erosion associated with the action area.
G. No uncured concrete or form materials will be allowed to enter the active stream channel.
H. Steps will be taken to cease work under high flows, except for efforts to avoid or minimize
resource damage.
I. Ensure pipeline is fabricated from materials meeting ODEQ standards for water quality.
J. Use suitable measures at the pipeline outlet to avoid or minimize erosion downstream of the
structure when design flows are released.
2.3.1.6 Site Preparation
A. Flagging Sensitive Areas – Prior to construction, clearly mark critical riparian vegetation
areas, wetlands, and other sensitive sites to minimize ground disturbance.
B. Staging Area – Establish staging areas for storage of vehicles, equipment, and fuels to
minimize erosion into or contamination of streams and floodplains.
C. No Topographical Restrictions – Place staging area 150 feet or more from any natural water
body or wetland in areas where topography does not restrict such a distance.
D. Topographical Restrictions – Place staging area away from any natural water body or wetland
to the greatest extent possible in areas with high topographical restriction, such as constricted
valley types.
E. Temporary Erosion Controls – Place sediment barriers prior to construction around sites
where significant levels of erosion may enter the stream directly or through road ditches. Temporary erosion controls will be in place before any significant alteration of the action site
and will be removed once the site has been stabilized following construction activities.
F. Stockpile Materials – Minimize clearing and grubbing activities when preparing staging, project, and or stockpile areas. Any large wood, topsoil, and native channel material

Dog River Pipeline Replacement | Environmental Assessment
23
displaced by construction will be stockpiled in a previously disturbed site as feasible for use during site restoration. Materials used for implementation of aquatic restoration categories
(e.g., large wood, boulders, fencing material) may be staged within the 100-year floodplain.
G. Hazard Trees within Riparian Areas – Where appropriate, include hazard tree removal (amount and type) in project design. Fell hazard trees when they pose a safety risk. If
possible, fell hazard trees within riparian areas towards a stream. Keep felled trees on site
when needed to meet coarse large wood objectives.
2.3.1.7 Heavy Equipment Use
A. Choice of Equipment – Heavy equipment will be commensurate with the project and operated
in a manner that minimizes adverse effects to the environment (e.g., minimally-sized, low pressure tires, minimal hard turn paths for tracked vehicles, temporary mats or plates within
wet areas or sensitive soils).
B. Fueling and Cleaning and Inspection for Petroleum Products
1. All equipment used for instream work will be cleaned for petroleum accumulations, dirt, plant material (to prevent the spread of noxious weeds), and leaks repaired prior to
entering the project area. Such equipment includes large machinery, stationary power
equipment (e.g., generators, canes, etc.), and gas-powered equipment with tanks larger
than five gallons. 2. Store and fuel equipment in staging areas after daily use.
3. Inspect daily for fluid leaks before leaving the vehicle staging area for operation.
4. Thoroughly clean equipment before operation below ordinary high water or within 50 feet of any natural water body or areas that drain directly to streams or wetlands and as
often as necessary during operation to remain grease free.
C. Temporary Access Points – Existing roadways will be used whenever possible. Minimize the
number of temporary access points and travel paths to lessen soil disturbance and compaction
and impacts to vegetation. When necessary, temporary access points will be decompacted
and/or revegetated. Temporary points in wet or flooded areas will be restored by the end of the applicable in-water work period.
D. Streams, Riparian Areas and Wet Areas – Minimize disturbance in streams, riparian areas and wet areas. Minimize number and length of stream crossings. Such crossings will be at right
angles and avoid potential spawning areas to the greatest extent possible. Stream crossings
shall not increase the risk of channel re-routing at low and high water conditions. After
project completion, temporary stream crossings will be abandoned and the stream channel and banks restored. Access, staging and stream crossing locations will be identified by a
hydrologist or fisheries biologist prior to implementation
E. Work from Top of Stream Bank for Instream Work – To the extent feasible, heavy equipment
will work from the top of the bank, unless work from another location (instream) would result
in less habitat disturbance, less floodplain disturbance, less sediment in the stream channel, or less damage to the overall aquatic and riparian ecosystem.
F. Timely Completion – Minimize time in which heavy equipment is in stream channels,
riparian areas, and wetlands. Complete earthwork (including drilling, excavation, dredging,

Dog River Pipeline Replacement | Environmental Assessment
24
filling and compacting) as quickly as possible. During excavation, stockpile native streambed
materials above the bankfull elevation, where it cannot reenter the stream, for later use.
2.3.1.8 Site Restoration
A. Initiate Rehabilitation – Upon project completion, rehabilitate all disturbed areas in a manner that results in similar or better than pre-work conditions through removal from the National
Forest of project-related waste, spreading of non-vegetation stockpiled materials (soil, etc.)
seeding, or planting with local native seed mixes or plants and restoration of stream channel bed and banks.
B. Short-term Stabilization – Measures may include the use of Forest Service approved
materials, weed-free certified straw, jute matting, and other similar techniques. Short-term stabilization measures will be maintained until permanent erosion control measures are
effective. Stabilization measures will be instigated within three days of construction
completion.
C. Decompact Soils – Excess materials should be stockpiled at an approved site, or dispersed
and decompacted by scarifying the soil surface of roads and paths, stream crossings, staging, and stockpile areas so that seeds and plantings can root. The Forest Service will review and
approve the need to disperse or stockpile excess material.
D. Pipeline Stream Crossing – Restore stream channel to pre-construction conditions.
2.3.1.9 Monitoring
Monitoring will be conducted by Forest Service staff, during and after the project to track effects
and compliance to ensure it is consistent with this Environmental Assessment.
A. Implementation
1. Visually monitor during project implementation to ensure effects are not greater (amount, extent) than anticipated.
2. Fix any problems that arise during project implementation.
3. Regular coordination with the fisheries biologist or hydrologist if fisheries biologist or hydrologist is not always on site to ensure contractor is following all stipulations.
B. Post Project – A post-project review shall be conducted after winter and spring high flows.
Adaptively manage for substantial deficiencies identified during monitoring (e.g., adding large wood to the outlet channel of South Fork Mill Creek).
1. For each element of the project, conduct a walk through and visual observation to determine if there are post-project affects that were not considered during planning. For
fish passage and revegetation activities, monitor in the following manner:
2. Fish Passage Activities – Note any problems with channel scour or bedload deposition, substrate, and discontinuous flow.
3. Dog River Pipeline Outlet downstream to Crow Creek Reservoir (South Fork Mill Creek)
– Monitor for any problems associated with additional flow (e.g., channel scour).
4. Headcut Stabilization – Monitor headcut stabilization sites for effectiveness (e.g., scour
or evidence of further headcutting).

Dog River Pipeline Replacement | Environmental Assessment
25
2.3.1.10 Installation of Aquatic Organism Passage (AOP) and Pipeline Crossing at Brooks Meadow Creek
A. The culvert design and pipeline crossing at Brooks Meadow Creek shall be reviewed by an
interdisciplinary design team consisting of an experienced engineer, fisheries biologist,
and/or hydrologist/geomorphologist. If the culvert is wider than 20 feet or the cost exceeds $100,000, it shall be reviewed by the USDA-Forest Service, Region 6, Aquatic Organism
Passage Design Assistance Team.
B. All road-stream crossing structures shall simulate stream channel conditions per Stream Simulation: An Ecological Approach to Providing Passage for Aquatic Organisms at Road-
Stream Crossings (USDA-Forest Service 2008a), located at:
http://stream.fs.fed.us/fishxing/aop_pdfs.html. Within the considerations of stream simulation, the structure shall, at a minimum, accommodate a bankfull wide channel plus
constructed banks to provide for passage of all life stages of native fish species (for more
information, reference Chapter 6, page 35 of the USFS Stream Simulation Guide).
C. Headcut and Grade Stabilization – Headcuts often occur in meadow areas, typically on
Rosgen “C” and “E” channel types. Headcuts develop and migrate during bankfull and larger
floods, when the sinuous path of Rosgen E type streams may become unstable in erosive, alluvial sediments, causing avulsions, meander cut-offs, bank failure, and development of an
entrenched Rosgen G gully channel (Rosgen 1994). These stabilization BMPs would apply
during activities in the vicinity of the stream crossing replacement location and at the pipeline stream crossing location.
1. Armor headcut with sufficiently sized and amounts of material to prevent continued up-
stream migration of the headcut. Materials can include both rock and organic materials which are native to the area. Material shall not contain gabion baskets, sheet pile,
concrete, articulated concrete block, and cable anchors.
2. Focus stabilization efforts in the plunge pool, the headcut, as well as a short distance of stream above the headcut.
3. Minimize lateral migration of channel around headcut (“flanking”) by placing rocks and
organic material at a lower elevation in the center of the channel cross section to direct flows to the middle of the channel.
4. Short-term headcut stabilization (including emergency stabilization projects) may occur
without associated fish passage measures. However, fish passage must be incorporated
into the final headcut stabilization action and be completed during the first subsequent in-
water work period.
D. Isolate the construction area and remove fish from the project site.
1. Isolate Capture Area – Install block nets at up and downstream locations outside of the construction zone to exclude fish from entering the project area. Leave nets secured to the
stream channel bed and banks until construction activities within the stream channel are
complete. If block nets or traps remain in place more than one day, monitor the nets or
traps at least on a daily basis to ensure they are secured to the banks and free of organic accumulation and minimize fish predation in the trap.
2. Capture and Release – Capture and release of resident trout will be conducted by Mt
Hood National Forest and ODFW fish biologist. 3. Electrofishing –Electrofishing will be conducted by Mt. Hood National Forest and
ODFW fish biologists.

Dog River Pipeline Replacement | Environmental Assessment
26
E. Dewater Construction Site – When dewatering is necessary, divert flow around the construction site with a coffer dam (built with non-erosive materials), taking care to not
dewater downstream channels during dewatering. Pass flow downstream with a by-pass pipe
large enough to handle the diverted flow. Small amounts of instream material can be moved
to help seal and secure diversion structures. If pumps are used to dewater, the intake must have a fish screen(s) and be operated in accordance with ODFW fish screen criteria. Dissipate
flow energy at the bypass outflow to prevent damage to riparian vegetation or stream channel.
Pump seepage water from the de-watered work area to a temporary storage and treatment site or into upland areas and allow water to filter through vegetation prior to reentering the stream
channel.
F. Stream Re-watering – Upon project completion, slowly re-water the construction site to
prevent loss of surface water downstream as the construction site streambed absorbs water
and to prevent a sudden release of suspended sediment. Monitor downstream during re-
watering to prevent stranding of aquatic organisms below the construction site.
2.3.1.11 Head-gate Diversion Replacement/Relocation & Screen Installation/ Replacement
A. ODFW Fish Passage Review and Approve – The Forest Service will ensure that the action is
individually reviewed and approved by ODFW for consistency with fish passage criteria. This applies across the action area.
B. Diversion structures associated with points of diversion and future fish screens must pass all life stages of aquatic species that historically used the affected aquatic habitat.
C. Water diversion intake and return points must be designed (to the greatest degree possible) to
prevent all native fish life stages from swimming or being entrained into the diversion. Abandoned ditches and other similar structures will be plugged or backfilled, as appropriate,
to prevent fish from swimming or being entrained into them.
D. When making improvements to pressurized diversions, install a totalizing flow meter capable
of measuring rate and duty of water use. For non-pressurized systems, install a staff gage or
other measuring device capable of measuring instantaneous rate of water flow.
E. Do not flush or otherwise move sediment from behind diversion structure downstream.
Deposit and stabilize sediment removed from behind diversion structure in a suitable
designated upland site.
2.3.2 Transportation/Engineering
2.3.2.1. Forest Service Road 4400:
A. After saw cutting pavement to replace new pipeline, rebuild sub-grade and sub-base in 6-inch
lifts to match existing asphalt.
2.3.2.2 Forest Service Road 4400-011:
A. Clear road of obstacles and danger trees where needed to provide safe passage for planned
vehicles.

Dog River Pipeline Replacement | Environmental Assessment
27
B. Maintain the culverts, ditchlines, and roadbed to reduce sediment delivery into waterbodies. install water bars to help drain surface and reduce sediment flows.
C. If road is to be used during wet conditions, surface road with 3-inch minus aggregate or other
road surfacing material to reduce sediment delivery into waterbodies.
2.3.2.3 Forest Service Road 1700:
A. At new pipeline crossing rebuild sub-grade with 6-inch lifts, roll or compact and reestablish
surface course.
B. Clean existing 18-inch culvert at the pipeline crossing if needed.
C. At existing pipeline maintenance access route, FSR 4400-011, which starts at FSR 1700 and
runs adjacent to the pipeline, maintain ditchlines and roadbed to reduce sediment delivery
into waterbodies and install rolling dips to help drain surface water.
2.3.2.4 Forest Service Road 1700-690:
A. Blade road to drain and replace surface material when needed to reduce dust and sediment
flows.
2.3.2.5 Forest Service Road 1700-014:
A. Place, roll and compact ¾-inch minus aggregate material 100 feet in each direction of road
crossing at Brooks Meadow Creek to minimize the delivery of sediment erosion to the
stream.
B. If the road is to be used in the wet season, surface portions of the road that have a native soil
surface with 3-inch minus aggregate or other road surfacing material.
C. Clear road of obstacles and danger trees where needed to provide safe passage for planned
vehicles.
D. Turnouts should be located approximately every 1000 feet.
E. Slope road to drain or install water bars to reduce sediment flows.
2.3.2.6 Staging Areas:
A. Place 6 inches minimum compacted (8”-10” loose) aggregate base at primary pipe storage
areas. Turn around areas would be required to have compacted aggregate base.
2.3.2.7 Miscellaneous:
A. If the access routes are to be used in the winter by wheeled vehicles, a snow plow permit
would be required by the Forest Service and approved and signed by the District Ranger. The City of the Dalles/Director of Public Works will notify the Forest Service of any winter
operations proposed.
B. A Forest Service road use permit may be required for maintenance and repair of damaged
Forest System Roads used for this project.
C. A Forest Service engineer will review final plans of all project activities prior to
implementation.

Dog River Pipeline Replacement | Environmental Assessment
28
2.3.3 Wildlife
A. If a northern spotted owl nest is found, there would be timing restrictions between March 1
and July 15 for all activities within 65 yards of the owl nest patch.
B. Leave 5% of the largest felled trees (live or dead) on the site with even distribution and
species selected for habitat considerations. Trees should be limbed and the slash piled.
C. If a wolf den or rendezvous site is found in or near the project area, no activities associated
with the proposed action will be allowed within one mile of the den or rendezvous site from
April 1 through July 15.
2.3.4 Fuels
A. All activity-created slash will be piled outside of riparian areas.
B. Slash piles should have a sound base to prevent toppling over and should be wider than they
are tall. Pile branches with their butt-ends toward the outside of the pile, and overlap them so
as to form a series of dense layers piled upon each other. Use a mixture of sizes and fuels throughout the pile. There should be no long extensions protruding from the piles. Do not
construct piles on stumps or on sections of large down logs.
C. Any mechanical slash piling would be done with equipment capable of picking up (grasping)
slash material and piling (as opposed to pushing/dozing). Piles need to be 8-feet wide at base,
6-feet high as a minimum. An allowance for a small deviation from the stated dimensions
would be made as long as this deviation does not jeopardize meeting any other stated goals. Any piling of slash will be kept separate from the chip material.
D. Hand piles would be constructed with enough fine fuels to allow for ignition during fall and winter months, and covered, to facilitate consumption of piled fuels. Piles need to be 8-feet
wide at base, 6-feet high as a minimum. An allowance for a small deviation from the stated
dimensions would be made as long as this deviation does not jeopardize meeting any other
stated goals.
E. Piles should be as compact and free of dirt as possible.
F. Pile size and location should be such to minimize damage to residual trees. Piles should be
located at least within the construction corridor. Piles should not be placed on or in the
following areas: pavement, road surface, ditch lines, or within 100-feet of a stream course.
G. Piles would be burned within two years of contract termination.
H. All boles remaining on site would be limbed and material would be piled.
2.3.5 Recreation
A. The Surveyors Ridge Trail would be closed for as little time as possible understanding that
closure due to safety concerns and the need for new construction is necessary. Pipeline

Dog River Pipeline Replacement | Environmental Assessment
29
replacement construction timing across the Surveyors Ridge Trail would be coordinated with Forest Service recreation staff to reduce impacts during times of high usage.
B. The City of The Dalles would work with Forest Service recreation staff to develop public
information materials and outreach plan using a combination of key entry/exit portals, visitor information boards and outreach via websites and other information sources.
C. The public would be notified of trail closures, detours, or alternative routes as early as possible utilizing signs at trail heads as well as media outlets such as newspapers and
websites. Trail closures would be posted no later than two weeks before the closure would
occur.
2.3.6 Visuals
A. In order to keep the pipeline corridor visually subordinate along FSR 44, as many trees as
possible would be retained along the FSR 44 corridor to maintain a visual buffer between the road and the pipeline corridor.
B. Piles would be visually subordinate along the pipeline corridor adjacent to FSR 44. They would be burned within two years of contract termination.
C. Tree stumps would be maintained at heights of 6 inches or less within the foreground (up to ½ mile) and be angled away from the roadway to meet retention standards adjacent to FSR
44.
D. Tree paint and boundary flagging would not be marked facing the roadway along FSR 44.
2.3.7 Soils
A. All disturbed ground, including temporary storage and access points would use erosion
control measures. A qualified specialist would monitor disturbed areas, as needed, to verify
that erosion controls are implemented and functioning as designed and are suitably
maintained. Due to the rating of Moderate Compaction Hazard, a minimum of 60% effective
groundcover is required before the first overwintering period.
2.3.8 Invasive Plants
A. Incorporate the standard contract provision that require cleaning of equipment. In order to
prevent the spread of invasive plants, all equipment would be cleaned of dirt and weeds
before entering National Forest System lands. This practice would not apply to service
vehicles traveling frequently in and out of the project area that would remain on the roadway.
B. The process for locating all landings or stockpile locations would be coordinated with a
Forest Service noxious weed specialist to insure these locations are not within any currently
established noxious weed populations. If necessary, pre-treat existing landings and skid trails that may be used for project implementation where existing infestations present an
unacceptable risk of spreading established invasive plant populations.

Dog River Pipeline Replacement | Environmental Assessment
30
C. Inspect active gravel, fill, sand stockpiles, quarry sites, and borrow material for invasive plants before use and transport. Treat or require treatment of infested sources before any use
of pit material. Use only gravel, fill, sand, and rock that is judged to be weed free by Forest
Service noxious weed specialists.
2.3.9 Cultural
A. In accordance with 36 CFR 800 and Section 106 of the National Historic Preservation Act
(1966), all known cultural and archaeological sites within the project planning area which are eligible or potentially eligible (unevaluated) for listing on the National Register of Historic
Places (NRHP) will be protected throughout the life of the project so that there are no adverse
impacts caused by project activities.
B. Archaeological site boundaries will be flagged for avoidance. A map will be provided to the
project lead prior to implementation with buffered site boundaries labeled as “Sensitive
Resource – Area to Protect.” The project lead will consult with a Forest Service Archaeologist on locations of equipment staging and access routes and any modifications in
project location or design before any activities proceed.
C. A qualified cultural resource specialist(s) working under the direct supervision of an
archaeologist meeting the Secretary of the Interior’s professional qualification standards will
conduct on-site monitoring during project activities occurring in or adjacent to areas modeled as ‘high probability’ under the Mount Hood National Forest Cultural Resource Inventory
Plan (Burtchard, Greg C. and Keeler, Robert W. Mt. Hood Cultural Resource Reevaluation
Project. Laboratory of Archaeology and Anthropology, Portland State University, 1994).
D. If during project activities cultural material is encountered, all work will cease immediately
and a Forest Service Archaeologist will be contacted to evaluate the inadvertent discovery. A
mitigation plan, if needed, will be developed in consultation with the Oregon State Historic Preservation Office (SHPO) and Confederated Tribes of the Warm Springs Reservation of
Oregon (CTWSRO), Tribal Historic Preservation Office (THPO).
E. All on-site monitoring will be documented in the Forest Service Heritage database. Any additional sites discovered during monitoring, or significant changes to the boundary or
character of previously documented sites will be recorded in the SHPO site record form and
submitted to SHPO.
F. Under continuing consultation and approval of the Mt Hood National Forest Heritage
Program, install interpretive signs describing the history of the Dog River aqueduct along the Surveyors Ridge and Cook’s Meadow Trails.
G. Under continuing consultation with Oregon SHPO and the Mt. Hood Heritage Program, as a
separate facilities maintenance undertaking, repair and stabilize the Dog River Headworks Log Cabin. This may include amendments to and repair of the foundation, excavating the hill
slope away from the cabin, leveling the cabin, replacing deteriorating logs, and re-shingling
the roof with cedar shakes. Or;
1. Repair the cabin and place it on a new foundation set back from the access road to protect
it from traffic damage.

Dog River Pipeline Replacement | Environmental Assessment
31
2. Repair the cabin, transport it to The Dalles, and place it on a new foundation in a City park.
3. File a copy of this report and site forms with the Wasco County Museum and the Hood
River County Museum on archival paper.
H. If during project activities cultural material is encountered, all work will cease immediately
and the Zone Archaeologist will be contacted to evaluate the inadvertent discovery. A mitigation plan, if needed, will be developed in consultation with the Oregon State Historic
Preservation Office (SHPO) and when appropriate, the Confederated Tribes of the Warm
Springs Reservation of Oregon (CTWSRO), Tribal Historic Preservation Office (THPO).
Chapter 3 – Environmental Consequences This chapter presents information on the physical, biological, social, and economic environments of the affected planning area, and the potential direct, indirect and cumulative effects to those environments due
to the implementation of the alternatives. Each resource area discloses the direct, indirect and cumulative
effects for that resource area.
The Environmental Assessment hereby incorporates by reference the project record (40 CFR 1502.21).
The project record contains specialist reports, biological evaluations, and other technical documentation
used to support the analysis and conclusions in this Environmental Assessment. Specialist reports, which
are incorporated by reference, were completed for resources. Separate biological evaluations were completed for aquatic, terrestrial wildlife, and botanical species. Also, biological assessments were
completed for fish and wildlife. Full versions of these reports are available in the project record.
Each of the analyses conducts cumulative effects analysis resulting from this project. The table below lists
projects considered in the cumulative effects analyses.
Table 1. Projects that the IDT considered in analyses.
Past Activities
The Dalles Watershed Fuels Reduction, Phase I and II
Timber harvests on federal, county and private lands (including associated road/landing construction)
Road decommissioning and road closures
Aquatic restoration projects
Cooks Meadow Trail relocation
Ongoing Activities
The Dalles Watershed Fuels Reduction, Phase I and II
Polallie Cooper Fuels Reduction
Timber harvests on federal, county and private lands (including associated road/landing construction)
Road decommissioning and road closures
Dog River Pipeline and Crow Creek Reservoir ongoing operations
Pre-commercial thinning
Dog River Trail relocation
National Forest System road and trail maintenance
Site-specific noxious plant treatments
Surveyors Ridge Trail relocation
Surveyors Ridge Trail maintenance
Highway 35 road maintenance and sanding
Dufur Mill Road (4400) maintenance

Dog River Pipeline Replacement | Environmental Assessment
32
Snowmobile use
Developed and dispersed campsites
Future Activities
Timber harvests on federal, county and private lands (including associated road/landing construction)
The Dalles Watershed Fuels reduction activities
Re-issuance of The Dalles Watershed special use permits
3.1 Vegetation Resources
3.1.1 Existing Condition
The proposed project area is dominated by three plant associations, Grand fir (Abies grandis)/vine maple (Acer circinatum)/vanilla leaf (Achlys triphylla) (A1), Grand fir/queencup beadlily (Clintonia uniflora)
(A2), and grand fir/vanilla leaf (A3). Common to the moist mix conifer plant associations (A1, A2, and
A3) the overstory would be dominated by Douglas-fir (Pseudotsuga menziesii), grand fir, and ponderosa pine (Pinus ponderosa) and the understory would be dominated by a variety of shrubs like Oregongrape
(Berberis nervosa), serviceberry (Amelanchier alnifolia), vine maple, greenleaf manzanita
(Arctostaphylos patula) (refer to Table 2). Currently ponderosa pine is only representing less than 20% of
the overstory component and very little to no shrub component is present in the stands due to high stand densities. Site productivity within the project area range in site indices between 125 to 135 feet on
moderate to highly productive sites. They are usually found on moderate slopes with an average elevation
between 2,800 to 5,300 feet.
Table 2 Existing Acres by Plant Association within Proposed Project Area.
Stand Group Plant Association Approximate Acres within
proposed project area
A1 Grand fir/vine maple/vanilla leaf 32
A2 Grand fir/queencup beadlily 9
A3 Grand fir/vanilla leaf 4
TOTALS 45
Currently, the project area contains a mix of stands of immature commercial plantations less than 80 years old, sapling age plantations less than 30 years old in moist mix conifer plant communities and recently
unmanaged stands (RUS) over 80 years old in both moist and dry mix conifer plant communities. The
majority of the plantations, sapling and commercial, are in the stem exclusion stage dominated by small to
medium size material with a quadratic mean diameter (QMD) ranging from 3 to 12 inches and an average height of 60 feet in the commercial plantations and 35 in the sapling plantations. The recently unmanaged
stands range in age from 90-200 years old and are dominated by stands in the reinitiation stage in both the
moist and dry mix conifer plant communities. The QMD within the RUS range from 5-12 inches in the moist mix conifer and 5-14 in the dry mix conifer with an average height range in both of 70-120 feet.
Regeneration in the RUS is dominated by shade tolerant species like grand fir and western hemlock and is
averaging around 700 trees per acre. Stands have an abundance of ladder fuels built up in the understory
with very little to no shrub component.

Dog River Pipeline Replacement | Environmental Assessment
33
3.1.2 Effects Analysis
No Action Alternative
Under the No Action alternative, stands would continue to progress through natural successional stages
that are already occurring. There would be no forested lands removed. This alternative would have no
effect on vegetation resources.
Proposed Action Alternative
Live and dead trees would be cut, in order to facilitate constructing the new pipeline. Removal of trees
would vary depending on site and slope to accommodate the new pipe. Tree sizes would typically range
in diameter from 5 inches 26 inches DBH and from 10 feet to 120 feet tall. With less than 50 acres of forested land being treated in the above mentioned plant communities there would be no considerable
change in the forest structure for the plant association within the analysis area. During the tree removal
process all residual trees would be protected from major damage. Overall, this alternative would have no
considerable effect on vegetation resources.
All logging activities would be ground based operations. Existing landing and skid trails would be
utilized to move the pipe material when possible. All merchantable (8”-23.9” DBH) trees removed would
be staged near open roads for future removal. To meet wildlife habitat requirements, approximately 5% of
the largest cut trees (boles only) would be left on site.
Cumulative Effects
For this cumulative effects analysis, all projects shown in the Cumulative Effects Table 1 were
considered; however, only projects with effects to vegetation within the project area were analyzed, such
as timber and fuels management activities. Since the Proposed Action would result in no measurable change to forested land or plant communities, there would be no cumulative effects for vegetation
resources.
3.1.3 Consistency Determination
NFMA Findings for Vegetation Manipulation As required by regulations (FSH 1909.12 5.31a), “all proposals that involve vegetative manipulation of
tree cover for any purpose must comply with the seven requirements found at 36 CFR 219.27(b).” All of
these requirements are met by the project (refer to project record).
Suitability for Timber Production The primary objective of the proposal is fuel reduction rather than timber production. However, as a pre-cursor to the silvicultural diagnosis process, stand examinations are conducted to determine existing stand
conditions, and a determination of suitability (in regard to management of the stand for timber
production) is made for each stand. Stands proposed for harvest treatment were examined for suitability in accordance with 36 CFR 219.13, Timber resource land suitability. Stands were found to be suitable for
timber management based upon the following:
Meet the definition of forestland as described in 36 CFR 219.3. Technological feasibility exists to ensure soil productivity and watershed protection. All sites considered
for treatment would use established harvesting and site preparation methods. In combination with resource protection standards in the Forest Plan and applicable Best Management Practices, these
methods would be sufficient to protect soil and water resource values.

Dog River Pipeline Replacement | Environmental Assessment
34
There is reasonable assurance that lands could be restocked within 5 years of final harvest (this generally does not apply to the proposed harvest units, as they would be thinned. Small openings in root disease
pockets would be regenerated with rot resistant species).
Maximum Harvested Acres (36 CFR 219.12 (k)(5)(iii), 219.27 (d)). Ensure that no timber harvesting occurs on lands classified as not suited for timber production, except for
salvage sales or sales necessary to protect other multiple-use values where the Forest Plan establishes that such actions are appropriate (36 CFR 219.27 (c) (1)). The proposed actions meet the forest plan
requirement for less than 40 acres of created openings.
Mt. Hood National Forest Land and Resource Management Plan (Forest Plan) All of the action alternatives proposed would meet the goals and objectives of the Mt. Hood National
Forest Land and Resource Management Plan (Forest Plan) as defined by B-2, Scenic Management Area Direction, B-6, Special Emphasis Watersheds, and C-1, Timber Emphasis as amended, including
Standards and Guidelines, Northwest Forest Plan, and Survey and Manage 2001 Record of Decision
Watershed impact areas should not excee “thresholds of concern (TOC) calculated for each
of the special emphasis watersheds. (B6018-020). Forest Plan guidelines advise that no more then 25% TOC for Upper Dog River be impacted by timber management activities. The proposal is consitant with this standard with less than 1% of the watershed
being impacted by the proposed tree removal and piping.
Suitability for even-aged and uneven-aged management Forest Plan guidelines advise against uneven aged management in stands with dwarf mistletoe and/or root
disease. Even-aged management is the effective way to manage dwarf mistletoe and root disease). (Forest wide Standards (FW) 316 and 317), (C1-019-021),(C1-024). Created openings should be no more than 2
acres (FW 323 and 324) and should be focused in areas of stands that are diseased, infested with
damaging insect populations, or damaged by storms (C1-022). The Forest Plan states “However, silvicultural prescriptions may specify appropriate mitigation measures
in Management Areas where uneven-aged management is being considered to fulfill resource objectives
other than timber production.” (Mt. Hood FP Four-88)(FW 318-347). The resource objective here is fuel reduction while maintaining structure for aesthetics, wildlife, nutrient cycling, and future stand
composition and health (FW 148-169). Project design features/mitigation measures such as patch
openings, and risk of windthrow are written into the design of the proposed action to meet Forest Plan
direction.
3.1.4 Summary of Effects
The Proposed Action would result in no considerable direct, indirect, or cumulative effects to vegetation
resources. With less than 50 acres of forested land being treated in the above mentioned plant communities there would be no considerable change in the forest structure for the plant association within
the analysis area.
Additional information regarding this resource can be found in the full specialist report which is
incorporated by reference and available in the project record.

Dog River Pipeline Replacement | Environmental Assessment
35
3.2 Soil Productivity
3.2.1 Existing Condition
Several field reviews have occurred during the planning lifespan of the project and no soils related issues
were discovered.
Currently, there are sufficient levels of effective groundcover across and adjacent to the proposed area of
disturbance since no unusual erosion was observed.
Soils across the planning area have been derived from numerous ashfall deposits, primarily from Mt.
Hood eruptions. Prevailing winds have a south or west component to them and as the mountain would erupt, ash clouds would be carried downwind and deposited across the entire planning area. Wind,
precipitation events, and landslides continue to alter the original depositional pattern by removing ash
completely in some places exposing bedrock, and depositing it in others resulting in very thick ash deposits. Soil characteristics are generally similar under the forested terrain across the length of the
pipeline footprint.
The soil in the project area is identified as SRI soil map unit 168, with a moderate compaction hazard and
surface erosion potential. As explained above, erosion rating of moderate which is based upon bare soil (no vegetative or duff cover). The compaction hazard is estimated as moderate, and the susceptibility to
soil displacement is high.
3.2.2 Effects Analysis
No Action Alternative
Soil Erosion Risk
The risk of erosion within the analysis area would remain unchanged because the amount of groundcover
protecting the soil surface from erosional influences is common and widespread. The expected effect is
the landscape would respond and change proportionate to the severity of natural events, such as storms or
wildfire.
Detrimental Soil Conditions
It is assumed that soils damaged by previous activities would continue to recover and change at an
unknown rate as roots, animals, and other influences slowly break up existing compaction. The effect of
soil recovery is a gradual increase in available soil (therefore nutrients and water) for all normally
expected soil biological, chemical, and physical functions to occur.
Organic Matter Levels
Soil organic matter and corresponding soil functions would continue without much change. Similar to erosion risk, the expected effect is that the soils at landscape and site scales would respond and change
proportionate to the severity of natural events, such as storms or wildfire. In addition, organic matter
decomposition is influenced substantially by temperature, moisture, and fire, thus the rate of decay and
cycling would continue accordingly.

Dog River Pipeline Replacement | Environmental Assessment
36
Proposed Action Alternative
Soil erosion risk
No active erosion from previous management was observed during the field reconnaissance for this
project. The project footprint is expected to meet the effective groundcover standard following ground
disturbing activities.
Detrimental soil conditions
Soils within the disturbance footprint, and especially the pipeline installation itself, will remain in an intentionally detrimental condition, much like a permanent road. Given the thin, linear nature of the
impact, it is not expected to have a measurable effect on the surrounding forest in terms of growth or
sustainability.
Organic Matter Levels
Soil organic matter and corresponding soil functions would continue without much change. Similar to erosion risk, the expected effect is that the soils at landscape and site scales would respond and change
proportionate to the severity of natural events, such as storms or wildfire. In addition, organic matter
decomposition is influenced substantially by temperature, moisture, and fire, thus the rate of decay and
cycling would continue accordingly.
Direct and Indirect Effects
Soil Erosion Risk
Soil erosion risk would increase with the Proposed Action because bare soil would be exposed during
implementation. As the amount of bare, bare/compacted soil increases, so does the risk of soil movement.
Actual resource impairment (erosion and/or sedimentation) is dependent on weather events that provide the energy to move soil material from one location to another. In order to diminish this risk while soils are
exposed, certain erosion control techniques are practiced to lessen erosive energies. The effectiveness of
these ‘Best Management Practices’, or BMPs, is discussed by Rashin et.al. (2006) in an applicable
publication of the Journal of the American Water Resources Association. Comparing the Proposed Action to their application of studied BMPs would indicate that the proposed project and associated design
criteria would substantially reduce the risk of resource damage should a storm event occur while the
ground is exposed. For example, the study showed an assessment of surface erosion and sediment routing during the first two years following a timber harvest activity indicated a 10 meter (approximately 30 feet)
setback from ground disturbance can be expected to prevent sediment delivery to streams from about 95
percent of harvest related erosion features. Therefore, by maintaining proper amounts of protective groundcover along with BMPs and PDCs, the risk of erosion and subsequent sediment delivery caused by
the Proposed Action is extremely small.
Detrimental Soil Conditions
Impacts caused by heavy equipment would increase the amount of detrimental soil damage within the
treatment areas, but is not expected to result in a measurable decrease in site productivity.
Organic Matter Levels
Sufficient tonnage is expected to remain on site to provide for organic matter input to the ecosystem once
all activities are complete.

Dog River Pipeline Replacement | Environmental Assessment
37
Cumulative Effects
Potential cumulative effects projects from cumulative effects in Table 1 have been reviewed and no
projects overlap in either time or space within the soils analysis areas, therefore there are no effects to
accumulate from these projects.
The effects of leaving the existing pipeline in the ground (pollution from tar and galvanized wire) was
analyzed.
The concentration and extent of pollutants that could be generated by leaving the existing pipeline abandoned underground would be expected to be very low and localized. Materials that were originally
used to assemble the wooden pipeline included galvanized wire and tar (presumed to be coal tar pitch).
Being manufactured materials, consideration has been given to the potential for their toxicity to the
environment. They have been in place for over 100 years, and remain around the outer surface of the
pipeline.
The galvanized wire has been subject to corrosion from underground weathering and oxidation. Soils the
pipeline is buried in exhibit pH values that are slightly acidic (greater than 6.0, but less than 7.0, SRI 1979). So the corrosion potential is considered to be relatively low. The rate of breakdown has been, and
would continue to be very slow. Any oxidation of metals such as iron, tin, and zinc would generate
minute particulate, with a likelihood to become adsorbed into the soil. The potential for it to become mobile and available for soluble transport in a concentrated form for uptake or ingestion in toxic
quantities is very low to unlikely.
The tar would not be expected to be soluble in the soil-water matrix. Chemical reaction to soil-water and
mineral content would be considered to be very low. Any degradation by sunlight would be unlikely. Breakdown of phenols and hydrocarbon compounds in the tar would be expected to be infinitesimal. The
likelihood that toxic concentrations would form and become mobile and available for uptake or as a
pollutant would be considered to be very low.
3.2.3 Consistency Determination
The Proposed Action is consistent with all applicable laws, regulations, and Forest Plan guidance.
3.2.4 Summary of Effects
The project footprint is expected to meet the effective groundcover standard following ground disturbing activities. Soil erosion risk would increase with the Proposed Action because bare soil would be exposed
during implementation. Given the thin, linear nature of the impact, it is not expected to have a measurable
effect on the surrounding forest in terms of growth or sustainability. Similar to erosion risk, the expected effect is that the soils at landscape and site scales would respond and change proportionate to the severity
of natural events, such as storms or wildfire. Impacts caused by heavy equipment would increase the
amount of detrimental soil damage within the treatment areas, but is not expected to result in a measurable decrease in site productivity. Sufficient tonnage is expected to remain on site to provide for
organic matter input to the ecosystem once all activities are complete.
Additional information regarding this resource can be found in the full specialist report which is
incorporated by reference and available in the project record.

Dog River Pipeline Replacement | Environmental Assessment
38
3.3 Hydrology
3.3.1 Existing Condition
The affected area for the Dog River Pipeline Replacement Project includes the Dog River and South Fork Mill Creek subwatersheds located on the eastern side of the northern Cascade Mountains of Oregon. Both
Dog River and South Fork Mill Creek are low- to mid-elevation streams that eventually drain into the
mid-Columbia River. Dog River is located to the southeast of the town of Parkdale, Oregon; and the
South Fork Mill Creek is situated to the southwest of The Dalles (Figure 1).
The hydrologic regime in each of the subwatersheds is dominantly snow, supplemented by rain and
groundwater. The principle runoff season occurs in spring months and is fed by an average persistent winter snowpack of about 80 to 100 inches at the highest elevations (CTD 2017). Additional precipitation
in the form of rain occurs primarily in late fall and winter months. High intensity winter precipitation
events can also drive peak flows. Given that the watersheds partially sit within the transient snow zone
between 2,500 to 5,000 feet elevation, periodic rain-on-snow events can cause rapid snowmelt and heavy runoff, often resulting in unusually high peak flows. Ordinary peak flows are most commonly attributable
to spring snowmelt. Snowfall typically accumulates between November and late March, and melts out
beginning in April and ending usually by early or mid-June. Base flows are maintained by perennial
tributaries and groundwater inputs from springs and wetlands.
Dog River
The Dog River subwatershed comprises about 8,142 acres (12.7 sq. mi.). The highest elevation of the subwatershed is the top of Lookout Mountain at 6,525 feet, and the lowest elevation is at the mouth of
Dog River at about 2,105 feet. The long-axis of the subwatershed is oriented primarily south to north,
being nearly 10 miles long and about 2 miles wide at its widest. Dog River flows north from its origin at the wet meadow known as High Prairie to its confluence with the East Fork of Hood River (EFHR), a
principle tributary to Hood River, which is tributary to the Columbia River. The subwatershed is made up
of four smaller nested perennial catchments: Lower Dog River, Puppy Creek, Brooks Meadow Creek, and Upper Dog River. Average precipitation in this subwatershed has historically ranged between 55 inches
annually at the lowest elevation in the Lower catchment, to 75 inches at the higher elevations in the Upper
catchment (Figure 4).
The Lower Dog River catchment comprises 62 percent (5,507 acres) of the larger Dog River
subwatershed. Terrain of the lower catchment is typified by a steeply sided narrow canyon that is
dissected by a number of high gradient intermittent/ephemeral streams, and several perennial tributaries.
It contains the perennial main stem of Dog River between stream miles 0.0 at the mouth and 5.5 at Cooks Meadow. Stream surveys document a number of unmapped and unnamed springs, particularly along the
left stream bank (as facing downstream) between river mile (RM) 1.9 and 5.0. There is a 60 foot waterfall
located at RM 2.6 that is considered a barrier to passage by fish. At the higher end of this catchment the Dog River pipeline traverses mid slope around Dog River Butte before entering the South Fork Mill
Creek subwatershed. About 96 percent of the Lower catchment is located within the bounds of the Hood
River Ranger District of the Mt Hood NF, the remaining 4 percent near the mouth is non-Federal
ownership.
The Brooks Meadow catchment is tributary to the Lower catchment below the City’s pipeline intake, and
makes up about 11 percent of its area. Terrain is gentle and nearly level, being mostly the wet feature

Dog River Pipeline Replacement | Environmental Assessment
39
known as Brooks Meadow. Brooks Meadow Creek flows perennially into Dog River at about RM 5.4 just below Cooks Meadow. The Dog River pipeline crosses underneath Brooks Meadow Creek several
hundred yards upstream from its confluence with Dog River. This catchment is within the Barlow Ranger
District.
The Puppy Creek catchment is also tributary to the Lower catchment below the City’s pipeline intake, and makes up about 28 percent of its area. Terrain in this catchment is very steep and highly dissected, except
for the uppermost segment of the main stem of Puppy Creek which is broad and gently sloped. Puppy
Creek flows perennially into Dog River at RM 0.2. This catchment is within the Hood River Ranger
District.
The Upper Dog river catchment comprises 38 percent (3,085 acres) of the larger Dog River subwatershed.
Terrain of the upper catchment is somewhat uniform and broad, gently rounded, weakly dissected, and moderately sloped. It contains the mostly perennial main stem of Dog River between RM 5.5 at Cooks
Meadow and 10.7 at High Prairie. There are a number of named and unnamed perennial springs and wet
meadows, including Agnes Spring, Blue Bucket Spring, Dog River Spring, and High Prairie. At the lower
end of the catchment is located the City of the Dalles diversion and the intake for the Dog River Pipeline at RM 6.0. The Upper catchment is located within the bounds of the Barlow Ranger District, as well as
the designated Dalles Muncipal Watershed and is 100 percent federal ownership.
For context at a larger scale, the Dog River 12th-field subwatershed is the smallest of four that make up the larger East Fork Hood River watershed (72,337 acres), comprising only 11 percent of its contributing
area above the confluence with the Middle Fork Hood River. Each of the other three contributing
subwatersheds is more than twice the size of the Dog River subwatershed.
Dog River subwatershed is mostly forested and dominated with conifers. Past management has included
commercial activities such as road development and timber harvest. But there have not been any new road
construction or regulated timber harvest in over two decades. More recently, recreation use in the
subwatershed has increased considerably, particularly mountain biking on the Dog River, Surveyor’s
Ridge and Cooks Meadow trails.
The Watershed Condition Framework is a national forest-based, reconnaissance-level evaluation of
watershed condition. In 2016, the overall condition class rating for the Dog River 12th-field subwatershed was, “Functioning At Risk”. A number of indicators that rated in the “fair” condition category contributed
to this overall rating, including: listed as “impaired” (for iron) on DEQ’s 303(d) list, altered hydrologic
regime, and forest insect and disease issues.

Dog River Pipeline Replacement | Environmental Assessment
40
Figure 4. Dog River Pipeline Project Subwatersheds and Catchments.

Dog River Pipeline Replacement | Environmental Assessment
41
South Fork Mill Creek
South Fork Mill Creek subwatershed comprises about 18,240 acres. The highest elevation is about 5,050
feet on Mill Creek Buttes to about 740 feet at the confluence with North Fork Mill creek approximately 7
miles downstream from the National Forest Boundary. The long-axis of the subwatershed is oriented primarily southwest to northeast, being a little more than 16 miles long and 3 miles wide at the widest.
The South Fork Mill Creek flows northeast from its headwaters in the Mill Creek Buttes area to its
confluence with the North Fork Mill Creek to form Mill Creek, a direct tributary to the Columbia River. The South Fork Mill Creek subwatershed can be subdivided into two nested catchments: the Lower
catchment and the Upper catchment. Average precipitation in this subwatershed has historically ranged
between about 60 inches annually at the higher elevations in the Upper catchment, to 17 inches at the
lowest elevations to the east in the Lower catchment (Figure 4).
The Lower South Fork catchment below Crow Creek dam comprises 55 percent (10,112 acres) of the
subwatershed. The terrain is a long, steep sided, dissected corridor canyon. The subwatershed contains the
perennial main stem of South Fork Mill creek between RM 0 and 11.4. There are no perennial tributaries to the stream in the Lower catchment. Mapped springs include Saddle and Schoolmarm. Between RM 8.4
and 11.4 the stream flows through non-federal in-holdings. The Forest boundary is at RM 11.4, all
ownership in the subwatershed below that is non-federal. About 65 percent of the Lower catchment is non-Federal ownership, including a large tract of private industrial forest lands. The Wicks water
treatment plant that supplies the City of The Dalles with municipal water is located about a mile and a
half above the confluence with the North Fork of Mill creek. About a mile and a half above that is Indian
Hollow, where there is a waterfall that is a barrier to fish passage.
The Upper South Fork catchment above Crow Creek dam comprises 45 percent (8,128 acres) of the
subwatershed. Terrain is mountainous, variably dissected, and moderately steep to steep, being dominated
by Mill Creek Buttes. The subwatershed contains the perennial main stem South Fork Mill between RM 11.4 and 15.9. Alder Creek is a perennial tributary to perennial Crow Creek, which flows into Crow
Creek Reservoir about a half-mile northwest of the inflow of South Fork Mill Creek. Outflow from the
Dog River pipeline deposits into a tributary to the South Fork Mill at about RM 15.7. Mapped perennial springs include Shellrock and Stroud, which are tributary to Crow Creek and South Fork Mill Creek
respectively. About 93 percent of the Upper Catchment is in Federal ownership, and is entirely on the
Barlow Ranger District.
For context at a larger scale, the South Fork Mill River subwatershed comprises 65 percent of the larger North Fork – South Fork Mill 12th-field, 27,938-acre subwatershed. Both the North Fork and South Fork
of Mill Creek merge to form one of nine subwatersheds that make up the larger Mid-Columbia/Mill Creek
10th-field watershed.
The South Fork Mill subwatershed is mostly forested and dominated with conifers, except for the eastern
third which is comprised of a drier ecotype of scrub-oak and juniper. Past management has included
commercial activities such as road development and timber harvest. There has not been any new road
construction in the subwatershed in many years. Since 2005 there has been a notable amount of vegetation management in the subwatershed, particularly on Federal lands, where the City of The Dalles
and the Forest Service have mutually endorsed the thinning of dense forest to reduce fuels and minimize
the risk of the municipal watershed being subjected to the effects of high-severity wildfire. Salvage of fire-killed timber has also occurred on privately owned industrial forestlands after the 2013 Government
Flats fire.
The Watershed Condition Framework overall condition class rating for the North Fork – South Fork Mill 12th-field subwatershed in 2016 was, “Functioning At Risk”. A number of indicators that rated in the
“fair” condition category contributed to this overall rating, including: altered hydrologic regime, some
unstable stream banks, low abundance of in-stream woody debris, loss of cover by recent wildfire, and
forest insect and disease issues.

Dog River Pipeline Replacement | Environmental Assessment
42
The Dalles Municipal Watershed
The Dalles municipal Watershed (DMW; Figure 5) is an approximately 24,000 acre designated
management unit and source water protection area. Lands within the DMW encompass the upper catchment of Dog River above the pipeline intake, the pipeline where it is routed around Dog River Butte,
Brooks Meadow, and the entire South Fork of Mill creek extending down to the Wicks water treatment
Plant located eight miles downstream of the Crow Creek dam. Water diverted and transferred from the
upper catchment of Dog River to the South Fork Mill creek, the waters of South Fork Mill Creek itself, Crow Creek, Alder Creek, and contributing waters from springs flow into Crow Creek Reservoir. The
reservoir allows for controlled release down the South Fork of Mill creek to the Wicks water treatment
plant. The earthen Crow Creek dam was constructed in 1967.
Because much of the municipal water supply originates from Forest Service System lands, a cooperative
agreement was signed between the United States Department of Agriculture and the City of The Dalles in
1912 for the purpose of conserving and protecting it within a specified area that includes both Federal and non-federal ownership. The intent of the 1912 Agreement was formalized again in 1972 as per Forest
Service Manual 2542 with a Memorandum of Understanding (MOU) between the City of The Dalles and
the Mt. Hood NF to maintain and protect the quality and quantity of water originating from National
Forest System lands for municipal use. It included management directions and a ten-year management plan for both Federal and City owned lands. As per the MOU, the DMW remains closed to public entry
except for a set number of walk-in hunters during selected fall big-game seasons. Roads are closed to all
except for administrative use.
Due to the high value beneficial use of Dog River (drinking water), the intent of the 1972 MOU was
carried forth into the Mt Hood National Forest (MHNF) Land and Resource Management Plan (LRMP)
of 1990 according to Forest Service direction (FSM 2542, 2007), and National Forest System lands were
designated further as a Special Emphasis Watershed, with management standards and guidelines.
Then in 1994, when the Northwest Forest Plan was adopted, all of the DMW and portions of neighboring
watersheds were included into the Mill/Fivemile/Eightmile Tier 1 Key Watershed management allocation,
which on Federal lands is intended to maintain and protect watersheds that contribute to anadromous fish habitat. The upper catchment of Dog River was included in the Tier 1 designation because of the pipeline
which transfers water to South Fork of Mill Creek and eventually Mill Creek where there is listed
steelhead habitat.
In January of 1996 the City requested that the Forest Service reclassify the municipal watershed from a
Tier 1 Key Watershed to a Tier 2 because of concerns about administrative barriers that could potentially
arise if any future development or enhancements to their infrastructure were to be proposed. But the
watershed analysis conducted for Mill Creek in 2000 determined that with either designation, standards and guidelines would be applied to a proposed activity to ensure consistency with the Northwest Forest
Plan and the Key Watershed allocation. Likewise, exceptions could preclude application of standards and
guidelines under either the Tier 1 or Tier 2 Key Watershed designation if they contradict existing law or
regulation (MHNF 2000b).
Management of natural and cultural resources on Forest Service System lands within the DMW is
administered by the Forest Service, whom collaborates with the City of The Dalles as per the MOU. Operations of the City’s facilities located on National Forest System lands, such as the Dog River pipeline
and Crow Creek Reservoir, are authorized via Special Use Permit, also administered by the Forest
Service.
However, the use and management of the water that originates in the DMW for municipal purposes is administered by agencies of the State of Oregon. Water rights in the name of the City and municipal use
in the DMW fall under the jurisdiction of the Oregon Water Resources Department (OWRD). In Chapter
690 of the Oregon Administrative Rules, Division 504, the Hood Basin Program, sub-section (1)(a), Dog

Dog River Pipeline Replacement | Environmental Assessment
43
River above its point of diversion is classified exclusively for municipal use (OAR 2019). The quality of the water that is used as a designated drinking water supply in the DMW falls under the jurisdiction of the
Oregon Department of Environmental Quality (ODEQ). In response to requirements of OWRD and
ODEQ, the City of The Dalles prepared a master development plan in 2006 (CTD 2006)for the
management of their municipal water supply, which addressed principally their drinking water system. In 2014, the City also prepared a Water Conservation Management Plan (CTD 2014), which was required by
OWRD as a condition of being a municipal water supplier.
In 2013 the Government Flats wildfire burned across about one-third of the Municipal Watershed, mostly
in the lower catchment. About 100 acres were on Federal lands, the remainder were on non-federal lands.
3.3.1.1 Stream Network and Channel Condition
Dog River
There are approximately 28 total miles of stream channel mapped within the Dog River subwatershed.
About 63 percent (17.5 miles) are characterized as flowing perennially. The total length of the main channel of Dog River is about 10.7 miles long. About 86 percent of that total length flows perennial in
most years. The other 14 percent flows intermittently, and includes two short sub-reaches that amount to
about 1.5 miles in length. They include the uppermost mile, where streamflow tends to dry up mid-
summer to mid-fall. The other is immediately downstream from the pipeline diversion, which dries up for about a half-mile when the total flow in the river is diverted, typically from early July until late October.
Just below this sub-reach, flow usually surfaces again in Dog River where it flows through Cooks
Meadow.
An August 2000 Stream Survey (MHNF 2000a) differentiates Dog River into four unique stream reaches
extending from its mouth to its headwaters (Figure 5). Reach 1 extends about 1.8 miles up from the
mouth of Dog River, and Reach 2 extends further upstream to near FSR 44. These two lower reaches
make up the main channel in the lower catchment of Dog River below the pipeline intake. Their gradient
is generally steep, averaging about 9 percent (Table 3).
Most of Reach 1 and all of Reach 2 are very confined in a narrow v-shaped valley with steep canyon
walls. The lowest segment of Reach 1 near the mouth is moderately confined as it issues from the
upstream canyon into the East Fork Hood River valley. Floodplain features in the upstream canyon are generally narrow, alternating, and sometimes absent on steep sections of the channel. The bankfull width
of Reach 1 averaged about 18.2 feet, whereas Reach 2 upstream was a bit narrower averaging about 16.7
feet. A channel spanning, 60-foot waterfall is located in reach 2 at about RM 2.6.
Reaches 3 and 4 occupy the Upper Catchment of Dog River between FSR 44 and the headwaters at High
Prairie. These two upper reaches make up the main channel of the upper catchment. The gradient of
Reach 3 is shallow, averaging about 3 percent, while the gradient of Reach 4 is steep averaging 10 percent. Reach 3 is moderately confined in a gentle, trough-like valley form that transitions upstream in
Reach 4 into a moderately confined mountain ravine. Floodplain features in Reach 3 are common, defined
and in places connected to small wet meadow features, and in Reach 4 they are more narrow with split channels or nonexistent. Bankfull width in Reach 3 averaged about 13.5 feet, and narrowed notably in
Reach 4 to about 9.3 feet.
In Reaches 1 and 2 there were 9 tributaries that were contributing flow to Dog River when surveyed in
late July. It was estimated by surveyors that they were contributing as much as 25 percent of the stream flow at the time of the survey. Two of these were the perennial streams of Brooks Meadow and Puppy
Creek. The other seven were springs or seeps issuing from near or upslope of the left bank, and the
intermittent Ward Creek.

Dog River Pipeline Replacement | Environmental Assessment
44
There were 24 tributaries observed in Reaches 3 and 4. All of them were contributing flow to Dog River when observed in late July. Surveyors estimated they contributed the majority of the stream flow
observed at that time. Three of the tributaries were unnamed streams fed by mapped springs. Most of the
remaining tributaries were unmapped springs or seeps issuing from near or upslope of the right bank.
Reaches 1 and 2 are step-pool channel types (Rosgen “A” channel types), dominated by pools. The lower reach had 36 total pools, and Reach 2 had 42. There were 10 primary pools observed in Reach 1, and 13
observed in Reach 2. The depth of the primary pools in both reaches was measured to be greater than 2
feet during summer low flows of July.
Reach 3 is a pool-riffle channel type, and Reach 4 is more of a cascade chute (Rosgen “B” and “A”
channel types respectively). There were 61 total pools in Reach 3, but only two were considered to be
primary as most were pocket pools. Reach 4 had a total of 67 pools but all were small pocket pools, none of them were concluded to be primary. The majority of the hydraulic controls in the stream consisted of
cobble-sized substrate (79%). A combination of wood and substrate controls made up 11 percent of the
total pools and wood controls were 10 percent of the total pools. Woody debris was the primary hydraulic
control creating pools in both Reaches 3 and 4.

Dog River Pipeline Replacement | Environmental Assessment
45
Figure 5. Dog River Diversion Pipeline Project Surveyed Stream Reaches in the Affected Area.

Dog River Pipeline Replacement | Environmental Assessment
46
The pool frequencies observed in all four reaches were below standards listed in the LRMP and by NMFS as indicators of properly functioning channel processes. Given however, the small size of this stream and
channel type, the formation of deep pools would not be expected because the stream power and discharge
to scour deeper and mobilize larger sizes and quantities of substrate is inherently low and infrequent.
Table 3. Select Channel Characteristics of the Dog River Subwatershed.
Reach Channel
Type
Confinement Avg.
Gradi
ent
(%)
Avg.
Bankfull
Width
(ft.)
Number of
Perennial
Tributaries,
Springs, or
Seeps
Dominant
Substrate
Total
Pools
Primary
Pools
1 step-pool very confined 7 18.2 1 cobble and
coarse
gravel
36 10
2 step-pool very confined 11 16.7 8 bedrock
and gravel
42 13
3 pool-riffle moderately
confined
3 13.5 8 coarse
gravel
61 2
4 cascade confined 10 9.3 16 small
cobble
67 0
Source: MHNF 2000a
Substrate in Reach 1 was dominated by small cobbles and coarse gravel, while Reach 2 was primarily
bedrock and coarse gravel. Sampling estimated that fine sediment amounted to 8 and 14 percent
respectively of the total substrate. Substrate in Reach 3 was dominated by coarse gravel, and Reach 4 was dominated by small cobbles. Estimated fine sediment that was sampled amounted to 12 and 6 percent
respectively of the total substrate.
There were 23 side channels identified in all four reaches, with an average depth of 0.8 feet, an average
length of 97 feet, and an average width of 5 feet. Most were observed in Reach 4.
Data from the 2000 stream survey of Dog River indicated that the overall abundance and density of in-
stream large woody debris in all reaches of Dog River was low to moderate (Table 4). Small wood
comprised 52 percent of the total wood counted in the stream channel at the time of the survey. Some of the small wood was a component of debris jams, but the majority of it was found as individual pieces.
The density of medium and large pieces of in-stream wood did not meet the LRMP standards for woody
debris density in any reach. It did however, meet the NMFS woody debris density standards for all
reaches.

Dog River Pipeline Replacement | Environmental Assessment
47
Table 4. Number of in-channel woody debris and woody debris density (total of both medium and large size classes) observed in the 2000 Dog River stream survey.
Source: MHNF 2000a
There were 103 debris jams counted during the survey of Dog River. Twenty-four percent of the total
wood inventoried was in these jams. Of the wood in debris jams, 47 percent was in the small size
category, 31 percent in the medium size class, and 22 percent in the large size class.
Since the 2000 survey, there have been additional inputs of in-stream woody debris. Large woody debris recruitment along all reaches of Dog River is good to excellent, with the exception of an upper segment of
Reach 1 where a former clear cut had encroached on the riparian zone. There is also an abundance of
downed wood within the inner and outer riparian zones on all reaches of Dog River. This material is not typically inventoried during stream surveys. Only in-stream wood was tallied. Overall, it is believed that
the abundance of woody debris throughout the system is mostly sufficient to provide structure and
function, and that it continues to naturally accumulate unabated like it has for many decades.
Table 5. Number of in-channel woody debris and where it was located either as isolated pieces (single) or in debris jams observed in the 2000 Dog River stream survey.
Reach # of Debris
Jams
Total Pieces of Woody Debris
Small Medium Large
Single Debris
Jam
Single Debris
Jam
Single Debris
Jam
1 16 52 19 30 10 56 22
2 15 95 24 40 7 44 11
3 22 199 27 108 15 40 7
4 50 99 54 70 49 26 17
Source: MHNF 2000a
There are three crossings where Dog River is diverted under a road. The first is where Highway 35
crosses over Dog River at RM 0.1. At this crossing the river flows perennially through a 60-foot long, double cement box culvert. The second crossing is at RM 5.5 marking the transition between Reach 2 and
3 where the river flows perennially under FS road 44 through 146-foot long, 36-inch diameter corrugated
metal culvert. The third is up in the headwaters at the base of High Prairie, where the river is a small intermittent stream that flows under FS road 4420 through a 40-foot long, 18-inch diameter, corrugated
metal culvert.
There are two other notable crossings in the subwatershed. One is where the channel of Brooks Meadow
Creek flows perennially through a 36-inch diameter, 60-foot corrugated metal culvert under FS road 17. The other is downstream where Brooks Meadow Creek flows across the top of the 12-foot wide gravel
service road that parallels the pipeline. The channel at this crossing has been heavily impacted, and flow
is sometimes hindered, ponding in wheel ruts before passing across and back into the creek.
Channel types in the two primary tributaries of Dog River (Puppy Creek and Brooks Meadow Creek) are
very different. Neither have been formally surveyed. Puppy Creek is mostly very confined and
dominantly a very steep gradient. Most of the channel segments are step-pool sequences. There are an
Reach Number of Pieces
In-Channel
Density per Mile Density per Mile
Standards
Small Medium Large Total Medium Large Total LRMP NMFS
1 71 40 78 189 16.7 26.7 43.4 106 20
2 119 47 55 221 18.6 21.7 40.3 106 20
3 226 123 47 396 39.2 15 54.2 106 20
4 153 119 43 315 64.8 23.4 88.2 106 20

Dog River Pipeline Replacement | Environmental Assessment
48
estimated 16.9 miles of total channel length in Puppy Creek, of which 46 percent (7.7 miles) are perennial including several first order tributaries. The uppermost reaches of Puppy Creek however, are different,
being moderately confined, with much less of a channel gradient. Here the stream is small, and mostly
flows intermittently.
In contrast, Brooks Meadow Creek originates and flows perennially through an unconfined wet meadow with a low stream gradient. It is a short stream with about 1.9 miles of channel length. Below the
meadow, the channel becomes steeper and moderately confined until it flows through a small forested
wetland and then into Dog River.
South Fork Mill Creek
There are approximately 70.2 total miles of stream channel mapped in the South Fork Mill Creek
subwatershed above the Wicks municipal treatment plant. About 35 percent (24.6) of those total miles are characterized as flowing perennial. The total length of the main channel of South Fork Mill Creek is
nearly 16.5 miles long. About 99 percent of that total length flows perennial. A small perennial spring at
RM 15.9 delivers to the headwater channel. The larger-year around contribution to the South Fork of Mill Creek however, is the inflow from the Dog River pipeline, which flows into a headwater tributary channel
before entering into the main stem at RM 15.7. Crow Creek Reservoir truncates the main channel between
the lower and upper catchments of the South Fork of Mill Creek.
A stream survey of the segments of the South Fork of Mill Creek that flow through Federal lands was
conducted in August of 2011. It differentiated the creek into three distinct reaches (Figure 5). Reach 1
begins at the Forest Boundary and extends upstream to Crow Creek Reservoir. It makes up the lower catchment of the South Fork of Mill Creek. The gradient is moderately steep, averaging overall about 4
percent (Table 6). It is very confined by steep-sided ridges that form a narrow canyon. Bankfull width of
Reach 1 averaged about 23.2 feet. It was characterized as having many long fast segments with some
undercut and unstable banks.
In the upper segment of Reach 1, the channel begins at the outflow at the base of Crow Creek dam. There
is leakage at the base of the dam, where several small braids taper off downstream before intersecting
with the main channel. The valley here is wider and less confined with less of a gradient, and there are some well-developed floodplain features that interconnect with several forested wetlands. A single 120-
foot long, 9-foot wide side channel was observed in one of the forested wetlands. The spillway for Crow
Creek Reservoir dumps into the base of an intermittent tributary coming off the hillside and flows into
South Fork Mill approximately a quarter-mile below the dam.
About another mile further downstream, the gradient begins to increase and the valley becomes more
confined. Most floodplain features become less developed and are more narrow and alternating, except
for several small forested wetlands. The downstream terminus of Reach 1 ends at the Forest boundary at RM 11.4. Forest Service crews did not survey downstream of the boundary, but the gradient continues to
increase and the canyon narrows as the channel becomes very confined for the next 4 miles until the 60-
foot high, channel spanning Mill Creek falls at a chasm feature labeled on maps as Indian Hollow.
Reaches 2 and 3 identified in the survey make up the main channel in the upper catchment above Crow
Creek Reservoir. The gradient of Reach 2 is moderately steep, but it increases upstream into Reach 3
where the main channel becomes steep in the upper mountain ravine in Mill Creek Buttes. Both reaches are confined in mountainous terrain. Floodplain features are small and usually alternating. Bankfull width
in Reach 2 is about 9.7 feet, narrowing down to 3 feet in Reach 3. There were some unstable stream banks
observed in Reach 2, and it was characterized as having many long fast segments.
There were no perennial tributary channels observed in Reach 1, and none are known to be present in the reaches downstream from the Forest boundary. There are several mapped springs high on the slopes
above these reaches, but their flow is intermittent and goes subsurface. Evidence of annual scour and

Dog River Pipeline Replacement | Environmental Assessment
49
deposition in the steep hillside channels below the springs was discontinuous or limited. There were 3 perennial tributaries in the upper catchment that were observed during the August survey. Two originated
from springs, one mapped (Stroud Springs) and one unmapped. These two tributaries were estimated to
contribute as much as 15 percent of the flow when surveyed. The third and uppermost one was the
tributary that receives flow from the pipeline, and was noted as contributing nearly all of the flow at its
confluence with the main channel.
Table 6. Select Channel Characteristics of the South Fork Mill Creek Subwatershed.
Reach Channel
Type
Confinement Avg.
Gradient
(%)
Avg.
Bankfull
Width
(ft.)
Number of
Perennial
Tributaries,
Springs, or
Seeps
Dominant
Substrate
Total
Pools
Primary
Pools
1 pool-riffle very confined 4 23.2 1 coarse
gravel
23 4
2 pool-riffle confined 3 9.7 1 sand and
coarse
gravel
27 2
3 pool-riffle confined 6 3.0 1 medium and coarse
gravel
0 0
Source: MHNF 2011
Reach 1 is a pool-riffle channel type, and Reaches 2 and 3 are primarily pool-riffle channel types, although Reach 3 also resembled a somewhat step-pool type. Pools were not abundant in any of the
reaches, and wholly lacking in Reach 3. The abundance of primary pools was very low throughout all the
reaches, and the average residual pool depth in Reach 1 and 2 was 1.7 and 1.4 feet respectively. Overall,
in-channel pool abundance was well below standards used for indicating naturally functioning channel forming processes. Wood created the majority of the pools. Entrenchment ratios decreased measurably
between the survey in 1999 and 2011, indicating that some incision has occurred (MHNF 1999, 2011).
Owing to the altered flow regime in the South Fork of Mill Creek as a result of the pipeline and reservoir operations, and the management of the municipal water supply, the channel forming processes that factor
into pool creation have been altered. The supplemental streamflow from the pipeline has likely increased
channel and stream bank scour in Reach 2, potentially increasing the channel gradient (MHNF 1999). Similarly, spillway releases after reservoir fill is achieved along with the heavy drawdown during summer
peak use, has altered the flow regime of South Fork Mill Creek below Crow Creek dam. Channel forming
processes such as bedload movement and scour no longer favor the formation and development of pools.
Data from the 2011 stream survey of South Fork Mill Creek indicated that the overall abundance and density of large woody debris in all reaches was low. The stream survey found that the majority of woody
debris in the system is small and the density of LWD in all reaches was below LRMP or NMFS standards
for woody debris density (Table 7).

Dog River Pipeline Replacement | Environmental Assessment
50
Table 7. Existing Number of In-channel Woody Debris and Woody Debris Density (total of both medium and large size classes) observed in the 2011 South Fork Mill Creek stream survey.
Source: MHNF 2011
Most of the woody debris observed was in jams (Table 8). Reach 1 had 32 debris jams, all of which was
small sized wood. Reach 2 had 90 jams, 97 percent was small sized wood. In Reach 3 there were 7 debris
jams counted, all of which were also small sized wood. All of the debris jams observed are thought to have formed after stream clean-out practices were mostly halted in the early 1980s. Prior to that, stream
clean-out practices that removed woody debris from the channel are likely to have contributed to the low
abundance observed during the stream survey.
Table 8. Existing number of in-channel woody debris and where it was located either as isolated pieces (single) or in debris jams.
Reach # of Debris
Jams
Total Pieces of Woody Debris
Small Medium Large
Single Debris
Jam
Single Debris
Jam
Single Debris
Jam
1 32 45 32 17 0 3 0
2 90 47 87 34 3 32 0
3 7 3 7 2 0 1 0
Source: MHNF 2011
Since the 2011 survey, there have been additional inputs of in-stream woody debris. Large woody debris
recruitment along all the reaches of the Upper catchment are good to excellent in the inner riparian zones. There is also an abundance of downed wood within the inner and outer riparian zones that was not
inventoried for the stream survey. Overall, it is believed that the abundance of woody debris throughout
the system is mostly sufficient to provide structure and function, and that it continues to naturally
accumulate unabated like it has for many decades.
In the Lower catchment, potential recruitment is good along the main corridor of South Fork Mill Creek,
but fair to poor in the outer riparian zones where the 1967 School Marm fire and the 2013 Government
Flats fire burned over the forest. Further down, the vegetation type changes to more scrub-oak and the
main riparian corridor is comprised of willows and cottonwood.
Data from the stream survey indicated that very coarse gravel was the dominant substrate size in Reach 1.
The amount of fine sediment that was sampled was considered to be low, possibly as a result of Crow Creek Reservoir capturing and retaining it. In Reach 2, substrate was dominated by coarse gravel and
small cobbles, but a notable amount of sand was collected in samples. In Reach 3 medium gravel was the
dominant size and type of substrate. Overall, the amount of fine sediment detected was low.
There are 5 road crossings in the subwatershed over perennial streams, of which four are on Federal
lands. One is the road segment that crosses across the top of Crow Creek dam. The second and third ones
are where FS road 1721 crosses over the South Fork Mill and Alder Creeks. The fourth is a bridge where
FS road 1720-190 crosses the South Fork Mill Creek about ¾ mile below the dam. The fifth crossing is a low-water ford downstream from the dam about 3.5 miles on non-Federal land. Because the watershed is
closed to the public, none of these crossings are used very often.
Reach
Number of Pieces
In-Channel Density per Mile
Density per Mile
Standards
Small Medium Large Total Medium Large Total LRMP NMFS
1 77 17 3 97 5.8 1.0 6.8 106 20
2 134 37 32 203 8.7 7.5 16.2 106 20
3 10 2 1 13 5.4 2.7 8.1 106 20

Dog River Pipeline Replacement | Environmental Assessment
51
Crow Creek was the major perennial tributary to the South Fork of Mill Creek. It no longer ties directly into the South Fork of Mill, but instead flows directly into Crow Creek reservoir, which flooded their
confluence after the dam was constructed. Alder Creek is the main contributing perennial channel to
Crow Creek. Neither has been formally surveyed intensively. Channel types are considered to be
dominantly pool-rifle sequences that are confined and exhibit moderate to steep gradients. Both are considered to be small channels, but the total stream length in their contributing area is estimated to be
about 20 miles, of which about half is deemed to be perennial in most years. There are several mapped
and unmapped springs that contribute flow. One is Shellrock Springs that feeds into Crow Creek from up
near the ridgetop, the other feeds into Alder Creek near its headwaters up on Mill Creek Buttes.
3.3.1.2 Water Quantity and Streamflow
Dog River
Hydrologic data for Dog River is limited. While there is a fair amount of streamflow data at the City’s
pipeline diversion at RM 6.0, there are very few records of flow data at the mouth. This implies that the effects that have been occurring to the amount of flow in the lower reaches of Dog River as a result of
diversion may not be readily discernible. For this analysis, data that were used to characterize stream flow
in upper Dog River were recorded just upstream of the pipeline diversion at RM 6.0 in the years 1960 to
1971 and 2011 to 2019. Data collected at the mouth of Dog River at RM 0.0 are less robust, and include a single year between the fall of 2016 and 2017, several isolated spot measurements, and data collected in
the spring and early summer of 2019.
Mean annual natural discharge (no diverted water) of Dog River has been estimated to be about 19.7 cfs. Monthly estimates by OWRD of natural streamflow at the mouth indicate that Dog River is fed by a
combination of seasonal snowmelt, groundwater, and precipitation. Winter precipitation and spring
snowmelt are likely to generate the greatest average streamflow, while base flows would typically occur
in late summer to mid-fall (Table 9).
Table 9. Estimated mean monthly natural streamflow (cfs) of Dog River at the mouth (50% exceedance level).
Jan Feb Mar Apr May Jun Jul Aug Sept Oct Nov Dec
27.9 32.5 32.2 33.6 27.0 21.5 12 7.8 5.9 5.5 9.0 21.0
Source: OWRD 2015
According to USGS data from the gage site above the diversion between 1960 and 1971, peak flows are
driven by precipitation events or snowmelt, or a combination of both, and have historically occurred
between November and June. Average monthly streamflows at the diversion ranged from 2.5 cfs in the
fall (October) to 23 cfs in the spring (June). The majority of the summer baseflows are maintained by
groundwater from perennial springs and small wet meadows from August through October (Figure 6).
Most of the streamflow volume comes from snowmelt, typically between May and July. Approximately 40 percent of the peak discharge events measured above the diversion occurred in the winter (November
through February) and at least three were likely the result of a rain-on-snow episode. Approximately 60
percent of the peak flow records above the diversion occurred in the spring (May through June). Peak
daily mean discharge magnitude exceeded 40 cfs during four of the eleven years with a maximum discharge of 72 cfs recorded on May 30th, 1969. These data indicate that Dog River has often undergone
two distinct peak flow periods.

Dog River Pipeline Replacement | Environmental Assessment
52
Figure 6. Mean daily discharge (cfs) for Dog River from water years 1961 to 1967 at RM 6.0, upstream of the Dog River pipeline diversion
Source: USGS 2016
Data collected by the CTWS near the mouth of Dog River between the fall of 2016 and fall of 2017
indicate a similar trend occurred for that period (Figure 7). The data show that there was a small peak
period in the winter of that year, followed by a notably larger peak flow period in late spring. As would be
expected, base flow periods between the two sites was also similar. Although the data collected by CTWS only represents a single year, the hydrograph generated from it suggests that streamflow trends of the
Upper and Lower catchments are similar. It is apparent that there is perennial flow at the mouth of Dog
River, even in low flow periods when 100 percent of the streamflow is being diverted to the pipeline
upstream at RM 6.0.
0.00
5.00
10.00
15.00
20.00
25.00
30.00
35.00
40.00
10/1 11/1 12/1 1/1 2/1 3/1 4/1 5/1 6/1 7/1 8/1 9/1
Month
Summary Hydrograph Dog River above Diversion
Dog River (cfs)

Dog River Pipeline Replacement | Environmental Assessment
53
Figure 7. Mean daily discharge (cfs) for Dog River near RM 0, just upstream of the confluence with East Fork Hood River.
Credit: modified screenshot of graph, CTWS 2017. Note – streamflow in a small side channel at the monitoring site
was not fully captured in the data.
The contributing area of the Upper catchment of Dog River, which produces flow available for diversion
to the pipeline, comprises 38 percent of the entire subwatershed. Sixty-two percent of the subwatershed is
comprised of the Lower catchment, which generates enough of its own flow so that lower Dog River is
perennial for nearly its entire length.
When the entire flow of the stream is being diverted to the pipeline in the summer and early fall, the river
at the mouth flows perennially. During this low flow period, the only reach that is partially dewatered is an eighth of a mile segment just below the pipeline diversion. Instream flows are restored not far below
by springs and hyporheic flow. Despite the diversion of all the summer low flow that is produced from
the Upper catchment of Dog River, there has been as much as 40 percent or more gain of available daily
flow recorded at the mouth that has been delivered from the Lower catchment (Table 10). But overall,
full capture of flows during the summer and late fall above the diversion, has reduced mean monthly base
flows at the mouth of Dog River by an estimated 30 to 40 percent.

Dog River Pipeline Replacement | Environmental Assessment
54
Table 10. Comparison of Discharge (cfs) in Dog River Measured Above and Below the Diversion on Select Dates.
Location July 20,
1972
July 27,
2000
July 27, 2016 May 1,
2019
RM 6.0 Above Diversion
(fully diverted flow)
6.21 4.02 3.23 14.915
RM 0.0 Near Mouth NA 8.33 5.34 30.15
RM 3.0 in Reach 2 9.01
Sources: 1HRWG 1999, 2MHF 2000b stream survey, 3CTD 2017b, 4CTWS 2017, 5OWRD 2019
Stream temperature monitoring may serve as a proxy that corroborates data indicating perennial flow in lower Dog River. The MHNF monitored summertime stream temperatures in the lower reach from 1994
through 2002, and again from 2016 through present. In each of these years sufficient flow was available
for monitoring stream temperature just upstream from the confluence with East Fork Hood River.
Perennial tributary waters that feed lower Dog River include Puppy Creek, Brooks Meadow Creek, in-channel springs and groundwater, and wet meadows. There are few to no empirical flow data for these
sources. There have been several spot flow measurements taken at the mouth of Puppy Creek, including
one noted on July 20, 1972 that was 0.1 cfs (HRWG 1999).
Based on estimates derived from the online USGS StreamStats tool (USGS 2017), which can be used for
approximating peak and base flow contributions for ungaged streams, Puppy Creek can potentially
contribute on average nearly 4 percent of the base flow to lower Dog River. The same tool estimated that Brooks Meadow Creek can potentially contribute nearly 12 percent of the base. Peak flow projections for
the two tributaries suggest a reverse trend, and that Puppy Creek can potentially contribute on average
about 19 percent of peak flow in lower Dog River, while Brooks Meadow Creek’s contribution would
only average about 4 percent of the peak. The approximations highlight the seasonality of inputs of each
of these catchments to Dog River below the diversion.
Groundwater contributions to Dog River are also believed to be substantial. The proportion of
contribution is not known to have been quantified. But there are many mapped springs in the general area, and prominent ones in the Upper catchment that are known to be perennial. There also have been
observed quite a few unmapped streamside springs (MHNF 2011).
Of the 33 tributaries observed in the July 2000 stream survey, 27 were near-bank springs or seeps. Seven
of them were observed in the Lower Catchment. All 33 of the tributaries observed had enough flow on July 27th to be able to measure their water temperature. These are notable year-round contributions to the
water supply of both upper and lower Dog River, and suggest that re-charge of the local aquifer is stored
for a period of time before steadily being released as surface flow. In lower Dog River, observers estimated that groundwater contributions amounted to as much as 25 percent of the streamflow when
surveyed, and in upper Dog River they concluded that groundwater was the major source of surface flow.
The effects of forest management on water quantity and streamflow in the subwatershed are considered to be slight. Two measures often used as indices of the potential effect of forest management on streamflow
include road density and the extent of watershed impact areas. Both measures were calculated in 2015 to
be below thresholds of concern (Table 11). Since then, there has been no new road construction, and only
a minor extent of past thinning. Effects of forest management on stream flow are considered to be
negligible. There remain however, 5 crossings over perennial streams where segments of road
periodically divert intercepted runoff toward streams, a portion of which likely enters the stream during

Dog River Pipeline Replacement | Environmental Assessment
55
high runoff events. But the amount of contributing area is a very small percentage. Overall, the Dog River subwatershed is considered to be hydrologically recovered from any past long-lasting effects to
streamflow from forest management.
Table 11. Road Density and Watershed Impact Areas in the Dog River Subwatershed in 2015.
Indicator 2015 Threshold of Concern
Road Density (mi/sq mi) 2.4 3.0
Watershed Impact Area (%) 2 25
Source: MHNF 2015
It has been estimated that under natural flow conditions, Dog River contributed about 6 percent of the mean annual discharge of the East Fork Hood River (HRWG 1999), above the confluence with Middle
Fork Hood River). Since diversion, Dog River is now estimated to contribute approximately 4 percent of
the mean annual flow to the East Fork Hood River.
South Fork Mill Creek
Several data sets are available for characterizing streamflow in the South Fork of Mill Creek. Continuous
daily streamflow measurements were collected from October 1960 through September 1975 by the USGS, and from September 2011 to May 2019 by the City of The Dalles at a gage site 0.2 miles upstream
from Wicks Reservoir at about RM 1.0 (USGS 2019, CTD 2019). Another set of data was collected
between October 1962 and September 1970 from an old gage site at the outlet of the Dog River pipeline
where it discharges into a headwater tributary to South Fork Mill (SWCD 2003).
South Fork Mill Creek streamflows are fed primarily by snowmelt, groundwater, and seasonal
precipitation. A hydrograph of the natural flow of South Fork Mill was generated by subtracting the flow
input from Dog River (Figure 8). This time period is uniquely important because it provides insight into
the flow regime of SF Mill Creek prior to the construction of Crow Creek Dam.
Natural mean daily streamflows ranged from 1.3 cfs in June to a little more than 45 cfs in April. The
majority of annual streamflow volume for South Fork Mill Creek occurred during March and April. This also is the time when peak flows were most likely to occur due to seasonal snowmelt, although
precipitation and rain-on-snow events could lead to peak flows occurring at other times of the year. The
highest peak flow recorded was 700 cfs and occurred in 1964, and was a rain-on-snow event. Another rain-on-snow in 1996 is believed to have been greater, but all gaging sites were substantially overtopped
so that stage could not be recorded. Base flows were lowest during May to late June, and were probably
maintained by the headwater springs high up in the subwatershed. Later, natural base flows rebounded in
July and August, presumably as a result of periodic convective thunderstorms.
Compared to the Dog River hydrograph, the majority of the annual peak runoff from South Fork Mill
inherently occurred a month sooner. This is likely due to the lower elevation of the South Fork Mill
subwatershed, and its position further east of the Cascade crest. Most of the stream flow is generated from the Upper catchment, which comprises 45 percent of the subwatershed and receives the greatest amount
of annual precipitation. The Lower catchment generates far less streamflow despite its greater size due to
the sharp decline in annual precipitation and elevation eastward. There are no perennial streams in the lower catchment besides South Fork Mill Creek. Nearly all of the perennial flow is produced from the
Upper Catchment.

Dog River Pipeline Replacement | Environmental Assessment
56
Figure 8. Estimated mean daily discharge (cfs) for South Fork Mill Creek for water years 1960 to 1967 upstream of Wicks Treatment Plant, naturalized by subtracting inputs of diverted water from Dog River.
Source: USGS 2019
Streamflow characteristics changed when the Dog River ditch began diverting water to South Fork Mill
Creek in the 1860s, and again after the construction of Crow Creek dam in 1967 (Figure 9). Generally,
management of the inflow and storage has resulted in an overall increase in base and mean annual
streamflow. Also, the Special Use Permit that the City has with the Forest Service to operate the reservoir stipulates that at least 2 cfs be released below the dam year-around to provide for aesthetics and aquatic
organisms (USFS 1967). Streamflow still varies seasonally as it would under natural conditions, but now
there is more quantity. For example, a single observation during a stream survey on August 17th, 2011 measured discharge to be 8.6 cfs at the Forest boundary at about RM 8.4 below Crow Creek dam (MHNF
2011). Estimates of natural streamflow for that time of year would be expected to be below 5 cfs.
0.00
5.00
10.00
15.00
20.00
25.00
30.00
35.00
40.00
45.00
50.00
10/1 11/1 12/1 1/1 2/1 3/1 4/1 5/1 6/1 7/1 8/1 9/1
Month
South Fork Mill Creek Hydrograph (naturalized)
SF Mill Creek (cfs)

Dog River Pipeline Replacement | Environmental Assessment
57
Figure 9. Hydrograph of South Fork Mill Creek above the Wicks water treatment plant intake.
Source: CTD 2019
Perennial tributaries in the Upper catchment that flow into the South Fork Mill Creek include Crow and
Alder Creeks. Based on estimates derived from the online USGS StreamStats tool (USGS 2017), which
can be used for approximating peak and base flow contributions for un-gaged streams, Crow Creek can potentially contribute on average about one-third of both the peak and base flow of the South Fork Mill
above the reservoir. Estimates for Alder Creek indicate that it could potentially contribute about 40
percent of Crow Creek’s peak flow and about 13 percent of its base flow. Together, their contributing area produces a notable perennial supply of streamflow from the Upper catchment that flows into Crow
Creek Reservoir.
Several springs located high in the Upper catchment are groundwater sources that contribute perennial
streamflow to two unnamed streams. One issues from Stroud spring and is tributary to South Fork Mill Creek, the other originates from Shellrock Springs and is tributary to Crow Creek. There is also a
headwater spring that originates in the highest reach of the South Fork Mill Creek, marking the upper
limit of its perennial flow. The amount of groundwater supply in the subwatershed has not been quantified, but their year-round contribution to the water supply of the South Fork Mill Creek suggest that
they are similar to the many springs in the area, where recharge of the local aquifer is typically stored for
a period of time before steadily being released as surface flow.
There have been about 3,829 (21%) acres of forest management activities over the last 15 years on
Federal lands in and around the South Fork subwatershed. Treatments consisted of thinning, brushing,
pruning, underburning, and pile burning to reduce hazardous fuels. They were intended to minimize the
potential risks and impacts of wildfire. Best Management Practices were incorporated into treatment design so that watershed effects would be minimized. Existing effects of forest management on water
quantity and streamflow in the subwatershed are considered to be slight.
Two measures often used as indices of the potential effect of forest management on streamflow include road density and the extent of watershed impact areas. Both measures were calculated in 2012 to be below
0.00
10.00
20.00
30.00
40.00
50.00
60.00
70.00
1-Oct 1-Nov 1-Dec 1-Jan 1-Feb 1-Mar 1-Apr 1-May 1-Jun 1-Jul 1-Aug 1-Sep
Flo
w in
CFS
South Fork Mill Creek Hydrograph 2012-2019 compared to Naturalized Hydrograph of the 1960's
SF Mill Ck ab Wicks (raw) SF Mill Creek (1960's Naturalized)

Dog River Pipeline Replacement | Environmental Assessment
58
thresholds of concern (Table 12). Since then, there has been no new road construction, some roads have
been closed and decommissioned, and the extent of ongoing fuel treatments (i.e. pile burning) is minor.
Effects of forest management on stream flow are considered to be negligible.
There remain however, 4 crossings over perennial streams where segments of road periodically divert intercepted runoff toward streams, a portion of which likely enters the stream during high runoff events.
But the amount of contributing area is a very small percentage. Overall, the South Fork Mill Creek
subwatershed is considered to have minimal hydrologic disturbance from forest management, and any
long-lasting effects to streamflow are considered to be negligible.
Table 12. Road Density and Watershed Impact Areas in the South Fork Mill Creek Subwatershed in 2012.
Indicator 2012 Threshold of Concern
Road Density (mi/sq mi) 2.6 3.0
Watershed Impact Area (%) 13* 25
Source: MHNF 2012, MHF 2000b *Prior to the Government Flats fire of 2013.
In 2013, the Government Flats fire burned over about 65 percent of the Lower catchment, the majority on
non-federal lands. As a result, there was a reduction in the extent of connected forested canopy, which increased the percentage of watershed impact area in the lower subwatershed. There are no perennial
tributaries to South Fork Mill Creek in this burned over area; therefore, increases to runoff would only
have been realized following a precipitation or runoff event of sufficient magnitude to produce streamflow in intermittent streams and ephemeral draws. But for the first several years, there was likely
an increase in peak flows after periodic heavy precipitation or runoff.
Immediately following the fire, actions were taken to re-establish vegetation by emergency aerial seeding
on much of the non-federal acreage. Then, years of natural revegetation and manual reforestation followed and continued to establish. Now, an effective ground cover has mostly recovered. This, and the
fact that the burned over area was mostly below the snow zone, in a band of lower annual precipitation,
and partially where oak is the dominant vegetation type, peak flow trends are believed to have returned to
a pre-fire flow regime and no longer elevated.
It has been estimated that under natural flow conditions, South Fork Mill Creek contributed about 69
percent of the mean annual discharge of Mill Creek (OWRD 2019a). Since diversion for the Wicks water
treatment plant, the estimated contribution is approximately 40 percent of Mill Creek’s mean annual flow
(at 50% exceedance probability).
Dog River Diversion and Crow Creek Reservoir
Nearly 100 percent of the consumptive water use allocated for Dog River and South Fork Mill Creek is
for municipal uses by the City of the Dalles (OWRD 2019a). Water is managed for this purpose by using
the Dog River diversion and pipeline, and the Crow Creek reservoir facilities. Operations of the Dog River pipeline and Crow Creek reservoir can be generalized as capturing both naturalized streamflow
from upper South Fork Mill Creek and the diverted flow from upper Dog River. Maximum storage (full-
pool) in the reservoir is usually achieved by early- to mid-February. Once full, diversion of flow from upper Dog River is reduced so as to minimize spill out of the reservoir while maintaining its level at full-
pool. Water operations are commonly adjusted throughout the year to try and balance the capture of
natural available flow with the quantity of diversion needed to maximize storage, minimize spill, and manage release so that demand is met efficiently. Efficiently managing capture and release is also

Dog River Pipeline Replacement | Environmental Assessment
59
intended to avoid over-drafting of the reservoir, so that re-filling it during the winter for the following
year would be attainable.
The Dog River diversion headworks at RM 6.0 consists of a channel-spanning concrete control structure
and spillway, along with a screw gate oriented perpendicular to the direction of flow into the pipeline
inlet. The screw gate, which is manually operated, determines the size of the opening for streamflow to enter the pipeline. Water is transferred from Dog River 3.4 miles through the pipeline at a grade of about
1 percent until it discharges into a headwater tributary that flows into the South Fork of Mill Creek at RM
15.7. The outflow then flows downstream for approximately another 5 miles where it enters Crow Creek
reservoir.
Crow Creek reservoir is supplied by two inlet streams, South Fork Mill Creek and Crow Creek, and their
contributing area. The reservoir is a 28-acre earthen structure impoundment. At a pool elevation of nearly 2,600 feet, it has a maximum depth of 65 feet and a storage capacity of about 267 million gallons (~820
AF, MHF 2000b, Mill Ck WA).
A spillway around the north side of the dam overtops when the pool level rises above 2,564.5 feet
elevation. There are no controls for the spillway, and no operational capability to manage its height. When water levels rise above its inlet, it simply diverts the flow gravitationally around the dam through
an excavated channel and back into an intermittent tributary to the South Fork Mill Creek about 1,200 feet
downstream.
Outflow (release) from the base of the dam is controlled manually using a screw valve that is activated
from the top of the dam. It provides the operational capability to manage the rate of drawdown and
release from the reservoir that discharges as outflow into the South Fork of Mill Creek, eventually to flow
approximately 8 miles downstream to the diversion for the Wicks water treatment plant at about RM 1.0.
The timing and amount of diverted flow from upper Dog River is based generally on the City’s demand,
storage capacity, and abundance or scarcity of supply. On average, Dog River contributes about 58 percent of the City’s total surface water contribution. Diversion to South Fork Mill Creek in the early summer averages about 7.0 cfs, and about 2.5 cfs during late summer. In most years, the headworks at the
pipeline inlet are operated to increase diverted flow in the late fall and early winter to re-fill Crow Creek
reservoir, by early or mid-February if possible. Once full, the amount of diversion is manually reduced to
a maintenance flow of about 2-3 cfs until mid- to late-May (Figure 10). Then the rate of diversion is
increased to capture the entire amount of upper Dog River’s baseflow from July through September and
early October (see Table 13).

Dog River Pipeline Replacement | Environmental Assessment
60
Figure 10. Mean daily discharge (cfs) summary of an average water year that is diverted into the City of The Dalles pipeline during 2012 through 2018 compared to the mean daily discharge of Dog River above the diversion.
Source: CTD 2018
Table 13. Estimated Percent of Mean daily discharge (cfs) of Dog River Diverted May through October.
May June July August September October
Percent of Dog
River diverted 52 99 100 100 100 99
Source: CTD 2018
The Dog River pipeline at capacity can potentially transfer a maximum flow of 12.3 cfs. Log records
from the City of The Dalles indicate that since 2006, there were two occasions when the pipeline was
filled to capacity in the period between October and January, and two other times during the month of
May (pers. comm. Dave Anderson 2016).
• Jan 30, 2006: pipeline flow of 12.3 cfs for short duration (storm event, flow decreased from 12.3
to 2.5 cfs in less than 24 hours, and had only been flowing at 5.7 cfs on 12/29/2005),
• Dec 24, 2014: pipeline flow of 12.3 cfs for less than 1 week, re-filling Crow Creek reservoir
• May 2009 and 2010 pipeline flow of 12.3 cfs for about 1 week each to finish re-filling Crow
Creek reservoir
The pipeline has had many leaks along its length throughout its 100 plus years of use. Currently the only
quantification of water loss from the pipeline is a mathematical estimate based upon the volume of the
pipe at full capacity. It is estimated by the City that as much as 1.9 cfs may be leaking from the pipeline
when it is at full capacity. However, as has been noted prior, there have only been four instances since
0
2
4
6
8
10
12
14
16
18
10/1 11/1 12/1 1/1 2/1 3/1 4/1 5/1 6/1 7/1 8/1 9/1
CFS
Average Flow Summary
Diversion Flow Dog River Streamflow

Dog River Pipeline Replacement | Environmental Assessment
61
2006 when the Dog River pipeline was filled to maximum capacity, and the amount of estimated water
loss could have been that much.
Many repairs and patches to limit the leaks have been made over the years with a variety of methods and
assorted materials. The locations and severity of leaks have also varied. Moreover, a given leak may only
be present or visible during periods of elevated flow within the pipeline, when the range of pressure and velocity are near their highest. At lower flows some leaks may not be detectable, or become a slight
trickle. Although leaks of varying size have been observed over the pipeline’s lifespan at different times
and locations along its length, no comprehensive empirical data have been collected to reliably inventory
and characterize the quantity and flow paths of specific leaks.
In recent years there have been several endeavors to try and better understand and characterize the amount
of water loss from leaks, but they have not been entirely conclusive. Using instrumentation to measure and track inflow and outflow proved infeasible. The City performed a single dye test in early October of
2016 in an attempt to find evidence that would indicate if leakage from the pipeline was contributing any
detectable return flows to lower Dog River during critical low flow periods. The test did not uncover
evidence of immediate and detectable return flow (pers. Comm. Dave Anderson 2016a).
During the 2000 summer stream survey, there were not any seeps or springs observed that flowed into
lower Dog River from the right streambank (looking downstream) that would suggest that leaks were
independently contributing directly to surface flow. All of the near-bank seeps and springs that were
inventoried were on the left bank, on the west side of the stream.
Anecdotal observations in late summer of 2017 and again in mid-spring of 2019 provided some insight as
to how a leak may behave under different flow rates, and potential fate pathways. It was observed that larger leaks tended to create overland routes during temporary high flow, that then find their way to an
existing intermittent or perennial channel. One such leak observed in mid-spring created an overland flow
route a short distance to Brooks Meadow Creek. Late summer observations indicated that a couple of
larger leaks became trickles and were slowly infiltrating into the soil.
The amount and fate of pipeline leakage is not well known. There is likely a proportion of leakage that
cannot be accounted for. A proportion of it is likely returned slowly to the local aquifers in the area to be
stored and released steadily over time. During high flows, the larger leaks find overland flow paths to intermittent or perennial streams. Depending on the location of the leak some could return to Dog River,
while some could contribute to the South Fork of Mill Creek. Some water loss is likely depleted by
evapotranspiration, and some is probably stored in the soil profile. Given the geology of the area, there
could be a proportion that drains to deeper aquifers for long-term storage and release elsewhere.
In practice, the total amount of water loss from leakage factors into the amount of water withdrawn from
upper Dog River for municipal use. Loss from leakage decreases efficiency of use so that water is
withdrawn until the operational demand is met. In effect the amount withdrawn is the quantity needed to meet demand plus leakage. This is one of the reasons the City is proposing to replace their pipeline, as a
measure to reduce diversion needed to replace loss.
Water that is not diverted into the pipeline is considered bypass flow and contributes to the available flow downstream into lower Dog River. Usually only a portion of streamflow is diverted from upper Dog
River from November to June. During some months bypass flows may be greater than diverted flows.
Data show that the City of The Dalles diverts the maximum percentage of streamflow through the
pipeline during the summer and early fall; bypass flows are often zero in July through September.
Since there is natural variability in the amount of streamflow available in Dog River, evaluating bypass
flows as a percentage of the total available flow can help explain how much volume from the Upper
catchment passes downstream to lower Dog River. Figure 11 displays the percentage of total streamflow
that was not diverted, but rather flowed past the point of diversion and stayed in the main channel of Dog
River during the 2012 to 2018 period of record. The maximum amount of bypass flow can be expected to

Dog River Pipeline Replacement | Environmental Assessment
62
occur during late April and early May and has accounted for between 70 and 80 percent of the total
available flow from upper Dog River.
Figure 11. The amount of mean daily streamflow that bypassed the pipeline diversion down Dog River (undiverted flow), expressed as a percentage of total available streamflow for water years 2012 to 2018.
Source: MHNF 2018
Streamflow data are not available for the portion of South Fork Mill Creek above Crow Creek Reservoir.
Dam release and spillway flows associated with Crow Creek reservoir were provided by the City of The
Dalles from 2006 to 2015 (Table 14). These data provide insight into the management of Crow Creek
Reservoir, and can be used in conjunction with available diversion data, to estimate “naturalized”
reservoir inflow. The naturalized reservoir inflow represents the combined flow from Crow Creek, Alder Creek, and South Fork Mill Creek, not including the water delivered through the Dog River diversion.
The highest naturalized inflow between 2006 and 2015 was nearly 100 cfs, recorded on March 31st, 2011
(note: data are typically recorded once per week so some peak flows may have been missed).
Table 14. Estimated maximum naturalized inflow into Crow Creek Reservoir not including diverted flows from Dog River.
Maximum Naturalized Inflow to Crow Creek Reservoir
(cfs)
2006 2007 2008 2009 2010 2011 2012 2013 2014 2015
78.4 10.5 12.8 29.3 5.0 98.4 80.5 20.1 21.9 9.5
3-Feb 22-May 27-Jun 20-May 28-Apr 31-Mar 26-Apr 21-Mar 21-Feb 6-Jan
Release from the reservoir occurs year-round primarily for: 1) treatment to meet municipal demand, and
2) to provide at least 2.0 cfs to South Fork Mill Creek as stipulated by the reservoir Special Use Permit. Dam releases are commonly 6 cfs or higher. Releases that are 6 cfs or higher would be generated
naturally by South Fork Mill Creek approximately 50% of the time (USGS 2017). The quantity needed
0
0.1
0.2
0.3
0.4
0.5
0.6
0.7
0.8
0.9
10/1 11/1 12/1 1/1 2/1 3/1 4/1 5/1 6/1 7/1 8/1 9/1
Percent of water bypassing diversion (median of 7 years)
Percent of water bypassing diversion (median of 7 years)

Dog River Pipeline Replacement | Environmental Assessment
63
for release typically fluctuates on a seasonal trend, but may also occur weekly or daily. The greatest demand and drawdown usually occurs during the summer months when precipitation is low and air
temperature is high. As inflow into the reservoir begins to subside, drawdown begins to occur and the
water level of the reservoir drops. The City normally begins drawdown in early July and it is often
November before any refilling begins (Figure 12). Reliable late summer flows from these surface water sources, including available live flows and stored water releases, are currently estimated to be 5.4 cfs
(CTD 2014). Sometimes there are needs for special releases such as when one of the supplemental wells
is taken off-line.
Figure 12. Mean monthly fill and drawdown trends during the period 2005 to 2015.
When the level of the water in the reservoir is higher than the elevation of the spillway inlet, it will flow
out the spillway channel. Spill is greatest during the winter and spring, and usually occurs in response to
heavy precipitation or runoff (Figure 13). Spill can be greater than release during these occurrences, and
excess to municipal use. This flow is bypass to the intake at the Wicks water treatment plant, and
contributes to Mill Creek discharge. Spill typically does not occur during the early summer to late fall
months, when demand and drawdown are highest. If spill is occurring, then less is needed for release.
0.0
20.0
40.0
60.0
80.0
100.0
120.0
Oct Nov Dec Jan Feb Mar Apr May Jun Jul Aug Sep
Reservoir Fill and Drawdown
Mean Mthly Reservoir fill (cfs)
Mean Mthly Reservoir drawdown (cfs)

Dog River Pipeline Replacement | Environmental Assessment
64
Figure 13. Comparison of mean monthly spill and release during the period 2005 to 2015.
Source: CTD 2017c. Note: Spill is not recorded continuously, so missing data has been interpreted by the graphed
line.
Besides Crow Creek reservoir, the City has 5 additional drinking water storage facilities in town. They
store finished drinking water for the community. The use of surface water from South Fork Mill Creek is
supplemented by three City groundwater wells, which are used to augment and bolster total municipal supply, typically during peak demand in the summer months, or for emergencies. In the year 2012,
approximately 87 percent of municipal water supply came from the City’s surface water sources and 13
percent came from groundwater (CTD 2014).
The Wicks water treatment plant intake from South Fork Mill Creek diverts on averages about 5.0 cfs
annually, but it has a maximum capacity to treat up to about 8.7 cfs. The City’s average annual water use
was estimated in 2015 to be 4.7 cfs. Estimated average use per month ranged from 2.6 cfs in October to 8.5 cfs in June (BOR 2015). The City’s Water Master Plan of 2006 describes their municipal water
system, its operations, maintenance, projected needs, customer base, budget, etc.
The City also prepared a Water Management and Conservation Plan in 2014 that was required by OWRD
as a condition of their surface water rights. In that plan are projections for future growth and demand, and
plans for meeting them. It includes conservation measures to be implemented to improve efficiency of
water use and minimize losses.
Future projects addressed by the City’s 2006 Water System Master Plan include expansions of Crow
Creek Reservoir on Forest Service lands and the Wicks water treatment plant downstream, which are
anticipated to increase the reliable summer flows from the municipal watershed to 15.5 cfs, for a total increase of 6.8 cfs. To date, however, only preliminary plans have been drafted, and there has not been
any formal proposal submitted to the Forest Service from the City to proceed with the expansion of the
reservoir. More recently, the City has received a limited license from OWRD to explore the feasibility of
an Aquifer Storage and Recovery (ASR) system on their property. The permit allows for 16.7 cfs to be used for exploration of the ASR, using water from the Wicks treatment plant. If feasibility is proven, then
it is possible that the City would not need to pursue expanding Crow Creek Reservoir (pers. Comm. Dave
Anderson 2019).
Testing for ASR would not be reliant on replacement of the Dog River pipeline, and will begin whether or
not the Proposed Action proceeds. Water to be used for the ASR testing would be supplied by the surface
0.0
5.0
10.0
15.0
20.0
25.0
30.0
Oct Nov Dec Jan Feb Mar Apr May Jun Jul Aug Sep
CFS
Spill and Release
Spill
Release

Dog River Pipeline Replacement | Environmental Assessment
65
water rights in the municipal watershed, which include Dog River, South Fork Mill Creek, and Crow Creek reservoir as stipulated by the limited license. The water treatment plant’s average intake would be
expected to increase too, capitalizing on existing flow that has not been utilized for municipal use prior.
In the issuance of the City’s limited license, OWRD has estimated that existing surface flow and storage
is available for the City’s ASR project (OWRD 2018).
It is estimated that demand for ASR testing will be 244 million gallons per year (equates approximately to
1.03 cfs). The increase in demand to test the ASR is expected to be supplied from a proportion of the total
annual contribution of South Fork Mill Creek. There has been enough average available spill and runoff in winter and spring from the South Fork Mill Creek subwatershed, that when coupled with a percentage
of the storage in the reservoir, there would not be a need for additional water diverted from Dog River to
meet the increase in demand (Figure 14).
Figure 14. Comparison of the proportion of the different source water supply with current and projected ASR demand.
Source: CTD 2019a Note: different scale for S. Fk. Mill Creek on right-hand axis). Values above the solid black line
(i.e., WTP Raw Water Diversion) represent the volume of unused water currently available for ASR testing.
3.3.1.3 Water Quality
Dog River
The Oregon Department of Environmental Quality (ODEQ) designates beneficial uses for river basins in
the state for which water quality standards are established. Beneficial uses designated by ODEQ for the
Hood Basin, which the waters of Dog River contribute to, are numerous (Table 15). The beneficial uses
designated for Dog River are fish and aquatic life and public domestic water supply. In the lower catchment of the Dog River subwatershed, from the mouth up to about RM 5.5 the use is specifically
designated for trout and salmon habitat, and salmon and steelhead spawning between October 15 and May
15. In the upper catchment above RM 5.5 the designated beneficial use is specifically for the Dalles
Municipal Watershed and as core cold water habitat.

Dog River Pipeline Replacement | Environmental Assessment
66
Table 15. Beneficial Use Designations for the Hood Basin (includes Mill Creek) from ODEQ.
Beneficial Use Hood River Basin
Streams
Public domestic water supply* X
Private domestic water supply* X
Industrial water supply X
Irrigation X
Livestock watering X
Fish and aquatic life X
Wildlife and hunting X
Fishing X
Boating X
Water contact recreation X
Aesthetic quality X
Hydropower X
Commercial navigation and
transportation X
* With adequate pre-treatment (filtration and disinfection) and natural
quality to meet drinking water standards.
Source: Table adapted from ODEQ (ODEQ 2017b)
For the designated Dog River beneficial uses, only one water quality standard has been identified as impaired, and is included on the ODEQ’s 303(d) list of Category 5 waters in their 2012 Integrated
Report. Testing of water samples taken from Dog River detected that the amount of iron in the water exceeds the standard for that constituent. It is considered to be a non-point source contaminant because
the cause for its presence and the amounts detected are not known. In fact, iron is listed as a constituent of
impairment in the entire Hood River basin including the West Fork, Middle Fork, and East Fork. It has
been surmised that iron may be naturally occurring, and its presence could be due to the geologic formations that underlie the area (ODEQ 2017c). No other impairments are listed by ODEQ for Dog
River; no other point source or non-point source pollutants, contaminants, or water quality exceedances
have been identified.
Due to the presence and use by salmon and steelhead of the lowest 2.5 miles of Dog River, and because of
the temperature TMDL for the Middle Columbia - Hood River basin, monitoring of stream temperature
has been an ongoing effort by the MHNF. Temperature data collected above the pipeline diversion indicated that temperatures within upper Dog River are cold and vary seasonally from close to 0°C in the
winter (December to February) to approximately 13°C in late July (MHNF 1996, 2017). At the mouth of
Dog River, temperature monitoring between July and October of 2000 (MHNF 2000a) found that the 7-
day maximum temperature remained below 13°C, which is the ODFW standard for salmon and steelhead
spawning, during that time period (Figure 15).
A June 2017 technical memorandum from the CTWS described Dog River as potential cold-water thermal refuge for salmon species in the East Fork Hood River because of the groundwater inputs from
springs and wet meadows (CTWS 2017). Results from their stream temperature monitoring near the

Dog River Pipeline Replacement | Environmental Assessment
67
mouth between May 2016 and May 2017 are displayed in Figure 15. That data corroborates the 7-day
maximum temperature findings of the MHNF, and verifies further the cold water contribution of Dog
River to the East Fork Hood River, particularly during inherent low flow periods in late summer and early
fall.
Figure 15. Daily average temperature data for Dog River upstream of the confluence of the East Fork Hood River.
Source: CTWS 2017
Stream temperature monitoring was also conducted by the MHNF in Puppy Creek near its mouth during a
2001 stream survey. The seven-day maximum average temperature did not exceed 14.5°C, indicating its contribution of cold water to lower Dog River at RM 0.1. Further upstream at about RM 5.4, the inflow of
Brooks Meadow Creek is also thought to be a source of cold water. While long-term stream temperature
monitoring has not been conducted there, its high elevation (approximately 4,500 feet), groundwater
source, short stream length, effective shading, and moderate late-summer flow (estim. avg. 2 cfs) suggests it is likely another cold water source to Dog River (MHNF 2017). Dog River has been identified as a cold
water source for the East Fork Hood River. It is known to contribute cold water in the summer, including
when full diversion into the pipeline occurs upstream at RM 6.0.
Residual effects to riparian shading from past forest management are considered to be negligible in the
Dog River subwatershed. The solar radiation measurements taken during the 2000 stream survey
averaged overall about 32 percent, indicating that the majority of the length of Dog River had effective shade. Segments of reaches where shade was lacking included two older clearcut plantations along
approximately 0.4 miles of lower Dog River where riparian vegetation had been encroached upon during
the original harvest in the 1970s, and where several small patches of streamside blowdown occur in both
the lower and upper reaches.

Dog River Pipeline Replacement | Environmental Assessment
68
As indicated by the 2000 stream survey conducted by the MHNF, fine sediment does not appear to have been impacting the water quality of Dog River. Also, the ODEQ 303(d) list does not identify any
impairments for Dog River for turbidity or sediment. There are however, anthropogenic sources of fine
sediment in the subwatershed. The principle sources are where certain segments of road connect to the
channel network at specific perennial stream crossings. There are four perennial stream crossings where
the potential for fine sediment to enter the stream network is greatest.
The first is where Highway 35 crosses over Dog River at RM 0.1. Highway 35 is a major thoroughfare,
and is subject to year-round traffic that at times can be heavy, particularly during the winter ski season. Grime and grit from the highway can be washed into streams where it crosses over them. In wintertime
driving conditions are often slick, so it is common practice that the highway is sanded to enhance traction.
Sanding materials typically buildup along the roadside over the course of the season. Road crews make an effort to recover much of this roadside buildup, but a notable proportion of it cannot be recovered. At
stream crossings, such as the one over Dog River near its mouth, these sanding materials remain poised
where they can be washed into stream waters periodically when it rains.
Two of the other crossings are where FS road 44 crosses over Dog River and where FS road 17 crosses over Brooks Meadow Creek. Both are paved crossings where use is seasonal, sporadic, and relatively low.
The amount of road grit and fine sediment generated at these crossings that can enter stream water is
comparatively low.
The fourth crossing is where Brooks Meadow Creek flows across the top of the 12-foot wide gravel
service road that parallels the pipeline. The channel at this crossing has been heavily impacted, and flow
is sometimes hindered, ponding in wheel ruts before passing across and back into the creek. Although this road is used very little, water flows across it persistently. When not frozen, this site is always ponded and
muddy, it is a potential chronic source of fine sediment. But the area is small, and the stream velocity low,
so the amount of sediment that actually gets mobilized into the water column is relatively low too, except
when a vehicle or OHV occasionally runs through the 10 x 12 foot puddle.
South Fork Mill Creek
Beneficial uses designated by ODEQ for the Hood Basin, which the waters of South Fork Mill Creek
contribute to, are also numerous (Table 15). The beneficial uses designated expressly for South Fork Mill
Creek are entirely public domestic water supply, but also for fish and aquatic life below Crow Creek
Reservoir. In the lower catchment of the South Fork Mill subwatershed, from the mouth up to Crow
Creek Reservoir the designation is specifically for trout and salmon habitat, while only the reach segment between the mouth and the waterfall at about RM 2.5 is designated specifically for salmon and steelhead
spawning between October 15 and May 15. In the upper catchment above Crow Creek Reservoir, the
designated beneficial use for fish and aquatic life is specifically core cold water habitat.
For the designated beneficial uses for South Fork Mill Creek, there are no water quality standards
identified as impaired on the ODEQ’s 303(d) list of Category 5 waters in their 2012 Integrated Report.
The City of the Dalles performs regular water quality testing on the South Fork Mill Creek just upstream
of their municipal water treatment plant. Other than seasonal or storm variation in temperature, turbidity, pH, and hardness, their monitoring indicates that the quality of the stream water in the creek is very good.
Occasionally they detect high concentrations of coliform, believed to originate from wildlife fecal
contamination. In the past, they have also detected slightly elevated concentrations of phosphorus, possibly from accumulated sediments in the reservoir. However, the dilution provided by the inflow of
water from Dog River has abated any effect that could necessitate special treatment (MHNF 2000b).
Due to the temperature TMDL for the Middle Columbia - Hood River basin, monitoring of stream temperature has been a contributing effort by the MHNF to provide data to ODEQ. Stream temperature
data were monitored in South Fork Mill Creek at the USFS boundary between July 9, 1999 and
November 3, 1999 (MHNF 1999). The seven-day average maximum water temperatures did not exceed

Dog River Pipeline Replacement | Environmental Assessment
69
13oC, which is the ODFW standard for salmon and steelhead spawning, during that time (Figure 16).
Additional monitoring of summer stream temperatures at a different location just downstream of Crow
Creek Reservoir between 2009 and 2012 (Figure 17) indicated that the seven-day maximum temperature
commonly increased slightly above the 13oC standard from early August to early October.
Figure 16. Seven-day-minimum and maximum temperatures in South Fork Mill Creek (elevation of 2,000 feet) at the USFS boundary (MHNF 1999) 4 miles below Crow Creek Reservoir.
Explanation for the differences in maximum stream temperatures observed at the two different locations
is not readily discernible. The 1999 data were acquired from a site 250 feet lower in elevation and about 4 miles downstream from the other monitoring site. Additional data would be needed to reliably determine
the cause for the difference, but one factor that may be at the upper monitoring site is the reservoir.
Drawdown during peak use would have lowered reservoir levels, resulting in the potential increase of
temperature in the stored water that issued from the dam where the monitoring occurred. Regardless, stream temperature is not considered by ODEQ to be degrading water quality in the South Fork Mill
Creek.

Dog River Pipeline Replacement | Environmental Assessment
70
Figure 17. Summer average daily temperature for South Fork Mill Creek (elevation of 2,500 feet), just below Crow Creek Reservoir.
Source: MHNF 2017
Residual effects to riparian shading from past forest management are also considered to be negligible in
the South Fork Mill Creek subwatershed. Solar radiation measurements taken during the 2011 stream
survey averaged overall about 12 percent for the month of July, indicating that the majority of the length
of the surveyed reaches had effective shade. Impacts to riparian vegetation from the Government Flats fire in 2013 were not extensive nor long-lasting in the South Fork Mill Creek subwatershed, and regrowth
of streamside shade that was affected has mostly recovered.
As indicated by the 2011 stream survey conducted by the MHNF, fine sediment was not observed to be impacting the water quality of South Fork Mill Creek. The ODEQ 303(d) list also does not identify any
impairments for South Fork Mill Creek for turbidity or sediment. There are however, some anthropogenic
sources of fine sediment in the subwatershed. The primary sources on Forest Service lands are where certain segments of road connect to the channel network at specific perennial stream crossings, and
presumably where several segments of the lower reach exhibited some evidence of unstable stream banks.
Three of the crossings are associated with FS road 1721 where it crosses over Stroud Springs and the
South Fork of Mill Creek, and also at Alder Creek. The relative amount of sediment potentially delivered from roads to these crossings is considered to be low. First, there is very little traffic because it is within
the Municipal Watershed which is closed to public use. Also, all three crossings are upstream of Crow
Creek Reservoir, where road sediment would be expected to settle and accumulate. Lastly, the drainage structures on this road are in good condition, and have been purposefully constructed to minimize the
length of road connected to the stream network.
A fourth crossing is currently a bridge where FS road 1720-190 crosses the South Fork of Mill Creek
about ¾ of a mile below the dam. It has blown out due to storm flow events on several occasions (MHNF 2000b). It is also within the Municipal Watershed, and seldom used. There has not been a great deal of
sediment observed from the use of this road, but there probably had been for a short period at the time it
was blown out.

Dog River Pipeline Replacement | Environmental Assessment
71
Another crossing is a low-water ford about 3.5 miles downstream of the dam on non-Federal land. It is also seldom used, and it is not always passable. Periodically, it could get used during low flow periods
when it would be safe to cross over. When crossed by a motorized vehicle, it is likely that a measure of
sediment is stirred and mobilized. The duration of the disturbance would be brief, so conceivably the
amount of sediment generated would be minor and short-lived.
The 2011 stream survey of South Fork Mill Creek noted some evidence of unstable streambanks in the
lower reach not far upstream of the Forest boundary. It is presumed that they have developed as a result of
an altered hydrologic regime. During peak demand in late summer and early fall, the streamflow is greater than what it would have been before the dam was constructed. Now it is likely that the creek flows higher,
and so stream banks in certain places have undergone some adjustment and periodic erosion.
Sedimentation has likely increased periodically due to wildfires that have occurred in the subwatershed. In 2013, the Government Flats fire burned over about 65 percent of the Lower catchment of the South
Fork subwatershed, mostly on non-federal lands. As a result, there was a reduction in the extent of
effective ground cover for several years. For the first wet season following the fire, turbidity levels
detected by the Wicks water treatment plant were elevated, particularly after periodic rains. Ash had also been detected, and the plant had to modify measures to treat it. Fortunately, there were no large storms of
above normal peak intensity that year, so the increased turbidity and ash contaminants remained treatable,
and the treatment plant was able to remain online and in operation (pers. comm. Dave Anderson 2014).
Immediately following the fire, actions were taken to reestablish vegetation by emergency aerial seeding
on much of the non-federal acreage. Then, years of natural revegetation and manual reforestation
followed and continued to establish. Now, an effective ground cover has mostly recovered. This, and the fact that the burned over area was mostly below the snow zone and in a band of lower annual
precipitation, sedimentation trends are believed to have returned to a pre-fire regime and no longer
elevated.
3.3.1.4 Water Rights
Water rights are under the purview of the Oregon Water Resources Department (OWRD), the state authority that regulates and oversees their use. OWRD monitors the City of the Dalles to ensure
compliance with Oregon Water Law that pertains to municipal use. The City of The Dalles reports to
OWRD their usage, proposed upgrades or changes, and provides planning documents for review
consistent with the requirements of Oregon Revised Statutes (ORS) and Administrative Rules (OAR).
The Mt. Hood National Forest does not administer or enforce water rights. However, the Forest’s Special
Use Permits, which authorize the City to operate and maintain the Dog River pipeline and Crow Creek Reservoir facilities located on National Forest System lands, require that all permitted activities comply
with State laws. The Mt. Hood National Forest relies on the OWRD’s oversight of the City’s use of its
water rights for compliance with the applicable State water laws.
There are four certificated water rights on National Forest System lands in the Dog River and South Fork
of Mill Creek subwatersheds that are designated for municipal use (Table 16). They include: 1.) a decreed
surface water right that authorizes the use of up to 2 cfs from South Fork Mill Creek; 2.) a decreed surface water right that authorizes the use of all the water in Dog River; 3.) a storage right for 955 acre-feet (AF)
of water in Crow Creek Reservoir; and 4.) a secondary right for the use of the stored water in the
reservoir. The City also holds two permitted applications for the storage and use of up to an additional 2,100 AF of
water from South Fork Mill Creek, Dog River, and Crow Creek Reservoir.

Dog River Pipeline Replacement | Environmental Assessment
72
Table 16. Surface Water Rights in the Dog River and South Fork of Mill Creek subwatersheds that are designated for municipal use by the Oregon Water Resources Department.
City of The Dalles
Application Permit Certificate Claim, Decree, or
Transfer
Priority date
Type of Beneficial
Use
Authorized Rate or
Annual
Volume
Dog River
14954
Hood
River
decree 8/1/1870 Municipal
“All the
water in
stream at
point of
diversion”
South Fork
Mill Creek 5691
Mill Creek
decree 1862 Municipal 2 cfs
Crow
Creek
reservoir
S-43668 S-32479 60410
5/29/1967 Municipal 955 AF
Crow
Creek Reservoir
S-84050 S-53930 NA
1/21/1999 Municipal 2,100 AF
South Fork
Mill Creek,
Dog River
R-43667 R-4988 44917
5/29/1967 Storage for
Municipal 955 AF
South Fork
Mill Creek,
Dog River
R-84049 R-13105 NA
1/21/1999 Storage for
Municipal 2,100 AF
Source: OWRDb 2019 Note: Definitions: Permit – Applicant has been approved to develop a water source for its
designated beneficial use. Certificate – Applicant has “perfected” and developed the water right as per the
conditions of the permit. The water right has become certified to the holder. Decree – Court issued water right to a
holder.
Both of the certified, decreed municipal water rights that the City holds (cert #s 14954 and 5691) have
priority dates that precede all other water rights in the Dog River and South Fork Mill Creek
subwatersheds. Based on the principle of prior appropriation of Oregon’s water laws, they are senior to all other water rights with later priority dates. Moreover, because they are municipal rights, they are not
subject to standard forfeiture statutes for non-use (ORS 540.610), and are protected from future
appropriations that would impair the municipal water supply (ORS 538.410).
The City of The Dalles also holds a variety of long-standing groundwater rights. Nine wells provide a
total of about 22.3 cfs for municipal uses. All of the points of diversion and use are on City or county
lands, and are permitted or certified by the OWRD. There is also a water right permit (S-49653) for withdrawing 40 cfs from the Columbia River, but that has not been developed to date, and it appears
unlikely that it will be put into use soon because of the City’s uncertainty about its feasibility. None of
these sources fall within the purview of the Mt. Hood National Forest because they are not located on National Forest System lands.
The two permitted water rights (S-53930 and R-13105) authorize the City to increase the storage capacity of the Crow Creek Reservoir for municipal use. Both have priority dates from January of 1999. The
completion dates of both have been extended to 2021. But to date, the City has not proven up on either
permit, and they have yet to proceed with formalizing any plans for expansion. They are expected to file
for another extension so that they can maintain the rights, but it is uncertain when, or if they will move forward pending the feasibility of other storage options being explored. If they decide to proceed with

Dog River Pipeline Replacement | Environmental Assessment
73
storage expansion, then NEPA would have to be initiated because the action would partially be located on National Forest System Lands.
In October of 2018, OWRD issued a final order and limited license approving the City to conduct testing
for the feasibility of an Aquifer Storage and Recovery (ASR) system. ASR is the direct injection of surface water supplies into an aquifer for later recovery and use. This license allows the City to divert up
to 16.7 cfs using their certificated water rights for Dog River, the South Fork of Mill Creek, and Crow
Creek Reservoir for testing ASR. OWRD determined that at this rate, the proposed testing would not impair or be detrimental to the public interest. The license also stipulates that testing would produce
information to describe effects of the ASR to the water quality and quantity in the aquifer and nearby
wells and springs. The license would not expand the use under an existing water right (OWRD 2018).
There are two other surface water rights in the Dog River and South Fork Mill Creek subwatersheds
(Table 17). Both rights are held in-trust by OWRD on behalf of the Oregon Dept. of Fish and Wildlife
(ODFW) to provide stream flow for the migration, spawning, egg incubation, fry emergence, and juvenile rearing for Coho salmon, summer and winter steelhead, rainbow trout and cutthroat trout. The priority
date for both instream water rights is 1991.
The flow rates allocated to them apply to the reaches of each below the point of diversion for the Dog
River pipeline and Crow Creek dam. They do not apply to the reaches upstream of those points of
diversion. These rates were determined by OWRD so that any remaining water available for allocation as a water right in the watershed would be designated for the in-stream purpose, and is the remainder of the
estimated natural average flow not being used for other senior users. They are not defined in the
certificates to be minimum flow requirements. These two water rights do not guarantee actual flow
availability at those rates, but rather reflect the maximum allocation protected for the instream beneficial use by the water right. As a condition of the certificate, they do not have priority over human
consumption. They are considered by OWRD to be junior to the City of The Dalles municipal water
rights in Dog River and South Fork Mill Creek.
Table 17. In-stream surface water rights in the Dog River and South Fork Mill Creek subwatersheds and the maximum monthly allocation protected by OWRD for instream use.
Source Jan Feb Mar Apr May Jun Jul Aug Sep Oct Nov Dec
Dog River
below
diversion Certificate
IS76267A
12.0 12.0 12.0 20.0 20.0 20.0 12.0 7.01 6.05 7.79 14.7 12.0
S Fk Mill Creek below
dam
Certificate
IS72078A
7.0 7.0 10.0 17.0 17.0 7.8 4.8 5.4 6.1 4.8 5.5 7.0
Source: OWRD 2019b
In some instances, the Forest Service can lay claim to water rights on lands they administer. When the United States reserves public land for certain uses such as Indian reservations, military reservations,
national parks, national forests, or monuments, it also implicitly reserves sufficient water to satisfy the
purposes for which the reservations were created. Reservations made by either presidential executive order, or by an act of Congress, have implied reserved water rights. These are defined as federal reserved

Dog River Pipeline Replacement | Environmental Assessment
74
water rights. The date of priority of a federal reserved water right is the date the reservation was established (DOJ 2019).
In 1893, lands along each side of the crest of the Cascade mountain range were incorporated into, and
federally designated as the Cascade Range Forest Reserve. When the Cascade Range Forest Reserve was dismantled into smaller, individual national forests in the early 1900s, the Oregon National Forest was
officially established on July 1, 1908. It included lands containing what is now the Mount Hood National
Forest, and was renamed such in 1924 (MHNF 2019). Included in those lands was the then Bull Run Timberland Reserve, and the Dalles Municipal Watershed. The priority date for federal reserved water
rights on the Mt. Hood National Forest would relay back to the initial year of origin of the federal Forest
Reserve in 1893.
The priority dates for the City of The Dalles’ water rights for Dog River and the South Fork of Mill Creek
pre-date the establishment of the Mt. Hood National Forest. Accordingly, these rights have priority over
the federal reserved water rights on the Forest (OWRD 2002). Additionally, any claims by the Forest Service to such rights would be subject to the state’s adjudication process. To-date, the Forest Service has
not submitted any claims for federal reserved water rights in the Dog River and South Fork Mill
subwatersheds.
3.3.2 Effects Analysis
The hydrologic analysis was conducted to determine the effects to water quantity, water quality, channel
and riparian features, and water rights that could be expected as a consequence of no action; or as a result
of implementing the proposed action. The Proposed Action is the replacement of the existing pipeline with a new pipeline, allowing the City of The Dalles to utilize more efficiently the water being diverted
from Dog River. The existing 3.4 mile pipeline would be replaced with a 24-inch-diameter pipe. It would
be located parallel and next to the existing alignment as much as possible.
In addition to pipeline replacement, the project will repair and improve the diversion structure and install
fish screens and passage structure, install a new culvert under the access road crossing Brooks Meadows
Creek, and improve summer low flows by adding 0.5 cfs into Dog River below the point of diversion during August, September, and October. Implementation of the proposed action would include the use of
BMPs and PDCs identified to minimize effects to natural and cultural resources.
Methodology
Analysis of the effects to hydrologic resources discerns the cause and effect relationship of constructing
and then operating and maintaining the new diversion and pipeline. Key to the analysis of effects is the location and proximity of activities in relation to water resources, the extent and connectivity of
disturbances to the stream and riparian network, and any alterations in the amount and timing of diverted
streamflow. Potential effects that could result from each of the alternatives is addressed relative to the existing condition. Since the pipeline transfers water from one subwatershed to another, the effects to Dog
River and the South Fork of Mill Creek are considered.
Effects from construction activities would presumably occur until work is completed. Construction
activities to consider include excavation of the trench, staging and transport of equipment and materials, pipeline assembly, and back-fill. Effects due to operations and maintenance could be expected to occur as
long as the pipeline is in use. Future operations of the pipeline diversion could change. Demand is
expected to increase with a rise in future population. Effects from future climate change could necessitate that the City adaptively manage their water use in the face of a shifting available supply. Future changes
to operations are based on inferred projections.

Dog River Pipeline Replacement | Environmental Assessment
75
Much of the analysis relies on existing information. Hydrologic data were used for basic computations and quantitative comparisons, including for use in a modeled environment as input variables. Spatial and
topographic data were used in a GIS environment to evaluate proximal relations and links. Research and
academic studies were used to rationalize local application of conventional theory. Watershed and
landscape assessments that have been conducted for the area provided local observations and conditions
for context. Lastly, several key assumptions were used to constrain the hydrologic analysis.
Key assumption(s) applied to the analysis of hydrologic effects included:
• Dog River diversion operations would not change for either alternative for a minimum of at least 10
years, and would remain the same from November through July.
• For the Proposed Action, the City of The Dalles would contribute 0.5 cfs bypass flow down Dog
River below the point of diversion from August through October.
• The primary fill period for Crow Creek Reservoir would typically be early November to early- or
mid-February for both alternatives. Flow to the reservoir would usually be managed from mid-
February to late June to maintain pool elevation and supplement storage for meeting peak demand in
summer and early fall.
• Increasing the capacity of the Crow Creek Reservoir within the next 10 years is not foreseeable, and
may not occur at all depending on the outcome of ASR testing. Should a proposal from the City be
submitted to the Mt Hood Nat. Forest to increase the reservoir’s capacity, then NEPA would have to
be initiated.
• Testing for the City’s ASR project will not necessitate that additional flow be diverted from Dog River. There is already enough available flow and storage to suffice testing. The OWRD is the
authority that administers the City’s limited license to test the ASR and enforces the conditions
therein.
3.3.2.1 No Action Alternative
The No Action Alternative would continue the status quo. The pipeline and diversion structure would not
be replaced or upgraded. Operations of the existing Dog River diversion and pipeline would not change.
Water loss from leakage would continue unabated. A new culvert to route Brooks Meadow Creek under
the pipeline access road would not be constructed.
Water Quantity and Streamflow
Dog River
Under the No Action Alternative, the quantity of water diverted from upper Dog River and its tributaries would remain unchanged from current conditions. On average, Dog River would continue to provide for
about 58 percent of the City’s total surface water contribution. Diversion to South Fork Mill Creek in the
early summer would be expected to average about 7.0 cfs, and about 2.5 cfs during late summer. In most years, the headworks at the pipeline inlet would be operated to increase diverted flow in the late fall and
early winter to re-fill Crow Creek reservoir, by early or mid-February if possible. Once full, the amount of
diversion would be reduced manually to a maintenance flow of about 2-3 cfs until mid- to late-May
(Figure 18). Then the rate of diversion would be increased to capture the entire amount of upper Dog
River’s base flow from July through September and early October to meet peak demand.

Dog River Pipeline Replacement | Environmental Assessment
76
Figure 18. Mean daily discharge (cfs) summary of an average water year that was diverted into the City of The Dalles pipeline during 2012 through 2018 compared to the mean daily discharge of Dog River above the diversion
Source: CTD 2018
Effects to streamflow from pipeline diversion would continue to be greatest during the late summer and
early fall when flows are lowest, and 100 percent of upper Dog River is diverted into the pipeline (see Table 18). During this time, the lowest eighth of a mile segment of Reach 3 below the pipeline diversion
would become partially dewatered. Instream flows to this segment would be restored naturally just
downstream by springs, seeps, and hyporheic flow. Lower Dog River would remain a perennial stream
type (Figure 19).
Table 18. Estimated Percent of Mean daily discharge (cfs) of Upper Dog River Diverted May through October.
May June July August September October
Percent of Dog
River diverted 39 99 100 100 100 99
Source: CTD 2018
It is estimated that Puppy Creek would continue to potentially contribute on average nearly 4 percent of
the base flow to lower Dog River, and Brooks Meadow Creek could potentially contribute nearly 12
percent of its base (USGS 2017). Ground water contributions to lower Dog River would also continue to supplement base flows. The perennial sources of near-bank springs and seeps along the lower reaches
below the diversion would continue to provide unceasing flow during summer months.
0
2
4
6
8
10
12
14
16
18
10/1 11/1 12/1 1/1 2/1 3/1 4/1 5/1 6/1 7/1 8/1 9/1
CFS
Average Flow Summary
Diversion Flow Dog River Streamflow

Dog River Pipeline Replacement | Environmental Assessment
77
Figure 19. Instantaneous Discharge measured near the mouth of Dog River spring through late-summer of 2019
When the entire flow of upper Dog River is being diverted to the pipeline in the summer and early fall,
the river at the mouth would continue to flow perennially. Despite the diversion of all the summer low flow that’s produced from the Upper catchment, as much as 40 percent or more gain of available daily
flow could be expected at the mouth of Dog River (Table 19). But overall, full capture of flows during
the summer and late fall would continue to reduce natural mean monthly base flows at the mouth of Dog
River by an estimated 30 to 40 percent.
Table 19. Comparison of Discharge (cfs) in Dog River Measured Above and Below the Diversion on Select Dates.
Location July 20,
1972
July 27,
2000
July 27,
2016
May 1,
2019
RM 6.0 Above
Diversion
(fully diverted flow)
6.21 4.02 3.23 14.915
RM 0.0 Near Mouth NA 8.33 5.34 30.15
RM 3.0 in Reach 2 9.01
Sources: 1HRWG 1999, 2MHF 2000b stream survey, 3CTD 2017b, 4CTWS 2017, 5OWRD 2019
The effects of diversion on peak flows would continue to be greatest during the late fall and early winter
months when Crow Creek Reservoir is filling. Diversion will decrease the overall magnitude of mean daily peak flows in Dog River during that time. Data indicates it could be by as much as 70 percent in a
year when total fall/winter precipitation is below normal. The majority of peak runoff however, which
occurs in the spring, would not be expected to be attenuated nearly to that degree. This is because in most
0.00
5.00
10.00
15.00
20.00
25.00
30.00
35.00
5-Apr-19 25-Apr-19 15-May-19 4-Jun-19 24-Jun-19 14-Jul-19 3-Aug-19 23-Aug-19 12-Sep-19
cfs
Discharge at the mouth of Dog River
Discharge

Dog River Pipeline Replacement | Environmental Assessment
78
years, Crow Creek Reservoir would be filled by early to mid-February. Typically, the majority of the
spring freshet would not be diverted, and would pass downstream to lower Dog River (see Figure 20).
Figure 20. A comparison of average streamflow and diverted flow from 2011 through 2018 above the Dog River diversion to illustrate the amount of spring peak flows that would bypass to lower Dog River.
Source: CTD 2018
In lower Dog River, the attenuation of winter peak flows would be less of an effect than the upper river
because of the contributions from perennial and intermittent streams in the Lower catchment. Puppy
Creek for example would continue to potentially contribute on average about 19 percent of peak flow in
lower Dog River, while Brooks Meadow Creek’s contribution could average about 4 percent of the peak
(USGS 2017).
Annually, there would continue to be an amount of bypass streamflow available to lower Dog River. Only
a portion of streamflow would be diverted from upper Dog River from November to June. During some months bypass flows would likely be greater than diverted flows. Based on past records, the percentage of
total streamflow that would not be diverted, and flow past the point of diversion and stay in the main stem
of Dog River can be displayed as a percentage of total streamflow (Figure 21). The maximum amount of bypass flow would be expected to continue during late April and early May and would account for
between 70 and 80 percent of the total available flow from upper Dog River.
0.00
5.00
10.00
15.00
20.00
25.00
30.00
35.00
40.00
45.00
9/29/11 9/29/12 9/29/13 9/29/14 9/29/15 9/29/16 9/29/17 9/29/18
Average Streamflow Compared to Average Diverted Flow for the Period of Record 2011-2019
Average Daily Stream Flow(CFS)Average Daily DiversionFlow (CFS)

Dog River Pipeline Replacement | Environmental Assessment
79
Figure 21. The amount of mean daily streamflow that bypassed (undiverted flow) the pipeline diversion down Dog River, expressed as a percentage of total available streamflow for water years 2012 to 2018.
Source: MHNF 2018
Because the existing aging pipeline would not be replaced under the No Action alternative, it would continue to leak from a number of places. At full pipe capacity, leakage could be as much as 1.9 cfs. But
there have only been four instances since 2006 when the Dog River pipeline was filled to maximum
capacity, so that quantity of water loss would not be expected to occur very often. The location and
severity of leaks would likely continue to vary. Some leaks would only be present or visible during periods of elevated flow within the pipeline, when the range of pressure and velocity are near their
highest. At lower flows some leaks would not be detectable, or become a slight trickle.
The amount and fate of pipeline leakage would remain uncertain. It’s likely that a proportion of leakage could not be accounted for. A proportion of it would probably return slowly to the local aquifers to be
stored and released steadily over time. During peak runoff, the larger leaks would follow overland flow
routes to an existing intermittent or perennial channel. Depending on the location of the leak some could
return to Dog River, while some could contribute to the South Fork of Mill Creek. Some water loss would likely be depleted by evapotranspiration, and some would probably be stored in the soil profile. Given the
geology of the area, there could be a proportion that drains to deeper aquifers for long-term storage and
release elsewhere.
The amount of water loss from the leaking pipeline would be expected to continue, although repairs and
patches to limit known leaks could be made under the authority of the Special Use Permit. Repairing
leaks in water conveyance infrastructure has been a strategy identified in the City’s Water Management
and Conservation Plan (CTD 2014).
In practice, the total amount of water loss from leakage would continue to factor into the amount of water
withdrawn from upper Dog River. Loss from leakage would continue to decrease efficiency of use so that
water would be withdrawn to meet operational demand. The quantity of water diverted from upper Dog
River will continue to include the amount of leakage plus what’s needed to meet demand.
The effects of forest management on water quantity and streamflow in the subwatershed would continue
to be slight. Two measures often used as indices of the potential effect of forest management on
0
0.1
0.2
0.3
0.4
0.5
0.6
0.7
0.8
0.9
10/1 11/1 12/1 1/1 2/1 3/1 4/1 5/1 6/1 7/1 8/1 9/1
Percent of water bypassing diversion (median of 7 years)
Percent of water bypassing diversion (median of 7 years)

Dog River Pipeline Replacement | Environmental Assessment
80
streamflow include road density and the extent of watershed impact areas. Both measures were calculated
in 2015 to be below thresholds of concern (Table 20).
Since then, there has been no new road construction, and only a minor extent of past thinning. Effects of
forest management on stream flow would remain negligible. There would remain however, 5 crossings over perennial streams where segments of road would periodically divert intercepted runoff toward
streams, a portion of which would likely enter the stream during high runoff events. Under the No Action
alternative, the one crossing where the pipeline access road intersects with Brooks Meadow Creek would not be improved. Nonetheless, the amount of contributing area to those crossings would remain a very
small percentage overall. Hydrologic recovery from any past activities would continue to improve.
Table 20. Road Density and Watershed Impact Areas in the Dog River Subwatershed in 2015. No changes are expected in these indicators under the No Action alternative.
Indicator 2015 Threshold of Concern
Road Density (mi/sq mi) 2.4 3.0
Watershed Impact Area (%) 3 25
Source: MHNF 2015
It is estimated that Dog River would continue to contribute about 4 percent of the mean annual discharge
to the East Fork Hood River (HRWG 1999), above the confluence with Middle Fork Hood River. Diversion from Dog River would decrease its mean annual contribution to the East Fork Hood River by
an estimated 2 percent.
Despite the No Action alternative, the City would continue to move forward with testing of an ASR
system on their property under a limited license issued to them in 2018 by OWRD. Testing is not reliant on replacement of the pipeline. Water to be used for the ASR would be supplied by the surface water
rights in the municipal watershed, which include Dog River, South Fork Mill Creek, and Crow Creek
reservoir. In the issuance of the license OWRD estimated that existing surface flow and storage is available for the City’s ASR project (OWRD 2018). OWRD would be the authority that administers the
limited license agreement and enforces its terms and conditions.
At peak demand it is estimated that ASR testing would use approximately 1.03 cfs (244 million gallons per year). This increase in demand could be expected to be supplied from a proportion of the total annual
contribution of South Fork Mill Creek. There has been enough average runoff in winter and spring from
the South Fork Mill Creek subwatershed, that when coupled with a percentage of the storage in the
reservoir, there would not be a need for additional water diverted from Dog River to meet the increase in
demand for ASR in most years (CTD 2019a).
South Fork Mill Creek
Under the No Action alternative, the amount and timing of flow diverted from Dog River to South Fork
Mill Creek would continue to be managed to meet municipal demand. Operations of the Dog River pipeline and Crow Creek reservoir would capture both the naturalized streamflow from upper South Fork
Mill Creek, and the diverted flow from upper Dog River until maximum storage (full-pool) would be
achieved in mid- to late winter. Diverted flow would be dialed back after the reservoir becomes full so as to minimize spill while maintaining its surface elevation at full-pool. Water operations would be adjusted
through the year to try and balance the capture of available flow, the quantity of diversion, storage, spill,
and release with annual variation in demand.

Dog River Pipeline Replacement | Environmental Assessment
81
Total streamflow in SF Mill Creek would continue to be artificially inflated above natural conditions (Figure 22). Inflow from Dog River and storage release from the reservoir would continue to increase
base and mean annual streamflow. Streamflow would still vary seasonally as it would under natural
conditions, but there would continue to be more available flow overall.
Figure 22. Mean daily flow in South Fork Mill Creek above the Wicks water treatment plant intake exhibiting the estimated increase in streamflow above the natural flow regime.
Source: CTD 2019
On average, Dog River would continue to contribute about 58 percent of the City’s total surface water
contribution. Diversion to South Fork Mill Creek in the early summer would average about 7.0 cfs, and
about 2.5 cfs during late summer. In Reach 2 between the pipeline outlet and Crow Creek Reservoir this
contribution would amount to about 5 times more streamflow than the natural base flow. In the late fall and early winter, the amount of diverted flow would be increased to try and re-fill Crow Creek reservoir
by early or mid-February. Once full, the amount of diversion would be reduced to a maintenance flow of
about 2-3 cfs until mid- to late-May. Then the rate of diversion would be increased to capture the entire
amount of upper Dog River’s base flow from July through September and early October.
Dam releases and diverted flow from Dog River would continue to be managed to meet peak demand
during the summer months. Base flows just above the Wicks water treatment plant near the mouth of the South Fork Mill would remain elevated by more than double that of estimated natural discharge. Reliable
late summer flows from these surface water sources, including available live flows and stored water
releases, would remain an average estimate of 5.4 cfs (CTD 2014).
Release from the reservoir would occur year around primarily to meet municipal demand and provide at least 2.0 cfs to South Fork Mill Creek as stipulated by the reservoir Special Use Permit. Releases of 6 cfs
or higher would be common. The quantity needed for release typically fluctuates on a seasonal trend, but
may occur weekly or daily too. Inflow into the reservoir would begin to subside in summer, when drawdown of the reservoir would be expected to occur. Typically the City would begin drawdown in
early July and then begin refilling in November (Figure 23). Sometimes there would be a need for special
releases such as when one of the supplemental wells might be taken off-line.
0.00
10.00
20.00
30.00
40.00
50.00
60.00
70.00
1-Oct 1-Nov 1-Dec 1-Jan 1-Feb 1-Mar 1-Apr 1-May 1-Jun 1-Jul 1-Aug 1-Sep
Flo
w in
CFS
South Fork Mill Creek Hydrograph 2012-2019 compared to Naturalized Hydrograph of the 1960's
SF Mill Ck ab Wicks (raw) SF Mill Creek (1960's Naturalized)

Dog River Pipeline Replacement | Environmental Assessment
82
Figure 23. Mean monthly fill and drawdown trends during the period 2005 to 2015.
Source: CTD 2017c
Peak flows would continue to be attenuated to a degree below the Crow Creek dam as a result of storage
in the reservoir. Spill over the reservoir however, would still occur during early spring when full-pool is exceeded because diverted flow from Dog River and natural inflow from the Upper catchment will have
already filled the reservoir. Spill would continue to be greatest during the winter and spring in response to
heavy runoff and precipitation (Figure 24).
Figure 24. Comparison of mean monthly spill and release during the period 2005 to 2015 (CTD 2017c). Note: Spill is not recorded continuously, so missing data has been interpreted by the graphed line.
Source: CTD 2017c Note: Spill is not recorded continuously, so missing data has been interpreted by the graphed
line.
If spill occurs, then less would be needed for release. Spill would not be expected to occur during the
early summer to late fall months, when demand and drawdown is highest. Spill would usually be greater
than release during winter and spring, and excess to municipal use. Most of this would bypass the Wicks
treatment plant intake and flow downstream to Mill Creek, elevating its average natural peak discharge.
0.0
20.0
40.0
60.0
80.0
100.0
120.0
Oct Nov Dec Jan Feb Mar Apr May Jun Jul Aug Sep
Reservoir Fill and Drawdown
Mean Mthly Reservoir fill (cfs)
Mean Mthly Reservoir drawdown (cfs)
0.0
5.0
10.0
15.0
20.0
25.0
30.0
Oct Nov Dec Jan Feb Mar Apr May Jun Jul Aug Sep
CFS
Spill and Release
Spill
Release

Dog River Pipeline Replacement | Environmental Assessment
83
Testing for the City’s ASR system under their limited license with OWRD could be expected to utilize the spill that typically occurs during the winter and spring (Figure 25). Testing for the ASR would not be
reliant on replacement of the Dog River pipeline. The increase in demand to test the ASR would be
supplied from a proportion of the total annual contribution of South Fork Mill Creek. There has been
enough average available spill and runoff in winter and spring from the South Fork Mill Creek subwatershed, that when coupled with a percentage of the storage in the reservoir, there would be
available water sufficient for ASR testing (OWRD 2018). OWRD would be the authority that administers
the City’s limited license and enforces the terms and conditions in the agreement.
The water treatment plant’s average intake would be expected to increase during that time because only
finished water can be used for ASR testing. This would decrease the amount of winter and spring flow
that has typically bypassed the Wicks treatment plant intake and flowed to Mill Creek. This would lower the elevated average peak flow from South Fork Mill that would flow into Mill Creek by an estimated 6
percent.
Under natural flow conditions, South Fork Mill Creek is estimated to have contributed about 69 percent
of the mean annual discharge of Mill Creek. Average annual diversion for the Wicks water treatment plant would continue to operate to meet demand, which has traditionally reduced the annual contribution
to Mill Creek by an estimated 40 percent (OWRD 2019a). Demand for ASR testing could decrease the
mean annual contribution by about another 13 percent.
Figure 25. Comparison of the proportion of the different source water supply with current and projected ASR demand.
Source: CTD 2019a Note: different scale for S. Fk. Mill Creek on right-hand axis. Values above the solid black line (i.e., WTP Raw Water Diversion) represent the volume of unused water currently available for ASR testing.
The effects of forest management on water quantity and streamflow in the subwatershed would continue
to be slight. Two measures often used as indices of the potential effect of forest management on
streamflow include road density and the extent of watershed impact areas. Both measures were calculated
in 2012 to be below thresholds of concern (Table 21).

Dog River Pipeline Replacement | Environmental Assessment
84
Since then, there has not been any new road construction on Forest Service lands. Some roads have been closed and decommissioned. The extent of ongoing fuel treatments (i.e. pile burning) would be minor.
Effects of forest management on stream flow would not be expected to change under the No Action
alternative, and remain negligible.
There would remain the 4 crossings over perennial streams where segments of road could periodically divert intercepted runoff toward streams, a portion of which likely enters the stream during high runoff
events. But the amount of contributing area would be very small. Overall, the South Fork Mill Creek
subwatershed would be considered to have minimal hydrologic disturbance from roads, and any long-
lasting effects to streamflow would remain slight.
There have been about 3,829 (21%) acres of forest management activities over the last 15 years on
Federal lands in and around the South Fork subwatershed. Treatments consisted of thinning, brushing, pruning, underburning, and pile burning to reduce hazardous fuels. They were intended to minimize the
potential risks and impacts of wildfire. Best Management Practices were incorporated into treatment
design so that watershed effects would be minimized. Existing effects of these past forest management
activities, as well as past wildfire, on water quantity and streamflow in the subwatershed would remain
slight and continue to diminish.
Table 21. Road Density and Watershed Impact Areas in the South Fork Mill Creek Subwatershed in 2012. No changes are expected in these indicators under the No Action alternative.
Indicator 2012 Threshold of Concern
Road Density (mi/sq mi) 2.6 3.0
Watershed Impact Area (%) 13* 25
Source: MHNF 2012, MHF 2000b *Prior to the Government Flats fire of 2013.
Channel Conditions
For the No Action Alternative, channel characteristics and features would continue to be affected as a result of diverted streamflow from upper Dog River. The timing and magnitude of diverted flow would
continue to be managed to the status quo so that Crow Creek Reservoir would get filled by early
February. Diversion would then be reduced to a flow that maintains the level of the reservoir through the spring. Then diversion would be increased to capture all of the base flow during the summer and early
fall.
Dog River
In the Dog River subwatershed, channel forming processes would continue to be altered by the modified
flow regime. Winter and summer flows would continue to be affected most. Early and mid-winter average peak flows would be attenuated to a moderate degree. But most of the streamflow volume comes from the
spring snowmelt, so the majority of the spring peak flow would bypass the diversion. During June
through October, virtually all of the streamflow from upper Dog River would be diverted to the South
Fork Mill Creek.
For most of the length of Dog River, direct access to the channel would remain limited and human
perturbation other than water management would be low. The stream banks and main channel could be expected to remain primarily stable, and the sediment supply would not be expected to undergo an
aberrant change from previous trends. Substrate would continue to be dominated by gravels and cobbles.
The average amount of fine sediment observed through-out all reaches would likely remain low to
moderate on an area weighted basis.

Dog River Pipeline Replacement | Environmental Assessment
85
Changes to channel forming processes related to modified streamflow would continue to mostly affect Reaches 1, 2, and the lower segment of 3. Effects would be greatest in the lower segment of Reach 3
immediately below the diversion because it would continue to be partially dewatered for a half-mile
downstream to Cooks Meadow in the summer and early fall months. The overall reduction in average
annual flow and the absence of base flows in this reach would continue to be the cause for the decline of
pool depth and quality, a decrease of the width-to-depth ratio, and a reduced wetted perimeter.
Effects to the main channel in Reaches 1 and 2 that make up lower Dog River would continue to be low
to moderate, primarily due to the overall reduction of mean base flows that affect the average depths of residual pools (Table 22). The average depth of the primary pools in both reaches could continue to be
greater than 2 feet during summer low flows of July, even when 100 percent of the flow of upper Dog
River would be diverted. Perennial streamflow from Brooks Meadow and Puppy creeks, as well as the many near-bank springs and seeps would continue to contribute to base flows and alleviate the effects of
full diversion. But overall, it is estimated that summer and early fall pool depths at the mouth of Dog
River would remain on average about 2 to 3 inches shallower because of diversion during the base flow
period.
Pool frequencies in all four reaches would be expected to remain below the LRMP and NMFS standards
that are often suggested as indicators of properly functioning channel processes. The attenuation of
average peak winter flows resulting from diversion to fill Crow Creek Reservoir in the early- and mid-winter months would be a likely cause for lower pool frequencies below the diversion. The majority of
pools that were observed in Reach 3 and 4 however were pocket pools, suggesting the small size of Dog
River and its channel types, which have a low inherent potential for new deep pool formation because the stream power and discharge to scour deeper and mobilize larger quantities of bedload is low and
infrequent.
Table 22. Observations of Select Channel Characteristics of Dog River from the 2000 Stream Survey Compared to LRMP and NMFS Standards and Guidelines.
Reach Percent Fine
Sediment
Observed
LRMP
Standard for
Percent Fine
Sediment
Total Pools
per Mile
Primary
Pools
per Mile
LRMP
Standard
Primary
Pools per
Mile
NMFS
Standard
Primary
Pools per
Mile
1 8 20 18.8 5.2 96.7 70
2 14 20 16.6 5.1 105.2 70
3 12 20 19.5 0.6 130.5 96
4 6 20 36.5 0.0 190.1 96
Source: MHNF 2000a
Channel forming processes in Reach 4 and the remaining perennial and intermittent tributaries would
remain largely unaffected. With the exception of Brooks Meadow Creek, where the pipeline access road crosses through its lower reach. It would continue to heavily impact about 12 feet, or 2 percent of the total
channel length. This small short segment would remain in a poorly functioning condition, and an erosion

Dog River Pipeline Replacement | Environmental Assessment
86
source. Flow would be hindered sometimes, ponding in wheel ruts before passing across and back into the
creek.
As observed in the 2000 stream survey, the abundance and density of large woody debris in all reaches of
Dog River were low to moderate compared to the LRMP standards (Table 23). But the density of LWD
met the NMFS standards in all reaches. Since then, inputs of woody debris have continued to accumulate. Small wood pieces would likely continue to dominate the total percentage of wood in the stream. Some of
the small wood will remain a component of debris jams, but the majority of it would likely continue to be
individual pieces. The in-stream abundance and density of woody debris would be expected to continue to gradually increase for all size classes because the potential for future recruitment from the inner riparian
zone is good to excellent along most of the main stem, and the inner riparian zone for all reaches is
dominated by late- and mid-seral forest structure.
Table 23. In-channel woody debris and woody debris density amounts (total of both medium and large size classes) observed in the 2000 Dog River stream survey.
Source: MHNF 2000a
Data from the 2000 stream survey are useful for interpreting the effects of the modified flow regime on
the potential transport, distribution, and accumulation of in-stream woody debris under the No Action
Alternative. There were 103 debris jams counted during the stream survey of Dog River in 2000 (Table
24). Twenty-four percent of the total wood inventoried was in these jams. Of the wood in debris jams, 47
percent was in the small size category, 31 percent in the medium size class, and 22 percent in the large
size class.
Table 24. Existing number of in-channel woody debris and where it was located either as isolated pieces (single) or in debris jams.
Reach # of Debris
Jams
Total Pieces of Woody Debris
Small Medium Large
Single Debris
Jam
Single Debris
Jam
Single Debris
Jam
1 16 52 19 30 10 56 22
2 15 95 24 40 7 44 11
3 22 199 27 108 15 40 7
4 50 99 54 70 49 26 17
Source: MHNF 2000a
The total amount of in-stream debris jams inventoried suggests that the capability of the flows in Dog
River in all reaches would continue to transport and distribute woody debris that could accumulate into
jams. But intrinsically, the potential would remain fairly low because the flows and channel size are
relatively small. The capability of the winter peak flows that have been attenuated by diversion to transport medium and larger pieces would remain somewhat diminished. Spring peak flows however,
could be expected to retain most of their potential to transport larger pieces where the channel is wide and
deep enough. Transport potential in the Lower catchment would remain higher than the Upper catchment
Reach
Number of Pieces
In-Channel Density per Mile
Density per Mile
Standards
Small Medium Large Total Medium Large Total LRMP NMFS
1 71 40 78 189 16.7 26.7 43.4 106 20
2 119 47 55 221 18.6 21.7 40.3 106 20
3 226 123 47 396 39.2 15 54.2 106 20
4 153 119 43 315 64.8 23.4 88.2 106 20

Dog River Pipeline Replacement | Environmental Assessment
87
due to greater mean channel width and depth. In lower Dog River, the potential for maximum peak flows in both winter and spring to transport and re-distribute medium and large pieces of woody debris would
remain functional.
South Fork Mill Creek
Under the No Action Alternative, diversion from Dog River and storage and release in Crow Creek Reservoir would continue to modify the flow regime in the South Fork Mill Creek subwatershed. Channel
forming processes would remain altered as a result in the main channel. Mid- and early winter flows,
spring flows, and summer flows would continue to be affected most. Direct access to the main channel of
South Fork Mill Creek would remain limited and human perturbation other than water management
would be low.
Above the reservoir, average peak flows in early and mid-winter would remain elevated above naturalized
levels due to contributions from diversion. Below the dam, they would be attenuated and less than naturalized rates due to the filling of the reservoir and retention for storage. Average spring peak flows
would remain higher than naturalized above and below the dam because of diversion contributions and
spill combined with release. Base flows above and below the dam would also remain elevated above
naturalized levels due to contributions from diversion and releases downstream.
Elevating average base and peak flows will continue to increase water velocity seasonally and gradually
deepen entrenchment. Width-to-depth ratios could be expected to slowly decrease, and the wetted
perimeter enlarge. The short segments of channel where unstable and undercut streambanks were observed in Reaches 1 and 2 could progressively expand. For these reasons, pool abundance and quality
would remain low (Table 25). Most of the segments in each of these reaches would continue to be fast
flowing, and not conducive to pool formation.
Table 25. Observations of Select Channel Characteristics of South Fork Mill Creek from the 2011 Stream Survey Compared to LRMP and NMFS Standards and Guidelines.
Reach Percent Fine
Sediment
Observed
LRMP
Standard for
Percent Fine
Sediment
Total Pools
per Mile
Primary
Pools
per Mile
LRMP
Standard
Primary
Pools per
Mile
NMFS
Standard
Primary
Pools per
Mile
1 5 20 7.9 1.4 76 70
2 23 20 6.3 0.5 115.8 96
3 11 20 0.0 0.0 NA 184
Source: MHNF 2011
Substrate would be expected to remain dominated by coarse gravel. Fine sediment generated by
streambank erosion and incision would essentially be routed through the system by the elevated water velocity. Although it could continue to accumulate in the few pools or short aggrading segments in
Reaches 1 and 2. Above the dam, the majority of fine sediment generated would most likely continue to
settle in the reservoir, while below the dam it could accumulate behind the Wicks intake structure.

Dog River Pipeline Replacement | Environmental Assessment
88
The low overall abundance and density of large wood observed in the 2011 stream survey was low, and well below LRMP and NMFS standards (Table 26). Since then, woody debris has continued to
accumulate. Small wood pieces would likely continue to dominate the total percentage of wood in the
stream. Some of the small wood will remain a component of debris jams, but the majority of it would
likely continue to be individual pieces.
The in-stream abundance and density of woody debris would be expected to continue to gradually
increase for all size classes in the Upper catchment because the potential for future recruitment from the
inner riparian zone is good to excellent along most of the main stem where the inner riparian zone is dominated by late-seral forest structure. In the Lower catchment, potential recruitment is good along the
main corridor of South Fork Mill Creek, but fair to poor in the outer riparian zones where the 1967
School Marm and the 2013 Government Flats fire burned over the forest. Further down, the vegetation
type changes to more scrub-oak and the main stem is comprised of willows and cottonwood.
Table 26. In-channel woody debris and woody debris density amounts (total of both medium and large size classes) observed in the 2011 stream survey.
Source: MHNF 2011
Data from the 2011 stream survey are useful for interpreting the effects of the modified flow regime on the potential transport, distribution, and accumulation of in-stream woody debris under the No Action
Alternative. There were 129 debris jams counted during the stream survey of South Fork Mill Creek in
2011 (Table 27). Debris jams in Reaches 1 and 3 were all comprised of small wood, and 97 percent of the
wood in jams in Reach 2 included small wood.
Table 27. Existing number of in-channel woody debris and where it was located either as isolated pieces (single) or in debris jams.
Reach # of Debris
Jams
Total Pieces of Woody Debris
Small Medium Large
Single Debris
Jam
Single Debris
Jam
Single Debris
Jam
1 32 45 32 17 0 3 0
2 90 47 87 34 3 32 0
3 7 3 7 2 0 1 0
Source: MHNF 2011
The total amount of in-stream debris jams inventoried suggests that the capability of the flows in South
Fork Mill Creek in all reaches would continue to transport and distribute woody debris that could accumulate into jams. But intrinsically, the potential would remain fairly low above the dam because the
channel sizes are relatively small.
The capability of the attenuated winter peak flows below the dam, as well as the reservoir itself would continue to be diminished. The enhanced spring peak flows however would continue to be capable of
transporting and re-distributing medium and larger pieces where the channel is wide and deep enough.
Transport potential in the Lower catchment would remain higher than the Upper catchment due to greater
mean channel width and depth.
Reach
Number of Pieces
In-Channel Density per Mile
Density per Mile
Standards
Small Medium Large Total Medium Large Total LRMP NMFS
1 77 17 3 97 5.8 1.0 6.8 106 20
2 134 37 32 203 8.7 7.5 16.2 106 20
3 10 2 1 13 5.4 2.7 8.1 106 20

Dog River Pipeline Replacement | Environmental Assessment
89
Water Quality
For the No Action Alternative, water quality would continue to be affected by diverted streamflow from
upper Dog River. The timing and magnitude of diverted flow would continue to be managed to the status quo so that Crow Creek Reservoir would get filled by early February. Diversion would then be reduced to
a flow that maintains the level of the reservoir through the spring. Then diversion would be increased to
capture all of the base flow during the summer and early fall.
Dog River
Under the No Action Alternative, only one water quality standard for the designated beneficial uses of
Dog River would remain impaired. Iron would continue to exceed the standard for that constituent,
keeping Dog River on ODEQ’s 303(d) list of Category 5 waters identified in their 2012 Integrated Report. It would remain a non-point contaminant because the source of the quantities detected would still
be unknown. It has been surmised that iron may be naturally occurring, and its presence could be due to
the geologic formations that underlie the area (ODEQ 2017c). Other impairments would not be expected
to result from the Proposed Action, and no other point source or non-point source pollutants,
contaminants, or water quality exceedances would be anticipated.
The seasonal trends in stream temperature observed at the mouth of Dog River would be expected to
continue (Figure 26). Stream temperature would not be affected under the No Action Alternative. Dog River stream temperatures would remain cold both above and below the diversion year-round, rarely
exceeding water quality standards for temperature, and meeting the ODEQ requirements for fish and
aquatic life beneficial uses. Due to the presence and use by salmon and steelhead of the lowest 2.5 miles of Dog River, and because of the temperature TMDL for the Middle Columbia - Hood River basin,
monitoring of stream temperature would continue to be ongoing by the MHNF.
Figure 26. Daily average temperature data observed in Dog River upstream of the confluence of the East Fork Hood River.
Source: CTWS 2017

Dog River Pipeline Replacement | Environmental Assessment
90
The potential for Dog River to provide cold-water thermal refuge for aquatic species would remain high because of the groundwater inputs from springs and wet meadows. Cold water contributions to lower Dog
River from Puppy and Brooks Meadow Creeks would also continue. Dog River would remain a cold
water source for the East Fork Hood River in the low flow periods of late summer and early fall,
including when full diversion into the pipeline would occur upstream at RM 6.0. Lower Dog River could
be expected to remain a likely location as a core cold water habitat.
Residual effects to riparian shading from past forest management would continue to be negligible in the
Dog River subwatershed. Average solar radiation to the main stem and its tributaries would remain low overall, and the majority of the length of Dog River would continue to be effectively shaded. Segments of
reaches where shade was lacking would remain, and include two older clearcut plantations along
approximately 0.4 miles of lower Dog River where riparian vegetation had been encroached upon during the original harvest in the 1970s, and where several small patches of streamside blowdown occur in both
the lower and upper reaches. Natural recovery along these segments from growing streamside vegetation
would be expected to continue.
The degree of fine sediment that can potentially enter stream waters in the subwatershed would be generated from the same sources. The greatest potential would continue to come from roads at four
crossings over perennial streams. The largest source would continue to be where Highway 35 crosses over
lower Dog River. The potential for road grime and grit, as well as winter sanding materials to wash into
the stream waters there would remain very high.
Two other crossings, where FS road 44 crosses over Dog River and where FS road 17 crosses over
Brooks Meadow Creek would also remain sources of potential fine sediment. Both however, are paved crossings where use is seasonal, sporadic, and relatively low. So the amount of road grit and fine sediment
potentially generated at these crossings that could enter stream water would remain relatively low.
The fourth crossing where the potential for fine sediment to enter stream waters would remain high is
where Brooks Meadow Creek flows across the top of the 12-foot wide gravel service road that parallels the pipeline. The channel at this crossing has been heavily impacted, and flow is sometimes hindered,
ponding in wheel ruts before passing across and back into the creek. Although this road is used very little,
water flows across it persistently. When not frozen, this site is always ponded and muddy, it is a potential chronic source of fine sediment. But the area is small, and the stream velocity low, so the amount of
sediment that actually gets mobilized into the water column would be relatively low too, except
temporarily when a vehicle or OHV occasionally runs through the 10 x 12 foot puddle.
Leakage from the pipeline would continue to occur under the No Action Alternative, and new ones could develop. During high flows, when flow velocities generate high pressure, the larger of these leaks would
continue to erode flow paths to existing intermittent or perennial channels, potentially delivering fine
sediment to stream waters that could temporarily increase turbidity.
Additionally, given the age and current condition of the existing pipeline, there would remain a risk of
catastrophic failure. If catastrophic failure of the pipeline were to occur, particularly on a steep slope,
gully erosion could be expected. Deposition of fine sediment and elevated turbidity would be expected as
a result, and would continue until the diversion could be shut down.
South Fork Mill Creek
Under the No Action Alternative, existing effects to the water quality of South Fork Mill Creek would
remain unchanged. There would continue to be no impairments to the designated beneficial uses. Other than seasonal or storm variation the quality of the stream water in the creek would be expected to remain
very good. Occasionally, high concentrations of coliform could be expected to be detected by the City at
the Wicks Water Treatment plant, probably originating from wildlife fecal contamination. In the past,
they have also detected slightly elevated concentrations of phosphorus, possibly from accumulated

Dog River Pipeline Replacement | Environmental Assessment
91
sediments in the reservoir. But the dilution provided by the inflow of water from Dog River would
continue to abate any effect that could necessitate special treatment.
The seasonal trends in stream temperature observed below the Crow Creek Reservoir would be expected
to continue (Figure 27). Stream temperature would not be affected under the No Action Alternative.
South Fork Mill Creek stream temperatures would remain cold year-round below the dam, rarely exceeding water quality standards for temperature, and meeting the ODEQ requirements for fish and
aquatic life beneficial uses.
Figure 27. Seven-day-minimum and maximum temperatures in South Fork Mill Creek at the USFS boundary (MHNF 1999) below Crow Creek Reservoir.
Just below the dam however, the seven-day summer maximum temperature would continue to commonly
be slightly increased above the 13oC standard (Figure 28). This is thought to result when drawdown during peak use in the summer would lower reservoir levels, resulting in the potential increase of
temperature in the stored water that would be released into the creek. Regardless, stream temperature
would not be considered to be degrading water quality in the South Fork Mill Creek. Due to the
temperature TMDL for the Middle Columbia - Hood River basin, monitoring of stream temperature by
the MHNF would continue.

Dog River Pipeline Replacement | Environmental Assessment
92
Figure 28. Summer average daily temperature for South Fork Mill Creek (elevation of 2,500 feet), downstream of Crow Creek Reservoir near the Forest boundary.
Source: MHNF 2017
Residual effects to riparian shading from past forest management would continue to be negligible in the
South Fork Mill Creek subwatershed. Average solar radiation to the main stem and its tributaries would
remain low overall, and the majority of the length of South Fork Mill Creek would continue to be effectively shaded. Segments of reaches where riparian shade had been impacted by the Government Flats
wildfire would continue to recover from growing streamside vegetation.
Fine sediment and turbidity would not be expected to become an impairment to the water quality of South Fork Mill Creek under the No Action Alternative. There would remain however, existing anthropogenic
sources of fine sediment in the subwatershed. The primary sources on Forest Service lands are where
certain segments of road connect to the channel network at specific perennial stream crossings, and where several segments of the upper reach have become slightly more incised, and in the lower reach where
there is some evidence of unstable stream banks.
Three crossings associated with FS road 1721 where it crosses over Stroud Springs, the South Fork of
Mill Creek, and at Alder Creek would continue to have the potential to deliver fine sediment to stream waters. The relative amount of sediment potentially delivered from these crossings would be low because
these crossings are within the Municipal Watershed, which is closed to public use and gets very little
traffic. The drainage structures on this road are in good condition, and have been purposefully constructed to minimize the length of road connected to the stream network. Also, all three crossings are upstream of
Crow Creek Reservoir, where road sediment would be expected to settle and accumulate
A fourth crossing is currently a bridge where FS road 1720-190 crosses the South Fork of Mill Creek about ¾ of a mile below the dam. It too is within the Municipal Watershed, and seldom used. The amount
of fine sediment that it could potentially generate and deliver to the creek would also be expected to
remain low.
A low-water ford located about 3.5 miles downstream of the dam on non-Federal land has the potential to generate and deliver fine sediment to the creek. But it too is seldom used. It is not always passable.
Periodically, it could get used during low flow periods when it would be safe to cross over. When crossed
by a motorized vehicle, it could be expected that a small measure of sediment is stirred and mobilized.

Dog River Pipeline Replacement | Environmental Assessment
93
The duration of the disturbance would be brief, so the amount of sediment generated would be minor and
short-lived.
The hydrologic regime of the South Fork Mill Creek would continue to be altered due to the diverted
flows from Dog River, the seasonal spill around Crow Creek dam, and the timed releases from the
reservoir. Average peak and base flows will continue to be elevated, increasing water velocity and stream turbulence. The channel and streambanks would continue to slowly adjust incrementally. Increases in
sedimentation and turbidity could be expected as a result, particularly during the spring spill and late
summer releases. But since the degree of channel incision and bank erosion is not widely extensive after many decades of an altered hydrologic regime, the amount of fine sediment generated as a result would
continue to remain only a slight increase.
Leakage from the pipeline would continue to occur under the No Action Alternative, and new ones could develop. During high flows, when flow velocities generate high pressure, the larger of these leaks would
continue to erode flow paths to existing intermittent or perennial channels, potentially delivering fine
sediment to stream waters that could temporarily increase turbidity.
Additionally, given the age and current condition of the existing pipeline, there would remain a risk of catastrophic failure. If catastrophic failure of the pipeline were to occur, particularly on a steep slope,
gully erosion could be expected. Deposition of fine sediment and elevated turbidity would be expected as
a result, and would continue until the diversion could be shut down.
Water Rights
The City of The Dalles would continue to use surface waters certificated by the OWRD for municipal use
from Dog River and the South Fork of Mill Creek, which include the four water rights currently in their name (Table 28). The amount and designated purpose of use authorized under these existing water rights
would not be expanded or transferred. The City would continue to have the decreed right to use all of the
water in upper Dog River above the point of the pipeline diversion, and 2 cfs from South Fork Mill Creek above the Wicks water treatment plant. The priority dates for these two surface water sources precede all
other claims, so they would remain senior to all other water rights from those streams. Because they are
decreed and certificated municipal water rights, they will not be subject to standard forfeiture statutes, and
will be protected against injurious claims (ORS 540.610 and 538.410 respectively).

Dog River Pipeline Replacement | Environmental Assessment
94
Table 28. Surface Water Right Certificates for Dog River and South Fork of Mill Creek that are designated for municipal use.
City of the Dalles
Source Application Permit Certificate Claim, Decree, or
Transfer
Priority date
Type of Beneficial
Use
Authorized Rate or
Annual
Volume
Dog River
14954
Hood
River
decree 8/1/1870 Municipal
“All the
water in
stream at
point of diversion”
South
Fork Mill Creek
5691
Mill
Creek decree
1862 Municipal 2 cfs
Crow
Creek
reservoir
S-43668 S-32479 60410
5/29/1967 Municipal 955 AF
South
Fork Mill
Creek,
Dog River
R-43667 R-4988 44917
5/29/1967 Storage
for
Municipal
955 AF
Source: OWRDb 2019. Note: Definitions: Permit – Applicant has been approved to develop a water source for its designated beneficial use. Certificate – Applicant has “perfected” and developed the water right as per the
conditions of the permit. The water right has become certified to the holder. Decree – Court issued water right to a
holder.
These water rights would remain the purview of the OWRD, the state authority that regulates and
administers their use and insures consistency with the requirements of Oregon Revised Statutes and
Administrative Rules. OWRD would continue to monitor the City of the Dalles to ensure compliance
with Oregon Water Law pertaining to municipal use. The City of The Dalles would continue to report to
OWRD their usage, proposed upgrades or changes, and provide planning documents for review consistent
with the requirements and statutes for municipal water providers.
The Mt. Hood National Forest does not administer or enforce water rights. The Forest’s Special Use
Permits however, which authorize the City to operate and maintain the Dog River pipeline and Crow
Creek Reservoir facilities located on National Forest System lands, would require that all permitted
activities comply with State laws. The Mt. Hood National Forest would continue to rely on the OWRD’s
oversight of the City’s use of water rights for compliance with the applicable State water laws.
The City would be expected to apply for an extension for their two permitted water rights slated to expire
in 2021 that would provide them authorization to expand Crow Creek Reservoir, which is identified in the City’s 2006 Water System Master Development Plan (permits S-53930 and R-13105). This would keep
the water rights for additional storage and increased municipal use in the name of the City. It’s anticipated
that OWRD would grant them a 10-year extension. If granted, it would be the second extension on each
of the permits.
Priority dates for the permits are both January of 1999. Since then, only preliminary plans for raising the
height of the dam have been drafted. The City has not submitted any formalized plans or filed for any other requisite approvals to prove-up on the permits so that their water rights could be certificated. Since
OWRD would be expected to extend the water right permits however, reservoir expansion would remain

Dog River Pipeline Replacement | Environmental Assessment
95
an option if needed for the City to meet future demand. But it would remain uncertain when, or if the City intends to proceed because they would continue their search for other storage options. If they were to
proceed with reservoir expansion, then NEPA would have to be initiated because the action would
partially be located on National Forest System lands.
Under the No Action Alternative, the City would be expected to exercise their limited license to conduct testing to determine the feasibility of an ASR system. The final order for the license was granted to the
City by OWRD in October of 2018. The City would be authorized to divert up to 16.7 cfs using their
existing water right certificates for Dog River, the South Fork of Mill Creek, and Crow Creek Reservoir. Additional diversion flow from Dog River would not be expected to meet ASR demand. OWRD would
administer the City’s use of the limited license, and be responsible for the enforcement of the final order’s
conditions.
Two other surface water rights in the Dog River and South Fork Mill Creek subwatersheds would remain
held in-trust by OWRD on behalf of the ODFW (Table 29). These water rights would be administered to
provide stream flow for the migration, spawning, egg incubation, fry emergence, and juvenile rearing for
Coho salmon, summer and winter steelhead, rainbow trout and cutthroat trout. The flow rates allocated to them would remain applicable to the reaches of each stream below the point of diversion for the Dog
River pipeline and Crow Creek dam respectively. The priority date for both instream water rights is 1991.
Table 29. In-stream surface water rights in the Dog River and South Fork Mill Creek subwatersheds and the maximum monthly allocation protected by OWRD for instream use.
Source Jan Feb Mar Apr May Jun Jul Aug Sep Oct Nov Dec
Dog River
below
diversion Certificate
IS76267A
12.0 12.0 12.0 20.0 20.0 20.0 12.0 7.01 6.05 7.79 14.7 12.0
S Fk Mill
Creek below dam
Certificate
IS72078A
7.0 7.0 10.0 17.0 17.0 7.8 4.8 5.4 6.1 4.8 5.5 7.0
Source: OWRD 2019b
OWRD would continue to administer these instream water rights so that any remaining water available
for allocation as a water right in the watershed would be designated for the in-stream purpose. These flow
allocations would be the remainder of the estimated natural average flow not being used for other senior users. As described in each of the respective certificates, they would not be expected to represent
minimum flow requirements. They would not guarantee actual flow availability at those rates, but rather
reflect the maximum allocation protected for the instream beneficial use by the water right. As a condition of the certificate, they would not have priority over human consumption. They would be considered by
OWRD to be junior to the City of The Dalles municipal water rights in Dog River and South Fork Mill
Creek.
The City of The Dalles’ water rights for Dog River and the South Fork of Mill Creek would remain senior
to any federal reserved water rights because their priority pre-dates that of the establishment of the Mt.
Hood National Forest (OWRD 2002). Any claims by the Forest Service to such rights would be subject to the state’s adjudication process. The Forest Service would not be expected to submit any claims or
assertion for federal reserved water rights in the Dog River and South Fork Mill subwatersheds.

96
3.3.2.2 Proposed Action Alternative
The Proposed Action is the replacement of the existing pipeline with a new pipeline, allowing the City of
The Dalles to utilize more efficiently the water being diverted from Dog River. The existing 3.4 mile pipeline would be replaced with a seam-sealed 24-inch-diameter pipe. It would be located parallel and
next to the existing alignment as much as possible. Decades-old leakage would be rectified.
In addition to pipeline replacement, the project will repair and improve the diversion structure and install fish screens and passage structure, install a new culvert under the service road crossing Brooks Meadows
Creek that would provide passage for aquatic organisms, and improve summer low flows by adding 0.5
cfs into Dog River below the point of diversion during August, September, and October. Implementation
of the proposed action would include the use of BMPs and PDC identified to minimize effects to natural
and cultural resources.
Water Quantity and Streamflow
Dog River
Under the Proposed Action Alternative, the quantity of water diverted from upper Dog River and its
tributaries would remain unchanged from current conditions between early November and Late July. On
average, Dog River would continue to provide for about 58 percent of the City’s total surface water
contribution. Diversion to South Fork Mill Creek in the early summer would be expected to average about 7.0 cfs, and about 2.0 cfs during late summer. In most years, the headworks at the pipeline inlet would be
operated to increase diverted flow in the late fall and early winter to re-fill Crow Creek reservoir, by early
or mid-February if possible. Once full, the amount of diversion would be reduced manually to a maintenance flow of about 2-3 cfs until mid- to late May. Then the rate of diversion would be increased to
capture the entire amount of upper Dog River’s base flow through July. The City would then reduce the
amount of flow diverted between August 1 and October 31 to allow a proportion (0.5 cfs) of the base flow
to bypass downstream to lower Dog River (Figure 29).

97
Figure 29. Mean daily discharge summary of an average water year that was diverted into the City’s pipeline during 2012 through 2018, minus 0.5 cfs bypass flow to be offered 8/1 through 10/31, compared to mean daily discharge of Dog River above diversion
Source: CTD 2018
Effects to streamflow from pipeline diversion would continue to be greatest during the summer and early
fall when flows are lowest, and an average of 80 to 100 percent of upper Dog River is diverted into the pipeline (see Table 30). During this time, the lowest eighth of a mile segment of Reach 3 below the
pipeline diversion would likely be partially dewatered mid-June through late July. Instream flows to this
segment would be restored naturally just downstream by springs, seeps, and hyporheic flow. Lower Dog River would continue to be a perennial stream type during this time (Figure 30). Then during late summer
and early fall, streamflow would be partially restored with 0.5 cfs of bypass flow from Aug. 1 to Oct. 31.
Table 30. Estimated Percent of Mean daily discharge (cfs) of Upper Dog River Diverted May through October under the Proposed Action.
May June July August September October
Percent of Dog
River diverted 39 99 100 80 80 79
Source: CTD 2018
It is estimated that Puppy Creek would continue to potentially contribute on average nearly 4 percent of
the base flow to lower Dog River, and Brooks Meadow Creek could potentially contribute nearly 12
percent of its base (USGS 2017). Ground water contributions to lower Dog River would also continue to supplement base flows. The perennial sources of near-bank springs and seeps along the lower reaches
below the diversion would continue to provide unceasing flow during summer months.
0
2
4
6
8
10
12
14
16
18
10/1 11/1 12/1 1/1 2/1 3/1 4/1 5/1 6/1 7/1 8/1 9/1
Flo
w in
CFS
Estimated Average Flow
Estimated diversion Dog River Streamflow

98
Figure 30. Instantaneous Discharge measured near the mouth of Dog River spring through late-summer of 2019, with additional proposed bypass flow of 0.5 cfs exhibited.
When the majority of flow of upper Dog River is being diverted to the pipeline in the summer and early
fall, the river at the mouth would continue to flow perennially. Despite the diversion of most of the
summer low flow that’s produced from the Upper catchment, as much as 40 percent or more gain of
available daily flow could be expected at the mouth of Dog River (Table 31). But overall, capturing the majority of flows during summer and late fall would continue to reduce natural mean monthly base flows
at the mouth of Dog River by an estimated 25 to 35 percent.
Table 31. Comparison of Discharge (cfs) in Dog River Measured Above and Below the Diversion on Select Dates.
Location July 20,
1972
July 27,
2000
July 27,
2016
May 1,
2019
RM 6.0 Above
Diversion
(fully diverted flow)
6.21 4.02 3.23 14.915
RM 0.0 Near Mouth NA 8.33 5.34 30.15
RM 3.0 in Reach 2 9.01
Sources: 1HRWG 1999, 2MHF 2000b stream survey, 3CTD 2017b, 4CTWS 2017, 5OWRD 2019:
The effects of diversion on peak flows would continue to be greatest during the late fall and early winter
months when Crow Creek Reservoir is filling. Diversion will decrease the overall magnitude of mean daily peak flows in Dog River during that time. Data indicates it could be by as much as 70 percent in a
year when total fall/winter precipitation is below normal. The majority of peak runoff however, which
occurs in the spring, would not be expected to be attenuated nearly to that degree. This is because in most years, Crow Creek Reservoir would be filled by early to mid-February. Typically, the majority of the
spring freshet would not be diverted, and would pass downstream to lower Dog River (Figure 31).
0.00
5.00
10.00
15.00
20.00
25.00
30.00
35.00
5-Apr-19 25-Apr-19 15-May-19 4-Jun-19 24-Jun-19 14-Jul-19 3-Aug-19 23-Aug-19 12-Sep-19
cfs
Discharge at the mouth of Dog River
Discharge
add 0.5 cfs

99
Figure 31. A comparison of average streamflow and diverted flow from 2011 through 2018 above the Dog River diversion to illustrate the amount of spring peak flows that would bypass to lower Dog River.
Source: CTD 2018
In lower Dog River, the attenuation of winter peak flows would be less of an effect than the upper river
because of the contributions from perennial and intermittent streams in the Lower catchment. Puppy
Creek for example would continue to potentially contribute on average about 19 percent of peak flow in lower Dog River, while Brooks Meadow Creek’s contribution could average about 4 percent of the peak
(USGS 2017).
Annually, there would continue to be an amount of bypass streamflow available to lower Dog River. Only a portion of streamflow would be diverted from upper Dog River most months. During some months
bypass flows would likely be greater than diverted flows. During June and July the entire, or nearly entire
amount of the flow from upper Dog River would be diverted. Bypass flows of 0.5 cfs downstream to Dog River would be maintained during the late summer and early fall only under the Proposed Action. Based
on past records, the percentage of total streamflow that would not be diverted, and flow past the point of
diversion and stay in the main stem of Dog River can be displayed as a percentage of total streamflow
(Figure 32). The maximum amount of bypass flow would be expected to continue during late April and early May and would account for between 70 and 80 percent of the total available flow from upper Dog
River.
0.00
5.00
10.00
15.00
20.00
25.00
30.00
35.00
40.00
45.00
9/29/11 9/29/12 9/29/13 9/29/14 9/29/15 9/29/16 9/29/17 9/29/18
Average Streamflow Compared to Average Diverted Flow for the Period of Record 2011-2019
Average Daily Stream Flow(CFS)Average Daily DiversionFlow (CFS)

100
Figure 32. The amount of mean daily streamflow that bypassed (undiverted flow) the pipeline diversion down Dog River, expressed as a percentage of total available streamflow for water years 2012 to 2018*
Source: MHNF 2018 *Includes simulated 0.5 cfs bypass flow to be offered by the City August 1 through October
31.
Installation of a new pipeline would eradicate the water loss that has persisted for many decades from the old conveyance line. The total amount of water loss would no longer factor into the amount of water
diverted from Dog River to meet demand. Conveyance of water using the new pipeline would become
more efficient, so that only the water needed to meet demand would be withdrawn. The amount of unused water diverted from Dog River could be minimized. Since operations that manage the timing and amount
of water diverted from Dog River would change little under the Proposed Action, the amount of water
loss due to leakage could become available as bypass flow downstream, or to fill Crow Creek Reservoir earlier in the winter and maintain its surface elevation longer into the spring. The water that was lost to
leakage during base flows, would be available for maintaining at least 0.5 cfs bypass flow downstream to
lower Dog River from August 1 to October 31.
The effects of forest management on water quantity and streamflow in the subwatershed would continue to be slight. Two measures often used as indices of the potential effect of forest management on
streamflow include road density and the extent of watershed impact areas. Both measures were calculated
in 2015 to be below thresholds of concern (Table 32).
Since then, there has been no new road construction, and only a minor extent of past thinning. Effects of
forest management on stream flow would remain negligible. There would remain however, 5 crossings
over perennial streams where segments of road would periodically divert intercepted runoff toward streams, a portion of which would likely enter the stream during high runoff events. Under the Proposed
Action, the one crossing where the pipeline access road intersects with Brooks Meadow Creek would be
improved by installing a culvert that would diminish interception and diversion of runoff to the stream. The amount of contributing area to all five crossings would remain a very small percentage overall.
Hydrologic recovery from any past activities would continue to improve.
0.00
0.10
0.20
0.30
0.40
0.50
0.60
0.70
0.80
0.90
10/1 11/1 12/1 1/1 2/1 3/1 4/1 5/1 6/1 7/1 8/1 9/1
Percent of Water Bypassing Diversion (Median of 7 years)
Percent of water bypassing diversion: Simulated Aug1-Oct31 (median of 7 years)
Percent of water bypassing diversion (median of 7 years)
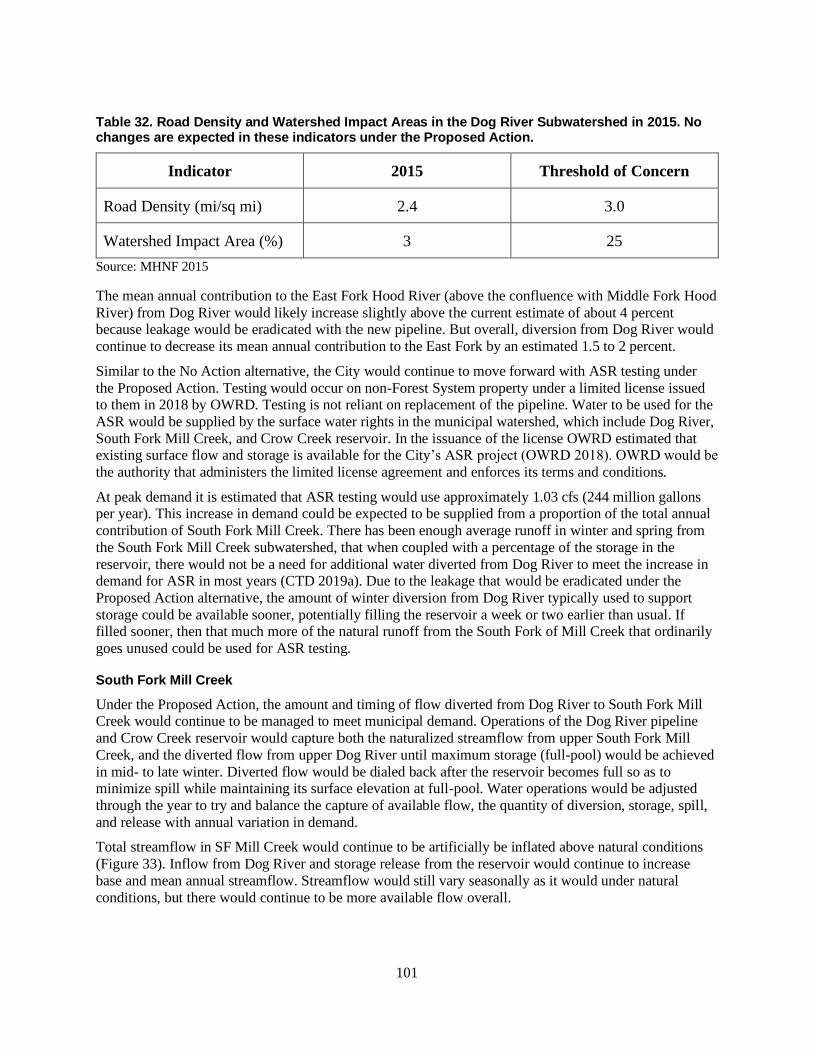
101
Table 32. Road Density and Watershed Impact Areas in the Dog River Subwatershed in 2015. No changes are expected in these indicators under the Proposed Action.
Indicator 2015 Threshold of Concern
Road Density (mi/sq mi) 2.4 3.0
Watershed Impact Area (%) 3 25
Source: MHNF 2015
The mean annual contribution to the East Fork Hood River (above the confluence with Middle Fork Hood
River) from Dog River would likely increase slightly above the current estimate of about 4 percent because leakage would be eradicated with the new pipeline. But overall, diversion from Dog River would
continue to decrease its mean annual contribution to the East Fork by an estimated 1.5 to 2 percent.
Similar to the No Action alternative, the City would continue to move forward with ASR testing under
the Proposed Action. Testing would occur on non-Forest System property under a limited license issued to them in 2018 by OWRD. Testing is not reliant on replacement of the pipeline. Water to be used for the
ASR would be supplied by the surface water rights in the municipal watershed, which include Dog River,
South Fork Mill Creek, and Crow Creek reservoir. In the issuance of the license OWRD estimated that existing surface flow and storage is available for the City’s ASR project (OWRD 2018). OWRD would be
the authority that administers the limited license agreement and enforces its terms and conditions.
At peak demand it is estimated that ASR testing would use approximately 1.03 cfs (244 million gallons per year). This increase in demand could be expected to be supplied from a proportion of the total annual
contribution of South Fork Mill Creek. There has been enough average runoff in winter and spring from
the South Fork Mill Creek subwatershed, that when coupled with a percentage of the storage in the
reservoir, there would not be a need for additional water diverted from Dog River to meet the increase in demand for ASR in most years (CTD 2019a). Due to the leakage that would be eradicated under the
Proposed Action alternative, the amount of winter diversion from Dog River typically used to support
storage could be available sooner, potentially filling the reservoir a week or two earlier than usual. If filled sooner, then that much more of the natural runoff from the South Fork of Mill Creek that ordinarily
goes unused could be used for ASR testing.
South Fork Mill Creek
Under the Proposed Action, the amount and timing of flow diverted from Dog River to South Fork Mill Creek would continue to be managed to meet municipal demand. Operations of the Dog River pipeline
and Crow Creek reservoir would capture both the naturalized streamflow from upper South Fork Mill
Creek, and the diverted flow from upper Dog River until maximum storage (full-pool) would be achieved
in mid- to late winter. Diverted flow would be dialed back after the reservoir becomes full so as to minimize spill while maintaining its surface elevation at full-pool. Water operations would be adjusted
through the year to try and balance the capture of available flow, the quantity of diversion, storage, spill,
and release with annual variation in demand.
Total streamflow in SF Mill Creek would continue to be artificially be inflated above natural conditions
(Figure 33). Inflow from Dog River and storage release from the reservoir would continue to increase
base and mean annual streamflow. Streamflow would still vary seasonally as it would under natural
conditions, but there would continue to be more available flow overall.

102
Figure 33. Mean daily flow in South Fork Mill Creek above the Wicks water treatment plant intake exhibiting the estimated increase in streamflow above the natural flow regime.
Source: CTD 2019
On average, Dog River would continue to contribute about 58 percent of the City’s total surface water contribution. Diversion to South Fork Mill Creek in the early summer would average about 7.0 cfs, and
about 2.0 cfs during late summer. In Reach 2 between the pipeline outlet and Crow Creek Reservoir this
contribution would amount to about 4 times more streamflow than the natural base flow. In the late fall
and early winter, the amount of diverted flow would be increased to try and re-fill Crow Creek reservoir by early or mid-February. Once full, the amount of diversion would be reduced to a maintenance flow of
about 2-3 cfs until mid- to late-May. Then the rate of diversion would be increased to capture the entire
amount of upper Dog River’s base flow through July. From August 1 through October 31, the City would
reduce the amount of diverted flow to South Fork by at least 0.5 cfs.
Dam releases and diverted flow from Dog River would continue to be managed to meet peak demand
during the summer months. Base flows just above the Wicks water treatment plant near the mouth of the South Fork Mill would remain elevated by more than double that of estimated natural discharge. Reliable
late summer flows from these surface water sources, including available live flows and stored water
releases, would remain an average estimate of 5.4 cfs (CTD 2014).
Release from the reservoir would occur year around primarily to meet municipal demand and provide at least 2.0 cfs to South Fork Mill Creek as stipulated by the reservoir Special Use Permit. Releases of 6 cfs
or higher would be common. The quantity needed for release typically fluctuates on a seasonal trend, but
may occur weekly or daily too. Inflow into the reservoir would begin to subside in summer, when
drawdown of the reservoir would be expected to occur. Typically the City would begin drawdown in early July and then begin refilling in November (Figure 34). Sometimes there would be a need for
special releases such as when one of the supplemental wells might be taken off-line.
0.00
10.00
20.00
30.00
40.00
50.00
60.00
70.00
1-Oct 1-Nov 1-Dec 1-Jan 1-Feb 1-Mar 1-Apr 1-May 1-Jun 1-Jul 1-Aug 1-Sep
Flo
w in
CFS
South Fork Mill Creek Hydrograph 2012-2019 compared to Naturalized Hydrograph of the 1960's
SF Mill Ck ab Wicks (raw) SF Mill Creek (1960's Naturalized)

103
Figure 34. Mean monthly fill and drawdown trends during the period 2005 to 2015.
Source: CTD 2017c
Peak flows would continue to be attenuated to a degree below the Crow Creek dam as a result of storage
in the reservoir. Spill over the reservoir however, would still occur during early spring when full-pool is exceeded because diverted flow from Dog River and natural inflow from the Upper catchment will have
already filled the reservoir. Spill would continue to be greatest during the winter and spring in response to
heavy runoff and precipitation (Figure 35).
Figure 35. Comparison of mean monthly spill and release during the period 2005 to 2015.
CTD 2017c. Note: Spill is not recorded continuously, so missing data has been interpreted by the graphed line.
If spill occurs, then less would be needed for release. Spill would not be expected to occur during the
early summer to late fall months, when demand and drawdown is highest. Spill would usually be greater
than release during winter and spring, and excess to municipal use. Most of this would bypass the Wicks
treatment plant intake and flow downstream to Mill Creek, elevating its average natural peak discharge.
Testing for the City’s ASR system under their limited license with OWRD could be expected to utilize
the spill that typically occurs during the winter and spring (Figure 36). Testing for the ASR would not be
0.0
20.0
40.0
60.0
80.0
100.0
120.0
Oct Nov Dec Jan Feb Mar Apr May Jun Jul Aug Sep
Reservoir Fill and Drawdown
Mean Mthly Reservoir fill (cfs)
Mean Mthly Reservoir drawdown (cfs)
0.0
5.0
10.0
15.0
20.0
25.0
30.0
Oct Nov Dec Jan Feb Mar Apr May Jun Jul Aug Sep
CFS
Spill and Release
Spill
Release

104
reliant on replacement of the Dog River pipeline. The increase in demand to test the ASR would be
supplied from a proportion of the total annual contribution of South Fork Mill Creek. There has been enough average available spill and runoff in winter and spring from the South Fork Mill Creek
subwatershed, that when coupled with a percentage of the storage in the reservoir, there would be
available water sufficient for ASR testing (OWRD 2018). OWRD would be the authority that administers
the City’s limited license and enforces the terms and conditions in the agreement.
The water treatment plant’s average intake would be expected to increase during that time because only
finished water can be used for ASR testing. This would decrease the amount of winter and spring flow that has typically bypassed the Wicks treatment plant intake and flowed to Mill Creek. This would lower
the elevated average peak flow from South Fork Mill that would flow into Mill Creek by an estimated 6
percent.
Under natural flow conditions, South Fork Mill Creek is estimated to have contributed about 69 percent of the mean annual discharge of Mill Creek. Average annual diversion for the Wicks water treatment
plant would continue to operate to meet demand, which has traditionally reduced the annual contribution
to Mill Creek by an estimated 40 percent (OWRD 2019a). Demand for ASR testing could decrease the
mean annual contribution by about another 13 percent.
Figure 36. Comparison of the proportion of the different source water supply with current and projected ASR demand.
(Note: different scale for S. Fk. Mill Creek on right-hand axis). Values above the solid black line (i.e., WTP Raw
Water Diversion) represent the volume of unused water currently available for ASR testing. Source: CTD 2019a
The effects of forest management on water quantity and streamflow in the subwatershed would continue
to be slight. Two measures often used as indices of the potential effect of forest management on
streamflow include road density and the extent of watershed impact areas. Both measures were calculated
in 2012 to be below thresholds of concern (Table 33).

105
Since then, there has not been any new road construction on Forest Service lands. Some roads have been
closed and decommissioned. The extent of ongoing fuel treatments (i.e. pile burning) would be minor. Effects of forest management on stream flow would not be expected to change under the Proposed
Action, and remain negligible.
There would remain the 4 crossings over perennial streams where segments of road could periodically divert intercepted runoff toward streams, a portion of which likely enters the stream during high runoff
events. But the amount of contributing area would be very small. Overall, the South Fork Mill Creek
subwatershed would be considered to have minimal hydrologic disturbance from roads, and any long-
lasting effects to streamflow would remain slight.
There have been about 3,829 (21%) acres of forest management activities over the last 15 years on
Federal lands in and around the South Fork subwatershed. Treatments consisted of thinning, brushing,
pruning, underburning, and pile burning to reduce hazardous fuels. They were intended to minimize the potential risks and impacts of wildfire. Best Management Practices were incorporated into treatment
design so that watershed effects would be minimized. Existing effects of these past forest management
activities, as well as past wildfire, on water quantity and streamflow in the subwatershed would remain
slight and continue to diminish.
Table 33. Road Density and Watershed Impact Areas in the South Fork Mill Creek Subwatershed in 2012. No changes are expected in these indicators under the No Action alternative.
Indicator 2012 Threshold of Concern
Road Density (mi/sq mi) 2.6 3.0
Watershed Impact Area (%) 13* 25
Source: MHNF 2012, MHF 2000b *Prior to the Government Flats fire of 2013.
Channel Conditions
For the Proposed Action, channel characteristics and features would continue to be affected as a result of diverted streamflow from upper Dog River. The timing and magnitude of diverted flow would mostly
continue to be managed to the status quo so that Crow Creek Reservoir would get filled by early
February. Diversion would then be reduced to a flow that maintains the level of the reservoir through the
spring. Then diversion would be increased to capture nearly all of the base flow through July. Then the
City would maintain a bypass flow of 0.5 cfs downstream to lower Dog River from Aug 1 to October 31.
Dog River
In the Dog River subwatershed, channel forming processes would continue to be altered by the modified
flow regime. Winter and summer flows would continue to be affected most. Early and mid-winter average peak flows would be attenuated to a moderate degree. But most of the streamflow volume comes from the
spring snowmelt, so the majority of the spring peak flow would bypass the diversion. During June
through October, the majority of the streamflow from upper Dog River would be diverted to the South
Fork Mill Creek.
For most of the length of Dog River, direct access to the channel would remain limited and human
perturbation other than water management would be low. The stream banks and main channel could be
expected to remain primarily stable, and the sediment supply would not be expected to undergo an aberrant change from previous trends. Substrate would continue to be dominated by gravels and cobbles.

106
The average amount of fine sediment observed through-out all reaches would likely remain low to
moderate on an area weighted basis.
Changes to channel forming processes related to modified streamflow would continue to mostly affect
Reaches 1, 2, and the lower segment of 3. Effects would be greatest in the lower segment of Reach 3
immediately below the diversion because it would continue to be partially dewatered for an eighth of a mile downstream during the mid-summer (i.e., mid-June to late July). Bypass flows of 0.5 cfs that would
be maintained by the City from August through October would be expected to re-water that segment of
the reach, although flows in it would amount to about 20 percent of natural base flows. Overall, the reduction in average annual flow and the reduction of the majority of base flows in this reach would
continue to be the cause for the diminished pool depth, width-to-depth ratio, and wetted perimeter.
Effects to the main channel in Reaches 1 and 2 that make up lower Dog River would continue to be low
to moderate, primarily due to the overall reduction of mean base flows that affect the average depths of residual pools. The average depth of the primary pools in both reaches could continue to average about 2
feet during summer low flows of July, even when 100 percent of the flow of upper Dog River would be
diverted. Perennial streamflow from Brooks Meadow and Puppy creeks, as well as the many near-bank
springs and seeps would continue to contribute to base flows and alleviate the effects of full diversion.
The 0.5 cfs bypass flow that the City would maintain August through October would enhance somewhat
base flows and pool depth. Pool depth compared to the No Action Alternative could be improved by a slightly measureable 1 to 2 inches. But overall, it is estimated that summer and early fall pool depths at
the mouth of Dog River would remain on average about 2 to 3 inches more shallow than natural flow
because of diversion during the base flow period.
Pool frequencies in all four reaches would be expected to remain below the LRMP and NMFS standards that are often suggested as indicators of properly functioning channel processes (Table 34). The
attenuation of average peak winter flows resulting from diversion to fill Crow Creek Reservoir in the
early- and mid-winter months would be a likely cause for lower pool frequencies below the diversion. The majority of pools that were observed in Reach 3 and 4 however were pocket pools, suggesting the
small size of Dog River and its channel type, which have a low inherent potential for new deep pool
formation because the stream power and discharge to scour deeper and mobilize larger quantities of
bedload is low and infrequent.
Table 34. Observations of Select Channel Characteristics of Dog River from the 2000 Stream Survey Compared to LRMP and NMFS Standards and Guidelines.
Reach Percent Fine
Sediment
Observed
LRMP
Standard for
Percent Fine
Sediment
Total Pools
per Mile
Primary
Pools per
Mile
LRMP
Standard
Primary
Pools per
Mile
NMFS
Standard
Primary
Pools per
Mile
1 8 20 18.8 5.2 96.7 70
2 14 20 16.6 5.1 105.2 70
3 12 20 19.5 0.6 130.5 96
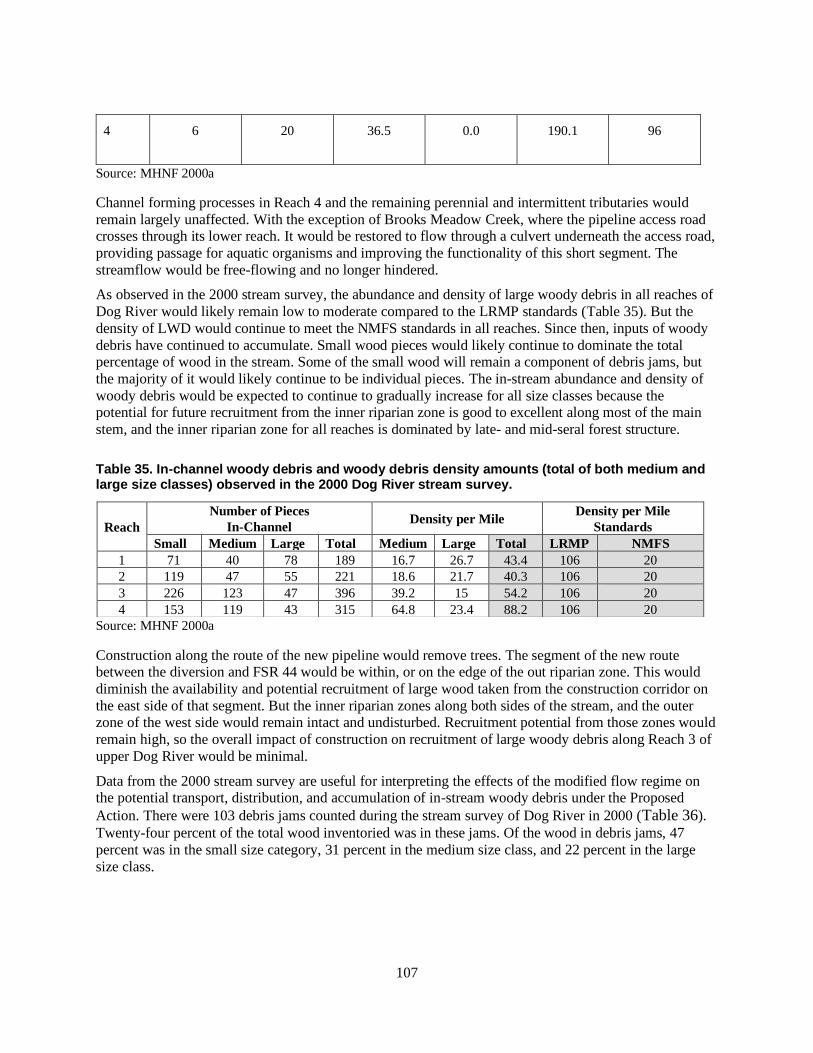
107
4 6 20 36.5 0.0 190.1 96
Source: MHNF 2000a
Channel forming processes in Reach 4 and the remaining perennial and intermittent tributaries would
remain largely unaffected. With the exception of Brooks Meadow Creek, where the pipeline access road crosses through its lower reach. It would be restored to flow through a culvert underneath the access road,
providing passage for aquatic organisms and improving the functionality of this short segment. The
streamflow would be free-flowing and no longer hindered.
As observed in the 2000 stream survey, the abundance and density of large woody debris in all reaches of
Dog River would likely remain low to moderate compared to the LRMP standards (Table 35). But the
density of LWD would continue to meet the NMFS standards in all reaches. Since then, inputs of woody
debris have continued to accumulate. Small wood pieces would likely continue to dominate the total percentage of wood in the stream. Some of the small wood will remain a component of debris jams, but
the majority of it would likely continue to be individual pieces. The in-stream abundance and density of
woody debris would be expected to continue to gradually increase for all size classes because the potential for future recruitment from the inner riparian zone is good to excellent along most of the main
stem, and the inner riparian zone for all reaches is dominated by late- and mid-seral forest structure.
Table 35. In-channel woody debris and woody debris density amounts (total of both medium and large size classes) observed in the 2000 Dog River stream survey.
Source: MHNF 2000a
Construction along the route of the new pipeline would remove trees. The segment of the new route between the diversion and FSR 44 would be within, or on the edge of the out riparian zone. This would
diminish the availability and potential recruitment of large wood taken from the construction corridor on
the east side of that segment. But the inner riparian zones along both sides of the stream, and the outer zone of the west side would remain intact and undisturbed. Recruitment potential from those zones would
remain high, so the overall impact of construction on recruitment of large woody debris along Reach 3 of
upper Dog River would be minimal.
Data from the 2000 stream survey are useful for interpreting the effects of the modified flow regime on the potential transport, distribution, and accumulation of in-stream woody debris under the Proposed
Action. There were 103 debris jams counted during the stream survey of Dog River in 2000 (Table 36).
Twenty-four percent of the total wood inventoried was in these jams. Of the wood in debris jams, 47
percent was in the small size category, 31 percent in the medium size class, and 22 percent in the large
size class.
Reach
Number of Pieces
In-Channel Density per Mile
Density per Mile
Standards
Small Medium Large Total Medium Large Total LRMP NMFS
1 71 40 78 189 16.7 26.7 43.4 106 20
2 119 47 55 221 18.6 21.7 40.3 106 20
3 226 123 47 396 39.2 15 54.2 106 20
4 153 119 43 315 64.8 23.4 88.2 106 20

108
Table 36. Existing number of in-channel woody debris and where it was located either as isolated pieces (single) or in debris jams.
Reach # of Debris
Jams
Total Pieces of Woody Debris
Small Medium Large
Single Debris
Jam
Single Debris
Jam
Single Debris
Jam
1 16 52 19 30 10 56 22
2 15 95 24 40 7 44 11
3 22 199 27 108 15 40 7
4 50 99 54 70 49 26 17
Source: MHNF 2000a
The total amount of in-stream debris jams inventoried suggests that the capability of the flows in Dog
River in all reaches would continue to transport and distribute woody debris that could accumulate into
jams. But intrinsically, the potential would remain fairly low because the flows and channel size are relatively small. The capability of the winter peak flows that have been attenuated by diversion to
transport medium and larger pieces would remain somewhat diminished. Spring peak flows however,
could be expected to retain most of their potential to transport larger pieces where the channel is wide and deep enough. Transport potential in the Lower catchment would remain higher than the Upper catchment
due to greater mean channel width and depth. In lower Dog River, the potential for maximum peak flows
in both winter and spring to transport and re-distribute medium and large pieces of woody debris would
remain functional.
South Fork Mill Creek
Under the Proposed Action, diversion from Dog River and storage and release in Crow Creek Reservoir
would continue to modify the flow regime in the South Fork Mill Creek subwatershed. Channel forming
processes would remain altered as a result in the main channel. Early- and mid-winter flows, spring flows, and summer flows would continue to be affected most. Direct access to the main channel of South Fork
Mill Creek would remain limited and human perturbation other than water management would be low.
Above the reservoir, average peak flows in early and mid-winter would remain elevated above naturalized levels due to contributions from diversion. Below the dam, they would be attenuated and less than
naturalized rates due to the filling of the reservoir and retention for storage. Average spring peak flows
would remain higher than naturalized above and below the dam because of diversion contributions and
spill combined with release. Base flows above and below the dam would also remain elevated above
naturalized levels due to contributions from diversion and releases downstream.
Elevating average base and peak flows will continue to increase water velocity seasonally and gradually
deepen entrenchment. Width-to-depth ratios could be expected to slowly decrease, and the wetted perimeter enlarge. The short segments of channel where unstable and undercut streambanks were
observed in Reaches 1 and 2 could progressively expand. For these reasons, pool abundance and quality
would remain low (Table 37). Most of the segments in each of these reaches would continue to be fast
flowing, and not conducive to pool formation.

109
Table 37. Observations of Select Channel Characteristics of South Fork Mill Creek from the 2011 Stream Survey Compared to LRMP and NMFS Standards and Guidelines.
Reach Percent
Fine
Sediment
Observed
LRMP
Standard for
Percent Fine
Sediment
Total Pools
per Mile
Primary
Pools per
Mile
LRMP
Standard
Primary
Pools per
Mile
NMFS
Standard
Primary Pools
per Mile
1 5 20 7.9 1.4 76 70
2 23 20 6.3 0.5 115.8 96
3 11 20 0.0 0.0 NA 184
Source: MHNF 2011
Substrate would be expected to remain dominated by coarse gravel. Fine sediment generated by
streambank erosion and incision would essentially be routed through the system by the elevated water
velocity. Although it could continue to accumulate in the few pools or short aggrading segments in
Reaches 1 and 2. Above the dam, the majority of fine sediment generated would most likely continue to
settle in the reservoir, while below the dam it could accumulate behind the Wicks intake structure.
The low overall abundance and density of large wood observed in the 2011 stream survey was low, and
well below LRMP and NMFS standards (Table 38). Since then, woody debris has continued to accumulate. Small wood pieces would likely continue to dominate the total percentage of wood in the
stream. Some of the small wood will remain a component of debris jams, but the majority of it would
likely continue to be individual pieces.
The in-stream abundance and density of woody debris would be expected to continue to gradually
increase for all size classes in the Upper catchment because the potential for future recruitment from the
inner riparian zone is good to excellent along most of the main stem where the inner riparian zone is
dominated by late-seral forest structure. In the Lower catchment, potential recruitment is good along the main corridor of South Fork Mill Creek, but fair to poor in the outer riparian zones where the 1967
School Marm and the 2013 Government Flats fire burned over the forest. Further down, the vegetation
type changes to more scrub-oak and the main stem is comprised of willows and cottonwood.
Table 38. In-channel woody debris and woody debris density amounts (total of both medium and large size classes) observed in the 2011 South Fork Mill Creek stream survey.
Source: MHNF 2011
Data from the 2011 stream survey are useful for interpreting the effects of the modified flow regime on
the potential transport, distribution, and accumulation of in-stream woody debris under the Proposed
Reach
Number of Pieces
In-Channel Density per Mile
Density per Mile
Standards
Small Medium Large Total Medium Large Total LRMP NMFS
1 77 17 3 97 5.8 1.0 6.8 106 20
2 134 37 32 203 8.7 7.5 16.2 106 20
3 10 2 1 13 5.4 2.7 8.1 106 20

110
Action. There were 129 debris jams counted during the stream survey of South Fork Mill Creek in 2011
(Table 39). Debris jams in Reaches 1 and 3 were all comprised of small wood, and 97 percent of the wood
in jams in Reach 2 included small wood.
Table 39. Existing number of in-channel woody debris and where it was located either as isolated pieces (single) or in debris jams.
Reach # of Debris
Jams
Total Pieces of Woody Debris
Small Medium Large
Single Debris
Jam
Single Debris
Jam
Single Debris
Jam
1 32 45 32 17 0 3 0
2 90 47 87 34 3 32 0
3 7 3 7 2 0 1 0
Source: MHNF 2011
The total amount of in-stream debris jams inventoried suggests that the capability of the flows in South
Fork Mill Creek in all reaches would continue to transport and distribute woody debris that could
accumulate into jams. But intrinsically, the potential would remain fairly low above the dam because the
channel sizes are relatively small.
The capability of the attenuated winter peak below the dam, and the capture of woody debris in the
reservoir itself would continue to diminish the redistribute of woody debris through the system. The
enhanced spring peak flows however would continue to be capable of transporting and re-distributing medium and larger pieces where the channel is wide and deep enough. Transport potential in the Lower
catchment would remain higher than the Upper catchment due to greater mean channel width and depth.
Water Quality
For the Proposed Action, water quality would continue to be affected by diverted streamflow from upper
Dog River. The timing and magnitude of diverted flow would continue to be managed close to the status quo so that Crow Creek Reservoir would get filled by early February. Diversion would then be reduced to
a flow that maintains the level of the reservoir through the spring. Then diversion would be increased to
capture all of the base flow through July. The City would maintain a bypass flow of 0.5 cfs from August 1
to October 31.
Dog River
Under the Proposed Action Alternative, only one water quality standard for the designated beneficial uses
of Dog River would remain impaired. Iron would continue to exceed the standard for that constituent, keeping Dog River on ODEQ’s 303(d) list of Category 5 waters identified in their 2012 Integrated
Report. It would remain a non-point contaminant because the source of the quantities detected would still
be unknown. It has been surmised that iron may be naturally occurring, and its presence could be due to
the geologic formations that underlie the area (ODEQ 2017c). Other impairments would not be expected to result from the Proposed Action, and no other point source or non-point source pollutants,
contaminants, or water quality exceedances would be anticipated.
The seasonal trends in stream temperature observed at the mouth of Dog River would be expected to continue (Figure 37). Stream temperature would not be affected by the Proposed Action. Dog River
stream temperatures would remain cold both above and below the diversion year-round, rarely exceeding
water quality standards for temperature, and meeting the ODEQ requirements for fish and aquatic life
beneficial uses. Due to the presence and use by salmon and steelhead of the lowest 2.5 miles of Dog

111
River, and because of the temperature TMDL for the Middle Columbia - Hood River basin, monitoring of
stream temperature would continue to be ongoing by the MHNF.
Figure 37. Daily average temperature data observed in Dog River upstream of the confluence of the East Fork Hood River.
Source: CTWS 2017
The potential for Dog River to provide cold-water thermal refuge for aquatic species would remain high because of the groundwater inputs from springs and wet meadows. Cold water contributions to lower Dog
River from Puppy and Brooks Meadow Creeks would also continue. Dog River would remain a cold
water source for the East Fork Hood River in the low flow periods of late summer and early fall, including when full diversion into the pipeline would occur upstream at RM 6.0. Lower Dog River could
be expected to remain a likely location as a core cold water habitat.
Residual effects to riparian shading from past forest management would continue to be negligible in the
Dog River subwatershed. Average solar radiation to the main stem and its tributaries would remain low overall, and the majority of the length of Dog River would continue to be effectively shaded. Segments of
reaches where shade was lacking would remain, and include two older clearcut plantations along
approximately 0.4 miles of lower Dog River where riparian vegetation had been encroached upon during the original harvest in the 1970s, and where several small patches of streamside blowdown occur in both
the lower and upper reaches. Natural recovery along these segments from growing streamside vegetation
would be expected to continue.
Construction of the new pipeline would result in the removal of trees along its route. The segment below
the diversion to FSR 44 would mostly be within, or on the edge of the outer riparian zone. Potential shade
would be removed from the construction corridor where it overlaps the out riparian zone. The inner
riparian zone would remain unaffected, and continue to function as a primary source of shade. At the crossing with Brooks Meadow Creek, trees would be removed to install a culvert the stream would flow
through. Tree removal at the site would occur in the inner riparian zone, diminishing shade function. But
the stream would flow inside the culvert, which would provide shade. Overall, the effects of tree removal
for construction of new pipeline would be nominal.

112
The degree of fine sediment that can potentially enter stream waters in the subwatershed would be
generated from the same sources. The greatest potential would continue to come from roads at four crossings over perennial streams. The largest source would continue to be where Highway 35 crosses over
lower Dog River. The potential for road grime and grit, as well as winter sanding materials to wash into
the stream waters there would remain very high.
Two other crossings, where FS road 44 crosses over Dog River and where FS road 17 crosses over
Brooks Meadow Creek would also remain sources of potential fine sediment. Both however, are paved
crossings where use is seasonal, sporadic, and relatively low. So the amount of road grit and fine sediment
potentially generated at these crossings that could enter stream water would remain relatively low.
The fourth crossing, where Brooks Meadow Creek flows across the top of gravel pipeline service road,
would be restored as a result of the Proposed Action. Streamflow would be routed through a culvert
underneath the road. The potential for fine sediment to enter stream waters from the crossing would be
notably reduced, and it would no longer be a chronic source of fine sediment.
Construction of the new pipeline would excavate and expose soils to erosive forces for a time until the
project was completed. The pipeline intake, the segment of the new pipeline route below the diversion down to FSR 44, and the segment across Brooks Meadow Creek would be the most prone locations.
Erosion control practices and BMPs would be implemented to minimize the amount of fine sediment that
could potentially be delivered to Dog River and Brooks Meadow Creek. The inner riparian zone would remain intact and undisturbed along the length of the segment between the diversion and Brooks Meadow
Creek, buffering effects of construction. At both the diversion and Brooks Meadow Creek, construction
would minimize contact with water so that any sedimentation that could occur would be short-lived and
of low magnitude.
The new pipeline under the Proposed Action would eradicate the persistent water loss that leaked from
the old conveyance. Surface and gully erosion would no longer result from pipeline leaks, particularly
during high flows. The potential for leaks to erode flow routes and deliver fine sediment to intermittent or perennial streams would be abated. Additionally, a new pipeline would make the risk of catastrophic
failure very low, diminishing considerably the potential for fine sediment and elevated turbidity to affect
water quality due to a pipeline failure.
South Fork Mill Creek
Under the Proposed Action, existing effects to the water quality of South Fork Mill Creek would remain
unchanged. There would continue to be no impairments to the designated beneficial uses. Other than
seasonal or storm variation the quality of the stream water in the creek would be expected to remain very
good. Occasionally, high concentrations of coliform could be expected to be detected by the City at the Wicks Water Treatment plant, probably originating from wildlife fecal contamination. In the past, they
have also detected slightly elevated concentrations of phosphorus, possibly from accumulated sediments
in the reservoir. But the dilution provided by the inflow of water from Dog River would continue to abate
any effect that could necessitate special treatment.
The seasonal trends in stream temperature observed below the Crow Creek Reservoir would be expected
to continue (Figure 38). Stream temperature would not be affected by the Proposed Action. South Fork Mill Creek stream temperatures would remain cold year-round below the dam, rarely exceeding water
quality standards for temperature, and meeting the ODEQ requirements for fish and aquatic life beneficial
uses.

113
Figure 38. Seven-day-minimum and maximum temperatures in South Fork Mill Creek at the USFS boundary (MHNF 1999) below Crow Creek Reservoir.
Just below the dam however, the seven-day summer maximum temperature would continue to commonly
be slightly increased above the 13oC standard (Figure 39). This is thought to result when drawdown
during peak use in the summer would lower reservoir levels, resulting in the potential increase of temperature in the stored water that would be released into the creek. Regardless, stream temperature
would not be considered to be degrading water quality in the South Fork Mill Creek. Due to the
temperature TMDL for the Middle Columbia - Hood River basin, monitoring of stream temperature by
the MHNF would continue.
Figure 39. Summer average daily temperature for South Fork Mill Creek (elevation of 2,500 feet), downstream of Crow Creek Reservoir near the Forest boundary.
Source: MHNF 2017

114
Residual effects to riparian shading from past forest management would continue to be negligible in the
South Fork Mill Creek subwatershed. Average solar radiation to the main stem and its tributaries would remain low overall, and the majority of the length of South Fork Mill Creek would continue to be
effectively shaded. Segments of reaches where riparian shade had been impacted by the Government Flats
wildfire would continue to recover from growing streamside vegetation.
Fine sediment and turbidity would not be expected to become an impairment to the water quality of South
Fork Mill Creek under the No Action Alternative. There would remain however, existing anthropogenic
sources of fine sediment in the subwatershed. The primary sources on Forest Service lands are where certain segments of road connect to the channel network at specific perennial stream crossings, and where
several segments of the upper reach have become slightly more incised, and in the lower reach where
there is some evidence of unstable stream banks.
Three crossings associated with FS road 1721 where it crosses over Stroud Springs, the South Fork of Mill Creek, and at Alder Creek would continue to have the potential to deliver fine sediment to stream
waters. The relative amount of sediment potentially delivered from these crossings would be low because
these crossings are within the Municipal Watershed, which is closed to public use and gets very little traffic. The drainage structures on this road are in good condition, and have been purposefully constructed
to minimize the length of road connected to the stream network. Also, all three crossings are upstream of
Crow Creek Reservoir, where road sediment would be expected to settle and accumulate
A fourth crossing is currently a bridge where FS road 1720-190 crosses the South Fork of Mill Creek
about ¾ of a mile below the dam. It too is within the Municipal Watershed, and seldom used. The amount
of fine sediment that it could potentially generate and deliver to the creek would also be expected to
remain low.
A low-water ford located about 3.5 miles downstream of the dam on non-Federal land has the potential to
generate and deliver fine sediment to the creek. But it too is seldom used. It is not always passable.
Periodically, it could get used during low flow periods when it would be safe to cross over. When crossed by a motorized vehicle, it could be expected that a small measure of sediment is stirred and mobilized.
The duration of the disturbance would be brief, so the amount of sediment generated would be minor and
short-lived.
The hydrologic regime of the South Fork Mill Creek would continue to be altered due to the diverted flows from Dog River, the seasonal spill around Crow Creek dam, and the timed releases from the
reservoir. Average peak and base flows will continue to be elevated, increasing water velocity and stream
turbulence. The channel and streambanks would continue to slowly adjust incrementally. Increases in sedimentation and turbidity could be expected as a result, particularly during the spring spill and late
summer releases. But since the degree of channel incision and bank erosion is not widely extensive after
many decades of an altered hydrologic regime, the amount of fine sediment generated as a result would
continue to remain only a slight increase.
The new pipeline under the Proposed Action would eradicate the persistent water loss that leaked from
the old conveyance. Surface and gully erosion would no longer result from pipeline leaks, particularly
during high flows. The potential for leaks to erode flow routes and deliver fine sediment to intermittent or perennial streams would be abated. Additionally, a new pipeline would make the risk of catastrophic
failure very low, diminishing considerably the potential for fine sediment and elevated turbidity to affect
water quality due to a pipeline failure.
Water Rights
The City of The Dalles would continue to use surface waters certificated by the OWRD for municipal use
from Dog River and the South Fork of Mill Creek, which include the four water rights currently in their name (Table 40). The amount and designated purpose of use authorized under these existing water rights

115
would not be expanded or transferred. The City would continue to have the right to use all of the water in
upper Dog River above the point of the pipeline diversion, and 2 cfs from South Fork Mill Creek above the Wicks water treatment plant. The priority dates for these two surface water sources proceed all other
claims, so they would remain senior to all other water rights from those streams. Because they are decreed
and certificated municipal water rights, they will not be subject to standard forfeiture statutes, and will be
protected against injurious claims (ORS 540.610 and 538.410 respectively).
Table 40. Surface Water Right Certificates for Dog River and South Fork of Mill Creek that are designated for municipal use.
City of the Dalles
Source Application Permit Certificate
Claim, Decree,
or
Transfer
Priority
date
Type of
Beneficial Use
Authorized Rate or
Annual
Volume
Dog River
14954
Hood
River
decree
8/1/1870 Municipal
“All the water in
stream at
point of diversion”
South
Fork Mill
Creek
5691
Mill
Creek
decree
1862 Municipal 2 cfs
Crow
Creek
reservoir
S-43668 S-32479 60410 5/29/1967 Municipal 955 AF
South Fork Mill
Creek,
Dog River
R-43667 R-4988 44917 5/29/1967 Storage for Municipal
955 AF
Source: OWRDb 2019. Note: Definitions: Permit – Applicant has been approved to develop a water source for its
designated beneficial use. Certificate – Applicant has “perfected” and developed the water right as per the
conditions of the permit. The water right has become certified to the holder. Decree – Court issued water right to a
holder.
These water rights would remain the purview of the OWRD, the state authority that regulates and
administers their use and insures consistency with the requirements of Oregon Revised Statutes and
Administrative Rules. OWRD would continue to monitor the City of the Dalles to ensure compliance
with Oregon water laws pertaining to municipal use. The City of The Dalles would continue to report to
OWRD their usage, proposed upgrades or changes, and provide planning documents for review consistent
with the requirements and statutes for municipal water providers.
The Mt. Hood National Forest does not administer or enforce water rights. The Forest’s Special Use
Permits however, which authorize the City to operate and maintain the Dog River pipeline and Crow
Creek Reservoir facilities located on National Forest System lands, would require that all permitted
activities comply with State laws. The Mt. Hood National Forest would continue to rely on the OWRD’s
oversight of the City’s use of water rights for compliance with the applicable State water laws.
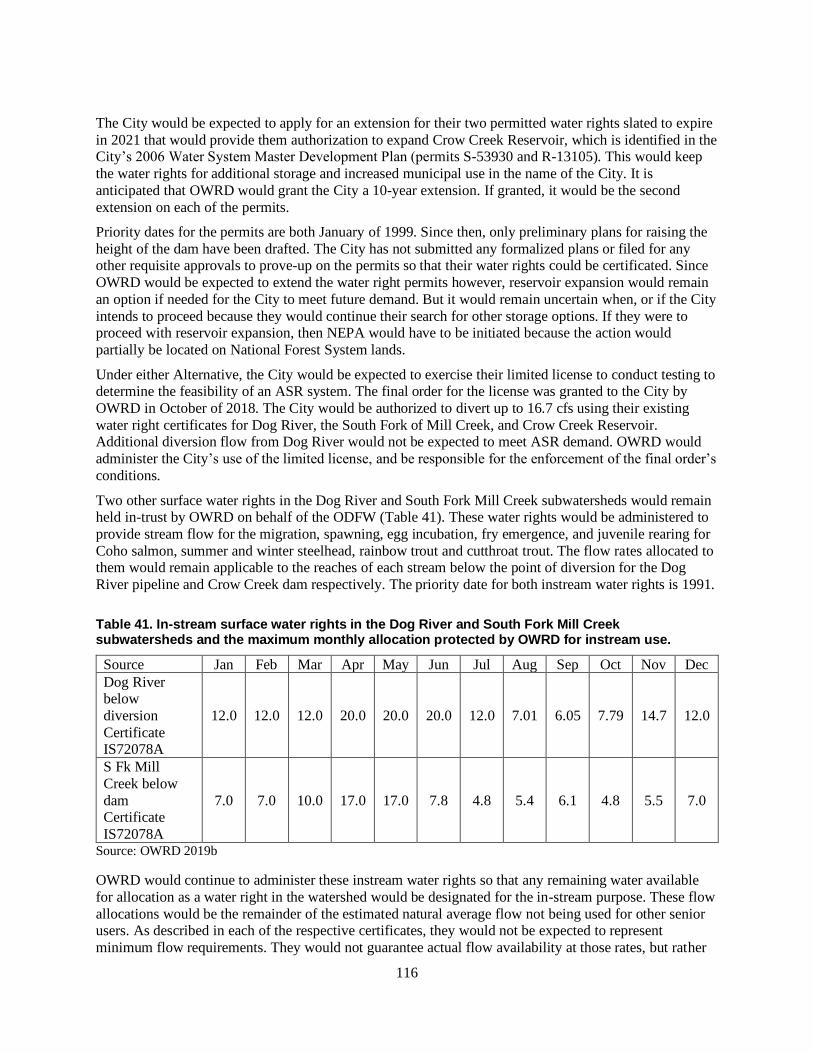
116
The City would be expected to apply for an extension for their two permitted water rights slated to expire
in 2021 that would provide them authorization to expand Crow Creek Reservoir, which is identified in the City’s 2006 Water System Master Development Plan (permits S-53930 and R-13105). This would keep
the water rights for additional storage and increased municipal use in the name of the City. It is
anticipated that OWRD would grant the City a 10-year extension. If granted, it would be the second
extension on each of the permits.
Priority dates for the permits are both January of 1999. Since then, only preliminary plans for raising the
height of the dam have been drafted. The City has not submitted any formalized plans or filed for any other requisite approvals to prove-up on the permits so that their water rights could be certificated. Since
OWRD would be expected to extend the water right permits however, reservoir expansion would remain
an option if needed for the City to meet future demand. But it would remain uncertain when, or if the City
intends to proceed because they would continue their search for other storage options. If they were to proceed with reservoir expansion, then NEPA would have to be initiated because the action would
partially be located on National Forest System lands.
Under either Alternative, the City would be expected to exercise their limited license to conduct testing to determine the feasibility of an ASR system. The final order for the license was granted to the City by
OWRD in October of 2018. The City would be authorized to divert up to 16.7 cfs using their existing
water right certificates for Dog River, the South Fork of Mill Creek, and Crow Creek Reservoir. Additional diversion flow from Dog River would not be expected to meet ASR demand. OWRD would
administer the City’s use of the limited license, and be responsible for the enforcement of the final order’s
conditions.
Two other surface water rights in the Dog River and South Fork Mill Creek subwatersheds would remain held in-trust by OWRD on behalf of the ODFW (Table 41). These water rights would be administered to
provide stream flow for the migration, spawning, egg incubation, fry emergence, and juvenile rearing for
Coho salmon, summer and winter steelhead, rainbow trout and cutthroat trout. The flow rates allocated to them would remain applicable to the reaches of each stream below the point of diversion for the Dog
River pipeline and Crow Creek dam respectively. The priority date for both instream water rights is 1991.
Table 41. In-stream surface water rights in the Dog River and South Fork Mill Creek subwatersheds and the maximum monthly allocation protected by OWRD for instream use.
Source Jan Feb Mar Apr May Jun Jul Aug Sep Oct Nov Dec
Dog River below
diversion
Certificate IS72078A
12.0 12.0 12.0 20.0 20.0 20.0 12.0 7.01 6.05 7.79 14.7 12.0
S Fk Mill
Creek below
dam Certificate
IS72078A
7.0 7.0 10.0 17.0 17.0 7.8 4.8 5.4 6.1 4.8 5.5 7.0
Source: OWRD 2019b
OWRD would continue to administer these instream water rights so that any remaining water available
for allocation as a water right in the watershed would be designated for the in-stream purpose. These flow
allocations would be the remainder of the estimated natural average flow not being used for other senior users. As described in each of the respective certificates, they would not be expected to represent
minimum flow requirements. They would not guarantee actual flow availability at those rates, but rather

117
reflect the maximum allocation protected for the instream beneficial use by the water right. As a condition
of the certificate, they would not have priority over human consumption. They would be considered by OWRD to be junior to the City of The Dalles municipal water rights in Dog River and South Fork Mill
Creek.
The City of The Dalles’ water rights for Dog River and the South Fork of Mill Creek would remain senior
to any federal reserved water rights because their priority pre-dates that of the establishment of the Mt.
Hood National Forest (OWRD 2002). Any claims by the Forest Service to such rights would be subject to the state’s adjudication process. The Forest Service would not be expected to submit any claims or
assertion for federal reserved water rights in the Dog River and South Fork Mill subwatersheds.
3.3.2.3 Cumulative Effects
The spatial consideration of the cumulative effects for hydrology is limited to the Dog River and SF Mill
Creek 12th-field subwatersheds. This was chosen because the potential for detecting measurable cumulative effects at this scale is better than at larger scales. Consideration of effects at larger scales was
not assessed because the order of magnitude of the larger watershed size could potentially render any
quantitative magnitude of cumulative effects inconsequential, and because the complexity of land uses at
the larger scale could blur the certainty of effects attributable to an individual activity. The temporal bounds for the analysis is from the present to the foreseeable future when projects associated with existing
decisions, funding, or identified proposals would be undertaken. The projects to be considered for
cumulative effects are listed below in Table 42. Table 43 summarizes the cumulative effects of ongoing activities that have the potential to affect water quantity and/or quality in Dog River and/or SF Mill
Creek.
Table 42. Ongoing and Future Activities Considered in the Cumulative Effects Analysis for Hydrology.
Activity Dog River Subwatershed South Fork Mill Subwatershed
Existing old Forest Service timber harvest units X X
Polallie Cooper Fuels Reduction Project X
The Dalles Watershed Phase I and II Fuels Reduction Project
X
Other timber harvests on federal, county, and private lands (including associated road/landing construction)
X
Forest Service road 4400 hazard tree removal X
Road decommissioning and road closures X X
Dog River pipeline and Crow Creek reservoir annual operations
X X
National Forest system road & trail maintenance X X
Highway 35 highway maintenance and sanding X
Invasive plant treatments X
Trail relocations (Dog River Trail #675, Cooks Meadow Trail #639, Surveyor’s Ridge Trail #688)
X
Developed and dispersed campsites X X
The contribution of the Proposed Action to the cumulative effects on hydrologic resources of past and
ongoing/future activities within the Dog River and SF Mill Creek watersheds would be minimal because
the construction footprint is comparatively small and the duration of that activity is short-term. Construction would require the removal of existing trees along the pipeline route, the majority of which is
directly adjacent to existing roads. Clearing widths for the construction corridor and staging/storage areas

118
would amount to less than 0.01 percent of either of the subwatersheds acreage. A small portion of that
disturbance footprint would occur within the upper Dog River riparian reserve near the existing intake, and trees would be removed along several hundred yards of the outer riparian zone on the east side below
the diversion. The resultant increase in the extent of cumulative watershed impact areas would be
nominal.
Given that both Dog River and the SF Mill are designated as Special Emphasis Watersheds in the MHNF
LRMP), management actions on Forest service lands within them would remain limited both spatially and
temporally. No more than 25 percent of the watershed area would be in a hydrologically disturbed condition at any time. The Special Emphasis designation and LRMP guidelines would serve as controls
that limit the extent of potential impacts from ongoing or future activities within the watersheds.
Additionally, none of the activities listed in Table 42 would be expected to result in large measurable
effects to the existing hydrologic regime in either of the watersheds. Implementation of any activities could be presumed to employ BMPs and PDCs intended to avoid and minimize impacts to hydrologic
resources.
Furthermore, pipeline operations once construction is complete would continue as they have, and the amount and timing of diverted water would be expected to remain unchanged from the current condition.
Ongoing primary water operations include maintenance and monitoring of facilities, controlling and
managing seasonal diversion and reservoir levels. Exploration of the feasibility of Aquifer Storage and Recovery would occur using existing available water from SF Mill Creek as per OWRD permit
conditions. Standard annual road maintenance services in SF Mill Ck by the City would continue. There
would not be any further removal of forest vegetation, nor any new roads. No increases in administrative
activities would be expected. Changes to pipeline operations and the rate of diversion could be expected in the future to meet rising demand due to a steady increase in population, and/or shifts to the available
supply of water as a result of projected climate change (cumulative effects, same as PA).

119
Table 43. Summary of cumulative effects on water quantity and quality resulting from past, current and future projects in the Dog River Pipeline EA action area. Only activities that have a potential for cumulative effect are addressed in this table.
Project Potential
Effects
Overlap in Measurable
Cumulative
Effect?
Activities or
Conditions
Relative
Magnitude of
Cumulative
Effect Time Space
Existing old
Forest Service
timber harvest
units
Altered
peak and/or
base flow
No Yes Not likely
Older harvest units were replanted and
have been growing
and naturally
revegetating for at
least two or more
decades. Effective
ground cover is
essentially 100%,
and the forest canopy
continues to develop
and mature. The mix
of disconnected early- and mid-seral
patches constitute a
small proportion of
each subwatershed.
Evapotranspiration
and watershed
processes
functioning properly.
Minimal
cumulative effect
throughout action
area because the
harvest and
replanting took
place long ago and regrowth has been
occurring for many
years.

120
Project Potential
Effects
Overlap in Measurable
Cumulative
Effect?
Activities or
Conditions
Relative
Magnitude of
Cumulative
Effect Time Space
Water
Quality
Degradation
No Yes Not likely
The majority of older
harvest units were
located away from
streams and riparian zones. The few units
that did encroach on
riparian forest along
perennial streams
were replanted and
have been growing
and naturally
revegetating for at
least two or more
decades. Effective
ground cover is
essentially 100%, and the forest canopy
continues to develop
and mature.
Vegetation in the
primary riparian
zone functioning to
provide shade and a
mix of growing,
disconnected and
scattered early- and
mid-seral patches for potential future
wood recruitment.
Minimal
cumulative effect
due to relatively
small amount of
perennial stream
impacted in
riparian zones and the re-growth and
vegetative
development that
has occurred since
harvest.
Polallie Cooper
Fuels Reduction
Project
Altered
peak and/or
base flow
Yes Yes Not likely
Approximately 90
acres would be
thinned in the Dog
River subwatershed
as part of the Keep
Stewardship
contract. None of it
would be located
within or near
riparian areas/forest.
No new roads proposed.
BMPs/PDCs to
avoid and minimize
impacts to water
quality would be
employed.
Nominal
cumulative effect.
Thinning would
affect less than 1
percent of the
subwatershed area.
No riparian
areas/forest affected. Only
existing roads
would be used.
Water
Quality
Degradation
Yes Yes Not likely

121
Project Potential
Effects
Overlap in Measurable
Cumulative
Effect?
Activities or
Conditions
Relative
Magnitude of
Cumulative
Effect Time Space
The Dalles
Watershed Phase I
& II Fuels
Reduction Project
Altered
peak and/or
base flow
No Yes Slightly
possible
All projects have
been completed
except for some
slash pile burning. BMPs/PDCs to
avoid and minimize
impacts to water
quality were
employed. All
streams and riparian
zones were buffered
by Northwest Forest
Plan Riparian
Reserves. Extent of
thinning acres was
low, and degree of canopy reduction
moderate. Stand
growth and vigor
ultimately enhanced.
Ongoing
development and
growth of forest
stands with greater
complexity and
resiliency expected.
Low cumulative
effect. Total area affected by a
decrease in
effective canopy
cover about 13
percent of the
subwatershed.
Buffers protect
streams and
riparian vegetation
from effects of
thinning. Only the existing road
system was used.
Post-harvest
repairs and
improvements
were made to
drainage features
and structures.
Degradation
of Water
Quality
No Yes Not likely
Other timber
harvests on
federal, county, or
private lands
Altered
peak and/or
base flow
No Yes Possible
Timber management activities have
occurred, and could
be expected
periodically on non-
Forest Service lands
in the lower
Minimal cumulative effect
because of small
proportion of the
watershed
expected to be
affected in any

122
Project Potential
Effects
Overlap in Measurable
Cumulative
Effect?
Activities or
Conditions
Relative
Magnitude of
Cumulative
Effect Time Space
Degradation
of Water
Quality
No Yes Possible
catchment of the
South Fork Mill
subwatershed where
BLM, City and privately-owned
forest industrial
lands are intermixed.
Oregon Forest
Practices rules that
buffer streams and
riparian areas would
be in play on non-
Federal lands.
Timing and extent of
harvest limited by
availability of merchantable stands.
Currently, less than
half the forested,
non-Federal acreage
is estimated to be
available in any
given decade. The
need for new road
construction
expected to be
limited to minor spurs. Road
maintenance and
reconstruction
expected to remain
minimal. Current
road system
connected to the
drainage network at
multiple locations.
Drier east-side
climatic conditions
prevailing.
given decade.
Order of
magnitude
estimated to be less than several
hundreds of acres
at any one time.
Harvested areas
would be re-
planted within 3
years. Drinking
water source area
protections in play
within the
municipal
watershed. Regrowth in
previously
harvested areas
expected to
continue and
develop, and
effective ground
cover reestablish
and be maintained.
Forest Service
road 4400 hazard
tree removal
Altered
peak and/or
base flow
Yes Yes None
Thinning dense
thickets, and removal
of hazard trees along
a 100 foot-wide strip
both sides of a 2-
mile segment of
Forest Service road
Nominal
cumulative effect.
Approximately 24
acres to be treated.
No work in
riparian zones.
Minimal ground

123
Project Potential
Effects
Overlap in Measurable
Cumulative
Effect?
Activities or
Conditions
Relative
Magnitude of
Cumulative
Effect Time Space
Degradation
of Water
Quality
Yes Yes None
44. Minor amount of
removal of trees
greater than 21
inches DBH. Lop and scatter slash.
Primarily hand work.
BMPs/PDCs would
be employed to
minimize impacts.
disturbance, nearly
all hand work.
Vegetation and
effective ground cover would
continue to grow
and develop once
completed.
Road
Decommissioning
and Closures
Altered
peak and/or
base flow
No
Yes
None
Road
decommissioning
within Dog River
and SF Mill Creek
has been completed.
All roads within The Dalles Municipal
watershed are closed
to the public, with
the exception of
several short spurs in
upper Dog River.
Nominal
cumulative effect.
Effective ground
cover has been
established on
decommissioned
roads, and they
have stabilized. There is little to no
connectivity to any
water bodies. Road
closures continue
to limit use, which
minimizes traffic
generated dust or
sediment.
Degradation
of Water
Quality
No Yes None
National Forest
system road and
trail maintenance
activities
Altered
peak and/or
base flow
Yes Yes Not likely Standard activities
include periodic and annual inspections,
removal of obstacles
such as fallen trees
or rocks, maintaining
functional drainage
features and
structures, trimming
encroaching
vegetation, and tread
repairs. Work
typically occurs
during the summer and fall. Wet
weather activities are
avoided.
Nominal
cumulative effect.
Work would be
periodic, non-repetitive, and
short-lived. The
disturbance
footprint would be
select segments as
needed. Locations
could be different
from year-to-year.
Maintenance
actions are
typically intended
to improve conditions, and
mitigate chronic or
episodic effects to
hydrologic
resources.
Degradation
of Water
Quality
Yes Yes Not likely

124
Project Potential
Effects
Overlap in Measurable
Cumulative
Effect?
Activities or
Conditions
Relative
Magnitude of
Cumulative
Effect Time Space
Highway 35 maintenance and
winter sanding
Altered
peak and/or
base flow
Yes Yes Not likely
Sanding of the
highway with
crushed aggregate to
enhance traction for motor vehicles
occurs regularly
during winter
months. Traffic use
and snow-plowing
causes sanding
materials to build up
to depth on the
shoulder and sides of
the highway. In the
spring, efforts are
taken to remove and recover a portion of
that build-up, but an
estimated one-third
to half of it is
unrecoverable and
remains on site. A
substantial
proportion of the
unrecoverable
sanding materials
that end up on the bridge over Dog
River eventually get
mobilized and are
deposited into the
water.
Cumulative impact to Dog River is
considered to be at
least moderate in
the reach below
the bridge.
Changes to the
river’s substrate
from the sanding
are observable in
that reach, which
is a low gradient
depositional channel type. The
effect is limited in
extent, and is an
impact only to the
lowest 1/8 mile of
the total 10.7 miles
of stream length.
Sanding has been
long practiced on
the highway, and
can be expected to continue long-
term.
Degradation
of Water
Quality
Likely
Invasive Plant
Treatments
Altered
peak and/or
base flow
Yes Yes No
These activities are
ongoing in the NF
and SF Mill Creek
and were approved
under a CE.
BMPs/PDCs would
Cumulative effects
would be slight.
No treatments near
water. Chemical
amounts and
concentrations to

125
Project Potential
Effects
Overlap in Measurable
Cumulative
Effect?
Activities or
Conditions
Relative
Magnitude of
Cumulative
Effect Time Space
Degradation
of Water
Quality
Yes Yes Slightly
possible
be employed with
any chemical
application to avoid
water bodies, including spill
prevention and
response plans. State
certified applicator’s
license required.
Treatments would be
administered by
hand.
be used in a single
year would be low.
Follow-up
treatments could occur a year or two
after initial
application.
Potential
accumulations on
sites with follow-
up treatments
would be isolated.
Trail Relocations
(Dog River Trail
#675, Cooks
Meadow Trail
#639, Surveyors
Ridge Trail #688)
Altered
peak and/or
base flow
Yes Yes Not likely
The Cooks Meadow
trail re-route has
been completed, and
most of the
Surveyor’s ridge reroute is also
finished. The Dog
River trail reroute
would be expected
after Keep
Stewardship sale has
been completed.
Rerouted segments
would be completed
using BMPs/PDCs to
minimize impacts to water, and new
segments would be
constructed so that
the trails are
disconnected with
any water/streams.
Cumulative effects
would be low. The
potential
connectivity of the re-routed segments
with a water body
is poor. Length of
trail potentially
connected to a
water body is
short. Drainage
features and
structures designed
into the trail
segments would be
intended to disperse
concentrated flow
and prevent
erosion of the
tread.
Degradation
of Water
Quality
Yes Yes Slightly
possible
Developed and
Dispersed
Campsites
Altered
peak and/or
base flow
Yes No No
There are no
developed campsites
in the Dog River or
SF Mill Creek
subwatersheds, but
there would be 2 developed trailheads.
Dispersed campsites
are present only in
the Dog River
subwatershed.
Cumulative effects
would be nominal.
Developed
trailheads are not
located adjacent to
any water bodies.
Dispersed sites are located on ridges
and on spur roads,
but none are
connected to
water.
Degradation
of Water
Quality

126
3.3.3 Consistency Determination
Several key existing plans provide direction in the form of Standards and Guidelines (S&G) and
recommended Best Management Practices (BMP) for planning and implementing projects. These documents include the Mt. Hood National Forest Land and Resource Plan (LRMP) (USDA 1990), and the
Northwest Forest Plan (NWFP) and associated supporting documents (USDA 1994). A summary of
S&G’s and BMP’s from these documents applicable to water quality and quantity are displayed below in Table 44. As indicated in Table 44, the Proposed Action is considered to be consistent with all of the
applicabl;e S&Gs that address water quality and quantitiy.
Mt. Hood National Forest Land and Resource Plan Standards and Guidelines that
Address Water Quality and Quantity:
o Consideration of BMP’s – FW-54,55,56,57,58,59,60
o Analysis considerations – FW-61,62,63,64
o Special Emphasis Watershed Allocations – FW-65,66,67
o Consideration of drinking water protection – FW-72,75,76 o Consideration of Water Use and Rights – FW-73
o Consideration of instream flows – FW-74
o Consideration of water temperature and sediment – FW-97,98,99,100,109,110,111,112,113,114,127,128,129,132,133,134,135,136
Table 44. Assessment of Consistency with Forest Plan Standards and Guidelines that Address Water Quality and Water Quantity.
S&G No. Applicable Standards
and Guideline
Consistent
with S&Gs?
Comments
FW-54 to FW-60
Consideration of BMPs and compliance with
Oregon State
requirements (Oregon Administrative Rules,
Chapter 340-41)
established in accordance with the
Federal Clean Water Act
(1977, amended 1987)
Yes
BMPs and PDCs (project design criteria) have been developed and
prescribed in the EA to prevent or
minimize effects to water quality, and are consistent with the 2019 MOU
with the State of Oregon DEQ.
FW-61 to FW-67
Considerations of cumulative effects and
Special Emphasis
Watersheds Yes
Clearing of forest vegetation for the new pipeline would be limited in
extent, and would not result in an
exceedance of the Threshold of Concern for Dog River or the SF Mill
Creek.
FW-72, 75, 76
Consideration of
drinking water
protection Yes
Municipal water supplies are required
by the State to meet safe drinking water standards. Pollution and spill
prevention BMPs would be employed
during construction activities, and are practices outlined in the City’s

127
S&G No. Applicable Standards
and Guideline
Consistent
with S&Gs?
Comments
operations plans. The majority of the
municipal watershed is also closed to
public entry.
FW-73
Consideration of Water
Use and Rights
Yes
The Forest Service has consulted with the State (OWRD) regarding the
City’s proposal to replace the Dog
River pipeline. The Proposed Action would not violate State water law.
Also, the City’s water right (1870)
pre-dates establishment of National Forest System lands (1908) and is
senior to Federally Reserved water
rights.
FW-74 Consideration of
instream flows
Yes
An MOU (1972) between the City and the Mt. Hood NF designates the
municipal watershed and its
management objectives. Instream flow protections have been identified
by the State below the Dog River
diversion and Crow Creek dam.
Pipeline replacement would not divert flow amounts greater than existing.
Instream water rights below the
diversion would not be violated. The City would provide an additional 0.5
cfs bypass flow to Dog River Aug.
through October.
FW-97,98,99,100,109,
110,111,112,113,1
14,127,128,129,13
2,133,134,135,136
Consideration of water temperature and
sediment
Yes
The majority of the construction would be located outside of Riparian
Reserves except for several key
segments of the route. BMPs and PDCs would be employed during
construction activities to prevent or
minimize effects to water quality. Temperature and sediment have not
been issues resulting from the City’s
operations in the past and are not
expected to be future concerns with
their ongoing use.
Northwest Forest Plan (NWFP) Standards and Guidelines:
• Standards and Guidelines addressing Key Watersheds (NWFP ROD pg. C-7)
• Standards and Guidelines addressing Riparian Reserves (NWFP ROD pg. C-31 through C-38)

128
Table 45. Consistency with Key Standards and Guidelines from the Northwest Forest Plan for Key Watersheds and Riparian Reserves.
Allocation Applicable Standards and
Guideline
Consistent
with S&Gs?
Comments
Key
Watersheds • Reduce road system. No new
roads
• Watershed Analysis requisite
• Watershed restoration
emphasized
Yes
No new roads have been proposed.
Unneeded roads have been identified
and decommissioned in past actions. Roads in the SF Mill portion of the
municipal watershed are closed to
public use. Watershed Analysis was completed in 2000. Watershed
restoration projects have been
identified. A new culvert will
replace a low water ford where the service road crosses Brooks
Meadow Creek, eliminating the
capture of streamflow and providing
passage for aquatic organisms.
Riparian
Reserves • Roads Management
Yes
One half-mile of the 100-year old
access and service road that would
be used during construction is within the outer zone of a Riparian Reserve.
BMPs and PDCs would be
employed during construction activities to prevent or minimize
effects to water quality and the
riparian zone.
Riparian
Reserves • General Riparian
Management
Yes
About 0.8 miles of the new pipeline would be constructed within the
outer zone of the Dog River and
Brooks Meadows Creeks Riparian Reserve, adjacent and parallel to the
100-year old access and service
road. Included within the clearing limits of this construction corridor
are many trees to be removed. The
inner zone of the Riparian Reserve
would remain intact and functional, providing adequate shade and
potential LWD recruitment.
Riparian
Reserves • Watershed Restoration
Yes
A new culvert will replace a low
water ford where the service road crosses Brooks Meadow Creek,
eliminating the interception of
streamflow and providing passage
for aquatic organisms.

129
Additional Considerations for consistency with the objectives of the Aquatic Conservation Strategy
in the NWFP.
• The range of Pacific Ocean anadromy does not extend into the project area, and is limited within the
analysis subwatersheds by natural waterfall migration barriers in the lowest reaches of both Dog
River and SF Mill Creek. So, consistency of the pipeline replacement to the ACS is not directly
applicable. Replacement of the pipeline, however, is upstream within contributing areas of anadromy below, so indirectly consistency is a consideration. As such, construction of a new pipeline is not
considered to be a consistency issue. Operations of the pipeline, and diversion of water into it for
transfer are indirect considerations.
• Application of the NWFP and thus ACS to other contracts, permits, and special use authorizations that pre-date the ROD (1994), will be applied at the time of their renewal. The 1912 Agreement and
1972 MOU between the City and the Mt Hood NF pre-date the ROD, as does the original Special Use
Permit of 1964. The City’s decreed water right has a priority date of 1870 and pre-dates establishment
of the Mt. Hood Nat Forest. Consistency of the City’s water use and operations as authorized under a
SUP would be a consideration at the time of renewal.
• Approximately ¾ of the total construction corridor for the pipeline is outside of Riparian Reserves.
BMPs and PDCs to be employed during construction would be expected to avoid or minimize further
effects to aquatic and hydrologic resources within and outside of Riparian Reserves. Potential effects
from construction would be limited to an approximately 6-month period.
• Water use and operations by the City would not be expected to change substantially as a result of a
new, larger pipeline. Water availability and instream flows downstream of the Dog River pipeline and
Crow Creek reservoir would be maintained. Natural flow that is generated below the Dog River diversion, and the Wicks water treatment plant would continue to provide instream flow available to
support downstream beneficial uses and TES aquatic habitat. Effects of water use and diversion on
the hydrologic and sediment regime, and riparian zone function would essentially remain as they have
for the last 100 plus years.
3.4 Fisheries and Aquatic Fauna
3.4.1 Existing Condition
The affected environment, also known as the action area, is defined as all areas to be affected directly or indirectly by the Federal action and not merely the immediate area involved in the action [50 CFR
§402.02]. For the purposes of this analysis, the action area includes all of the Dog River subwatershed
area downstream of the point of diversion, as well as the South Fork Mill Creek drainage downstream to
Crow Creek Reservoir (Figure 40). This action area includes all areas where ground disturbance would take place for the proposed activities, as well as aquatic habitat areas downstream where potential effects
could occur.
The 6th field watersheds were used as the basis for the site-specific analysis summarized in this BE while the 5th field sub-watersheds were used for larger scale habitat effects analysis. Although subwatershed or
drainage boundaries delineate much of the action area, the actual expected effects will only be realized in
a small portion of the watershed.

130
Dog River
The Dog River subwatershed comprises about 8,142 acres. The highest elevation of the subwatershed is
the top of Lookout Mountain at 6,525 feet, and the lowest elevation at the mouth of Dog River at about 2,105 feet. Average precipitation in this subwatershed has historically ranged between 55 inches annually
at the lowest elevation to 75 inches at the higher elevations. The hydrology of Dog River is driven by
spring (groundwater) contributions during base flow periods, and by the addition of snowmelt during high flow periods, with the majority of runoff taking place in the spring and early summer (May to June). In
addition, there are episodic rain-on-snow events that can cause rapid snowmelt and heavy runoff that can
result in short durations of high peak flow spikes from November to February. The main perennial
tributaries to Dog River are Brooks Meadow Creek and Puppy Creek. Dog River subwatershed is approximately 11 percent of the larger 5th field hydrologic unit of the East Fork Hood River (72,337
acres). Other than the lower ¼ mile, the river channel is steep with an average gradient of 7% and 11% in
the 2 reaches surveyed between RM 0-5.1 (MHNF, 2000a). Base flows are supported by numerous groundwater/spring inputs. The uppermost critical habitat designation ends at RM 2.0, but for this BE,
Listed Fish Habitat (LFH) is delineated to RM 2.6 at a 60’ waterfall (Dog River Falls). The Oregon
Department of Fish and Wildlife (ODFW) considers that, in some years, small numbers of steelhead may
potentially make it up to this waterfall. The subwatershed is largely forested with subalpine fir and pacific silver fir in upper elevations, transitioning to a drier forest made up of grand fir and Douglas-fir, with a
few ponderosa pine, at lower elevations (MHNF 1996).
South Fork Mill Creek
The South Fork Mill Creek subwatershed comprises about 18,240 acres. The highest elevation is about
5,050 feet on Mill Creek Buttes to about 740 feet at the confluence with North Fork Mill creek approximately 7 miles downstream from the National Forest Boundary. Average precipitation in this
subwatershed has historically ranged between about 60 inches annually at the higher elevations, to 17
inches at the lowest elevations to the east. In contrast to Dog River, South Fork Mill Creek has a relatively gentle gradient that averaged 3% and 6% in the 2 reaches within the action area (MHNF, 2011).
Since 1887, South Fork Mill Creek has received input from the Dog River ditch/pipeline, before flowing
into Crow Creek Reservoir. Dog River pipeline contributes roughly 95% of the total annual flow to the creek (MHNF 2011). The USFS Stream survey in 2011 noted 2 very small (unnamed) tributaries on river
right. Both tributaries are spring fed, with one originating from Stroud springs and the other spring
unnamed. At RM 11.1, the Crow Creek Reservoir is a 28-acre impoundment at an elevation of 2,600 feet
and has a maximum depth of 65 feet and a storage capacity of 267 million gallons. There are no LFH within the SF Mill Creek portion of the action area due to Mill Creek falls located at RM 3.0. The
drainage is largely forested with Western hemlock, grand fir, Douglas-fir, and ponderosa pine.

131
Figure 40. ESA action area and extent of Critical Habitat. Note: Red dot with “x” is location of Dog River Falls and upper extent of Listed Fish Habitat.

132
Pipeline Operations
The City of the Dalles has an 1870 state-issued water right for all of the water in the stream at the point of
the Dog River diversion. Peak reservoir fill period occurs from October to early Feb, up to capacity of pipeline (12.3 cfs). In most years, Crow Creek reservoir is filled to capacity by early Feb. In some years
it is full well before that. Not all flow is diverted when filling the reservoir; there is some bypass flow
during this time. Once the reservoir is full, intake is reduced (using a gate screw) to maintain flow to the reservoir that averages 3 cfs (although in winter when the headgate is not very accessible, the City lets
spill over the dam until they can safely access the site). During the dry months of the year (approximately
July through early November) the City diverts most of Dog River flow into the Dog River transmission
pipe (RM 6.0).
Although most of the river flow is diverted during July-November, surface flows are replaced by
groundwater immediately downstream of the diversion. A USFS stream survey from July 26 – August 30
of 2000 noted wetted stream channel in all areas downstream of the diversion. The discharge rate of 8.3 cfs was recorded at the mouth on July 26, 2000. Field visits in August of 2016 and September of 2019
also noted wetted channel immediately below the diversion; directly from leaking wood check boards, as
well as groundwater recharge.
Land Ownership/Allocation
Most of the action area of Dog River and SF Mill Creek is within the Mt. Hood National Forest (MHNF) boundary, with the exception of portions surrounding Crow Creek Reservoir, as well as the lower 1.4
miles of Dog River. Mt. Hood Meadows has ownership from RM 0-0.7 (mouth to Hwy 35 crossing),
while Hood River County has ownership from RM 0.7 to 1.4. The USFS MHNF boundary starts at Dog
River RM 1.4.
On USFS lands, Northwest Forest Plan (NWFP) Land Allocation for the action area is a mixture of Late
Successional Reserve, Matrix, and Riparian Reserve (Figure 3). The upper portion of Dog River (38% of
the subwatershed) and all of the SF Mill drainage is designated as The Dalles Watershed Management Unit, and provides a drinking water source for the City of The Dalles. Due to the high value beneficial
uses of Dog River (drinking water), it was designated as a Special Emphasis Watershed in the MHNF
Land and Resource Management Plan (LRMP; MHNF 2017a).
3.4.1.1 Environmental Baseline
The environmental baseline discussion describes existing aquatic habitat conditions, particularly as they relate to designated critical habitat primary constituent elements (PCE) in the action area; and then
describes Proposed, Endangered, Threatened, and Sensitive Aquatic Species within the action area. Only
those species and associated habitat that are found within the action are discussed and analyzed since
there would be no effect/impact to species/habitat outside the action area.
3.4.1.1.1 Existing Aquatic Habitat Conditions within the Action Area, Including
Designated Critical Habitat and Essential Fish Habitat
The project area has been impacted over the past century by timber harvest, road building, floods, fires,
fire suppression, municipal water diversion, and recreational activities. Separately and cumulatively, these
activities have resulted in loss of function of natural processes related to water quality and quantity,
riparian and floodplain function and connectivity, in-channel habitat, and obstruction free migration corridors for aquatic organisms. As a result of this project, some additional effects to those processes are
possible. Project Design Criteria (PDC) have been developed to minimize those impacts.

133
The section below describes the current condition for habitat indicators that are used to determine
attainment of the Aquatic Conservation Strategy (ACS) as outlined in the Northwest Forest Plan. Additional ACS habitat parameters and/or fluvial processes are analyzed in the Hydrology Specialist
Report.
A baseline determination of functioning, functioning at risk, or not properly functioning is given to each
habitat element that may be affected by the project and summarized in Table 55.
Aquatic habitat data were collected from stream surveys, water quality monitoring, queries of GIS
databases, and watershed analyses. Although the surveys vary in age, all are after 1996, which was the
last major flood event to dramatically change stream habitat conditions (Table 46).
Table 46. Stream Survey Data from the 2000 MHNF Dog River Stream Survey.
Reach
To
River
Mile
Average
Wetted
Width
(feet)
Entrenchment
Ratio
Width-
to-Depth
Ratio
Average
Percent
Gradient
Dominant
Substrate
Rosgen
Channel
Type Valley Form
1 1.8 14.2 2.3 15.6 7 Cobble B3a Narrow V-
shape
2 5.1 13.2 1.5 15.4 11 Gravel A4a+ Narrow V-
shape
3 7.9 8.5 1.7 18.5 3 Gravel B4 Trough-like
open
4 9.8 4.6 2.05 14.9 10 Cobble A3 Trough-like
open
Stream Temperature
Stream temperature plays a critical role in determining metabolic rates, physiological function, and life-
history of aquatic organisms as well as ecological processes such as nutrient cycling and productivity
(Allen and Castillo, 2007). Aquatic species are restricted to temperature ranges that limit their distribution and available habitat. For salmonid species, there is a well-established connection between temperature
and growth rate. Warmer temperatures increase feeding activity and rates of digestion, but also increase
respiratory rates and energetic costs (Allen and Castillo, 2007). The Ultimate Upper Incipient Lethal
Temperature (UUILT) of most salmonids falls within the range 21 to 26°C; however, multiple exposures to sub-lethal temperatures can lead to mortality (McCollough 1999). However, growth and development
can be limited long before temperature approach lethal conditions. For most salmon and trout, the,
preferred maximum temperatures range from 12 – 14 °C, which is close to optimal temperatures for maximum growth efficiency (Brett 1952 as cited in Groot and Margolis 1991).
From 1994-2002, stream temperature data were collected via data logger by the MHNF Hood River
Ranger District at RM 0.1 (Highway 35 culvert) and is displayed in Figure 40. In addition, temperature monitoring from July 7 to October 19, 2000 was conducted as part of a USFS stream survey (MHNF
2000a) that recorded the 7-day maximum temperature remained below 13°Celsius. There are thirty-three
surface water tributaries noted by the 2000 stream survey crew. All tributary temperatures were measured at midday via calibrated handheld digital thermometers for Dog River during the July 26-August 30, 2000
stream survey, with temperatures that ranged from 3-11° C. Most tributaries were 5° C or less. Dog River
flow stays cold year-round due to these numerous cold-water spring contributions. A June 2017 technical
memorandum from the CTWS described Dog River as potential cold-water thermal refuge for salmon

134
species in the East Fork Hood River because of the groundwater inputs from springs and wet meadows
(CTWS 2017). Results from their stream temperature monitoring near the mouth between May 2016 and May 2017 are displayed in Figure 41. That data corroborates the 7-day maximum temperature findings of
the MHNF, and verifies further the cold water contribution of Dog River to the East Fork Hood River,
particularly during inherent low flow periods in late summer and early fall.
Figure 41. Mt. Hood National Forest (MHNF) stream temperature monitoring data (1994-2002) in Dog River just upstream of the Highway 35 culvert (near mouth).

135
Figure 42. Daily average temperature data for Dog River upstream of the Highway 35 culvert (CTWS 2017).
A temperature data logger was installed in South Fork Mill Creek, at the USFS boundary 2.7 miles
downstream of Crow Creek Reservoir (downstream of Action Area), from July 9, 1999 to November 3,
1999, by the MHNF stream survey crew (USFS 1999). Seven-day average minimum and maximum water
temperatures for South Fork Mill Creek did not exceed 13oC (Figure 42). Within the Action Area, handheld temperature readings were regularly taken, totaling 39 readings, as the crew surveyed from
Crow Creek Reservoir to the headwaters of SF Mill Creek (5.2 miles) from September 28 to October 13
of 1999. Readings were all taken at midday. Main channel readings ranged from 4-7 oC, and 3 tributary readings varied from 5-6 oC, including the diversion input from Dog River that was classified as a
tributary.
Figure 43. Seven-day-minimum and maximum temperatures in South Fork Mill Creek at the USFS boundary 2.7 miles downstream of Crow Creek Reservoir (MHNF 1999).
0
2
4
6
8
10
12
14
Te
mp
era
ture
(oC
)
Date
SF Mill Creek 99
7-day max
7-day min

136
Sediment & Substrate Character
Fine sediment deposition and turbidity in streams can adversely affect fish and fish habitat, particularly for salmonids, by reducing the quantity and/or quality of spawning habitat; reducing food supply by
impacting invertebrate habitat; reducing interstitial habitat, thereby decreasing fry survival; and reducing
pool quality and quantity. Both past and on-going land use activities can contribute fine sediment in
streams. The Mt. Hood National Forest Land and Resource Management Plan (forest plan) states that
spawning habitat shall maintain less than 20 percent fine sediments less than 2 millimeters (FW-096).
Fine sediment levels in Dog River are low (Table 47). Substrate data from the 2000 USFS stream survey
showed that small cobbles and coarse gravel are dominant in Dog River; Median particle size (D50) in the
three reaches (RM 0-7.9) were 73.4 mm, 64.7 mm, and 23.4 mm.
Table 47. The percent of surface fine sediment measured by Wolman pebble counts in streams within the Dog River Pipeline Project action area.
Stream Year
Surveyed River Miles
Percent fines
<6mm
Percent fines
<2mm
Dog River 2000 0.0 – 1.8 8 5
Dog River 2000 1.8 – 5.1 17 14
Dog River 2000 5.1 – 7.9 12 10
Substrate data from the 2011 USFS stream survey in South Fork Mill Creek recorded sand (<2 mm)
accounted for 11-23%. Observations by FS personnel noted moderate silt levels that caused some gravel
embeddedness. Coarse gravel (16-32 mm) accounted for 16-31% of the substrate. In the upper most reach, medium gravel (4-16 mm) accounted for 51% of the substrate. Small cobbles and coarse gravel are
dominant in Dog River and gravel is dominant in South Fork Mill Creek. Both streams have low levels of
turbidity although surface fines are slightly high (>20%) in SF Mill Creek.
Chemical Contamination/Nutrients
There are very low potential sources for chemical contamination in the Dog River and South Fork Mill
Creek watersheds. Most of the upper action area is closed to entry within The Dalles Watershed
Management Area. The rest of the area is largely commercial forest land, which also has seasonal
recreation use. There is no agricultural or industrial land in the action area. Oregon Highway 35 is the only (paved) road that crosses LFH. This road is designed to route road surface contaminants onto
vegetated areas. Therefore, chemical contamination is not a process of concern in the action area.
Physical Barriers
There are numerous natural barriers (steep gradients and waterfalls) in both the Dog River Watersheds and Mill Creek. As previously described, these waterfalls act as upstream migration barriers to
anadromous fish. There are no anthropogenic barriers to ESA listed fish in the action area. However,
there are several anthropogenic barriers to resident trout migration in the action area. The diversion structure at RM 6.1 is almost a complete barrier to upstream migration but does allow for downstream
fish passage during higher flow periods. The culvert that passes Dog River under USFS Road 17 is
classified as a year-round migration barrier. And two culverts on Brooks Meadows Creek are barriers
(USFS 1710 Road crossing and USFS 4400 – 014).

137
Large Woody Debris
Action area streams are very close to meeting Aquatic Passage (AP) standards for >20 pieces per mile (Table 48). Recruitment potential along nearly the entire length of Dog River is considered to be good to
excellent. Most of its length flows through lands administered by the Forest Service. The riparian corridor
and upland slopes are heavily forested. Disturbance within the subwatershed has been very minimal, and
there is an abundance of stream-adjacent large standing conifers. The upper reach of Dog River above the pipeline intake is within the designated The Dalles Watershed Management Unit, which is a protected
area with limited access. Along the lower reaches of Dog River below the intake, which are outside of the
watershed management area, access is also somewhat limited. There have been; however, several stands where timber had been harvested about thirty years ago. The lower margins of these two older harvest
units partially encroached upon the riparian zone, though a buffer was left untouched to protect the river
and its banks. This condition applies to about 4 percent of the total length of the riparian corridor. The remaining 96 percent of the corridor has been unaffected by any large-scale disturbance, and the
recruitment potential for large wood is high.
In the South Fork Mill Creek subwatershed, large wood recruitment along riparian corridors is also good.
These stream reaches are all within The Dalles Watershed Management Unit and located on lands administered by the Forest Service downstream to Crow Creek Reservoir. There has been timber harvest
in the form of thinning and fuel reduction projects adjacent to portions of the riparian corridor within the
subwatershed. Intact riparian buffers, however, have not been treated and there remains an abundant source of stream-adjacent large conifers available for potential recruitment. None of the large wood can
move outside the action area into downstream LFH due to the complete barrier at Crow Creek Reservoir
(and dam).
Table 48. The in stream large wood summary for surveyed streams in the Dog River Pipeline Project action area.
Stream Year
Surveyed River Mile
Number of
Pieces
Medium
Number of
Pieces
Large
Pieces per
Mile
Medium
Pieces per
Mile Large Total
Dog River 2000 0.0 – 1.8 40 78 17 27 44
Dog River 2000 1.8 – 5.1 47 55 19 22 41
SF Mill
Creek 2011 11.3 – 15.6 37 32 9 7 16
SF Mill
Creek 2011 15.6 – 15.9 2 1 5 3 8
Pool Frequency and Quality/Large Pools
Pool habitat is a critical component of healthy stream habitat for salmonid populations. The forest plan requires that pool habitat be maintained or increased as a result of a given project (FW-088) and that
streams contain one or more primary pools per five to seven channel widths in low-gradient streams (less
than 3 percent slope), and one per three channel widths in steeper channels (FW-090/091). A primary pool is defined as a pool at least 3 feet deep, which occupies at least half of the low-water flow channel.
Pool frequency is often related to the occurrence of large wood or other channel obstructions
(Montgomery et al. 1995) and pool depth is a function of a variety of factors including sediment input and
the ability of the stream at that site to scour, and maintain, a pool. Fine sediment above natural

138
background levels can fill pools and increase bed mobility, resulting in shallower scour depths
(Buffington et al. 2002).
Pool frequency in all stream reaches within the action area is below AP and Forest Plan standards (Table
49). This is less about intact riparian habitat being able to provide adequate pool-forming wood, and is
rather more indicative of these small streams being transport reaches or are located in naturally riffle dominated canyons. Other than the lower ¼ mile, the Dog River channel is steep with an average
gradient of 7% and 11% in the 2 reaches surveyed between RM 0-5.1 (MHNF, 2000a). South Fork Mill
Creek gradient averaged 3% and 6% in the 2 reaches within the action area (MHNF, 2011).
Table 49. Pool habitat summary for surveyed streams found within the Dog River Pipeline Project action area, including total pools per mile; primary pools (pools ≥3ft. deep) per mile, and the AP standard (pools per mile).
Stream Year
Surveyed River Miles
Total Pools
per Mile
Primary
Pools per
Mile
AP Pools per
Mile Standard
Dog River 2000 0.0 – 1.8 19 5 63
Dog River 2000 1.8 – 5.1 17 5 63
SF Mill Creek 2011 11.3 – 15.6 27 2 70
SF Mill Creek 2011 15.6 – 15.9 0 0 184
Pool quality is a descriptive measure of their suitability for fish and other aquatic fauna. Pools of higher quality are deeper and contain some form of cover for fish (i.e. large wood, undercover bank, water
turbulence bubbles). Pools in the action area generally have adequate cover, temperature regime, and have
not been impacted by fine sediment deposition. Adequate sources of large wood are available for both
long term and short-term recruitment.
Off Channel Habitat and Floodplain Connectivity
Off channel habitat is infrequent because of the steepness of the streams in the action area. Few side
channels are present in Dog River and SF Mill Creek, and they tend to be high energy habitats; there are
few off-channel features such as oxbows or backwaters. Most this is a natural condition due to the confined valley form and steep gradients of Dog River and moderately confined valley for SF Mill Creek,
with the exception of the area at Oregon Highway 35. The highway, at RM 0.7 constricts Dog River
through a 60’ double box culvert and reduces floodplain connectivity and off-channel habitat through this
low gradient (1%) reach.
Refugia
Limited refugia are present within the action area for adult and juvenile spring Chinook salmon, Coho
salmon, and winter steelhead. Most of this is a natural condition due to steep gradients of Dog River, with the exception of Highway 35. The highway, at RM 0.7 constricts Dog River through a 60’ double box
culvert and reduces complexity and refugia habitat through this low gradient (1%) reach.
Intact riparian reserves, conservation areas, ground water upwelling areas, and seeps are present and
protected in the action area. Cold water year-round provides a temperature refugia for resident and anadromous fish in Dog River, although access is naturally limited due to steep gradients and waterfalls.
On SF Mill, a waterfall downstream of the action area prevents any passage of anadromous species into
the action area.
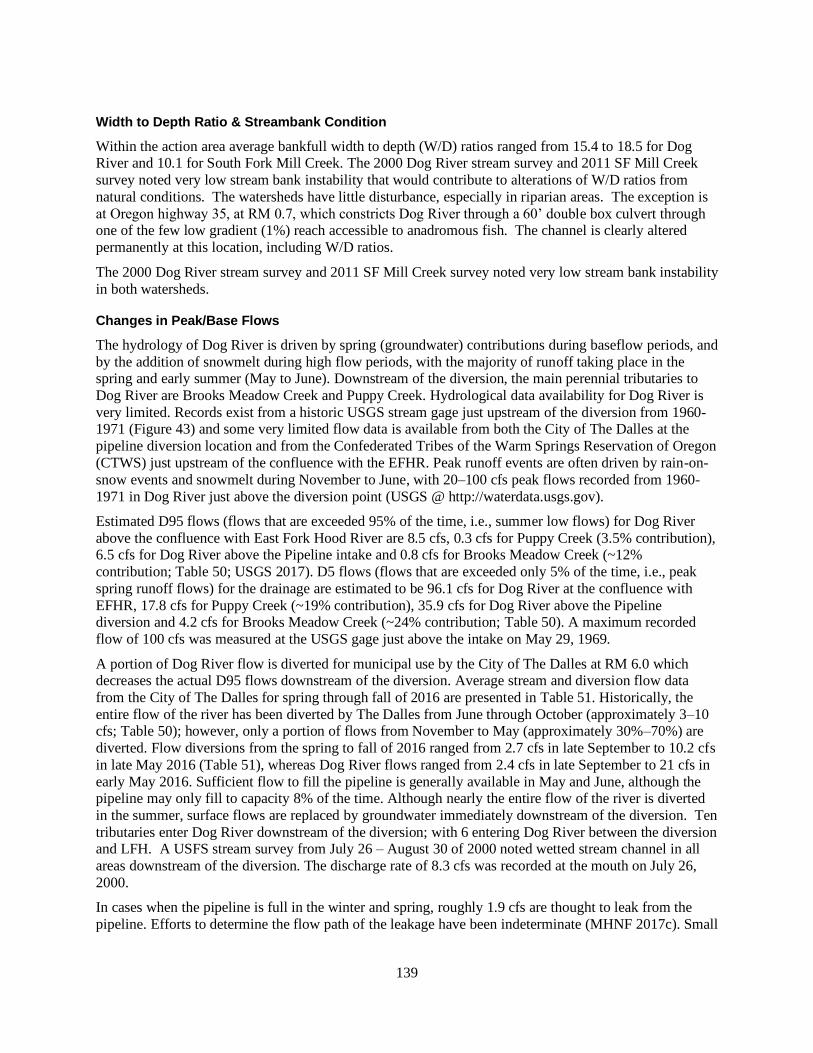
139
Width to Depth Ratio & Streambank Condition
Within the action area average bankfull width to depth (W/D) ratios ranged from 15.4 to 18.5 for Dog River and 10.1 for South Fork Mill Creek. The 2000 Dog River stream survey and 2011 SF Mill Creek
survey noted very low stream bank instability that would contribute to alterations of W/D ratios from
natural conditions. The watersheds have little disturbance, especially in riparian areas. The exception is
at Oregon highway 35, at RM 0.7, which constricts Dog River through a 60’ double box culvert through one of the few low gradient (1%) reach accessible to anadromous fish. The channel is clearly altered
permanently at this location, including W/D ratios.
The 2000 Dog River stream survey and 2011 SF Mill Creek survey noted very low stream bank instability
in both watersheds.
Changes in Peak/Base Flows
The hydrology of Dog River is driven by spring (groundwater) contributions during baseflow periods, and
by the addition of snowmelt during high flow periods, with the majority of runoff taking place in the spring and early summer (May to June). Downstream of the diversion, the main perennial tributaries to
Dog River are Brooks Meadow Creek and Puppy Creek. Hydrological data availability for Dog River is
very limited. Records exist from a historic USGS stream gage just upstream of the diversion from 1960-1971 (Figure 43) and some very limited flow data is available from both the City of The Dalles at the
pipeline diversion location and from the Confederated Tribes of the Warm Springs Reservation of Oregon
(CTWS) just upstream of the confluence with the EFHR. Peak runoff events are often driven by rain-on-
snow events and snowmelt during November to June, with 20–100 cfs peak flows recorded from 1960-
1971 in Dog River just above the diversion point (USGS @ http://waterdata.usgs.gov).
Estimated D95 flows (flows that are exceeded 95% of the time, i.e., summer low flows) for Dog River
above the confluence with East Fork Hood River are 8.5 cfs, 0.3 cfs for Puppy Creek (3.5% contribution), 6.5 cfs for Dog River above the Pipeline intake and 0.8 cfs for Brooks Meadow Creek (~12%
contribution; Table 50; USGS 2017). D5 flows (flows that are exceeded only 5% of the time, i.e., peak
spring runoff flows) for the drainage are estimated to be 96.1 cfs for Dog River at the confluence with
EFHR, 17.8 cfs for Puppy Creek (~19% contribution), 35.9 cfs for Dog River above the Pipeline diversion and 4.2 cfs for Brooks Meadow Creek (~24% contribution; Table 50). A maximum recorded
flow of 100 cfs was measured at the USGS gage just above the intake on May 29, 1969.
A portion of Dog River flow is diverted for municipal use by the City of The Dalles at RM 6.0 which decreases the actual D95 flows downstream of the diversion. Average stream and diversion flow data
from the City of The Dalles for spring through fall of 2016 are presented in Table 51. Historically, the
entire flow of the river has been diverted by The Dalles from June through October (approximately 3–10 cfs; Table 50); however, only a portion of flows from November to May (approximately 30%–70%) are
diverted. Flow diversions from the spring to fall of 2016 ranged from 2.7 cfs in late September to 10.2 cfs
in late May 2016 (Table 51), whereas Dog River flows ranged from 2.4 cfs in late September to 21 cfs in
early May 2016. Sufficient flow to fill the pipeline is generally available in May and June, although the pipeline may only fill to capacity 8% of the time. Although nearly the entire flow of the river is diverted
in the summer, surface flows are replaced by groundwater immediately downstream of the diversion. Ten
tributaries enter Dog River downstream of the diversion; with 6 entering Dog River between the diversion and LFH. A USFS stream survey from July 26 – August 30 of 2000 noted wetted stream channel in all
areas downstream of the diversion. The discharge rate of 8.3 cfs was recorded at the mouth on July 26,
2000.
In cases when the pipeline is full in the winter and spring, roughly 1.9 cfs are thought to leak from the
pipeline. Efforts to determine the flow path of the leakage have been indeterminate (MHNF 2017c). Small

140
leaks have been observed at several sites along the pipeline, but the location of the majority of the loss is
unknown.
Table 50. StreamStats Low Flow Statistics Estimates for Sites within the Dog River Watershed (values are cfs).
Site Name D5 D50 D95
Brooks Meadow 4.2 1.3 0.8
Dog River Above Intake 35.9 11.2 6.5
Puppy Creek 17.8 2.4 0.3
Dog River at Confluence 96.1 23.6 8.5
Source: USGS (2017) Note: D5 represents the streamflow estimated to be exceeded 5% of the time, D50 represents
the streamflow estimated to be exceeded 50% of the time and D95 represents the streamflow estimated to be
exceeded 95% of the time.
Figure 44. Average monthly flow for Dog River immediately upstream of the Dog River Diversion, from 1961 to 1971.
Source: USGS @ http://waterdata.usgs.gov
0
5
10
15
20
25
30
35
40
45
50
Jan Feb Mar Apr May June July Aug Sept Oct Nov Dec
Dog River Monthly Mean (cfs)All available data from USGS gage, just above diversion
1960
1961
1962
1963
1964
1965
1966
1967
1968
1969
1970
1971
Existing capacity
Proposed capacity
1960
19611963
1962
1969 ^100 cfs
19641967
1965 ^ 56 cfs
1966
1968 ^68 cfs
1970
1971
Month and Amount of PeakFlow for gaged years

141
Table 51. Monthly Average Flow for Dog River and the Dog River Pipeline.
May June July August September October
Dog River 15.7 7.7 4.4 3.3 2.7 3.6
Dog River
Diversion 8.1 7.6 4.9 3.5 3.0 3.6
Percent of Dog
River diverted 52% 99% 109% 108% 112% 99%
Note: Values for percent of Dog River diverted that exceed 100% are because of measurement variation. From June
to October 2016, the entire flow of Dog River was diverted into the Dog River Diversion (City of the Dalles).
Very little flow data are available for South Fork Mill Creek. Dam release and spillway flows are
available from the City of The Dalles for 2005 to 2015. Low flow statistics for South Fork Mill Creek,
Crow Creek, and Alder Creek were generated with the USGS StreamStats software (Table 52; USGS
2017). South Fork Mill Creek has an estimated D95 of 0.85 cfs, and Crow Creek has an estimated D95 of 0.28 cfs, which indicates that Crow Creek would naturally contribute roughly one third of the base flow.
The Dog River Diversion commonly transfers approximately 3 cfs to South Fork Mill Creek in the late
summer (when D95 flows are most common) and up to approximately 10 cfs during high flow events in
the winter and spring (see Figure 10 above depicting Dog River and Pipeline flows).
Table 52. StreamStats Low Flow Statistics Estimates for Sites within South Fork Mill Creek Watershed.
Site Name D5 D50 D95
Crow Creek 48.9 2.45 0.28
Alder Creek 19.8 0.95 0.035
South Fork Mill Creek 135 6.66 0.85
Source: USGS (2017) Note: D5 represents the streamflow exceeded 5% of the time, D50 represents the streamflow
exceeded 50% of the time and D95 represents the streamflow exceeded 95% of the time.
A reduction in canopy cover has the potential to influence peak/base flows. A reduction in canopy cover can reduce the volume of stream flow that is taken up by vegetation and lost to evapotranspiration.
Portions of the watershed have been logged in the upper watershed; however, the trees in these patches
have begun to grow back since they were harvested. Aggregate recovery percentage for Dog River subwatershed was calculated as 97.8% in 2015 (USFS, 2016). South Fork Mill Creek is part of the Dalles
Municipal Watershed and is a Special Emphasis Watershed in the MHNF Land and Resource
Management Plan and therefore certain management actions have been taken to safeguard the supply of
domestic water to The Dalles. Management and commercial activities such as road development and timber harvest for fuels reduction have influenced the forested cover of the watershed over the years.
Approximately 7% of the combined North and South Fork Mill Creek Watershed is made up of younger
managed stands with less than 70% cover and an average DBH of less than 8 inches (MHNF 2017a), meaning that despite past timber harvest and wildfire the majority of the forested canopy still functions to

142
intercept rainfall and perform evapotranspiration processes at the watershed-scale. Given the high canopy
cover and low level of disturbance in the action area, it is unlikely that the action area has experienced
increased baseflow or modified peak flows due to forest canopy removal.
3.4.1.1.2 Proposed, Endangered, Threatened, and Sensitive Aquatic Species
within the Action Area
Fish Species Presence / Absence
Dog River, Brooks Meadow and South Fork Mill are all perennial fish-bearing streams. Maximum upper limits for ESA Listed Fish Habitat (LFH) in Dog River ends at RM 2.6, and in South Fork Mill Creek at
RM 3.0; both due to natural waterfalls. Designated Critical Habitat for LCR Chinook ends at ~RM 0.1
(highway 35), LCR Coho at RM 1.4 (FS boundary), and LCR steelhead at RM 2.0. Due to the steep gradient, ODFW estimates that Coho and Chinook distribution currently ends at ~RM 0.2 (Puppy Creek
confluence), while a very small number of steelhead may be able to make it all the way to Dog River
Falls at RM 2.6 in optimal water years. Dog River Falls at RM 2.6 is thus considered the upper extent of
Listed Fish Habitat (LFH) for this BE. Cutthroat trout are present in Brooks Meadow Creek, South Fork Mill Creek and Dog River. Coastal rainbow trout are found in lower Dog River but have not been
documented above the Dog River and Brooks Meadow confluence.
Lower Columbia River (LCR) steelhead (Oncorhynchus mykiss) - Both LCR summer and winter steelhead runs are present in the Hood River Basin; however, only winter steelhead are present in the
EFHR. Steelhead are found in the EFHR and the lower reaches of Dog River (Rod French, ODFW,
personal communication, 2017) including the action area (Figure 40). Adult winter steelhead typically enter the Hood River in early December to mid-June before spawning from mid-January to late June.
Most juvenile steelhead emigrate as age-2 or age-3 smolts and spend 2 years rearing in the ocean before
returning as adults Winter steelhead are found in the East Fork of the Hood River and have been
documented in Dog River and in the East Fork near the confluence of Dog River.
Mid-Columbia River (MCR) steelhead and their critical habitat are present in the North Fork Mill Creek
and South Fork Mill Creek 6th field subwatershed but are not present in the action area. MCR Steelhead
have been documented by ODFW up to Mill Creek Falls (RM 3.0) on South Fork Mill Creek, which is 8 miles downstream of Crow Creek Reservoir. Since LFH for MCR steelhead is not in the Action Area,
this species will not be discussed further in this BE.
LCR Coho salmon (O. kisutch) - There is no artificial propagation program for Coho salmon in the
Hood River Basin. Coho salmon distribution is based on limited survey information obtained from
Confederated Tribes of Warm Springs and ODFW.
Coho salmon are a minority anadromous species in the Hood River compared with Chinook salmon and
steelhead. The number of returning adults varies widely, averaging 243 per year but ranged from 13 to 1020 in the period 1992 - 2009, and a large proportion of the escapement is made up of hatchery strays
from other river systems (Reagan 2011). The unmarked portion of the run each year is only a fraction of
the entire run. For the 2009 run year, the last year Coho were trapped and counted prior to the decommissioning of Powerdale Dam (and fish passage facility), 70 natural and 563 stray hatchery Coho
salmon passed upstream into the Hood River. There is no artificial propagation program for Coho salmon
in the Hood River Basin.
Coho distribution in the Hood River and especially the action area is not as well understood as Chinook salmon and steelhead. Little distribution and spawning survey monitoring has focused specifically on
Coho. Neither CTWS, USFS, or ODFW conduct spawning surveys specifically for Coho but spawning
has been noted in the lower East Fork Hood River and some tributaries. Based on the intermittent presence of juveniles in the action area, successful spawning is occurring, likely downstream in the

143
mainstem East Fork, as well as possibly Dog River in the action area. Spawning surveys in the action
area have included the mouths of Dog River, Puppy Creek, Tilly Jane Creek, and Ash Creek. No Coho spawners were detected in 2014 in these 4 reaches, although juveniles have been noted in CTWS 2010
and 2011 snorkel surveys.
Upper limits for LCR Coho salmon ends at the Puppy Creek confluence with Dog River (RM 0.14) due to steep gradient beyond this point. Listed critical habitat for Coho salmon ends upstream in Dog River at
RM 1.4, at the Forest Boundary.
LCR Chinook salmon (O. tshawytscha) - Chinook salmon in the Hood River basin were extirpated in the mid 1990’s, and a run has been reintroduced originating from the Round Butte hatchery on the
Deschutes River (CTWS and ODFW, 2000). As of 2014, the present Hood River spring-run Chinook
hatchery stock is not an ESA-listed population under the ESA (FR Vol 79: 20802-20817; April 14, 2014).
A final critical habitat designation was published on September 2, 2005, with an effective date of January 2, 2006, and remains unchanged at current time. Distribution and critical habitat of the LCR chinook
evolutionary significant units (ESU) within the action area is shown in Figure 40. EFH in the action area
is commensurate with designated critical habitat. Spring Chinook salmon are present in the action area.
Fall Chinook salmon are found lower in the Hood River Basin outside of the action area.
CTWS has conducted annual spring Chinook salmon spawning surveys since 2008 (CTWS 2017). Redds
have been observed in Dog River eight of the nine years monitored. While spring Chinook spawning is common in Dog River, it appears to be very restricted as all redds have been observed downstream of the
Highway 35 culvert (RM 0.07).
Chinook typically enter the Hood River beginning in April and spawning commences the following
August through September. Numbers of returning spring Chinook salmon adults to the Hood River
averaged 500 per year and ranged from 85 to 1236 from 1992 to 2010.
Upper limits for LCR chinook and Coho salmon ends at the Puppy Creek confluence with Dog River
(RM 0.14) due to steep gradient beyond this point. Designated critical habitat for Chinook salmon stops
at Highway 35 crossing at RM 0.07 in Dog River (Figure 40).

144
3.4.1.1.3 Regional Forester’s Special Status Species List - Sensitive Vertebrates
and Invertebrates July 2015
As part of the NEPA process, the Forest Service reviews programs and activities to determine their
potential effect on sensitive species. Only sensitive species are required to be addressed in a biological evaluation (Forest Service Manual 2670). Distribution, life history, etc. for many strategic species are
poorly understood; thus when they are found while conducting surveys for other species, the Forest
Service requires recording location(s) in corporate databases established by the agency.
Fish Species Presence/Absence
Pacific lamprey - Pacific lamprey are listed as a state sensitive species and a U.S. Fish and Wildlife
Service Species of Concern. Upper limit data for Pacific lamprey is very limited in both the East Fork
Hood River and Mill Creek 5th Field Watersheds. In general, little is known about lamprey presence in the project area or area of influence. The upper limit for Pacific lamprey is presumed to be the lower
reach of Dog River below Dog River falls (Rod French, ODFW, personal communication, 2017). Upper
limits for Pacific lamprey in South Fork Mill Creek is likely Mill Creek falls at RM 3.0.
Pacific lamprey migrate from freshwater streams to the Pacific Ocean, then return upstream to spawn.
Typical spawning habitat is similar to that for salmon or steelhead trout, in medium- and large-sized, low-
gradient Rivers and streams. Lampreys construct a nest (called a redd) in small gravel substrate. Females
can lay up to 100,000 eggs, which are fertilized externally by the male. Adult lampreys die within four days of spawning. Pacific lampreys spend most of their life in freshwater streams before entering the
ocean as adults to feed. Young lamprey burrow into the muddy bottoms of backwater pools and eddies,
where they filter the mud and water. The juveniles, called ammocoetes, live in fresh water for up to 5 or 6 years. Juvenile lampreys are filter feeders. After a two-month metamorphosis they emerge as adults less
than 5 inches long, then migrate downstream to saltwater. In the ocean they grow to 16 to 27 inches
before returning after 1 or 2 years to fresh water to spawn and die. Adults are parasitic on other fish, scavenge, or are predators while in the ocean. Pacific lampreys do not feed while traveling to spawn.
Pacific lampreys are vulnerable to habitat losses due to reduced river flows, water diversions, dredging,
streambed scouring, channelization, inadequate protection of streamside vegetation, chemical pollution
and spills, and impeded upstream passage due to dams and poorly designed road culverts.
Inland Columbia Basin Redband Trout - Inland redband trout may be present in the North Fork Mill
and South Fork Mill Creek 6th field subwatershed, but are not present in the action area. Genetic analysis
of salmonids from mainstem Mill Creek indicated a mixed population of inland redband and coastal cutthroat trout immediately below the confluence of the North and South Forks, predominantly redband
trout. Rainbow trout identified as redband had a high frequency of the redband allele, thus it is assumed
they are the inland variety (Gregg et al., 1995). Progressing downstream, coastal cutthroat trout presence
dissipated giving way to a pure inland redband population. Salmonids in South Fork Mill Creek above Mill Creek Falls are cutthroat trout (USFS, 2000). Redband are not known to be present in Dog River. For
this analysis, resident inland redband trout distribution is assumed to be identical to steelhead distribution
in Mill Creek.
Coastal Cutthroat Trout - Coastal cutthroat trout are known to be present in Dog River up to about RM
8.5 and in Brooks Meadow Creek from its confluence with Dog River upstream to the FS road 17
crossing (RM 0.3). The FS road 17 culvert is considered to be a fish passage barrier. It is not presently known if coastal cutthroat trout are present in Brooks Meadow Creek upstream of FS road 17 crossing.
However, cutthroat trout have been observed in Brooks Meadow (USFS, 1999, MHNF, unpublished
data).
Coastal cutthroat trout are the only salmonids known to be present in South Fork Mill Creek above Mill Creek Falls. Forest Service personnel have observed cutthroat trout while electrofishing and made visual

145
observation of salmonids during surveys in South Fork Mill Creek up to RM 16.3 (USFS, 1999, MHNF,
unpublished data). The Dog River water transmission pipeline can entrain fish at the diversion due to the lack of a fish screen. A 2010 genetic analysis (Smith et al. 2010), conducted by MHNF, ODFW, and
USFWS Abernathy Fish Technology Center, found cutthroat trout tissue samples collected in the Upper
Dog River (above the Dog River diversion headgate), South Fork Mill Creek, and Crow Creek (a tributary
to South Fork Mill Creek) were from the same genetic population group.
Aquatic Macroinvertebrate Presence/Absence
There are three aquatic mollusks and two caddisflies known or suspected to occur on the Forest included on the Region 6 Regional Forester’s 2011 Sensitive Species list (Table 53). In addition, there are four
mollusks and three caddisflies considered strategic species by the Regional Forester. Only the Dalles Juga
is known to occur within the Action Area. Two of the strategic mollusks (Basalt Juga and Columbia
duskysnail) were also listed as Survey and Manage Category A species requiring management of known sites and minimizing inadvertent loss of undiscovered sites (USFS and BLM 2001). For the purposes of
this report/biological evaluation, the only two strategic species discussed further are the Columbia
duskysnail and Basalt Juga since they are Survey and Manage species as described above.
Dalles Juga - This species of aquatic mollusk has been found in Mill Creek and the central and eastern
Columbia River Gorge from Hood River to The Dalles, in Hood River and Wasco Counties, Oregon, and
Skamania County, Washington (Frest and Johannes 1995). The Dalles juga is found at low elevation large springs and small-medium streams with a stable gravel substrate and fast-flowing, unpolluted, highly-
oxygenated cold water. Relatively few macrophytes or epiphytic algal taxa are present, with Rorippa
being the most frequently encountered. The species cannot survive long out of water (Frest and Johannes
1995).
Columbia Duskysnail and Basalt Juga - The Columbia duskysnail and Basalt Juga have been
documented on the MHNF. Prior to summer of 2015 the Columbia duskysnails found on MHNF were
believed to be (Colligyrus sp. nov.), but after DNA analysis was conducted in 2015 by Liu H-P, Hershler R., Rossel C (2015), specimens taken from the Dog River subwatershed (Brooks Meadow Creek), were
determined to be Rocky Mountain duskysnail (Colligyrus greggi), which are not on the 2015 Regional
Forester’s Special Status Species List. Basalt Juga has only been found on MHNF in the North Fork Mill
Creek drainage. Since these two species are Survey and Manage species rather than Special Status
Species, they will not be discussed further in this document.

146
Table 53. Region 6 (R6) special status species either documented or suspected to occur within the Mt. Hood National Forest and within the Dog River Pipeline Project action area (Yes, No, Assumed, Unknown).
Scientific name Common name
Forest
presence
Action Area
Presence
Dog River
Action
Area
Presence
Mill
Creek
Sensitive Species
Entosphenus tridentatus Pacific lamprey Documented Assumed Assumed
Onchorynchus mykiss gairdneri Redband trout Documented No Yes
Onchorynchus clarki Coastal cutthroat trout Documented Yes Yes
Juga hemphilli dallesensis Dalles juga Documented Yes Yes
Juga hemphilli Barren juga – Documented No No
Juga hemphilli maupinensis Purple-lipped juga Suspected No No
Allomyia scotti Scott’s apatanian caddisfly Documented No No
Namamyia plutonis Caddisfly (no common
name) Suspected Unknown Unknown
Strategic Species
Fluminicola sp. nov. (Pinhead) Pinhead pebblesnail Suspected No No
Juga sp. nov. (Basalt) Basalt juga Documented Yes Yes
Juga sp. nov. (Brown) Brown juga Suspected No No
Lyogyrus (Colligyrus) sp.
nov.(Columbia) Columbia duskysnail Documented
Yes Yes
Pristinicola hemphilli Pristine springsnail Suspected No No
Lepania cascada A caddisfly (no common
name) Suspected
No No
Moselyana comosa A caddisfly (no common
name) Suspected
No No
Rhyacophila unipunctata One-spot rhyacophilan
caddisfly Documented
No No
Note: The two species in bold are also Survey and Manage species as outlined in Forest Service et al. 2001.
3.4.2 Effects Analysis
Analysis Assumptions and Methodology
This analysis utilizes research, relevant monitoring, field data, previous experience and professional judgment, as well as GIS information, to provide the context, amount, and duration of potential direct,
indirect and cumulative effects on aquatic resources from the proposed project. The physical scientist
reports on Hydrology provide the basis for the analysis for effects to aquatic habitat. The analysis method utilized to determine potential impact to fish, aquatic invertebrates, and their associated habitat are listed
below.

147
1. Determine known and suspected locations of federally listed or proposed aquatic species,
designated critical habitat, essential fish habitat, Region 6 Regional Forester’s sensitive species and survey and manage species in relation to proposed project activities.
2. Assess proposed project activities and determine the aquatic habitat elements potentially
impacted and the geographic area where effects could occur (i.e., the action area). Project activities include:
o Abandonment of old pipeline/installation of new pipeline
o Installation of aquatic organism passage (AOP) and pipeline crossing at Brooks Meadow Creek
o Installation of fish screen and diversion/outlet structures
o Temporary staging areas/material hauling
o Pipeline operations 3. Overlap the species/habitat locations with the action area and determine which species/habitat
could be affected by project activities.
4. When species/habitat overlaps with the action area, predict impacts from proposed project activities to individuals and their associated habitat. Potential effects to aquatic fauna and habitat
were determined by analyzing the following:
• Direct and/or indirect effects to individuals from proposed activities;
• Potential reductions in stream shade and subsequent increases in water temperature compared
to existing levels;
• Potential increases in erosion and fine sediment input to streams and wetlands compared to
existing levels;
• Potential increases in chemical contaminants/nutrients;
• Presence of physical barriers;
• Potential effects to existing and future levels of large wood in stream channels and riparian reserves, including any effects on large wood recruitment; off-channel habitat and floodplain
connectivity, width/depth ratio, and streambank condition; and quantity and quality of pool
habitat;
• Potential effects to peak and or base flows;
• Cumulative effects associated with ongoing or proposed projects in the action area or close
enough so that cumulative effects could occur.
Effects to the biological resource were determined based on professional experience, data, and literature.
Direct and Indirect Effects
Direct Effects
Direct effects are those that directly impact aquatic species/habitat. Commonly the activity needs to be in
close proximity to the water body where they reside, often within the water body itself. From an aquatic perspective, direct effects most often result in disturbance to aquatic organisms—forcing movement or a
flight response. Depending on the activity, it is possible that individuals can be injured or killed; this is
almost always a result of people or equipment working directly in water.
In this case, the project elements that are likely to directly affect aquatic species or habitat are the additional 0.5 cfs in late summer and the culvert replacement and fish screen installation projects. These
could directly affect resident fish and other sensitive aquatic organisms that are adjacent to or
immediately downstream of those actions. Direct effects to resident fish species in Dog River could include a slight increase in available habitat below the diversion due to increases in late summer flow.

148
Direct effects could also include reduced feeding efficiency during times of increased turbidity, the
possibility of individual mortality during construction, and capture of resident cutthroat trout during work
area isolation.
Fish rely on sight to feed, and therefore feeding success could be hampered during those times turbidity is
increased. This would be a short-term effect since turbid conditions would dissipate soon after the in-stream work phase was completed; generally in a few hours. Any time there is digging or equipment in
the live stream channel there is a possibility that fish could be killed or seriously injured by being crushed
or run over by equipment or materials. Because aquatic macroinvertebrates are relatively immobile, especially mollusks, it is likely such organisms would be injured or killed during construction if they are
present at the site. This impact would occur at the site scale and not across the range of any aquatic
macroinvertebrate species thus, the effects would be localized.
Design and engineering surveys would be conducted at the culvert crossing. When these surveys are carried out within or in close proximity to streams, harassment of fish can occur. In some instances, fish
are flushed from hiding cover and can become more susceptible to predation. The disturbance typically
lasts a few hours and will not have population level effects and is considered to be negligible at the 6th
field and project scale.
Prior to the culvert installation, resident fish will need to be captured and removed from the project area
and block nets will be installed to prevent fish movement into the project during construction. Both the capture and loss of fish passage will directly affect resident cutthroat trout. Following in-water work
guidelines, and the strict adherence to applicable PDC’s, would limit the direct effects on fish and aquatic
mollusk species and result in negligible effects at the watershed scale.
Indirect Effects
Indirect effects are effects caused by or resulting from the proposed actions, are later in time, and are reasonably certain to occur. For example, when streamside forests are removed, an indirect effect
associated with shade reduction could be an increase in water temperature. The magnitude of such an
effect, if it occurred, would depend on the amount of vegetation removed, location and elevation of the
stream, amount of stream flow, etc. In this case, indirect effects may affect resident trout present within close proximity to the restoration actions but have little to no effect on ESA species or LFH present
farther downstream. The following analysis evaluate potential indirect effects on habitat indicators that
result from the no action alternative and the proposed action alternative.
The proposed action has been stated earlier in this document. This report separates the proposed action
into five project elements, which are described in detail below. Project Design Criteria have been
developed for each of the project elements and can be found in Chapter 2 of the Dog River Pipeline
Replacement EA.
Abandonment of Old Pipeline/Installation of New Pipeline
The primary elements of the project are the abandonment in place of the old 18” wooden pipeline and
installation of the new 24” pipeline. Existing trees and dead wood will be cut and removed within the 25-
foot pipeline right-of-way along the pipeline route within the pipeline service road, and at planned staging areas (Figure 47). An excavator will dig approximately a 4-foot deep by 3 to 4-foot wide trench, piling the
excavated material to either side. The excavator will place the pipe in the trench and then cover the pipe
section with gravel or sand and fill in the ditch with the removed material. Additional gravel or sand will
be transported to the excavator by a small rubber-tired or tracked vehicle.
As water would still need to be passed to SF Mill Creek, a temporary bypass pipe would run from the end
of the newly installed pipe around the active construction area to the open end of the existing pipe. The
bypass pipe could consist of 8″ aluminum sprinkler-type pipe, which could be moved by hand. Two lines

149
could run parallel for up to 500 feet. Installation of the bypass pipe would be around existing trees, logs,
and rock.
It is estimated that around 438 live trees ranging in size from 6” to 48” dbh will be removed along the
approximately 3.4-mile pipeline route. Of these 438 trees, roughly 12 are larger than 24” dbh, 170 are
between 12” and 14” inches, and around 256 trees are 11” and smaller. In addition to the live trees approximately 198 standing dead trees would be cut. Of these, over half are between 11” and 20” inches,
22 between 20” to 30”, roughly 3 are over 30” dbh with the remainder under 11” dbh. Around 11 acres
total would be affected. At its closest point, this affected Riparian Reserve area (Table 54) is about 2.7 miles upstream of Listed Fish Habitat (LFH) and 3.3 upstream of Critical Habitat (CH). This project
element does not involve in-water work.
Upon project completion, all disturbed areas would be rehabilitated in a manner that results in similar or
better than pre-work conditions through removal from the National Forest all of project related waste, decompaction of soil, spreading of non-vegetation stockpiled materials (soil, etc.) seeding, or planting
with local native seed mixes or plants, and restoration of stream channel bed and banks. Five percent of
the largest felled trees (live or dead) will be left on site, evenly distributed over the disturbed area.
Table 54. The length of proposed new pipeline in various streamside zones.
Riparian Reserve 300’ on each side of fish-bearing stream of Dog River
and Brooks Meadow Creek
0.93 miles
(4,900’)
1 Site Potential Tree 130’ from Dog River and Brooks Meadow Creek 0.53 miles
(2,800’)
100’ from Dog River and Brooks Meadow Creek 0.15 miles
(815’)
Installation of Aquatic Organism Passage (AOP) and Pipeline Crossing at Brooks Meadow Creek
Brooks Meadow Creek is a perennial stream tributary to Dog River that is about 1 mile in length and
contains resident cutthroat trout. It is located 2.8 miles upstream of LFH.
There are 2 locations for this project element, and they both involve in-water work. First, the pipeline is
proposed to be buried under the channel near RM 0.1 of Brooks Meadow Creek.
Second, USFS Road 1700-014 crosses Brooks Meadow Creek at RM 0.2. The road parallels the pipeline
for much of its length and provides equipment and maintenance access to the pipeline. It is currently a rough, natural surface, single lane road with an undersized culvert carrying Brooks Meadow Creek
beneath. Due to its small size, the culvert has failed, resulting in Brooks Meadow Creek flooding over the
road prism (Figure 48). The project would install a cement prefabricated open box culvert that will provide Aquatic Organism Passage (AOP) at all life stages and eliminate a chronic sediment source.
During the culvert construction, the stream would be re-routed around the work area as the culvert is
being installed. Additionally, because the existing pipeline is too fragile to handle surface vehicle traffic, the construction area would be accessed along the newly constructed section of the pipeline. It is unlikely
that any mature trees will need to be removed to install the AOP culvert at the Brooks Meadow Creek
crossing. Vegetation removal at the crossing will largely consist of brushing low vegetation rather than
removal of mature trees.

150
Installation of Fish Screen and Diversion/Outlet Structures
The current diversion of water from Dog River into the existing pipeline is not equipped with a fish
screen (Figure 48). This project will install a fish screen at the diversion. The proposed structure will be an in-channel screening structure that will prevent passage of resident trout into the diversion. The fish
screen will meet ODFW fish screening criteria. While the fish screen is designed to work year-round, the
lack of electricity at the diversion means there is no mechanism to de-ice the fish screen during winter which could result in a failure of the diversion. Therefore, the structure will be designed and constructed
in a manner that will allow its removal in the winter under heavy icing conditions. The pipe inlet, flow
measuring facilities, and discharge structure would also be replaced.
Temporary Staging Areas/Material Hauling
There are multiple staging areas identified for the construction period (Figure 45). None are in Riparian Reserve. A 1-acre staging area would be located at the 1700-014 road at the top of the hill west of the
Brooks Meadow Creek Crossing and would accommodate the transfer of pipe from the primary storage
area to the construction area. It will also act as the storage area for trees/logs removed from the corridor
before they are removed from the project (Figure 45). Minor realignment of the 1700-014 road between Brooks Meadow Creek and the staging area would be completed to allow for construction vehicle traffic.
There are several other locations identified for storing pipe and gravel/sand: 1) on either side of the 1700-
691 where it intersects with the 1700-690; 2) along road 4400-011 at the junction with road 4400; or, 3) at an old landing off of the 1700. Gravel and sand may also be stored at the junction of the 1700 and the
1700-680 roads. All the staging areas will be rehabilitated upon completion of the project.
Roads where equipment, materials, and gravel or log hauling will occur within the action area are located
outside Riparian Reserves with 3 exceptions:
• The Dog River pipeline access road (Rd 1700-014 and 4400-011), which is within 100’ of Dog River
and Brooks Meadow Creek for about 815’. This native surface pipeline access road is about 2.7 miles upstream of LFH, at its closest point (3.3 upstream of CH).
• The 1700 road, which is paved, crosses Brooks Meadow Creek. This paved road crossing is about 3.1
miles upstream of LFH. Roadsides are densely vegetated at this location.
• Oregon Highway 35 near the confluence of EFHR and at Dufur Mill Road (4400) which crosses Dog
River as well as several smaller streams. These road crossings do cross over LFH. Both roads are
paved, have wide shoulders and good drainage.
Pipeline Operations
The new pipeline would continue to be maintained and operated as it conventionally has for many decades, conveying water diverted from upper Dog River to the South Fork of Mill Creek and stored in
Crow Creek Reservoir for municipal use by the City of the Dalles (City) in accordance with existing state
and federal authorizations. Current operations entail the diversion of Dog River flow year-round, including the diversion of almost all flows during the summer and early fall months. Peak reservoir fill
period occurs from October to early February. Dave Anderson, City of The Dalles Public Works director
for the last 12 years (and The Dalles Municipal Watershed manager for the prior 15 years), notes that in most years Crow Creek reservoir is filled to capacity by early February (personal communication). In
some years it is full well before that. The City does not divert all of the stream flow when filling the
reservoir. There is bypass flow during this time. Once the reservoir is full, the intake is reduced (using a
screw gate) to maintain flow to the reservoir that averages around 3 cfs (although in winter when the headgate is not very accessible they let spill over Crow Creek dam until they can safely access the site).
The existing operating plan allows the majority of spring peak flows to bypass the intake and continue
down Dog River.

151
The proposed project will modify the current pipeline operations by leaving a minimum instream bypass
flow of 0.5 cfs (August 1 to October 31) during a portion of the low stream flow period. The new 24”
pipeline has a capacity of 26.3 cfs compared to the current pipe’s capacity of 12.3 cfs.
Figure 45. Project Area including pipeline location, staging areas, and culvert replacement.

152
Figure 46. Top row photos: USFS Road 1700-014 road crossing ford at Brooks Meadow Creek. Middle row photos: Existing Diversion Structure on Dog River at RM 6.0. Bottom row photos: Existing Pipeline Intake at Diversion Structure on Dog River at RM 6.0.

153
3.4.2.1 Temperature
No Action
Stream temperature would not be affected under the No Action Alternative. The seasonal trends in stream
temperature observed at the mouth of Dog River would be expected to continue. Dog River stream temperatures would remain cold both above and below the diversion year-round, rarely exceeding water
quality standards for temperature, and meeting the ODEQ requirements for fish and aquatic life beneficial
uses (Hydrologist Specialist Report). Under the No Action Alternative, existing effects to the water quality of South Fork Mill Creek would remain unchanged. There would continue to be no impairments
to the designated beneficial uses
Proposed Action - Abandonment of Old Pipeline/Installation of New Pipeline
The primary elements of the project that could alter stream temperature are the abandonment in place of
the old 18” wooden pipeline and installation of the new 24” pipeline. Existing trees and dead wood will
be cut and removed within the 25-foot pipeline right-of-way along the pipeline route within the pipeline service road. It is estimated that less than 600 trees total will be removed along the 3.6-mile pipeline
route. Around 11 acres total would be affected. This project element does not involve in-water work. At
its closest point, this affected Riparian Reserve area is about 2.7 miles upstream of Listed Fish Habitat
(LFH), and 3.3 miles upstream of CH, in Dog River.
Tree falling outside of 1 Site Potential Tree height (130’) has no causal mechanism to affect stream
shading that would affect water temperature, thus tree falling in 2.92 out of the total 3.6 mile pipeline will
have a neutral effect on water temperature.
Tree falling to replace the diversion outlet in headwaters of SF Mill Creek has no possibility of affecting
LFH because of the pronounced distance (>11 miles from pipeline outlet to LFH), and more significantly,
the juxtaposition of an impoundment (28-acre Crow Creek reservoir/dam) that disconnects potential project impacts from LFH.
Tree removal within a site potential tree height has the potential to affect stream temperature through
removal of tree canopy that provides shade to streams. Approximately 0.68 miles (3,615’) of pipeline
road will have trees removed within this zone of Dog River and the mouth of Brooks Meadow Creek.
The removal of trees in this zone will have a discountable effect to resident cutthroat trout and a
discountable effect to stream temperature in LFH due to the following:
• 0.3 miles out of the 0.68 miles pipeline opening is only on the north side of the stream. Little stream
shading is provided by trees on the north bank.
• A very small amount (815’) of pipeline is within 100’ (of one side) of the stream. The majority of the
pipeline that is 100-130’ away from the stream will have additional shading provided by 100’ of
undisturbed over story trees, understory hardwoods, and streamside shrubs.
• At its closest point, this affected riparian area is about 2.7 miles upstream of Listed Fish Habitat
(LFH), and there are 6 cold water tributaries between this point and LFH (tributaries contributed 4.5-
10 oC flow when recorded during August 2000).
• The riparian corridor is intact and densely forested the entire length from the diversion to LFH.

154
Proposed Action - Installation of AOP and Pipeline Crossing at Brooks Meadow
Creek
Brooks Meadow Creek is a small (<1 cfs during summer) spring-fed stream that stays cold year-round. A
2000 USFS stream survey measured the mouth at 10 oC in early August, and field visits in summer of
2016 confirm the very cold stream temperatures in the portion that runs through Brooks Meadow.
It is unlikely that any mature trees will need to be removed to install the AOP culvert at the Brooks Meadow Creek crossing. Vegetation removal at the crossing will largely consist of brushing low
vegetation rather than removal of mature trees. A few trees will likely be removed to allow for the
pipeline to cross under Brooks Meadow Creek, with a clearing width of 25 feet perpendicular to the creek.
The pipeline crossing is approximately 2.9 miles upstream of LFH, with the AOP installation at
approximately 3.0 miles upstream of LFH. Since few, if any, overstory trees are will be affected by the
AOP installation, this action will have neutral effect on water temperature.
Tree removal has the potential to affect stream temperature through removal of trees that provide shade to
streams. Tree removal adjacent to Brooks Meadow Creek accounts for about 0.06 acres of opening. The 25-foot wide opening will be perpendicular to the stream and thus still retain mature trees immediately
adjacent to this small section of opening that will provide shade for the majority of the day. There is
discountable chance that stream temperatures in LFH will be affected by this element due to the very slight increase in solar contribution at the crossing site, which is located 2.9 miles upstream of LFH. This
is especially true since 4 tributaries enter Dog River between the project site and LFH, with contributions
of 5-7 oC flow, as measured during August 2000.
Proposed Action - Installation of Fish Screen and Diversion/Outlet Structures
The installation of fish screen and diversion structures are within the footprint of existing disturbed areas. As no shading of the stream will be affected, this project element has no causal mechanism to affect
stream temperature. Therefore, installation of fish screening and diversion/outlet structures will have a
neutral effect on stream temperatures.
Proposed Action - Temporary Staging Areas/Material Hauling
None of the temporary staging areas are in riparian reserve, thus there is no causal mechanism to affect stream shade. Timber and rock haul, regardless of location or duration, will not reduce shade and has no
causal mechanism to increase water temperature. Therefore, both temporary staging areas and
timber/rock hauling will have a neutral effect on water temperature.
Road maintenance has the potential to remove shade producing vegetation through danger tree removal near perennial streams. Proposed road maintenance activities (that includes danger tree treatment) are all
located outside Riparian Reserves, except for the Dog River pipeline access road (Rd 1700-014 and 4400-
011), which is within 100’ of Dog River and Brooks Meadow Creek for about 815’. This native surface
pipeline access road is about 2.7 miles upstream of LFH, at its closest point (3.3 upstream of CH).
Approximately 815’ of pipeline road may have some danger trees removed within 100’ of Dog River and
the mouth of Brooks Meadow Creek.
The removal of a few danger trees in this zone will have discountable effect to stream temperature in
LFH due to the following:
• A very small amount (815’) of road is being treated, with <10 danger trees expected to need falling.

155
• At its closest point, this affected riparian area is about 2.7 miles upstream of Listed Fish Habitat
(LFH), and there are 6 cold water tributaries between this point and LFH (tributaries contributed 4.5-
10 oC flow when recorded during August 2000).
• Other than the 815’, the riparian corridor is intact and densely forested the entire length from the
diversion to LFH.
Proposed Action - Pipeline Operations
Current operations entail the diversion of Dog River flow year-round. The entire flow of the river has
typically been diverted by the City from June through October (approximately 3–10 cfs); however, only a portion of flows from November to May (approximately 30%–70%) are diverted. The proposed project
will modify the current pipeline operations by leaving a minimum instream flow of 0.5 cfs (August 1 to
October 31) during a portion of the low stream flow period. The new 24” pipeline has a total capacity of 26.3 cfs as compared to the current capacity of 12.3 cfs (a 114% increase). The expanded capacity would
allow the filling of Crow Creek Reservoir faster by diverting a greater portion of the Dog River peak
flows when available. Once the reservoir is full (historically by early February), pipeline diverted flows
are reduced to around 3 cfs for the remainder of winter and early spring.
Flow diversions from the spring to fall of 2016 ranged from approximately 2.7 cfs in late September to
10.2 cfs in late May 2016, whereas Dog River flows ranged from 2.4 cfs in late September to 21 cfs in early May 2016. Although the entire flow of the river is diverted in the summer, surface flows are
replaced by groundwater immediately downstream of the diversion. A USFS stream survey from July 26
– August 30 of 2000 noted wetted stream channel in all areas downstream of the diversion. The discharge
rate of 8.3 cfs was recorded at the mouth on July 26, 2000.
The diversion is located at RM 6.0 and is 3.4 miles upstream of LFH in Dog River. Changes in pipeline
operations from the diversion point to Crow Creek Reservoir has neutral possibility of affecting LFH in
SF Mill Creek because there are no proposed changes to operations downstream of the reservoir, which is 7 miles upstream of LFH. Diversion of surface flow has the potential to increase downstream
temperatures due to the lowered volume, reduced depth, and decreased buffering capacity, which is more
prone to warming from solar exposure.
As displayed in the baseline temperature data, Dog River is a very cold system yearround within LFH and
almost always meets the 13ºC requirements of listed fish species based on the ODEQ criteria. Current
stream temperatures are warmest (above 10ºC) generally from June to September in the 11 years of
available data. The proposed action will divert the same amount of flow (all available surface water) from June to July, while leaving more instream flow (0.5 cfs) in August through October than current
conditions. As flow diversion will either be the same or lesser in amount during the warmest period
(June-September) with the proposed action, there will be discountable effects to stream temperatures in
Dog River LFH from current conditions.
Summary of Effects on Temperature
After field validation of stream habitat in the action area, project design criteria (PDC) were developed by
the interdisciplinary team to minimize water quality impacts, including any from reduction of shade that
may affect stream temperature. Some minor shade reduction may occur on perennial resident fish only streams within the action area, but effects will be discountable for LFH due to the combination of
pronounced distance (>2.5 miles), existing cold year-round temperature baseline, cold spring influence
(4.5-10 oC summer contribution) from multiple tributaries downstream of the action, a retention of 0.5 cfs minimum instream flow during August-October, and the small fraction (~900’) of canopy reduction as
compared to intact riparian area in almost all of the action area.

156
3.4.2.2 Sediment and Substrate Character
No Action
For most of the length of Dog River, direct access to the channel would remain limited and human
perturbation other than water management would be low. The stream banks and main channel could be
expected to remain primarily stable, and the sediment supply would not be expected to undergo an
aberrant change from previous trends. Substrate would continue to be dominated by gravels and cobbles. The average amount of fine sediment observed throughout all reaches would likely remain low to
moderate on an area weighted basis (Hydrology Specialist Report). The failed culvert at Road 1700-014
at the Brooks Meadow crossing would continue to route fines into Brooks Meadow Creek resulting in an increase in fines at the local scale. If the culvert is not replaced, there would be no construction-related
fines generated.
In South Fork Mill Creek substrate would be expected to remain dominated by coarse gravel. Fine
sediment generated by streambank erosion and incision would essentially be routed through the system by the elevated water velocity that results from diverted Dog River flows, although it could continue to
accumulate in the few pools or short aggrading segments in Reaches 1 and 2. Above the dam, the majority
of fine sediment generated would most likely continue to settle in the reservoir, while below the dam it
could accumulate behind the Wicks intake structure.
Proposed Action - Abandonment of Old Pipeline/Installation of New Pipeline
The primary elements of the project are the abandonment in place of the old 18” wooden pipeline and
installation of the new 24” pipeline. Existing trees and dead wood will be cut and removed within the 25-
foot pipeline right-of-way along the pipeline route within the pipeline service road. An excavator will dig approximately a 4-foot deep by 3 to 4-foot wide trench, piling the excavated material to either side. The
excavator will place the pipe in the trench and then cover the pipe section with gravel or sand and fill in
the ditch with the removed material. Additional gravel or sand will be transported to the excavator by a
small rubber-tired or tracked vehicle.
This project element does not involve in-water work (except at Brooks Meadow crossing that is described
in the project element below). At its closest point, this affected Riparian Reserve area is about 2.7 miles
upstream of Listed Fish Habitat (LFH), and 3.3 miles upstream of CH, in Dog River.
Installation of a new pipeline outlet in the headwaters of SF Mill Creek has no possibility of affecting
LFH because of the pronounced distance (>11 miles from pipeline outlet to LFH), and more significantly,
the juxtaposition of an impoundment (28-acre Crow Creek reservoir/dam) that disconnects potential
project impacts from LFH.
Installation of new pipeline adjacent to the existing pipeline does not involve any in-water work (except at
Brooks Meadow crossing that is described in the project element below. Any potential overland erosion that may introduce suspended sediment to stream channels will not occur as there are PDCs that will be
applied. The most pertinent one states, “Temporary Erosion Controls – Place sediment barriers prior to
construction around sites where significant levels of erosion may enter the stream directly or through road
ditches. Temporary erosion controls will be in place before any significant alteration of the action site and
will be removed once the site has been stabilized following construction activities.”
Due to this and other standard erosion control PDCs in place for this project, the probability that any fine
sediment generated during pipeline placement traveling overland and reaching adjacent streams and LFH
(2.7 miles downstream) is considered discountable.

157
Proposed Action - Installation of AOP and pipeline crossing at Brooks Meadow
Creek
Instream excavation will be necessary to install the AOP at the current road ford crossing, as well as
install the pipeline under the Brooks Meadows Creek channel.
The pipeline crossing is approximately 2.9 miles upstream of LFH on Dog River, with the AOP
installation at approximately 3.0 miles upstream of LFH in Dog River. There is no hydrologic connection
of this element to SF Mill Creek drainage.
Excavation work associated with installation of the AOP and the new pipeline at Brooks Meadow Creek
could potentially introduce suspended sediment to the Brooks Meadow Creek stream channel. The installation of the AOP culvert as proposed will eliminate an active ford, thereby reducing potential
turbidity and fine sediment at the site scale and benefitting resident fish species and habitat.
PDC will be applied that minimize sediment introduction to surface waters, including work area isolation
during construction and timing during lowest flow period (ODFW in-water work window of July 15-August 31). Although PDC stipulate de-watering the culvert removal site during implementation,
sediment will likely be mobilized and transported when the channel is re-watered post-construction, as
well as during the first few significant precipitation events.
Silt, the sediment size most easily transported and that which usually results in turbid conditions, can be
transported over a wide range of flows, even very low flows (Swanston 1991). However, the particles
will settle where stream energy drops significantly such as behind obstructions. From 2010 to 2013, turbidity monitoring during all stream culvert removals and/or replacements on the Mt. Hood NF
recorded that turbidity plumes were short lived and not visually detectable past 700’ feet downstream of
the worksite (MHNF, unpublished data as reported annually to NMFS and USFWS; NMFS 2013). Note
that these observations were made mostly in anadromous streams that are larger than Dog River so in this
smaller stream, most of the silt is not expected to be transported as far as in larger streams.
Turbidity decreases downstream from the source relatively rapidly both in space and time. A study on
Idaho and Washington streams by Foltz et al. (2008) found that turbidity decreased by an order of magnitude within 328’ of the source following culvert removal, and turbidity dropped to background
levels within ½ mile on average. This distance is likely a much longer distance than what would occur in
Dog River, as his study included 11 stream crossings, where 7 had no mitigation control in place (no de-watering of construction area and no restrictions on heavy equipment in live water). At the mitigated sites
the turbidity and sediment yields directly below the road crossings were many orders of magnitude less
than at unmitigated sites. At the three sites with mitigation the peak turbidity during construction
(including channel re-watering) was 1,300 mg/L, compared with 9,900 and 22,000 mg/L at the two
unmitigated sites.
In summary, the probability that fine sediment/turbidity will affect LFH in Dog River is discountable due
to the following:
• Three years of formal monitoring of forest culvert installation and replacements show
sediment/turbidity impacts to extend to a maximum of 700’ downstream. Decades of on-site
implementation monitoring observations is consistent with the formal monitoring results.
• Studies of culvert work, with much less mitigation controls in place, noted turbidity/sediment impacts
up to 0.5 miles downstream. PDC will be applied at Brooks Meadow Creek sites to minimize
sediment introduction to surface waters, including work area isolation during construction and
construction timing during lowest flow period (ODFW in-water work window of July 15-August 31).

158
• LFH is >2.9 miles downstream of the instream culvert installation and pipeline crossing.
The installation of a new fish passable culvert at Brooks Meadow will have the long-term benefit of
improving year-round resident fish passage and reducing sediment delivery downstream of the crossing.
As a result, the culvert installation will have a beneficial effect to cutthroat trout over the long term.
Proposed Action - Installation of Fish Screen and Diversion/Outlet Structures
The diversion structure and fish screen are at RM 6.0 on Dog River; a distance of 3.4 miles upstream of LFH. The outlet structure is on SF Mill Creek, above Crow Creek Reservoir, and has no connection to
LFH.
To minimize impacts to resident fish and habitat, fish screen installation and structure replacement
activities are planned to be completed within the ODFW instream work period of July 15 to August 31. In order to reduce the potential for introduction of sediment into stream channels, streamflow will be
diverted around work areas. Upon project completion, the construction site will slowly be re-watered to
prevent loss of surface water downstream (as the construction site streambed absorbs water) and to prevent a sudden release of suspended sediment. Monitoring will be completed during re-watering to
ensure no stranding of aquatic organisms occurs or excessive sediment is released below the construction
site. These, along with other standard construction and erosion control PDC, will greatly reduce
sediment/turbidity release into Dog River channel.
Sediment and/or turbidity levels will increase during re-watering and after the first few significant
precipitation events post-construction. Turbidity monitoring of all 23 in-water aquatic restoration projects
was completed on the Mt. Hood NF from 2010 to 2013. All projects followed pertinent PDC as required by the ESA consultation BO (NMFS 2013). Restoration projects were diverse in nature, and included
culvert removal/replacement, large wood placement (via excavator and helicopter), side channel re-
connection, and gravel/wood augmentation (downstream of dammed rivers). Monitoring showed that turbidity plumes were short lived and visually detectable from 25 to 1000 feet downstream of the worksite
(MHNF, unpublished data as reported annually to NMFS and USFWS). In-stream wood placements via
excavator (in live streams) were the type of project that generally created the longest turbidity plumes
downstream.
The combination of construction and erosion-control PDCs, as well as the extended distance upstream
(3.4 miles) from LFH, eliminates the likelihood of sediment/turbidity to affect LFH, and thus is
discountable in effect.
The installation of a new fish screen at the diversion will reduce entrainment of fish during most of the
year. As a result, the fish screen will have a beneficial effect to cutthroat trout over the long term.
Proposed Action - Temporary Staging Areas/Material Hauling
There are multiple staging areas identified for the construction period. None are in a Riparian Reserve.
As there are no surface hydrologic connection to streams or other waterbodies (PDC A-5), the use of
temporary staging areas will be discountable in sediment/turbidity effect to LFH.
Roads where equipment, materials, and gravel or log hauling will occur within the action area are located
outside Riparian Reserves with 3 exceptions:

159
• The Dog River pipeline access road (Rd 1700-014 and 4400-011), which is within 100’ of Dog River
and Brooks Meadow Creek for about 815’: This native surface pipeline access road has one stream
crossing at Brooks Meadow Creek, which is about 3.0 miles upstream of LFH.
• The 1700 road at the Brooks Meadow Creek crossing: This paved road crossing is about 3.1 miles
upstream of LFH. Roadsides are densely vegetated at this location. No maintenance will be needed
for this road system as associated with this project.
• Oregon Highway 35 (over Dog River near the confluence of EFHR) and Road 4400 which crosses
Dog River as well as several smaller streams: These road crossings do cross over LFH. Both roads
are paved, have wide shoulders and good drainage. No maintenance will be needed for these road
systems as associated with this project.
The haul on paved Oregon Highway 35, Road 44, and Road 1700, as well as the lack of associated road
maintenance actions, will not cause any soil or instream disturbance that would lead to sediment/turbidity
effects at the site scale nor at LFH (discountable effect).
The native surface Dog River pipeline access road (Rd 1700-014 and 4400-011) will have haul as well as
associated road maintenance actions, which include:
• Cleaning of road cross drain culverts, sloping the road to drain, and/or install water bars to help drain
surface and reduce sediment flows.
• Placing, rolling and compacting 3/4” (-) aggregate material 100’ each direction of road crossing at
Brooks Meadow Creek crossing to minimize the delivery of sediment erosion to the stream.
• (If road is to be used in the wet season) surfacing of road with 3” (-) aggregate or other surfacing
material to minimize sediment flows.
Haul, and associated road maintenance, conducted further from stream channels than the closest drainage
relief culvert is not expected to result in sediment increases in area streams because the drainage relief
culverts empty onto well-vegetated areas that are not hydrologically connected to stream channels. The
presence of well-vegetated buffers between cross drain culvert outlets and streams will be sufficient to halt overland erosion before it can enter streams. The Dog River access road has one short point of
surface hydrologic connection to streams at the Brooks Meadow Creek crossing. The stream at this
location is <1 cfs summer flow, with little annual variation due to its spring-fed source about 1 mile
upstream.
Although the entire goal of road maintenance is to reduce sediment transport from existing conditions
(including conversion of native road stream crossing to aggregate surface, installation of water bars to improve draining onto vegetated surfaces and the cleaning of road drain culverts), road maintenance
activities do have the potential to increase short-term road crossing related erosion and sediment during
rainfall events due to initial soil surface disturbance. Temporary Erosion Controls adjacent to the stream
crossing and through road ditches will capture sediment before it enters the stream channel. Any turbidity created by road maintenance activities would most likely be washed from the road or ditch surface in the
first few precipitation events immediately after work has been completed. These sporadic events may
cause disturbed fine soil to be mobilized downstream and potentially into stream channels for a short
time. Overall, road maintenance will have a discountable effect in sediment/turbidity to LFH.

160
Proposed Action - Pipeline Operations
The changes in pipeline operations (diversion flow timing and volume) does not involve any soil
disturbance or instream alterations. This project element has no causal mechanism to affect
sediment/turbidity, therefore, will have a neutral effect on this indicator.
Changes in pipeline operations (diversion flow timing and volume) from the diversion point to Crow
Creek Reservoir has neutral possibility of affecting sediment/turbidity levels in LFH in SF Mill Creek because there are no proposed changes to operations downstream of the reservoir, which is 7 miles
upstream of LFH.
Summary of Effects on: Sediment and Substrate Character
The proposed project will result in disturbed soil in localized areas that has the potential to enter stream
channels; primarily associated with diversion structure replacement/fish screening, material hauling, road maintenance, and AOP installation. Sediment/turbidity levels may be detectable at the site scale within
resident fish only streams but will be discountable at LFH due to multiple PDC that minimize sediment
mobilization, as well as the pronounced distance (>2.9 miles) between instream work and LFH. Over the
long term, the new culvert installation should result in reduced sediment delivery at the local scale.
3.4.2.3 Chemical Contamination/Nutrients
No Action
Currently, there are very low potential sources for chemical contamination in the Dog River and South
Fork Mill Creek watersheds. Most of the upper action area is closed to entry within The Dalles Watershed Management Area. The rest of the area is largely commercial forest land, which also has
seasonal recreation use. There is no agricultural or industrial land in the action area. Highway 44 is
paved and as a result may contribute to vehicle related chemicals/pollutants at stream crossings over Dog River and Brooks Meadow Creek at the local scale but has not been identified as a process of concern.
Oregon Highway 35 is the only (paved) road that crosses LFH. This road is designed to route road
surface contaminants onto vegetated areas. Therefore, chemical contamination is not a process of concern
in the action area.
Proposed action
Installation of new pipeline, AOP culvert placement, diversion structure/fish screen and outlet
replacement all require heavy equipment that carry and use petrochemicals to work within resident fish
stream channels. It is extremely unlikely that heavy equipment and haul vehicles will spill contaminants.
Standard construction PDC are in place to ensure that materials for emergency hazardous materials control are onsite (e.g., silt fence, straw bales, oil-absorbing floating boom whenever surface water is
present), as well as requiring all equipment used for instream work be cleaned for petroleum
accumulations, and leaks repaired prior to entering the project area. Such equipment includes large machinery, stationary power equipment (e.g., generators, canes, etc.), and gas-powered equipment with
tanks larger than five gallons.
Based on decades of staff experience that encompass tens of thousands of log truck loads hauled off the MHNF, as well as use of heavy equipment for in-stream restoration projects, there have been very few
chemical spills ever noted. Log/rock/pipe hauling, and use of heavy equipment in-stream will have a
discountable effect on chemical contamination in LFH and may impact individuals and habitat for
resident fish.

161
Proposed Action - Pipeline Operations
Pipeline operations does not involve the use of any agricultural or industrial contaminants, nor involve
use of nutrients, thus has no causal mechanism for contamination in resident trout habitat or in LFH – the
effect is neutral.
Summary of Effects on Chemical Contamination/Nutrients
With PDC in place, the potential contaminants used as part of project implementation are not likely to
enter the stream network. Therefore, there will be a discountable effect on the indicator in LFH/CH and
may impact individual fish and habitat for resident fish.
3.4.2.4 Physical Barriers
No Action
Currently, there are numerous natural barriers (steep gradients and waterfalls) in both the Dog River
Watersheds and Mill Creek. As previously described, these waterfalls act as upstream migration barriers to anadromous fish. There are no anthropogenic barriers to ESA listed fish in the action area. However,
there are several anthropogenic barriers to resident trout migration in the action area. The Dog River
diversion structure at RM 6.1 is almost a complete barrier to upstream migration but does allow for
downstream fish passage during higher flow periods. The culvert that passes Dog River under USFS Road 17 is classified as a year-round migration barrier. And two culverts on Brooks Meadows Creek are
barriers (USFS 1710 Road crossing and USFS 4400 – 014). Wicks Reservoir acts as an upstream barrier
to resident fish in Mill Creek. Under the No Action alternative, there would be no change to listed fish or
resident trout migration in the action area.
Proposed Action – Installation of AOP Culvert
None of the action elements are located in LFH stream channels thus there is no causal mechanism to
affect this indicator. The project activities neither correct nor create any fish passage barriers for ESA-
Listed Species, although resident cutthroat trout will benefit locally from fish screening of the Dog River diversion structure and replacement of a ford crossing with an AOP culvert in Brooks Meadow Creek. All
projects elements have a neutral effect to LFH for this indicator within the action area.
Proposed Action – Installation of Fish Screens & Diversion Outlet Structure
None of these action elements are located in LFH stream channels thus there is no causal mechanism to
affect this indicator. Installation of fish screens at the outlet structure does prevent resident trout from being entrained into the pipeline during most of the year. However, since the fish screens may not
operate in winter, resident trout will likely still be entrained during that time. These project elements
neither correct nor create any fish passage barriers for ESA-Listed Species but resident cutthroat trout will benefit from better fish screening of the Dog River diversion structure. All projects elements will have No
Effect to LFH for this indicator within the action area and a neutral effect to resident trout.
Proposed Action – Abandonment of Pipeline and Temporary Staging
None of these action elements are located in LFH stream channels thus there is no causal mechanism to
affect this indicator. These action elements have no causal mechanism to create passage barriers for resident trout. All project elements will have No effect to LFH or resident trout for this indicator within
the action area.

162
Summary of Effects on Physical Barriers
Under the proposed action alternative resident fish would benefit slightly from improved passage at
Brooks Meadow Creek and reduced entrainment into the pipeline. There would be no change in the
proposed or no action to LFH/CH. Therefore, there will be a neutral effect on the indicator in LFH/CH.
3.4.2.5 Large Woody Debris, Pool Frequency & Quality/Large Pools, Off-channel
Habitat and Floodplain Connectivity, Refugia, Width/Depth Ratio, and Streambank Condition
These habitat indicators are grouped together in this effects analysis because they are interrelated, and in
this action area these indicators are often linked with the amount of in-channel and floodplain large wood.
No Action
Large wood recruitment potential would not be affected under the No Action alternative in any of the
action area. Almost all the action area streams are very close to meeting AP standard for >20 pieces per
mile and recruitment potential along nearly the entire length of Dog River will remain high. In the South Fork Mill Creek subwatershed, large wood recruitment along riparian corridors is also good. These stream
reaches are all within The Dalles Watershed Management Unit and located on lands administered by the
Forest Service downstream to Crow Creek Reservoir. Within the pipeline right of way, trees will continue
to be removed as needed to maintain the integrity of the pipeline.
Under the No Action Alternative, diversion from Dog River and storage and release in Crow Creek
Reservoir would continue to modify the flow regime in the Dog River and South Fork Mill Creek
subwatersheds.
In Dog River, changes to channel forming processes related to modified streamflow would continue to
mostly affect Reaches 1, 2, and the lower segment of 3. Effects would be greatest in the lower segment of
Reach 3 immediately below the diversion because it would continue to be partially dewatered for a half-mile downstream to Cooks Meadow in the summer and early fall months. The overall reduction in
average annual flow and the absence of base flows in this reach would continue to be the cause for the
decline of pool depth and quality, a decrease of the width-to-depth ratio, and a reduced wetted perimeter.
In SF Mill Creek, elevated average base and peak flows will continue to increase water velocity
seasonally and gradually deepen entrenchment. Width-to-depth ratios could be expected to slowly
decrease, and the wetted perimeter enlarge. The short segments of channel where unstable and undercut
streambanks were observed in Reaches 1 and 2 could progressively expand. For these reasons, pool abundance and quality would remain low. Most of the segments in each of these reaches would continue
to be fast flowing, and not conducive to pool formation.
Off-channel habitat and floodplain connectivity will remain unchanged under the no action alternative largely due to the confined valley form and steep gradients that exist in Dog River and the moderately
confined valley form of SF Mill Creek. Highway 35 will continue to constrict Dog River’s floodplain at
its confluence with the East Fork Hood River.
Proposed Action - Abandonment of Old Pipeline/Installation of New Pipeline
Approximately 600 existing trees will be removed along approximately 1,500 feet of the pipeline corridor in relatively close proximity to aquatic habitat; however, this portion of the pipeline route is not near
LFH, therefore, the action will have a discountable effect on LFH and minor, site scale effect on resident
fish habitat. No construction activities will be close enough to Dog River to affect stream channel
characteristics.

163
Proposed Action - Installation of AOP and Pipeline Crossing at Brooks Meadow
Creek
Brooks Meadow Creek will be temporarily dammed during the low-flow summer period and the water
will be re-routed around the work area as the pipe is being installed. The pipe will be laid under the creek
channel and the creek channel will be rehabilitated back to existing channel conditions to the degree
possible. A temporary culvert at the existing crossing could be installed during construction and removed after completion of the project. The installation of a new AOP at Brooks Meadow Creek should improve
channel process in the short segment below the road. Erosion will be reduced which should improve pool
formation and function; flow will no longer go overland providing for improved channeling forming
processes immediately downstream.
Installation of the AOP and burial of the pipeline will be conducted in areas previously disturbed by a
road crossing (ford) and previous pipeline burial. None of the action elements are located in LFH stream
channels therefore, the action will have a discountable effect on LFH and minor, site scale effect on
resident fish habitat.
Proposed Action - Installation of Fish Screen and Diversion/Outlet Structures
The new diversion/outlet structures and the fish screen will be constructed in approximately the same
locations as the existing structures; however, these structures are not located in or near LFH/CH. Instream work associated with fish screen and diversion/outlet structures will not affect channel characteristics in
the immediate area or in downstream LFH, therefore the effect will be neutral and no further analysis is
necessary. PDC and BMPs will greatly minimize the amount sediment entering Dog River and South
Fork Mill Creek during construction of these instream structures. Sediment from this element will have an insignificant effect on turbidity and fine sediment levels in LFH and minor, site scale effect on resident
fish habitat during project implementation but should result in benefits to resident over the long-term.
Proposed Action - Temporary Staging Areas/Materials Hauling
Road crossings and landing areas that may affect instream habitat elements are located at least 0.2 miles
from LFH/CH and as a result will have a discountable effect on LFH but could result in minor, site scale
effects to resident fish habitat.
Fine sediment generated from hauling traffic will increase in action area streams at road crossings. Most
of this sediment will disperse and settle before reaching LFH; however, some will eventually make its way into LFH. As in upper stream reaches this fine sediment will be deposited in slow water habitats,
primarily pools and stream margins. The small amount of fine sediment reaching LFH would be
immeasurable against background levels, thus sediment deposition in pools will have a discountable
effect on pool quantity and quality, and the number of large pools will remain the same. Similarly, sediment deposition will have a discountable effect on stream width to depth ratio and habitat refugia due
to the small amount of sediment deposited.
Proposed Action - Pipeline Operations
In the Dog River sub-watershed, channel characteristics would continue to be altered by the modified flow regime. Winter and summer flows would continue to be affected most. Early and mid-winter flows
would be attenuated which could alter the redistribution of substrate and subsequent re-working of the
channel configuration, potentially reducing pool depth, LWD density, and habitat heterogeneity (Poff et
al. 1997).
Elevated flows diverted into South Fork Mill Creek from Dog River have the potential to alter stream
channel habitat indicators; however, it is unlikely that volumes entering the pipeline will exceed current
volumes. Pipeline operations will manage diverted flows so that the erosive effects to the channel from

164
high magnitude surges of water will be minimized. Changes in pipeline operations from the diversion
point to Crow Creek Reservoir has neutral possibility of affecting LFH in SF Mill Creek because there
are no proposed changes to operations downstream of the reservoir, which is 7 miles upstream of LFH.
The proposed action will divert the same amount of flow November to July, while leaving more instream
flow (minimum 0.5 cfs) from August through October than current conditions. As flow diversion will be the same or lesser in amount, the transport of large wood, and the maintenance/creation of pools and other
habitat features will be maintained. The increase in instream flows at the diversion point (RM 6) from
August to October may have the potential to have slight positive (beneficial) effects to pool volume in
LFH (RM 2.6) during this typical low-flow period in Dog River.
Summary of Effects on Large Woody Debris, Pool Frequency & Quality/Large Pools, Off-channel Habitat and Floodplain Connectivity, Refugia, Width/Depth Ratio, and Streambank Condition
Overall, the Dog River Pipeline Project construction elements will result in discountable effects to channel habitat indicators as described above. Disturbance is small in scale (<1 acre) and > 2 miles from
LFH. The proposed action includes diversion of the same amount of flow (all available surface water)
from November to July, while leaving more instream flow (0.5 cfs) from August through October than current conditions. As flow diversion will be the same or lesser in amount, the transport of large wood,
and the maintenance/creation of pools and other habitat features will be maintained. The increase in
instream flows at the diversion point (RM 6) from August to October may have the potential to have
slight positive effects to pool volume in LFH (RM 2.6) during this typical low-flow period in Dog River.
3.4.2.6 Change in Peak/Base Flows
No Action
Under the No Action Alternative, diversion from Dog River and storage and release in Crow Creek
Reservoir would continue to modify the flow regime in the Dog River and South Fork Mill Creek
subwatersheds.
In South Fork Mill Creek mid- and early winter flows, spring flows, and summer flows would continue to
be affected most. Direct access to the main channel of South Fork Mill Creek would remain limited and human perturbation other than water management would be low. Average peak flows in early and mid-
winter would remain elevated above naturalized levels due to contributions from diversion. Below the
dam, they would be reduced due to the filling of the reservoir and retention for storage. Average spring
peak flows would remain higher than naturalized above and below the dam because of diversion contributions and spill combined with release. Base flows above and below the dam would also remain
elevated above naturalized levels due to contributions from diversion and releases downstream. Changes
in habitat quality would continue to have a slightly negative effect on resident trout habitat process and
No Effect or Neutral on LFH/CH.
In Dog River, effects to streamflow from pipeline diversion would continue to be greatest during the late
summer and early fall when flows are lowest, and nearly 100 percent of upper Dog River is diverted into the pipeline. During this time, the lowest eighth of a mile segment of Reach 3 below the pipeline
diversion would continue to be partially dewatered reducing the quantity of available habitat to resident
trout and aquatic macroinvertebrates. Instream flows to this segment would continue to be restored
naturally just downstream by springs, seeps, and hyporheic flow. Reaches 1 and 2 of Dog River would
remain a perennial stream type. Impacts to LFH/CH in reach 1 would continue to be negligible

165
Proposed Action - Abandonment of Old Pipeline/Installation of New Pipeline
Pipeline operations is the primary project element affecting potential changes in peak/base flows. Pipeline
abandonment and installation of the new pipeline will not affect existing conditions because it will be necessary to maintain diversion of water through a temporary pipe while the new pipeline is under
construction. The same is true for installation of the AOP and installation of the new pipeline at Brooks
Meadow Creek. Flows will be maintained and diverted during construction activities for all related
project structures (Hydrologist Specialist Report).
The abandonment and installation of the new pipeline will have a neutral effect on LFH/CH since flows
will be maintained during construction through a temporary bypass pipe. The removal of trees and the
resultant reduction in canopy cover to install the new pipeline and maintain a service road has the potential to indirectly influence peak/base flows. A reduction in canopy cover can alter the volume and
timing of stream flow due to reduced evapotranspiration rate and increased snow accumulation.
Temporary staging areas and haul routes are largely in previously disturbed areas and no overstory trees are expected to need removal. This element has no causal mechanism (neutral) to affect changes to peak
or base flows.
The abandonment and installation of the new pipeline would remove trees from around 11 acres in total, with the vast majority (9.7 acres) in the Dog River subwatershed. This accounts for around 0.1 % of
watershed in Dog River subwatershed and 0.01% of the South Fork Mill Creek subwatershed. Given the
high canopy cover and low level of disturbance in the current action area, it is unlikely (discountable
effects) that the action area will experience increased base flow or modified peak flows due to the
extremely minor acreage of forest canopy removal to install the new pipeline and maintain a service road.
Proposed Action - Installation of AOP and pipeline crossing at Brooks Meadow
Creek
Activities associated with the construction of the project have low potential to cause impacts to water
quantity in Brooks Meadow Creek. The damming and diversion of Brooks Meadow Creek during the
construction period may result in a temporary decrease in water quantity in the lowest reach of the creek
and in Dog River while the AOP (culvert) is being installed; however, the decrease would be temporary and minimal. Additionally, a section of the creek may be transformed into a small reservoir (slower
velocities, greater water depths, etc.) until the temporary dam is removed and the creek is routed through
the new culvert under the access road.
Brooks Meadow Creek is not in close proximity to LFH or CH, therefore the temporary damming and
diversion of the creek will not affect listed fish species. The existing ford of Brooks Meadow Creek is
approximately 2.1 miles from the nearest LFH/CH. As a result of this proximity assessment, the effect of this action on peak/base flows is neutral and no further analysis is needed.
Proposed Action - Installation of Fish Screen and Diversion/Outlet Structures
This project element has no causal mechanism to affect this indicator as flows will be maintained during
construction.
The proposed fish screen and diversion/outlet structures in Dog River and South Fork Mill Creek are not in close proximity to LFH or CH and existing flows will be maintained during construction activities,
therefore these activities will not affect aquatic species or LFH/CH. As a result, the effect of these actions
on peak/base flows are expected to be neutral and no further analysis is needed.

166
Proposed Action - Temporary Staging Areas/Materials Hauling
Temporary roads and material hauling will not occur in the proximity of LFH/CH therefore the effects of
these activities on peak/base flows will be neutral and no further analysis is needed.
Proposed Action - Pipeline Operations
The Proposed Project will continue to divert flows from Dog River into South Fork Mill Creek for storage in Crow Creek Reservoir. A portion of the river’s flow will be diverted by the pipeline throughout the
year, thus altering both peak and base flow. The effects of diversion on peak flows would continue to be
greatest during the late fall and early winter months when Crow Creek Reservoir is filling. Diversion will decrease the overall magnitude of mean daily peak flows in Dog River during that time. Data indicate it
could be by as much as 70 percent in a year when total fall/winter precipitation is below normal. The
majority of peak runoff however, which occurs in the spring, would not be expected to be attenuated nearly to that degree. This is because in most years, Crow Creek Reservoir would be filled by early to
mid-February. Typically, the majority of the spring freshet would not be diverted, and would pass
downstream to lower Dog River (Hydrology Specialist Report). Summer base flows in Dog River would
increase compared to existing conditions as a result of the required minimum in-stream flow of the 0.5 cfs from August 1 to October 31. The majority of the Dog River flow (~80%–83%) would still be diverted
from the channel during these low-flow periods. The greatest potential for impacts to water quantity
would be within Reach 3 of Dog River immediately downstream of the intake; however, inputs from hyporheic flow and perennial tributaries (such as Brooks Meadow Creek) that enter Dog River shortly
downstream of the diversion will help recover its surface flow.
The replacement of the Dog River pipeline will have low potential for short- and long-term impacts to
peak/base flows in the Dog River and South Fork Mill Creek watersheds.
During high flow periods (winter and spring) pipeline operations will have the potential to decrease water
quantity in Dog River because of the expanded capacity of the replacement pipeline (24-inch diameter) to
divert additional water. This expanded capacity will allow The Dalles to fill Crow Creek Reservoir faster by diverting a greater proportion of peak flows when they are available. Once the Reservoir is filled, the
amount of diverted flow will be decreased. Pipeline diversions during high-flow periods will decrease the
magnitude of peak flows in the river, since up to 26.3 cfs (73% of the estimated D5 flow of 35.9 cfs) (USGS 2017) could be diverted. The diversion capacity of the replacement pipeline will be greater than
the average monthly flow in May (15.6 cfs) and June (18.2 cfs) in Dog River upstream of the diversion
(MHNF 2017a), therefore the pipeline will only be filled during peak runoff events. USGS streamflow
records from 1960–1971 indicate that Dog River flows at the site of the diversion may reach 26.3 cfs or greater in 2 of every 3 years; however, the duration of those peak flows will be minimal. The potential to
divert the entirety of spring runoff flows into the pipeline will generally be constrained by flow
availability (peak flows may only last a matter of hours or days) and Crow Creek Reservoir storage capacity. It is expected that the diversion schedule will be similar to the existing schedule although the
larger replacement pipeline will be filled to capacity less frequently, due to the larger capacity of the
replacement pipeline.
Changes in flows to Reaches 1–3 downstream of the diversion have the potential to be greater than those
associated with existing conditions because of the increased capacity of the replacement pipeline.
However, the existing pipeline is rarely filled to capacity due to lack of flow in Dog River and/or Crow
Creek Reservoir storage capacity.
The Dog River pipeline inlet (Lat/Long is: N 45 24.454 W 121 31.156) is located at about river mile
(RM) 6.0 in Dog River, or about 0.5 RM upstream of the Forest Service Rd 4400 in the Dog River 6th
field subwatershed of the East Fork Hood River 5th field watershed. The Dog River pipeline outlet (Lat/Long is: N 45 25.904 W 121 31.2544,054) flows into the South Fork Mill Creek at about RM 15.5.

167
South Fork Mill Creek is the primary drainage in the South Fork Mill Creek 6th field subwatershed of the
Mill Creek 5th field watershed. Only the lower reaches (reaches 1 and 2) of Dog River is in proximity to LFH and critical habitat. Effects to LFH in this reach are likely to be discountable because input from
hyporheic flow and perennial tributaries such as Brooks Meadow Creek that enter Dog River shortly
downstream of the diversion will help recover surface flow diverted through the pipeline.
The probability of affecting seasonal peak and base flows in LFH/CH within the action area is not
discountable. The slight negative effect from this project element is insignificant in magnitude and
presents no measurable risk to listed species or habitat.
The potential for effects to the quantity of water in South Fork Mill Creek will be low under the Proposed
Action although peak flows will have the potential to increase from 12.3 to 26.3 cfs (a 114% increase)
with the expanded pipeline capacity. Despite the increased pipeline capacity, the frequency with which
the pipeline will be filled to capacity will be low due to the lack of available Dog River flow and Crow Creek Reservoir storage capacity limitations. Additionally, habitat impacts from higher magnitude surges
during peak flows will be minimized through management of pipeline operations.
The Dog River replacement pipeline will have low potential for short- and long-term impacts to peak/base
flows within the Dog River watershed. A portion of the river’s flow will be diverted by the pipeline
throughout the year, thus reducing water quantity; although the severity of impacts will vary seasonally and will only change from the existing condition during August 1 to October 31 due to the inclusion of a
Project Design Criterion that will require a minimum in-stream flow of 0.5 cfs to be left in the river
during that period. The flow in Dog River during these months would increase thus reducing the
magnitude of water quantity effects. The majority of the Dog River flow (~80%–83%) will still be diverted from the channel during this low-flow period. The only potential for water quantity impacts to
LFH will be within Reach 1where listed species may be present; however, inputs from hyporheic flow
and perennial tributaries (such as Brooks Meadow Creek) that enter the river shortly downstream of the diversion will help to recover surface flow in this lower reach. Installation of a new pipeline would
eradicate the water loss that has persisted for many decades from the old conveyance line. The total
amount of water loss would no longer factor into the amount of water diverted from Dog River to meet
demand. Conveyance of water using the new pipeline would become more efficient, so that only the water needed to meet demand would be withdrawn. The amount of unused water diverted from Dog River could
be minimized. Since operations that manage the timing and amount of water diverted from Dog River
would change little under the Proposed Action, the amount of water loss due to leakage could become available as bypass flow downstream, or to fill Crow Creek Reservoir earlier in the winter and maintain
its surface elevation longer into the spring. The water that was lost to leakage during base flows, would be
available for maintaining at least 0.5 cfs bypass flow downstream to lower Dog River from August 1 to
October 31.
During high flow periods (winter and spring) the Project has the potential to decrease water quantity in
Dog River due to the expanded capacity of the replacement pipeline (24-inch diameter) to divert
additional water. This expanded capacity will allow The Dalles to fill Crow Creek Reservoir faster by diverting a greater proportion of peak flows when they are available. Once the Reservoir is filled, the
amount of diverted flow will be decreased. Pipeline diversions during high-flow periods will decrease the
magnitude of peak flows in the river, by as much as 26.3 cfs (73% of the estimated D5 flow of 35.9 cfs) (USGS 2017). The diversion capacity of the replacement pipeline will be greater than the average
monthly flow in May (15.6 cfs) and June (18.2 cfs) in Dog River just upstream of the diversion (MHNF
2017b), and therefore the pipeline could only be filled during peak runoff events. USGS streamflow records from 1960–1971 indicate that Dog River flows at the site of the diversion may reach 26.3 cfs or
greater in 2 of every 3 years; however, the duration of those peak flows may be minimal. It is expected
that the diversion schedule under the Proposed Action will be similar to existing volumes, although the

168
larger replacement pipeline will be filled to capacity less frequently, due to the larger capacity of the
replacement pipeline.
Effects to Reaches downstream of the diversion have the potential to be greater than those associated with
existing conditions due to the increased capacity of the replacement pipeline. However, the existing
pipeline is rarely filled to capacity due to lack of flow in Dog River and/or Crow Creek Reservoir storage
capacity.
Summary of Effects on Peak/Base Flows
Installation of AOP and pipeline crossing at Brooks Meadow Creek, and installation of fish screen and diversion/outlet structures has no causal mechanism to affect this indicator (neutral) since baseline flows
will be maintained during and post construction, and no removal of trees will occur. A reduction in
canopy cover can alter the volume and timing of stream flow due to reduced evapotranspiration rate and increased snow accumulation. Temporary staging areas and haul routes are largely in previously disturbed
areas and no overstory trees are expected to need removal. This element also has no causal mechanism
(neutral) to affect changes to peak or base flows.
There are no proposed changes to operations downstream of Crow Creek Reservoir, which is 7 miles
upstream of LFH, thus there is neutral possibility of affecting baseline peak/base flow levels in LFH in
SF Mill Creek.
The larger Dog River diversion pipe capacity may allow larger flow volume to be captured opportunistically from episodic storm events from November-February over the current 12.3 cfs, and
these short-term events may allow reservoir fill at a few days (to weeks) earlier than current rate. The
quantity of water diverted from upper Dog River and its tributaries would remain largely unchanged from current conditions between early November and July, thus there will be discountable effects to peak
flows in Dog River. The change in pipeline operations to maintain at least 0.5 cfs bypass flow at the
diversion point from August 1 to October 31 is expected to result in a slight increase in base flow in LFH that is 3.4 miles downstream. Overall, there may be a slight positive effect from this project element at
LFH from the increased base flow volume as compared to baseline (no bypass flows at diversion point).
This is expected to benefit Coho and Chinook spawning habitat, as well as slightly increase rearing
habitat (pool depth) for steelhead, Coho and Chinook juveniles.
3.4.2.7 Effects Determination
Determinations for the proposed action were made as a result of analysis at the 6th-field watershed scale.
The checklist for Documenting Environmental Baseline and Effects of Proposed Action(s) on Relevant
Indicators was consulted for this project and a cumulative effects analysis was completed. Potential
effects to steelhead trout, Chinook salmon, Coho salmon, and resident cutthroat and rainbow trout using a habitat approach is summarized below (Table 55). The AP provides a dichotomous key which is utilized
to reach the appropriate ESA effect determination (Table 56).
Potential effects to water quality or habitat resulting from the project will be substantially diminished and immeasurable by the time they reach known occurrence of LCR chinook, Coho, and steelhead therefore
the effects will be discountable and the determination Not Likely to Adversely Affect (NLAA). Under
the proposed project there will be No Effect (NE) to Middle Columbia River (MCR) steelhead and their
critical habitat since they are not known to occur within the project action area.
The Magnuson-Stevens Fishery Conservation and Management Act (amended 1996) required designation
of Essential Fish Habitat (EFH) for Chinook and Coho salmon. The Dog River and East Fork Hood River
Basins (HUC 17070105) are designated as Chinook and Coho salmon EFH. Although both species have been documented in the EFHR and lower Dog River, EFH would not be adversely affected (NAA) by the

169
project since project effects will be ameliorated within the distance from the intake structure downstream
to their known occurrence.
Coastal cutthroat trout and Dalles Juga are present in the project area where in-water activities will occur.
The project may impact coastal cutthroat trout and Dalles Juga individuals or habitat (MIIH).
However, project actions will not likely contribute to a trend towards federal listing since fish present in the immediate area will be relocated prior to in-water work as per project PDCs and BMPs. Impacts are
expected to be minimal and localized. The project will likely benefit cutthroat trout by providing
additional bypass flow during the typical low flow period (August 1to October 31) in Dog River
downstream of the intake structure.
Pacific lamprey is thought to be present only in the lower reach of Dog River and the South Fork of Mill
Creek although its presence has not been documented. Upper limits for Pacific lamprey in South Fork
Mill Creek is likely Mill Creek falls at RM 3.0 and lower Dog River below Dog River falls. The project
may impact pacific lamprey individuals or habitat (MIIH).
Inland redband trout may be present in the North Fork Mill and South Fork Mill Creek 6th field
subwatershed but are not present in the project area or action area. Salmonids in South Fork Mill Creek above Mill Creek Falls are cutthroat trout (USFS, 2000). For this analysis, resident inland redband trout
distribution is assumed to be the same as MCR steelhead distribution, therefore the effects determination
is no impact.

170
Table 55. Summary of effects of project elements on aquatic habitat indicators.
Indicator
Element Summary
Indicator
Summary
Action Area
Baseline
Condition
Pipeline
Abandon/
Installation
AOP
Fish
Screen/
Inlet/
Outlet
Roads/
Material
Hauling
Pipeline
Ops.
Temperature PF D D N D D D
Sediment and Substrate
Character PF – Dog
River FAR – SF
Mill
D D D D N D
Chemicals/Nutrients PF D D D D N D
Physical Barriers PF N N N N N N
Large Woody Debris FAR D D N D B D
Pool Frequency and Quality, Large Pools
FAR D D N D B D
Off-channel Habitat, Floodplain Connectivity
FAR D D N D B D
Refugia FAR D D N D B D
Width to Depth Ratio FAR D D N D B D
Streambank Condition PF D D N D B D
Change in Peak/Base Flows
FAR D N N D D for Peak B for Base
D
Table key: PF Properly functioning N Neutral FAR Functioning at risk D Discountable NPF Not properly functioning I Insignificant B Beneficial
Table 56. Analytical process project effects determination key for species and designated critical habitat
1) Do any of the indicator summaries have a positive or negative conclusion?
X Yes - Go to 2
No – No Effect
2) Are the indicator summary results only positive?
Yes – NLAA
X No – Go to 3
3) If any of the indicator summary results are negative, are the effects insignificant or
Discountable?
X Yes – NLAA
No – LAA, fill out Adverse Effects Form
This project was designed to minimize negative effects to aquatic habitat, water quality, and ESA listed
fish species and sensitive aquatic species through PDCs, while still meeting the resource objectives
identified in the proposed action.
This project is located in relatively close proximity to habitat utilized by summer steelhead, spring
Chinook and Coho salmon so land management actions are often likely to expose fish to negative effects. However, the implementation of this project will not likely result in negative effects of measurable

171
magnitude to any of the habitat or population indicators. Direct take to any listed fish in the action area
will not occur under implementation of any project element.
Table 57. The Dog River Pipeline Project effects determination summary for ESA listed species, designated
critical habitat and essential habitat, and Region 6 Regional Forester’s Sensitive Species.
Listed Species Or Habitat ESA Status
ESA / EFH ESA/EFH Determination
No Action Proposed Action
Lower Columbia River Chinook
Salmon – Critical Habitat
Designated May Affect, Not Likely to
Adversely Affect
May Affect, Not Likely to Adversely Affect
Lower Columbia River Chinook
Salmon – Essential Habitat
Designated Not Adversely Affected Not Adversely Affected
Lower Columbia River Coho
Salmon – ESU
Threatened May Affect, Not Likely to
Adversely Affect
May Affect, Not Likely to Adversely Affect
Lower Columbia River Coho
Salmon – Critical Habitat
Designated y May Affect, Not Likely to
Adversely Affect
y May Affect, Not Likely to
Adversely Affect
Lower Columbia River Coho
Salmon – Essential Habitat
Designated Not Adversely Affected Not Adversely Affected
Lower Columbia River Steelhead
Trout – ESU
Threatened y May Affect, Not Likely to
Adversely Affect
y May Affect, Not Likely to
Adversely Affect
Lower Columbia River Steelhead
Trout – Critical Habitat
Designated May Affect, Not Likely to
Adversely Affect
May Affect, Not Likely to Adversely Affect
Region 6 Sensitive Aquatic
Species
Location No Action Proposed Action
Pacific Lamprey Dog River, Mill
Creek
May Impact Individuals or Habitat
May Impact Individuals or Habitat
Cutthroat Trout Dog River, Mill
Creek
May Impact Individuals or
Habitat
May Impact Individuals
or Habitat
Dalles Juga Mill Creek May Impact Individuals or Habitat
May Impact Individuals or Habitat
Rocky Mountain
Duskysnail
Dog River, Mill
Creek
May Impact Individuals or Habitat
May Impact Individuals or Habitat
3.4.2.8 Cumulative Effects
Cumulative effects include the effects of past, present, and reasonably foreseeable future state, tribal,
local or private actions that overlap in time and space within the action area (i.e., affected environment) of the Federal action subject to consultations (50 CFR 402.02). The “reasonably foreseeable” clause is a key
factor in assessing and applying cumulative effects and could include actions that are permitted,
imminent, have an obligation of venture, or have initiated contracts (U.S. Fish and Wildlife Service and NOAA Fisheries 1998). Past and present impacts are incorporated as part of the environmental baseline
and discussed below.
Only those indicators that are affected by the project are included in the cumulative effects analysis; if the action has no direct/indirect effects there would be no cumulative effects. The spatial context for the

172
following cumulative effects analysis is the action area as described previously. Project activities
occurring outside this area may have an effect on aquatic species and/or habitat but would not add to those effects from project activities proposed in this environmental assessment. The temporal context
depends on the existing or future project/activity. If there is an overlap in time from an effects
perspective, then it is included.
Cumulative effects from an aquatic species and habitat perspective overlap considerably with water
quality (peak/base flows, sediment) cumulative effects because most of the attributes analyzed by the
hydrologist are directly related to aquatic habitat conditions.
Table 58. Summary of past, present, and reasonably foreseeable future actions which may contribute to cumulative effects to aquatic fauna and habitat for the no action and proposed action alternatives
Project Potential
Effects
Overlap
in time
Overlap
in space
Measurable
Cumulative
Effect?
Extent, Detectable?
Aquatic Species
or Stream
Habitat Effects
Existing
Old Forest
Service
Timber
Harvest
Units
Large Wood Recruitment Potential; Channel
and floodplain processes: Pool Frequency and Quality and Large Pools, Off-Channel Habitat and Floodplain Connectivity,
Refugia, Width/Depth Ratio, Streambank Condition.
Yes Yes
Not Likely Projects completed. Removing large wood from stream channels was
a common practice into the 1970’s thus the amount of large wood in many streams within the action area have less large wood than historic conditions. None of the actions proposed in this
EA would directly reduce existing levels of large wood in any stream. Indirect effects, associated with slight reductions in large wood recruitment potential, could result in localized reduction in
recruitment along the Dog River pipeline corridor north of the 44 road and along a localized area on Brooks Meadow Creek that is adjacent to the pipeline corridor. This may result in a small decrease in large wood
recruitment and thus less in stream wood for the next 50 years or more within those reaches.
All the habitat indicators for this project were
either discountable, neutral, or insignificant. Some impact is possible in terms of rearing habitat to resident
salmonids in reaches adjacent to the pipeline in Dog River and Brooks Meadow Creek. There would be no discernible
impact downstream where ESA aquatic species and CH occurs.
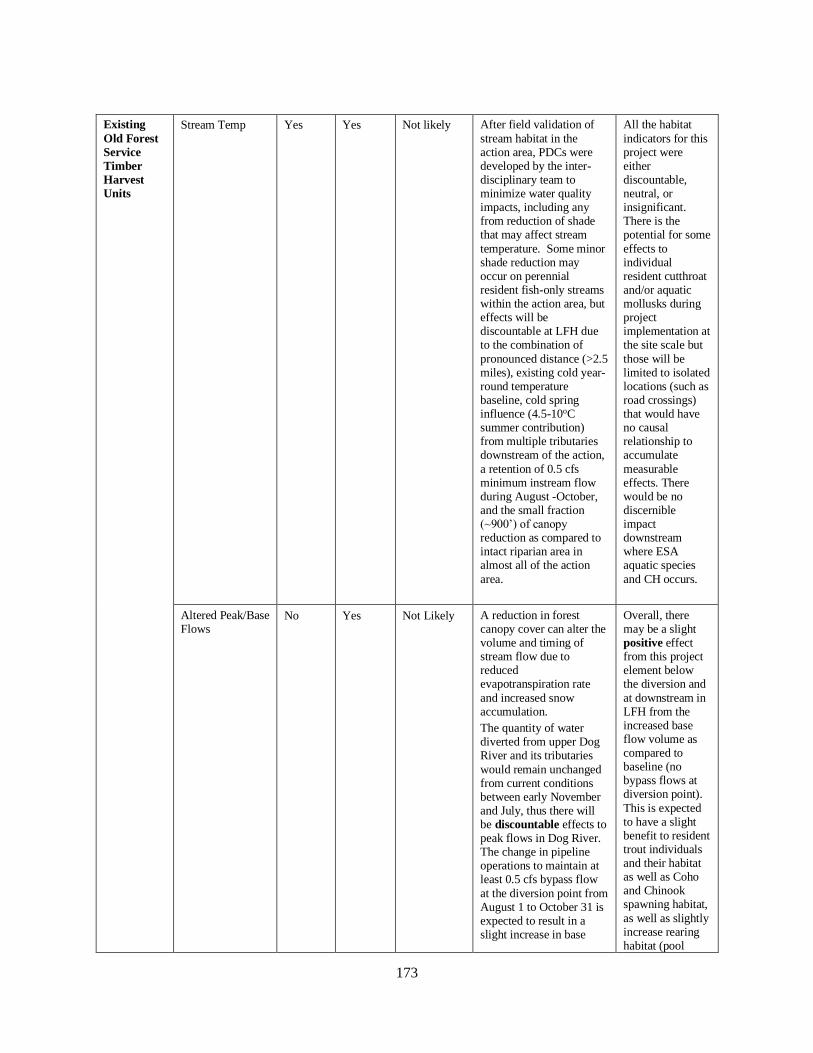
173
Existing
Old Forest
Service
Timber
Harvest
Units
Stream Temp Yes Yes Not likely After field validation of
stream habitat in the action area, PDCs were developed by the inter-disciplinary team to minimize water quality impacts, including any from reduction of shade that may affect stream
temperature. Some minor shade reduction may occur on perennial resident fish-only streams within the action area, but effects will be discountable at LFH due to the combination of
pronounced distance (>2.5 miles), existing cold year-round temperature baseline, cold spring influence (4.5-10oC summer contribution) from multiple tributaries downstream of the action,
a retention of 0.5 cfs minimum instream flow during August -October, and the small fraction (~900’) of canopy reduction as compared to intact riparian area in almost all of the action
area.
All the habitat
indicators for this project were either discountable, neutral, or insignificant. There is the potential for some
effects to individual resident cutthroat and/or aquatic mollusks during project implementation at the site scale but
those will be limited to isolated locations (such as road crossings) that would have no causal relationship to accumulate
measurable effects. There would be no discernible impact downstream where ESA aquatic species
and CH occurs.
Altered Peak/Base Flows
No Yes Not Likely A reduction in forest canopy cover can alter the volume and timing of stream flow due to reduced evapotranspiration rate
and increased snow accumulation.
The quantity of water diverted from upper Dog River and its tributaries
would remain unchanged from current conditions between early November and July, thus there will be discountable effects to peak flows in Dog River. The change in pipeline operations to maintain at least 0.5 cfs bypass flow
at the diversion point from August 1 to October 31 is expected to result in a slight increase in base
Overall, there may be a slight positive effect from this project element below the diversion and
at downstream in LFH from the increased base flow volume as compared to baseline (no bypass flows at diversion point).
This is expected to have a slight benefit to resident trout individuals and their habitat as well as Coho and Chinook spawning habitat,
as well as slightly increase rearing habitat (pool

174
flow in LFH that is 3.4 miles downstream.
There are no proposed changes to operations downstream of Crow Creek Reservoir, which is 7 miles upstream of LFH, thus there is neutral
possibility of affecting
baseline peak/base flow levels in LFH in SF Mill Creek.
depth) for steelhead, Coho and Chinook
juveniles.
Existing
Old Forest
Service
Timber
Harvest
Units
Sediment Yes Yes No The proposed project will
result in disturbed soil in localized areas that has the potential to enter stream channels; primarily associated with diversion structure replacement/fish
screening, material hauling, road maintenance, and AOP installation. Sediment/turbidity levels may be detectable at the site scale within resident fish only streams, but will
be discountable at LFH due to multiple PDCs that minimize sediment mobilization, as well as the pronounced distance (>2.9 miles) between instream work and LFH.
The habitat
indicators for this project were either discountable, neutral, or insignificant.
Effects from turbidity and fine sediment levels in LFH were insignificant due to the extended distance (>2.9 miles) of the
project to LFH. There is the potential for some effects to individual resident cutthroat and/or aquatic mollusks during
project implementation at the site scale but those will be limited to isolated locations (such as road crossings) that would have no causal
relationship to accumulate measurable effects. The installation of the AOP culvert as proposed will eliminate an
active ford crossing thereby reducing potential turbidity and fine sediment at the site scale that will benefit resident

175
fish species and habitat.
Timber
harvests on
federal,
county and
private
lands
including
associated
road/
landing
construc-
tion
Large Wood
Recruitment Potential, Channel and floodplain processes: Pool Frequency and Quality and Large Pools, Off-Channel Habitat
and Floodplain Connectivity, Refugia, Width/Depth Ratio, Streambank Condition. Change in
Peak/Base Flows, Sediment
No Yes Not Likely Projects completed.
Although most previous timber harvest occurred decades ago riparian stands were treated more aggressively in many areas than current practices and thus the amount of standing wood
remaining was less than desired conditions. These areas are still recovering (trees are still growing) and those less 40 years old in particular have yet to grow to a size where they would contribute
meaningfully to riparian/stream habitat even if they were to fall. The riparian tree removal proposed in this EA would increase the riparian area that would not contribute as much large wood
compared to no action.
Minimal
cumulative effect throughout action area because the reduction in large wood recruitment potential resulting from proposed project would be
quite small (less than 1 percent of Riparian Reserves affected). This reduction in large wood potential would not directly affect
aquatic fauna or habitat; indirect effects could result in localized reductions in in-stream large wood and pool habitat quality
and quantity.
Polallie
Cooper
Fuels
Reduction
Project
Large Wood
Recruitment Potential, Channel and floodplain processes: Pool Frequency and Quality and Large Pools, Off-Channel Habitat
and Floodplain Connectivity, Refugia, Width/Depth Ratio, Streambank
Yes Yes Not Likely An overlap in time and
location may exist with other timber management on USFS managed land. There are PDC’s in place that prevent measurable effects to the habitat indicators described above. Private and/or
County timber activities in the Dog River and SF Mill Creek watersheds are limited in location and scale as the majority of both watersheds are federally managed. Therefore, the potential
The habitat
indicators for this project were either discountable, neutral, or insignificant. Effects to aquatic species were
insignificant at the 6th field scale with the potential for some effects to individual resident cutthroat and/or aquatic mollusks during

176
Condition. Sediment
for effects to habitat indicators resulting from non-federal timber
management are likely immeasurable at the 6th field scale.
project implementation at the site scale.
Timber harvest activities within the Dog River and Mill Creek watershed could result in some direct localized effects to resident
trout and aquatic mollusks but will be limited to isolated locations (such as road crossings) that would have no causal
relationship to accumulate measurable effects.
Altered Peak
and/or Base Flows
Yes Yes Not Likely A reduction in forest
canopy cover can alter the volume and timing of stream flow due to reduced evapotranspiration rate and increased snow
accumulation.
The quantity of water diverted from upper Dog River and its tributaries would remain unchanged
from current conditions between early November and July, thus there will be discountable effects to peak flows in Dog River. The change in pipeline operations to maintain at least 0.5 cfs bypass flow at the diversion point from
August 1 to October 31 is expected to result in a slight increase in base flow in LFH that is 3.4 miles downstream.
There are no proposed changes to operations downstream of Crow Creek Reservoir, which is 7 miles upstream of LFH, thus there is neutral
possibility of affecting baseline peak/base flow
levels in LFH in SF Mill Creek.
Overall, there
may be a slight positive effect from this project element below the diversion and at downstream in
LFH from the increased base flow volume as compared to baseline (no bypass flows at diversion point). This is expected
to have a slight benefit to resident trout individuals and their habitat as well as Coho and Chinook spawning habitat, as well as slightly
increase rearing habitat (pool depth) for steelhead, Coho and Chinook juveniles.

177
Forest
Service
Road 4400
Hazard tree
Removal
Large Woody
Debris Recruitment Potential, Stream temperature
Yes Yes Not Likely An overlap in time and
location may exist with other timber management on USFS managed land. There are PDC’s in place that prevent measurable effects to the habitat indicators described above. Private and/or
County timber activities in the Dog River and SF Mill Creek watersheds are limited in location and scale as the majority of both watersheds are federally managed. Therefore, the potential
for effects to habitat indicators resulting from non-federal timber management are likely immeasurable at the 6th field scale.
Habitat indicators
for this project were either discountable, neutral, or insignificant. Effects to aquatic species were insignificant at
the 6th field scale with the potential for some effects to individual resident cutthroat and/or aquatic mollusks during project
implementation at the site scale. Timber harvest activities within the Dog River and Mill Creek watershed could result in some
direct localized effects to resident trout and aquatic mollusks but will be limited to isolated locations (such as road crossings) that
would have no causal relationship to accumulate measurable effects.
The Dalles
Watershed
Phase I and
II Fuel
Reduction
Large Wood Recruitment Potential
Yes Yes
Unlikely Removing large wood from stream channels was a common practice into the 1970’s thus the amount of large wood in many streams within the action area have less large
wood than historic conditions. None of the actions proposed in this EA would directly reduce existing levels of large wood in any stream. Indirect effects, associated with slight reductions in large wood recruitment
potential, could result in localized reduction in recruitment along the Dog River pipeline corridor north of the 44 road and
A reduction of large wood recruitment could result in fewer pools and some
reduction in channel stability because one of the major roughness elements that forms and maintains habitat
is large wood.
All the habitat indicators for this project were either
discountable, neutral, or insignificant.

178
along a localized area on Brooks Meadow Creek that is adjacent to the
pipeline corridor. This may result in less large wood recruitment and thus less in stream wood for the next 50 years or more within those reaches.
Some impact is possible in terms of rearing habitat
to resident salmonids in reaches adjacent to the pipeline in Dog River and Brooks Meadow Creek. There would be no
discernible impact downstream where ESA aquatic species and CH occurs. A negligible impact to aquatic
macrointertebrate populations as a whole, but some localized habitat degradation possible.
Therefore, effects to aquatic species were insignificant at the 12th field scale with the potential for some effects to individual
resident cutthroat and/or aquatic mollusks at the site scale.
Road
Decommis-
sioning and
Closures
Sediment Yes Yes Not likely After field validation of
stream habitat in the action area, PDCs were developed by the inter-disciplinary team to minimize water quality impacts.
All the habitat
indicators for this project were either discountable, neutral, or insignificant.
Some impact is possible in terms of rearing habitat to resident salmonids in reaches adjacent to the pipeline in Dog River and
Brooks Meadow Creek. There would be no discernible impact downstream where ESA

179
aquatic species and CH occurs.
National
Forest
System
road and
trail
mainten-
ance
activities
Sediment Yes Yes No The proposed project will
result in disturbed soil in localized areas that has the potential to enter stream channels; primarily associated with diversion structure replacement/fish
screening, material hauling, road maintenance, and AOP installation. Sediment/turbidity levels may be detectable at the site scale within resident fish only streams,but will
be discountable at LFH due to multiple PDCs that minimize sediment mobilization, as well as the pronounced distance (>2.9 miles) between instream work and LFH.
The habitat
indicators for this project were either discountable, neutral, or insignificant.
Effects from turbidity and fine sediment levels in LFH were insignificant due to the extended distance (>2.9 miles) of the
project to LFH. There is the potential for some effects to individual resident cutthroat and/or aquatic mollusks during project
implementation at the site scale but those will be limited to isolated locations (such as road crossings) that would have no causal
relationship to accumulate measurable effects.

180
The Dalles
Fuels
Reduction
Project
Change in
Peak/Base Flows Yes Yes No A reduction in forest
canopy cover can alter the volume and timing of stream flow due to reduced evapotranspiration rate and increased snow accumulation.
There could be an increase in diversion during the late fall and early winter due to larger diameter pipe. But it would only be when there is a higher
amount of flow available. In other words, diversion would not be increased, only capacity to capture more when it’s there. Thus there will be discountable effects to peak flows in Dog River.
The change in pipeline operations to maintain at least 0.5 cfs bypass flow at the diversion point from August 1 to October 31 is expected to result in a slight increase in base flow in LFH that is 3.4
miles downstream.
There are no proposed changes to operations downstream of Crow Creek Reservoir, which is 7 miles upstream of LFH,
thus there is neutral
possibility of affecting baseline peak/base flow levels in LFH in SF Mill Creek.
Overall, there
may be a slight positive effect from this project element below the diversion and at downstream in LFH from the increased base
flow volume as compared to baseline (no bypass flows at diversion point). This is expected to have a slight benefit to resident
trout individuals and their habitat as well as Coho and Chinook spawning habitat, as well as slightly increase rearing habitat (pool
depth) for steelhead, Coho and Chinook juveniles.

181
The Dalles
Fuels
Reduction
Project
Channel and
floodplain processes: Pool Frequency and Quality and Large Pools, Off-Channel Habitat and Floodplain Connectivity,
Refugia, Width/Depth Ratio, Streambank Condition.
Yes Yes No An overlap in time and
location may exist with this project. PDC’s were in place during the Watershed Fuels reduction that prevent measurable effects to these habitat indicators.
None
Ongoing
City of The
Dalles
Operations
in the
Municipal
Watershed
Large Wood
Recruitment Potential, Channel and floodplain processes: Pool Frequency and Quality and Large
Pools, Off-Channel Habitat and Floodplain Connectivity, Refugia, Width/Depth Ratio, Streambank Condition.
Sediment, Peak/Base Flows
Yes Yes Not Likely An overlap in time and
location may exist with this project. The City has PDC in place that prevent measurable effects to the habitat indicators described above.
The habitat
indicators for this project were either discountable, neutral, or insignificant.
Effects to aquatic species were insignificant at the 6th field scale with the potential for some effects to individual resident cutthroat and/or aquatic
mollusks during project implementation at the site scale.
Dufur Mill
Road (44)
and USFS
Road 17
Mainten-
ance
Habitat Indicators Yes Yes No An overlap in time and
location may exist with this project. Trail projects and this project have PDC’s in place that prevent measurable effects
to the habitat indicators described above. Treating weeks may be beneficial to some of the habitat indicators described above.
The habitat
indicators for this project were either discountable, neutral, or
insignificant. Effects to aquatic species were insignificant at the 6th field scale with the potential for some effects to individual
resident cutthroat and/or aquatic

182
mollusks during project implementation at
the site scale. Trail maintenance has no causal relationship that would accumulate localized effects to resident fish or aquatic mollusks
and may be beneficial at the 6th field scale.
Surveyors
Ridge and
Other
Ongoing
Trail
Mainte-
nance
Habitat Indicators Yes Yes No An overlap in time and
location may exist with this project. Weed maintenance projects and this project have PDC’s in place that prevent measurable effects to the habitat indicators
described above. Managing invasive weeds will be beneficial to the habitat indicators described above.
None
Specific
Noxious
Weeds
Treatments
Yes Yes None None None
Trail
relocations
(Dog River
Trail #675,
Cooks
Meadow
Trail #639,
Surveyor’s
Ridge Trail
#688)
Large Wood
Recruitment Potential, Channel and floodplain processes: Pool Frequency and Quality and Large Pools, Off-
Channel Habitat and Floodplain Connectivity, Refugia, Width/Depth Ratio, Streambank Condition. Sediment
Yes Yes Not Likely An overlap in time and
location may exist with this project. Both the trail relocation project and this project have PDC’s in place that prevent measurable effects to the habitat indicators
described above..
The habitat
indicators for this project were either discountable, neutral, or insignificant. Effects to aquatic
species were insignificant at the 6th field scale with the potential for some effects to individual resident cutthroat and/or aquatic mollusks during
project implementation at the site scale. Roadside sanding at highway 35 would not measurably accumulate
effects to resident fish or aquatic mollusks.

183
Highway 35
road
Mainten-
ance and
Sanding
Sediment
Yes Yes Not Likely The proposed project will
result in disturbed soil in localized areas that has the potential to enter stream channels; primarily associated with diversion structure replacement/fish screening, material hauling, road
maintenance, and AOP installation. Sediment/turbidity levels may be detectable at the site scale within resident fish only streams, but will be discountable at LFH due to multiple PDCs that
minimize sediment mobilization, as well as the pronounced distance (>2.9 miles) between instream work and LFH
The habitat
indicators for this project were either discountable, neutral, or insignificant. Effects to aquatic species were
insignificant at the 6th field scale with the potential for some effects to individual resident cutthroat and/or aquatic mollusks during
project implementation at the site scale.
Developed
and
Dispersed
Camping
Large Wood Recruitment Potential, Channel and floodplain processes: Pool
Frequency and Quality and Large Pools, Off-Channel Habitat and Floodplain Connectivity, Refugia, Width/Depth
Ratio, Peak/Base Flows, Streambank Condition. Sediment
Yes Yes No An overlap in time and location may exist with this project. Developed and dispersed recreation is managed to prevent
measurable effects to the habitat indicators described above.
The habitat indicators for this project were either discountable,
neutral, or insignificant. Effects to aquatic species were insignificant at the 6th field scale with the potential for some effects
to individual resident cutthroat and/or aquatic mollusks during project implementation at the site scale. Recreation has causal
relationship that would accumulate effects to resident fish or aquatic mollusks.
3.4.3 Consistency Determination
The Dog River Pipeline Project is consistent with all applicable fish/aquatic related federal law, plans,
and guidelines as outlined below.

184
Law, Regulation & Policy
The Mt. Hood National Forest Plan and the Northwest Forest Plan provide guidance for projects in the
form of Standards and Guidelines and recommended Best Management Practices (BMP). There is overlap between aquatics and water quality in terms of applicable standards and guidelines; therefore, those listed
below are directly related to fisheries, or other aquatic special status species. The other water quality
standards can be found in the Hydrology specialist report.
Mt. Hood Forest Plan Standards and Guidelines include (pages Four-64, Four-69, Four-257–258):
Fisheries: FW-137, -138, -139, -145, -147
Threatened, Endangered and Sensitive Plants and Animals: FW-174, -175, -176
B7 General Riparian Area: B7-028, -030, -031, -032, -033, -037, -038, -059
Northwest Forest Plan Standards and Guidelines include:
Riparian Reserve Standard and Guides and Aquatic Conservation Strategy (ACS)
In addition to the above, the Forest Service is required to assess and disclose the effects of any Federal action on Regional Forester’s special status species, as outlined in the Endangered Species Act of 1973
and National Forest Management Act of 1976 (see effects determination section). The Magnuson-Stevens
Fishery Conservation and Management Act of 1976 requires the Forest Service to assess and disclose the
affects to Essential Fish Habitat. Clean Water Act compliance and consistency with the standard and guidelines outlined in the Northwest Forest Plan Aquatic Conservation Strategy objectives determination
is provided for in this analysis and is also discussed in the Hydrology specialist report.
Desired Future Condition
The desired future condition (DFC) for streams and associated riparian areas within the Dog River Project
Area is summarized in several sources as outlined below:
The NWFP Aquatic Conservation Strategy (ACS) was developed”…to restore and maintain the
ecological health of watersheds and aquatic ecosystems contained within them on public lands.” Within
the strategy are nine ACS objectives that give direction regarding maintenance and/or restoration of aquatic processes key to watershed health. These objectives can be considered desired future conditions
from an aquatics perspective for the project area and are described and discussed below.
Finally, the Forest Plan presents desired future conidtions for all management areas, including General Riparian Areas. The list of DFC can be found on pag3e Four-254 in the LRMP, and the General Riparian
Area management goal is to “…achieve and maintain riparian and aquatic habitat conidtions for the
sustained, long-term production of fish, selected wildlife and plant species, and high quality water for the
full spectrum of the Forest’s riparian and aquatic areas.
Survey and Manage
This project is consistent with the survey requirements in the 2001 Record of Decision and Standards and
Guidelines for Amendments to the Survey and Manage, Protection Buffer, and other Mitigation Measures
Standards and Guidelines (USDA and BLM).
Aquatic Conservation Strategy
In order for a project to proceed, “a decision maker must find that the proposed management activitiy is consistant with the Aquatic Conservation Strategy objectives” (ROD B-10) from the Northwest Forest
Plan Record of Decision. The nine objectives are listed on page B-11 of the ROD. Portions of the effects

185
analysis in this document focus on key parameters or indicators that make of elements of the nine ACS
objectives, to determine if the project would restore, maintain, or degrade these indicators. Once this determination is made, the indicators are examined together with the Range of Natural Variability to
ascertain whether the project is consistent with the objectives. A description of the range of natual
variability from the Watershed Analysis are included in the “Existing Conditions” section of this report and the Hydrologist Specialist Report. The following table displays specific indicators that comprise the
ACS objectives and the effects section that covers this indicator in the Environmental Assessment. Also,
refer to the Fisheries Biological Assessment for additional effects descriptions.
The following table displays the individual indicator and the effect the alternative have on those
indicators at the 5th, 6th, and 7th field watershed scale. Fifth field watersheds are generally large in size
(40,000 acres to 250,000 acres), while 6th and 7th field watersheds are smaller (5,000 acres to 40,000 acres
and 2,000 acres to 5,000 acres respectively).
Table 59. ACS Objective Indicators in the EA.
Indicators Analysis Found in the Effects Section of the EA
Water Temperature Hydrology, Fisheries
Sediment Soil Productivity, Water Quality, Fisheries
Contaminents Hydrology. Fisheries
Physical Barriers Hydrology, Fisheries
Substrate Fisheries
Large Woody Debri Fisheries
Pool Frequency Fisheries
Pool Quality Fisheries
Off-Channel Habitat Fisheries
Refugia Fisheries
Width/Depth Ratio Fisheries
Streambank Condition Hydrology, Fisheries
Floodplain Connectivity Hydrology, Fisheries
Peak/base Flows Hydrology, Fisheries
Drainage Network Increase Hydrology
Riparian Reserves Hydrology, Fisheries

186
Table 60. ACS Objective Indicators for each Alternative.
Indicators Effects - No
Action
Effects - Proposed Action
Water Quality:
Temperature
M
M
Sediment M M
Chemical Contamination M M
Habitat Access:
Physical Barriers
D
R – due to culvert replacement
Habitat Elements:
Substrate
M
M
Large Woody Debris M M
Pool Frequency M M
Pool Quality M M
Off-Channel Habitat M M
Refugia M M
Channel Conditions and
Dynamics:
Width/Depth Ratio
M
M
Streamback Condition M M
Floodplain Connectivity M M
Flow/Hydrology:
Peak/Base Flows
M
Slight restore (R) in Dog River, M in South Fork Mill
Drainage Network Increase M M
Watershed Condition:
Riparian Reserves
M
M
Note: The abbreviations in the table are defined as R=Restore which means the actions(s) would result in
acceleration of the recovery rate of the indicator; M=Maintain which means that the function of an indicator does
not change by implementing the action(s) or recovery would continue at its current rate; and D=Degrade which
means changing the function of the indicator for the worse.

187
3.5 Visual Qualities
3.5.1 Existing Condition
Scenic Context for Planning Area
The terrain along the existing pipeline corridor is mostly forested with gently rolling hills. Three miles of
the pipeline falls along the Surveyors Ridge Trail #688. This portion of the pipeline corridor as well as the vast majority of the remainder of the existing pipeline corridor is bordered by mature trees. Where the
trail and the pipeline overlap, the trail tread averages about 24” wide. Most human activity along the
corridor occurs where it overlaps with Surveyors Ridge Trail. The remainder of the corridor likely
receives the highest amount of human use for pipeline maintenance. The overstory along the pipeline corridor is comprised of mixed conifer forest (Douglas-fir, grand fir, and ponderosa pine. There is little
understory throughout the project area due to the density of the existing stand along the pipeline.
Human effects are noticeable throughout the project area as a result of the establishment and maintenance of the pipeline. Fire suppression over the past 100 years has led to lower species diversity and fewer
openings in the stands adjacent to the pipeline, making visibility outside of the corridor difficult.
Visual Management Areas and Scenic Viewshed (B2)
Table 61. Visual Quality Objectives (VQOs 1) by Management Area.
Distance Zone from Viewer Position
Management
Areas
Approximate
Percentage of
Project Area
Foreground Middleground Background
Scenic
Viewshed (B2)
48% Management Area Standards and
Guidelines specific
to Dufur Mill Road
Scenic Viewshed
Management Area Standards and
Guidelines specific
to Dufur Mill Road
Scenic Viewshed
Management Area Standards and
Guidelines specific
to Dufur Mill Road
Scenic Viewshed
Wood Product
Emphasis (C1)
38% Modification Modification Modification
Special
Emphasis
Watershed (B6)
14% Modification Modification Modification
Dufur Mill Road Scenic Viewshed (FSR 4400)
The Dog River Pipeline crosses Dufur Mill Road approximately 1200 feet south of the road’s intersection
with FSR 1700. The pipeline crosses the road here and possibly runs parallel to the western edge of the road for less than 500 feet. The pipeline corridor itself is not easily visible from the road although it is
approximately 90 feet west of the edge of the roadway, as it is screened by dense conifers and is at least
10 feet below the road grade of Dufur Mill Road.

188
The viewshed from the portion of the Dufur Mill Road which falls within the project area is heavily
vegetated. Views beyond the shoulders of the road are blocked by this vegetation. The topography of this portion of the roadway also prohibits extended views. West of the road, the surrounding area is below
road grade, while east of the road is steeper and above grade.
Overall, the views from this designated viewshed are of scenically attractive landscape dominated by natural line, colors, textures and forms. It is a thickly forested landscape with some signs of human
activity stemming from trail intersections and signs of old timber sales further east, and outside of the
project area. Some short portions of the road where previous harvest occurred, and trail intersections, meet a partial retention Visual Quality Objective (VQO) and not the prescribed retention VQO. However
the majority of the road meets the prescribed retention VQO for the foreground (within ½ mile of the
roadway), partial retention VQO for the mid-ground (1/2 mile – 5 miles from the roadway), and partial
retention for the background (more than 5 miles from the roadway).
Project Area Trails
Surveyors Ridge Trail #688 intersects with the planning area. Visual sensitivity levels of the trail are
classified by the Mt. Hood National Forest Plan. Within these sensitivity levels visual quality objectives
are prescribed for foreground, far foreground, and middleground.
Designated Trails within the Planning Area
As a sensitivity level II trail intersecting the project area, Surveyors Ridge Trail currently has well
established trail tread with few visible impacts along the trail. It is meeting the prescribed partial retention
VQO for the visible foreground (660 feet from each side of the trail unless screened by topography.) The
modification VQO is prescribed for both the far foreground (660 beyond the first 660 feet) and
middleground (anything visible beyond 1,320 feet from each side of the trail.)
Approximately 2.7 miles of Surveyors Ridge Trail is located on top of the Dog River Pipeline. Surveyors
Ridge Trail is 12.7 miles in its entirety. The portion of the trail collocated with the pipeline is also an access road for pipeline maintenance. Small portions appear to be a dirt road, but the majority of the trail
collocated with the pipeline has grown in quite a bit. There is a lot of vegetative screening and trees have
encroached along the edges of the roadway creating screening and shade.
A short portion of the trail follows somewhat parallel to FSR 44. The trail is not visible from FSR 44 due
to the screening of trees and vegetation that have grown along the edge of the trail.
Wood Product Emphasis and Special Emphasis Watershed (C1 & B6)
While managed for different purposes, lands under these two management areas share a modification VQO for all distance zones. There has been a significant amount of past timber harvest activity within
these management areas, and the effects of harvest activity are often visually evident. This harvest
activity has created opportunities for viewing distant peaks in some places, which is noted as a desired
condition in the Forest Plan. These harvested stands are generally not visible from the Scenic Viewshed
(B2) within the project area due to vegetative screening.
Other human modifications to the landscape include a network of non-motorized trails. There are also
unofficial dispersed campsites within these management areas. While human modifications are present within these management areas they remain visually subordinate to the natural landscape, and these areas
currently meet the prescribed modification VQO.

189
3.5.2 Effects Analysis
No Action Alternative
There would be no direct effects as a result of implementing the No Action alternative. An indirect effect
from implementing the No Action alternative would be the deterioration of the pipeline to the point that major excavation would need to be done along the pipeline corridor. Heaviest visual impacts of this work
would occur along Surveyor’s Ridge Trail or Dufur Mill Road Scenic Viewshed. If major repairs were
needed under these circumstances, it could be difficult to maintain desired VQOs.
Proposed Action Alternative
Pipeline Installation
Impacts would occur along the existing pipeline. Along the majority of the pipeline corridor, many
mature trees and dead wood line the 25 foot right-of-way, which has grown in significantly over the
years. The removal of this material would significantly alter the right-of-way. This change would not lead to a deviation from prescribed VQOs in most locations, as the desired VQO is modification. However,
where the pipeline overlaps the trail, the prescribed VQO is partial retention. As a mitigation to the
Proposed Action, Surveyors Ridge Trail has been rerouted so that the trail no longer overlaps the pipeline right-of-way for 2.7 miles. There is now one location where the trail intersects with the pipeline. This
mitigation would reduce the magnitude of these effects and ensure that the Proposed Action remain
consistent with prescribed VQOs.
The prescribed VQO of retention would be impacted where the pipeline crosses Dufur Mill Road. Currently, dense vegetation screens the view of the pipeline. Implementation of the project and
maintenance of a 25 foot corridor resulting in the removal of a 25 foot band of vegetation perpendicular to
the viewshed would have a negative impact on the desired VQO of retention. Visual impacts to the east of the road would be minimized due to topography. West of the road, the landscape is below the road grade,
which would make the view of the pipeline corridor more noticeable. According to the Forest Plan,
structures and improvements may be provided within scenic viewsheds in order to protect resource values, for administrative purposes, and to accommodate recreational use. The Dog River Pipeline is
needed for administrative purposes for the City of The Dalles.
The Proposed Action would affect the scenic integrity of the landscape surrounding the pipeline. There
would be a noticeable change in the width of the right-of-way, which would not only occur during implementation, but also be maintained for the lifetime of the pipeline. Throughout the majority of the
project area this impact would not lead to a deviation from the prescribed VQO which is modification.
For the portion of the project area that intersects with Dufur Mill Road, there would be a deviation from the retention VQO. According to the Forest Plan, structures and improvements may be provided within
scenic viewsheds in order to protect resource values, for administrative purposes, and to accommodate
recreational use.
Staging Areas
There are five possible staging areas that could be used for staging pipe, sand/gravel, and materials under the Proposed Action. Visual impact from the southern-most staging area along the 4400-11, would not be
visible from the Dufur Mill Road due to vegetative and topographic screening. The other two proposed
staging areas are located within land use allocations with prescribed VQO of modification, allowing for
activities to visually dominate the characteristic landscape. The staging areas would be utilized during
implementation and then returned to their previous condition, ensuring that impacts would be short-term.

190
Cumulative Effects
The items documented in Table 1 were considered when analyzing cumulative effects for visual quality.
These items were analyzed as a result of their proximity to the planning area and their potential to have an effect on visual quality. The spatial context of the cumulative effects analysis lies within one mile of any
portion of the proposed pipeline replacement.
Under the Proposed Action, these items could have an impact on the planning area. Combined with the
Proposed Action, these actions would not deviate from Forest Plan standards.
3.5.3 Consistency Determination
All of the proposed alternatives described in this report would be in compliance with Mt. Hood Forest
Plan and the Forest Service Manual.
Table 62. Consistency with Forest Plan Standards and Guidelines.
Standards & Guidelines Relevant Elements of
Proposed Action
Consistency of the Proposed
Action with the Forest Plan
FW-586: Sensitivity Level II
trails shall have prescribed
VQOs of Partial Retention,
Modification, and Modification
in near foreground, far
foreground and middleground
distance zones, respectively.
The degree to which the
Proposed Action maintains
prescribed VQOs.
The Proposed Action would be
consistent with the Forest Plan provided mitigations were
implemented. Specifically:
The Surveyors Ridge Reroute Decision memo reroute which
addresses impacts to VQOs.
FW-584 Trail VQOs shall be
prescribed for near foreground,
far foreground and
middleground based on trail
sensitivity level. Prescribed trail
VQOs apply to both existing
trails and planned trails.
The degree to which the
Proposed Action maintains
prescribed VQOs.
The Proposed Action would be
consistent with the Forest Plan
provided mitigations were
implemented. Specifically:
The Surveyors Ridge Reroute
Decision memo reroute which
addresses impacts to VQOs.
FW-556 The prescribed VQO
should be achieved within one
year after completion of any
project activities.
Activity debris, staging areas,
piling, and tree marking.
The Proposed Action would be consistent with the Forest Plan
provided mitigations which
address project impacts (i.e. equipment disturbance, tree
marking, etc.) rehabilitation
were implemented.

191
Standards & Guidelines Relevant Elements of
Proposed Action
Consistency of the Proposed
Action with the Forest Plan
FW-552 The VQOs prescribed
in management direction
represent the minimum level
that shall be achieved in long
term visual resource
management
The degree to which the
Proposed Action maintains
prescribed VQOs.
This effects analysis addresses
this Standard and Guideline.
C1-007 Management activities
shall achieve a VQO of
Modification as viewed from
open roads; local roads and
temporary roads are exceptions
The degree to which the
Proposed Action maintains
prescribed VQOs.
This effects analysis addresses
this Standard and Guideline.
B6-011 VQOs accepting less
visual quality disturbance shall
be applied when B6 Management Areas are located
within “designated viewsheds”
(Dufur Mill Road) (R PR PR)
The degree to which the
Proposed Action maintains
prescribed VQOs within the
Dufur Mill Road viewshed.
This effects analysis addresses
this Standard and Guideline.
B6-010 Management activities shall achieve a VQO of
modification from open roads
The degree to which the Proposed Action maintains
prescribed VQOs.
This effects analysis addresses
this Standard and Guideline.

192
Standards & Guidelines Relevant Elements of
Proposed Action
Consistency of the Proposed
Action with the Forest Plan
B2-012 Management activities
shall achieve prescribed VQOs
from the identified viewer
positions
Proposed activity within the
Dufur Mill Road Scenic
Viewshed.
The Proposed Action would be
consistent with the Forest Plan
provided mitigations were
implemented. Specifically:
• The pipeline corridor would be
visually subordinate along FSR
44. As many trees as possible
would be retained along the FSR
44 corridor to maintain a visual
buffer between the road and the
pipeline corridor.
• Decks of trees would be
visually subordinate along the
pipeline corridor adjacent to
FSR 44.
• Piles would be visually
subordinate along the pipeline
corridor adjacent to FSR 44.
They would be burned within 2
years of contract termination.
• Tree stumps will be visually
subordinate along the pipeline
corridor adjacent to FSR 44.
Stump heights will be
maintained at heights of 6
inches or less within Foreground
(up to ½ mile) and be angled
away from the roadway.
• Tree paint would not be visible
from the roadway along FSR 44.
B2-001: Structures and
improvements may be provided
to protect resource values, for administrative purposes, and to
accommodate recreational use
Installation of a modern pipeline
with a 25 foot right-of-way.
The pipeline installation and
maintenance of the modern
right-of-way corridor would be consistent with the Forest Plan
as the pipeline is needed for
administrative purposes for The
City Of The Dalles.

193
3.5.4 Summary of Effects
There would be no direct effects to scenic resources under the No Action alternative. The Proposed Action alternative would reduce and even eliminate vegetative screening along a short section of FSR 44
where the pipeline crosses the road within the Dufur Mill Road Scenic Viewshed. This would have a
negative effect on VQOs, however, it would not deviate from Forest Plan Standards as structures and improvements may be provided within scenic viewsheds for administrative purposes. The reroute of the
Surveyors Ridge Trail 688 would maintain VQOs along the trail corridor. Direct visible human effects
within the scenic viewshed would include stumps, staging areas, slash piles and tree marking. The Proposed Action includes mitigations to address these visual effects of actions commensurate with the
retention VQO.
The Proposed Action would improve the efficiency of the Dog River Pipeline and maintain a modern
right-of-way along the pipeline corridor. The modern right-of-way could be unattractive to some visitors, but others may enjoy it for access for non-motorized recreation. The No Action alternative would not
result in any changes to the viewshed or right-of-way corridor.
In the short-term the Proposed Action would have a negative effect on the retention VQO within the Scenic Viewshed (B2) management area. The Proposed Action would not affect VQOs within the Wood
Product Emphasis (C1) or Special Emphasis Watershed (B6) management areas. In the long term (10+
years) the No Action alternative would not impact the VQOs for these three management areas. The
Proposed Action alternative would maintain VQOs for the Wood Product Emphasis (C1) and Special Emphasis Watershed (B6) management areas, and decrease retention VQOs along the pipeline corridor
within the Scenic Viewshed (B2) management area due to the administrative need of The City Of The
Dalles. The area of impact to the retention VQO from FSR 44 would be minimal, although it’s impact
would last the duration of the maintenance of the pipeline corridor.
Additional information regarding this resource can be found in the full specialist report which is
incorporated by reference and available in the project record.

Dog River Pipeline Replacement | Environmental Assessment
194
3.6 Wildlife
This section is organized into six sections: Threatened, Endangered and Proposed Species – Northern
Spotted Owl; Northern Spotted Owl Critical Habitat; Region 6 Sensitive Species – Gray Wolf, Fringed
Myotis, Western Bumblebee, Johnson’s Hairstreak; Management Indicator Species – Deer, Elk, Pileated Woodpecker, American Marten, Wild Turkey, Western Gray Squirrel; Snag and Down Log Associated
Species; and Neotropical Migratory Birds. The existing condition, effects analysis, consistency
determination, and summary or effects are discussed for each.
3.6.1 Threatened, Endangered and Proposed Species – Northern Spotted Owl
Existing Condition
There are three historic spotted owl territories that overlap the project boundary. All of these home ranges
are currently below the threshold of 40 percent suitable habitat and are below 50 percent suitable habitat within the core area. Surveys have been conducted in the project area since 2010 and one spotted owl was
detected in 2011. Follow-up visits did not relocate this owl and no other owls have been found. The
historic nesting sites are currently considered unoccupied. A first year male spotted owl was detected during surveys for a project adjacent to the proposed pipeline on two separate occasions in August of
2015. The owl was not detected again in subsequent visits and therefore the status of that owl is unknown.
Effects Analysis
No Action Alternative
There would be no short-term effects to spotted owls under this alternative. In the short-term, the portion
of the proposed pipeline that is providing dispersal and suitable habitat would continue to function as
dispersal and suitable habitat and snag levels would remain essentially unchanged. In 20 to 30 years, the trees along the proposed pipeline could start to differentiate to varying degrees and show an increase in
the levels of snags and down wood as live trees continue to die. The quality of habitat would improve
only slightly in some stands while improving more in others depending on site conditions.
Proposed Action Alternative
The proposed project is expected to have disturbance to the spotted owl from all phases of pipeline
construction. Specifically the disruption will be from chainsaws and heavy equipment. No spotted owls
have been found during surveys. If the potential nest sites are unoccupied, then there would be no effect from disturbance to spotted owls from the proposed activities. If a spotted owl nest is found during
surveys, that nest patch would be buffered and timing restrictions would be placed on activities that
would take place within the disruption distance as defined in Table 63. Because timing restrictions would
be in effect in the event that a nest is found, the disturbance from the Proposed Action may affect, but is
not likely to adversely affect spotted owls.

Dog River Pipeline Replacement | Environmental Assessment
195
Table 63. Disturbance and Disruption Distances for Northern Spotted Owls.
Disturbance
Source
No Effect (March
1 – September
30.)
Disturbance
Distance Entire
Breeding Period
(March 1 –
September 30).
NLAA (not likely
to adversely
affect)
Disruption
Distance1 Critical
Breeding Period
(March 1 – July
15). LAA (likely
to adversely
affect)
Disruption
Distance1 Latter
Breeding Period
(July 16 –
September 30).
LAA (likely to
adversely affect)
Use of chainsaws > 0.25 mile 66 yards to 0.25
mile
≤ 65 yards No Disruption
Anticipated
Use of heavy
equipment
> 0.25 mile 66 yards to 0.25
mile
≤ 65 yards No Disruption
Anticipated
Hauling on open
roads
> 0.25 mile ≤ 0.25 mile No Disruption
Anticipated
No Disruption
Anticipated
Blasting > 1 mile 0.25 mile to 1
mile ≤ 0.25 mile ≤ 100 yards
(injury)
Helicopter –
Type I2
> 0.5 mile 266 yards to 0.5
mile
≤ 265 yards ≤ 100 yards
(hovering only)
Helicopter –
other3
> 0.25 mile 111 yards to 0.25
mi
151 yards to 0.25
mile
≤ 50 yards
(hovering only)
Rock crushing 440 yards (0.25
mile)
180 yards No Disruption
Anticipated
Burning > 1 mile 0.25 mile to 1
mile
≤ 0.25 mile No Disruption
Anticipated
1. Noise distances were developed from a threshold of 92 dB (USFWS 2003). Smoke disturbance distances are based on a FWS white paper (USFWS 2008b). Distances are measured from occupied spotted owl nest tree or
fledgling location. If these are not identified, distances are from the edge of nest patch (for both known and potential
spotted owl sites.
2. Type I helicopters seat at least 16 people and have a minimum capacity of 5,000 lbs. Both a CH 47 (Chinook) and
UH 60 (Blackhawk) are Type I helicopters. Kmax helicopters are considered “other” for the purposes of
disturbance. Sound readings from Kmax helicopter logging on the Olympic NF registered 86 dB at 150 yards (Piper
2006).
3. All other helicopters (including Kmax).

Dog River Pipeline Replacement | Environmental Assessment
196
Tree removal included in the Proposed Action would be in the form of a 3.4 mile long, 25 foot wide
corridor of approximately 10.3 acres. Of these approximate 10.3 acres, roughly 6.1 are in suitable habitat
and roughly 4.2 are in dispersal habitat. Within the home ranges, roughly 3.9 acres would be removed
from territory 10119P92, roughly 7.8 would be removed from 6035P94, and approximately 4.2 acres would be removed from 6102P90 (Table 64). This habitat removal would not impact the ability of owls to
utilize this habitat at the stand scale since the trees that would be removed are spread out across a long
narrow corridor rather than in one patch and the function of the habitat within each stand would remain unchanged.
Table 64. Approximate Acres Impacted within Territories.
1101P92 6035P94 6102P90
Acres Suitable Removed 3.9 5.4 1.2
Acres Dispersal Removed 0 2.4 3.0
Total 3.9 7.8 4.2
Because the portion of the project that removes trees in dispersal habitat is spread over a 1.4 mile length,
the Proposed Action would not impact the ability of spotted owls to disperse across the landscape and would not change the function of dispersal habitat at the stand scale. Therefore the removal of
approximately 4.2 acres of dispersal habitat may affect but is not likely to adversely affect spotted owls.
Future nesting opportunities would be reduced by removing large trees and snags within suitable habitat and territories that are currently below threshold levels would have habitat removed, therefore, the
removal of approximately 6.1 acres is likely to adversely affect spotted owls. Because the tree removal is
along a narrow corridor, the function of the habitat within these stands would remain unchanged.
The small mammal species that have been found to increase most after tree removal are not ones that are selectively favored by barred owls more than spotted owls. Based on these studies, the proposed pipeline
construction would not be expected to expand the range of barred owls since the function of the habitat at
the stand scale would remain unchanged.
Cumulative Effects
Of the projects and activities found in Table 1 timber harvest on federal land (past, present, and
reasonably foreseeable) was considered in this cumulative effects analysis because the activities overlap
in time and space. There is a potential cumulative impact to suitable habitat from the removal of approximately 6 acres of suitable owl habitat. However, this cumulative impact would be minor because
the removal of approximately 6 acres represents 0.2% of the available suitable habitat on the landscape.
Additionally, cumulative effects to dispersal habitat would not prevent spotted owls from continuing to forage or disperse throughout the analysis area because the 4.2 acres proposed for removal are minor
compared to the stand scale. In conclusion, cumulative effects would be minor because the overall
function of the northern spotted owl’s habitat at the stand-scale would remain unchanged.
Consistency Determination
Late Successional Reserve (LSR) Assessment
The Regional Ecosystem Office (REO) and the interagency Late-Successional Reserve Work Group has
reviewed the Surveyors Ridge Late-Successional Reserve Assessment (Assessment). The REO found that the Assessment provided sufficient framework and context for projects and activities within the LSR,

Dog River Pipeline Replacement | Environmental Assessment
197
including the Dog River Pipeline replacement. A memorandum dated July 23, 1997 stated that specific projects described in the Assessment that are consistent with the Standards and Guidelines and the
treatment criteria identified are exempted from project-level REO review.
Recovery Actions 10 and 32
The proposed project is consistent with the Northwest Forest Plan and with the Revised Northern Spotted
Owl Recovery Plan (USFWS 2011).
• Recovery Action 10: Conserve spotted owl sites and high value spotted owl habitat to provide
additional demographic support to the spotted owl populations.
o The proposed project does not impact the highest quality.
• Recovery Action 32: Because spotted owl recovery requires well distributed, older and more
structurally complex multi-layered conifer forests on Federal and non-federal lands across its range, land managers should work with the Service to maintain and restore such habitat while
allowing for other threats, such as fire and insects, to be addressed by restoration management
actions. These high-quality spotted owl habitat stands are characterized as having large diameter trees, high amounts of canopy cover, and decadence components such as broken-topped live
trees, mistletoe, cavities, large snags, and fallen trees.
o The proposed project was developed in coordination with the Fish and Wildlife Service
(FWS) and does not impact and RA 32 habitat.
Consultation
A formal Programmatic Biological Assessment (BA) that included the Dog River Pipeline replacement
was submitted to the FWS for the effects to federally listed species including northern spotted owls. The Biological Opinion on the Effects of Projects with the Potential to Modify the Habitat and/or Disrupt
Northern Spotted Owls within the Willamette Province, FY 2017, proposed by the Mt. Hood National
Forest; and Willamette National Forest; on the Northern Spotted Owl and its’ Designated Critical Habitat
(FWS Reference Number 01EOFW00-2017-F-0045 and 17-14) was received in August 2017.
Summary of Effects
While the proposed project is expected to have disturbance to the spotted owl from all phases of pipeline
construction, no spotted owls have been found during surveys. If the potential nest sites are unoccupied,
then there would be no effect from disturbance to spotted owls from the proposed activities.
Tree removal may affect but is not likely to adversely affect spotted owls. Future nesting opportunities would be reduced by removing large trees and snags within suitable habitat and territories that are
currently below threshold levels would have habitat removed, therefore, the removal of approximately 6.1
acres is likely to adversely affect spotted owls. Because the tree removal is along a narrow corridor, the
function of the habitat within these stands would remain unchanged.
Additional information regarding this resource can be found in the full specialist report which is
incorporated by reference and available in the project record.
3.6.2 Northern Spotted Owl Critical Habitat
Existing Condition
Critical Habitat in the Action Area
Of the 10.3 acres of tree removal for the pipeline, 8.8 acres are in critical habitat. Of the 8.8 acres in critical habitat, 3.7 acres are providing only dispersal habitat (Physical or Biological Feature [PBF] 4) and

Dog River Pipeline Replacement | Environmental Assessment
198
5.1 acres are providing suitable habitat for spotted owls (PBF 2, 3 and 4). These PBFs in the action area
are functioning at a landscape scale and could support up to 8 territories.
Subunit East Cascade North 7
The Proposed Action is within East Cascades North (ECN), subunit ECN 7. Of the 139,983 acres in this
unit, approximately 139,865 are located on the Mt. Hood NF. This unit is located in Wasco and Hood River Counties on the east side of the Cascades with a small portion in Clackamas County on the west
side of the Cascades. There are approximately 8.8 acres of critical habitat proposed for removal.
There are approximately 58,397 acres of suitable habitat within subunit ECN 7. Based on the amount of habitat and the average home range size for this Province, this subunit could potentially support up to 48
territories. Of these territories, 3 overlap habitat within the action area.
Special management considerations or protections are required in this subunit to address threats from current and past timber harvest, removal or modification of habitat by forest fires and the effects on
vegetation from fire exclusion, and competition with barred owls. This subunit is expected to function
primarily for demographic support to the overall population, as well as north-south and east-west
connectivity between other subunits and critical habitat units.
Effects Analysis
The analysis area for spotted owl critical habitat includes the Dog River Pipeline project boundary and a
1.2 mile buffer to include any territories that may overlap.
No Action Alternative
There would be no short-term effects to spotted owl critical habitat under this alternative. In the short-term, dispersal habitat (Physical or Biological Features [PBF] 4) would continue to function as dispersal
habitat and snag levels would remain essentially unchanged. In 20 to 30 years, the stands could start to
differentiate to varying degrees and show an increase in the levels of small snags and small down wood.
Stands that are functioning as suitable habitat (PBF 2) would continue to function as suitable habitat.
Proposed Action Alternative
Tree removal in critical habitat would be in the form of an approximate 2.9 mile long, 25 foot wide corridor for a total of 8.8 acres. Of the total acres, approximately 5.1 are in suitable habitat (PBFs 2 and 3)
and approximately 3.7 acres are in dispersal habitat (PBF 4). This habitat removal would not impact the
ability of owls to utilize this habitat at the stand scale since the trees that would be removed are spread out
across a long narrow corridor rather than in one patch and the function of the habitat within each stand
would remain unchanged.
Because the portion of the project that removes trees in dispersal habitat is spread over a roughly 1.4 mile
length, the Proposed Action would not impact the ability of spotted owls to disperse across the landscape and would not change the function of dispersal habitat at the stand scale. Therefore the removal of
approximately 3.7 acres of dispersal habitat may affect but is not likely to adversely affect spotted owls.
Future nesting opportunities would be reduced by removing large trees and snags within suitable habitat
and territories that are currently below threshold levels would have some habitat removed, therefore, the removal of approximately 5.1 acres is likely to adversely affect spotted owls. Because the tree removal is
along a narrow corridor, the function of the habitat within these stands would remain unchanged.
The Proposed Action maintains the PBFs in a manner that meets the life history needs of the spotted owl
at the stand-scale, therefore it would not have significant adverse impacts at the subunit or unit scale.

Dog River Pipeline Replacement | Environmental Assessment
199
Cumulative Effects
Of the projects and activities found in Table 1 timber harvest on federal land (past, present, and
reasonably foreseeable) was considered in this cumulative effects analysis because the activities overlap
in time and space.
Timber harvest on federal lands has reduced the amount of suitable and dispersal habitat (PBFs 2, 3, and 4) on the landscape and will continue to do so into the future until these stands grow over time and
become habitat again. With less suitable habitat on the landscape, there are fewer opportunities for
spotted owls to successfully nest and produce young. The cumulative effects to dispersal habitat would
not prevent spotted owls from continuing to forage or disperse throughout the analysis area.
Consistency Determination
The Proposed Action is consistent with the Critical Habitat (CH) Rule that relies on the recommendations
laid out by the Recovery Plan for the spotted owl. The proposed project is not considered active forest
management, does not impact the function of PBFs at the stand scale, would not impact the ability of owls to exist on the landscape, and would not preclude the recovery of the species.
Consultation
A formal Programmatic Biological Assessment (BA) that included the Dog River Pipeline replacement
was submitted to the Fish and Wildlife Service (FWS) for the effects to federally listed species including northern spotted owls and their critical habitat. The Biological Opinion on the Effects of Projects with the
Potential to Modify the Habitat and/or Disrupt Northern Spotted Owls within the Willamette Province,
FY 2017, proposed by the Mt. Hood National Forest; and Willamette National Forest; on the Northern Spotted Owl and its’ Designated Critical Habitat (FWS Reference Number 01EOFW00-2017-F-0045 and
17-14) was received in August 2017.
Summary of Effects
The habitat removal would not impact the ability of owls to utilize habitat at the stand scale since the trees
that would be removed are spread out across a long narrow corridor rather than in one patch resulting in the function of the habitat within each stand to remain unchanged. Therefore the removal of roughly 3.7
acres of dispersal habitat may affect but is not likely to adversely affect spotted owls. Future nesting
opportunities would be reduced by removing large trees and snags within suitable habitat and territories
that are currently below threshold levels would have some habitat removed, therefore, the removal of approximately 5.1 acres is likely to adversely affect spotted owls. Because the tree removal is along a
narrow corridor, the function of the habitat within these stands would remain unchanged.
Additional information regarding this resource can be found in the full specialist report which is
incorporated by reference and available in the project record.
3.6.3 Region 6 Sensitive Species – Gray Wolf, Fringed Myotis, Western Bumblebee, Johnson’s Hairstreak
Gray Wolf
Existing Condition
Gray wolves (Canis lupus) were reintroduced in the mid-1990s in central Idaho and Yellowstone National
Park and then dispersed naturally into Oregon. In 2008 the first wolf pack was confirmed in Oregon on the Umatilla National Forest by Oregon Department of Fish and Wildlife (ODFW) biologists. In May
2001, the FWS delisted wolves in Idaho, Montana, parts of Oregon, Washington, and Utah. In December

Dog River Pipeline Replacement | Environmental Assessment
200
2015 the ODFW removed the gray wolf from its endangered species list because the wolf had met the state’s population criteria for delisting. Wolves in Oregon west of Hwy 395 remain protected by the
federal Endangered Species Act. The FWS is the lead management agency for wolves west of Hwy 395,
including those that may be on the Forest.
In March 2015, a male wolf from the Imnaha Pack identified as OR25, moved through the Columbia Basin and southern Blue Mountains before traveling west and spending a number of weeks on the Mt.
Hood National Forest. OR25 then traveled south to Klamath County and continues to remain in that area.
Because wolves have the ability to disperse over large distances, as in the case of other wolves (OR7 and OR3) that have established territories in southern Oregon, there is the possibility that other undetected
wolves have been or may currently be on the Forest. In January, 2018, two wolves were captured on
remote sensing cameras in the southeastern portion of the Forest. The breeding status of those wolves is
unknown. Since 2018, there have been multiple wolf sightings on the Mt. Hood National Forest.
Effects Analysis
Analysis Area
The analysis area for gray wolves includes the pipeline and a one mile buffer.
No Action Alternative
There would be no increase in human activities in the area and therefore there would be no effect to
wolves.
Proposed Action Alternative
No dens or rendezvous sites have been detected on the Forest or within the project area. The possibility of
a wolf den or rendezvous site remaining undetected in the vicinity of the project area is extremely unlikely because of the vocal nature of wolf packs and the amount of human activity that takes place on
this part of the Forest. Project related activities would increase human presence during implementation
and this may cause wolves to temporarily avoid the area. While the Proposed Action may cause wolves to temporarily avoid the area during project implementation, the Proposed Action is not within a mile of any
den or rendezvous site and would not disrupt breeding behavior, therefore, the proposed project would
have no effect to gray wolf.
Cumulative Effects
Because there is no effect to gray wolf from the Proposed Action, there are no cumulative effects.
Consistency Determination
The Following Mt. Hood National Forest Land and Resource Management Plan Standards and Guidelines
that apply to the Proposed Action alternative and would be met:
• FW-174: Habitat for threatened, endangered, and sensitive species has been identified and
managed in accordance with the ESA (1973), the Oregon ESA (1987), and FSM 2670.
• FW 177 & 178: Consultation with the USFWS shall occur on each program activity or project
that the Forest Service determines may affect threatened or endangered species. Consultation
shall be completed before any decision is made on the proposed project.

Dog River Pipeline Replacement | Environmental Assessment
201
Consultation
• Because there is no effect to gray wolf from the Proposed Action, consultation is not required for
this species.
Summary of Effects
There is no effect to the gray wolf because no dens or rendezvous sites have been detected on the Forest
or within the project area.
Fringed Myotis
Existing Condition
The most common habitats in which the Fringed Myotis has been found are oak, pinyon, and juniper
woodlands or ponderosa pine and Douglas-fir forest at middle elevations (O’Farrell and Studier 1980,
Cockrum et al. 1996, Wilson and Ruff 1999, Ellison et al. 2004). This species is mostly found in dry habitats where open areas are interspersed with mature forests, creating complex mosaics with ample
edges and abundant snags. Suitable roosting sites are an important habitat component, the availability of
which can determine population sizes and distributions (Humphrey 1975, Kunz 1982). Abundance of large snags and low canopy cover allows more thermal heating of roosts, easier flight access to roosts,
and the ability to readily switch roosts, for predator avoidance, or to find more suitable microclimates
(Lewis 1995, Weller 2000). Some studies have suggested that fringed myotis consume mostly beetles
(Rainey and Pierson 1996), but others in the Pacific Northwest have suggested mainly moths (Whitaker et al. 1977). Anecdotal information supports a diet largely of beetles and moths (Turner and Jones 1968,
Arizona Game and Fish Department 1997). The loss of habitat through conversion and degradation is a
major threat to this species. Second to loss of forested habitat is the loss of stand structural complexity, which supports both foraging and roosting activities. Disturbances of native vegetation can enhance the
spread of invasive plant species, which may further disrupt insect diversity and densities. Other threats
include recreational caving, rock climbing, commercial mining and quarrying of roost habitat. Pesticide use and environmental contaminants may reduce prey availability and bioaccumulate in bats. White-nose
Syndrome (WNS) has recently arrived in the northwest. Given that many Myotis species have been
severely impacted in the eastern United States, WNS could negatively affect fringed myotis as well.
Threats to this species are enhanced by its patchy distribution and general low abundances.
Effects Analysis
No Action Alternative
Under the No Action alternative, fringed myotis roosting and foraging habitat would not be impacted.
There are no hibernacula or mines in the analysis area. The No Action alternative would have
approximately 125 more snags for roosting since this species roosts in snags larger than 11 inches DBH and none would be cut for the pipeline replacement.
Proposed Action Alternative
The Proposed Action would have no impact on maternity colonies or hibernacula since caves and mines are not in the project area. Some roost trees would be removed, including 125 snags larger than 11 inches
DBH. Tree removal under the Proposed Action would benefit fringed myotis only slightly by opening the
canopy along the pipeline which would improve foraging habitat. Large snags in the adjacent stands
would continue to provide roosting habitat. Even though some roosting snags would be removed for pipeline construction, foraging habitat would be slightly improved and roosting habitat would still be
provided adjacent to the pipeline, therefore the Proposed Action may impact individuals or habitat, but
Dog River Pipeline Replacement | Environmental Assessment
202
will not likely contribute to a trend towards federal listing or cause a loss of viability to the
population or species.
Cumulative Effects
Of the projects and activities found in Table 1 timber harvest on federal land (past, present, and reasonably foreseeable), and The Dalles Watershed Phase I and II Fuel Reduction were considered in this
cumulative effects analysis because the activities overlap in time and space.
There are no known mines or caves that would provide for maternity colonies or hibernacula, therefore there are no cumulative effects to these structures. The Dalles Watershed Phase I and II would benefit the
fringed myotis by increasing the potential for larger trees on the landscape and opening the canopy which
provides foraging. Past timber harvest on federal land that targeted large ponderosa pine has reduced the
number of large ponderosa pine which would become the large snags needed for roosting habitat.
Summary of Effects
Some roosting snags would be removed for pipeline construction, foraging habitat would be slightly
improved and roosting habitat would still be provided adjacent to the pipeline, therefore the Proposed
Action may impact individuals or habitat, but will not likely contribute to a trend towards federal
listing or cause a loss of viability to the population or species.
Additional information regarding this resource can be found in the full specialist report which is
incorporated by reference and available in the project record.
Western Bumblebee
Existing Condition
Surveys for Western bumblebees were conducted by the Xerces Society on the Forest in 2013 and by
Forest Service biologists in 2015. A total of 34 locations were surveyed in 2013 and Western bumble bees
were located at 8 of these locations. In 2015, 24 locations were surveyed and bumble bees were detected at 8 locations, 6 of which were previously unreported locations for this species. In 2016, 23 locations
were surveyed and Western bumblebees were documented at 6 of these sites. Five of the six sites were
new locations for this species. One of the new locations found was in the meadow adjacent to Bear
Springs Campground and previous detections were made adjacent to the project area at Little Crater Lake
and Jackpot Meadow.
Effects Analysis
The analysis area for Western bumblebee includes the Dog River Pipeline Project boundary.
No Action Alternative
Under the No Action alternative, there would be no direct impacts to bumble bee nesting, foraging, and over-wintering habitat. There would be fewer flowering plants for foraging under this alternative in the
long-term since canopies along the pipeline would remain unchanged and less sunlight would reach the
forest floor which is required for the growth of most nectar plants.
Proposed Action Alternative
The proposed project may temporarily impact flowering plants during pipeline construction. Reducing
this food source would reduce the ability of foraging bees to find nectar at these sites which is a required
food source for young bees. It is expected that these shrubs would regenerate within a few years and that
the bumblebees would have other nectar plants available adjacent to the proposed pipeline.

Dog River Pipeline Replacement | Environmental Assessment
203
The proposed project may temporarily impact nest sites if these nests are located within abandoned bird nests or other structures above ground. Pipeline construction activities could reduce the number of nests
available in the short-term and therefore reduce the number of bumblebees that this area could support.
Nest sites would increase within a few years after construction. The temporary reduction in flowering
shrubs and nesting sites may impact individuals but will not likely contribute to a trend towards
federal listing or cause a loss of viability of the population or species.
The total number of acres impacted would not exceed 10.3 acres since that is the total area of the footprint
of the pipeline. While the number of bees in the analysis area may be slightly reduced, this reduction
would be temporary as flowering shrubs and nest sites increase within a few years after treatments.
Because bumblebees can forage for nectar on a variety of flowering plants, the area adjacent to the
pipeline would continue to provide a food source. These portions of the watershed would also continue to provide for nesting and hibernating habitat. The adjacent untreated areas would allow for bumblebees to
recolonize the impacted acres within the treatment area as foraging and nesting habitat return. Between 2
and 10 years after treatments, there would be an increase in flowering plants for foraging compared to the
No Action alternative since the area along the pipeline would be more open and more sunlight would
reach the forest floor which is required for the growth of most nectar plants.
Cumulative Effects
Of the projects and activities found in Table 1 timber harvest on federal land (past, present, and
reasonably foreseeable), road decommissioning and road closures, trail construction and maintenance, pre-commercial thinning, and The Dalles Watershed Phase I and II Fuel Reduction were considered in
this cumulative effects analysis because the activities overlap in time and space.
Projects that may increase or improve foraging habitat in the long-term include road closures, and pre-commercial thinning. While weed treatments may benefit bumblebees by improving habitat for native
flowering plants, bees can be indirectly harmed when the flowers that they normally use for foraging are
removed by the application of broad-spectrum herbicides. Depending on the prescription and the
condition of the stand before treatments, timber harvest may increase or decrease the amount of foraging
habitat available. Trail construction and maintenance reduces the amount of foraging and nesting habitat.
Habitat alterations including those that could destroy, fragment, alter, degrade or reduce the food supply
produced by flowers as well as destruction of nest sites and hibernation sites for overwintering queens, such as abandoned rodent burrows and bird nests, adversely affect these bees. Large scale ground
disturbing activities alter landscapes and habitat required by bumble bees by removing flowering food
sources, disturbing nest sites and altering the vegetation community. The size of bumble bee populations diminish and inbreeding becomes more common as habitats become fragmented. This in turn, decreases
the genetic diversity and increases the risk of population decline.
While the projects analyzed under cumulative effects may have impacts to individual bumble bees, the
main threats to this species are agriculture and urban development, livestock grazing, and broad scale insecticide application (Thorp et al. 2008). These kinds of activities are not included in the Proposed
Action. Because some of the proposed activities increase or improve habitat while others may decrease it,
the impacts would likely be beneficial and detrimental at the same time, and populations of this species
would still persist in the analysis area.
Consistency Determination
The Proposed Action alternative is consistent with the following Standards and Guidelines for sensitive
species: (1) FW-174: Threatened, endangered and sensitive plants and animals shall be identified and
managed in accordance with the Endangered Species Act (1973), the Oregon Endangered Species Act (1987), and FSM 2670; and, (2) FW-175: habitat for threatened, endangered and sensitive plants and
animals shall be protected or improved.

Dog River Pipeline Replacement | Environmental Assessment
204
Summary of Effects
The temporary reduction in flowering shrubs and nesting sites may impact individuals, but will not likely
contribute to a trend towards federal listing or cause a loss of viability of the population or species.
Additional information regarding this resource can be found in the full specialist report which is
incorporated by reference and available in the project record.
Johnson’s Hairstreak
Existing Condition
Johnson’s hairstreak occurs within coniferous forests which contain the mistletoes of the genus
Arceuthobium, commonly referred to as dwarf mistletoe. These plants are highly specialized and are
known to occur on a number of different conifers (Schmitt and Spiegel 2008). Larsen et al. (1995) states that old-growth and late successional second growth forests provide the best habitat for this butterfly,
although younger forests where dwarf mistletoe is present also supports C. johnsoni populations. All
sightings in both Washington and Oregon have been in coniferous forests. Ecoregions where this species
occurs in Oregon, as determined by the Oregon Biodiversity Information Center include the Ochoco, Blue and Wallowa Mountains, Coast Range, East Cascades, Klamath Mountains, West Cascades and the
Willamette Valley. Larvae can be found feeding on dwarf mistletoe (Opler and Wright 1999). Caterpillars
feed on all exposed plant parts and secrete a sugary solution which is used by ants that in turn protect the caterpillar from predators. Caterpillars can be found on host leaves April-October (Allen et al. 2005).
Nectar of flowers in several families from numerous genera including Actostophylos, Ceanothus, Cornus,
dandelion, Fragaria, Rorippa and Spraguea is consumed by adult butterflies who obtain additional moisture by visiting mud puddles (Shields 1965). Due to their habitat associations and tendency to reside
in the forest canopy, these butterflies are not often encountered. The main threats to this species are the
reduction of old-growth, insecticide use, and application of herbicides to flowering plants that are nectar
sources.
Effects Analysis
Analysis Area
The analysis area for Johnson’s hair streak includes the Dog River Pipeline project boundary.
No Action Alternative
Under the No Action alternative, there would be no direct impacts to Johnson’s hair streak larval and
foraging habitat. There would be fewer flowering plants for foraging under this alternative in the long-
term since canopies would remain closed and less sunlight would reach the forest floor which is required
for the growth of most nectar plants.
Proposed Action Alternative
The Proposed Action could impact the larval stage of Johnson’s hairstreak by removing large trees with
mistletoe. Mistletoe brooms may also be removed where it is a ladder fuel component. Trees with mistletoe would not be directly targeted by this project and would continue to be present throughout the
planning area. Mature forest structure would also remain within treated and adjacent untreated stands.
The proposed project may temporarily impact flowering plants during road maintenance, road
construction, fuels treatments, and timber harvest activities. Reducing this food source would reduce the ability of foraging butterflies to find nectar at these sites which. It is expected that these flowers and
shrubs would regenerate within a few years and that the butterflies would have other nectar plants
available within the project area.

Dog River Pipeline Replacement | Environmental Assessment
205
While the number of Johnson’s hairstreak in the project area may be slightly reduced, this reduction would be temporary as flowering shrubs increase within a few years after treatments. Because these
butterflies can forage for nectar on a variety of flowering plants, the untreated portions of the planning
area would continue to provide a food source. These untreated portions of the planning area and many of
the treated stands would continue to provide mistletoe for caterpillar habitat. The Proposed Action may
impact individuals or habitat, but will not likely contribute to a trend towards federal listing or
cause a loss of viability to the population or species.
Cumulative Effects
Of the projects and activities found in Table 1 timber harvest on federal land (past, present, and reasonably foreseeable), pre-commercial thinning, road decommissioning and road closures, trail
construction and maintenance, The Dalles Fuels Treatments Phase I and II, The Dalles Watershed Fuel
Reduction, were considered in this cumulative effects analysis because the activities overlap in time and
space.
Projects that may increase or improve foraging habitat in the long-term include plantation thinning, road
closures, pre-commercial thinning, and noxious weed treatments. While weed treatments may benefit butterflies by improving habitat for native flowering plants, butterflies can be indirectly harmed when the
flowers that they normally use for foraging are removed by the application of broad-spectrum herbicides.
Depending on the prescription and the condition of the stand before treatments, timber harvest may
increase or decrease the amount of foraging habitat available. Trail maintenance removes flowing plants
but at the same time maintains edges that promote the growth of flowering plants and shrubs.
Consistency Determination
The Proposed Action alternative is consistent with the following Standards and Guidelines for sensitive
species: (1) FW-174: Threatened, endangered and sensitive plants and animals shall be identified and
managed in accordance with the Endangered Species Act (1973), the Oregon Endangered Species Act (1987), and FSM 2670; and, (2) FW-175: habitat for threatened, endangered and sensitive plants and
animals shall be protected or improved.
Summary of Effects
The Proposed Action may impact individuals or habitat, but will not likely contribute to a trend
towards federal listing or cause a loss of viability to the population or species. While the number of Johnson’s hairstreak in the project area may be slightly reduced, this reduction would be temporary as
flowering shrubs increase within a few years after treatments. These butterflies can forage for nectar on a
variety of flowering plants, the untreated portions of the planning area would continue to provide a food
source.
Additional information regarding this resource can be found in the full specialist report which is
incorporated by reference and available in the project record.
3.6.4 Management Indicator Species – Deer, Elk, Pileated Woodpecker, American Marten, Wild Turkey, Western Gray Squirrel
Deer and Elk
Existing Condition
The project area supports elk and deer for most of the year. Elk cows and calves are in the western portion
of the watershed from early spring though late fall. Black-tailed deer are common and relatively abundant

Dog River Pipeline Replacement | Environmental Assessment
206
in the spring, summer, and fall within the western portion of the planning area. The eastern portion of the planning area is identified in the Mt. Hood LRMP as inventoried winter range, most of which is in B10
Land Use Allocation. A number of deer and elk spend the winter there depending on snow accumulation.
Deer are less likely to be there during periods of heavy snowfall as they are less able to move through
deep snow. Forage is available in the planning area, but is generally of low quality due to the lack of un-forested areas. With the reduction in regeneration timber harvest, the Forest now has abundant optimal
and thermal cover, but openings for forage are becoming scarce. There are approximately 69,226 acres of
early-seral habitat on the Forest. This level is declining over time at mid and lower elevations since plantations have grown dense with trees that shade out forage. There are few dry meadows in the planning
area, and forage habitat improvement for elk is limited.
High road densities lead to harassment of elk herds. Harassed elk move more often than elk left alone and use of habitat decreases as road density increases (Witmer 1985). It is also recognized that elk within or
moving through areas of high open-road densities move longer distances; often several miles per day.
Effects Analysis
Analysis Area
The analysis area for deer and elk is the East Fork Hood River Watershed.
No Action Alternative
Disturbance from human presence and activities within the planning area would remain the same as the
current levels.
Proposed Action Alternative
Pipeline construction activities could potentially disturb and temporarily displace animals in the area at
the time of implementation. Project activities would not all be occurring at the same time, but in a few
places at any one time. The potential disturbance is predicted to be small in scale, temporary in nature and only impact a few individuals. There would be no increase in the long-term harassment of deer and elk
and the project is not expected to cause a measurable reduction or increase in the current local population
size for either deer or elk.
Cumulative Effects
Of the projects and activities found in Table 1, timber harvest on federal land (past, present, and
reasonably foreseeable), road decommissioning and road closures, pre-commercial thinning, The Dalles
Watershed Phase I and II Fuel Reduction, and The Dalles Watershed Fuel Reduction were considered in
this cumulative effects analysis because the activities overlap in time and space.
Cover is not considered a limiting factor for deer and elk in the analysis area because much of the Forest’s lands are providing cover and very little forage opportunities. The optimum cover forage ratio is 60
percent forage and 40 percent cover (Thomas, 1979). Forage availability is more of a limiting factor on
the Forest, but is more available off-Forest as a result of regeneration harvest on private lands. Cumulatively, there would be a small increase in forage and a small decrease in cover which would move
the forage to cover ratio towards the optimum ratio.
An increase in human presence from developed and dispersed campsites would modify behaviors and may cause some avoidance behaviors by both deer and elk. Deer are expected to be more tolerant of
recreation, while elk are less, and may move out of areas at certain times of the year. However, seasonal
closures on roads and trails are implemented in the areas for winter range, and for reasons of trail
stability. Trails would impact deer and elk but are not anticipated to impact populations.

Dog River Pipeline Replacement | Environmental Assessment
207
Consistency Determination
This analysis is consistent with The National Forest Management Act which requires the Forest Service to
manage wildlife habitat to “maintain viable populations of existing native and desired non-native vertebrate species in the planning area.” The National Forest Management Act requires the Forest Service
to identify Management Indicator Species through the planning process, and to establish objectives to
maintain and improve the habitat of indicator species. A Forest wide analysis was completed and is incorporated by reference. Viable populations of all the Management Indicator Species in this BE would
be maintained at the Forest-scale.
Open road densities under the Proposed Action would be reduced. However, the Forest Plan Standard of 2.5 miles per square mile of open roads for inventoried summer range (FW-208) would not be met. The
Forest Plan Standard for open road densities within B10 and inventoried winter range would continue
meeting the Forest Plan Standard of 1.5 (B10) and 2.0 (inventoried winter range) miles per square mile.
Summary of Effects
An increase in human presence from developed and dispersed campsites would modify behaviors and may cause some avoidance behaviors by both deer and elk. However, seasonal closures on roads and
trails are implemented in the areas for winter range, and for reasons of trail stability. Trails would impact
deer and elk but are not anticipated to impact populations.
Pileated Woodpecker
Existing Condition
The pileated woodpecker was chosen as a management indicator species because of its need for large
snags, large amounts of down woody material, and large defective trees for nesting, roosting and
foraging. Large snags and decadent trees are important habitat components for pileated woodpeckers (Hartwig et al. 2004, Mellen et al. 1992). The association with late seral stages comes from the need for
large-diameter snags or living trees with decay for nest and roost sites, large-diameter trees and logs for
foraging on ants and other arthropods, and a dense canopy to provide cover from predators. Because ants are the main diet for pileated woodpeckers, large diameter snags and logs with some decay are selected
for foraging because carpenter ants inhabit these sites. Given the amount of habitat available, there may
be up to 10 home ranges in the project area when considering unmanaged stands as habitat.
Effects Analysis
Analysis Area
The analysis area for the pileated woodpecker includes the area within the project boundary. The
Northwest Forest Plan directs the B5 pileated woodpecker/American marten areas to return to their underlying land allocation in Matrix lands except where needed to assure habitat and dispersal for the
guilds of species represented by the pileated woodpecker and marten. The Forest assessed the relative
importance of individual B5 areas in contributing to late seral forest conditions at the watershed landscape
level. Based on that assessment, the Forest recommended that certain B5 areas be returned to the underlying land allocation and that individual watershed analysis take a closer look at the remaining B5
areas. There is no B5 in the Analysis Area.
No Action Alternative
There would be no short-term effects to pileated woodpecker habitat under this alternative. In the short-term, large trees and snag levels would remain essentially unchanged. In 20 to 30 years, more snags are
likely to be added along the pipeline.

Dog River Pipeline Replacement | Environmental Assessment
208
Proposed Action Alternative
Pipeline construction would impact habitat by removing large trees and snags which would reduce the amount of nesting and foraging trees available for up to one pair of pileated woodpeckers. This impact
would be long-term since trees would not be allowed to grow back along the pipeline.
Cumulative Effects
Of the projects and activities found in Table 1, timber harvest on federal land (past, present, and reasonably foreseeable), and The Dalles Watershed Phase I and II Fuel Reduction were considered in this
cumulative effects analysis because the activities overlap in time and space. Past timber harvest on federal
lands has reduced the amount of habitat in the analysis area. Habitat for this species has continued to increase over time across the Forest but the analysis area would likely provide less habitat than other
areas of the Forest due to past and present timber harvest.
Consistency Determination
This analysis is consistent with The National Forest Management Act which requires the Forest Service to
manage wildlife habitat to “maintain viable populations of existing native and desired non-native vertebrate species in the planning area.” The National Forest Management Act requires the Forest Service
to identify Management Indicator Species through the planning process, and to establish objectives to
maintain and improve the habitat of indicator species. A Forest wide analysis was completed and is
incorporated by reference. Viable populations of all the Management Indicator Species in this BE would
be maintained at the Forest-scale.
Summary of Effects
Pipeline construction would impact habitat by removing large trees and snags which would reduce the
amount of nesting and foraging trees available for up to one pair of pileated woodpeckers. This impact
would be long-term since trees would not be allowed to grow back along the pipeline.
Additional information regarding this resource can be found in the full specialist report which is
incorporated by reference and available in the project record.
American Marten
Existing Condition
In the western United States, the American marten’s distribution is fragmented. Home ranges vary from 1
to 4.5 square miles for males and from 0.4 to 3.6 square miles for females (Simon 1980, Zielinski et al.
1997). Martens prey on vertebrates smaller and larger than themselves, eat carrion, and forage for bird eggs, insects, and fruits (Martin 1994). American martens are closely associated with forested habitats
with complex physical structure near the ground. Use of non-forested habitats by martens increases in
summer and includes meadows and small harvest units near forest edges, as well as areas above the tree
line in western mountains (Buskirk and Ruggiero 1994). Activities such as timber harvest and road construction that fragment, dissect, and isolate habitats are the largest threats to marten. Fragmented
habitats attract habitat generalist predators like the great-horned owl, coyote, and bobcat which can all
prey on marten. In addition, fragmentation eliminates the connectivity and creates isolated individuals and
populations which are more susceptible to extirpation.

Dog River Pipeline Replacement | Environmental Assessment
209
Effects Analysis
Analysis Area
The analysis area for the American martin includes the area within the project boundary. The Northwest
Forest Plan directs the B5 pileated woodpecker/American marten areas to return to their underlying land
allocation in Matrix lands except where needed to assure habitat and dispersal for the guilds of species represented by the pileated woodpecker and marten. The Forest assessed the relative importance of
individual B5 areas in contributing to late seral forest conditions at the watershed landscape level. Based
on that assessment, the Forest recommended that certain B5 areas be returned to the underlying land allocation and that individual watershed analysis take a closer look at the remaining B5 areas. There is no
B5 in the Analysis Area.
No Action Alternative
There would be no short-term effects to American marten under this alternative. In the short-term, habitat and snag levels would remain essentially unchanged. In 20 to 30 years, more snags are likely to be added
along the pipeline.
Proposed Action Alternative
Pipeline construction would impact marten habitat by removing large trees and snags which would reduce the amount of denning and foraging trees available. This impact would be long-term since trees would not
be allowed to grow back along the pipeline.
Cumulative Effects
Of the projects and activities found in Table 1, timber harvest on federal land (past, present, and reasonably foreseeable), and The Dalles Watershed Phase I and II Fuel Reduction were considered in this
cumulative effects analysis because the activities overlap in time and space.
Past timber harvest on federal lands has reduced the amount of habitat in the analysis area. Habitat for this
species has continued to increase over time across the Forest but the analysis area would likely provide
less habitat than other areas of the Forest due to past and present timber harvest.
Consistency Determination
This analysis is consistent with The National Forest Management Act which requires the Forest Service to
manage wildlife habitat to “maintain viable populations of existing native and desired non-native vertebrate species in the planning area.” The National Forest Management Act requires the Forest Service
to identify Management Indicator Species through the planning process, and to establish objectives to
maintain and improve the habitat of indicator species. A Forest wide analysis was completed and is
incorporated by reference. Viable populations of all the Management Indicator Species in this BE would
be maintained at the Forest-scale.
The Forest wide Standards and Guidelines would be met for B5 American marten land allocation. At least
160 acres of mature and/or old growth forest habitat shall be maintained within each 320 acre Management Area for American marten (B5-010). Snags are discussed below under “Snag and Down
Log Associated Species.”
Summary of Effects
Pipeline construction would impact marten habitat by removing large trees and snags which would reduce
the amount of denning and foraging trees available. This impact would be long-term since trees would not
be allowed to grow back along the pipeline.

Dog River Pipeline Replacement | Environmental Assessment
210
Additional information regarding this resource can be found in the full specialist report which is
incorporated by reference and available in the project record.
Wild Turkey and Gray Squirrel
Existing Condition
Wild Turkey
The wild turkey is a management indicator species for the ponderosa pine-Oregon white oak vegetation
association of the Forest. Two subspecies of wild turkeys (Merriam’s and Rio Grande) are found on the Forest. Turkeys feed on acorns, conifer seed, insects, and grass/forbs and nest on the ground hidden by
grass or shrubs. Turkeys roost on the ground and in large diameter (> 14 inch dbh) ponderosa pine and
Douglas-fir generally on slopes greater than 30 percent and within 0.5 miles of a food source.
Western Gray Squirrel
The western gray squirrel is also a management indicator species for the ponderosa pine-Oregon white
oak association of the Forest. Western gray squirrels need a mix of mast-producing trees to provide food,
cover, and nesting sites in their habitat. The ecological range of the western gray squirrel includes a
variety of habitat types within mixed conifer and oak forests. High tree species diversity is a common component of western gray squirrel habitat and contributes to habitat quality (Linders, 2000). Gray
squirrel have been documented in the planning area and there is both wintering and nesting habitat.
Effects Analysis
Analysis Area
The analysis area for wild turkey and Western gray squirrels includes the area that lies within the project
boundary.
No Action Alternative
Under the No Action alternative, there would be no change to forage and hiding cover for wild turkey.
Western gray squirrel would continue to have an abundance of nesting habitat and mycorrhizal fungi for
foraging.
Proposed Action Alternative
The Proposed Action would have little impact to wild turkey since the pipeline construction would
minimally open stands and provide some suitable foraging, nesting, brood-rearing, and roosting cover.
Pipeline construction would open the forest canopy in places and provide a combination of open, mature,
mast-producing forests and shrubs, and species of varying ages and sizes that would create a mix of habitats. Because the pipeline is so narrow, this increase would be minimal. The stands adjacent to the
pipeline would maintain patches of forested habitat that would serve as travel corridors.
The Proposed Action would have both negative and beneficial impacts to western gray squirrels. Reduction of canopy cover and disturbance of the litter layer during construction may reduce soil
moisture resulting in lower mychorrhizal fungi production, which is an important food source for this
species. Western gray squirrels would continue to forage in the stands adjacent to the pipeline and would also nest in adjacent conifer stands with higher canopy cover. The Proposed Action would not be
expected to reduce the number of Western gray squirrels that the planning area could support because tree
removal for the pipeline adjacent to uncut stands would continue to provide conditions suitable for both
foraging and nesting.

Dog River Pipeline Replacement | Environmental Assessment
211
Cumulative Effects
Of the projects and activities found in Table 1, timber harvest on federal land (past, present, and
reasonably foreseeable), and The Dalles Watershed Phase I and II Fuel Reduction were considered in this
cumulative effects analysis because the activities overlap in time and space. These projects would have a combination of beneficial and negative impacts to wild turkey and western gray squirrel. Timber harvest
and thinning have reduced the canopy cover which reduces nesting habitat for western gray squirrel but
may also increase pine seed production for foraging.
Consistency Determination
This analysis is consistent with The National Forest Management Act which requires the Forest Service to manage wildlife habitat to “maintain viable populations of existing native and desired non-native
vertebrate species in the planning area.” The National Forest Management Act requires the Forest Service
to identify Management Indicator Species through the planning process, and to establish objectives to maintain and improve the habitat of indicator species. A Forest wide analysis was completed and is
incorporated by reference. Viable populations of all the Management Indicator Species in this BE would
be maintained at the Forest-scale.
Summary of Effects
The Proposed Action would have little impact to wild turkey since the pipeline construction would minimally open stands and provide some suitable foraging, nesting, brood-rearing, and roosting cover.
The Proposed Action would not be expected to reduce the number of Western gray squirrels that the
planning area could support because tree removal for the pipeline adjacent to uncut stands would continue
to provide conditions suitable for both foraging and nesting.
Additional information regarding this resource can be found in the full specialist report which is
incorporated by reference and available in the project record.
3.6.5 Snag and Down Log Associated Species
Existing Condition
Snags
Currently, 63.3 percent of the East Fork Hood River Watershed contains no large snags in eastside mixed
conifer compared to the historic condition of 34.6 percent. The only category where current levels exceed
historical conditions is in 0-2 large snags per acre. Currently, 16.7 percent of the watershed has between 0 and 2 snags per acre and historically that number was 14.2. This Watershed is deficient in high
concentrations of snags with 8.1 percent of the area with 10 or more snags per acre historically and 3.9
percent currently.
Down Wood
While current and reference conditions of large down logs in eastside mixed conifer are comparable, there
are some differences. Historically, 14.0 percent of the White River Watershed had 2 to 4 percent cover of
large down logs compared to 6.8 percent currently. Under historic conditions, none of the watershed had
greater than 12 percent cover and currently 6.9 percent of the watershed has greater than 12 percent cover.
Effects Analysis
The analysis area includes the White River Watershed. The Pipeline falls within the habitat type identified
in DecAID as Eastside Mixed Conifer with vegetation condition types of small/medium trees and large
trees.

Dog River Pipeline Replacement | Environmental Assessment
212
No Action Alternative
In the short-term, portions of the pipeline that go through plantations would provide low amounts of down wood cover. Most areas would be below 6.5 percent cover of down wood and therefore be below the 30
percent tolerance level for wildlife habitat. However, some of the pipeline would likely have at least 3
percent of down wood comprised of classes 1 thru 4 and therefore would meet the 30 percent tolerance
level for natural down wood conditions, as indicated by DecAID inventory data from unharvested plots.
In the next 20 to 30 years, these stands would begin to experience increased stand density and start to
become increasingly more susceptible to damaging agents such as insects and diseases. These natural
processes would recruit new snags and down logs, mainly from the smaller intermediate and suppressed
trees.
Proposed Action Alternative
The proposed action would involve the removal of trees and dead wood within a 25-foot corridor.
Approximately 438 live trees ranging in size from 6” to 48” dbh that will be removed. Of these 438 trees, roughly 12 are larger than 24” dbh, 170 are between 12” and 14” inches, and the remaining trees are 11”
and smaller. In addition to the live trees approximately 198 standing dead trees would be cut. Of these,
over half are between 11” and 20” inches, roughly 3 are over 30” dbh, 22 between 20” to 30”, with the remainder under 11” dbh. Some of the live trees proposed for cutting would have eventually become
snags and down wood. The total acre of trees and snags proposed for cutting is 10.3 acres. The Watershed
is 102,016 acres and the proposed acres removed represents 0.01. Assuming that 20 percent of the live trees would eventually become snags in the next 50 years, the potential amount of snags lost from the
proposed pipeline would not exceed 0.005 percent of the Watershed which is not measurable at a
meaningful scale and the comparison of reference and current conditions for down logs and snags would
remain unchanged. The project design criteria that requires 5 percent of the largest trees to be left on site,
increasing the amount of large down wood in the planning area.
Cumulative Effects
Of the projects and activities found in Table 1, timber harvest on federal land (past, present, and
reasonably foreseeable), road decommissioning and road closures, and trail maintenance and relocation
were considered in this cumulative effects analysis because the activities overlap in time and space.
It is not likely that private lands would provide snags and downed wood in the foreseeable future. Other
timber harvest activities on Forest Service land would improve structural diversity by initiating a new age class and by creating openings. Thinning would also have an indirect impact by releasing the green
retention trees. These retention trees would later become the large diameter snags and downed wood.
Blocks of unharvested habitat would provide large snags and down wood while the treated areas of the
watershed move toward the mature forest state. The adjacent untreated areas would allow for snag and
down wood-dependent species to recolonize habitat as snags and down wood increase in the treated areas.
Consistency Determination
FW-219 and FW-223 indicate that stands should have 6 logs per acre in decomposition class 1, 2, and 3
and that they should be at least 20 inches in diameter and greater than 20 feet in length. However, FW-
225 and FW-226 indicate that smaller size logs may be retained if the stand is too young to have 20 inch trees. Under the Proposed Action, logs representing the largest tree diameter class would be retained,
maintaining compliance.
Summary of Effects
The proposed acres removed represents 0.01 percent of the East Fork Hood River Watershed which is
102,016 acres. Assuming that 20 percent of the live trees would eventually become snags in the next 50

Dog River Pipeline Replacement | Environmental Assessment
213
years, the potential amount of snags lost from the proposed pipeline would not exceed 0.005 percent of
the Watershed which is not measurable at a meaningful scale.
Additional information regarding this resource can be found in the full specialist report which is
incorporated by reference and available in the project record.
3.6.6 Neotropical Migratory Birds
Existing Condition
Close to 30 species of migratory birds occur on the Barlow and Hood River Districts, some of which are present within the project area during the breeding season. Some species favor habitat with late-
successional characteristics, such as the hermit thrush and brown creeper, while others favor early-
successional habitat such as the Nashville warbler or the Williamson’s sapsucker. Other species like the
white headed woodpecker and pygmy nuthatch utilize open ponderosa pine habitat. Sandhill crane nest in
Camas Prairie in the open meadow when it is flooded in the spring and early summer.
Effects Analysis
The analysis area for migratory birds includes areas within the boundary of the Proposed Action.
No Action Alternative
There would be no habitat alteration under this alternative. Stand conditions and the composition of
migratory bird species dependent on these stands would remain unchanged.
Proposed Action Alternative
Research has demonstrated that timber removal enhances habitat for a number of migratory species and
provides habitat for some species that are rare or absent in un-thinned stands (Hagar and Friesen 2009). However, some species of migratory birds have been shown to decline following thinning. The effects of
tree removal would most likely have a combination of positive, neutral, and negative impacts on
migratory bird use depending on which species are present. The species that may benefit from tree
removal in the analysis area include the olive-sided flycatcher, Williamson’s sapsucker, and chipping sparrow. The species that may be negatively impacted by tree removal include the brown creeper,
Swainson’s thrush, and hermit warbler. Because the trees to be removed are in a linear pattern along the
pipeline, the effects to migratory bird species would be difficult to measure since the habitat at the stand
scale would remain unchanged.
Cumulative Effects
Of the projects and activities found in Table 1, timber harvest on federal land (past, present, and
reasonably foreseeable), road decommissioning and road closures, The Dalles Watershed Phase I and II Fuel Reduction, and The Dalles Watershed fuel reduction were considered in this cumulative effects
analysis because the activities overlap in time and space.
Open habitat that would be created could be beneficial for early seral species like the olive-sided
flycatcher, white-headed woodpecker and Williamson’s sapsucker. The Swainson’s thrush and brown creeper would be negatively impacted by habitat removal. The cumulative effects of timber harvest
activities are similar to the effects of the Proposed Action and would have a combination of positive,
neutral, and negative impacts on migratory birds.

Dog River Pipeline Replacement | Environmental Assessment
214
Consistency Determination
The Proposed Action is consistent with Executive Order 13186 (66 Fed. Reg. 3853, January 17, 2001)
“Responsibilities of Federal Agencies to Protect Migratory Birds.” This Executive Order directs federal agencies to avoid or minimize the negative impact of their actions on migratory birds, and to take active
steps to protect birds and their habitat. This Executive Order also requires federal agencies to develop
Memorandum of Understandings (MOU) with the FWS to conserve birds including taking steps to restore and enhance habitat, prevent or abate pollution affecting birds, and incorporating migratory bird
conservation into agency planning processes whenever possible. The Bureau of Land Management and
U.S. Forest Service have both completed, and are currently implementing, their respective MOU’s with
the FWS.
Summary of Effects
The effects of tree removal would most likely have a combination of positive, neutral, and negative
impacts on migratory bird use depending on which species are present. Because the trees to be removed
are in a linear pattern along the pipeline, the effects to migratory bird species would be difficult to
measure since the habitat at the stand scale would remain unchanged.
Additional information regarding this resource can be found in the full specialist report which is
incorporated by reference and available in the project record.

Dog River Pipeline Replacement | Environmental Assessment
215
3.7 Botany
3.7.1 Existing Condition
This project is located in an area which has been managed in the past. Some large legacy trees remain, but
it is predominantly second-growth Douglas-fir, with a shrub component of oceanspray (Holodiscus
discolor) and wild rose (Rosa gymnocarpa) among others. There is a healthy diversity of understory forbs and grasses within this area, especially within forest openings. The trees and shrubs have been thinned
along the road systems to maintain a fuel break, and now support a dense grass and forb community.
Along the pipeline itself there are several small, wetland habitats. These have been determined to be naturally created sites (see the Fisheries report for more information) which could provide potential
habitat for certain bryophyte species. Only one species was known from within this project area, and no
new sites were found during project surveys.
Shistostega pennata
The goblin-moss, Shistostega pennata, is listed as a Class A species on the 2001 ROD. It used to be on the Regional Forester’s Sensitive species list, but has been removed and does not have a state ranking
with the Oregon Natural Heritage Program. There is one historic site for the goblin-moss within Brook’s
Meadow creek near the project area. There is one point along this creek where the pipeline and access will cross. Surveys at this site did not find any specimens. The goblin-moss is an ephemeral species which
often colonizes mineral soil, most often within the root mass of recently downed trees. These sites are
most common in moist areas, or sites such as caves or riparian areas which stay moist. As this bare,
mineral soil becomes colonized by other bryophytes and plants after the first year, the goblin-moss will
fade out (Harpel and Helliwell 2005).
3.7.2 Effects Analysis
No Action Alternative
Under the No Action alternative, no activities involving the pipe replacement, and all associated ground-
disturbance, repair and maintenance would occur. There would be no impact to sensitive vascular plants,
bryophytes, lichens and fungi.
Proposed Action Alternative
The Proposed Action includes ground-disturbing activities associated with removing the old, existing pipe
and replacing it and other infrastructure. There is also planned, regular maintenance along this pipeline.
This work will remove existing vegetation and create early seral habitats along the pipeline.
There are no current sites for sensitive vascular plants, bryophytes, lichens and fungi within this project
area, so there will be no impact to any of these species.
Cumulative Effects
There are no sensitive species known from this area, resulting in no cumulative effects to consider within
this report.

Dog River Pipeline Replacement | Environmental Assessment
216
3.7.3 Consistency Determination
Forest Service Policy
The No Action alternative and the Proposed Action alternative are consistent with the following Forest
Service Standards FSM 2672.1 - Sensitive Species Management and FSM 2670.22(2) - “Maintain viable populations of all native and desired non-native wildlife, fish and plant species in habitats distributed
throughout their geographic range on National Forest System lands.”
Mt. Hood National Forest Land and Resource Management Plan (Forest Plan)
Direction
The No Action alternative and the Proposed Action alternative are consistent with the following
Forestwide Standards; FW-148, 149 and 150, FW-162, FW-174, FW-175 – “Habitat for threatened,
endangered, and sensitive plants and animals shall be protected and/or improved, and FW-176.
2001 Survey and Manage Record of Decision
The No Action alternative and the Proposed Action alternative are consistent with the survey protocols 2001 Survey and Manage Record of Decision. All botany surveys included consideration of botanical
species in Table C-3 of the 2001 Survey and Manage Record of Decision.
National Forest Management Act (NFMA) Implementing Regulations
The No Action alternative and the Proposed Action alternative are consistent with regulations 36 CFR
219.19 and The 1983 USDA Departmental Regulation 9500-4.
3.7.4 Summary of Effects
The Proposed Action would have no impact on sensitive vascular plants, bryophytes, lichens and fungi
because there are no sensitive vascular plants, bryophytes, lichens and fungi within this project area.
Additional information regarding this resource can be found in the full specialist report which is
incorporated by reference and available in the project record.
3.8 Invasive Plant Species
3.8.1 Existing Condition
The project area is located within a previously managed area. The area has a healthy growth of native
shrubs, grasses and forbs which prevents the establishment of invasive species. The 1700 road is
maintained as a fuel break, and is also heavily utilized for travel and recreation. This route has been used many times in the past several years as a haul route for timber sales. Because of these activities, this road
and nearby landings or trailheads have been regularly surveyed and managed for invasive weeds for many
years. The 1700-014 road runs parallel to the existing pipeline, and is used primarily for pipeline
maintenance and not for regular travel. The target invasive species, or “noxious weeds” identified by the Oregon Department of Agriculture (ODA) that are known to occur within or adjacent to the project area
are spotted and diffuse knapweed, bull thistle and St. Johnswort. There are only sparse populations of
each within the project area.

Dog River Pipeline Replacement | Environmental Assessment
217
3.8.2 Effects Analysis
No Action Alternative
The No Action alternative would have no effects which would increase or introduce invasive weed
populations. None of the planned activities would take place, and no ground disturbance would occur.
Vectors which are currently present would continue to have the potential for invasive species introduction
and spread.
Proposed Action Alternative
The Proposed Action would remove old pipeline, replace it and other infrastructure, and would provide maintenance along this new line. These ground-disturbing activities would create favorable conditions for
invasive species establishment from new or current populations and seed source. As part of the project,
pipes and gravel/sand materials will be stockpiled at four different sites off the 1700 road and 4400-011
road. These stockpiles will be in open, previously disturbed areas which have been approved for use. Introduction of new weed species or infestations can occur through this material and its use during the
project implementation. Machinery also has the potential to bring in new weed seeds or particles, or
transport it from neighboring infestations.
Project Design Criteria associated with the Proposed Action would provide mitigation for the introduction
of new weed species, and would prevent the spread of current invasive species into areas without
infestation as well as to other areas of the forest. This prevention would occur through the cleaning of
equipment, use of weed-free materials, and restoration with native seed. Machinery would be washed prior to its arrival on forest land. There are only small infestations near the project area, but those haul
routes, landings and known sites within the project area would be treated prior to implementation.
The level of risk for the introduction or spread of noxious weeds is moderate and based on the following: known weeds in/and or adjacent (~ 100 feet) to the project area, in moderate quantities (Moderate
density/acre), no more than four of vectors 1 - 8 present in the immediate project area, project operation
activities not able to avoid weed populations.
Long term treatments are not proposed as part of this project, and would be conducted under a separate
program and NEPA document (FEIS Site-Specific Invasive Plant Treatments for Mt. Hood National
Forest and Columbia River National Scenic Area in Oregon including Forest Plan Amendment #16.
Cumulative Effects
The area analyzed for cumulative effects was within the Dog River 6th field subwatershed, with a focus on the travel ways within and associated with the project. Of the projects and activities found in Table 1,
road decommissioning and road closures, The Dalles Watershed Phase I and II Fuel Reduction, The
Dalles Watershed fuel reduction, trail maintenance and relocation, were considered in this cumulative
effects analysis because the activities overlap in time and space.
These projects overlap in space and some overlap in time. The use of the 1700 road system and nearby
trails for project haul routes and travel has a continued risk for invasive species introduction. Project
Design Criteria, as discussed above, would mitigate for the introduction and spread of invasive species. Under the 2008 Site-Specific Invasive Plant Treatment EIS, roadside populations would be treated
regularly depending on the need and level of infestation. These combined actions would lower the risk of
invasive species introduction within the project area. This additional road maintenance would be addressed separately through the FEIS Site-Specific Invasive Plant Treatments for Mt. Hood National
Forest and Columbia River National Scenic Area in Oregon including Forest Plan Amendment #16.

Dog River Pipeline Replacement | Environmental Assessment
218
3.8.3 Consistency Determination
Forest Service Manual (FSM) 2900 Invasive Species Management direction requires the determination of
“the risk of invasive species introduction or spread as part of the project planning and analysis process for
proposed actions, especially for ground disturbing and site altering activities, and public use activities”
(FSM 2904.08, #8)
FSM 2900 also states, “Ensure that all Forest Service management activities are designed to minimize or
eliminate the possibility of establishment or spread of invasive species on the National Forest System, or
to adjacent areas” (FSM 2903).
The identification of management and prevention is also consistent with the Site-Specific Invasive Plant
Treatments for Mt. Hood National Forest and Columbia River Gorge National Scenic Area in Oregon
FEIS/ROD (2008).
Northwest Forest Plan Direction:
• FW-299 - “Noxious weed control projects shall comply with Region Six “Managing Competing
and Unwanted Vegetation” FEIS, Record of Decision (1988), and Mediated Agreement (1989).”
• FW-300 - “Plants that have been identified as pests by the State Department of Agriculture shall
be controlled as described in the Mt. Hood National Forest Noxious Weed Implementation Plan.”
• FW-301 - “Implementation of control measures should adhere to the following priorities:
• Prevention
• Early treatment
• Maintenance
• Correction
• No action (per Vegetation Management FEIS, Record of Decision 1988, and Mediated
Agreement 1989)”
• B2-056 – “Vegetation management adjacent to major travel routes or recreation sites shall be
consistent with the Northwest Region (R6) “Management of Competing and Unwanted
Vegetation” FEIS, Record of Decision (1988) and Mediated Agreement (1989)”
3.8.4 Summary of Effects
The Proposed Action would have a moderate risk of weed introduction. The pipe removal and
replacement activities would create disturbed conditions for invasive species growth, and the equipment may introduce seeds or propagules from nearby roadside sources. Mitigations are proposed to reduce the
risk of invasive species introduction and spread.
Additional information regarding this resource can be found in the full specialist report which is
incorporated by reference and available in the project record.
3.9 Recreation
3.9.1 Existing Condition
Recreational activities occur within and adjacent to the project area. The area is popular for dispersed
recreation, including hunting and camping. A popular non-motorized trail system is located along The
Dog River Pipeline as well as in the adjacent area. The following existing conditions within the planning
area will be examined: the Recreation Opportunity Spectrum, dispersed recreation, and trails.

Dog River Pipeline Replacement | Environmental Assessment
219
Recreation Opportunity Spectrum (ROS)
The majority of the proposed project falls within the ROS setting identified in the Forest Plan as: Roaded
Modified. Recreation experiences and opportunities in these areas often depend on vehicular access off the primary routes via secondary roads. Camping experiences are relatively primitive, with few on-site
facilities provided, requiring some self-reliance and use of primitive outdoor skills.
A small portion of the project falls within the Roaded Natural ROS setting. This portion of the project is not a high use recreation area. Roaded National ROS settings provide for areas characterized by
predominantly natural-appearing environments with moderate evidences of the sights and sounds of man.
These evidences usually harmonize with the natural environment. Interaction between users may be low to moderate but with evidence of other users prevalent. Resource modification practices are evident but
harmonize with the natural environment. Conventional motorized use is provided for in construction
standards and the design of facilities.
Dispersed Recreation
Dispersed recreation use may occur throughout the project area. Dispersed recreation in the vicinity of the proposed pipeline replacement may include camping, hunting, berry picking, mushroom picking, and
driving for pleasure. Other incidental recreational use may occur as well.
Trails
There are numerous popular trails along FSRs 44 and 17. Surveyors Ridge Trail 688 is popular for hikers,
horseback riders and mountain bikers. The trail winds through forested areas, open areas and along Surveyors Ridge where it provides views of Mt. Hood and the surrounding valley. The trail is located on
top of the Dog River Pipeline for approximately 2.7 miles. This section of the trail is also an access road,
but portions of it have grown in significantly over the years making it look more like a trail than a road.
Surveyors Ridge Trail 688 connects with other popular trails in the area which provide large loops for nonmotorized recreationists to connect. Surveyors Ridge connects directly to The Super Connector, Dog
River Trail 675 and Cooks Meadows Trail 639. Many mountain bikers enjoy riding several trails in one
day, and Surveyors Ridge is often a popular choice for both locals and visitors who have heard about the
views the trail offers.
FSRs 44 and 17 are snowmobile trails during the winter. The roads are closed November 15 through
March 15 and may be groomed for snowmobiles December 1 through April 1. A local snowmobile club
performs the grooming under a road use permit with the Mt. Hood National Forest.
Table 65. Trails within Project Area.
Trail Name and Number Permitted Use Approximate Length (Miles)
Surveyors Ridge 688 Pack and Saddle, Bike, Hike 13.0
Dog River 675 Bike, Hike 5.3
Cooks Meadow 639 Pack and Saddle, Bike, Hike 3.0

Dog River Pipeline Replacement | Environmental Assessment
220
3.9.2 Effects Analysis
No Action Alternative
There would be no direct or indirect effects from the No Action alternative. Taking the No Action
alternative would have no impact to the ROS spectrum, dispersed recreation, or trails.
Proposed Action Alternative
Recreation Opportunity Spectrum (ROS)
The pipeline replacement would not have a detrimental impact on the Roaded Modified ROS or Roaded
Natural ROS. In both ROS settings motorized use is evident. Project completion could bring more routine maintenance utilizing vehicles along the pipeline right-of-way. This activity would be consistent with
these ROS settings, as well as the presence of a modern, roaded right-of-way.
Dispersed Recreation
The proposed project could have some impacts to dispersed recreation. During project implementation,
forest visitors could see and hear construction along the pipeline right-of-way and the proposed staging
areas. This impact would be temporary and only occur during project implementation.
Another effect would be the presence of a modern right-of-way with the completion of the project. The
new right-of-way would look different from the existing right-of-way and have substantially less
vegetation shading it. Some visitors may enjoy the new right-of-way, and use it for non-motorized recreation. Others may miss the old right-of-way which was not visible from the roadway and was well
shaded and had vegetation encroaching upon in in areas.
Visitors who enjoy driving for pleasure would see the right-of-way corridor where it crosses FSR 17. The right-of-way would be the most visible from the west side of the road. Some visitors may not appreciate
the change in scenery from the road, although it will impact the view for less than 100 linear feet along
the road.
Trails
Sections of the Surveyors Ridge Trail 688 would be closed during implementation. A 2.7 mile section of the trail overlaps with the existing right-of-way. This section of trail would be substantially different once
the pipeline is replaced as the right-of-way which is currently covered with native surface and shaded by
vegetation would be disturbed to replace the existing pipeline and resurfaced with aggregate and widened to 25 feet. To mitigate this impact, a trail has been constructed connecting the Super Connector trail
directly to Surveyors Ridge Trail 688. This action will allow visitors to use the Super Connector Trail to
directly access the Surveyors Ridge Trail and bypass the section of trail where the pipeline replacement
would take place. A reroute was also completed to allow visitors to stay on a primitive trail and avoid the
sections of existing trail where it would be impacted by the pipeline project, except at one intersection.
Some visitors might prefer using the pipeline right-of-way once it becomes a modern right-of-way. They
might enjoy easy access along the corridor. Others may be disappointed that what they perceived to be a trail and not a right-of-way looks and feels more like a road. There would likely be a period during
construction when there wouldn’t be trail access to the unimpacted section of Surveyors Ridge trail from
the Dog River and Cooks Meadow Trails. Some visitors may not utilize the trail system for this reason. However, this would be temporary. All changes to the system would be posted at pertinent trail heads, on
pertinent websites and released to the public ahead of time, so visitors could plan accordingly.
It is unlikely that the Dog River Pipeline replacement would have an impact on groomed snowmobile
trails in the vicinity of the project.

Dog River Pipeline Replacement | Environmental Assessment
221
Cumulative Effects
Of the projects and activities found in Table 1, the items below were considered when analyzing
cumulative effects for recreation. These items were analyzed as a result of their proximity to the planning area and their potential to have an effect on recreation within the planning area. The spatial context of the
cumulative effects analysis lies within one mile of any portion of the proposed pipeline replacement.
Under the Proposed Action, these items could have an impact on the planning area. Combined with the
Proposed Action, these actions would not deviate from Forest Plan standards.
Trail Maintenance
No cumulative effects would occur. The affected portion of Surveyors Ridge Trail would be closed and the portion of the trail overlapping the pipeline right-of-way would be permanently impacted, but project
design criteria would mitigate any long term impacts after the project was complete by rerouting the trail
to provide a similar, somewhat primitive trail experience. Over time, potential hazard tree removal along
trails could open up scenic views near the project area. This could improve views of Mount Hood as well
as other unique natural features within the planning area.
Hazardous Fuels Reduction
No cumulative effects would occur. The projects would occur in close proximity, and trail closures would occur due to each project. However, they would not be likely to be implemented at the same time.
Furthermore, the Surveyors Ridge Trail reroute would help mitigate impacts of closure of the Dog River
Trail which would occur during the implementation of the fuels reduction.
Road decommissioning and road closures
No cumulative effects would occur. Road closures within and adjacent to the project could eliminate
access to dispersed campsites and other dispersed recreation use like berry picking. There are already a
minimal number of roads in the vicinity. Any closures would be minimal and would have a small impact on access for dispersed recreation. Over time, potential hazard tree removal along roads could open up
scenic views near the project area. This could improve views of Mount Hood as well as other unique
natural features within the planning area.
3.9.3 Consistency Determination
Table 66 lists the Standards and Guidelines from the Forest Plan pertinent to the No Action alternative
and the Proposed Action alternative.

Dog River Pipeline Replacement | Environmental Assessment
222
Table 66. Consistency with Forest Plan Standards and Guidelines.
Standards & Guidelines Relevant
Element of
Proposed
Action
Does the
Proposed Action
Meet Standard
as currently
designed?
Data Used for
Analysis
FW-451/458: Forest Management
activities with the potential to
adversely impact trails and associated facilities and dispersed
recreation sites shall include
measures to minimize impacts and
provide for protection and/or restoration of the impacted trails,
sites, facilities, and structures.
Installation of a
modern pipeline
and modern right-of-way in
the same
location as the
Surveyors Ridge
trail.
Yes Surveyors Ridge Trail
Reroute Decision
Memo.
FW-460: Trail systems shall be
designed, located, managed, and
maintained to consider user’s needs
and other resource objectives
Installation of a
modern pipeline
and modern right-of-way in
the same
location as the
Surveyors Ridge
trail.
Yes Surveyors Ridge Trail
Reroute Decision
Memo.
FW-452/463: Designated trails,
trailheads, associated facilities, and dispersed recreation sites impacted
and/or adversely affected by
management activities, shall be
rehabilitated, restored, and/or
relocated.
Installation of a
modern pipeline and modern
right-of-way in
the same
location as the Surveyors Ridge
trail, and closure
of portions of
the trail system.
Yes Surveyors Ridge Trail
Reroute Decision
Memo.
B2-001: Structures and
improvements may be provided to
protect resource values, for administrative purposes, and to
accommodate recreational use
Pipeline
installation is
needed for administrative
purposes for The
City Of The
Dalles
Yes Proposed Action
discusses need for
improving the existing
pipeline.
B2-005: A trail system should be
developed and designated to disperse
recreational use and provide a range
of difficulty levels.
Pipeline will
have an impact
on trail system. Separate
decision
mitigates
Yes Surveyors Ridge Trail
Reroute Decision
Memo.

Dog River Pipeline Replacement | Environmental Assessment
223
Standards & Guidelines Relevant
Element of
Proposed
Action
Does the
Proposed Action
Meet Standard
as currently
designed?
Data Used for
Analysis
impacts to trail
system.
B6-003,004,005: The development
of new or expansion of existing recreation sites, facilities and trails
may occur, but should avoid or
protect sensitive watershed lands. These sites, facilities and trails shall
not be permitted in The Dalles
Watershed.
Pipeline will
have an impact on trail system.
Separate
decision mitigates
impacts to trail
system.
Yes Surveyors Ridge Trail
Reroute Decision
Memo.
C1-001: Dispersed recreation opportunities shall be provided and
encouraged. Hiking and trail use,
driving for pleasure, hunting, wildlife viewing, berry picking,
cross-country skiing, the use of off-
road vehicles, and cultural resource
interpretation are examples of
possible activities.
Installation of a modern pipeline
and modern
right-of-way in the same
location as the
Surveyors Ridge
trail.
Yes Surveyors Ridge Trail Reroute Decision
Memo.
3.9.4 Summary of Effects
Recreation Opportunity Spectrum (ROS)
There would be no direct effects to the two ROS settings identified within the planning area under the No
Action alternative or the Proposed Action alternative. Regardless of the course of action, the ROS settings
would remain the same, and recreational opportunities within the settings would remain the same.
Dispersed Recreation
There would be no direct or indirect effects to dispersed recreation under the No Action alternative.
Under the Proposed Action alternative there may be some impacts to dispersed recreation during project
implementation if visitors are unable to access areas they would like to visit. Construction sights and sounds could also have a negative impact on someone’s experience in the vicinity of the project if they
are seeking solitude and quiet, however, this would be temporary. The new modern right-of-way could be
perceived either positively or negatively by visitors depending on visitor perspective.
Trails
The Proposed Action alternative would impact the trail system in the vicinity of the project. Surveyors Ridge trail would be the most directly impacted as a 2.7 mile section of the trail overlaps with the right-
of-way. This segment of trail would be permanently modified by the project. A reroute of the trail will
mitigate concerns related to the change in the condition of the trail itself by continuing to provide a

Dog River Pipeline Replacement | Environmental Assessment
224
semiprimitive trail experience and continuing to connect Surveyors Ridge trail to the other trails along the
FSR 44 corridor.
A segment of trail bypassing the construction will be constructed prior to implementation of the pipeline
replacement, which would provide continuity for the majority of the trail system. The full reroute would
not be completed until the entire pipeline replacement was completed, so there would be an impact in the
short term. In the long term, the system would remain intact.
Additional information regarding this resource can be found in the full specialist report which is
incorporated by reference and available in the project record.
3.10 Cultural Resources
3.10.1 Existing Condition
Very few archaeological surveys or excavations have been conducted in the area, and little is known about the prehistory of the area. Nearby peeled cedar trees suggest that huckleberries and other plant
resources were probably gathered, along with hunting forays for deer, elk and other wildlife. Expansive
vistas of Mt. Hood were probably enjoyed for recreational and spiritual pursuits; a few rock cairns and
rock features have been located overlooking the East Fork Hood River and the mountain. Some of the current hiking trails and roads likely follow earlier Indian trails, especially the 4410 and 4420 roads, and
possibly the 1700 and 1720 roads.
Although there are no known Traditional Cultural Properties known to exist near the project area, stacked rock features and lithic scatters within a few hundred meters of the project location indicate a varied and
intensive use of the area. A projectile point recovered from the 4420 site (661NA0184) appears similar to
the Eastgate type and suggests that the area was utilized at least 2500 years ago (Perino 1985).
Dog River Aqueduct
The Dog River Aqueduct is considered individually eligible for inclusion on the National Register of Historic Places. The Dog River Aqueduct (661EA0031) is largely intact as it was constructed in 1913-
1914, with the exception of at least two areas repaired with steel pipe or terra cotta pipe. The feature also
exhibits a high degree of engineering skills, with all of the labor conducted using hand tools. Features associated with the aqueduct include a total of eight rocked pressure valves, seven rocked culverts, the log
stringer bridge crossing over Meadow Creek, scattered clay tiles, gauging stations, and a concrete access
box. A portion of the pipeline was replaced with steel pipe during a previous failure in 1944. Today,
pipeline maintenance consists of driving wooden wedges beneath the steel bands to tighten the seams and
replacing deteriorated segments.
Dog River Head Works Log Cabin
The Dog River Head Works Log Cabin (661EA0073) is considered eligible for inclusion on the National
Register of Historic Places as contributing elements to the historic district. It was constructed in 1904, is
believed to be the oldest structure at the head works. The cabin has played a key role in the development and installation of the aqueduct. The cabin has experienced some modifications, is leaning into a
hillslope, and is partially deteriorated, but is still largely intact.
Dog River Head Works Cabin and Wood Shed
The Head Works Cabin is considered eligible for inclusion on the National Register of Historic Places as
contributing elements to the historic district. The cabin portion of the Dog River Head Works Cabin and Wood Shed (661EA0074) was constructed in 1922 in the Mill Creek area and later moved to the head

Dog River Pipeline Replacement | Environmental Assessment
225
works. The structure has always functioned as the headquarters for the head works, and appears to be unmodified. According to Keyser, the cabin was constructed in 1922 on City of The Dalles property on
Lower Mill Creek, and later moved (no date) to its current location. The cabin has always served as patrol
and maintenance headquarters for City Water Works staff.
The Wood Shed component of the Dog River Head Works Cabin and Wood Shed (661EA0074) was constructed in the 1940s by Tobe Payne, and moved to its current location in 1969 (Unpublished
manuscript; William Keyser August 27, 1980). The Wood Shed lies outside of the Period of Significance
for the Dog River Head Works.
Dog River Diversion Cabin
The Dog River Diversion Cabin (661EA0075) is considered individually eligible for inclusion on the
National Register of Historic Places. It was constructed between 1910 and 1920 (exact date unknown)
during the installation of the pipeline. The structure is unique because of the “US” stamping exhibited on
the ends of each log; this stamping shows early cooperation between the City of The Dalles and the US
Forest Service in the management of the watershed.
Brooks Meadow Pipeline
The site was initially documented in 1990 by Kirk Metzger as part of the Dog River Aqueduct, FS
number 666EA0031. For the purpose of this analysis the Brookes Meadow Pipeline is documented as FS
number 666EA0298, separate from the Dog River Pipeline. The site consists of a water transmission
pipeline.
The Dog River Telephone Line
The Dog River Telephone line (661EA0350) consists of 12 trees with the remains of a telephone line
along both sides FSR 4400-011. The telephone line remains consist of brown and white split-tree ceramic
insulators or wire mountings. The trees are immediately adjacent to the road. The insulators are mounted on the trees at various heights. A 1916 Oregon National Forest Map shows a telephone system running
north from a guard station at Brooks Meadow, which may have connected to the Dog River Telephone
Line. The telephone line was probably installed to monitor conditions at the head gate works for the Dog River Aqueduct (Pipeline) and was most likely installed when the Dog River Head Works Cabin
(661EA0074) was placed at the head works in 1922.
The Dalles Water Supply Ditch
The water Supply Ditch (661EA0351) is considered individually eligible for inclusion on the National
Register of Historic Places. The intact portions of the ditch are a good example of early efforts by local communities to begin to manipulate and manage resources on Federal lands determined to be vital for
their survival. The site is a linear feature that extends north from the bank of Dog River for approximately
2.18 miles. The ditch measures up to 16 feet wide and up to 5 feet in depth. The ditch begins on the east bank of Dog River about 3,143 feet upstream from the dam and diversion at the current headworks for the
Dog River Aqueduct. No diversion remains at the point where the ditch leaves Dog River.
The Dog River Diversion and Impoundments
The Dog River Diversion and Impoundments is considered eligible for inclusion on the National Register
of Historic Places as contributing elements to the historic district. This site is comprised of two small dams on the Dog River; an upper dam and a lower dam. The upper dam consists of concreate and is
located approximately 78 feet upstream from the lower dam. There are two modern gauging stations at
the site. The lower dam is located at the Head Gate Cabin, and consists of a complex structure designed to
impound and divert waters from Dog River into the Dog River Aqueduct. There is a spillway at the east

Dog River Pipeline Replacement | Environmental Assessment
226
end of the dam. The aqueduct intake is beneath the Dog River Diversion Cabin (661EA0075), and consists of a ‘pond’ partially enclosed by concrete walls. There is a covered grate in front of the intake.
Modern metal steps and railings lead up the north face of the dam, where a walkway constructed of
boards leads to a metal sluice gate.
The Dog River Diversion and Impoundments (661EA0364) has been significantly modified through the years. The modifications include the addition of concrete abutments, the addition of walkways, the
modification of the intake, the addition of modern steps, the addition of a sluice gate, and the addition of
modern hand rails. The appearance of the dam has changed dramatically from the same structure photographed in 1923. The feature does not retain suitable integrity to be considered individually eligible
for inclusion in the National Register of Historic Places; however, the feature can be considered as a
contributing element to the Dog River Head Works historic district.
3.10.2 Effects Analysis
No Action Alternative
By not replacing the pipeline, Heritage Resources would continue to persist in their existing condition. The resources would be affected by decay, natural forces, and continued maintenance to the pipeline and
associated infrastructure.
Proposed Action Alternative
To determine the effects of the Proposed Action, it is necessary to assess the significance, or eligibility for
inclusion in the National Register of Historic Places, for each of the historic properties potentially
affected by the Proposed Action.
Dog River Aqueduct
It is expected that although the historic pipeline would be left intact, most if not all of the associated
features would most likely be obliterated during the installation of the new pipeline. The setting of the
pipeline would be affected by the removal of trees and equipment maneuvering. However, the effects on the setting would only be temporary as the exposed slopes would be stabilized and it is expected that
conifer trees would quickly restock in a natural process. Although the proposal calls for leaving the
historic pipeline intact and functioning through the replacement process, the old pipeline will no longer carry water once the new pipeline is operational. Without constant exposure to water, it is expected that
the historic pipeline will rapidly deteriorate. The Dog River Aqueduct is a buried artifact; replacing the
pipe would have no impact on the visual character or historic nature of the pipeline; however, the visual
setting would be disrupted temporarily. Interpretive opportunities would not be affected by the replacement of the buried pipeline. The Dog River Aqueduct has been fully documented. An interpretive
sign explaining the history of the aqueduct would be erected along the Surveyors Ridge Trail. The
Proposed Action would have no adverse effect on the Dog River Aqueduct. The project will have no
adverse effect on the Dog River Head Works historic district.
Dog River Head Works Log Cabin
The proposed replacement of the Dog River Aqueduct would occur about 30 feet to the west of and
adjacent to the cabin. Equipment maneuvering would occur along Forest Service Road 4400-011 adjacent
to the cabin. The cabin would not be directly affected by the proposed project. However, the setting of the cabin would be affected by the removal of some of the vegetation between the road and the pipeline.
However, the effects on the setting would only be temporary as the exposed slopes would be stabilized
and it is expected that conifer trees would quickly restock in a natural process. There would be no indirect effects to the cabin. The proposed project would have no adverse effect to the Dog River Head Works

Dog River Pipeline Replacement | Environmental Assessment
227
Log Cabin (661EA0073). The project will have no adverse effect on the Dog River Head Works historic
district.
Dog River Head Works Cabin and Wood Shed
The proposed replacement of the Dog River Aqueduct would occur about 30 feet to the west of the cabin,
where the pipeline is situated beneath Forest Service Road 4400-011. The setting includes a small
graveled parking area to the south of the cabin. There would be no direct or indirect effects to the cabin or the wood shed. The proposed project would have no effect to the Dog River Head Works Cabin and
Wood Shed (661EA0074). The project will have no adverse effect on the Dog River Head Works
historic district.
Dog River Diversion Cabin
The replacement of the Dog River Aqueduct would involve modifications to the intake, situated beneath the cabin. The intake has been modified and no longer retains any historic character. The cabin would
remain in its current location; there are no plans to modify, move, or change the cabin. There would be no
direct or indirect effects to the cabin. The proposed project would have no effect to the Dog River Diversion Cabin (661EA0075). The project will have no adverse effect on the Dog River Head Works
historic district.
Brooks Meadow Pipeline
The replacement of the Dog River Aqueduct would involve use of Forest Service Road 1700-014 adjacent
to and above the southern portion of the Brooks Meadow Pipeline. The southern portion of the Brooks Meadow Pipeline lies near the 25-foot wide maintenance/access corridor required for the pipeline
replacement and would likely be impacted by the project. The northern portion of the pipeline above the
crossing of Forest Service Road 1700-014 over Meadow Creek would remain unaffected by the project. It
has been determined that the pipeline does not contribute to the NRHP eligibility of the Dog River Head Works historic district, and is not individually eligible for inclusion on the NRHP. There would be no
indirect effects to the pipeline. The Brooks Meadow Pipeline is considered to be ineligible for inclusion in
the NRHP, both as an individual resource and as a contributing element to the Dog River Head Works historic district. The proposed project would have no effect to the Brooks Meadow Pipeline (661EA0293)
or to the historic district.
Dog River Telephone Line
The Dog River Telephone Line lies adjacent to Forest Service Road 4400-011 and within the 25-foot
wide corridor for equipment maneuvering. The telephone line would likely be impacted by the project; many of the trees containing insulators are dead or dying, and would be removed as hazard trees. Other
trees containing insulators may be obstacles to equipment maneuvering and would be removed. There
would be no indirect effects to the telephone line. The Dog River Telephone Line is considered to be ineligible for inclusion in the NRHP, both as an individual resource and as a contributing element to the
Dog River Head Works historic district. The proposed project would have no effect to the Dog River
Telephone Line (661EA0350) or to the historic district.
The Dalles Water Supply Ditch
The ditch lies outside of any of the proposed areas affected by the project. The Dalles Water Supply Ditch would not be directly or indirectly affected by the project. There would be no effect to the Dalles Water
Supply Ditch (661EA0351).

Dog River Pipeline Replacement | Environmental Assessment
228
Dog River Diversion and Impoundments
A fish screen is scheduled to be installed as part of the project. The structure would measure about 40 feet
long and 20 feet wide. The structure would connect to the existing dam and extend upstream for 40 feet, and extend into the stream 20 feet from the diversion intake gate. The fish screen would be added to the
main diversion as described above. The addition of the fish screen would be a permanent attachment and
visual change to the impoundment. There would be no indirect effects to the Dog River Diversion and Impoundments (661EA0364). The proposed project would have no adverse effect to the Dog River
Diversion and Impoundments (661EA0364). The project will have no adverse effect on the Dog River
Head Works historic district.
Cumulative Effects
For heritage resources, any effects are limited to site specific locations. Any cumulative effects would also be limited to heritage resources situated within proposed areas of ground disturbance. It has been
determined that the project as proposed would have no adverse effect on heritage resources. All projects
shown in Table 1, were considered for cumulative effects; however, none of the proposed projects involve heritage resources situated within the proposed project areas. There are no known projects that would
overlap with the current project area in the foreseeable future, therefore there would be no cumulative
effects for heritage resources as a result of implementing any of the action alternatives. The consultation
for the Heritage Resource Survey results and recommendations for the project have been completed in accordance with the 2004 PA and submitted to the Oregon SHPO for review; the results of the SHPO
review are pending.
3.10.3 Consistency Determination
The project would not adversely impact any significant heritage resources. Based on the proposed
protective measures, the project meets the criteria in the Programmatic Agreement for “No Historic
Properties Adversely Affected” determination.
This action is consistent with Forest Plan goals to protect important heritage resources. Heritage resource inventories were conducted in compliance with the 2004 PA during the project planning stage (FW-598,
FW-600, FW-610, FW-602 and FW-606), the field survey results were fully documented (FS-608).
Heritage resources potentially affected by the project activities have been evaluated for inclusion on the NRHP (FW-612), and the potential effects to heritage resources from the proposed projects have been
assessed (FW-609, FW-610). All records and documents concerning heritage resources for the project are
kept on file at the Hood River Ranger District, Mt. Hood National Forest (FW-626).
3.10.4 Summary of Effects
Under the Proposed Action, the City of The Dalles proposes to replace the entire length of the Dog River
Aqueduct and add a fish screen to the lower impoundment at the intake. Pipe, gravel, and equipment
would be staged at as many as three storage areas. A complete (100%) survey of the entire project area revealed a collection of features and structures comprise the Dog River Head Works historic district,
shown in Table 67.

Dog River Pipeline Replacement | Environmental Assessment
229
Table 67. Dog River Head Works Historic District
Forest Service
Temporary Number
Name Description
661EA0031 Dog River Aqueduct Historic wood pipeline
661EA0073 Dog River Head Works Log Cabin Historic cabin
661EA0074 Dog River Head Works Cabin and Woodshed Historic structures
661EA0075 Dog River Diversion Cabin Historic Cabin
661EA0293 Brooks Meadow Pipeline Historic wood/steel pipeline
661EA0350 Dog River Telephone Line Historic telephone line
661EA0351 The Dalles Water Supply Ditch Historic Ditch
661EA0364 Dog River Diversion and Impoundments Historic dams, intake
The historic district was determined to be eligible for inclusion on the National Register of Historic Places
(NRHP) based on NRHP Criterion A with a Period of Significance of 1887 to 1922. Properties
determined to be individually significant and eligible for inclusion on the NRHP include the Dog River Aqueduct (661EA0031), the Dog River Diversion Cabin (661EA0075), and The Dalles Water Supply
Ditch (661EA0351). Properties determined to be eligible for inclusion in the NRHP as contributing
elements to the historic district include the Dog River Head Works Log Cabin (661EA0073), the cabin portion of the Dog River Head Works Cabin and Wood Shed (661EA0074), and the Dog River Diversion
and Impoundments (661EA0364). Properties determined to be ineligible for inclusion on the NRHP and
also non-contributing elements of the historic district include the Brooks Meadow Pipeline (661EA0293)
and the Dog River Telephone Line (661EA0350). No protective measures are required or recommended
for ineligible properties.
For each of the properties documented during the survey, it was determined that the project would have
the effects listed in Table 68.
Table 68. Summary of Effects, Dog River Head Works
Temporary
Number
Site Name Eligibility Determination
of Effect
Description of Effects
661EA0031 Dog River
Aqueduct
Individually
Significant
No Adverse
Effect
Property is below ground, no visual
effects to historic character. Property has been fully
documented. An interpretive sign
will be installed. Most of associated features
expected to be obliterated.
Property is part of municipal water source with upgrades, maintenance
expected.
Upgrade required to avoid
detrimental potential effects of failure.
An interpretive sign explaining the
aqueduct history would be installed. Setting affected by 25-foot wide
installation corridor would be
temporary; vegetation expected to restock naturally.

Dog River Pipeline Replacement | Environmental Assessment
230
Temporary
Number
Site Name Eligibility Determination
of Effect
Description of Effects
661EA0073 Dog River Head
Works Log
Cabin
Contributing
element -
moved from original
location
No Adverse
Effect
Setting of cabin affected by 25-foot
wide installation corridor would be
temporary; vegetation expected to restock naturally.
661EA0074 Dog River Head
Works Cabin and Wood Shed
Cabin is
contributing element-
moved from
original location.
Wood Shed
is outside of
Period of Significance
No Effect Setting is already open and would
remain unchanged. Cabin would not be impacted by pipeline
replacement
661EA0075 Dog River
Diversion Cabin
Individually
Significant
No Effect Intake would be modified, but cabin
would be left unmodified and intact.
661EA0293 Brooks
Meadow
Pipeline
Non-eligible No Effect Property determined to be ineligible
661EA0350 Dog River Telephone Line
Non-eligible No Effect Property determined to be ineligible
661EA0351 The Dalles
Water Supply
Ditch
Individually
Significant
No Effect The property lies outside of any
activity areas associated with this
project.
661EA0364 Dog River
Diversion and
Impoundments
Contributing
element-has
been significantly
modified
No Adverse
Effect
The lower dam has already been
significantly modified. The addition
of a fish screen would be consistent in scope and scale with previous
modifications. No historic materials
would be removed.
Additional information regarding this resource can be found in the full specialist report which is
incorporated by reference and available in the project record.

Dog River Pipeline Replacement | Environmental Assessment
231
3.11 Climate Change
3.11.1 Existing Condition
The Council on Environmental Quality has identified that climate change is a particularly complex
challenge given its global nature and the inherent interrelationships among its sources, causation,
mechanisms of action, and impacts. Projects and programs with a Federal nexus requiring the disclosure of environmental impacts under NEPA have the potential to either affect the amount of greenhouse gases
(GHGs) in the atmosphere or to be affected by climate change.
There has been growing concern and interest over the effects of climate change on National Forests and their current status as a carbon sink. Evidence suggesting that the correlation between an increase in
average global temperatures and the extent of forest lands impacted annually is compelling. The size,
frequency and duration of drought, wildfire, and insect/disease outbreaks has been trending to increase over the last several decades. It is believed that the role of these events has had a notable effect on the
carbon cycle in the forested ecosystems across the Nation.
This project involves the replacement of an aging water conveyance pipeline with a new one. It was not
specifically intended to mitigate or respond to potential climate change. The project is not considered to be an action that would be categorized as a primary contributor to local, regional, or global greenhouse
gas emissions. Forested land will not be converted into a developed or agricultural condition. The extent
of tree removal would be limited to the construction corridor and minimized to that which is only necessary for the replacement of the existing pipeline. Since the project’s footprint of disturbance would
be comparatively very small in the regional or global context, this analysis will not attempt to quantify
carbon emission or sequestration. This section will address however, aspects of the project that may affect carbon emission or sequestration at the local scale.
Tree removal, along with forest health and growth issues are discussed in Section 3.1, Vegetation
Resources.
3.11.2 Effects Analysis
It is anticipated that for either alternative, the City of The Dalles would participate in climate change
adaptation strategies being developed by the State, including those that would be executed by the OWRD and the Oregon Health Authority (OHA) for municipal and drinking water suppliers. The Oregon Climate
Change Adaptation Framework (Kershner 2010), and the Oregon Climate Assessment Reports prepared
by the Oregon Climate Change Institute (OCCI), have identified future water supplies and availability as
a priority for focused development of adaptation strategies.
They have recognized implications of expected risks and adaptive capacity, to ascertain priorities and the
need for potential near-term actions and long-range preparedness. Core to forecasted changes and water
management adaptation is timing of response, authority for implementation, intergovernmental
coordination, and community empowerment.
As with all municipalities, if warranted the City could be invoked in the future to implement a mandated
response by State authority, which might alter their municipal water management and operations. Such actions would be expected to occur irrespective of pipeline replacement or provisions of their special use
permit with the Mt. Hood National Forest. As with current regulation, any planning or future actions that
would address or respond to climate change adaptation and the management of municipal water supplies
would be regulated by the State. The development of an Integrated Water Resources Strategy is already
well underway by the OWRD.

Dog River Pipeline Replacement | Environmental Assessment
232
As a requirement of State regulation, the City already has in place a Water Management Conservation Plan (CTD 2014). In it are measures for increasing water use efficiency, reducing waste, and response
strategies to shortages. The plan would be in effect with, or without a new pipeline.
No Action Alternative
As no vegetative manipulation would occur and pipeline construction would take place, the current
carbon sequestration rates locally would remain unchanged and no additional carbon would be released into the atmosphere. The No Action alternative would not result in carbon emissions from vehicles or
burning and would result in the retention of relatively slow growing trees. The mortality that results
would be retained on site (see Sections 3.1, Vegetation Resources and 3.6, Wildlife for more details).
Proposed Action Alternative
This project is not likely to have direct localized effects on climate. By its very nature, the discussion of a project’s effect on climate change is indirect and cumulative because the effects occur at a different time
and place, and because the scale of the discussion is global. Since it is not reasonable to measure a
project’s global impact, the discussion here focuses on key elements of forest management discussed in
the scientific literature.
For this proposal, the following actions have the potential to affect carbon emissions or sequestration:
• Fossil fuel would be used by equipment such as saws, tractors, skyline yarders and log trucks. It
would be possible for some of this equipment to use biofuels if available and priced competitively.
• Some of the slash and debris resulting from clearing adjacent to the construction corridor would be
burned on site or utilized locally for restoration projects. Slash and debris burning would release carbon into the atmosphere, while utilization of some of the debris would retain it for sequestration.
Cumulative Effects
The Proposed Action would result in some carbon emissions and some carbon sequestration. Effects of
pipeline construction would be localized and of short-duration. Its effect cumulatively would be
considered minute by comparison to regional scale carbon exchanges. See Section 3.1, Vegetation
Resources, for a discussion of forest health and resiliency.
3.12 Congressionally Designated Areas
Congressionally designated areas include Wilderness, Wild and Scenic Rivers, and Inventoried Roadless
Areas. None exist in the project area.
A portion of the East Fork of Hood River was added to the National Wild and Scenic Rivers System by
the Omnibus Public Land Management Act of 2009 (Public Law 111-11). This portion is west of the project area. The Outstandingly Remarkable Values (ORVs) for the East Fork Hood River Wild and
Scenic River segment include wildlife, recreation, and botany. As the ORVs exist outside any proposed
treatment areas there would be no adverse effect to the ORVs for which the river segment was added to
the National Wild and Scenic River System.
3.13 Environmental Justice and Civil Rights
On February 11, 1994, President Clinton issued the Executive Order on Federal Actions to Address
Environmental Justice in Minority Populations and Low-Income Populations (Executive Order 12898). This order directs agencies to identify and address disproportionately high and adverse human health or
environmental effects of projects on certain populations. In accordance with this order, the proposed

Dog River Pipeline Replacement | Environmental Assessment
233
activities have been reviewed to determine if they would result in disproportionately high and adverse
human and environmental effects on minorities and low-income populations.
The communities of Mt. Hood/Parkdale, Odell and Hood River are less than 20 miles of the planning
area. The communities of Dufur and The Dalles are less than 20 miles to the east / northeast of the
planning area. Other communities that may have an interest in the proposal would include Sandy,
Gresham and Portland to the West.
No disproportionate impacts to consumers, civil rights, minority groups, and women are expected from
this project. Commercial thinning work would be implemented by contracts with private businesses. Project contracting for the project’s activities would use approved management direction to protect the
rights of these private companies.
The Dog River Pipeline Replacement planning area is located on usual and accustomed land for the Confederated Tribes of Warm Springs (as is all of the Mt. Hood National Forest). The Treaty of 1855
granted the Confederated Tribes of the Warm Springs (CTWS) the right of “usual and accustomed”
gathering of traditional native plants and “special interest” use. According to the Ethnographic Study of
the Mt. Hood National Forest (French et al. 1995), no traditional use areas have been identified in this
planning area. No activities are proposed that would preclude any granted rights.
Because this project does not propose to increase, or reduce the amount or type of activities that occur on
the forest, the proposal to implement this project is not expected to have any negative effect on special
forest product gatherers.
3.14 Other Required Disclosures
3.14.1 Conflicts with Plans, Policies or Other Jurisdictions
This project would not conflict with any plans or policies of other jurisdictions. This project would not
conflict with any other policies, regulations, or laws, including the Clean Water Act (see Section 3.3),
Endangered Species Act (see Sections 3.4, 3.6, and 3.7), National Historic Preservation Act (see Section
3.13) and Clean Air Act (see Section 3.15). Other potential conflicts with plans, policies, or other
jurisdictions are discussed below.
3.14.2 Floodplains and Wetlands
There are no jurisdictional floodplains or wetlands within the project area as per Executive Order 11988. There would be very limited impacts to non-jurisdictional floodplains or wetlands from this project. Due
to the steepness of the topography, small stream size and confined nature of streams in this area,
floodplain width is fairly limited. More detailed information on wetlands and floodplains are discussed in
Section 3.3 (Hydrology), and 3.4 (Fisheries). Due to the PDCs and BMPs which are aimed at minimizing the impacts to wetlands and floodplains, there would be minimal direct and indirect effects. The proposed
Action would be consistent with Section 404 of the Clean Water Act (CWA).
3.14.3 Air Quality
The proposed action associated with the Dog River Pipeline replacement has the potential to affect air
quality: burning slash, exhaust generated by vehicles, equipment, chainsaws and helicopters and dust
created by vehicles that drive on aggregate surface and native surface roads.
Summary - The following sections show that the proposed action complies with direction in the Forest Plan (as amended) and that activity fuels would be managed appropriately to minimize fire hazard while

Dog River Pipeline Replacement | Environmental Assessment
234
also minimizing effects to resources. The timing and quantity of smoke created by pile burning and
broadcast burning would be managed to minimize air quality impacts.
3.14.3.1 Existing Conditions
Fine particulates less than PM2.5 (2.5 micrometers in diameter) cause reductions in visibility due to
absorption and scattering of light by suspended particles. Almost all smoke particles from wildfire and
prescribed fire, residential wood stoves and fireplaces, industrial boilers, field burning, diesel combustion, and other combustion processes can be characterized as fine particulates, primarily PM2.5 (ODEQ 2014).
These small particulates can be inhaled and cause respiratory problems, especially in smoke sensitive
portions of the population, such as the young, elderly, or those predisposed to respiratory ailments.
Particles can accumulate in the respiratory system and aggravate health problem such as asthma.
Oregon Department of Environmental Quality classifies Class I Areas as “certain wilderness areas
designated by Congress as federal Class I Areas that are subject to visibility protection under the
Environmental Protection Agency’s Regional Haze Rule and the federal Clean Air Act”(ODEQ 2014).
The closest communities to the project area are the City of The Dalles, Parkdale, Odell, and the City of
Dufur. Winds in this area can blow in different directions potentially affecting these communities.
3.14.3.2 Direct, Indirect and Cumulative Effects
The burning of slash piles would typically be implemented during fall when favorable smoke dispersal
conditions are expected. Pile burning prescribed fires are primarily conducted when the ground is frozen
or saturated, reducing the potential of smoldering and creeping into adjacent fuels. Prescribed burning
would occur when the weather conditions would minimize visibility effects to Class I airsheds.
Cumulatively, this project uses similar techniques and timing as other projects in the Mt. Hood National
Forest. While it is not known what year treatments would occur in or when piles would be available for burning, prescribed burning of various projects would occur spread over several years and at appropriate
times of the year which would result in less air quality impact compared to wildfire. Air quality
throughout Oregon can be affected by wildfire. Projects that reduce the likely size or intensity of wildfire
have the effect of reducing overall air quality impact.
Cumulative effects of the proposed action when added to other fuel reduction projects and the impacts of
wildfire and of fire suppression tactics would not be substantial.
3.14.3.3 Forest Plan Standards and Guidelines
The project is consistent with FW-039 to 053 because smoke would be minimized.
The Oregon Smoke Management Plan, which is administered by the Oregon State Forester, regulates the
amount of forestry related burning that can be done at any one time. The amount of burning that can occur on any one day depends upon the specific type of burning, the tons of fuel loading to be ignited, and the
atmospheric conditions available to promote particulate matter mixing and transportation of smoke away
from sensitive areas. Through compliance and cooperation in the implementation of the Oregon Smoke
Management Plan, the Proposed Action would comply with the following laws and regulations.
• The Federal Clean Air Act (CAA) is the primary legal basis for air quality regulations across the
country.
• Oregon Smoke Management Plan, OS477.013, as administered by Oregon Department of Forestry
• Oregon State Implementation Plan (The Federal Clean Air Act Implementation Plan)

Dog River Pipeline Replacement | Environmental Assessment
235
• Oregon Administrative Rules OAR 629-0048-0001: Smoke Management Rules
• Oregon Visibility Protection Plan for Class I Areas, OAR 340-200-0040, section 5.2
• Forest Service Best Smoke Management Practices 2012
• Forest Service Manual 2500-Watershed and Air Management, Chapter 2580-Air Resource
Management - The project would minimize the impacts on air quality through compliance and cooperation with Federal, state and local air regulations to prevent significant adverse effects of air
pollutants, mitigation of adverse impacts form prescribed fire on air resources though the application
of Best Smoke Management Practices, and protection of air quality related values within Class I areas.
3.14.4 Treaty Resources and Reserved Indian Rights
No impacts on American Indian social, economic, or subsistence rights are anticipated. No impacts are
anticipated related to the American Indian Religious Freedom Act. The Confederated Tribes of Warm
Springs was contacted in reference to this Proposed Action.
3.14.5 Prime Farmlands, Rangelands, and Forestlands
None of the alternatives would have an adverse impact to the productivity of farmland, rangeland, or
forestland because none were identified in the project area.
3.14.6 Potential or Unusual Expenditures of Energy
The No Action alternative would not require any expenditure of fuel or energy. The Proposed Action
would require expenditures of fuel for workers to access the planning area, use power equipment, and to utilize the logging systems, and installation of the pipeline. Overall, the Proposed Action would not result
in any unusual expenditure of fuel.
3.14.7 Irreversible and Irretrievable Commitments of Resources
Irreversible commitments of resources are those that are forever lost and cannot be reversed. Irretrievable commitments of resources are considered to be those that are lost for a period of time and, in time, can be
replaced. The use of rock for road surfacing and pipeline placement is an irreversible resource
commitment.
3.14.8 Conflicts with Plans, Policies, or Other Jurisdictions
NEPA at 40 CRF 1502.25(a) directs “to the fullest extent possible, agencies shall prepare draft
environmental impact statements concurrently with and integrated with . . . other environmental review
lands and executive orders.”
Based on information received during scoping, informal consultation meetings, and analysis in the EA,
none of the alternative under consideration would conflict with the plans or policies of other jurisdictions,
including the Confederated Tribes of Warm Springs. This project would not conflict with any other policies and regulations or laws, including the Clean Water Act, Endangered Species Act, Magnuson-
Stevens Fishery Conservation and Management Act, National Historic Preservation Act, and Clean Air
Act.

Dog River Pipeline Replacement | Environmental Assessment
236
Chapter 4 – Consultation and Coordination The Forest Service consulted with federal, state, and local agencies and Tribes during the development of
this assessment.
4.1 Federal, State and Local Agencies
• U.S. Fish and Wildlife Service
• NOAA National Marine Fisheries Service
• Oregon Historic Preservation Office
• Oregon Department of Fish and Wildlife
• Oregon Water Resources Department
• The City of the Dalles
4.2 Tribes
• Confederated Tribes of Warm Springs

Dog River Pipeline Replacement | Environmental Assessment
237
References
Vegetation Resources
USDA Forest Service, 1982. Plant Associations and Management Guide for the Pacific Silver Fir Zone. Hemstrom, Miles A., et al. Gen. Technical Paper R6-ECOL-100-1982a. Portland, OR Pacific Northwest
Region
USDA Forest Service, 1997. Plant Associations and Management Guide for the Mountain Hemlock Zone. McCain, Cindy et al. Gen. Technical Paper R6-MTH-GP-TP-08-95. Portland, OR Pacific
Northwest Region
USDA Forest Service, 2001. Record of Decision and Standards and Guidelines for the Amendments to
the Survey and Manage, Protection Buffer, and other Mitigation Measures Standards and Guidelines.
USDA Forest Service, 2002. Field Guide to the Forested Plant Associations of the Westside Central
Cascades of Northwest Oregon. McCain, Cindy and N. Diaz. Gen. Technical Paper R6-NR-ECOL-TP-
02-02. Portland, OR Pacific Northwest Region
Wargo, Philip M. and T.C. Harrington. 1991. Chapter 7 Host Stress and Susceptibility in Armillaria Root
Disease. USDA Forest Service, Agriculture Handbook No. 691. Washington, DC.
Soil Productivity
Howes, Steve. 1979. Soil Resource Inventory, Mt. Hood National Forest. Mt. Hood National Forest.
Sandy, OR.
Rashin, E. B.,C. J. Clishe, A. T. Loch, J. MBell.2006. Effectiveness of Timber Harvest Practices for
Controlling Sediment Related Water Quality Impacts. Journal-American Water Resources Association,
Vol. 42 (5): 1307-1328
Hydrology
BOR 2015. Hood River Basin Study. Bureau of Reclamation, Pacific Northwest Region, U.S. Department
of Interior. Boise, ID. 2015.
CTD 2006. Water Master Plan. Public Works Department, City of The Dalles, OR 2006.
CTD 2014. Water Management and Conservation Plan. Prepared for City of The Dalles, Oregon. GSI
Water Solutions, Inc. Corvallis, OR. November, 2014.
CTD 2017. High Prairie snow course records for water years 1983 to 2016. Public Works Department,
City of the Dalles, OR. 2017.
CTD 2017b. Stream flow records from the Dog River municipal gage for water year 2000. Public Works
Department, City of The Dalles, OR. 2017.
CTD 2017c. Reservoir fill and drawdown records, and reservoir spill and release records for Crow Creek
Dam for water years 2005 to 2015. Public Works Department, City of the Dalles, OR 2017.
CTD 2018. Stream flow records from the Dog River municipal gage for water years 2012 to 2018. Public
Works Department, City of The Dalles. 2017.

Dog River Pipeline Replacement | Environmental Assessment
238
CTD 2019. Stream flow records from the South Fork of Mill Creek municipal water gage above the Wicks Water Treatment Plant intake for the period September 2011 to May 2019. Public Works
Department, City of The Dalles. 2019.
CTD 2019a. Surface Water Sources Used to Meet Non-ASR Demand and Water Available for ASR
Recharge, Present Day Conditions (Based on Year 2013). A graph from proprietary water availability
studies commissioned by the City of the Dalles. Public Works Department, City of The Dalles. 2019.
CTWS 2017. Technical memorandum from Chris Brun to MHNF. Fisheries Branch, Natural Resources
Department, Confederated Tribes of Warm Springs. 2017.
DOJ 2019. U.S. Department of Justice, Environment and Natural Resources Division webpage, Federal
Reserved Water Rights and State Law Claims website: https://www.justice.gov/enrd/federal-reserved-
water-rights-and-state-law-claims
FSM 2007. Forest Service Manual (FSM). FSM 2500 – Watershed and Air Management. Chapter 2540 –
Water Uses and Development. Section 2542 – Municipal Watersheds. National Headquarters.
Washington, D.C. September 4th, 2007.
HRWG 1999. Hood River Watershed Assessment. Hood River Watershed Group. Hood River Soil and
Water Conservation District. 1999.
MHNF 1990. Land and Resource Management Plan. Mount Hood National Forest. Pacific Northwest
Region, Forest Service, U.S. Department of Agriculture. 1990.
MHNF 1996. East Fork Hood River and Middle Fork Hood River Watershed Analysis. Mount Hood
National Forest. Pacific Northwest Region, Forest Service, U.S. Department of Agriculture. 1996.
MHNF 1999. South Fork Mill Creek Stream Survey Report. Barlow Ranger District, Mount Hood
National Forest, Forest Service. 2009.
MHNF 2000a. Dog River Stream Survey Report. Hood River Ranger District, Mount Hood National
Forest, Forest Service. 2000.
MHNF 2000b. Mill Creek Watershed Analysis. Mount Hood National Forest, Pacific Northwest Region,
Forest Service, United States Department of Agriculture. 2000.
MHNF 2001. Puppy Creek Stream Survey Report. Hood River Ranger District, Mount Hood National
Forest. Forest Service. 2001.
MHNF 2011. South Fork Mill Creek Stream Survey Report. Barlow Ranger District, Mount Hood
National Forest, Forest Service. 2011
MHNF 2012. The Dalles Watershed Phase II Environmental Assessment. Barlow Ranger District, Mount
Hood National Forest, Forest Service. 2012.
MHNF 2015. Polallie-Cooper Hazardous Fuels Reduction Environmental Assessment. Hood River
Ranger District, Mount Hood National Forest, Forest Service. 2015
MHNF 2017. Stream temperature records for Dog River and the South Fork of Mill Creek, AqS data base, Aquatic and Riparian Effectiveness Monitoring Program. Barlow and Hood River Ranger Districts,
Mount Hood National Forest, Forest Service. 2017.
MFNF 2019. Mt. Hood National Forest Learning Center webpage, History and Culture website:
https://www.fs.usda.gov/main/mthood/learning/history-culture
OAR 2019. Oregon Administrative Rules. Water Resources Department. Chapter 690. Division 504.
Hood Basin Program. Oregon Secretary of State website:
https://secure.sos.state.or.us/oard/displayChapterRules.action?selectedChapter=183

Dog River Pipeline Replacement | Environmental Assessment
239
ODEQ 2017a. Figure 160B: Salmon and steelhead spawning use designations, Hood Basin, Oregon. Oregon Department of Environmental Quality website:
https://services.oregon.gov/deq/Rulemaking%20Docs/figure160b.pdf. August 23, 2017.
ODEQ 2017b. Table 160A: Designated beneficial uses, Hood Basin (340-41-0160), Oregon. Available at:
https://services.oregon.gov/deq/Rulemaking%20Docs/table160a.pdf. Accessed on August 23, 2017.
ODEQ 2017c. Oregon’s 2012 Integrated Report. Water Bodies on the 2012 303(d) list, category 5 streams
needing a TMDL. Oregon Department of Environmental Quality website:
https://www.deq.state.or.us/wq/assessment/rpt2012/results303d12.asp
OWRD 2002. Water Rights in Oregon. An Introduction to Oregon’s Water Laws and Water Rights
System. Oregon Water Resources Department. Salem, Oregon November 2002.
OWRD 2018. Dog River Water Availability 50% Exceedance Level. Water Availability Reporting System. Oregon Water Resources Department website:
https://apps.wrd.state.or.us/apps/wars/wars_display_wa_tables/search_for_WAB.aspx
OWRD 2018. Limited License Application #025. Final Order Approving Aquifer Storage and Recovery
testing. Groundwater section, Water Rights Services Division, Oregon Water Resources Department.
Salem, OR. October 15th, 2018.
OWRD 2019. Streamflow readings from near the mouth of Dog River in water year 2019. District 3
watermaster, North-Central Region, Oregon Water Resources Department. The Dalles, OR. July 2019.
OWRD 2019a. Water availability reporting system, Hood River Basin. Oregon Water Resources
Department website:
https://apps.wrd.state.or.us/apps/wars/wars_display_wa_tables/search_for_WAB.aspx
OWRD 2019b. Water Rights Information System, Oregon Water Resources Department website:
https://apps.wrd.state.or.us/apps/wr/wrinfo/
pers. comm. Dave Anderson 2014. Effects of 2013 Government Flats wildfire on the Wicks water
treatment plant. Personal conversation on post-fire monitoring trip. June 2014.
pers. comm. Dave Anderson 2016. Records of full-pipe conditions. Email communication to Todd
Reinwald. April, 4th, 2016.
pers. comm. Dave Anderson 2016a. Results of dye test in Dog River pipeline. Email communication to
Kameron Sam. October 11th, 2016.
pers. comm. Dave Anderson 2019. Possible abandonment of plans to enlarge Crow Creek reservoir
contingent on ASR feasibility. Personal conversation during installation of stage gage and cross section.
May 20th, 2019.
SWCD 2003. The Dalles Watershed Assessment. Wasco County Soil and Water Conservation District.
USDA Service Center. The Dalles, OR. 2003.
USFS 1967. Special Use Permit: Reservoir (49). City of The Dalles, OR. Mount Hood National Forest
Pacific Northwest Region. U.S. Forest Service.
USGS 2016. Streamflow data for Dog River gage 1961 to 1967. National Water Information System Web
Interface site: https://nwis.waterdata.usgs.gov/nwis/inventory/?site_no=14113400
USGS 2017. U.S. Geological Survey. 2017. The StreamStats Program. U.S. Department of the Interior.
Available at: http:streamstats.usgs.gov/. Accessed on August 15, 2017.
USGS 2019. Streamflow data for South Fork Mill Creek gage above Wicks water treatment plant intake
1960 to 1967. Scanned unpublished data. Portland Form #6, Revised 6-24-60. Sta. No. 14-1058.50. U.S.
Geological Survey. Portland, OR. 2017.

Dog River Pipeline Replacement | Environmental Assessment
240
Fisheries and Aquatic Fauna
Anderson, Dave. 2016. Personal communication. Records of full-pipe conditions. Email communication
from Dave Anderson (City of the Dalles public works director) to Todd Reinwald (Mt. Hood National
Forest watershed program manager). April 4, 2016.
Anderson, Dave. 2016a. Personal communication. Results of dye test in Dog River pipeline. Email
communication from Dave Anderson (City of The Dalles public works director) to Kameron Sam (Mt.
Hood National Forest, Barlow District Ranger). October 11, 2016.
Buffington, J. M., Lisle, T. E., Woodsmith, R. D., and S. Hilton. 2002. Controls on the size and
occurrence of pools in coarse-grained forest rivers. River Research and Applications. 18: 507-531.
City of the Dalles (CTD). 2017. High Prairie snow course records for water years 1983 to 2016. Public
Works Department, City of the Dalles, OR. 2017.
CTD 2018. Stream flow records from the Dog River municipal gage for water years 2012 to 2018. Public
Works Department, City of The Dalles. 2017.
Coccoli, H. 2004. Hood River subbasin plan for fish and wildlife: including the lower Oregon Columbia
Gorge tributaries. Report submitted to the Northwest Power and Conservation Council. 225 pp.
Confederated Tribes of Warm Springs (CTWS) and Oregon Department of Fish and Wildlife. 2001,
updated 2017. Hatchery and Genetic Management Plan, Hood River Production Plan – Spring Chinook
Salmon stock 50. https://www.dfw.state.or.us/fish/HGMP/docs/2017/Hood%20River%20Spring%20Chinook%20HGMP%
204-3-17%20to%20NMFS.pdf
CTWS 2016. Email from CTWS Fisheries Branch staff to Chris Rossel (USFS Barlow District fish
biologist) with an attachment describing “Dog River Fish Community”, dated April 26, 2016.
CTWS 2017. Technical memorandum from Chris Brun to MHNF. Fisheries Branch, Natural Resources
Department, Confederated Tribes of Warm Springs. 2017.
Foltz, R.B., K.A Yanosek, and T.M. Brown. 2008. Sediment concentration and turbidity changes during
culvert removals. Journal of Environmental Management 87:329-340.
French, Rod French. 2016. Personal communication. Upper anadromous fish distribution in Dog River.
Email communication between Rod French (ODFW District fish biologist) and Chris Rossel (USFS
Barlow District fish biologist). March 30, 2016.
Montgomery, D. R., B. D. Collins, J. M. Buffington, and T. B. Abbe. 2003. Geomorphic effects of wood
in rivers. American Fisheries Society Symposium 37: 21-47.
Montgomery, D. R., J. M. Buffington, R. D. Smith, K. M. Schmidt, and G. Pess. 1995. Pool spacing in
forest channels. Water Resources Research. 31: 1097-1105.
Oregon Department of Environmental Quality (ODEQ). 2017a. Figure 160B: Salmon and steelhead
spawning use designations, Hood Basin, Oregon. Available at:
https://services.oregon.gov/deq/Rulemaking%20Docs/figure160b.pdf. Accessed on August 23, 2017.
ODEQ. 2017b. Table 160A: Designated beneficial uses, Hood Basin (340-41-0160), Oregon. Available
at: https://services.oregon.gov/deq/Rulemaking%20Docs/table160a.pdf. Accessed on August 23, 2017.
Oregon Department of Fish and Wildlife (ODFW). 2008. Oregon guidelines for timing of in-water work
to protect fish and wildlife resources. June 2008.
https://www.dfw.state.or.us/lands/inwater/Oregon_Guidelines_for_Timing_of_%20InWater_Work2008.p
df

Dog River Pipeline Replacement | Environmental Assessment
241
Olsen, E.A., R.A. French, and A.D. Ritchey. 1995. Hood River and Pelton Ladder Evaluation Studies. Annual Progress Report 1994 of Confederated Tribes of the Warm Springs Reservation and Oregon
Department of Fish and Wildlife to Bonneville Power Administration, Portland, Oregon.
Oregon Water Resources Department (OWRD). 1999. State of Oregon Certificate of Water Right issued
to Oregon Water Resources Department. Water right to be maintained in Dog River from river mile 5.9 to
the mouth at river mile 0.0.Salem, Oregon.
O'Toole, Patty, Jim Newton, Rich Carmichael, Steven Cramer, and Kathryn Kostow. 1991. Hood River
Production Master Plan Project No. 1988-05300, 102 electronic pages, (BPA Report DOE/BP-00631-1 by
CTWS and ODFW).
OWRD 2019. Streamflow readings from near the mouth of Dog River in water year 2019. District 3
watermaster, North-Central Region, Oregon Water Resources Department. The Dalles, OR. July 2019.
Poff, N.L., D. Allan, M.B. Bain, J.R. Karr, K.L. Prestegaard, B.D. Richter, R.E. Sparks, and J.C.
Stromberg. 1997. The Natural Flow Regime. BioScience 47(11):769–784.
Reagan, R.E. 2011. Hood River and Pelton ladder evaluation studies, Annual Report 2010. Prepared for
United States Department of Energy, Bonneville Power Administration, Project Number 1988-053-04.
327 pp.
Reeves, G.H., K.M. Burnett, and E.V. McGarry. 2003. Sources of large wood in the main stem of a
fourth-order watershed in coastal Oregon. Canadian Journal of Forestry 33:1363– 1370.
Rosgen, D.L. 1994. A classification of natural rivers. Catena 22:169-199.
Rosgen, D.L. 1996. Applied River Morphology. Wildland Hydrology, Inc. Pagosa Springs, Colorado.
Swanston, D.N. 1991. Natural processes. American Fisheries Society Special Publication 19:139-179.
US Department of Agriculture (USDA)-Forest Service (FS), US Department of Commerce-National
Marine Fisheries Service (NMFS), US Department of Interior (USDI)–Bureau of Land Management
(BLM), and USDI–Fish and Wildlife Service (USFWS). 1999 as amended.
Streamlined Consultation Procedures for Section 7 of the Endangered Species Act (ESA) July, 1999.
https://www.fs.fed.us/r6/icbemp/esa/procedure.htm
US Department of Agriculture (USDA)-Forest Service (FS), US Department of Commerce-National
Marine Fisheries Service (NMFS), US Department of Interior (USDI)–Bureau of Land Management (BLM), and USDI–Fish and Wildlife Service (USFWS). 2004. Analytic Process for Developing
Biological Assessments for Federal Actions Affecting Fish within the Northwest Forest Plan Area. BLM
Instruction Memorandum No. OR-2005-012. Portland, Or. 17 pp.
USDA-Mount Hood National Forest (MHNF). 1990. Land and Resource Management Plan. Pacific
Northwest Region, Forest Service, U.S. Department of Agriculture. Oregon.
USDA-MHNF. 1996. East Fork Hood River and Middle Fork Hood River Watershed Analysis. Pacific
Northwest Region, Forest Service, U.S. Department of Agriculture. Oregon.
USDA-MHNF. 1999. The 1999 South Fork Mill Creek Stream Survey Report. Barlow Ranger District,
Forest Service. Oregon.
USDA-MHNF. 2000a. 2000 Dog River Stream Survey Report. Barlow Ranger District, Forest Service,
United States Department of Agriculture. Oregon.
USDA-MHNF. 2000b. Mill Creek Watershed Analysis. Pacific Northwest Region, Forest Service, United
States Department of Agriculture. Oregon.

Dog River Pipeline Replacement | Environmental Assessment
242
USDA-MHNF. 2001. Puppy Creek, 2001 Stream Survey Report. Hood River Ranger District, Mount
Hood National Forest Service, United States Department of Agriculture. Oregon.
USDA-USFS and USDI Bureau of Land Management. 2001. Decision Record for Amendments to Survey
and Manage, Protection Buffer, and other Mitigation Measures Standards and Guidelines.
USDA-MHNF. 2011. The 2001 South Fork Mill Creek Stream Survey Report. Barlow Ranger District,
Forest Service. Oregon.
USDA-USFS. 2012. National best management practices for water quality management on national forest
system lands. Volume 1: national core BMP technical guide. FS-990a. 165 pp.
USDA-MHNF, 2013. Unpublished data as reported annually to NMFS and USFWS. Aquatic Restoration
Regulatory Reporting System (ARRRS) database. https://apps.fs.usda.gov/gtac-
tools/ARRRS/projectsIndex.php
USDA-MHNF 2015. Polallie-Cooper Hazardous Fuels Reduction Environmental Assessment. Hood
River Ranger District, Mount Hood National Forest, Forest Service. 2015. Oregon.
USDC-NMFS. 2000. Guidelines for electrofishing waters containing salmonids listed under the
Endangered Species Act. National Marine Fisheries Service. Portland, Oregon and Santa Rosa,
California. http://swr.nmfs.noaa.gov/sr/Electrofishing_Guidelines.pdf.
USDC- National Marine Fisheries Service (NMFS). 2005. Final Assessment of NOAA Fisheries’ Critical
Habitat Analytical Review Teams For 12 Evolutionarily Significant Units of West Coast Salmon and
Steelhead. GIS data available from: http://www.nwr.noaa.gov/1salmon/salmesa/crithab/CHsite.htm.
USDC-NMFS. 2011. Anadromous salmonid passage facility design. NMFS, Northwest Region, Portland,
Oregon. http://www.habitat.noaa.gov/pdf/salmon_passage_facility_design.pdf.
USDC-NMFS. 2012. Proposed ESA recovery plan: Lower Columbia River salmon and steelhead.
National Oceanic and Atmospheric Administration, Seattle, WA.
USDC-NMFS. 2014. Endangered and Threatened Wildlife; Final Rule To Revise the Code of Federal
Regulations for Species Under the Jurisdiction of the National Marine Fisheries Service. Federal Register Vol 79: 20802-20817; April 14, 2014. https://www.federalregister.gov/documents/2014/04/14/2014-
08347/endangered-and-threatened-wildlife-final-rule-to-revise-the-code-of-federal-regulations-for-species
USDC-NMFS. 2016. 2016 5-year review: Summary and evaluation of Lower Columbia River (LCR) Chinook salmon, Columbia River chum salmon, LCR Coho salmon, LCR steelhead. NMFS West Coast
Region, Portland, Oregon. 87 pp. https://repository.library.noaa.gov/view/noaa/17021
USDI-U.S. Fish and Wildlife Service and USDC-National Marine Fisheries Service. 1998. Endangered
species consultation handbook. Procedures for conducting consultation and conference activities under
Section 7 of the Endangered Species Act.
USDI USFWS. 2017. Biological Opinion on the effects of projects with potential to modify the habitat
and/or disrupt Northern spotted owls within the Polallie Cooper Hazardous Fuels Reduction project proposed by the Mt. Hood National Forest; on the Norther spotted owl and its’ Designated Critical
Habitat. FWS Reference Number 01EOFW00-2017-F-0212.
USDI-U.S Geological Survey (USGS). 2017. The StreamStats Program. U.S. Geological Survey, U.S.
Department of the Interior. Available at: http:streamstats.usgs.gov/. Accessed August 15, 2017.
USDI-USGS. 2016. USGS stream gage site 14113400 data at Dog River near Parkdale, Oregon. All
available years (1960-1971). Online data downloaded in 2016 from USGS National Water Information
System: Web Interface; USGS surface-water historical instantaneous data for Oregon.
http://waterdata.usgs.gov/or/nwis

Dog River Pipeline Replacement | Environmental Assessment
243
Visual Qualities
USDA Forest Service, 1974. National Forest Landscape Management Volume 2.
USDA Forest Service. 1990. Land and Resource Management Plan. Mount Hood National Forest.
USDA Forest Service 1995. Landscape Aesthetics, AHandbook for Scenery Management, Agriculture
Handbook 701.
Wildlife
Allen, T.J., J.P. Brock and J. Glassberg. 2005. Caterpillars in the Field and Garden, a Field Guide to the
Butterfly Catterpillars of North America. Oxford University Press, Oxford, England. 232 pp.
Anthony, R.G., M.A. O’Connell, M.M. Pollock and J.G. Hallett. 2003. Associations of mammals with
riparian ecosystems in Pacific Northwest forests. Pp. 510–563 in C.J. Zabel and R.G. Anthony (editors), Mammal Community Dynamics: Management and Conservation in the Coniferous Forests of Western
North America. Cambridge University Press, Cambridge, England.
Arizona Game and Fish Department. 1997. Animal Abstracts: Bats of Arizona. Arizona Game and Fish
Department, Heritage Data Management System, Phoenix, AZ.
Banfield, A.W.F. 1975. Mammals of Canada. University of Toronto Press, Toronto, Ontario, Canada.
Black, H.L. 1974. A north temperate bat community: structure and prey populations. Journal of
Mammalogy 55:138-157.
Bresson, B. 2016. Incorporating Migratory & Resident Bird Concerns into the National Environmental
Policy Act Process Region Six Forest Service & OR/WA Bureau of Land Management.
Brown, P.E. and R.D. Berry. 1998. Twenty Years of Bat Radio-Telemetry: Progress and Pitfalls. Bat
Research News 39:118.
Buskirk, S.W. and L.F. Ruggiero. 1994. Marten. Pages 7-37 in L.F. Ruggiero, K.B. Aubry, S.W.
Buskirk, L. Jack Lyon, and W.J. Zielinski, eds. The scientific basis for conserving forest carnivores. Gen.
Tech. Rep. RM-254. Ft. Collins, CO: USDA, Forest Service, Rocky Mountain Forest and Range
Experiment Station. 184 p.
Christy, R.E. and S.D. West. 1993. Biology of Bats in Douglas-Fir Forests. USDA Forest Service, Pacific
Northwest Research Station, Portland, OR.
Cockrum, E.L., B. Musgrove, and Y. Petryszyn. 1996. Bats of Mohave County, Arizona: Populations and
Movements. Occasional Papers, The Museum, Texas Tech University 157:1-72.
Courtney, S.P., J.A. Blakesley, R.E. Bigley, M.L. Cody, J.P. Dumbacher, R.C. Fleischer, A.B. Franklin, J.K. Franklin, R.J. Gutierrez, J.M. Marzluff, L. Sztukowski. 2004. Scientific evaluation of the status of
the Northern Spotted Owl. Sustainable Ecosystems Institute. Portland, Oregon.
Cryan, P.M. 1997. Distribution and Roosting Habits of Bats in the Southern Black Hills, South Dakota.
Master’s Thesis submitted to the University of New Mexico, Albuquerque, NM.
Dugger, K.M., R.G. Anthony and L.S. Andrews. 2011. Transient dynamics of invasive competition:
barred owls, spotted owls, habitat composition and the demons of competition present.

Dog River Pipeline Replacement | Environmental Assessment
244
Ellison, L.E., M.B. Wunder, C.A. Jones, C. Mosch, K.W. Navo, K. Peckham, J.E. Burghardt, J. Annear, R. West, J. Siemers, R.A. Adams, and E. Brekke. 2004. Colorado bat conservation plan. Colorado
Committee of the Western Bat Working Group.
Forsman, E.D., E.C. Meslow and H.M. Wight. 1984. Distribution and biology of the spotted owl in
Oregon. Wildlife Monographs 87:1–64.
Forsman, E.D., I.A. Otto, S.G. Sovern, M. Taylor, D.W. Hays, H. Allen, S.L. Roberts and D.E. Seaman.
2001. Spatial and temporal variation in diets of spotted owls in Washington. Journal of Raptor Research
35:141–150.
Forsman, E.D., R.G. Anthony, K.M. Dugger, E.M. Glenn, A.B. Franklin, G.C. White, C.J.Schwarz, K.P.
Burnham, D.R. Anderson, J.D. Nichols, J.E. Hines, J.B. Lint, R.J. Davis, S.H. Ackers, L.S. Andrews,
B.L. Biswell, P.C. Carlson, L.V. Diller, S.A. Gremel, D.R. Herter, J.M. Higley, R.B. Horn, J.A. Reid, J. Rockweit, J. Schaberl, T.J. Snetsinger and S.G. Sovern. 2011. Population demography of northern spotted
owls: 1985–2008. Studies in Avian Biology. Cooper Ornithological Society.
Goulsen, D. 2003a. Bumblebees: their behaviour and ecology. Oxford University Press, Oxford, England.
Goulsen, D. 2003b. Conserving wild bees for crop pollination. Food, Agriculture & Environment 1(1):
142-144.
Gregory, S., 2005. Seasonal movements and nest site selection of the western gray squirrel (Sciurus
griseus) in the Methow River watershed. M.S. Thesis, University of Washington, Seattle.
Hagar, J., Friesen, C., 2009. Young Stand Thinning and Diversity Study: Response of Songbird
Community One Decade Post-Treatment. U.S. Geological Survey Open-File, Report 2009-1253.
Hall, E.R. 1981. The Mammals of North America. Vol. 2. John Wiley and Sons, Inc., New York, NY.
600 pp.
Hamer, T.E., S.G. Seim, and K.R. Dixon. 1989. Northern spotted owl and northern barred owl habitat use
and home range size in Washington: preliminary report. Washington Department of Wildlife, Olympia,
Washington. 7 pp.
Hartwig, C.L., D.S. Eastman, and A.S. Harestad. 2004. Characteristics of foraging sites and the use of
structural elements by the pileated woodpecker (Dryocopus pileatus) on southeastern Vancouver Island,
British Columbia, Canada.
Herder, M. 1998. Northern Arizona bat roost inventory. Arizona Game and Fish Department, Phoenix,
AZ.
Humphrey, S.R. 1975. Nursery roosts and community diversity of nearctic bats. Journal of Mammalogy
56:321-346.
Iverson, W.F. 1993. Is the barred owl displacing the spotted owl in western Washington? Thesis, Western
Washington University, Bellingham, Washington.
Kunz, T.H. 1982. Roosting ecology of bats. Pages 1-55 in T.H. Kunz, editor. Ecology of bats. Plenum
Press, New York, NY.
Larsen, E.M., E. Rodrick and R. Milner. 1995. Management Recommendations for Washington's Priority
Species, Volume I. 42-46 pp.
Lewis, S.E. 1995. Roost fidelity of bats: A review. Journal of Mammalogy 76:481-496.
Linders, M. J. 2000. Spatial ecology of the western gray squirrel, (Sciurus griseus) in Washington: The
interaction of season, habitat and home range. M.S. Thesis. University of Washington, Seattle, WA. 99
pp.

Dog River Pipeline Replacement | Environmental Assessment
245
Marshal, D. B., M. G. Hunter, A. L.Contreras, Eds. 2003. Brids of Oregon: A General Reverence.
Oregon State University Press, Corvallis, OR. 768Pp.
Martin, S.K. 1994. Feeding ecology of American martens and fishers. In: Buskirk, S.W.; Harestat, A.S.;
Raphael, M.B., comps. eds. Martens, sables, and fishers: biology and conservation. Ithaca, NY: Cornell
University Press: 297-315.
McComb, B., Kellogg, L., and Tappeiner, J. 2013. Young Stand Thinning and Diversity Study.
Establishment Report, Study Plan, and Key Findings. 70pp.
Mellen, T. Kim, E. Charles Meslow, R. William Mannan Source Summertime Home Range and Habitat Use of Pileated Woodpeckers in Western: The Journal of Wildlife Management, Vol. 56, No. 1 (Jan.,
1992), pp. 96-103.
Mellen, Kim, Bruce G. Marcot, Janet L. Ohmann, Karen Waddell, Susan A. Livingston, Elizabeth A. Willhite, Bruce B. Hostetler, Catherine Ogden, and Tina Dreisbach. 2003. DecAID, the decayed wood
advisor for managing snags, patially dead trees, and down wood for biodiversity in forests of Washington
and Oregon. Version 1.10. USDA Forest Service, Pacific Northwest Research Station; USDI Fish and
Wildlife Service, Oregon State Office; Portland, Oregon.
O’Farrell, M.J. and E.H. Studier. 1980. Myotis thysanodes. Mammalian Species 137:1-5.
Opler, P. and A.B. Wright. 1999. A Field Guide to Western Butterflies. Houghton Mifflin Company,
Boston, Massachusetts. 540 pp.
Patton, D.R. 1984. A model to evaluate Aber squirrel habitat in uneven ponderosa pine. Wildlife Society
Bulletin 123:408-414.
Pearson, R.R., and K.B. Livezey. 2003. Distribution, numbers, and site characteristics of spotted owls and barred owls in the Cascade Mountains of Washington. Journal of Raptor Research 37(4):265-276.
Perkins, J.M., J.M. Barss, and J. Peterson. 1990. Winter records of bats in Oregon and Washington.
Northwestern Naturalist 71:59-62.
Perkins, J.M., J.M. Barss, and J. Peterson. 1990. Winter records of bats in Oregon and Washington.
Northwestern Naturalist 71:59-62.
Pyle, R.M. 2002. The Butterflies of Cascadia, A Field Guide to All the Species of Washington, Oregon,
and Surrounding Terrietories. Seattle Audobon Society, Seattle, Washington. 420 pp.
Rainey, W.E. and E.D. Pierson. 1996. Cantara spill effects on bat populations of the Upper Sacramento
River, 1991-1995. Report to California Department of Fish and Game, Contract # FG2099R1. Redding,
CA.
Rasheed, S.A., P.F.J. Garcia, and S.L. Holroyd. 1995. Status of the fringed myotis in British Columbia.
Wildlife Working Report, WR-73:1-17.
Rodrick, E.A. 1986. Survey of historic habitats of the western gray squirrel (Sciurus griseus) in the
southern Puget Trought and Klickitat County, Washington. M.S. Thesis. University of Washington,
Seattle, WA. 41 pp.
Schmitt, C.L. and L.H. Spiegel 2008. Johnson's Hairstreak butterfly and dwarf mistletoe backgrounder.
USDA Forest Service Blue Mountains Pest Management Service Center, La Grande, OR, unpublished
memo to Forest Supervisors, 8p.
Scott, J. 1986. The Butterflies of North America, A Natural History and Field Guide. Stanford University
Press, Stanford, California. 584 pp.
Simon, T.L. 1980. An ecological study of the pine marten in the Tahoe National Forest. Sacramento,
CA: California State University. M.S. thesis 143pp.

Dog River Pipeline Replacement | Environmental Assessment
246
Thomas, J.W., Editor. 1979. Wildlife habitats in managed forests – The Blue Mountains of Oregon and
Washington. U.S. Dep. Agric., For. Serv. Handb. 533. 512pp.
Thomas, J.W., R.G. Anderson, C. Maser, and E.L. Bull. 1979. Snags. Pages 60-77 in J.W. Thomas,
editor. Wildlife habitats in managed forests: Agriculture handbook No. 553. USDA Forest Service,
Washington, D.C.
Thomas, J.W., E.D. Forsman, J.B. Lint, E.C. Meslow, B.R. Noon, and J. Verner. 1990. A conservation
strategy for the northern spotted owl. Report of the Interagency Scientific Committee to address the
conservation of the northern spotted owl. Unpublished interagency document. 458 pages.
Thorp, R.W., D.S.H. Jr. and L.L. Dunning. 1983. Bumblebees and cuckoo bumblebees of California.
University of California Press, Berkeley, Los Angeles, London. 3 pp.
Thorp, R.W., E. Evans and S.H. Black. 2008. Status review of three formerly common species of
bumblebee in the subgenus Bombus. 63 pp.
Turner, R.W. and J.K. Jones, Jr. 1968. Additional Notes on Bats from Western South Dakota. The
Southwestern Naturalist 13:444-447.
USFS. 2015. Status and Trend of Gray Wolves and Forest Management on the Umatilla National Forest.
USFWS. 2002. Appendix D of the Biological opinion of the effects of Olympic National Forest program
of activities for 2002 on marbled murrelets and northern spotted owls. USDI Fish and Wildlife Service,
Lacey, Washington.
USFWS. 2011. Revised Recovery Plan for the Northern Spotted Owl (Strix occidentalis caurina). U.S.
Fish and Wildlife Service, Portland, Oregon. xvi + 258 pp.
USFWS. 2012. Final Rule, Endangered and Threatened Wildlife and Plants; Designation of Revised
Critical Habitat for the Northern Spotted Owl.
Weller, T.J. 2000. Snag use and roost fidelity of fringed myotis in an old-growth Douglas-fir forest in
northern California. Master’s Thesis, Humboldt State University, Arcata, CA.
Weller, T.J., and C.J. Zabel. 1999. Myotis thysanodes day roost characteristics in a northern California
Douglas-fir forest. Abstracts of the Wildlife Society 6th Annual Conference, Austin, TX.
Wiens, J.D. 2012. Competitive Interactions and Resource Partitioning Between Northern Spotted Owls
and Barred Owls in Western Oregon. An Abstract of Dissertation.
Wilson, D.E. and S. Ruff. 1999. The Smithsonian book of North American Mammals. Smithsonian
Institution Press, Washington, D.C..
Whitaker, J. O., Jr., C. Maser, and L. E. Keller. 1977. Food habits of bats of Western Oregon. Northwest
Science 51:46-55.
Witmer, G.W. and D.S. DeCalesta. 1985. Effects of forest roads on habitat use by Roosevelt elk.
Northwest Science (2): 122-125.
Xerces Society. 2009. Bumblebees: western bumblebee (Bombus occidentalis). Profile prepared by R.
W. Thorp, E. Evans and S. H. Black.
Zabel, C. J., J.R. Dunk, H.B. Stauffer, L.M. Roberts, B.S. Mulder, and A. Wright. 2003. Northern
spotted owl habitat models for research and management application in California (USA). Ecological
Applications 13(4): 1027-1040.
Zielinski, W.J., R.H. Barrett, and R.L. Truex. 1997. Southern Sierra Nevada fishers and marten study: Progress Report IV. USDA Forest Service, Pacific Southwest Research Station, Redwood Sciences
Laboratory, Arcata, CA. 37 P.

Dog River Pipeline Replacement | Environmental Assessment
247
Botany
Harpel, J. and R. Helliwell. 2005. Conservation Assessment for Schistostega pennata (Hedw.) Web &
Mohr. USDA Forest Service and USDI Bureau of Land Management.
Hitchcock, C.L. and A. Cronquist. 1987. Flora of the Pacific Northwest. Seattle: University of
Washington Press.
Interagency Special Status/Sensitive Species Program (ISSSSP) species factsheets for bryophytes,
lichens, and fungi. USDA Forest Service and USDI Bureau of Land Management.
http://www.fs.fed.us/r6/sfpnw/issssp/
Mount Hood National Forest Land and Resource Management Plan. 1990
National Resources Manager (NRM) Threatened, Endangered, and Sensitive Plants – Invasive Species
(TESP-IS) database (2016).
Oregon Biodiversity Information Center. 2016. Rare, Threatened and Endangered Species of Oregon.
Institute for Natural Resources, Portland State University, Portland, Oregon. 130 pp.
Regional Forester’s Special Status Species List. USDA Forest Service- Pacific Northwest Region.
Updated July 2015.
USDA Forest Service Manual
US Department of Agriculture, Forest Service, Regions 1, 4, and 6. 17 Aug 1995 Memo (File Code
2670/1950): Streamlining Biological Evaluation and Conclusions for Determining Effects to Listed,
Proposed, and Sensitive Species. Salwasser, H., D. Bosworth, and J. Lowe.
USDA Forest Service and USDI Bureau of Land Management. 1994. Record of Decision for
Amendments to Forest Service and Bureau of Land Management Planning Documents within the Range of the Northern Spotted Owl and Standards and Guidelines for Management of Habitat for Late-
successional and Old-Growth Forest Related Species within the Range of the Northern Spotted Owl.
Portland, OR.
USDA Forest Service & USDI Bureau of Land Management. 2001. Record of Decision and Standards and Guidelines for Amendments to the Survey and Manage, Protection Buffer, and other Mitigation
Measures Standards and Guidelines (January 2001). Portland, OR.
USDA Forest Service & USDI Bureau of Land Management. 2004. Record of Decision to Remove or Modify the Survey and Manage Mitigation Measure Standards and Guidelines (January 2001). Portland,
OR.
Invasive Plant Species
Oregon Department of Agriculture - Plant Division, August, 2011. Oregon Weed Control Program, p.5.
Salem, Oregon, USA.
USDA Forest Service. 1993, January 7. FSM, 2470/2600. Direction on the use of non-native species for
revegetation projects.
USDA Forest Service. 2016. Natural Resource Managers Threatened Endangered Sensitive Plants-
Invasive Species National Data Base.
USDA Forest Service. 2011. FSM, 2081.03 Management of Noxious Weeds.

Dog River Pipeline Replacement | Environmental Assessment
248
USDA Forest Service, Region 6, Pacific Northwest Region. September, 2005. Final Environmental Impact Statement for the Invasive Plant Program, Preventing and Managing Invasive Plants, (Record of
Decision).
USDA Forest Service, Barlow Ranger District, Mt. Hood National Forest. September, 1998.
Environmental Assessment for the Application of Herbicides for the Control and Management of Noxious
Weeds on the Barlow Ranger District.
USDA Forest Service. 1988. Managing competing and unwanted vegetation. Final environmental impact
statement. Pacific Northwest Region, Portland, OR.
USDA Forest Service, Mt. Hood National Forest. March 2008. Site Specific Invasive Plant Treatments
for Mt. Hood National Forest and Columbia River Gorge National Scenic Area in Oregon, including
Forest Plan Amendment #16 (Record of Decision, Final Environmental Impact Statement).
Recreation
U.S. Department of Agriculture, Forest Service, Mount Hood National Forest. 1990. “Land and Resource
Management Plan.”
U.S. Department of Agriculture, Forest Service. ROS Users Guide. Washington, DC: U.S. Department
of Agriculture, Forest Service; 1982.
Cultural Resources
Atwood, Kay, Sally Donovan, Dennis Gray, and Ward Tonsfeldt. 2005. Utility and Service Combined with Beauty – A Contextual and Architectural History of USDA Forest Service Region 6: 1905-1960.
USDA Forest Service, Pacific Northwest Region, Portland.
Brown and Caldwell. 2010. Proposed Action Dog River Pipeline. Forest Connections, LLC. 6500 SW
Macadam Avenue, Suite 200. Portland, Oregon.
Burtchard, Greg C. and Keeler, Robert W. 1994. Mt. Hood Cultural Resource Reevaluation Project.
Laboratory of Archaeology and Anthropology, Portland State University.
City of The Dalles, OR. 2015. City of The Dalles 2015 Drinking Water Quality Report. Brochure printed by the City of The Dalles, Public Works Department. 1215 West 1st Street, The Dalles, Oregon,
97058.
Dryden, Michael D. 2017. Dog River Aqueduct Replacement Project, Barlow Ranger District, Mount Hood National Forest. Unpublished Heritage Resource Compliance Report 2017/060601/0002 on file at
the Hood River Ranger District, Mt. Hood National Forest.
Francis, Katherine, Yvonne Hajda, Robert Moore, E. David V. Ellis. 1995. An Ethnographic Study of the Mount Hood National Forest, Oregon. Archaeological Investigations Northwest, Inc. Report No. 86,
Portland, Oregon.
Howe, Steve. 1979. Soil Resource Inventory and Report. Forest Service, USDA. Pacific Northwest
Region, Mount Hood National Forest.
Keyser, William. 1979. Typed unpublished manuscript by William Keyser of The City of The Dalles
Department of Water Supply and Treatment. Dated August 27, 1980. Copy on file at the Hood River
Ranger District, Mt. Hood National Forest.
Langille, H.D., et al. 1903. Forest Conditions in the Cascade Range Forest Reserve, Oregon.
Washington Government Printing Office.

Dog River Pipeline Replacement | Environmental Assessment
249
McArthur, Lewis A. and Lewis L. McArthur. 2003. Oregon Geographic Names, Seventh Edition.
Oregon Historical Society Press, Portland, Oregon.
McNeal, William H. 1974. History of Wasco County, Oregon. Silesia Printing and Publishing Co., 19
Broadcreek Dr., Oxen Hill, Md. 20022.
Perino, Greg. 1985. Selected Preforms, Points and Knives of the North American Indians, Volume 1.
Points & Barbs Press, Idabel, Oklahoma.
Climate Change
Kershner, Jesse. 2010. The Oregon Climate Change Adaptation Framework - A Case Study. EcoAdapt’s State of Adaptation Program. Oregon Department of Land Conservation and Development. In
collaboration with the Oregon Climate Change Institute. Oregon Climate Service. Oregon State
University.
CTD 2014. Water Management and Conservation Plan. Prepared for City of The Dalles, Oregon. GSI
Water Solutions, Inc. Corvallis, OR. November, 2014.