dogfish creek - kitsap public health district
TRANSCRIPT

BKCHD City of Poulsbo Nonpoint Pollution Impacts to South Fork of Dogfish Creek Final Report
CITY OF POULSBO NONPOINT POLLUTION IMPACTS TO SOUTH FORK OF DOGFISH CREEK: FINAL REPORT
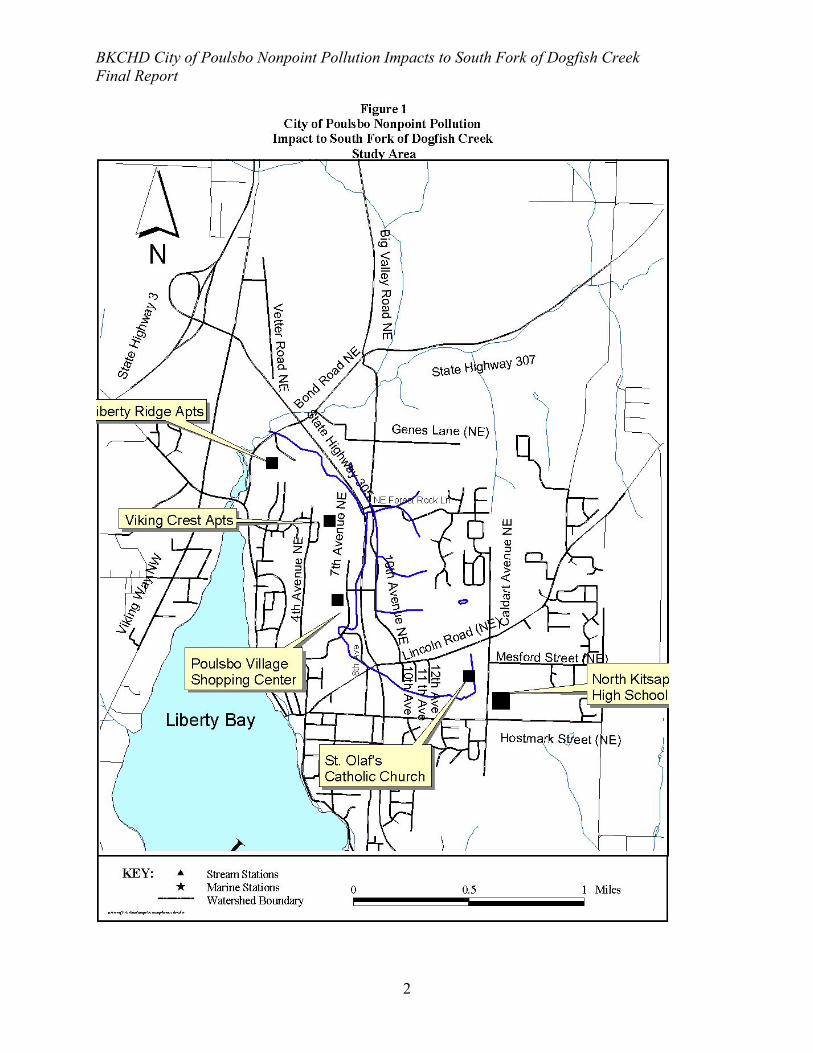
1.0 INTRODUCTION Dogfish Creek has documented fecal coliform bacteria (FC) and turbidity contamination. It is listed on Washington State’s Clean Water Act Section 303(d) List of Impaired Waters [Washington State Department of Ecology (Ecology), 1998]. Under a separate grant from Ecology the Bremerton Kitsap County Health District (Health District) is currently performing a pollution identification and correction study on the West and East Forks of Dogfish Creek which lie in rural Kitsap County. The study concentrates on identifying sources of FC pollution from failing on-site sewage systems (OSS) and improper animal waste management, which have been determined to be the pollution sources. In contrast, the South Fork of Dogfish Creek is located in an heavily urbanized corridor of the City of Poulsbo (City). Potential nonpoint pollution sources degrading water quality include stormwater discharges from the City stormwater system, failing on-site sewage systems, and poorly managed construction activities. The City has contracted with the Health District to begin pollution identification and correction of the South Fork of Dogfish Creek. 2.0 PROJECT AREA DESCRIPTION The South Fork of Dogfish Creek is a spring fed stream that originates at an elevation of 272 feet in Wilderness Park and has a length of 2.1 miles before entering the main stem of Dogfish creek at a culvert on Bond Road. The South Fork enters the main stem downstream of the confluence of the East and West Forks. The South Fork Drainage Basin is comprised of 956 acres where runoff into the creek is from a highly urbanized land base of residential, commercial and state highway development [Washington State Department of Transportation (WSDOT), 2000]. A map of the study drainage area is shown in Figure 1. The upper section of the South Fork is formed by the headwaters near St. Olaf’s Catholic Church. The average gradient from Wilderness Park to Iverson Street is 5%. Stormwater from the North Kitsap High School athletic fields, parking lots, roofs, and adjacent neighborhoods on 15th Loop impact this section heavily by contributing large flows during rain events. As a result, the stream channel through Wilderness Park has been scoured deeply revealing hardpan (Washington State Conservation Commission, 2000). The lower section of the South Fork from Iverson St. to the confluence at Bond Road into the main stem is a low gradient stream (1%) and is approximately 1.6 miles in length. At the Poulsbo Village Shopping Center, 7th Ave. to Liberty Road, the stream was relocated from its original path to the current one to circumvent the Shopping Center. It follows a relatively narrow U-shaped channel parallel to State Route (SR) 305 Right-of-Way (WSDOT, 2000; Washington State Conservation Commission, 2000). Stormwater from roadways, parking lots and residential neighborhoods is diverted to the stream. The streambed in the last 0.5 miles has received large amounts of silt so that former ponds and pools have been filled with sediment (WSDOT, 2000;
1
BKCHD City of Poulsbo Nonpoint Pollution Impacts to South Fork of Dogfish Creek Final Report
2

BKCHD City of Poulsbo Nonpoint Pollution Impacts to South Fork of Dogfish Creek Final Report Washington State Conservation Commission, 2000). Stormwater from upland residential neighborhoods in the Torval Canyon area, Vikings Crest Apartment complex and Liberty Ridge Apartment complex is collected and directed to this final 0.3 miles of the stream. In general, salmon habitat of the South Fork has been described as poor for the condition of the stream channel, spawning substrate, riparian condition and water quality (Washington State Conservation Commission, 2000). However, spawning chum and coho salmon, and native cutthroat are observed in the South Fork (Paul Dorn, Suquamish Tribe, 2002). These fish utilize the lower 1.6 miles of stream corridor from 7th Avenue to Bond Road.
Historical water quality studies of Dogfish Creek have concentrated on the main stem, and the East and West Forks, excluding the South Fork. Studies of the main stem and east and west forks from 1988 through 1993 reported significant contamination of FC and turbidity (KCM, 1994; Health District, November 1995). Additionally, historical studies of Liberty Bay (with Dogfish Creek being the largest fresh water contributor) document the increase in FC levels to the point where shellfish growing was decertified for commercial harvest in May 1991 [Washington State Department of Health (WSDOH), 2001]. Limited sampling of the South Fork by the Health District in 1994 showed it to be failing to meet the Washington State water quality standards (WAC 173-201A) for FC. The Health District began monitoring the South Fork of Dogfish Creek on a more concentrated level in its countywide trend water quality monitoring program (Health District, 2001). Since 1997 over 45 water samples for FC, temperature, pH, dissolved oxygen, specific conductance and turbidity have been collected for a minimum of ten sampling events each calendar year. The samples are collected on a random-systematic basis during both dry and wet weather conditions and are a good representation of the overall water quality of the stream (Health District, 2001). The sampling station, SF01, is located at the stream mouth at Bond Road. Data from 1997 through 2001 are summarized in Table 1 and statistical analysis of FC trend is shown in Figure 2.
TABLE 1 WATER QUALITY OF SOUTH FORK OF DOGFISH CREEK
January 1997 to September 2001 Parameter State Standard Geomean or
Mean Range % Meeting
Standard Meets WQ Standard?
Fecal Coliform 50 FC/100 ml (Part 1)
102 17->1600 57% No
Turbidity 24.3 NTU1 19.2 0.0-208.0 82% No Temperature ≤16.0 C 9.8 1.9-15.6 100% Yes
pH 6.5-8.5 units 7.5 6.2-8.9 96% Yes Dissolved Oxygen
>9.5 mg/L 10.3 7.6-12.2 73% No
1Turbidity standard is watershed wide average plus 5 NTU. It is a Health District criterion used in reports for comparison purposes only and is not a replacement for the WAC 173-201A standard.
3

BKCHD City of Poulsbo Nonpoint Pollution Impacts to South Fork of Dogfish Creek Final Report
FIGURE 2 FRESH WATER TREND ANALYSIS RESULTS OF STATION SF01
January 1997 to September 2001
20-M
ay-9
9
28-A
ug-9
9
06-D
ec-9
9
15-M
ar-0
0
23-J
un-0
0
01-O
ct-0
0
09-J
an-0
1
19-A
pr-0
1
28-J
ul-0
1
05-N
ov-0
1
40
50
60
70
80
90
100
110120130140150160170180190200
Feca
l Col
iform
Bac
teri
a M
PN p
er 1
00 m
l(M
ovin
g 30
Sam
ple
Geo
met
ric
Mea
ns)
Class AA, Part 1
r = -0.9711SignificantDecreasingTrend
Table 1 shows the South Fork of Dogfish Creek fails to meet the WAC 173-201A freshwater quality standards for fecal coliform, dissolved oxygen and the Health District criteria for turbidity. However, Figure 2 demonstrates a strong statistically significant decreasing FC trend. Clearly, with FC as the key indicator of nonpoint source pollution, the South Fork is showing remarkable improvement. Recent studies have shown that stormwater runoff from impervious surfaces contributes significant levels of FC and turbidity to urban streams and bays (Mallin, 2000; Marsalek, 1989; Pitt, 1995). Stormwater systems in the South Fork drainage area are a combination of older (pre-1993) drain-inlets, piping and outfalls which provide a direct path of flow for pollutants, and newer bioswales and detention pond systems which provide partial removal of pollutants. Strong evidence demonstrates that stormwater systems, especially older direct pipe systems, can serve as reservoirs for FC and a major source during storm events (Mallin, 2000). Additionally, sewage spills, cross-connected sewer lines, and failing OSS may contribute FC to the South Fork of Dogfish Creek. The City has contracted with the Health District to perform an initial study of nonpoint pollution water quality impacts to South Fork of Dogfish Creek. This City is also providing grant match funds for the sanitary survey of properties near the South Fork served by OSS. The results will be used to determine the need for future pollution identification projects and implementation of best management practices (BMPs) for stormwater.
4

BKCHD City of Poulsbo Nonpoint Pollution Impacts to South Fork of Dogfish Creek Final Report 3.0 GOALS AND OBJECTIVES The goals of the City of Poulsbo Nonpoint Pollution Impacts to South Fork of Dogfish Creek are to:
• Protect public health and the environment by identifying and correcting sources of water quality degradation.
• Prevent future water quality degradation through understanding the sources of nonpoint pollution into South Fork of Dogfish Creek.
• Provide a baseline evaluation for future studies and the restoration of the South Fork of Dogfish Creek.
To meet the project goals, the following objectives were developed and implemented:
• Inspect the City of Poulsbo stormwater system (drain inlets, piping and outfalls) for
potential sources of nonpoint pollution. • Verify drainage maps of the City of Poulsbo stormwater system for accuracy of structures
and piping configuration. • Perform surveys of properties with on-site sewage systems to identify and correct
nonpoint pollution sources. • Perform water quality sampling of the most significant stormwater outfalls for typical
stormwater pollutants. • Sample selected stream segment stations for impacts of typical stormwater pollutants. • Compare water quality data with established standards or regional reference data. • Provide the City of Poulsbo recommendations for improving the quality of stormwater
runoff and implementing best management practices. 4.0 PROJECT DESIGN AND METHODS 4.1.1 MAPPING AND INSPECTION OF THE STORMWATER SYSTEM Stormwater maps, 1″=200′ scale, of the City of Poulsbo were obtained from the Public Works Department. The maps were produced in 1993; therefore stormwater systems designed and installed after 1993 are not illustrated. The City of Poulsbo is in the process of incorporating post-1993 systems in order to update their maps. Stormwater systems not included in the 1993 maps were located but as-builts were not produced since the City is updating their maps from existing drawings. Stormwater systems identified to impact Liberty Bay or other streams which are not tributaries to the South Fork are outside the scope of this project. The stormwater systems inspected in this study are characterized as more than 10 years old consisting of Type I and II catch basins, pipes, and oil/water separators in some private parking lots. The post-1993 systems were not inspected since they consist of wet ponds, dry ponds and bioswales. These systems have been shown to have removal efficiencies of stormwater pollutants from 26% to 99%, depending upon the treatment system and pollutant (Chesapeake Research Consortium, 1997). Therefore, this study focuses upon the stormwater systems prior to
5

BKCHD City of Poulsbo Nonpoint Pollution Impacts to South Fork of Dogfish Creek Final Report 1993 which provide little or no treatment of pollutants and have the greatest potential to impact the stream. The stormwater drainage systems were mapped and inspected. Mapping is defined as verifying the structure type (Type I or II catch basin, oil/water separator, outfall), location, and pipe size. Additionally, outfalls were identified, located, pipe diameter and condition of outfall determined. Inspection is defined as removing the catch basin or manhole lid, determining the depth of sediment, and recording any defects (such as shallow basin), which may obstruct the performance of the structure. Criteria for the determination of the need for maintenance of a structure is defined in the Washington State Department of Ecology Stormwater Manual (Ecology, 2001). Stormwater systems under the responsibility of the City of Poulsbo were inspected; systems on private property were not in the scope of this project. However, it is clear stormwater systems on private property have the potential to contribute sediments and pollutants into the City system. 4.1.2 WATER QUALITY MONITORING OF STORMWATER OUTFALLS AND
SOUTH FORK DOGFISH CREEK After mapping and inspection of the City’s stormwater drainage system, water quality sample sites of stormwater outfalls and the South Fork of Dogfish Creek were selected. Eight outfalls were selected based upon the field inspection for the greatest potential to impact the South Fork. Criteria included land-use, flow volumes observed during wet weather and the degree of sedimentation near the outfall. Five stream segment sampling stations on the South Fork were established. Table 2 shows the sample station locations and descriptions. A map of the outfall and stream sampling locations and identifications are shown in Figure 3.
TABLE 2 WATER QUALITY SAMPLE STATION NAMES AND DESCRIPTION Station ID Station Description SF01 Culvert on Bond Road at mouth of creek SF01B Intersection of Little Valley and Highway 305 SF01C 50 feet downstream of Liberty Road and Highway 305 SF02 Corner of 7th and 8th Ave. N.E. SF04 Wilderness Park below the 2nd footbridge PSW01 42” culvert on Bond Road PSW02 18” outfall on Bond Road PSW03 24" outfall at Bondwood apartments PSW04 12” outfall at 20594 Highway 305 PSW05 8” 0utfall adjacent to DME Auto Service, Poulsbo Village North PSW06 42” outfall on Liberty Road PSW07 Unable to locate outfall, sampled at Type II catch basin on Hostmark St. PSW08 24” outfall from High School fields
Rainfall data was obtained from the Kitsap Public Utility District Big Valley rain gauge station. The established 6-month 24-hour event rainfall for Poulsbo (Washington State Conservation
6

BKCHD City of Poulsbo Nonpoint Pollution Impacts to South Fork of Dogfish Creek Final Report
7

BKCHD City of Poulsbo Nonpoint Pollution Impacts to South Fork of Dogfish Creek Final Report Commission, 2000) is 1.28”. Samples were collected during 24-hour event rainfalls between 0.37” and 0.76”. Water quality samples were collected during these “mild” rainfall events. Heavy rainfall events were avoided since they would represent an extreme condition and not a more frequent event typical for loading pollutants into the stream. Stream sampling stations and stormwater outfalls were sampled during one event for a broad range of stormwater pollutants (see below discussion and Tables 3, 4, and 5) . FC and turbidity were monitored for eight events; four dry weather and four wet weather at stream segment stations and three wet weather events at stormwater outfalls. All samples were collected between January and March 2001. Stormwater drainage basins contributing flow to the South Fork are predominately urban residential and commercial land uses. Most of the basins are sewered, with a small portion of residential areas served by on-site sewage systems. It is not possible to sample stormwater for every potential pollutant. Therefore, pollutants most likely to be present based upon previous studies were selected for laboratory analysis. Table 3 shows the selected parameters for analysis and the potential sources.
TABLE 3 STORMWATER POLLUTANTS AND THEIR POTENTIAL SOURCES
Parameter Potential Sources Total Petroleum Hydrocarbons
Automobile fluids, oil spills
Biological oxygen demand-5 day
Fertilizers, lawn clippings, vegetative residue, pet waste, failing OSS, sewer leaks, illicit discharges1
Nitrate+nitrite-nitrogen Fertilizers, lawn clippings, pet waste, failing OSS, sewer leaks, illicit discharges Total phosphorus Fertilizers, sediments Copper Automobile fluids, commercial and industrial processes Zinc Automobile fluids, tires, commercial and industrial processes Total suspended solids Construction activities, street refuse, road deterioration, vegetative residue Turbidity Construction activities, street refuse, road deterioration, vegetative residue Fecal coliform bacteria Pet waste, failing OSS, sewer leaks, illicit discharges, water fowl 1Sanitary sewer inappropriately connected to the stormwater system Flow-proportional samples are the optimum method for sample collection to minimize variability during a rain event (Marsalek, 1989). However, due to budget constraints grab samples were collected. The water quality data collected in the study will be useful as an initial investigation of pollutant levels, comparison to regional data and state standards, and selection of future indicator parameters. Grab samples were collected using the appropriate sample collection bottles. Sample preservation, bottles and holding times as specified in the Washington State Department of Ecology Sampling Guidelines (Ecology, 2001) were followed. Samples were either analyzed in the field or transported to the appropriate contract laboratory as described below. The Health District laboratory analyzed FC samples and Twiss Analytical Laboratory, Inc and Edge Analytical, Inc analyzed all other parameters. All laboratories are certified by Ecology.
8

BKCHD City of Poulsbo Nonpoint Pollution Impacts to South Fork of Dogfish Creek Final Report Health District staff used standard field equipment for the collection of turbidity, specific conductivity, and pH data. For samples analyzed in the field the equipment, analytical method and detection limits are listed in Table 4. For samples analyzed by the laboratories, the analytical methods and detection limits are listed in Table 5.
TABLE 4 FIELD ANALYSIS EQUIPMENT, METHOD, AND DETECTION LIMITS
Parameter Manufacturer/Model Analytical Method Detection Limit PH YSI 63 EPA 150.1 0.5 SU Specific Conductivity YSI 63 EPA 120 10 um/cm Turbidity Hach 2100 EPA 180.1 0.1 NTU
TABLE 5 PARAMETERS, ANALYTICAL METHODS AND DETECTION LIMITS ANALYZED
BY THE LABORATORIES Parameter Analytical Method Detection Limit NWTPH-HCID Northwest Total Petroleum Hydrocarbon-by gas
chromatograph with distinction of gas/diesel/oil components
Gasoline 0.25 mg/L Motor oil 0.63 mg/L Diesel 0.63 mg/L
Biological oxygen demand-5 day
EPA 405.1 1 mg/L
Nitrate+nitrite-nitrogen EPA 353.2 0.01mg/L Total phosphorus EPA 365.3 0.01mg/L Hardness EPA 130.2 1.0 mg/L Dissolved and total zinc EPA 200.7 6.0 ug/L Dissolved and total copper
EPA 200.7 5.0 ug/L
Total suspended solids EPA 160.2 1 mg/L Fecal coliforms SM 9221 E <2 cfu For the purpose of precision in field sample collection, for every 10th sample a field duplicate was collected. If less than ten samples were collected during the sampling event, then one field duplicate was collected. Field blanks were employed for metals analysis only, since these are the most likely parameters for field contamination. Appropriate laboratory data was supplied to the Health District by the contract laboratory including laboratory duplicates, laboratory blanks and spiked matrix results. Instrument calibration curves were available upon request. Laboratory duplicates not meeting appropriate criteria for reproducibility within the range of 10% for metals and 30% for all other parameters were subject to re-analysis, or if re-analysis was not possible, non-acceptance of the data into the dataset. The exception to reproducibility acceptance is for FC. FC results are based upon a logarithmic scale and cannot be subject to a linear rule of acceptance. Stormwater and stream water quality data were compared to state standards, western Washington values or Health District criteria. Western Washington stormwater values are described by Chandler (1995) for BOD, total copper, total zinc, and TSS. No comparable regional values for nitrate in stormwater were available. The current state water quality standard (WAC 173-201A) for pH and fecal coliform bacteria was used for both stream and stormwater data. Stream water
9

BKCHD City of Poulsbo Nonpoint Pollution Impacts to South Fork of Dogfish Creek Final Report quality data for TSS and nitrate+nitrite was compared to values from King County streams (1991) and are an adequate comparison since they are considered from the same ecological region, the Puget Sound Lowlands. Dissolved and total zinc in stormwater and streams was compared to the state standard (WAC 173-201A), which is based upon a calculation derived from the concentration of hardness in the sample. The acute criterion, which is for short-term exposure of aquatic organisms, was used for stormwater samples and the chronic criteria, which is for long-term exposure of aquatic organisms, was used for stream samples. Turbidity is the measurement of visual clarity as determined by the degree of the passage of light through a water sample. This parameter is closely correlated with the degree of human disturbance in a watershed. The turbidity standard in WAC 173-201A states that the turbidity shall not exceed 5 nephelometric turbidity units (NTU) over background turbidity when the background turbidity is 50 NTU or less. Determining the “background” value is challenging in a disturbed watershed such as the South Fork. In recent reports (Health District, 1999)the Health District has developed criteria for each watershed based upon an average of all samples from that watershed. The values determining the average are from a combination of streams in both disturbed and undisturbed areas. The Liberty Bay/Miller Bay Watershed, in which the South Fork is located, turbidity criteria 24.3 NTU. This value will be used for stormwater samples only. An Ecology approved method to determine the “background” in the Dogfish Creek system is to determine the turbidity in a paired similar drainage basin, the Port Gamble Creek basin. The Port Gamble Creek basin is similar to the Dogfish Creek basin in terms of stream gradient, soils, and rainfall patterns, but is relatively undisturbed. The background value for the Port Gamble Creek basin is 1.8 NTU and the criteria will be 6.8 NTU for stream samples. Table 6 summarizes the sources and values of the comparison data in stormwater and stream samples.
TABLE 6 SOURCES AND VALUES OF COMPARISON DATA FOR STORMWATER AND
STREAM SAMPLES Parameter in Stormwater
Sample Source of the Comparison Value or
Standard Value of the Reference Data
Fecal coliform bacteria WAC 173-201A, Class AA Freshwater, Part 1
50 cfu/100ml
10

BKCHD City of Poulsbo Nonpoint Pollution Impacts to South Fork of Dogfish Creek Final Report Total zinc Chandler, 1995 119 ug/L Dissolved zinc WAC 173-201A, acute criteria Based upon calculation of
hardness Total copper Chandler, 1995 19 ug/L Dissolved copper WAC 173-201A, acute criteria Based upon calculation of
hardness TSS Chandler, 1995 124 mg/L BOD Chandler, 1995 14.8 mg/L Nitrate+nitrite No comparison Not applicable pH WAC 173-201A 6.5-8.5 SU Turbidity Health District criteria for Liberty Bay/Miller
Bay Watershed1 24.3 NTU
Parameter in Stream Sample Source of the Comparison Value or Standard
Value of the Reference Data
Fecal coliform bacteria WAC 173-201A, Class AA Freshwater, Part 1
50 cfu/100ml
Total zinc WAC 173-201A, chronic criteria Based upon calculation of hardness
TSS King County Streams, 1991 5.1 mg/L BOD No comparison Not applicable Nitrate+nitrite King County Streams, 1991 0.70 mg/L pH WAC 173-201A 6.5-8.5 SU Turbidity Health District paired watershed, Port
Gamble Bay 6.8 NTU
4.1.3 ON-SITE SEWAGE SYSTEM SURVEYS OSS located in the City of Poulsbo with the potential to be a source of contamination of the South Fork of Dogfish Creek were surveyed according to the methods contained in the “Manual of Protocol for Conducting On-Site Sewage Systems Surveys in Kitsap County, Washington” (Health District, 1995) and “Manual of Protocol: Fecal Coliform Bacteria Pollution Identification and Correction Projects” (Health District, 1999). Both the Washington State Department of Ecology and State Health have approved the Health District’s survey protocol manual. Nineteen properties in the City served by OSS were identified. In summary, the survey involves contacting the resident, explaining the purpose of the project and requesting an appointment to meet with them at their home. At the time of the site visit, Health District staff conducts an interview and provide educational material related to on-site sewage system operation and maintenance. Subsequently, permission to view the drainfield for signs of failure is requested. If permission is granted, the drain field is inspected. If failure is suspected, the system may be analyzed further (water samples and dye test) to determine if the OSS is properly functioning. The resident has the right to deny access at any time during the initial contact or during the site visit. The Health District has been performing Pollution Identification and Correction (PIC) projects for over 10 years and has a documented history of high participation rates and surface water quality improvements. Past project areas include Gorst, Burley Creek, and Dogfish Creek. 5.0 RESULTS AND DISCUSSION
11

BKCHD City of Poulsbo Nonpoint Pollution Impacts to South Fork of Dogfish Creek Final Report 5.1.1 MAPPING AND INSPECTION OF STORMWATER SYSTEM In December of 2001 and January of 2002 field mapping and inspection of the stormwater system was performed. Eleven stormwater outfalls from the City stormwater system were confirmed to discharge to the South Fork. The outfall site descriptions are in Table 7 and the location of the outfalls is shown in Figure 4. The listed outfalls do not include those from private property.
TABLE 7
CITY OF POULSBO STORMWATER OUTFALLS ENTERING SOUTH FORK DOGFISH CREEK IN ORDER ACCORDING TO LOCATION, UPSTREAM TO
DOWNSTREAM Outfall Designation on Map
Location Description Outfall Size
Condition Map Key
779A South culvert on Caldart at High School Fields 24” Adequate 1 782B North culvert on Caldart at High School Fields 12” Adequate 2 750A Hostmark and 15th St. Loop residential area Unknown Unable to
locate 3
598B Highway 305 and Plaza 305 roadside 8” Unknown, buried under brambles
4
974A Corner of 8th Ave. and 7th Ave. 16” Buried in sediment, below grade of creek bed
5
959A Poulsbo Village at Mitzels 42” Outfall partially buried in sediment
6
1016A Poulsbo Village North Parking Lot 10” Crushed 7 214D 20594 Highway 305 12” Adequate 8 BW Drainage at Bondwood Apartments 24” Adequate 9 167A Bond Road N.E. in front of medical building 18” Adequate 10 168A Liberty Ridge Apartments at Bond Road 42” Adequate 11 Six of the eleven outfalls appeared to be adequate. Outfall 598B at Highway 305 near Lincoln Road was buried under brambles. This roadside system will be reconstructed and replaced with
12

BKCHD City of Poulsbo Nonpoint Pollution Impacts to South Fork of Dogfish Creek Final Report
13

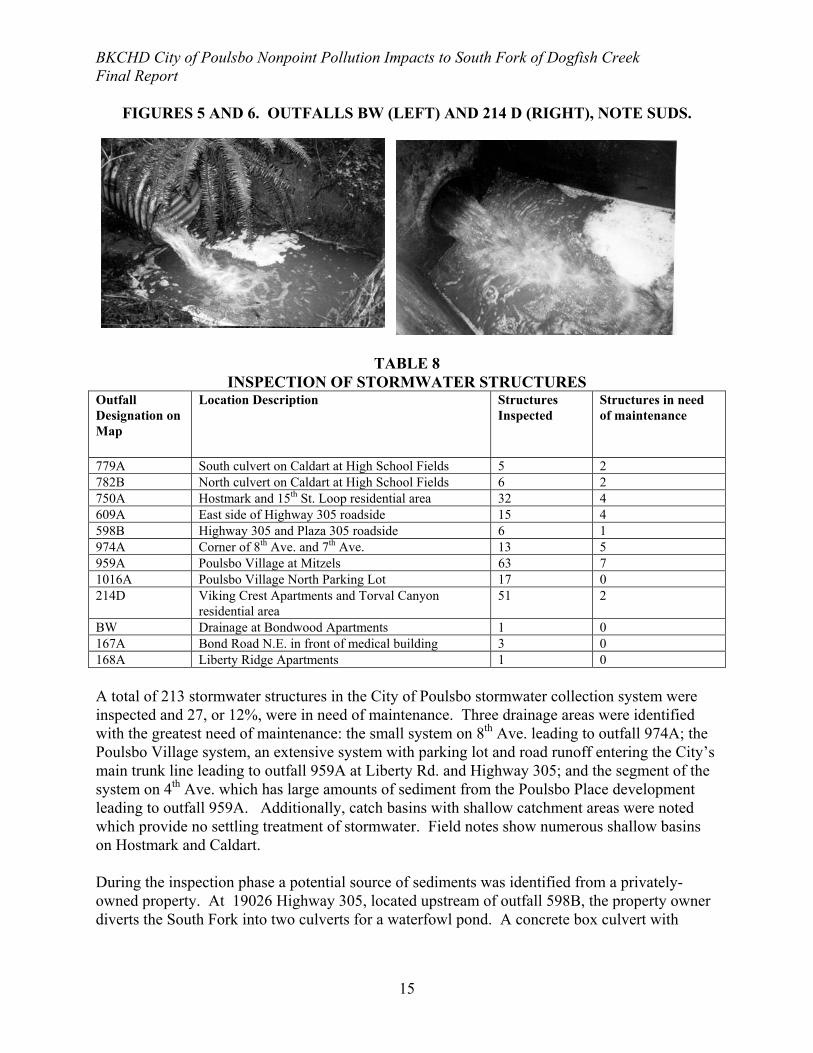
BKCHD City of Poulsbo Nonpoint Pollution Impacts to South Fork of Dogfish Creek Final Report bioswales by the Washington State Department of Transportation during the SR-305 Project (WSDOT, June 2000). Outfall 974A located on 8th Ave. discharges directly to the creek but is below the elevation of the creek and is buried. Outfall 959A at Liberty Rd and Highway 305 is partially buried by sediment, as is the culvert under Liberty Road. The Washington State Department of Transportation will replace the culvert during the SR-305 Project. Outfall 1016A from the North Parking Lot of Poulsbo Village is crushed. Outfall 750A, located on Hostmark, is in a brushy ravine. Health District staff used machetes to cut a trail into the ravine, but were unable to locate and inspect the outfall structure. Stormwater sampling for this outfall was performed at the manhole at the head of the outfall structure. Inspection of the outfalls during wet weather indicated two areas of water quality concern. Stormwater discharge from outfalls BW and 214D in the lower reach of the South Fork of Dogfish Creek displayed a high level of suds (Figures 5 and 6). Suds were observed during wet weather site visits of the two outfalls on January 7, February 6, February 21, and March 11. Water quality samples from these outfalls will be discussed in section 5.1.2. The inspection of the system for outfall 214D showed that Vikings Crest apartments has a designated car wash station for tenants directly over a storm drain. This may be the sole source of the suds, or car washing from the residential neighborhood may also contribute soapy water. The management of the apartments has removed the car wash station. A cover letter and educational materials were provided to the apartment manager (Appendix A). The source of the suds has not been determined for outfall BW. Inspection of the stormwater system contributing to each outfall was performed. For each of the eleven systems Table 8 shows the number of structures inspected and the number of structures in need of maintenance. A majority of maintenance needs identified were catch basins with greater than 6” of depth of sediment or 30% of the catchment depth containing sediment. Excessive sediment in catch basins contribute pollutants, such as sediment-bound metals, FC and oils, which are transported downstream in the storm system and ultimately discharged into the stream. The City has been provided a clean copy of the maps showing the pipe size and location of outfalls, the connecting pipe sizes between structures, and corrections of pipe configurations. The drainage systems inspected, which impact the South Fork of Dogfish Creek, are highlighted on the maps so that City stormwater maintenance crews are aware of the systems directly impacting the South Fork of Dogfish Creek.
14
BKCHD City of Poulsbo Nonpoint Pollution Impacts to South Fork of Dogfish Creek Final Report
FIGURES 5 AND 6. OUTFALLS BW (LEFT) AND 214 D (RIGHT), NOTE SUDS.
TABLE 8 INSPECTION OF STORMWATER STRUCTURES
Outfall Designation on Map
Location Description Structures Inspected
Structures in need of maintenance
779A South culvert on Caldart at High School Fields 5 2 782B North culvert on Caldart at High School Fields 6 2 750A Hostmark and 15th St. Loop residential area 32 4 609A East side of Highway 305 roadside 15 4 598B Highway 305 and Plaza 305 roadside 6 1 974A Corner of 8th Ave. and 7th Ave. 13 5 959A Poulsbo Village at Mitzels 63 7 1016A Poulsbo Village North Parking Lot 17 0 214D Viking Crest Apartments and Torval Canyon
residential area 51 2
BW Drainage at Bondwood Apartments 1 0 167A Bond Road N.E. in front of medical building 3 0 168A Liberty Ridge Apartments 1 0 A total of 213 stormwater structures in the City of Poulsbo stormwater collection system were inspected and 27, or 12%, were in need of maintenance. Three drainage areas were identified with the greatest need of maintenance: the small system on 8th Ave. leading to outfall 974A; the Poulsbo Village system, an extensive system with parking lot and road runoff entering the City’s main trunk line leading to outfall 959A at Liberty Rd. and Highway 305; and the segment of the system on 4th Ave. which has large amounts of sediment from the Poulsbo Place development leading to outfall 959A. Additionally, catch basins with shallow catchment areas were noted which provide no settling treatment of stormwater. Field notes show numerous shallow basins on Hostmark and Caldart. During the inspection phase a potential source of sediments was identified from a privately-owned property. At 19026 Highway 305, located upstream of outfall 598B, the property owner diverts the South Fork into two culverts for a waterfowl pond. A concrete box culvert with
15

BKCHD City of Poulsbo Nonpoint Pollution Impacts to South Fork of Dogfish Creek Final Report sluice gates catch sediment. During heavy rains the sluice gates are raised to transport the accumulated sediment downstream. 5.1.2 ON-SITE SEWAGE SYSTEM SURVEYS Nineteen properties were identified to be served by OSS in the project area. The pollution identification and correction OSS survey was conducted from December 2001 to June 2002. During this period a total of 15 properties were surveyed. The 15 properties are rated as follows: six as “no records”, six as “no apparent problems”, and three as “non-conforming”. Two properties denied access and the locations in relation to the stream show a low probability of water quality concerns. Two properties did not respond, and are located in areas with a low probability of water quality impacts to the South Fork. No failing or suspect OSS were identified. 5.1.3 WATER QUALITY MONITORING OF STORMWATER OUTFALLS Eight outfalls were selected for water quality sampling for stormwater pollutants. Refer to Figure 3 for the sample locations. Data met the criteria for accuracy and precision except for total phosphorus. The laboratory blank contained a significant level of total phosphorus. The laboratory subtracted the quantity from the samples. Even with the blank correction the results were deemed unreliable and are not reportable. All laboratory results are attached in Appendix B. Total petroleum hydrocarbons (TPH) were not detected in the stormwater samples above the detection limit. A previous study (Shepp, 1996) showed TPH concentrations in stormwater from 0.7 to 6.6 mg/L in low volume low intensity storms, well above the detection limits of 0.25-0.63 mg/L (see Table 4). Toxic effects in freshwater fish have been observed at levels as low as 0.3 mg/L. Samples collected from the City storm system may have not been collected under optimum conditions. To confirm the results, sampling should be repeated for outfalls with the highest potential of TPH, which are those collecting runoff from commercial land uses and roads. Table 9 shows the results for pH, BOD, total copper, total zinc, nitrate and TSS. Western Washington stormwater data and the pH standard are shown.
16

BKCHD City of Poulsbo Nonpoint Pollution Impacts to South Fork of Dogfish Creek Final Report
TABLE 9 WATER QUALITY OF CITY OF POULSBO STORMWATER AND COMPARISON TO
REGIONAL DATA AND STATE STANDARDS
Parameter Total ZincTotal
Copper TSS BOD Nitrate+nitrite pH Unit ug/L ug/L mg/L mg/L mg/L SU
PSW01 166 5 43 10.0 0.11 6.89 PSW02 67 8 47 9.0 0.07 7.08 PSW03 59 7 15 10.1 0.09 7.08 PSW04 34 6 44 11.7 0.19 7.12 PSW05 65 6 15 11.0 0.12 7.21 PSW06 72 12 57 12.4 0.12 7.24 PSW07 31 <5 14 11.3 0.22 7.06 PSW08 43 19 72 10.9 0.26 7.06
Western Washington Stormwater1 119 19 124 14.8 WAC Standard2 6.5-8.5
1Chandler, 1995 2Washington Administrative Code Chapter 173-201A Bold cells denote a value greater than the comparison
Total copper, TSS, and BOD are at or below the event mean concentration of the western Washington comparison values (Chandler, 1995). All pH values are well within the state standard. The concentration of total zinc at PSW01 was greater than the average mean event concentration of western Washington stormwater, 166 ug/L compared to 119 ug/L. PSW01 collects stormwater from the Liberty Ridge Apartment complex roofs, landscaped areas, parking lots and driveways. When comparing the samples between sites, PSW08, which collects stormwater from the high school fields, had the highest value for nitrate, TSS and total copper. It is recommended that additional sampling be performed to determine if these contaminants are present on a regular basis and are candidates for source tracing. Table 10 shows the comparison of zinc concentrations in stormwater samples to the state acute standard.
TABLE 10 DISSOLVED ZINC IN STORMWATER OUTFALLS COMPARED TO WAC 173-201A
ACUTE STANDARD Sample
Site Dissolved Zinc
ug/L Calculated Zinc Acute Standard
ug/L PSW01 126 35 PSW02 48 30 PSW03 47 54 PSW04 18 45 PSW05 28 49 PSW06 24 35 PSW07 22 35 PSW08 13 40
Bold cells denote an exceedance of the state zinc criteria
17

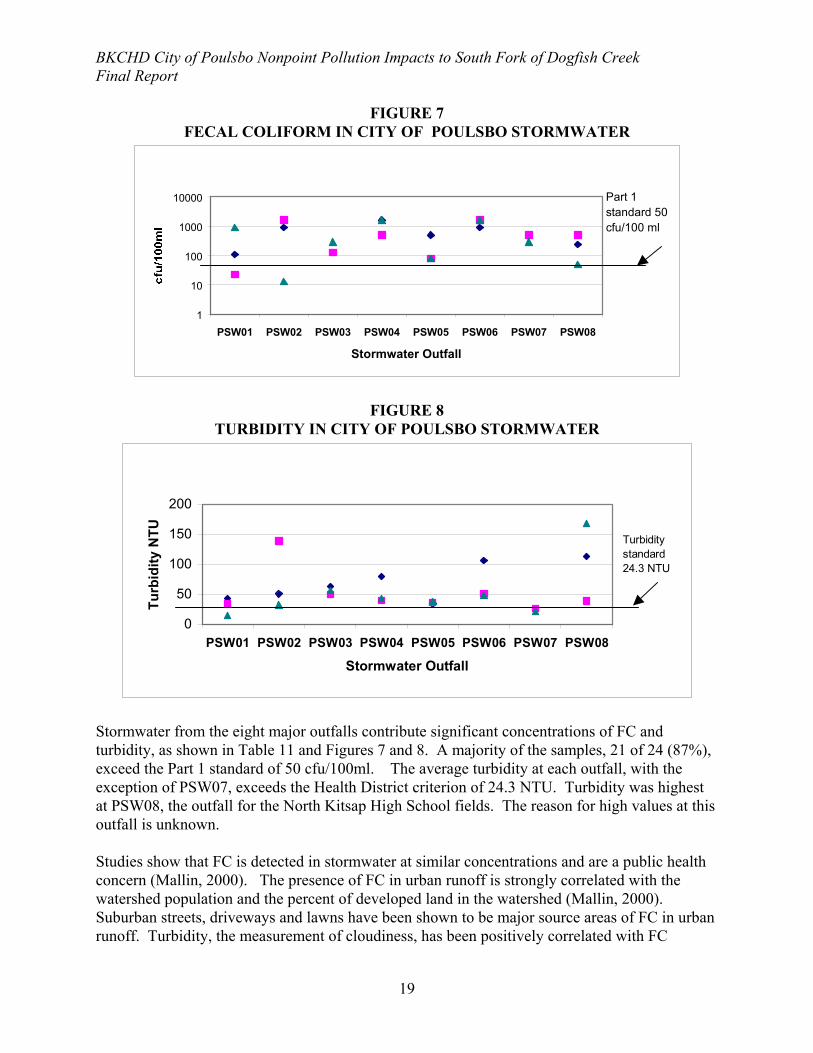
BKCHD City of Poulsbo Nonpoint Pollution Impacts to South Fork of Dogfish Creek Final Report The dissolved fractions of zinc and copper were evaluated. No dissolved copper below 5ug/ml was detected. However, dissolved zinc was regularly detected in Poulsbo stormwater. PSW01 and PSW02 exceed the standard for zinc. Previous research (Pitt, 1995) evaluated zinc concentrations in runoff from a variety of land uses and found the highest levels from roofs, parking areas and landscaped areas. Further evaluation of zinc concentrations from PSW01 and PSW02 to confirm the results and identify the sources is recommended. Stormwater samples were collected during three different rainfall events and analyzed for FC and turbidity. Table 11 summarizes the FC and turbidity results. Figures 7 and 8 show scatter plots of the data from Table 11.
TABLE 11 FECAL COLIFORM AND TURBIDITY OF STORMWATER OUTFALLS AND
COMPARED TO STANDARDS
Sample Date
Fecal Coliform
cfu/100 ml
Geomeancfu/100 ml
TurbidityNTU
Average
NTU PSW01 2/6/2002 110 132 43.1 31 2/21/2002 23 33.9 3/11/2002 900 14.6 PSW02 2/6/2002 900 266 50.3 74 2/21/2002 >1600 139.0 3/11/2002 13 31.9 PSW03 2/6/2002 130 172 63.3 57 2/21/2002 130 50.0 3/11/2002 300 56.6 PSW04 2/6/2002 >1600 1086 79.4 54 2/21/2002 500 39.6 3/11/2002 1600 42.6 PSW05 2/6/2002 500 147 33.8 36 2/21/2002 80 36.1 3/11/2002 80 38.2 PSW06 2/6/2002 900 1321 106.0 69 2/21/2002 >1600 51.6 3/11/2002 >1600 48.6 PSW07 2/6/2002 500 422 22.4 23 2/21/2002 500 26.2 3/11/2002 300 21.4 PSW08 2/6/2002 240 182 113.5 107 2/21/2002 500 38.9 3/11/2002 50 168.0 WAC Standard 50 24.3 Bold cells denote values greater than the WAC173-201A for FC and the Health District turbidity criterion.
18
BKCHD City of Poulsbo Nonpoint Pollution Impacts to South Fork of Dogfish Creek Final Report
FIGURE 7 FECAL COLIFORM IN CITY OF POULSBO STORMWATER
1
10
100
1000
10000
PSW01 PSW02 PSW03 PSW04 PSW05 PSW06 PSW07 PSW08
Stormwater Outfall
Part 1 standard 50 cfu/100 ml
FIGURE 8 TURBIDITY IN CITY OF POULSBO STORMWATER
0
50
100
150
200
PSW01 PSW02 PSW03 PSW04 PSW05 PSW06 PSW07 PSW08
Stormwater Outfall
Turb
idity
NTU Turbidity
standard 24.3 NTU
Stormwater from the eight major outfalls contribute significant concentrations of FC and turbidity, as shown in Table 11 and Figures 7 and 8. A majority of the samples, 21 of 24 (87%), exceed the Part 1 standard of 50 cfu/100ml. The average turbidity at each outfall, with the exception of PSW07, exceeds the Health District criterion of 24.3 NTU. Turbidity was highest at PSW08, the outfall for the North Kitsap High School fields. The reason for high values at this outfall is unknown. Studies show that FC is detected in stormwater at similar concentrations and are a public health concern (Mallin, 2000). The presence of FC in urban runoff is strongly correlated with the watershed population and the percent of developed land in the watershed (Mallin, 2000). Suburban streets, driveways and lawns have been shown to be major source areas of FC in urban runoff. Turbidity, the measurement of cloudiness, has been positively correlated with FC
19
BKCHD City of Poulsbo Nonpoint Pollution Impacts to South Fork of Dogfish Creek Final Report abundance (Mallin, 2000) and serves as an excellent supplemental indicator of FC. FC can be reduced by locating and correcting point sources such as illicit connections to the stormwater system and sewage spills. Nonpoint sources of FC are more difficult to correct since they are contributed by many residents in the watershed and the piped stormwater system acts as a transport system to move these contaminants to the stream in an efficient manner. Some success can be accomplished through better maintenance of the system and public education about proper disposal of pet waste.
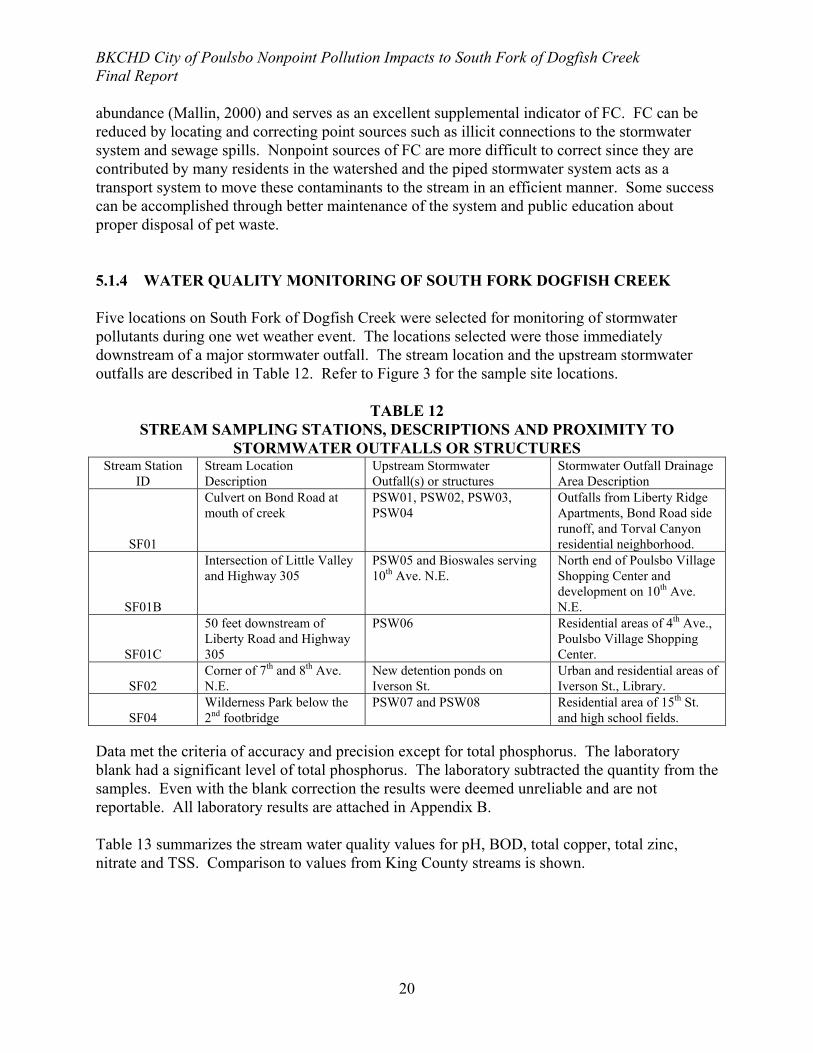
5.1.4 WATER QUALITY MONITORING OF SOUTH FORK DOGFISH CREEK Five locations on South Fork of Dogfish Creek were selected for monitoring of stormwater pollutants during one wet weather event. The locations selected were those immediately downstream of a major stormwater outfall. The stream location and the upstream stormwater outfalls are described in Table 12. Refer to Figure 3 for the sample site locations.
TABLE 12 STREAM SAMPLING STATIONS, DESCRIPTIONS AND PROXIMITY TO
STORMWATER OUTFALLS OR STRUCTURES Stream Station
ID Stream Location Description
Upstream Stormwater Outfall(s) or structures
Stormwater Outfall Drainage Area Description
SF01
Culvert on Bond Road at mouth of creek
PSW01, PSW02, PSW03, PSW04
Outfalls from Liberty Ridge Apartments, Bond Road side runoff, and Torval Canyon residential neighborhood.
SF01B
Intersection of Little Valley and Highway 305
PSW05 and Bioswales serving 10th Ave. N.E.
North end of Poulsbo Village Shopping Center and development on 10th Ave. N.E.
SF01C
50 feet downstream of Liberty Road and Highway 305
PSW06 Residential areas of 4th Ave., Poulsbo Village Shopping Center.
SF02 Corner of 7th and 8th Ave. N.E.
New detention ponds on Iverson St.
Urban and residential areas of Iverson St., Library.
SF04 Wilderness Park below the 2nd footbridge
PSW07 and PSW08 Residential area of 15th St. and high school fields.
Data met the criteria of accuracy and precision except for total phosphorus. The laboratory blank had a significant level of total phosphorus. The laboratory subtracted the quantity from the samples. Even with the blank correction the results were deemed unreliable and are not reportable. All laboratory results are attached in Appendix B. Table 13 summarizes the stream water quality values for pH, BOD, total copper, total zinc, nitrate and TSS. Comparison to values from King County streams is shown.
20

BKCHD City of Poulsbo Nonpoint Pollution Impacts to South Fork of Dogfish Creek Final Report
TABLE 13 WATER QUALITY RESULTS FOR SOUTH FORK DOGFISH CREEK
Parameter BOD Total Copper Total Zinc Nitrate+nitrite TSS pH Unit mg/L ug/L ug/L mg/L mg/L SU SF01 2.9 5 22 0.39 23 7.21 SF01B 3.4 5 21 0.37 14 7.28 SF01C 4.2 <5 13 0.43 7 7.29 SF02 3.6 <5 9 0.46 3 7.33 SF04 3.7 <5 18 0.40 13 7.4 King County streams, 1991 0.70 5.1 7.5 WAC Standard 6.5-8.5
Bold cells denote values greater than comparison.
All TSS values, with the exception of SF02 located at the corner of 7th and 8th Avenue near the Poulsbo Village Shopping Center, were above the comparison value from King County streams. TSS and zinc was highest at the furthest downstream station at Bond Road, which has a great amount of sediment deposition. The high zinc result correlates with the high level of zinc found in stormwater from PSW01 located just upstream of this stream station. It is interesting to note that the lowest levels of zinc and TSS are at the stream stations which are downstream of stormwater detention ponds or bioswales, stations SF01C and SF02. Stormwater detention ponds and bioswales remove 50-70% of these pollutants (Chesapeake Research Consortium, 1997). Nitrate and pH were below or within the normal ranges compared to King County streams. No comparison for BOD was available; however, the values are about three times lower than found in the stormwater samples. Copper levels are found near the detection limit. Table 14 shows the comparison of zinc concentrations in stormwater samples to the state chronic standard.
TABLE 14 COMPARISON OF ZINC CONCENTRATIONS IN SOUTH FORK DOGFISH CREEK
TO WAC 173-201A CHRONIC STANDARD
Sample Site Total Zinc
ug/L Dissolved Zinc ug/L
Chronic Standard
ug/L SF01 23 <6 40 SF01B 21 <6 40 SF01C 13 <6 40 SF02 9 <6 40 SF04 18 <6 36
Dissolved zinc concentrations are below the detection limit. Total zinc concentrations were well below the WAC 173-201A chronic standard at all stations. FC and turbidity were sampled for three events during wet weather and four events during dry weather. Geometric mean average for FC and watershed turbidity criteria were calculated and compared to the state standard or Health District criterion. Figures 9 and 10 displays the FC
21
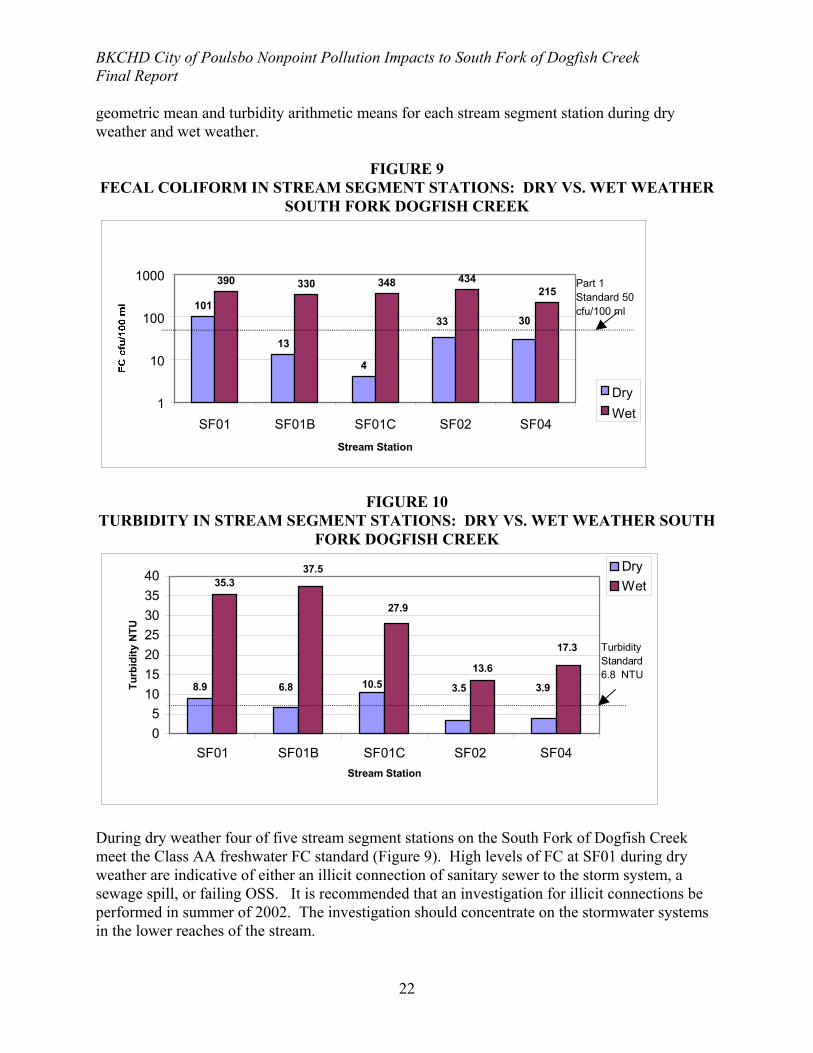
BKCHD City of Poulsbo Nonpoint Pollution Impacts to South Fork of Dogfish Creek Final Report geometric mean and turbidity arithmetic means for each stream segment station during dry weather and wet weather.
FIGURE 9 FECAL COLIFORM IN STREAM SEGMENT STATIONS: DRY VS. WET WEATHER
SOUTH FORK DOGFISH CREEK
101
13
4
390 330 348 434215
33 30
1
10
100
1000
SF01 SF01B SF01C SF02 SF04Stream Station
DryWet
Part 1 Standard 50 cfu/100 ml
FIGURE 10 TURBIDITY IN STREAM SEGMENT STATIONS: DRY VS. WET WEATHER SOUTH
FORK DOGFISH CREEK
8.9
35.3
13.610.5 3.93.56.8
27.9
37.5
17.3
05
10152025303540
SF01 SF01B SF01C SF02 SF04Stream Station
Turb
idity
NTU
DryWet
Turbidity Standard 6.8 NTU
During dry weather four of five stream segment stations on the South Fork of Dogfish Creek meet the Class AA freshwater FC standard (Figure 9). High levels of FC at SF01 during dry weather are indicative of either an illicit connection of sanitary sewer to the storm system, a sewage spill, or failing OSS. It is recommended that an investigation for illicit connections be performed in summer of 2002. The investigation should concentrate on the stormwater systems in the lower reaches of the stream.
22
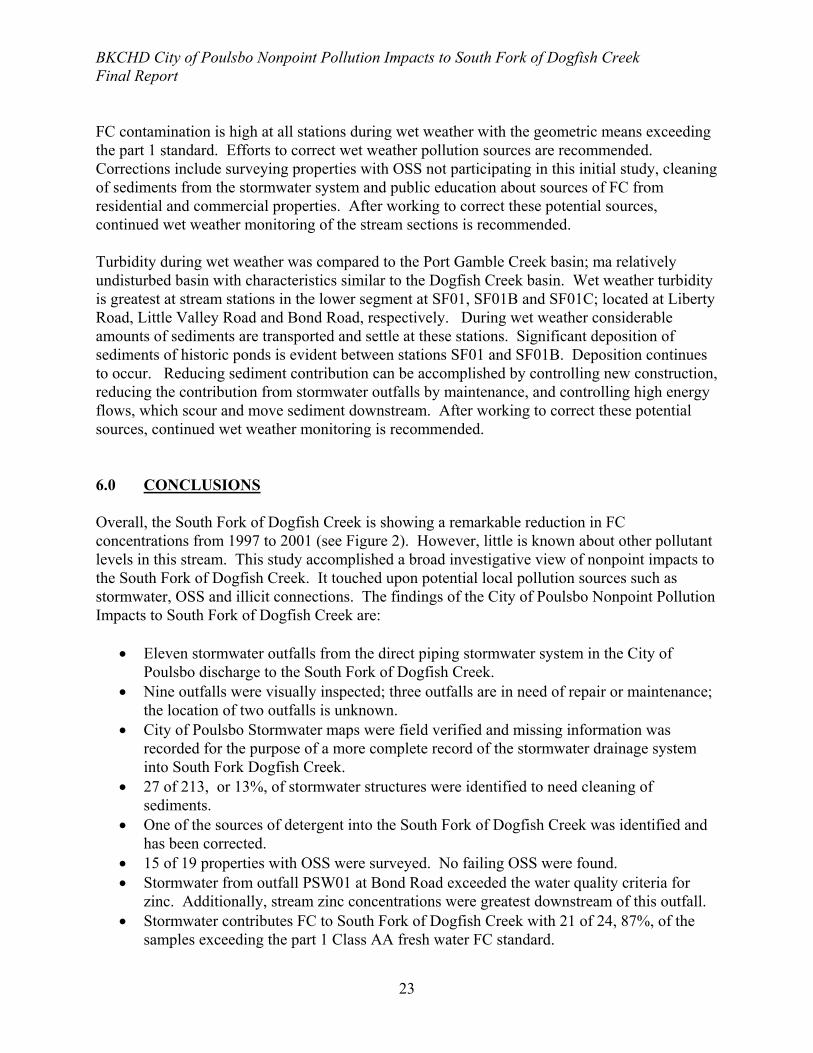
BKCHD City of Poulsbo Nonpoint Pollution Impacts to South Fork of Dogfish Creek Final Report FC contamination is high at all stations during wet weather with the geometric means exceeding the part 1 standard. Efforts to correct wet weather pollution sources are recommended. Corrections include surveying properties with OSS not participating in this initial study, cleaning of sediments from the stormwater system and public education about sources of FC from residential and commercial properties. After working to correct these potential sources, continued wet weather monitoring of the stream sections is recommended. Turbidity during wet weather was compared to the Port Gamble Creek basin; ma relatively undisturbed basin with characteristics similar to the Dogfish Creek basin. Wet weather turbidity is greatest at stream stations in the lower segment at SF01, SF01B and SF01C; located at Liberty Road, Little Valley Road and Bond Road, respectively. During wet weather considerable amounts of sediments are transported and settle at these stations. Significant deposition of sediments of historic ponds is evident between stations SF01 and SF01B. Deposition continues to occur. Reducing sediment contribution can be accomplished by controlling new construction, reducing the contribution from stormwater outfalls by maintenance, and controlling high energy flows, which scour and move sediment downstream. After working to correct these potential sources, continued wet weather monitoring is recommended. 6.0 CONCLUSIONS Overall, the South Fork of Dogfish Creek is showing a remarkable reduction in FC concentrations from 1997 to 2001 (see Figure 2). However, little is known about other pollutant levels in this stream. This study accomplished a broad investigative view of nonpoint impacts to the South Fork of Dogfish Creek. It touched upon potential local pollution sources such as stormwater, OSS and illicit connections. The findings of the City of Poulsbo Nonpoint Pollution Impacts to South Fork of Dogfish Creek are:
• Eleven stormwater outfalls from the direct piping stormwater system in the City of Poulsbo discharge to the South Fork of Dogfish Creek.
• Nine outfalls were visually inspected; three outfalls are in need of repair or maintenance; the location of two outfalls is unknown.
• City of Poulsbo Stormwater maps were field verified and missing information was recorded for the purpose of a more complete record of the stormwater drainage system into South Fork Dogfish Creek.
• 27 of 213, or 13%, of stormwater structures were identified to need cleaning of sediments.
• One of the sources of detergent into the South Fork of Dogfish Creek was identified and has been corrected.
• 15 of 19 properties with OSS were surveyed. No failing OSS were found. • Stormwater from outfall PSW01 at Bond Road exceeded the water quality criteria for
zinc. Additionally, stream zinc concentrations were greatest downstream of this outfall. • Stormwater contributes FC to South Fork of Dogfish Creek with 21 of 24, 87%, of the
samples exceeding the part 1 Class AA fresh water FC standard.
23

BKCHD City of Poulsbo Nonpoint Pollution Impacts to South Fork of Dogfish Creek Final Report
• Stormwater contributes turbidity to South Fork of Dogfish Creek above stream background levels at all outfalls sampled.
• Zinc concentrations were lowest downstream of detention ponds and bioswales. • TSS was highest at the Bond Road stream station. • FC data from the five stream stations showed evidence of dry and wet weather FC
contamination. • Turbidity data from the five stream segment stations showed the greatest wet weather
impacts at the streams’ lower reach at Liberty Road, Little Valley Road and Bond Road.
7.0 RECOMMENDATIONS
Based upon the conclusions of the City of Poulsbo Nonpoint Pollution Impacts to South Fork of Dogfish Creek Study, the Health District recommends the following actions to the City of Poulsbo Public Works Department:
• Establish a maintenance program for the stormwater collection system, • update stormwater drainage maps to show all current stormwater drainage systems, • repair or reconstruct outfalls 974A, 959A and 1016A, • locate and inspect outfalls 750A and 598B, • perform an illicit connection survey of the stormwater system in the South Fork of
Dogfish Creek drainage during the summer of 2002, • perform a public education program to residents of the drainage basin of the South
Fork of Dogfish Creek regarding the impacts of nonpoint sources of pollution from everyday activities with an emphasis on pet waste disposal and car washing.
• implement an inspection program of private stormwater systems and oil/water separators,
• continue a sampling program of the stormwater outfalls and stream stations for total and dissolved zinc, hardness, TSS, FC, TPH, nutrients and turbidity for the purpose of further evaluating water quality impacts, and
• perform a stormwater system inspection of detention ponds and bioswales.
8.0 REFERENCES Bremerton Kitsap County Health District. Water Quality Trend Monitoring Plan, Streams and Marine Waters. April, 2001. Bremerton-Kitsap County Board of Health. Ordinance Number 2000-6, Solid Waste Regulations, August 2, 2000. Bremerton-Kitsap County Health District. Manual of Protocol: Fecal Coliform Bacteria Pollution Identification and Correction Projects, 1999.
24
BKCHD City of Poulsbo Nonpoint Pollution Impacts to South Fork of Dogfish Creek Final Report Bremerton-Kitsap County Board of Health. Ordinance Number 1996-8, Rules and Regulations of the Governing On-site Sewage Disposal. 1996. Bremerton-Kitsap County Health District. Liberty Bay/Miller Bay Watershed Nonpoint Source Pollution Baseline Water quality Assessment. November 1995. Bremerton-Kitsap County Health District. Manual of Protocol for Conducting OSS Sanitary Surveys in Kitsap County, Washington, 1995. Chandler, R.D. Improving Urban Stormwater Runoff Monitoring. Doctor of Philosophy Thesis, University of Washington. 1995. Chesapeake Research Consortium. National Pollutant Removal Performance Database for Stormwater Best Management Practices, August, 1997. Dorn, P. Suquamish Tribe. Personal communication. 2002. KCM. Liberty Bay/Miller Bay Watershed Existing Water Quality Data Summary. November, 1994. King County (formerly Metro). Quality of Local Lakes and Streams 1989-1990. Water Resources Section, Water Pollution Control Department. 1991. Kitsap Public Utility District #1. Rainfall data from Big Valley Rain Gauge. 2002. Mallin, M.A., et al. Effect of Human Development on Bacteriological Water Quality in Coastal Watersheds. Ecological Applications. 10 (4). 2000. Marsalek, J. and Ng, H.Y.F. Evaluation of Pollution Loadings From Urban Nonpoint Sources: Methodology and Applications. J. Great Lakes Res. 15(3). 1989. Pitt, R. et al. Urban Stormwater Toxic Pollutants: Assessment, Sources, and Treatability. Water Environment Research. Vol. 67, No. 3. 1995. Shepp, D.L. Petroleum Hydrocarbon Concentrations Observed in Runoff From Discrete, Urbanized Automotive-Intensive Land Uses. Watershed 96 Proceedings. 1996. U.S. Environmental Protection Agency. Results of the Nationwide Urban Runoff Program Volume I-Final Report. Number PB84-185552. 1983. Washington State Conservation Commission. Draft WRIA 15 (Kitsap County Streams) Salmonid Habitat Limiting Factors., 2000.
25

BKCHD City of Poulsbo Nonpoint Pollution Impacts to South Fork of Dogfish Creek Final Report Washington State Department of Ecology. Stormwater Manual for Western Washington. 2001. Washington State Department of Ecology. Guidelines for Preparing Quality Assurance Project Plans for Environmental Studies. Publication No. 01-03-003. February 2001. Washington State Department of Ecology. Chapter 173-201A of the Washington Administrative Code, Water Quality Standards for Surface Waters of the State of Washington, 1992. Washington State Department of Ecology. State 303(d) List. 1998. Washington State Department of Transportation. Hydraulics Report OL-3420 #98042 SR-305, Poulsbo SCL to Bond Road MP 10.60 to MP 12.82. June, 2000. Washington State Department of Health. 2000 Annual Inventory: Commercial and Recreational Shellfish Areas of Puget Sound. May 2001.
26