doi: 10.15415/jtmge.2017.81002 determinants of offshore ... · pdf fileand bpo. relationship...
TRANSCRIPT

Determinants of Offshore Outsourcing Lo-cations – A Comparison on Voice Based Jobs in
India and Philippines
Abstract
Present study like to examine the variables that are significant, in the selection of offshore outsourcing locations for the voice based jobs in India and Philippines. The study has statistically tested human resources factors, finance factors, national level factors, communication, language, culture, client and service provider relationship, service delivery, organizations credentials and regulatory environment. The study has used descriptive research design, survey questionnaire method and deliberative purposive sampling techniques on the total sample size of 178 top and middle level employees of BPOs and Call centres. Data were analyzed using structure equation modeling, multiple regression, weighted least square method and Path analysis. Results of the study shows, overall affects of above discussed factor variables on the selection of location as Philippines are more than choosing India as preference of location for voice based jobs. Keywords: BPOs, Call centres, India and Philippines.
Subhashish MitraAmit Mittal
Pawan Kumar ChandChitkara Business School, Chitkara University, Punjab, India.
Journal of Technology Management for
Growing Economies Vol. 8, No. 1
April 2017pp. 41-65
©2017 by Chitkara University. All Rights
Reserved.
INTRODUCTIONMajor organizations in the developed world have been outsourcing their operations to developing countries mainly as a cost reduction strategy. India, Philippines, Malaysia, Indonesia, Brazil, Thailand and Mexico have become the priority choice in offshore selection of locations for the outsourcing of voice based jobs in BPOs and Call centres. Managing the services such as call centres, transcription services, medical billing and coding, software development, website design/SEO, data entry services, product information’s under the scope in-bound and out-bound call activities. The business outcomes reveals India as an appealing destination of choice for outsourcing and produce the high cash flow per year, when compared with alternatives destinations of US and South Africa (Kumar et al., 2007). Friedman (2004) noted that about 2.8 million employees in India work in the outsourcing sector, this was almost fifteen years ago. India has healthy earnings of US$10.9 billion from offshore BPO and US$30 billion from IT and total expected in year 2008. But by the year 2011, the Philippines improved upon India to develop into the top call
DOI: 10.15415/jtmge.2017.81002

Mitra, S.Mittal, A.Chand, P. K.
42
Journal of Technology Management for Growing Economies, Volume 8, Number 1, April 2017
center BPO location in the world. In the year 2012, BPO in the Philippines had produced more than $13 billion in revenues, an increase of $2 billion from the gradual of $11 billion in year 2011. The Business Processing Association of the Philippines (BPAP) reveals that revenue of the BPO industry will touch $16 billion in year 2013 and have 926,000 full-time employees. Growth of the call centre industry in the Philippines can be summarize up to the lower operational and labor costs relative to the US, the high proficiency in spoken American-style English and idioms. Both the countries India and Philippines are showing tussle to draw the attention of investors in the service sector.
This study seeks answers to the following research questions: What are those factors that attract the offshore locations as destination for outsourcing of voice based jobs in India and Philippines? Is there a casual relationship among these factor that interpret the cause and effect relationship for the se-lection of offshore location for the outsourcing? Whether BPO companies are delivering any positive effort to influence the skill level of the employees? What significant role does the host country government policies play to attract organizations from the developed world to invest in offshore outsourcing in their country? Whether the outsourcing has influenced the labour market of the developing nation? What are those factors that can be compared as common among the offshore outsourcing locations, India and Philippines? The present study includes determinant variables such as human resources factors, finance factors, national level factors, communication, language, culture, client and service provider relationship, service delivery, organizations credentials and regulatory environment for India and Philipinnes.
Human resources factorHuman resources factor in the present study is concerned to human resources functions like procurement, training, development, education, employee turn-over, competencies associated with human resources outsourcing in the ITES based call centre. IT outsourcing can be operationally explained as subcon-tracting a company’s IT functions to an external vendors Cheon et al., (1995), Lacity and Willcocks (2001), Loh and Venkataraman (1992), Sengupta and Zviran (1997). Similarly, BPO can be illustrated as long-term contracting of a firm’s non-core business activities to an external service provider Romberg (1998).
Finance factorsFinance factors under the scope of present study covers the wage rate, cost of real estate, cost of electric power and utilities, transportation cost, infrastructure cost, tax and regulatory cost involved in selection of location for voice based jobs.
Determinants of Offshore Outsourcing Locations
43
Journal of Technology Management for Growing Economies, Volume 8, Number 1, April 2017
National level factorsNational level factors in the present study means general administration and efforts of India and Philippines over policy framework, legal framework promoting – IT sector, education system, labour market, standard of living of community, political stability, Time zone/distance, supportive local authorities and exposure to western education.
Communication, language and cultureCommunication, language and culture refer to client and customer interaction in the environment of India and Philippines concern to the – IT, Call centers and BPO.
Relationship between client and service providerRelationship in service sector jobs, especially in BPO, call center and IT sector has major role to deliver, when one is looking for the concept of offshore outsourcing of location for voice based jobs. Relationship is the bonding that exists between client and vendor that can be understand under the dimensions like – credibility, reliability, transparency, trust, influential association and trade bodies.
Service deliveryThe US call centres companies involved in outsourcing to service providers with operations in the United States as well as offshore facilities in India, the Philippines, Ireland, Canada, and Mexico, among other countries.
Organization credentialsA credential can be explained as an attestation of academic and professional qualification, competencies, or authority assigned issued to an individual by a third party with a relevant or de facto authority or assumed competence to do so.BPO certification institute (BCI) offer the biggest pan area of the world’s only sort of role regulate credentialing and certification program for BPO employees- on the basis first, most inclusive and only dedicated to BPO human competence master standards (HCMS 3.1) in the world.
Regulatory EnvironmentRegulatory environment in India and Philippines under the scope of this covers regulation of tax incentives, facilities like ICT, bandwith and exposure.
REVIEW OF LITERATUREKleibert (2014) states that outsourcing and offshoring of services to developing countries has opened new opportunities for economic development of countries in the global South. The findings gaze at the possibility for agency

Mitra, S.Mittal, A.Chand, P. K.
44
Journal of Technology Management for Growing Economies, Volume 8, Number 1, April 2017
of local institutional actors in the speculation attraction of business process outsourcing companies. Drawing on practical work from the Philippines, an examination of the process of integrating lower-tier cities into global service production networks is presented. Specifically, the roles of local institutional performer in make possible FDI attraction and strategically coupling local assets with the needs of multinational service corporations were shared. Two distinct cases, the cities of Baguio and Bacolod, show that significant scope for intervention rests with local institutional actors. The findings have proposition for policymaking and research concerned with the latest phase of outsourcing and offshoring in developing countries.
Joshi & Mudigonda (2008) affirms offshoring of services will influence the economic background for the coming decades, and present openings and challenges for individuals, organizations, and countries. Many countries are push around in the global services marketplace to take benefit of the rising opportunities. The success of an organization’s offshoring proposal depends significantly on the selection of a right destination, a wrong choice may result in a failure and impose major costs. The study presents a framework to assess the attractiveness of a target country, which identifies various motivating, inhibiting, and smooth the progress of factors that may influence its attractiveness. The framework is used to examine the future attractiveness of India. The relative attractiveness of other potential competitors for offshoring of services is also discussed. Findings reveals that India is likely to uphold its leading position for a long time in the services sector, and that it is likely to come out as a global center for the delivery of services, related to China’s role in the manufacturing sector.
H1: There is a difference in the evaluation based on selected factors between Philippines and India as a perfect destination for voice based jobs.
RESEARCH METHODOLOGYThe present research study has used descriptive research design. Data were collected using survey research. The sample consisted of 178 middle and top level employees of BPO call centres in India and Philippines managing inbound and outbound calls. 89 subjects each were selected from India and Philippines BPOs to contribute to the total sample size of 178 employees. The sample size is in conjunction with the studies of Israel (1992). Hinkin (1995) noted that item to answer ratios generally ranged as of 1:4 to 1:10 in the literature. It was therefore proposed to adopt 1:4 items to response ratio with around 42 items in the questionnaire.
The employees selected in the research study were designated as Customer service executive (08), Assistant manager (15), Customer service operations

Determinants of Offshore Outsourcing Locations
45
Journal of Technology Management for Growing Economies, Volume 8, Number 1, April 2017
manager(10), General / Operations manager (07), Sr. operations manager (09), Service delivery manager(08), Operations manager(14), Deputy general manager (11), Senior customer service representative CSR (12), Operations team leader(13), Assistant manager(20), Customer service team leader(11), General human resources (HR) manager(15), Sr. human resources (HR) manager (12), Vice president VP (06), Human resources (HR) director (07). Selected officers for the research study were found handling the assignments such as voice process (inbound and outbound), semi voice process or back office support, medical transcription, medical billing, data entry, e-mail support, knowledge process outsourcing, recruitment process outsourcing, education process outsourcing, legal process outsourcing, technical writing, content writing and web designing. The job assignments of the employees selected from the BPO call centers of India and Philippines, were of homogenous in nature. The selected subjects were found in between the age group of 24 to 53 years around 60 percent were less than 35 years in their age. All of them were having length of service in between 2 to 21 years and had good command over spoken English. All respondents were graduates and Post graduates in their academic qualifications.
From India the respondents were selected from locations of captive and third party BPOs located in various Indian cities such as Bangalore, Chennai, Hyderabad, Gurgaon, Mumbai, Pune etc.
From Philippines the subjects were selected from locations of captive and third party BPOs such as Manila, Baguio, Bacolod, Cebu, Clark, Dagupan, Davao, Dumaguete, Lipa , Malolos etc.
To collect primary information, self-administered questionnaire was used. Khan (1993), self-administered questionnaires as data collection methods are economical, does not require interviewer time as well as allows respondents to maintain the mystery and reconsider their responses. While framing self- administered questionnaire on Likerts scale scaling from 1 to 5, very irrelevant ‘1’ to very important ‘5’ for the present research study, Indian and Philippines work conditions were taken care off. The revision of the research questions have been framed for the instruments from research work of previous researchers such as MacCormack et al. (1994), Mazzarol and Choo (2003), McCann et. al (2002), Bhatnaga and Amrik (2005), Naidu et al., (2005), Rajkumar (2013), Joshi and Mudigonda (2008), Farrell (2006) and Kearney (2004).Some of the items were dropped and picked with discussion of experts in internal business. As a whole final questionnaire include 42 items for each respondent of India and Philippines. The instrument designing have been made for the constructs

Mitra, S.Mittal, A.Chand, P. K.
46
Journal of Technology Management for Growing Economies, Volume 8, Number 1, April 2017
such as human resources factor- include 6 items, finance factors-6 items, national level factors-10 items, communication, language and culture-4 items, client and service provider relationship-4 items, service delivery- 3 items, organizations credentials- 5 items and regulatory environment- 4 items to assess the views of respondents in the questionnaire on offshore outsourcing location for BPOs.
RESULTS AND DISCUSSIONSTo reduce the item statements in the survey instrument on locations – Philippines and India into meaningful factors, the principal components analysis was executed with varimax rotation. The consequential factors were recognized using an eigen value greater than one criterion (Hair et al., 2006). Finally, 42 items under 8 constructs were selected for location Philippines and India. The standard factor loadings values, details are mentioned in Table 1 and Table 2.
Measurement modelMeasurement model commonly reports approximation of internal con-sistency reliability (e.g. Cronbach’s alpha) and carry out factor analy-sis, provide some evidence of convergent and discriminant validity. In other words, it is more rigorous tests of construct reliability and valid-ity Bagozzi, (1980), Fornell and Larcker (1981), Garbing and Anderson (1988). For reliability determination of each item was tested through Cronbach’s alpha. Composite reliability (CR) was employed to measure the reliability of the construct in the measurement model. Convergent va-lidity was calculated using standardized factor loading of the construct.
To develop the measurement model, a confirmatory factor analysis (CFA) using AMOS 18.0 has been done keeping in consideration that it is necessary to test whether the measurement model has a acceptable level of validity and reliability before testing for a significant interrelationship within the structural model Fornell and Larcker (1981) and Ifinedo (2006).
Measurement model of factors affecting location Philippines; constructs ‘human resources factor’, ‘finance factors,’ ‘national level factors’, ‘communication, language, culture,’ ‘client and service provider relationship’, ‘service delivery’, ‘organizations credentials’ and ‘regulatory environment’ are indicated by six, six, ten, four, four, three, five and four indicators items respectively in Figure 1 thus eight constructs were measured by 42 measured indicator variables (HR1 – RE1)

Determinants of Offshore Outsourcing Locations
47
Journal of Technology Management for Growing Economies, Volume 8, Number 1, April 2017
Figure 1: Measurement model, CFA of construct location Philippines : HR-human resources factor, FIN-finance factors, NLF- national level factors, CLC-communication, language, culture, CS-client and service provider
relationship, SD-service delivery, OC- organizations credentials and RE- regulatory environment contributing to selection of location.
Figure 1 shows the confirmatory factor analyses CFA of location Philippines and analyse the issue of uni-dimensionality, the limit to which the measured variable of construct belong to one single construct.CFA helped to identify the number of factors essential in the items and which measured variable is associated to which latent variable. CFA models assumed that linear regression and correlation relationship existed among the constructs. CFA as a statistical technique analyse the construct validity both convergent as well as discriminant validity considering dimensions of the construct together.
The properties of the measurement model, CFA of Philippines in terms of reliability, convergent validity and discriminant validity are described in Table 1.

Mitra, S.Mittal, A.Chand, P. K.
48
Journal of Technology Management for Growing Economies, Volume 8, Number 1, April 2017
Table 1: Overall reliability of the construct location –Philippines
Construct Indica-tors AVE MSV ASV CR
Factor Load-
ing
CronbachAlpha
Human Re-sources Factor
Item 1Item 2Item 3Item 4Item 5Item 6
0.763 0.052 0.042 0.867
.741
.706
.761
.764
.705
.6590.866
Finance Fac-tors
Item 1Item 2Item 3Item 4Item 5Item 6
0.654 0.032 0.021 0.874
.732
.773
.784
.741
.702
.6550.872
National Level Factors
Item 1Item 2Item 3Item 4Item 5Item 6Item 7Item 8Item 9Item 10
0.745 0.056 0.043 0.939
.697
.718
.759
.769
.813
.798
.762
.803
.798
.791
0.936
Communica-tion, Language,
Culture
Item 1Item 2Item 3Item 4
0.678 0.043 0.034 0.848
.684
.780
.818
.7700.843

Determinants of Offshore Outsourcing Locations
49
Journal of Technology Management for Growing Economies, Volume 8, Number 1, April 2017
Construct Indica-tors AVE MSV ASV CR
Factor Load-
ing
CronbachAlpha
Client and Ser-vice provider
Item 1Item 2Item 3Item 4
0.721 0.076 0.062 0.896
.811
.865
.863
.7830.894
Service Deliv-ery
Item 1Item 2Item 3
0.672 0.056 0.021 0.824
.836
.838
.6810.821
Organizations Credentials
Item 1Item 2Item 3Item 4Item 5
0.731 0.062 0.032 0.859
.681
.799
.779
.732
.7210.859
Regulatory Environment
Item 1Item 2Item 3Item 4
0.693 0.071 0.052 0.889
.794
.834
.849
.8210.888
Note: MSV - maximum shared variance, CR - composite reliability, ASV -average shared variance, and AVE - average variance extracted
For reliability purpose internal consistency was considered, which is a measure of reliability of different questionnaire items proposed to measure the same characteristics. The indicator used to evaluate internal consistency was Cronbach’s α, calculated from the pair wise correlation linking items which range between 0 and 1.
The Cronbach’s α score was calculated for each constructs location Philippines-‘human resources factor’, ‘finance factors,’ ‘national level factors’, ‘communication, language, culture,’ ‘client and service provider relationship’, ‘service delivery’, ‘organizations credentials’ and ‘regulatory environment’ to calculate the internal consistency. Table 1 shows that reliability of each construct was examined through Cronbach’s α. A value of the Cronbach’s α for construct ‘human resources factor’ was 0.866, ‘finance factors’ was 0.872

Mitra, S.Mittal, A.Chand, P. K.
50
Journal of Technology Management for Growing Economies, Volume 8, Number 1, April 2017
, ‘national level factors’ was 0.936, ‘communication, language, culture’ was 0.843 , ‘client and service provider relationship’ was 0.894, ‘service delivery’ was 0.821, ‘organizations credentials’ was 0.859 and ‘regulatory environment’ was 0.888. Therefore we can say that all the constructs obtained a good level of reliability. Thus, these measures can be used for SEM analysis.
Table 1 reports the composite reliability of ‘human resources factor’ 0.867, ‘finance factors’ 0.874 , ‘national level factors’ 0.939, ‘communication, language, culture’ 0.848 , ‘client and service provider relationship’ 0.896, ‘service delivery’ 0.824, ‘organizations credentials’ 0.859 and ‘regulatory environment’ 0.889. So we can end that composite reliability of the construct location Philippines in measurement model were higher than 0.70. Therefore, every constructs of location Philippines in the measurement model shows fine reliability
Convergent validity is computed using standardized factor loadings. The impact of standardized regression weight or standardized factor loading estimates, shows that the indicator variables are considerable and representative of their hidden variable. All constructs’ indicator loadings be significant. Their standardized estimates extend from 0.681 to 0.865 for the location Philippines, Table 1 Item statement no.2 of the sub-construct ‘client and service provider’ with highest factor loading 0.865, ‘standards’ shows an indication of acceptance of highest convergent validity in construct location Philippines. on the basis high construct reliabilities and significant loadings, we assured that our model has convergent validity. The average variance extracted (AVE) values were found at above 0.5. Therefore, these results made us certain about the being of convergent validity. Hence these results found standard with the findings of Hair et al., (2010).
Discriminant validity explains the extent to which a construct is in fact distinct from other constructs Hair et al., (2010) MSV<AVE and ASV<AVE. It succeeds if the average variance extracted (AVE) value of every construct becomes bigger than the square of its correlation coefficient by other constructs Fornell & Larcker (1981).
Location Philippines signified a good model fit with the values such as: χ2
/ df= 1.72, CFI= 0.873, GFI= 0.743, AGFI=0.803, NFI= 0.847and RMSEA= 0.04. Values further than 0.9 for GFI, AGFI, and NFI indicate an outstanding model fit. Values below 0.05 for RMSEA signify an excellent fit for the model while values within 0.06 and 0.08 MacCallum et al, (1996) indicate an

Determinants of Offshore Outsourcing Locations
51
Journal of Technology Management for Growing Economies, Volume 8, Number 1, April 2017
acceptable fit. The on the whole indicators showed that model was a good fit with NFI, CFI, GFI, AGFI and RMSEA in the acceptable limits as illustrated by the preceding research Li et al. (2006), Chong et al. (2011).
Measurement model of factor affecting location India construct ‘human resources factor’, ‘finance factors,’ ‘national level factors’, ‘communication, language, culture,’ ‘client and service provider relationship’, ‘service delivery’, ‘organizations credentials’ and ‘regulatory environment’ are indicated by six, six, ten, four, four, three, five and four indicators items respectively in Figure 2 thus eight constructs were measured by 42 measured indicator variables (HR1 – RE1)
Figure 2 : Measurement model, CFA of construct location India : HR-human resources factor, FIN-finance factors, NLF- national level factors, CLC-com-
munication, language, culture, CS-client and service provider relationship, SD-service delivery, OC- organizations credentials and RE- regulatory envi-
ronment contributing to selection of locationTable 2: Overall reliability of the construct location – India
Construct Indica-tors
AVE MSV ASV CR Factor Loading
CronbachAlpha
Human Resources Factor
Item 1Item 2Item 3Item 4Item 5Item 6
0.783 0.210 0.087 0.873
.752
.695
.720
.783
.706
.728
0.871

Mitra, S.Mittal, A.Chand, P. K.
52
Journal of Technology Management for Growing Economies, Volume 8, Number 1, April 2017
Construct Indica-tors
AVE MSV ASV CR Factor Loading
CronbachAlpha
Finance Factor
Item 1Item 2Item 3Item 4Item 5Item 6
0.680 0.080 0.041 0.889
.753
.747
.757
.825
.754
.714
0.888
National Level Factors
Item 1Item 2Item 3Item 4Item 5Item 6Item 7Item 8Item 9Item 10
0.781 0.034 0.063 0.924
.677
.676
.719
.771
.824
.767
.786
.745
.735
.736
0.924
Commu-nication, Language, Culture
Item 1Item 2Item 3Item 4
0.678 0.291 0.345 0.852.807.887.733.658
0.850
Client and Service provider
Item 1Item 2Item 3Item 4
0.676 0.353 0.015 0.876.806.826.824.747
0.874
Service Delivery
Item 1Item 2Item 3
0.634 0.262 0.016 0.784.821.801.692
0.780
Organi-zations Credentials
Item 1Item 2Item 3Item 4Item 5
0.693 0.273 0.063 0.838
.658
.771
.749
.715
.687
0.838
Regulatory Environ-ment
Item1Item 2Item 3Item 4
0.762 0.042 0.015 0.882.763.808.812.850
0.879
Note: AVE - average variance extracted, CR - composite reliability, MSV - maxi-mum shared variance, ASV -average shared variance

Determinants of Offshore Outsourcing Locations
53
Journal of Technology Management for Growing Economies, Volume 8, Number 1, April 2017
The properties of the measurement model of construct location India in requisites of reliability, convergent validity and discriminant validity are explained in Table 2.
The Cronbach’s alpha score was calculated for each construct of location India -‘human resources factor’, ‘finance factors,’ ‘national level factors’, ‘communication, language, culture,’ ‘client and service provider relationship’, ‘service delivery’, ‘organizations credentials’ and ‘regulatory environment’ to assess the internal consistency. Table 2 explains the reliability of each construct was checked through Cron-bach’s alpha. Therefore, it can be stated that all constructs obtained a good level of reliability as Cronbach’s alpha for the construct ‘human resources factor’ was 0.871, ‘finance factors’ was 0.888 , ‘national lev-el factors’ was 0.924, ‘communication, language, culture’ was 0.850, ‘client and service provider relationship’ was 0.874, ‘service delivery’ was 0.780, ‘organizations credentials’ was 0.838 and ‘regulatory envi-ronment’ was 0.879.
Convergent validity is considered employing standardized factor loadings. The impact of standard regression weight (standardized fac-tor loading) estimates shows that the indicator variables are significant and representative of their latent variable. The factor loading of every observed variables in Table 2 range from 0.658 to 0.887. This clearly indicates that observed variables or items were ample and correspond to their constructs so we can confirm the construct location India has convergent validity.
Hair et. al (2010) recommends Convergent validity: CR>.7, CR>AVE, AVE>.5, Discriminant validity: MSV<AVE and ASV<AVE. Construct location India meets with the standards of convergent valid-ity and discriminant validity as shown in Table 2 as AVE is more than MSV and AVE . The outcomes of the CFA of construct location India signified a goodness of fit value such as: χ2 / df= 1.64, CFI= 0.808, GFI= 0.841, AGFI=0.790, NFI= 0.730 and RMSEA= 0.05. Therefore, we can say that overall showed that model a good fit in the acceptable limits.
Structural ModelThe structural equation model was tested to understand the relationship be-tween the constructs. The structural equation model explains the potential causal dependencies between endogenous and exogenous variables.
H1: There is a difference in the evaluation based on selected factors

Mitra, S.Mittal, A.Chand, P. K.
54
Journal of Technology Management for Growing Economies, Volume 8, Number 1, April 2017
between Philippines and India as a perfect destination for voice based jobs.To carry out the structure equation modeling on the choice of selection of
location for BPOs and call centre as Philippines and India previous research statistical techniques of Masood (2007) and Rajkumar (2013) are followed. Figure 3 shows the structural model as path analysis diagram for selection of Philippines with weighted least square, SEM and path analysis.
The method of least squares is a standard move toward in regression analysis to the estimated solution of over determined systems, i.e. sets of equations in which there are extra equations than unknowns. ‘Least squares’ states that the overall solution minimizes, the sum of the squares of the residuals made in the outcomes of every single equation.
Philippines
SLOPHP = f {HR, FIN, NLF, CLC, CS, SD, OC, RE, PRE}
HR= β11 HR1 + β12 HR2 + β13 HR3 + β14 HR4 + β15 HR5 + β16 HR6 + ℮1
FIN= β21 FIN1 + β22 FIN2 + β23 FIN3+ β24 FIN4+β25 FIN5 + β26 FIN6 + ℮2
NLF= β31 NLF1 + β32 NLF2 + β33 NLF3 + β34 NLF4 + β35 NLF5 + β36 NLF6 +β37 NLF7 + β38 NLF8 + +β39 NLF9 + β40 NLF10 +℮3
CLC = β41 CLC1 + β42 CLC2 + β43 CLC3 + β44 CLC4 +℮4
CS = β51 CS1 + β52 CS2 + β53 CS3 + β54 CS4 + ℮5
SD = β61 SD1 + β62 SD2 + β63 SD3 +℮6
OC = β71 OC1 + β72 OC2 + β73 OC3 + β74 OC4 + β75 OC5 +℮7
RE = β81 RE1 + β82 RE2 + β83 RE3 + β84 RE4 +℮8
PRE = β91 HR + β92 FIN + β93 NLF + β94 CLC + β95 CS + β96 SD + Β97 OC + β98 RE +℮9
SLOPHP= β101 PRE + ℮10
Where,
SLOPHP- Selection of location Philippines, HR-human resources factor, FIN-finance factors, NLF- national level factors, CLC-communication, language, culture, CS-client and service provider relationship, SD-service delivery, OC- organizations credentials and RE- regulatory environment , PRE- Preference of location.

Determinants of Offshore Outsourcing Locations
55
Journal of Technology Management for Growing Economies, Volume 8, Number 1, April 2017
Figure 3: Path diagram of structural model for selection of location - Philip-pines
Note: SLOPHP- Selection of location Philippines, HR-human resources factor, FIN-fi-nance factors, NLF- national level factors, CLC-communication, language, culture, CS-client and service provider relationship, SD-service delivery, OC- organizations credentials and RE- regulatory environment , PRE- Preference of location.
Figure 3 explain the formulation of the constructs and the subjective affects of the constructs in the form of a path model. The path analysis diagram explains the measurement model, which contains two latent constructs: preference for locations and selection of location. The first exogenous construct ‘preference for location’ was created based on eight input and the following endogenous input such as ‘human resources factor’, ‘finance factors,’ ‘national level factors’, ‘communication, language, culture,’ ‘client and service provider relationship’, ‘service delivery’, ‘organizations credentials’ and ‘regulatory environment’ for Philippines.
Weight of these eight endogenous constructs on the ‘preference for location’ varies with dissimilar magnitudes as shown in Table- 3 and the structural equation model comprises eight equations. The individual equation consists of the particular elements of the constructs. The second exogenous construct ‘selection of location’ was created by the exogenous construct ‘preference for location’.
The output of the SEM includes matrices of the estimated (Table 3) rela-tionship between the variables in the model.
Mitra, S.Mittal, A.Chand, P. K.
56
Journal of Technology Management for Growing Economies, Volume 8, Number 1, April 2017
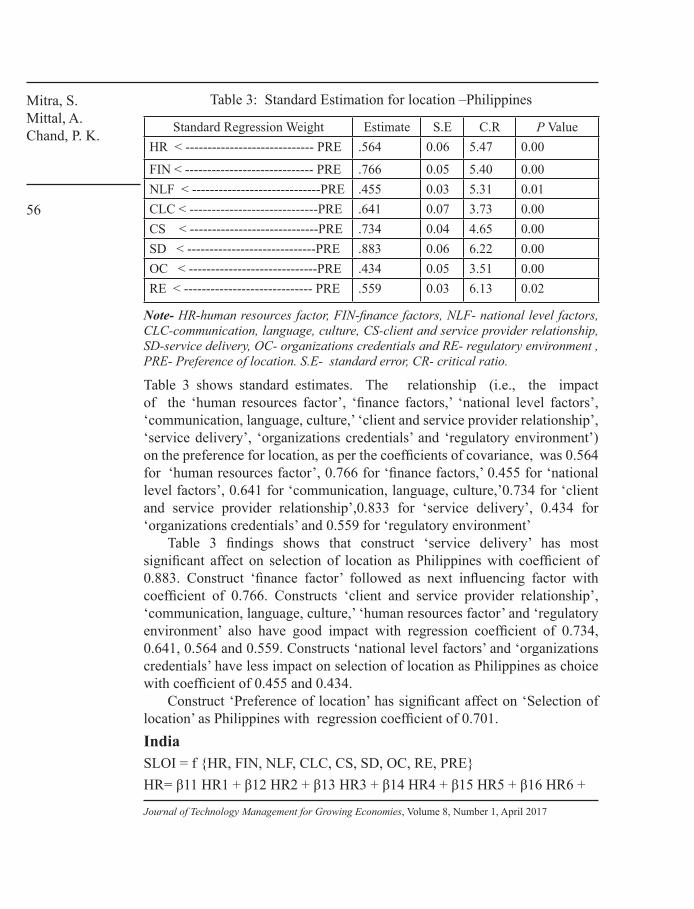
Table 3: Standard Estimation for location –Philippines
Standard Regression Weight Estimate S.E C.R P ValueHR < ----------------------------- PRE .564 0.06 5.47 0.00
FIN < ----------------------------- PRE .766 0.05 5.40 0.00NLF < -----------------------------PRE .455 0.03 5.31 0.01CLC < -----------------------------PRE .641 0.07 3.73 0.00CS < -----------------------------PRE .734 0.04 4.65 0.00SD < -----------------------------PRE .883 0.06 6.22 0.00OC < -----------------------------PRE .434 0.05 3.51 0.00RE < ----------------------------- PRE .559 0.03 6.13 0.02
Note- HR-human resources factor, FIN-finance factors, NLF- national level factors, CLC-communication, language, culture, CS-client and service provider relationship, SD-service delivery, OC- organizations credentials and RE- regulatory environment , PRE- Preference of location. S.E- standard error, CR- critical ratio.
Table 3 shows standard estimates. The relationship (i.e., the impact of the ‘human resources factor’, ‘finance factors,’ ‘national level factors’, ‘communication, language, culture,’ ‘client and service provider relationship’, ‘service delivery’, ‘organizations credentials’ and ‘regulatory environment’) on the preference for location, as per the coefficients of covariance, was 0.564 for ‘human resources factor’, 0.766 for ‘finance factors,’ 0.455 for ‘national level factors’, 0.641 for ‘communication, language, culture,’0.734 for ‘client and service provider relationship’,0.833 for ‘service delivery’, 0.434 for ‘organizations credentials’ and 0.559 for ‘regulatory environment’
Table 3 findings shows that construct ‘service delivery’ has most significant affect on selection of location as Philippines with coefficient of 0.883. Construct ‘finance factor’ followed as next influencing factor with coefficient of 0.766. Constructs ‘client and service provider relationship’, ‘communication, language, culture,’ ‘human resources factor’ and ‘regulatory environment’ also have good impact with regression coefficient of 0.734, 0.641, 0.564 and 0.559. Constructs ‘national level factors’ and ‘organizations credentials’ have less impact on selection of location as Philippines as choice with coefficient of 0.455 and 0.434.
Construct ‘Preference of location’ has significant affect on ‘Selection of location’ as Philippines with regression coefficient of 0.701.IndiaSLOI = f {HR, FIN, NLF, CLC, CS, SD, OC, RE, PRE}HR= β11 HR1 + β12 HR2 + β13 HR3 + β14 HR4 + β15 HR5 + β16 HR6 +

Determinants of Offshore Outsourcing Locations
57
Journal of Technology Management for Growing Economies, Volume 8, Number 1, April 2017
℮1FIN= β21 FIN1 + β22 FIN2 + β23 FIN3+ β24 FIN4+β25 FIN5 + β26 FIN6 + ℮2NLF= β31 NLF1 + β32 NLF2 + β33 NLF3 + β34 NLF4 + β35 NLF5 + β36 NLF6 +β37 NLF7 + β38 NLF8 + +β39 NLF9 + β40 NLF10 +℮3CLC = β41 CLC1 + β42 CLC2 + β43 CLC3 + β44 CLC4 +℮4CS = β51 CS1 + β52 CS2 + β53 CS3 + β54 CS4 + ℮5SD = β61 SD1 + β62 SD2 + β63 SD3 +℮6OC = β71 OC1 + β72 OC2 + β73 OC3 + β74 OC4 + β75 OC5 +℮7RE = β81 RE1 + β82 RE2 + β83 RE3 + β84 RE4 +℮8PRE = β91 HR + β92 FIN + β93 NLF + β94 CLC + β95 CS + β96 SD + Β97 OC + β98 RE +℮9SLOI= β101 PRE + ℮10Where,SLOI- Selection of location India, HR-human resources factor, FIN-finance factors, NLF- national level factors, CLC-communication, language, culture, CS-client and service provider relationship, SD-service delivery, OC- organizations credentials and RE- regulatory environment , PRE- Preference of location.
Figure 4: Path diagram of structural model for selection of location - IndiaNote: SLOI- Selection of location India, HR-human resources factor, FIN-finance factors, NLF- national level factors, CLC-communication, language, culture, CS-cli-ent and service provider relationship, SD-service delivery, OC- organizations creden-tials and RE- regulatory environment , PRE- Preference of location.

Mitra, S.Mittal, A.Chand, P. K.
58
Journal of Technology Management for Growing Economies, Volume 8, Number 1, April 2017
Figure 4 shows the formulation of the constructs and the subjective impact of the constructs in the form of a path model. The path analysis illustration explains the measurement model, which include of two latent constructs: preference for locations and selection of location. The first exogenous construct ‘preference for location’ was created based on eight inputs and the following endogenous inputs such as ‘human resources factor’, ‘finance factors,’ ‘national level factors’, ‘communication, language, culture,’ ‘client and service provider relationship’, ‘service delivery’, ‘organizations credentials’ and ‘regulatory environment’ for India. Influence of these eight endogenous constructs on the ‘preference for location’ varies with different magnitudes as shown in Table 4 and the structural equation model comprises e igh t equations. The individual equation consists of the respective elements of the constructs. The second exogenous construct ‘selection of location’ was produced by the construct exogenous ‘preference for location’.
Table 4: Standard Estimation for location –India
Standard Regression Weight Estimate S.E C.R P ValueHR < ----------------------------- PRE .604 0.05 4.24 0.00FIN < ----------------------------- PRE .805 0.06 4.24 0.00NLF < -----------------------------PRE .435 0.03 3.73 0.00CLC < -----------------------------PRE .421 0.04 4.89 0.02CS < -----------------------------PRE .686 0.07 6.35 0.00SD < -----------------------------PRE .816 0.03 4.65 0.00OC < -----------------------------PRE .411 0.05 4.89 0.00RE < ----------------------------- PRE .581 0.07 4.31 0.00
Note- HR-human resources factor, FIN-finance factors, NLF- national level factors, CLC-communication, language, culture, CS-client and service provider relationship, SD-service delivery, OC- organizations credentials and RE- regulatory environment , PRE- Preference of location. S.E- standard error, CR- critical ratio.
The two-stage approach was employed in the structural equation model, where a measurement model that consist of the latent construct ‘preference for location’ was evaluated first, followed by a structural model that measures the construct ‘selection of location’. The model confirms causal dependencies between the endogenous and exogenous variables. The relationship and dependency facilitate in calculating the influence of the individual elements in the determination of location selection.
The parameter is the value of interest, which is the regression coefficient between the exogenous and the endogenous variables or the factor loading

Determinants of Offshore Outsourcing Locations
59
Journal of Technology Management for Growing Economies, Volume 8, Number 1, April 2017
(regression coefficient between the indicator and its factor). Table 4 show the standard estimates. The relationship (i.e., the impact of the ‘human resources factor’, ‘finance factors,’ ‘national level factors’, ‘communication, language, culture,’ ‘client and service provider relationship’, ‘service delivery’, ‘organizations credentials’ and ‘regulatory environment’) on the preference for location, as per the coefficients of covariance, are 0.604 for ‘human resources factor’, 0.805 for ‘finance factors,’ 0.435 for ‘national level factors’, 0.421 for ‘communication, language, culture,’0.686 for ‘client and service provider relationship’,0.816 for ‘service delivery’, 0.411 for ‘organizations credentials’ and 0.581 for ‘regulatory environment’
Table 4 findings shows that construct ‘service delivery’ has most significant affect on selection of location as India with coefficient of 0.816. Construct ‘finance factor’ followed as next influencing factor with coefficient of 0.805. Constructs ‘client and service provider relationship’, ‘human resources factor’ and ‘regulatory environment’ also have good impact with coefficient of 0.686, 0.604 and 0.581. Constructs ‘national level factors’, ‘communication, language, culture,’ and ‘organizations credentials’ have less impact on selection of location as India as choice with coefficient of 0.435 ,0.421 and 0.411.
Construct Preference of location has significant affect on Selection of location as India with regression coefficient of 0.642.
Table 5: Comparison standard estimation of regression coefficient between the locations Philippines and India.
Standard Regression Weight Regression Coefficient- Philippines
Regression Coeffi-cient- India
Comparison
HR < ----------------------------- PRE .564 .604 PHP < INDFIN < ----------------------------- PRE .766 .805 PHP < INDNLF < -----------------------------PRE .455 .435 PHP > INDCLC < -----------------------------PRE .641 .421 PHP > INDCS < -----------------------------PRE .734 .686 PHP > INDSD < -----------------------------PRE .883 .816 PHP > INDOC < -----------------------------PRE .434 .411 PHP > INDRE < ----------------------------- PRE .559 .581 PHP < IND
Note- HR-human resources factor, FIN-finance factors, NLF- national level factors, CLC-communication, language, culture, CS-client and service provider relationship, SD-service delivery, OC- organizations credentials and RE- regulatory environment , PRE- Preference of location., PHP- Philippines, IND- India

Mitra, S.Mittal, A.Chand, P. K.
60
Journal of Technology Management for Growing Economies, Volume 8, Number 1, April 2017
Call centers are the integral part of IT enabled service and BPOs hold the host of activities such as credit preparation of invoices, payrolls, card enquiries, cheques, reconciliation of daily accounts, processing applications, medical transcriptions, billing and collections, product enquiries Babu (2004) states under the scope of inbound and outbound services. Selection of offshore location for outsourcing the BPOs and call center jobs has become ideal area of interest for the investors such UK , US, Poland, Bulgaria and Ukraine etc due to cost reduction strategies and availability of necessary resources with the host country. Present study has examined variables such as human resources factor, finance factors, national level factors, communication, language, culture, client and service provider relationship, service delivery, organizations credentials and regulatory environment as determinants towards the selection of location as Philippines and India.
Regression coefficient value of location Philippines in Figure 3 as .0701 and Regression coefficient value of location India in Figure 4 as .642 shows that the overall affect of Philippines on selection of location for BPOs and call center is more than the selection of location as India for the voice based jobs. The results are supported by (Dossani 2005) developing nations, India and Philippines have become the major centres to attract the information technology sectors or other service sectors and considered to deliver an important role in the international trade and thus offshoring. David Ricardo (2006) theory states that comparative benefit is a specialty technique used to make more efficient production and explains opportunity cost between producers with perfect competition and undistorted markets, countries be apt to export goods in which they have a relative benefit.
Tholons, a US-based tactical advice-giving organization for global outsourcing and investments has placed the Philippines capital Manila number 3, lifting it 1 mark to beat off India’s New Delhi from number 3 position in year 2012 to number 4 in year 2013 due to highly competent and educated work force and high ability in spoken English. Zhang and Markuson (1999) stressed the significance of the ease of access of skilled labor in the host country for FDI inflows. Porter (1990) reflect on the competitiveness of a country as a function of four major determinants: demand conditions, factor conditions, firm strategy, related supporting industries, structure, and rivalry.
Table 5 shows the comparison of both offshore outsourcing location Philippines and India for voice based jobs. The results of the present research study reveals Philippines is ahead from India in the following factors such as service delivery, client and service provider relationship, communication, language, culture, national level factors and organization credentials. These

Determinants of Offshore Outsourcing Locations
61
Journal of Technology Management for Growing Economies, Volume 8, Number 1, April 2017
factor variables are the major emerging antecedents appears in the research study towards the location Philippines.
According to a review carried out by the U.S.A based Meta group, Philippines was placed in the ranking as the fourth country among Asian countries on the foundation of labor quality and is positioned the number one in stipulations of availability of knowledge-based jobs and workers worldwide. Low cost and high skills are accessible by the islands and they share a language and legal system with the U.S. At present the outsourcing sector make use of more than 200,0,00 people and that is still way behind India’s 750,000, but Manila is coming up fast (http://www.123Employee.com).
For outsourcing sector, the Philippines government has continued to focus on developing human capital through education and training to maintain a balanced supply of talent. The outsourcing industry by business process association of Philippines is expected to create a US$11 billion market and about 900,000 people to be employed in the year 2010. Filipinos are accepted as number one of the world leading source of IT professionals outside of the US. Filipino programmers are well considered for their creative technical knowledge, design-skills and smoothness in English and are also very well recognized to be hardworking and service-oriented. Philippines hold great assurance in the customer service industry. Although India does charge lower price than the Philippines for data encoding work, India charges around $4 (U.S.) and $6 in the Philippines, but most of the multinationals are choosing the Philippines because of the towering quality of work.
Philippines standard of living will ascertain the best of sea, sun, sand and style in the tropical setting teeming with the finest of western amenities. It is also the second home to travelers, who take pleasure in the company of the warmest people in the region, the country’s openness to distinct cultures and also a rising desire to have a global outlook.
The economic and trade integration with ASEAN free trade agreement has firmed, Philippines had become the most strategic location for firms that want right to use to the large ASEAN market by providing vast trade opportunities.
Table 5 also shows that India dominates over Philippines in the factors such as human resources factors, finance factors and regulatory environment. Rest other factors as service delivery, client and service provider relationship, communication, language, culture, national level factors and organization credentials are also significant but there significance is less in value as compare to Philippines. However, Kearney’s (2016) Global Services Location Index (GSLI) placed India as number one out of the total 55 countries explored in three categories- people skills, financial attractiveness and availability, and
Mitra, S.Mittal, A.Chand, P. K.
62
Journal of Technology Management for Growing Economies, Volume 8, Number 1, April 2017
business environment. Placed, Philippines at the seventh place (http://www.prnewswire.com). The findings of the present study on India with respect to human resources factors, finance factors and regulatory environment meet the findings of research of Kearney’s (2016) in terms of human resources factors, finance factors and regulatory environment. The present research study have emphasized more on determinants side.
Human resources factors has competitive advantage in India 20,000 graduates produce every year Rao and Varghese (2009) speak the English at ease and can be developed to core competencies of the firm ( Prahalad and Hamel, 1990). Financial factors such as wage rate, cost of real estate, cost of electric power and utilities, transportation cost, infrastructure cost, tax and regulatory cost are inexpensive in India. India has certainly competitive advantage. However, countries like South African, Latin American, Philippines, and East European states are up-and-coming but catching up fast (D’Cruz and Noronha, 2008). Regulatory environment in India are very much supported by Indian government. Indian outsourcing organizations have productively adopted SEI-CMM Capability Maturity Model, ISO, Total Quality Management (TQM), Six Sigma Quality and COPC. Further, with stress on a secured environment, Indian BPOs are adopting standards such as BS 7799, COBIT, ISO 17799 and ITSM. The government make available a more conducive regulatory environment for global corporations with incentives like the ten-year tax holiday and rebates in custom duties Budhwar et. al., (2006). India has already realized Bill Gates‘ prediction in 1999 of India possible to become the next software superpower Ghemawat (2001). IT-BPO industry was highlighted in 2008 through actions such as the Income Tax act amendment, addition of tax incentives by a year, removal of the SEZ Act variances and the beginning of progressive telecom policies that focus on work from home NASSCOM (2009).
Both the countries Philippines and India found competent in drawing the attention of world towards location attractiveness. The findings of the present research study has highlighted the emerging determinants for BPOs and Call centers- IT industry.
CONCLUSIONOutsourcing at offshore locations is become one of substantial area of interest for the business organizations, specially the service industry such as BPOs and call centres for cost reductions and quality service delivery. In the present research study the factors such as human resources factor, finance factors, national level factors, communication, language, culture, client and service provider relationship, service delivery, organizations credentials and regulatory

Determinants of Offshore Outsourcing Locations
63
Journal of Technology Management for Growing Economies, Volume 8, Number 1, April 2017
environment that affects the decision of offshore outsourcing locations were examined for India and Philippines BPOs and call centre. It was found both the country has potentials to attract the investors but, Philippines is ahead from India in its subjective impact to affect the selection of location as the destination for outsourcing.
PRACTICAL IMPLICATIONS First, the study will be helpful for the investors of multi- national companies of various sectors such as IT and manufacturing etc. to significantly examine the aspects that affect the decision of choice of outsourcing their products from offshore locations. Second, the study will be conducive in knowing the key result area of particular nation in service or other sectors.
FUTURE SCOPE OF RESEARCHFuture scope of research, give the line of direction to the researchers, is to test the model on more countries with a larger sample size covering other services, manufacturing, automobiles or other industries to gain new insights and add new knowledge to the existing literature.
REFERENCESAthreye, S. (2005). The Indian software industry, in Arora and Gambardella (ed.), From
Underdogs to Tigers, Oxford University Press: Oxford. http://doi.org/10.3386/w16167.Babu, R (2004).Cyber Coolies in BPO: Insecurities and Vulnerabilities of Non Standard Work,
Economic and Political Weekly, Vol. 39, No. 5, pp. 492–497.Bagozzi, R. (1980). Causal models in marketing. New York: Wiley. http://doi.org/10.1002/ 9781118785317.weom090037Bentler, P. M. (1990). Comparative fit indexes in structural models. Psychological Bulletin, 107,
238-246.Bhatnaga, R., & Amrik, S. S. (2005). Supply chain competitiveness: Measuring the impact
of location factors, uncertainty and manufacturing practices. Technovation, 25, 443–456. http://doi.org/10.1016/j.technovation.2003.09.012.
Budhwar, P., Varma, A., Singh, V. & Dhar, R. (2006). HRM Systems of Indian Call Centers: An Exploratory Study, International Journal of Human Resource Management, 17 (5): 881-97. http://dx.doi.org/10.1080/09585190600640976.
Cheon, M.J., Grover, V., Teng, J.T.C.,(1995). Theoretical perspective on the outsourcing of information systems. Journal of Technology Information10, 209–219. http://dx.doi.org/10.1057/jit.1995.25.
Chong, A. Y. L., Chan, F. T. S., Ooi, K. B, & Sim, J. J. (2011). Can Malaysian firms improve organizational/innovation performance via SCM? Industrial Management & Data Systems, 111(3), 410-431. http://dx.doi.org/10.1108/02635571111118288.
Chordas, L. (2003). Global Outsourcing: Eyes on India. BEST’s Review, 2003(May1)98-103.Currie, W.L (2000). The supply-side of IT outsourcing: the trend towards mergers, acquisitions
and joint ventures. International Journal of Physical Distribution and Logistics Management. 38(4), 238-254. http://dx.doi.org/10.1108/09600030010325993.
D’Cruz, P.& Noronha, E.(2008). Doing Emotional Labor: The Experiences of Indian Call Center Agents, Global Business Review 9(1):131 -47. http://dx.doi.

Mitra, S.Mittal, A.Chand, P. K.
64
Journal of Technology Management for Growing Economies, Volume 8, Number 1, April 2017
org/10.1177/097215090700900109.David Ricardo(2006) .Def. 1. WordNet Search. Princeton U. 7 Nov. 2006 .Dossani, R., & A. Manwani. (2005). Agilent’s supply chain: A locational analysis of its Indian
operations. Paper presented at the Stanford University Conference on the Globalization of Services (June 17).
Farrell, D., (2006). Smarter Offshoring. Havard Business Review, 84, 6, 84-92.Fornell, C., Larcker, D.F.(1981). Evaluating structural equation models with unobservable
variables and measurement error, Journal of Marketing Research 18 (1), 39-50. http://dx.doi.org/10.2307/3151312.
Friedman T.L (2004).The Great Indian Dream, The New York Times, March 11, 2004, pg. A29.Gerbing, D.W., and J.C. Anderson. (1988). An Updated Paradigm for Scale Development
Incorporating Unidimensionality and its Assessment, Journal of Marketing Research, 25(2): 186-192. http://dx.doi.org/10.2307/3172650.
Ghemavat, P. (2001). Distance still Matters: The Hard Reality of Global Expansion, Harvard Business Review, 79, No.8, pp. 137-147.
Glenn, D. and Israel. (1992). Determining Sample Size. Program Evaluation and Organizational Development, IFAS, University of Florida, PEOD-5, October, 1992.
Hair, J. F., Black, B., Babin, B., Anderson, R. E., & Tatham, R. L. (2006). Multivariate data analysis (6th ed.). Delhi: Prentice Hall.
Hair, J., Black, W., Babin, B., & Anderson, R. (2010). Multivariate data analysis (7th ed.). Upper Saddle River, NJ, USA: Prentice-Hall.
Hair, J.F., Black, W.C., Babin, B.J. and Anderson, R.E. (2009) .Multivariate Data Analysis. Upper Saddle River, NJ: Prentice Hall.
Heeks, R., Krishna, S., Nicholson, B., & Sahay, S. (2001). Synching or Sinking:Trajectories and strategies in global software outsourcing relationships. IEEE Software Special Issue, 18(2), 54-60.
Hinkin, T.R. (1995). A review of scale development practices in the study of organizations, Journal of Management, 21 (5), 967-988. https://doi.org/10.1016/0149-2063(95)90050-0.
http://www.123employee.com.http://www.prnewswire.comhttp://www.statitistics.com 2009.Ifenedo,(2006). Extending the Gable et al. enterprise systems success measurement model: A
preliminary study. Journal of Information Technology Management. V. 17 i1. 14-33.Joshi, K, and Mudigonda, S.(2008). An analysis of India’s future attractiveness as an offshore
destination for IT and IT enabled service. Journal of Information Technology 23(4),215-227,doi:10.1057/jit.2008.13. https://doi.org/10.1057/jit.2008.13.
Kearney. A.T (2004). AT Kearney’s 2004 Offshore Location Attractiveness Index: Making Offshore Decisions. Chicago: A.T. Kearney, Inc.
Kearney. A.T (2016). AT Kearney’s 2016 Offshore Location Attractiveness Index: Making Offshore Decisions. Chicago: A.T. Kearney, Inc.
Khan ME, Patel BC, Hemlatha Rao, S.(1993) Use of focus groups in social and behavioral Research - some methodological issues. Consultation on epidemiological and statistical methods of rapid health assessment. World Health Organization, E.M./CONS/R.A./1993.
Khan, N., Currie, W. L., Weerakkody, V. and Desai, B. (2003). Evaluating Offshore IT Outsourcing in India: Supplier and Customer Scenarios. Proceedings of the 36th Hawaii International Conference on System Sciences (HICSS’03), 6-9 January, Washington DC, USA; IEEE Computer Sciences.
Kleibert, J. M. (2014). Strategic coupling in ‘next wave cities’: Local institutional actors and the offshore service sector in the Philippines. Singap J Trop Geogr, 35: 245–260. doi:10.1111/sjtg.12044. https://doi.org/10.1111/sjtg.12044.
Kline, R.B. (1998). Principles and Practice of Structural Equation Modeling. New York, USA:

Determinants of Offshore Outsourcing Locations
65
Journal of Technology Management for Growing Economies, Volume 8, Number 1, April 2017
Guilford Press.Kumar, Sameer; Aquino, Edgardo C.; Anderson, Elizabeth (2007). Application of a process
methodology and a strategic decision model for business process outsourcing, Information Knowledge Systems Management, Vol. 6 Issue 4, p323-342.
Lacity, M.C., Willcocks, L.P.( 2001).Global Information Technology Outsourcing. John Wiley and Sons.
Li, Y., Zhao, Y., & Liu, Y. (2006). The relationship between HRM, technology innovation and performance in China. International Journal of Manpower, 27(7), 679-697.
Loh, L., Venkataraman, N., (1992). Diffusion of information technology outsourcing: influence sources and the Kodak effect. Information System Research3 (4), 334–358. http://dx.doi.org/10.1108/01437720610708284.
MacCallum RC, Browne MW, Sugawara HM (1996). Power Analysis and Determination of Sample Size for Covariance Structure Modeling. Psychological Methods.1:130–49.
MacCormack, A., Newmann, L., & Rosenfield, D. (1994). The new dynamics of global manufacturing site location. Sloan Management Review, 35(4), 69–80.
Masood A. B. (2007). Dimensions of industrial location factors: Review and exploration. Journal of Business and Public Affair, 1(2), 1–26.
Mazzarol, T., & Choo, S. (2003). A study of the factors influencing the operating location decisions of small firms. Property Management, 21(2), 190–208. http://dx.doi.org/10.1108/02637470310478918
McCann, P., Arita, T., & Gordon, I. R. (2002). Industrial clusters, transactions costs and the institutional determinants of MNE location behaviour. International Business Review, 11, 647–663. http://doi.org/10.1016/S0969-5931(02)00043-4.
McLaughlin, L. (2003). An eye on India: Outsourcing debate continues. IEEE Software, 20(3), 114-117. http://doi.org/10.1109/MS.2003.1196336.
Naidu, K. K., Reed, R., & Heywood, C. (2005). The impact of business outsourcing on corporate real estate in India. Journal of Corporate Real Estate, 7(3), 234–245. http://dx.doi.org/10.1108/14630010510631072.
Nasscom. (2009). Strategic Review.Nunnally, J. C., & Bernstein, I. H. (1994). Psychometric theory (3rd ed.). New York: McGrawHill.Porter, M. (1990). The Competitive Advantage of Nations. Macmillan, London.Prahalad, C. K., & Hamel, G. (1990). The core competence of the corporation. Harvard Business
Review, pp. 79–91. Rajkumar, P (2013). A Study of The Factors Influencing The Location Selection Decisions of
Information Technology Firms”, The Asian Academy of Management Journal, Vol. 18, No1.
Rao, T.V & Varghese, S (2009). Trends and Challenges of developing human Capital in India. Human Resource Development International; Feb2009, Vol. 12 Issue 1, 15-34. http://dx.doi.org/10.1080/13678860802638800.
Romberg, D.,(1998). Firms here have taken to outsourcing, study finds. Computing Canada 24 (39), 8 (Oct 19).
Sekaran, U. (2003). Research methods for business. New York: John Wiley & Sons Inc.142.Sengupta, K., Zviran, M.,(1997). Measuring user satisfaction an outsourcing environment.
IEEE Transactions on Engineering Management 44 (4), 414–421. http://dx.doi.org/10.1109/17.649871.
Trochim, W. M. K. (2006). Introduction to Validity. Social Research Methods, retrieved from www.socialresearchmethods.net/kb/introval.php, September 9, 2010.
Zhang, K., Markuson, J., (1999). Vertical multinationals and host-country characteristics. Journal of Development Economics 59, 233 – 252. http://dx.doi.org/10.3386/w6203.