doi: 10.7897/2230-8407.0811241 - irjponline.com · tamil nadu, india 2department ... computers the...
TRANSCRIPT

Yogapriya J et al. Int. Res. J. Pharm. 2017, 8 (11)
201
INTERNATIONAL RESEARCH JOURNAL OF PHARMACY
www.irjponline.com
ISSN 2230 – 8407
Research Article
AN EFFECTIVE MACHINE LEARNING ALGORITHM FOR TEXTURE BASED MEDICAL IMAGE
RETRIEVAL SYSTEM
Yogapriya J 1*, Saravanabhavan C
1 and Ila Vennila
2
1Department of Computer Science and Engineering, Kongunadu College of Engineering and Technology, Trichy,
Tamil Nadu, India 2Department of Electrical and Electronics Engineering, PSG College of Technology, Coimbatore, Tamil Nadu, India
*Corresponding Author Email: [email protected]
Article Received on: 13/11/17 Approved for publication: 30/11/17
DOI: 10.7897/2230-8407.0811241
ABSTRACT
In the present digital world, an image databases are increasing enormously across the world. An effective image retrieval approach is needed for
utilizing this massive databases. An extensive research efforts have been conducted in the field of Content-Based Medical Image Retrieval(CBMIR) system. This paper analysed a novel evolutionary approach to extract texture features for CBMIR application .The selected
texture features are Local Octal pattern(LOP)in which extracted features are formed as feature vector database. A machine learning algorithms
are analysed for feature selection and classification problems. To reduce the high dimensional texture features, Grey Wolf Optimization(GWO) is used to select the best features. A classification algorithm is used as an Evaluation Criteria, for identifying the best subset of features. Fuzzy based
Relevance Vector Machine(FRVM) based classification algorithm is applied to classify the subset of texture features of the images. Euclidean
Distance(ED) is used as similarity measurement techniques, to identify the similarity between the query image and the classified image feature database.To evaluate the retrieval performance, an experiments have been conducted on medical image dataset. The Precision and Recall is used
as a performance metrics to evaluate the CBMIR systems.
Keywords: Content Based Medical Image Retrieval (CBMIR), Texture Features, Feature Extraction, Selection, Classification, Grey Wolf
Optimization(GWO), Fuzzy based Relevance Vector Machine(FRVM), Euclidean Distance (ED).
INTRODUCTION
Medical imaging plays a major role in healthcare systems to
physicians for monitoring the treatment responses of patients
diseases. Everyday thousands of human body anatomy images
are scanned in the radiology department of each hospitals
,using different imaging modality devices, such as Computed
Tomography (CT), Magnetic Resonance Imaging (MRI),
Ultrasound (US), MammoGrams (MG), and Digital
Radiography (DR) . All the images to be stored in a structured
way and to be retrieved whenever images are needed by the
physicians. Image retrieval is the process of searching the
similar images from the database.Image retrieval using text
analysis is a difficult task due to the enormous collection of
images.
Content Based Medical Image Retrieval (CBMIR)1 system
retrieves the needed images automatically from the medical
image databases by extracting the visual content of the
features2. The colour, shape and texture feature extraction
methods are widely used for image retrieval3,4. The extracted
visual image features can form as Feature Vector Database.
The main task is to decide which features are best for
specifying the contents of an image and which methodologies
are best suited for extraction. In CBMIR, physicians look for
visual characteristics of images in particular Region of
Interest(ROI), for searching the surface to classify abnormality
and resolve if a biopsy is needed. The distinct objects outside
the image, such as medical tools, vaginal walls, and text
information will affect the retrieval performance. For the past
few years, massive development has been seen in the field of
CBMIR5 for effective analysis of medical images, to help the
physician for analysing the diagnosis and decision-making.
The main aim of this work is to build an efficient framework for
CBMIR system by adapting the four phases of workflow such as
Feature Extraction, Feature Selection, Feature Classification and
Similarity Measurements.
MATERIALS AND METHODS
Texture Feature Extraction
For medical images, only limited applications are using colour
as feature extractor, such as dermatology, pathology,
ophthalmology and nuclear cardiology6. Texture features are
having the properties for capturing semantic features clearly in
medical images and reflect the needed details from images as
compared with all other visual features.
The texture local properties are identified using spectrum
models. The standard Local Binary Patterns (LBP)7 and Local
Derivative Patterns(LDP)8 encode the relationship between the
reference pixel and its surrounding neighbours by computing the
gray-level difference. The different versions of the LBP and
different directional orders of LDP could not deal exactly about
the presence of illuminations and partial occlusions in the
image. To overcome this problem, the Local Ternary Patterns
(LTP)9 with three binary codes is applied for image retrieval.
LTP codes are unaffected by noise, however, it is not invariant
to gray-level transformations. Murala10 proposed a Local Tetra

Yogapriya J et al. Int. Res. J. Pharm. 2017, 8 (11)
202
Pattern (LTrP) with four direction code for texture feature
extraction along with Magnitude patterns. This encodes the
relationship between the referenced pixel and its neighbours.
The nth order LTrP can be identified by using (n-1)th order
derivatives in both horizontal and vertical directions and proved
that second order derivative based LTrP is an efficient method
for image retrieval.
A texture feature extraction method, called Local Octal Patterns
(LOP), is used in our CBMIR system11,12. LOP is utilized by
analyzing the various existing texture feature extraction methods
such as LBP, LDP, LTP and LTrP. LTrPs considers only
horizontal and vertical pixels in four directions for derivative
calculation. The performance of LTrP method can be improved
by separating out the boundaries in more than four directions by
using the horizontal, diagonal and vertical pixels for derivative
calculations. This has motivated us to use an eight directional
code, denoted as LOP for CBMIR.
The feature vectors are the histogram of the binary patterns.
With P neighborhoods, there are 2P potential combinations of
binary patterns, are extracted. Hence, the feature vector length is
2P, which will increase the computational complexity. If all of
the patterns are considered for performing the classification,
then it will take more time to retrieve the needed images. In
order to reduce the computational cost, researchers have
considered the uniform patterns13. The uniform pattern is
considered, which shows the uniform appearance of patterns,
that has limited discontinuities or transitions in the circular
binary pattern representation. The most frequent „uniform‟
binary patterns are micro features such as edges, corners and
spots and the remaining patterns are referred as non-uniform
patterns, hence they can be considered as feature detectors that
reflect the best matching patterns. If two transitions are exists
between “0” and “1” then the patterns are uniform. For
example, 11110111 and 11011111 are uniform patterns and it
is identified that, nearly 90% of encoded labels are uniform
patterns only.
The above problem is addressed by using a machine learning
algorithms. The feature selection method which selects only the
optimal uniform patterns with the consideration of irregular
larger edges or shapes of patterns to extract the texture
information. The classification algorithm is used as an
Evaluation Criteria, for identifying the best subset of features. If
maximum classification accuracy or minimum error rate, is
reached, the process will stop and that will select the best subset
of features for retrieval.
Machine Learning Algorithms
Machine learning is a field of computer science that gives
computers the ability to learn without being explicitly
programmed. Machine learning algorithms that make
predictions on given set of samples. The most widely used
machine learning algorithms are Supervised learning,
Unsupervised Learning and Reinforcement Learning14.
Supervised Learning searches for patterns within the value
labels assigned to data points. The sample algorithms are
Decision Tree, Random Forest, K-Nearest Neighbor, Logistic
Regression, Naïve Bayes, Support Vector Machine, Relevance
Vector Machine and Ensemble Methods
Unsupervised Learning, which has no labels associated with
data points. It organizes the data into a group of clusters to
describe its structure and create complex data into easily
understandable manner. The sample unsupervised learning
algorithms are
k-means for clustering problems.
Apriori algorithm for association rule learning problems
To address the issues of high feature dimensionality,Bio-
inspired Meta-Heuristic Algorithms (BMHA) are used.
In Reinforcement Learning, the machine is trained to take
specific decisions and trains itself continually using trial and
error. It learns from past experience and tries to capture the best
possible knowledge to take accurate decisions. Markov Decision
Process is an example for this algorithm.
Unsupervised Machine Learning Algorithms for Feature
Selection
Bio Inspired Meta Heuristic Algorithms (BMHA) are used to
solve optimization problems by mimicking biological or
physical phenomena , widely used in engineering applications
because they: (i) Simple concepts and easy to apply; (ii)
Gradient information is not required (iii) local optima can be
bypassed; (iv) Different disciplines of problems can be
addressed. The four steps for feature selection are subset
generation, evaluation, stopping criterion and subset validation.
There are three varieties of BMHA15:
Evolution- Based Methods: Inspired by the laws of natural
evolution. The search process starts with a randomly generated
population which is evolved over subsequent generations. Best
individuals are always combined together to form the next
generation of individuals. This allows the population to be
optimized over the course of generations Genetic Algorithms
(GA), Genetic Programming (GP), Biogeography-Based
Optimizer (BBO), Evolution Strategy (ES), Probability-Based
Incremental Learning (PBIL).
Physics-Based Methods: The most popular algorithms are
Simulated Annealing (SA), Gravitational Local Search (GLSA),
Big-Bang Big-Crunch (BBBC), Gravitational Search Algorithm
(GSA), Charged System Search (CSS), Central Force
Optimization (CFO), Artificial Chemical Reaction Optimization
Algorithm (ACROA), Black Hole (BH) algorithm, Ray
Optimization (RO) algorithm, Small-World Optimization
Algorithm (SWOA), Galaxy-based Search Algorithm (GbSA),
and Curved Space Optimization (CSO).
Swarm-Based Methods: Particle Swarm Optimization(PSO)
,Marriage in Honey Bees Optimization Algorithm (MBO)
,Artificial Fish-Swarm Algorithm (AFSA) ,Termite Algorithm ,
Ant Colony Optimization(ACO) Wasp Swarm Algorithm,
Monkey Search, Wolf pack search algorithm, Bee Collecting
Pollen Algorithm (BCPA) ,Cuckoo Search (CS), Dolphin
Partner Optimization (DPO), Bat-inspired Algorithm (BA),
Firefly Algorithm (FA), Hunting Search (HS), Bird Mating
Optimizer (BMO) Krill Herd (KH) Fruit fly Optimization
Algorithm (FOA) Dolphin Echolocation (DE) and Grey Wolf
Optimization(GWO).
Ballerini16 proposed CBMIR for Skin Lesions by GA. The
ranking quality17 of medical image retrieval is improved using
GA as feature selection method. The experimental result shows
that GA has provided fast suboptimal solutions but it is not able
to find a global optimum solution within a timeframe.This way
of approach is not always possible to take accurate selection of
features. ACO18,19 based feature selection method results shows
that convergence is guaranteed but time for convergence is
uncertained and parameter updation is not straightforward.

Yogapriya J et al. Int. Res. J. Pharm. 2017, 8 (11)
203
Particle Swarm Optimization (PSO)20,21,22 is used as feature
selection method for image retrieval.The experimental results
shown that PSO has produced quality solutions with stable
convergence features. However, the performance of PSO is
affected by improper selection of parameters value that has
caused the premature convergence, and trapped in local
optimum solutions. When the velocity of particles are decreased
in the search space ,it causes premature convergence. Hence,
these kind of feature reduction problems to be addressed by the
researchers.
Compared with above-mentioned BMHA techniques, Grey
Wolf Optimization (GWO)23 is a new BMHA technique
proposed recently by Mirjalili &Lewis.GWO is the simulated
hunting behavior with random or the best search agent to chase
the prey. GWO has great searching capacity and it is used in
many real world problems such as optimal reactive power
dispatch problem, compensator controller design ,smart grid
,nonconvex economic load dispatch problem and capacitated
vehicle routing problems and medical diagonosis24.GWO
mimics the social hierarchy and hunting behavior of grey wolves
in nature.
Supervised Machine Learning Algorithm for Feature
Classification:
CBMIR system was proposed25 using GLCM as texture feature,
K means algorithm for classification and Euclidean Distance as
the similarity measurements. The experimental results shown
that classification perform poorly on overlapping regions, could
not work on features with non-continuous values. Supervised
Machine learning algorithms are used to classify the images.The
most widely used machine learning algorithms are Support
Vector Machine (SVM)26 and Relevance Vector
Machine(RVM)27.
SVM and RVM28,29 are used for mammogram image
classification to know whether themicro calcifications was
present or absent based on a small region of interest (ROI)
surrounding that point. From the experimental results, it was
proved that RVM performs better than SVM. The major
drawbacks of SVM30 are the following: (1) SVM is unstable for
the small-sized training set, (2) SVMs optimal hyper plane may
be partial due to certain condition, (3) over fitting occurs when
the number of feature dimensions is higher than the size of the
training set, (4) SVM makes point predictions rather than
generating predictive distributions, (5) SVM requires more
support vectors to classify and (6) Kernel functions must satisfy
Mercer conditions. All the training points are treated uniformly
in RVM, as a matter of fact, in many real world applications, the
influence of the training points are different. To assign fuzzy
membership to each different training features for successful
classification by using Fuzzy based Relevance Vector Machine
(FRVM) algorithm31,32.
Similarity Measurements
Similarity measurement is to retrieve the similar images from
the classified image feature vector databases. Several similarity
measurements are used as distance metrics33 such as Manhattan
Distance (L1 metric), Euclidean Distance (L2 metric), Vector
Cosine Angle Distance, Chord Distance, Pearson‟s Correlation
Coefficient, Spearman Rank Coefficient and Earth Movers
Distance34 has been proposed in the literature for measuring
similarity between feature vectors.
An efficient retrieval system is based on choosing the similarity
measure that selects the suitable classified reference samples of
the same class between the query image and the database
images. Zhu35 has made a research on similarity measurement
for texture image retrieval and shown that an average Euclidean
distance is best for effective similarity. A different distance
measures for medical image retrieval is analyzed36 and known
that Euclidean distance will produce good retrieval results.
PROPOSED SYSTEM
The proposed CBMIR system is represented in Figure 1. A
texture feature extraction method, called Local Octal Patterns
(LOP), is used in our CBMIR system. LOP is utilized by
analyzing the various existing texture feature extraction methods
such as LDP LTP and LTrP. LTrPs considers only horizontal
and vertical pixels in four directions for derivative calculation.
Thus, it is evident that the performance of LTrP method can be
improved by segregating the boundaries in more than four
directions by considering the horizontal, diagonal and vertical
pixels for derivative calculation.
This observation has motivated us to use an eight directional
code, denoted as LOP for CBMIR. Hence the proposed CBMIR
uses second order derivative based LOP along with magnitude
patterns for effective texture feature pattern extraction. The
performance of the proposed LOP texture feature extractor is
validated using LDP, LTP and LTrP. From this analysis, it has
been concluded that LOP based CBMIR system is a well-
defined texture feature extractor method which extracts the more
detailed and complete pattern information of images using
higher order derivatives of horizontal, vertical and diagonal
directions along with the magnitude patterns. This effectively
deal with the presence and variations of affected areas in the
medical images such as tumors, swelling of inner organs etc.,
This LOP features are combined to form high dimensional
texture features. In order to reduce the high feature dimension
reduction, a best feature selection approach is applied. The
feature selection method chooses a subset of features among
this high dimensional feature vectors. There are four steps for
the selection of best subset of features. Feature subset
generation, Feature subset evaluation, stopping condition for
selection, and validation of the final feature subset during
testing. The feature vectors optimized in different points of a
texture images are need to be classified to a particular
category which should increase the accuracy rate. The
selected subset of features during training are evaluated using
classification techniques. If high classification accuracy and
low error rate is achieved then that subset is selected for next
generation. Feature selection is performed on the training
subsets and validated on the test ones.

Yogapriya J et al. Int. Res. J. Pharm. 2017, 8 (11)
204
Figure 1. Overall Structure of the Proposed System
The main contribution of this proposed work is to reduce the
high texture feature dimension by using Grey Wolf
Optimization(GWO), which is used to select the best features
among high dimensional texture features. The best subset of
features are selected and evaluated using classification
algorithm. Fuzzy based Relevance Vector Machine(FRVM)
based classification algorithms are a capable method to
classify texture features of the images. Euclidean
Distance(ED) is used as similarity measurement techniques, to
identify the similarity between the query image and the
classified image feature database.
FEATURE EXTRACTION USING LOCAL OCTAL
PATTERNS (LOP)
LOP is based on the ideas of LBP,LDP,LTP and LTrP. The
LOP describes the spatial structure of the local texture image
using the direction of the center gray pixel by segregating the
boundaries in eight directions by considering the horizontal,
diagonal and vertical pixels for derivative calculation. Hence
the proposed CBMIR system uses second order derivative
based LOP for effective texture feature pattern extraction.
The first order derivative at center pixel I (gct) along with 0o
,45o and 90o directions are mentioned as
1
0 ,45 90( ) | o o oct and
I g
.Let gct represents the center
pixel in I,ghn,gdn and gvn denote the pixel values of
horizontal, diagonal and vertical neighborhoods of gct,
respectively. Hence the first order derivative is defined as

Yogapriya J et al. Int. Res. J. Pharm. 2017, 8 (11)
205
The centre pixel direction is calculated as follows:
This shows that the image is evaluated in eight directions such as 1,2,3,4,5,6,7, and 8 revolving around the centre pixel and therefore
the image is transformed into eight directional values.
The second order derivative is evaluated as:
For each centre pixel, the 8 bit octal feature pattern would be extracted from the Equations 3 and 4. Following that, need to separate
all octal patterns into eight directional parts. Finally, the octal feature patterns, for each directions, are transformed to seven binary
patterns. If the direction of centre pixel )g(I ct1Direction is „1‟,then )g(LOP ct
2would be changed to seven binary patterns and
defined in Equation 5.
Similarly, the other seven octal patterns for remaining seven directions of center pixels are transformed to binary patterns. So totally
56 binary patterns would be obtained. The 57th binary pattern would be obtained by using the Magnitude Component (MC) of the
horizontal, vertical and diagonal first-order derivatives and defined in Equations 6 and 7.

Yogapriya J et al. Int. Res. J. Pharm. 2017, 8 (11)
206
Once the 57th bit LOP pattern for each pixel (a,b) has been computed then the image is denoted by constructing a histogram as
defined in Equation 8:
Where M1×M2 denotes the size of the input image.
FEATURE SELECTION ALGORITHM USING GREY
WOLF OPTIMIZATION (GWO)
The objective of the feature selection method is to minimize the
high dimensional features into low dimensional features i.e.,
NM,where}sf...sf,sf,sf{}f,...f,f{Min M,321N21Ffi
, N represents the set of all possible features, }f,...f,f{ N21,
and sf represents the set of selected features ,
}sf...sf,sf,sf{ M,321 ,.This reduced features should
maximize the classifcation accuracy and reduce the error rate.In
this section, GWO, a feature selection algorithm is explained.
The GWO is a new BMHA algorithm which mimics the social
hierarchy and hunting technique of grey wolves in nature and is
based on three main steps:encircling prey, hunting, and
attacking prey. To model the leadership hierarchy of wolves in
mathematical way, put the best solution as alpha, second
solution as beta and third solution as delta,respectively.The
remaining of the candidate solutions to be omega. Figure 2
represents the socially dominant hierarchy of grey wolves.
Figure 2. Socially Dominant Hierachy of Wolves
Yogapriya J et al. Int. Res. J. Pharm. 2017, 8 (11)
207
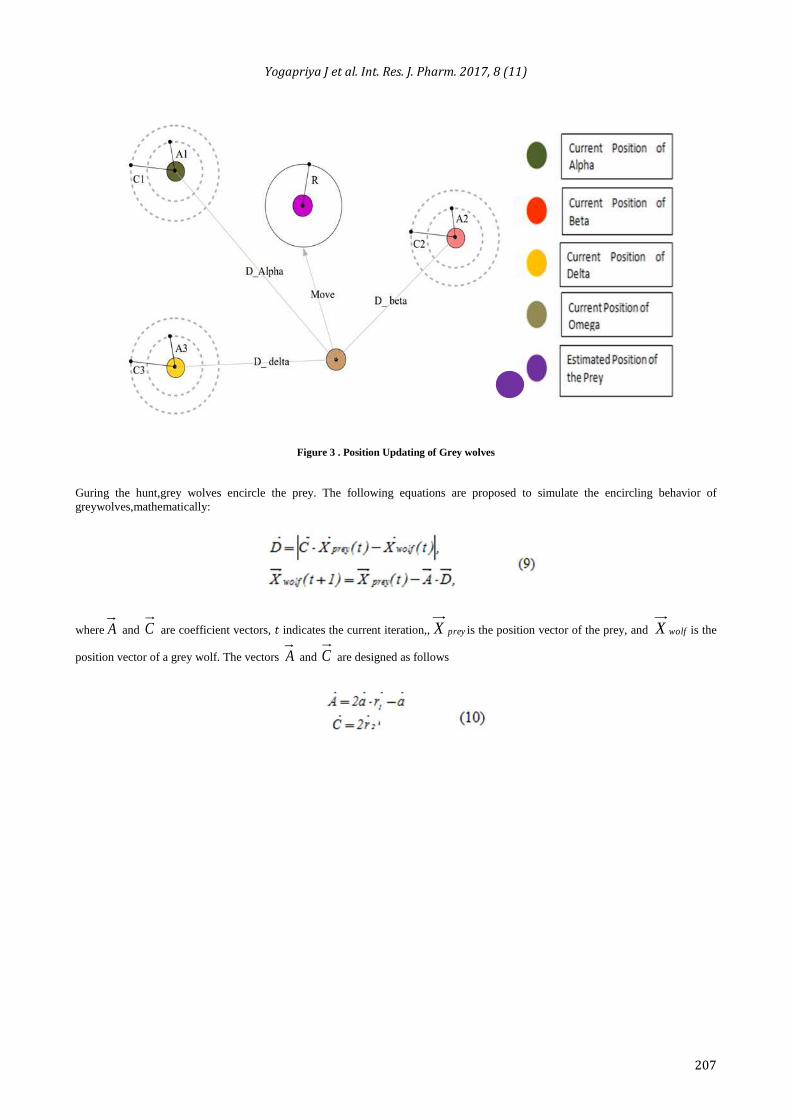
Figure 3 . Position Updating of Grey wolves
Guring the hunt,grey wolves encircle the prey. The following equations are proposed to simulate the encircling behavior of
greywolves,mathematically:
where A and C are coefficient vectors, 𝑡 indicates the current iteration,, preyX is the position vector of the prey, and wolfX is the
position vector of a grey wolf. The vectors A and C are designed as follows

Yogapriya J et al. Int. Res. J. Pharm. 2017, 8 (11)
208
Figure 4. Flowchart of GWO Algorithm
where a is linearly decreased from 2 to 0 for the entire
iterations and 1r and 2r are random vectors in the interval of [0,
1]. The hunt is regularly guided by alpha. Beta and delta also
take part in hunting rarely. To mimic the hunting behavior of
grey wolves, first three best solutions such as alpha, beta, and
delta obtainedso far are saved and the omega search agents are
indulged to update their positions according to (11)–(17).

Yogapriya J et al. Int. Res. J. Pharm. 2017, 8 (11)
209
The update of positions for grey wolves is shown in Figure 3.
The GWO algorithm is represented in Figure 4.
FEATURE CLASSIFICATION USING FUZZY BASED
RELEVANCE VECTOR MACHINE
In this section, Relevance Vector Machine is explained for
image classification.
Relevance Vector Machine
Relevance Vector Machine (RVM) is a machine learning
classification technique,which is a statistical learning theory,
and gaining popularity because, it is having attractive features
and reflective empirical performance and,it is proved to be faster
than Support Vector Machine (SVM), since it yields an
optimum solution with few training samples .In RVM, there is
no necessity for kernel function to satisfy the Mercer‟s
condition.
The main goal of supervised learning is that functional mapping
of the input and output data, which can be specified as a
decision function ( )t oy ox .This function is evaluated
based on a set of input features, training set T, such that
1 1 2 2( , ), ( , ),..., ( , )N NT ox t ox t ox t ,where iox is the
input vector and ioy is the corresponding outputs. The aim is to
use this training data along with prior knowledge to make
predictions of new values of ox . The optimized inputs are D
dimensional real vectors Dox , and output could be a
categorical manner. The decision function is a stable structure
and having a set of parameters.
RVM is a machine learning clasification techniques based on
statistical learning theory and has an exploited probabilistic
Bayesian learning framework. RVM generates predictions of the
output based on the decision function which is the sum of the
product of weights and kernel functions. The decision function
of RVM is specified in Equation 18.
where N specifies the length of the data, T
N21 ,..., are the model weights,
)ox,ox(K i is a kernel function.
The likelihood of the complete training data set is defined as follows:
Where

Yogapriya J et al. Int. Res. J. Pharm. 2017, 8 (11)
210
),(),,([)( 21 oxoxKoxoxKox nnn T
NnoxoxK ],(,... represents NN design matrix,
2 specifies the width of the Gaussian kernel.
The classical approach is to estimate,t, which should maximize the likelihood estimation of weight and 2 from Equation (18),
which would makes over-fitting.
To overcome this over fitting and control the complexity of the learning function, Gaussian prior distribution over weight is
assigned as zero mean with variance1
i
2
j
:
The hyper-parameter is ],...,[21 N
, which link independently with every weight (one per weight) in which sparsity is
achieved that could strengthen the prior information. It is used to make the weight, to be focused around 0, and to very few nonzero
terms in );ox(oy . This nonzero weight are called relevance vectors (RVs).
Once the prior distribution and likelihood function is defined, then the posterior over weight is defined based on Bayes rule as
follows
The likelihood distribution over the training targets can be marginalized based on the weights, which is also a Gaussian distribution:
The values of the hyper parameters, α and σ2, are used to maximize the marginal likelihood which can be obtained by using an
iterative re-estimation method with the approach of MacKay, which canbe used to maximize the objective function of (19) ,is
defined as follows:
where i is the ith posterior mean weight from (2.40) and the
measure i is defined by iiii 1 .With ii the ith
diagonal element of the posterior weight covariance from (22)
computed with the current and values. During the
estimation of iterative procedure, the hyper parameters
newiter
i leads to infinity also the relative weight becomes
highly peak at zero. Hence the vector from the training set
that associates with the remaining nonzero weights are called
Relevance Vectors.
Fuzzy Based Relevance Vector Machine (FRVM) For
Classification
The limitation of RVM is that,it considers the training points
homogeneously, but most of the cases ,the training points are
different. In order to improve the RVM performance, different
training points should be used with fuzzy membership,
specifies how much point iox belongs to one class. A fuzzy
membership should be required in each input training points.A
Fuzzy based RVM (FRVM) is proposed to overcome this
training effects for medical image classification, where a fuzzy
membership is chosen to each training input point, so that the
dissimilar input points can make various effects in learning

Yogapriya J et al. Int. Res. J. Pharm. 2017, 8 (11)
211
evolution. FRVM is designed to overcome this training
difficulty in which a fuzzy membership function (MF) is
assigned to each training input point,such that different input
points can make different impacts in learning process. A
property of FRVMs is that, they simultaneously minimize the
empirical classification error and maximize the geometric
margin; hence they are also known as maximum margin
classifiers. Figure 5 represents the Feature Classification
using Fuzzy RVM.
Based on the different values of MFsn, there would be
control over the transaction of the respective training points
)t,ox( ii during the classification stage. In general, A
suitable value of MF grades the corresponding point
)t,ox( ii less weighty in training. So RVM is the special
case of FRVM if MF is positive then conclude that the
optimized feature set would be properly classified otherwise it
cannot be under the specific class and defined in Equation 24:
Figure 5 Feature Classification using Fuzzy RVM
The proposed system uses Gaussian Fuzzy Membership fuction. Fuzzy inference system to be designed using RVM in which
all the training points to be equally applied.The output is computed based on individual rule function.

Yogapriya J et al. Int. Res. J. Pharm. 2017, 8 (11)
212
Step 1:The likelihood of Equation (19) can be redefined in Equation 25 by applying the generalization linear model and logistic
sigmoid link function.
The weight can be obtained by minimizing the following
Equation (26)
with );ox(oyoy nn .The first term represents the sum error of data and the second term represents the regularization
term.
Step 2:The Gaussian fuzzy membership nMFs is introduced into the likelihood and defined in Equation 27.
Gaussian membership function (MFsn) is selected for fuzzy inference system in order to identify the grade of membership of the
center *
ijox.ox and variance ij of predictive distribution of jth dimension term of ith input variable iox and defined in Equation
28.
where*
ijox is the RVs,2
ij specifies the kernel width parameter and it is variant to both the feature of the input spaceD and RVs
and D,...,2,1j,n,...,2,1i .
Step 3:
Iteratively Reweighed Least Squares Algorithm for updating the weight and hyper-parameters such as 2 , :
The gradient and hessian matrix of (29) are given by,
The updating procedure for
newiter
i and newiter2 )( is same as classical RVM.

Yogapriya J et al. Int. Res. J. Pharm. 2017, 8 (11)
213
Step 4: The Defuzzification is performed for the overall output
of the fuzzy model by aggregating the output.
From the above study,it is concluded that, it is a standard RVM
if 1MFsi .If it has different values ,then the trade-off of the
respective training point )t,ox( ii in the system can be
controlled.When iMFs
has smaller value then the
corresponding training point is less important.
SIMILARITY MEASUREMENTS
Euclidean Distance (ED) is used to find the similarity between
the query image features and the categorized image features in
the database and defined in Equation 30:
where, ]i[FQ
is the ith query image features and CFDB [i] is
the corresponding feature in the classified feature vector
database and N refers to the total number of images in the
database.
EXPERIMENTAL RESULTS AND DISCUSSIONS
This proposed CBMIR system is implemented in MATLAB
with the medical image database of 1000 images which are gray
level images of the human body anatomy such as Brain, Lung,
Liver, and Kidney with resolution 512 ×512. Each dataset
consists of 250 images of CT and MRI modalities.The images
used in this research are collected from Fortis Malar Hospitals-
Chennai,India Saravana Radiological Scan Centre,Salem,India
and Namakkal Scans and Diagnostics,Namakkal,India and also
few images acquired from Google search engine.
This proposed system is applicable to all four categories of
medical images where proper training has been given to four
databases, respectively. For analysis purpose, this proposed
CBMIR system has taken 250 MRI images of normal/abnormal
brain images and 250CT kidney images of different categories
such as Normal kidneys, cortical cysts, medical renal diseases
which are used for performance analysis.The motivation of
building a CBMIR system is to identify the similar normal
kidneys ,cortical cysts and medical renal diseases .The sample
normal and abnormal kidney and brain images are represented in
Figure 6.For analysis purpose, 100 normal and 80 abnormal
images are taken for training. And, 35 normal and 35 abnormal
images are taken for testing.
During the process of retrieval, a query image which contains
the abnormalbrain or kidney image is given as an input, to
retrieve the similar images from the old patients‟ database. The
feature vectors of query image are computed online and the
feature vectors of stored database images are computed offline.
The feature selection and classification is performed on the
training subsets and evaluated on the test ones. For each query,
the system collects „n’database ( )images with
the shortest image matching distance computed using Euclidean
Distance. If the retrieved image fits into same category as that of
the query image, then it is known that the system has suitably
identified the expected image, otherwise, the system has failed
to catch the expected image .
Figure 6 Sample CT Images of Kidney and MRI images of Brain in the Database

Yogapriya J et al. Int. Res. J. Pharm. 2017, 8 (11)
214
Performance Analysis of CBMIR System
The evaluation of an CBMIR system is the process of assessing how well a system meets the requested images from the user. The
retrieval performance is evaluated using precision and recall. Precision gives retrieval accuracy while recall gives ability of retrieving
relevant images from the database. The Precision (P) and Recall (R) are then defined in Equation 31,32:
The measure of classification accuracy and error rate are used as evaluation criteria for each selected subset of features.The
Sensitivity, Specificity, Accuracy and Error Rate are measured using confusion matrix which are described in Equations 33 to 36,
respectively. A confusion matrix is a specific table layout where each column of the matrix represents the occurrences in a predicted feature
class and each row represents the occurrences in an actual feature class.
Where
t_pos is the number of true positives that were correctly
classified,
pos is the number of positive tuples.
t_neg is the number of true negatives.
neg is the number of negative tuples.
f_pos is the number of false positives.
f_neg is the number of false negatives.
The computation time for feature selection is calculated using
MATLAB command such as tic and toc. The tic command starts
a stopwatch timer and MATLAB executes the block of
statements then toc stops the timer, displaying the time elapsed
in seconds.
Results of Feature Extraction by LOP
The possible local pattern transitions resulting in an LOP for
direction “1” of the center pixel is represented in Figure 7. The
LOP is coded to “0” when it is equal to the direction of center
pixel, otherwise coded in the direction of neighbourhood pixel.
Using the same analogy, LOPs are calculated for center pixels
having directions 2, 3, 4,5,6 and 7.Figure 8 represents the
sample example of the second-order LOP calculationresultant in
direction “1” for a center pixel marked with red. When the first-
order derivative in horizontal, vertical and diagonal directions to
the neighbourhood pixel “6,” then obtain direction “8” and
magnitude “4.2.” It can be seen that the magnitude of the center
pixel is “5.4,” which is higher than the magnitude of
neighbourhood pixel. Hence, assign value “0” to the
corresponding bit of the magnitude pattern. Similarly, the
remaining bits of the LOP and the magnitude pattern for the
other seven neighbours are computed resulting in the tetra
pattern “8 3 7 8 0 4 6 0” and the magnitude binary pattern
“00001100”.
After taking the octal pattern,it can be separated into seven
binary patterns as follows. Referring to the generated LOP, the
first pattern is “00000000” which is having 0 transitions.The
second pattern is obtained by keeping “1” where the octal
pattern value is “3” and “0” for other values i.e., “01000000”.
Similarly, the other five binary patterns “00000100”,
”00000000”, ”00000010”, ”00100000”,10010000” are
computed for octal pattern values “4”,”5”,”6”,”7”,and ”8”
respectively. In the same way, octal patterns for center pixels
having directions 2, 3,4,5,6 and 7 are computed. Thus, with
eight octal patterns, 56 binary patterns are obtained. The 57th
binary pattern is obtained from the magnitude of the first-order
derivatives.

Yogapriya J et al. Int. Res. J. Pharm. 2017, 8 (11)
215
Figure 7 Calculation of octal pattern bits for the center-pixel direction “1” using the direction of neighbors. Direction of (red) the center pixel
and (cyan) its neighborhood pixels
Figure 8 Example to obtain the Octal and Magnitude patterns

Yogapriya J et al. Int. Res. J. Pharm. 2017, 8 (11)
216
The sample results of kidney image feature extraction is
represented in Figure 9.
Figure 9 Sample Results of Kidney Image Feature Extraction
Results of Optimized Feature Selection by GWO
The octal feature patterns for each direction are transformed to
seven binary patterns along with one magnitude pattern.For
eight direction, LOP produce 56 binary pattern along with one
magnitude pattern. The feature vector length for LBP is 59, LTP
is 2 X 59 (118), LDP is 4 X 59 (236),LtrP is 13 X 59 (767) and
LOP is 57 X 59 (3363).To select the best features among the
high dimensional featires,the search pocess is started randomly
and Grey wolves diverge from each other for searching the prey
and converge after find the best features. Each grey wolves
evolve in the population of 20 to 30. After finding a prey,grey
wolves encircle the prey and find the current best position
andpass the current best solutions to the next generation. The
procedure is then repeated for a fixed number of periods or until
a minimum error is attained or the classification accuracy is
high.The Size of population is 20 and 30 and the number of
iterations are 50 and 100. The sample results of feature selection
is shown in Figure 10 . The second order LOP based texture
feature extraction performs well for medical images.The 57
binary patterns are reduced to 21 binary patterns using GWO.
Figure 10 Sample results of kidney image feature selection by GWO
Results of Classified Optimized Features and Similarity
Measurements
There are four different combination of feature subsets are
selected for classification. The feature vector formed for each
subset features denoted by ix which is then treated as an input
pattern and is labeled as 1iy for a relevant case,and
1iy for a irrelevant case.Together ( , )i ix y forms an
input-output pair. These pairs are subsequently for training and
testing of the FRVM classification.FRVM collects the training
samples, decide the kernel function and select the relevant
model parameters for good performance. Different training input
points can make different impacts in the learning process.Radial
Basis Function (RBF) is choosen as kernel function.The hyper
parameter α could link independently with every weight in
which sparsity is achieved that could strengthen the prior
information.
The training and testing of optimized features are performed for
classification using FRVM. The fine tuning parameters of the
FRVM classifier model are determined using 10 fold cross
validation in the training set. Experiments are conducted with
different kernel width ranges of 1,2.5,5 and 10.RBF kernel
produced a generalization error of 3.72% with kernel width of
2.5 which in turn re-trained with all the samples in the training
set to get a final decision function.The FRVM classification is
performed efficiently and model selection and decision function
is made, for example ,in the training set with generalization
error rate of 5% with kernel width of 2.5.
Table 1 FRVM Classification Accuracy for four different subset features of FCKS – FPSO
Method Clasification
Accuracy
Pop_Size
=20
Max_Iter
=50
Pop_Size
=20
Max_Iter
=100
Pop_Size=30
Max_Iter=50
Pop_Size
=30
Max_Iter
=100
FPSO-FSVM Average 77% 77% 79% 80%
Best 84%/25 81%/32 83%/38 82%/39
FPSO-FRVM Average 78% 80% 81% 82%
Best 82%/32 84%/35 88%/42 84%/39
GWO-FRVM
Average 90% 92% 94% 90%
Best 88%/31 96%/21 92%/27 92%/22
The accuracy of classification is analyzed with respect to four
optimized feature subsets with the population size of 20 and 30
and the total training period is 50 and 100. The best and
averaged classification accuracy of SVM, RVM and FRVM for
the ten runs is shown in Table 1. FRVM achieves the accuracy
of 96% with 21 feature subsets, population size 20 and
generation is 100. For four different combinations of population
size and training generations, GWO keeps conveying good and
consistent outcomes. The results are compared with Fuzzy
Based Particle Swarm Optimization (FPSO). The query image is

Yogapriya J et al. Int. Res. J. Pharm. 2017, 8 (11)
217
comparedagainst the training images of all the classes and
theimage is assigned to the class which has the
minimumdistance using ED. The Figures 11&12 represent the
output of retrieved images of brain and kidney using LOP-
GWO-FRVM. The experiments were carried out and the
average precision for LOP-GWO-FRVM-ED based CBMIR has
significantly increased from 89%, 91%, and 92 % to 96%, as
compared with the LTP, the LDP, and the LTrP respectively.
The recall has increased from 79%, 81%, 86% to 92% as
compared with the LTP, and the LDP, the LTrP, respectively.
Figure 11 Sample Top 20 Retrieval of Brain Images
Figure 12 Sample Top 20 Retrieval of Kidney Images
CONCLUSION
This proposed CBMIR framework consists of four main stages
which are feature extraction, feature selection, classification, and
similarity measurements, respectively, for effective retrieval of
images. A Local Octal Pattern (LOP), is used to extract the
texture features of the medical images. An effective Grey Wolf
Optimization (GWO) algorithm is used for feature selection,
Fuzzy based Relevance Vector Machine (FRVM) classifier was
used to perform the prediction based on the feature subset
obtained in the second stage. GWO algorithm is very viable
compared to the state-of-art meta-heuristic algorithms as well as
conventional methods. Finally, Euclidean Distance(ED) is used
to measure the similarity between query image and database
images. The proposed method is compared against well-known
feature selection methods including Fuzzy Based Particle
Swarm Optimization (FPSO), on the two disease diagnosis
problems. The experimental results shown that the proposed
LOP-GWO-FRVM-ED method converges more quickly as
compared with existing techniques, producing better solution
,produces less number(21 LOP Patterns) of selected features,
and also has achieved 96% classification performance for
retrieving an images. In future, we have planned to use fuzzy
approach for tuning a GWO parameters and Big data analytics
methods for managing huge image database for effective
retrieval of images.
REFERENCES
1. Bohren BF, Hadzikadic M, Hanley EN. Extracting
knowledge from large medical databases: an automated
approach. Computers and biomedical research. 1995 Jun
30;28(3):191-210.
2. Shyu CR, Brodley CE, Kak AC, Kosaka A, Aisen A,
Broderick L. Local versus global features for content-based
image retrieval. InContent-Based Access of Image and
Video Libraries, 1998. Proceedings. IEEE Workshop on
1998 Jun 21 (pp. 30-34). IEEE.
3. Liu Y, Zhang D, Lu G, Ma WY. A survey of content-based
image retrieval with high-level semantics. Pattern
recognition. 2007 Jan 31;40(1):262-82.
4. Deselaers T, Keysers D, Ney H. Features for image
retrieval: an experimental comparison. Information retrieval.
2008 Apr 1;11(2):77-107.
5. Akgül CB, Rubin DL, Napel S, Beaulieu CF, Greenspan H,
Acar B. Content-based image retrieval in radiology: current
status and future directions. Journal of Digital Imaging.
2011 Apr 1;24(2):208-22.
6. Dorileo EA, Frade MA, Roselino AM, Rangayyan RM,
Azevedo-Marques PM. Color image processing and content-
based image retrieval techniques for the analysis of
dermatological lesions. In Engineering in Medicine and
Biology Society, 2008. EMBS 2008. 30th Annual
International Conference of the IEEE 2008 Aug 20 (pp.
1230-1233). IEEE..
7. Ojala T, Pietikäinen M, Harwood D. A comparative study of
texture measures with classification based on featured
distributions. Pattern recognition. 1996 Jan 1;29(1):51-9.
8. Zhang B, Gao Y, Zhao S, Liu J. Local derivative pattern
versus local binary pattern: face recognition with high-order
local pattern descriptor. IEEE transactions on image
processing. 2010 Feb;19(2):533-44.
9. Tan X, Triggs B. Enhanced local texture feature sets for face
recognition under difficult lighting conditions. IEEE
transactions on image processing. 2010 Jun;19(6):1635-50.
10. Murala S, Maheshwari RP, Balasubramanian R. Local tetra
patterns: a new feature descriptor for content-based image
retrieval. IEEE Transactions on Image Processing. 2012
May;21(5):2874-86.
11. Nithya,J,Suchitra.S & Chitrakala,S. Local Octal Pattern: A
Proficient Feature Extraction for Face
Recognition.International Journal of Computer Science and
Mobile Computing, 2014; (34):139-146.
12. Bhuvana, S, Radhakrishnan, R, Tamije Selvy, P, &
Subhakala, S. An Efficient Hybrid Feature Descriptor For
Content Based Image Retrieval. Journal of Theoretical &
Applied Information Technology, 2014;66:145-157.
13. Guo Z, Zhang L, Zhang D. Rotation invariant texture
classification using LBP variance (LBPV) with global
matching. Pattern recognition. 2010 Mar 31;43(3):706-19.
14. Chapter from the Book: Ayodele, TO. Types of machine
learning algorithms. In New advances in machine learning.
InTech press; 2010. p:20-48
15. Mirjalili S, Lewis A. The whale optimization algorithm.
Advances in Engineering Software. 2016 May 31;95:51-67.
16. Ballerini L, Li X, Fisher RB, Aldridge B, Rees J. Content-
based image retrieval of skin lesions by evolutionary feature
synthesis. InEuropean Conference on the Applications of
Evolutionary Computation 2010 Apr 7 (pp. 312-319).
Springer, Berlin, Heidelberg.
17. Da Silva SF, Ribeiro MX, Neto JD, Traina-Jr C, Traina AJ.
Improving the ranking quality of medical image retrieval

Yogapriya J et al. Int. Res. J. Pharm. 2017, 8 (11)
218
using a genetic feature selection method. Decision Support
Systems. 2011 Nov 30;51(4):810-20
18. Varghese TA. Performance enhanced optimization based
image retrieval system. Int J Comput Appl (IJCA).
2010;1:31-4.
19. Chen, L., Chen, B., & Chen, Y. (2011, December). Image
feature selection based on ant colony optimization. In
Australasian Joint Conference on Artificial Intelligence (pp.
580-589). Springer Berlin Heidelberg.
20. Kameyama K, Oka N, Toraichi K. Optimal parameter
selection in image similarity evaluation algorithms using
particle swarm optimization. InEvolutionary Computation,
2006. CEC 2006. IEEE Congress on 2006 Jul 16 (pp. 1079-
1086). IEEE.
21. Ye Z, Xia B, Wang D, Zhou X. Weight optimization of
image retrieval based on particle swarm optimization
algorithm. InComputer Network and Multimedia
Technology, 2009. CNMT 2009. International Symposium
on 2009 Jan 18 (pp. 1-3). IEEE
22. Sasi KM, Kumaraswamy YS. Medical Image Retrieval
System Using PSO for Feature Selection. InInternational
Conference on Computational Techniques and Mobile
Computing (ICCTMC'2012) 2012 (pp. 182-186).
23. Mirjalili S, Mirjalili SM, Lewis A. Grey wolf optimizer.
Advances in Engineering Software. 2014 Mar 31;69:46-61.
24. Li Q, Chen H, Huang H, Zhao X, Cai Z, Tong C, Liu W,
Tian X. An enhanced grey wolf optimization based feature
selection wrapped kernel extreme learning machine for
medical diagnosis. Computational and mathematical
methods in medicine. 2017 Jan 26;2017.
25. Ramamurthy B, Chandran KR. Content based medical
image retrieval with texture content using gray level co-
occurrence matrix and k-means clustering algorithms.
Journal of Computer Science. 2012 Jul 1;8(7):1070.
26. Cortes C, Vapnik V. Support-vector networks. Machine
learning. 1995 Sep 1;20(3):273-97.
27. Tipping ME. Sparse Bayesian learning and the relevance
vector machine. Journal of machine learning research.
2001;1(Jun):211-44.
28. Liu GH, Yang JY, Li Z. Content-based image retrieval using
computational visual attention model. pattern recognition.
2015 Aug 31;48(8):2554-66..
29. Wernick MN, Yang Y, Brankov JG, Yourganov G, Strother
SC. Machine learning in medical imaging. IEEE signal
processing magazine. 2010 Jul;27(4):25-38.
30. Xiang-min X, Yun-feng M, Jia-ni X, Feng-le Z.
Classification performance comparison between RVM and
SVM. InAnti-counterfeiting, Security, Identification, 2007
IEEE International Workshop on 2007 Apr 16 (pp. 208-
211). IEEE
31. Momot A, Momot M, Łęski J. The Fuzzy Relevance Vector
Machine and its application to noise reduction in ECG
signal. Journal of Medical Informatics & Technologies.
2005;9:99-105.
32. Jaganathan Y, Vennila I. A hybrid approach based medical
image retrieval system using feature optimized classification
similarity framework. Am J Appl Sci. 2013;10:549-62.
33. Chen CC, Chu HT. Similarity measurement between
images. InComputer Software and Applications Conference,
2005. COMPSAC 2005. 29th Annual International 2005 Jul
26 (Vol. 2, pp. 41-42). IEEE.
34. Papushoy A, Bors AG. Image retrieval based on query by
saliency content. Digital Signal Processing. 2015 Jan
31;36:156-73
35. Zhu Z, Zhao C, Hou Y. Research on similarity measurement
for texture image retrieval. PloS one. 2012 Sep
25;7(9):e45302.
36. Ayyachamy S, Manivannan VS. Distance measures for
medical image retrieval. International Journal of Imaging
Systems and Technology. 2013 Mar 1;23(1):9-21.
Cite this article as:
Yogapriya et al. An effective machine learning algorithm for
texture based medical image retrieval system. Int. Res. J. Pharm.
2017;8(11):201-218 http://dx.doi.org/10.7897/2230-
8407.0811241
Source of support: Nil, Conflict of interest: None Declared
Disclaimer: IRJP is solely owned by Moksha Publishing House - A non-profit publishing house, dedicated to publish quality research, while every effort has been taken to verify the accuracy of the content published in our Journal. IRJP cannot accept any responsibility or liability for the site content and articles published. The views expressed in articles by our contributing authors are not necessarily those of IRJP editor or editorial board members.