doi doc url //eprints.lib.hokudai.ac.jp/dspace/bitstream/2115/...feeding and ranging behaviors of...
TRANSCRIPT

Instructions for use
Title Feeding and Ranging Behaviors of Proboscis Monkey Nasalis larvatus in Sabah, Malaysia
Author(s) Matsuda, Ikki
Issue Date 2008-03-25
DOI 10.14943/doctoral.k8718
Doc URL http://hdl.handle.net/2115/34633
Type theses (doctoral)
Additional Information There are other files related to this item in HUSCAP. Check the above URL.
File Information Matsuda.pdf
Hokkaido University Collection of Scholarly and Academic Papers : HUSCAP

.
Feeding and Ranging Behaviors of Proboscis Monkey Nasalis larvatus in Sabah, Malaysia
A Ph.D. Dissertation Submitted to
Graduate School of Environmental Earth Science,
Hokkaido University
By
Ikki Matsuda
2008

.
CONTENTS
SUMMARY ……………………………………………………..…...…… i - iv
INTRODUCTION …………………………………………………….….. 1 - 5
STUDY AREA ………………………………...………………………...... 5 - 7
METHODS
1. Surveys of topography and vegetation ……………..……………..…….. 7
2. Behavioral observation of BE-Group …...…………………………..…... 8 - 10
3. Boat census along the river ………………………………………......… 10
RESULTS
1. Number and composition of groups ……..……………………..……..... 11
2. Selection of sleeping sites …………………………………………………. 11 - 13
3. Activity budget …………………………….………………….………. 13 - 15
4. Food habits
4. 1. Vegetation and food menu …..…………………………………… 16 - 17
4. 2. Spatiotemporal distribution of food sources ………………....…...... 17
4. 3. Food preference …………………...……..…………………..… 18 - 19
4.4. High preference for fruits, especially seeds ……………….………... 19 - 22
4. 5. Seasonal trend of food menu diversity ……………...…………...… 22
4. 6. Consumption of tree barks, termite nests and water …...…………..... 22 - 23
5. Ranging behavior
5. 1. Home range ……………………………….…………....……. 24
5. 2. Travel distance …………………………………………….…. 24 - 25
5. 3. Behavioral core trees ……………………………………...….. 25 - 26
5. 4. Effects of water level on ranging ……….…………..……….… 26 - 27
DISCUSSION
Feeding Behavior………………………………………...…………………… 27 - 33
Ranging Behavior and Predation Pressure ………………………………….... 33 - 40
Conservation Implications ………………………………………………….... 40 - 42
ACKNOWLEDGMENTS …………………………………………......… 43 - 44
REFERENCES ………………………………………………………..…. 45 - 53
11 Tables, 37 Figures and 1 Appendix

i
SUMARRY
A one-male group (BE-Group) of proboscis monkey Nasalis larvatus consisting
of the α-male Bejita, six adult females and some immatures was chosen and focal
male and females in BE-Group were followed for a total of 1,968 and 1,539 hours,
respectively, along the Menanggul River (which is a tributary of the Kinabatangan
River), Sabah, Malaysia, focusing on feeding and ranging behaviors from May 2005 to
May 2006. In order to determine the availability and seasonal changes of plant species
consumed by the focal monkeys, vegetation surveys were carried out in 2.15 ha along
16 200-500 m trails set up in the forest. In addition, sleeping sites of all the groups in
the area were surveyed in the evenings of 6-22 days per month using a boat along the
river side. The main results were:
1) Sleeping sites of BE-Group were distributed in a wide range of overlap with
those of other groups, suggesting no territoriality between different groups on the
riverside trees. BE-Group seemed to select their sleeping sites on riverside trees at
narrow river locations to reduce the predation chance of clouded leopard and/or to raise
the probability of successful river crossing by females (often with infants) and juveniles
to escape from predators.
2) As there was no difference in time budget between individuals excluding the
category others (grooming + copulation) which contributed very little, the data of all
focal monkeys were pooled, and its resting, feeding, moving and others accounted for
76.4%, 19.5%, 3.5% and 0.5%, respectively. In the feeding time, young leaves, fruits,
flowers, mature leaves and other food sources constituted 65.9%, 25.9%, 7.7%, 0.03%
ii
and 0.5%, respectively, indicating that the tendency of consuming young leaves was
strong in terms of total food amount. However, monthly fruit production of plants
positively correlated with monthly fruit-eating and feeding activity of proboscis
monkeys, respectively, though young leaf production to young leaf-eating and flower
production to flower-eating did not correlate with each other, respectively, and both
young leaf and flower production did not correlate with feeding activity. These
suggest that fruit production significantly affects the activity budget of proboscis
monkeys.
3) In both the male and females, the ratio of feeding time was the highest at 15:00
- 17:00, i. e. shortly before sleeping. As proboscis monkeys require about 50 hours for
processing leaves, they may feed on lots of foods in late afternoon to spend the night
time not only for sleeping but also for digestion.
4) Total number of plant species consumed by focal monkeys was 188 (127
genera, 55 families). When the availability of each species was estimated from the
vegetation survey in which 180 tree and vine species were described and monthly
followed their phenology, the actual observed time for consuming them was
significantly different from consumption time expected from availability in some
species, suggesting that the proboscis monkey is the picky eater. For instance,
Mallotus muticus, Ficus binnendijikii, Crudia reticulate, Lophopyxis maingayi and so
on were positively preferred by proboscis monkeys.
5) The seven focal monkeys spent a total of 177.2 hours for fruit-eating, of which
seed-eating constituted 97%, suggesting that the proboscis monkeys seemed to consume
the fruits in favor of seeds. Whenever monkeys collected ripe fruits, they abandoned

iii
flesh and consumed only seeds. They fed extensively on the seeds of Mallotus muticus
trees and Lophopyxis maingayi vines which were the most abundant plant species in the
study area, although some dominant and predominant species were not consumed or
showed negative food preference. Because the proboscis monkeys almost completely
grind and digest the seeds of these abundant plant species, in this study site, they may
limit too much increase of the predominant species and permit minor plant species to
survive in the community.
6) Nonetheless, some seeds of Antidesma thawaitesianum, Nouclea subdita and
Ficus spp. remained undigested in the feces of proboscis monkeys. The undigested
seeds were small and relatively hard and were found in intact shape. Especially seeds
of Ficus spp. were often found in feces when the proboscis monkeys often fed on its
fruits, and Ficus species have been thought to be one of the most important plant
species for a lot of wildlife. There is a possibility that proboscis monkeys may play
the role of seed dispersal for a few plant species.
7) During 1,968 hours, the BE-Group moved within the range of 138.3 ha. The
ranging of proboscis monkey was affected by the location of river crossing points and
the availability of foods, in particular fruits.
8) The daily path length of BE-Group ranged from 220 m to 1,734 m (mean: 799
m) which was negatively correlated with fruit availability. The proboscis monkeys
were apt to stay within a small range in fruit-abundant seasons.
9) BE-Group sometimes stayed within a limited area to frequently visit a
particular tree which produced their favorite foods. Out of positively preferred trees or
vines, Crudia reticulate, Cynometra ramiflora and Carallia brachiata could be such

iv
behavioral core trees.
10) Since the water level of the river had a statistically significant effect on the
location of BE-Group’s sleeping site, when more than 3 m deep water covered the forest
floor more than 1 km from both sides of the riverbank towards the inland in seasonal
flood, the group slept inside the forest. It may be that the proboscis monkeys are not
restricted to the riverbank, which has an uncluttered view for easily finding predators,
because of reduced predation pressure by terrestrial animals during times when high
water levels prevent predators from hunting.
Thus, the feeding behavior of proboscis monkeys shows a high degree of
fruit-eating (or seed-eating) in some seasons, and their extremely wide dietary diversity
was demonstrated. Therefore, the ranging behaviors of proboscis monkeys were
influenced by availability of fruits. The fruit-eating and fruit availability were one of
the key factors to control the feeding and ranging behaviors of proboscis monkeys. In
addition to those factors, ranging behaviors, including the sleeping sites selection of
proboscis monkeys may be affected by predation pressure. In any case, the riverine
forest of at least 800 m from the both river banks is evidently needed for the surviving
of proboscis monkeys.

- 1 -
INTRODUCTION
The proboscis monkey (Nasalis larvatus) belongs to the subfamily Colobinae,
distributed in Asia and Africa that includes 44 species of 7 genera and 15 species of 3
genera, respectively (Groves, 2001; Fashing, 2007; Kirkpatrick, 2007). The monkeys
in this subfamily are characterized by a reduced thumb and an enlarged and sacculated
forestomach (Napier and Napier, 1967 and 1985; Napier, 1985). The forestomach with
fermenting bacteria enables the digestion of cellulose and deactivates toxins in leaves
(Bauchop and Martucci, 1968; Kay et al., 1976; Bauchop, 1978; Chivers and Hladik,
1980; Waterman, 1984). The endemic proboscis monkeys in Borneo Island inhabit
mangrove, peat swamp and riverine forests. They exhibit sexual dimorphism; that is,
the body size of adult males, which have a long and hanging nose, is the largest among
colobine species and their weight reaches about 20-24 kg, whereas adult females have a
much shorter nose than that of the males and their weight is about 10 kg (Allen and
Coolidge, 1940; Schultz, 1942; Napier and Napier, 1985). Furthermore, proboscis
monkeys are adept at swimming in rivers and walking on soft mangrove because their
hind feet have webbed toes (Napier and Napier, 1967; Napier, 1985). Even though
earlier research on proboscis monkeys reported stable or loosely organized multi-male
groups (Kern, 1964; Kawabe and Mano, 1972; Jeffrey, 1979; Macdonald, 1982), recent
studies have revealed that the monkeys are evidently organized into stable one-male
groups consisting of one adult male, several females and their offspring and all-male
groups consisting of young males (Benett and Sebastian, 1988; Yeager, 1989 and 1995;
Murai, 2004a, 2004b, 2006 and 2007).

- 2 -
Whereas substantial detailed research on Asian and African colobines has been
conducted until now (Struhsaker, 1987; Fashing, 2007; Kirkpatrick, 2007), only a little
information on proboscis monkeys has been reported because some of their favorite
habitats are swampy and thus prevent the observation and tracking of the monkeys in
inland forests. Nonetheless, since proboscis monkeys always come back to the
riverbank for sleeping (Kern, 1964; Kawabe and Mano, 1972; Jeffrey, 1979; Bennett,
1986a; Bennett and Sebastion, 1988; Yeager, 1989) even though the reason why the
riverbank is a preferred sleeping site has not yet been resolved, most earlier long and
short-term research has been conducted by observing from a boat on the river while the
monkeys are on the riverbank in the early morning and late afternoon.
In the previous boat-based studies on feeding behavior of proboscis monkeys,
those conducted over shorter time periods conclude that food habits of proboscis
monkeys show a high degree of folivory and low food diversity (Kern, 1964; Kawabe
and Mano, 1972; Macdonald, 1982) whereas the importance of fruit-eating in their food
habits and relatively higher food diversity is reported in longer term studies (Yeager,
1984 and 1989; Salter, et al. 1985; Benett and Sebastian, 1988). Since Yeager (1989)
reports that the monkeys seasonally changed their food parts (fruit, flower and young
leaf), the short-term studies might not cover a long enough period of time to observe
their various feeding behaviors, including their fruit-eating. However, in observing
proboscis monkeys only from the river by boat for a limited time, there is a limit in the
ability to determine their feeding behaviors and whether they have a strong tendency for
fruit or leaf-eating because the monkeys spend daytime mostly in the forest. Similarly,
it is difficult to estimate the amount of their feeding time in a day when observing from

- 3 -
a boat on the river, although one report on proboscis monkeys by Salter et al. (1985), is
conducted both by boat and occasional foot survey, represents the activity budgets and
the daily rhythm of feeding amount in a day. According to this report, proboscis
monkeys spend most of their time resting, feeding or moving as the amount of these
activities differs between forest types and the daily feeding rhythm fluctuates with a
peak at 13:00-15:00.
In addition to the feeding behavior of proboscis monkeys, their ranging
behavior has not yet been studied in detail as terrain problems also make it difficult to
follow the monkeys in the forest. Their ranging behavior is usually investigated from
the location of their observed sleeping site by boat survey. The sleeping sites of
proboscis monkey’s one-male groups overlapped each other (Benett and Sebastian,
1988; Yeager, 1989; Murai 2004a) and their home range sizes, which are estimated by
the length of the riverbank used, differ between habitats in one male groups: 315 ha in
mangrove forests (Boonratana, 1993); 900 ha in mixed mangrove and lowland forests
(Benett and Sebastian, 1988); 137 ha in peat swamp forests (Yeager, 1989); 221 ha in
riverine forests (Boonratana, 2000). Only Boonratana’s figure of 221 ha in riverine
forests is calculated by tracking the monkeys in the forest.
One report suggests that the ranging behavior of proboscis monkeys may be
affected by spatial and temporal distribution of food availability (Boonratana, 2000), as
reported from other primates (Clutton-Brock, 1975; Raemaekers, 1980; Oates, 1987;
Bennett and Davies, 1994; Olupot et al., 1994; Koenig, 2000; Di Fiore, 2003;
Kirkpatrick, 2007; Lambert, 2007). It is also said that predation pressures are an
important factor affecting ranging behaviors and social systems of primates, although

- 4 -
the estimation of predation rates is difficult as predation events on any type of primate
are rarely observed (Cheney and Wrangham, 1987; Miller and Treves, 2007). In
proboscis monkeys, three accidental observations of predations on adult males by false
gavial (Tomistoma schlegeli) (Galdikas 1985) and by clouded leopard (Neofelis
nebulosa) (Davis, 1962; Jackson & Nowell 1996) and one case of predation on an
adolescent female by false gavial has been reported (Yeager 1991a). Of the four
reports, Yeager (1991a) suggests that the ranging behavior and social system of
proboscis monkeys is affected by predation pressure when they cross the river, as this
behavior exposes monkeys to a high risk of predation by aquatic predators such as
crocodiles.
Compared with the research on feeding and ranging behavior of proboscis
monkeys, the research on their social system is the most focused theme in former
studies since it is relatively easy to observe the relationship between the groups even by
boat from the river. Recent long-term studies suggest that the proboscis monkey has a
multi-level society in which one-male groups regularly associate with each other at least
along the riverbank (Benett and Sebastian 1988; Yeager 1991b and 1992; Boonratana
2002; Murai 2004a). The degree of association between one-male groups at the
riverbank may be influenced by the water level of the river and/or predation pressure
(Yeager 1993; Murai 2004a). However, it is still unknown whether the association
between the groups is maintained even in the forest.
Because of the limited habitat of proboscis monkeys along the river, the World
Conservation Union (IUCN) reported in 1978 that the major threat to their population is
habitat loss through logging. Their conservation status has been classified as

- 5 -
“endangered” since 2000 by IUCN, and this species is listed on Appendix I by the
Convention of International Trade in Endangered Species (CITES). To conserve this
endangered species, several studies for population estimation have been conducted: <
300, 1000, 5000 and 6000 individuals in Brunei Bay, Sarawak, protected reserves in
Kalimantan and Sabah, respectively (Bennett, 1986b; Yeager and Blondal, 1992; Sha
2006), while the ecological data for the preservation of proboscis monkeys (especially
feeding and ranging data in the forest), which should be useful information when
establishing new forest reserves and replanting plant species at logged areas is hardly
known.
Thus, as there is a total lack of behavioral data on proboscis monkeys inside the
forest in past studies, to understand their ecology and preserve this endangered species,
information about this monkey inside the forest is needed in every category. The
present study, which is the first systematic research on a one-male group of proboscis
monkeys observed not only at the riverbank but also inside the forest throughout a day,
provides information focusing on their feeding and ranging behaviors.
STUDY AREA
This study was made from January 2005 to May 2006 in riverine forests along the
Menanggul River, a tributary of the Kinabatangan River, Sabah, Malaysia (Fig. 1).
Whereas the southern area of the Menanggul River was extensively covered by natural
forest, the northern area had been deforested for oil palm plantations except for a legally

- 6 -
protected zone along the river. The riverine forest was inhabited by not only proboscis
monkeys but also long-tailed macaques (Macaca fascicularis), pig-tailed macaques
(Macaca nemestrina), silver langurs (Trachpithecus cristatus), hose’s langurs (Presbytis
hosei), bornean gibbons (Hylobates muelleri) and orangutans (Pongo pygmaeus).
Although the main objective of this study was to investigate the behavior and food
habits of proboscis monkeys, the food habits of other primates were also described
facultatively. This area is one of tourism resources, and many boats and tourists
visited the Menanggul River (especially in June-September), with the peak in
September when an average of 12 boats and 70 tourists were counted per day (Fig. 2).
The rainfall was measured every morning at base camp, using a tipping bucket
rain gauge. The air temperature was automatically recorded by a HOBO Water Temp
Pro deposited at a lodge near the mouth of the Menanggul River. I firmly stuck a 5 m
tall board of Borneo ironwood Eusideroxylon zwageri which was scaled at intervals of
10 cm, with 0 cm at the river bottom, onto the floor of river mouth to measure the water
level. Whenever I entered the Menanggul River 20-26 days per month, the water level
was checked at 18:30-19:00. Mean minimum temperature was nearly constant at
about 24°C throughout a year but mean maximum temperature fluctuated between
27.4°C in February and 32.5°C in September (Fig. 3). Annual precipitation from June
2005 to May 2006 was 2,509 mm (Fig. 4A). Although monthly rainfall fluctuated
from 90.9 mm in August to 560.6 mm in February, the dry season was not as clear as in
the Samunsam Wildlife Sanctuary, western Sarawak, Malaysia (Basiuk, 1985; Bennett
and Sebastian, 1988). In parallel with the fluctuation of monthly rainfall, the mean
water level at the river mouth was highest in February (345 cm) and lowest in August

- 7 -
(66 cm) (Fig. 4B).
METHODS
1. Surveys of topography and vegetation
Prior to the beginning of regular surveys from May 2005, I made a topographic
map of the study areas by using GPS. Along the Menanggul River, datum points were
located at intervals of 50 m over an area stretching from the river mouth to a point 6 km
upstream. At intervals of 500 m and over an area stretching from the river mouth to a
point 4,000 m upstream, 200-500 m long and 1 m wide trails were set up (Fig. 1) by
cutting off the floor layer of vegetation for the ready observation and following of
proboscis monkeys. Along the trail, I labeled the trees of DBH ≥ 10 cm and vines of
diameter ≥ 5 cm which were located on the trail or within 1 m from the edge of the trail,
i. e. surveyed width = 3 m. All of the labeled trees and vines were measured DBH and
taxonomically identified with the support of the Forest Research Center of Sabah State
Forestry Department. Since trails were set up on both riversides, the total number of
trails was 16: TR 2 = 200 m long, TR 4 = 400 m, TR 6 = 400 m, TR 8 = 250 m, TR 10 =
400 m and other trails = 500 m each. From May 2005, the trees and vines were visited
at the end of each month to follow their phenology, that is, presence or absence of
flowers (including floral buds), fruits (including ripe and unripe fruits) and young leaves
(including leaf buds).

- 8 -
2. Behavioral observation of BE-Group
Prior to following a particular one-male group, I made a preliminary observation
of some one-male groups to choose a group which seemed appropriate for the present
study. In the study area, all of the one-male groups were relatively habituated to
tourists on the river. However, once researchers attempted to land on a riverbank, the
proboscis monkeys became excited and escaped into the forest, but not BE-Group
whose α-male, Bejita, was unperturbed by the landing researchers and the other
members of the group followed his attitude. Then, I carefully approached them almost
everyday in the second half of April 2005 to habituate them to researchers. During this
preliminary observation, I described some physical characteristics of BE-Group’s α
-male and all adult-female members to identify them from proboscis monkeys of other
one-male groups.
From the beginning of May 2005 to May 2006, the focal monkeys (which were
all adults) in BE-Group were followed continuously from the time they were found
until evening each day through a focal animal sampling method (Altman, 1974). At
06:00-06:30 a. m. of each sampling day, I and two research assistants arrived at the
BE-Group’s sleeping site which had been determined the previous evening. The α
-male Bejita was always focal and another focal monkey was chosen from the
adult-female members by attempting to avoid the choice of the female followed on the
last day. Of the three researchers, one followed the male, one followed the focal
female and the other one supported the two followers. They followed the focal
monkeys until the BE-Group set up their sleeping site and started sleeping at
18:30-19:00, though, if the focal female was lost from the researcher’s sight for more

- 9 -
than 30 minutes, one of the other females was chosen as a new target. The monkeys
were followed 11-17 days per month, except in February 2006 when the study area
was totally flooded and BE-Group was not discovered for almost one month due to
their migration in the forest. In March, when the forest floor was flooded but
BE-Group was fortunately found, the focal monkeys were followed by using boat even
in the deep forest.
During observations, activities of the focal monkeys were recorded in seconds.
The researchers recorded the time the focal monkeys started and ended the following
three activities, i. e. resting, moving and feeding, in seconds. Behaviors other than
these three categories were treated as others. Resting includes all instances in which
the subject was inactive, defecating or urinating. Moving includes any locomotor
behaviors resulting in a change in spatial position. Feeding includes the acts of
plucking, masticating, swallowing food or drinking water. Others include social and
self grooming and copulation. When the focal monkeys were feeding, we recorded
whether the food items consisted of young leaves (including leaf buds), flowers
(including floral buds), fruits (ripe and unripe fruits), or others (including tree barks and
termite nests). The food plants were taxonomically identified in situ and recorded, but
if the food plant species was yet unidentified, leaves, flowers and/or fruits were
collected from the plant for identification at the Forest Research Center. To certify that
fruit-eating resulted in the seeds being defecated, some feces were examined in situ,
though seeds of only a few plant species remained intact. While following Bejita, his
geographical points were located by GPS at intervals of 10 minutes. The daily path
length of Bejita from one sleeping site to the next sleeping site was considered as

- 10 -
BE-Group’s daily path length in this paper, because all group members traveled almost
the same route and the focal females rarely moved more than 50 m away from Bejita.
3. Boat census along the river
Proboscis monkeys have been thought to set up their sleeping sites on the
riverside trees (Kern, 1964; Kawabe and Mano, 1972; Jeffrey, 1979; Bennett, 1986a;
Bennett and Sebastion, 1988; Yeager, 1989) (Fig. 5). In order to observe the
distribution of sleeping sites, membership of one-male groups, all-male groups and
mixed groups and the number of these groups and solitary monkeys, a boat census was
conducted starting from a point 6 km upstream of the river mouth in the evening of 6-13
days per month except in February 2006 when the boat census was carried out in the
evening of 22 days partly in search of the lost BE-Group. At 16:00-16:30, we started
the boat census from 6 km upstream, went down the river slowly to the river mouth, and
finished before it got dark at 18:00-18:30. Whenever a group was found in each
census, the member composition was recorded by categorizing the monkeys into five
sex & growth stage groups (Table 1). In each boat census, because the survey was
carried out traveling only one way on the river, the same groups were not counted
double.

- 11 -
RESULTS
1. Number and composition of groups
In each boat census, 2-15 one-male groups were observed, except in February and
March when the study area was entirely flooded and almost all of the groups traveled in
the forest without returning to the riverbank for sleeping (Table 2). The size of the
one-male groups was 2-29 individuals, with a mean number of about 5 females and 5-8
immatures (subadults, juveniles and infants). In addition to the one-male groups, there
were a few mixed groups which referred to a loosely bonded predominantly male group
with several females, all-male groups and solitary monkeys. The membership of
mixed groups and all-male groups seemed unstable. The solitary monkeys were rarely
observed and most of the monkeys found were males. Overall, 21-218 individuals of
proboscis monkeys were observed in each census, i. e. with 3.5-29.8 individuals / km,
suggesting that the number of proboscis monkeys which could be found in the study
area at the riverbank fluctuates greatly from day to day due to the differing time each
group would return to the riverbank.
2. Selection of sleeping sites
Figure 6 shows the temporal trends of the BE-Group’s sleeping sites along
riverbanks based on the data obtained from the 13-month observation of this one-male
group. They occasionally moved more than 1,000 m per day but usually stayed within
a limited range for several weeks or months, frequently crossing the Menanggul River.
During the 13-month observation, 261 sleeping sites of BE-Group (confirmed by
- 12 -
full-day observation and boat census) were distributed between 1,500 m and 5,180 m
from the river mouth (Fig. 7A). As for other groups, 621 sleeping sites (confirmed by
boat census) were distributed between 150 m and 5,650 m from the river mouth (Fig.
7B), with a wide range of overlap with the distribution of BE-Group’s sleeping sites,
suggesting no territoriality between different groups at least on the riverside trees. The
absence or inconspicuousness of between-group hostility is supported by Figure 8
representing that 100 sleeping sites of other one-male groups were located within 200 m
from BE-Group’s sleeping site. Thirty-seven sleeping sites were located within 50 m,
with occasional occurrences in which the same tree was shared. The nearest sleeping
sites of other one-male groups were frequently situated on the same riverside with
BE-Group’s sleeping site (Chi-square test: χ2 = 16.49 and p < 0.0001).
Over a total of 3,506 hours (Bejita: 1,968 hrs; females: 1,539 hrs), river crossings
by Bejita and focal adult females were observed 90 times and 65, respectively. The
frequency of pooled river crossings for Bejita and adult females was significantly higher
at the parts of the river where the width was narrower, between 1,400 m and 5,250 m
from the river mouth, which is the range of the riverbank used by BE-Group
(Generalized linear models with Poisson error and log link: coefficient -0.053 ± 0.020
and p (G) < 0.01). As shown in Figures 6 and 7, BE-Group often (15 times or more)
had sleeping sites at 2,650-2,700 m, 3,500-3,550 m and 4,200-4,250 m from the river
mouth. At these locations, the Menanggul River was as narrow as 15-20 m in width
(Fig. 9A) so that the α-male Bejita almost always successfully crossed the river from
tree to tree (Fig. 9B). Whereas females often failed jumping between-trees and fell
into the river, their success probability was higher at these locations than at others (Fig.

- 13 -
9B). The ratio of successful river crossings was 93% in the male, 53% in adult
females with infants, 56% in adult females without infants and only 32% in juveniles
(Fig. 10). Although I did not observe any deaths of the individuals which fell into the
river, the Menanggul River is inhabited by estuarine crocodiles (Crocodylus porosus)
which were thought to be one of the major predators for proboscis monkeys. In
following BE-Group, I happened to observe an infant and a juvenile suddenly attacked
and victimized by clouded leopard (Neofelis nebulosa) on 21 July 2005 and 8 April
2006, respectively (Fig. 11). BE-Group seemed to select their sleeping sites on
riverside trees at narrow river locations to reduce the predation chance of clouded
leopards and/or to raise the probability of successful river crossing by females (often
with infants) and juveniles to escape from predators.
3. Activity budget
Six focal adults, Chi-J♀, Bul-J♀, Bul-I♂, Lun-J♀, Lun-I♀, Ara-J♀ and Big-J
♀ survived and stayed in BE-Group throughout the 13 months, whereas a subadult
female, Ranfan, transferred to another one-male group in April 2006, Chi-I♂
disappeared for unknown reason in December 2005 and Ara-I♀ (Fig. 11A) was
victimized by a clouded leopard on 21 July 2005 (Fig. 12). In addition to these
members, new infants Big-I♂ and Ara-I♂ were born by Bigmama on 15 March 2006
and Arare on 27 January 2006, respectively, and a new female adult member Midori and
her daughter Mi-J♀ transferred into BE-Group from another one-male group on 15
March 2006, though Mi-J♀ was victimized by a clouded leopard on 8 April 2006 (Fig.
11B). In the observation of this group, the new member Midori was also treated as one

- 14 -
of focal members. During the 13 months, the adult male Bejita was followed for a
total of 1967.8 hours and adult females were followed for 48.2 hours (Midori) to 681.7
hours (ChiChi) (Table 3). An average of 12.5 ± 1.6 hours per day made for a total of
3,506 hours
As depicted in Table 4, the difference in time budget among seven focal monkeys,
even including the new member Midori, was not significant for resting (One-way
ANOVA: F = 1.03 and p = 0.40), feeding (F = 1.14 and p = 0.34) and moving (F = 1.35
and p = 0.23) consisting 73.9-79.6%, 16.4-21.0% and 3.0-3.6%, respectively, but
significant in others (grooming + copulation) (Kruskal-Wallis-test: H = 45.5 and p <
0.01) constituting 0.1-2.4%. Thus, as there was no difference in time budget between
individuals excluding the category others which contributed very little, the data of all
focal monkeys were pooled, and its resting, feeding, moving and others accounted for
76.4%, 19.5%, 3.5% and 0.5%, respectively (Total in Table 4). Including about
12-hour stays at night at sleeping sites, proboscis monkeys spent about 21 hours / day
for resting and sleeping and only about 3 hours / day for activities. Sexual difference
in time budget was significant for feeding (t-test: t = 2.02 and p = 0.04), moving (U-test:
U = 10003.5 and p = 0.04) and others (U = 16140 and p < 0.0001) (Fig. 13). The male
would spend more time on feeding than female to maintain his larger body. As the
male frequently retraced the way he came to bring back the females separated from
BE-Group, he would spend more time on moving than female. Females more
frequently performed grooming to other females, infants and juveniles while the male
more frequently performed copulation. Among activities, moving and others
constituted only 2.3-4.3% and 0.05-1.3% per month, respectively, and therefore feeding

- 15 -
seemed a key factor which determined the activity budget of proboscis monkeys. To
confirm the seasonal fluctuation of feeding activity, I examined the seasonal fluctuation
of defecation frequency. The seasonal fluctuation of mean daily defecation frequency
was significant in both the male (One-way ANOVA: F = 7.96 and p < 0.01) and females
(Kruskal-Wallis-test: H = 41.43 and p < 0.01), with a high peak from June to August
and another peak in November (Fig. 14A). As mentioned in the following section,
monthly fruit production of plants positively correlated with monthly feeding activity
(Pearson product-moment correlation coefficient: r2 = 0.37 and p = 0.04) and
fruit-eating (r2 = 0.61 and p = 0.003) of proboscis monkeys, respectively, and fruit
production and fruit-eating was the largest July to August. However, monthly young
leaf and flower production of plants did not correlate with young leaf- and flower-eating,
respectively (young leaf: r2 = 0.18 and p = 0.17; flower: r2 = 0.01 and p = 0.74) and
feeding activity (young leaf: r2 = 0.08 and p = 0.38; flower: r2 = 0.02 and p = 0.70).
These suggest that fruit production significantly affects the activity budget of proboscis
monkeys. Figure 14 additionally shows the seasonal fluctuation of urination frequency,
also with a peak in June-July. The fluctuations in daily feeding rhythm were
statistically significant in both the male (One-way ANOVA: F = 4.94 and p < 0.01) and
females (F = 3.48 and p < 0.01) (Fig. 15), with a peak at 15:00-17:00, i. e. shortly before
sleeping.
- 16 -
4. Food habits
4. 1. Vegetation and food menu
In the survey of vegetation along 16 trails, 1,645 trees and 497 vines of 180
species (124 genera, 46 families) were described (Table 5). Predominant species were
Mallotus muticus, Excoecaria indica, Dillenia excelsa, Croton oblongus, Nauclea
subdita, Xylosma sumatrana, Pternandra galeata, Vitex pinnata, Vatica rassak and
Antidesma thwaitesianum in trees and Lophopyxis maingayi, Croton caudatus,
Dalbergia parvifolia, Hydnocarpus sumatrana, Entada rheedei, Bridelia stipularis,
Albizia corniculata, Artabotrys suaveolens, Bauhinia diptera and Millettia
nieuwenhuisii in vines. Since DBH markedly varied among species and growth stages,
total basal area of each species is also shown in Table 5. Whereas the surveyed area
reached as large as 2.15 ha (3 m width × 7,150 m length), the cumulative number of
plant species did not plateau (Fig. 16) due to extremely high species diversity in tropical
riverine forests. Accordingly, the total number of plant species consumed by focal
monkeys during a total of 3,506 hours was 188 (127 genera, 55 families, Fig. 17 and
Table 6), exceeding the total number of plant species described in the survey of
vegetation (180 species). The proboscis monkeys frequently ingested young leaves,
fruits and flowers and occasionally mature leaves and others (barks of Eugenia sp. 2 and
nests of termite Microcerotermes distans), and the difference of the composition of each
plant part among seven focal monkeys was not significant in young leaves (One-way
ANOVA: F = 0.78 and p = 0.58), fruits (F = 0.87 and p = 0.52), flowers
(Kruskal-Wallis-test: H = 6.94 and p = 0.22) and others (H = 0.70 and p = 0.87) (Table
7). Thus, as there was no difference in the composition of the plant parts consumed

- 17 -
between individuals, the data for the focal monkeys were pooled, and young leaves,
fruits, flowers, mature leaves and others constituted 65.9%, 25.9%, 7.7%, 0.03% and
0.5%, respectively (Total in Table 7). The numbers of plant species providing young
leaves, fruits and flowers were 182, 49 and 28, respectively, with overlaps as shown in
Figure 18.
4. 2. Spatiotemporal distribution of food sources
Every month, excepting February, 2006, when the study area was flooded with
3-4 m deep water and the tagged trees and vines could not be identified, phenology of
the 2,142 plants along the 16 trails was surveyed by examining whether each plant had
young leaves, fruits and/or flowers. Out of the 2,142 plants, 1,902 were of species
consumed by focal monkeys: 1,899 plants for young leaves; 919 for fruits; 469 for
flowers (Fig. 19). Figure 20 represents the spatiotemporal distribution of plants with
fruits, flowers or young leaves. Young leaves were highly available in all seasons and
all trails (Fig. 20A) and flowering trees and vines showed relatively even distribution
across the trails and seasons (Fig. 20B). In contrast, the abundance of fruiting plants
was distorted to particular seasons and trails (Fig. 20C). Spatially, the fruiting plants
were more abundant on the southern side (trail of odd numbers), especially on TR 13,
than the northern side (trails of even numbers). Seasonally, the availability of fruits
was higher in July-August and November but lower in May than in other months.

- 18 -
4. 3. Food preference
In 48 of 180 species described in the vegetation survey along the 16 trails, the
number of plants exceeded 12 which was the mean number of plants per species, i. e.
2,142 plants / 180 species. Out of the 48 dominant species, 16 species had many fruits
and flowers but proboscis monkeys did not consume their fruits or flowers at all for
unknown reasons, whereas orangutan or long-tailed macaque was facultatively observed
consuming fruits of five of those species (Table 8). Out of the five species, Vitex
pinnata, Microcos crassifolia and Dracontomelon dao had seeds which seemed too hard
for proboscis monkeys to consume. Fruits of Entada rheedei appeared too large and
hard for proboscis monkeys to take the seeds out of the fruits. Excoecaria indica was
one of the predominant tree species in the study area and produced a lot of fruits
throughout a year but neither proboscis monkeys, orangutans or long-tailed macaques
consumed any fresh fruits and flowers on the trees, though a group of long-tailed
macaques was once observed taking some old and dry E. indica fruits floating in the
river. Even young leaves of this plant species were rarely consumed by proboscis
monkeys. This species may have some chemicals which are toxic or repellent for the
nonhuman primates. The proboscis monkeys did not consume any fruits and flowers
of the predominant species Croton caudatus and C. oblongus, with very rare
consumption of young leaves. Their fruits and young leaves exerted a specific smell,
suggesting the presence of some toxic or repellent chemicals.
To test the proboscis monkeys’ preference for edible plant species, time spent for
consuming each plant species was compared with time expected from its availability.
The availability of each part (flowers, fruits and young leaves) was calculated using the
- 19 -
following formula. Availability = Bk · ∑ (nki / Nk) / 12 where Nk is the total number
of plants, nki is the number of tree or vine plants with flowers, fruits or young leaves in
month i and Bk is total basal area per hectare in the species k. As shown in Table 9, the
availability of each species was given by basal area, and G-test was conducted for trees
and vines separately. Thus, the plant species were divided into six categories, i. e.
(vine and tree) × (fruits, flowers and young leaves), and observed data and expected
values were compared by using G-test (Table 9) for each category. Accordingly, the
difference between observed data and expected values was statistically significant in all
of the six categories (G = 31307 and p < 0.0001 in tree fruits; G = 4686 and p < 0.0001
in vine fruits; G = 5860 and p < 0.0001 in tree flowers; G = 2405 and p < 0.0001 in vine
flowers; G = 56541 and p < 0.0001 in tree young leaves; G = 11259 and p < 0.0001 in
vine young leaves). In Table 9, the preferences of proboscis monkeys were
categorized into positive (PO), negative (NG) and neutral (NU) preferences when the
observed consumption was considerably larger, smaller than and nearly equal to the
availability, respectively: observed or expected time is more than 180 minutes and the
ratio of observed time to expected time is > 2.0 (PO), < 0.5 (NG) and 0.5 < 2.0 (NU).
4.4. High preference for fruits, especially seeds
As shown in Figure 13, the percentage of time spent for feeding exhibits
remarkable seasonal fluctuation. To examine the contribution of fruit, flower and
young leaf consumptions, the seasonal fluctuations of the three factors are separately
represented in Figure 21A. Flower consumption was constantly low throughout a year.
Since the proboscis monkeys were primarily leaf eaters, young leaves almost constantly

- 20 -
contributed to their food habits at a high level. In contrast, fruit consumption was very
low in some seasons but exceeded the percentage of young leaves in July and August,
indicating the high contribution of fruits to the seasonal fluctuation of feeding activity.
For young leaves, fruits and flowers, the male-female difference of seasonal fluctuation
was not statistically significant (U-test: U = 10059 and p = 0.28; U = 11641 and p =
0.28; U = 10277 and p = 0.43, respectively) (Fig. 21B-D).
The seven focal monkeys spent a total of 177.2 hours for fruit-eating, of which
unripe fruits constituted 90.4% (Fig. 22A). A fruit was composed of seed, flesh and
calyx, and the proboscis monkeys spent 32.9%, 2.1% and 0.9% of 177.2 hours for
consuming only seeds, flesh and calyxes, respectively (Fig. 22B). When the seeds and
the flesh of the fruit firmly stuck to each other and seemed difficult to be separated,
proboscis monkeys concurrently consumed both the seeds and flesh in most cases
(64.1% of the time). Accordingly, seeds made up 97% of 177.2 hours, suggesting that
the proboscis monkeys seemed to consume the fruits in favor of seeds. Whenever
monkeys collected ripe fruits, they abandoned flesh and consumed only seeds.
Fruit consumption by the focal members of the BE-Group was observed for a
total of 49 plant species (Table 10), and seeds were consumed in 48 species, excepting
Ziziphus borneensis which had extremely hard seeds. On the other hand, calyxes were
consumed in only Alseodaphne insignis (Table 10). The growth of A. insignis fruits
could be divided into four stages (Fig. 23). In unripe stage 1, the calyx was fresh and
larger than the flesh, in which the seed was indistinct (Fig. 23A). In unripe stage 2, the
calyx was still fresh and the flesh became large, with an immature seed (Fig. 23B). In
unripe stage 3, the flesh grew up to full size with a still immature seed, and the calyx

- 21 -
was withered (Fig. 23C). In the ripe stage, the flesh was juicy with a mature seed (Fig.
23D). Proboscis monkeys consumed only calyxes in unripe stage 1, calyxes and flesh
in unripe stage 2 and only seeds in unripe stage 3 and ripe stage. A. insignis was so
rare in the study area that no trees of this species were described in the vegetation
survey along 16 trails. Nonetheless, the focal members repeatedly visited three ca.
20-25 m tall trees of A. insignis near TR 13. Of the three, two trees (I and II) were
located near the riverside and the other tree (III) was about 100 m away from the
riverside. Whereas trees I and III produced fruits for at least four months from
October to January, proboscis monkeys frequently visited in only December and
January (Fig. 24) when the fruits had seeds, indicating that the main targets of the
monkeys were not calyxes or flesh but seeds. The consumption of calyxes in April
may suggest that the phenology of A. insignis is not well synchronized among trees.
In the observation of BE-Group, feces content was examined in 400 feces
samples of focal members, ranging from 19 feces in September to 71 in November.
Seeds were contained in 23 of 71 feces in November, 15 of 38 feces in December and 5
of 21 feces in March. The indigested seeds were of Antidesma thawaitesianum,
Nouclea subdita and Ficus spp. in November and December (Fig. 25A), which was
consistent with the fact that focal members of the BE-Group consumed fruits of A.
thawaitesianum and N. subdita mostly in November and December (Fig. 25B).
Species of Ficus, F. binnendijikii and F. globosa were relatively abundant in the study
area and their fruits were positively preferred by proboscis monkeys (Table 9).
Although F. binnendijikii had fruits throughout a year, the monkeys consumed only their
young fruits containing immature seeds which seemed digestible in their forestomach.

- 22 -
F. globosa had fruits from September to May and the monkeys consumed not only
young fruits but also pre-ripe or ripe fruits containing mature seeds. Most of the seeds
contained in the feces were probably of F. globosa. The mature seeds of A.
thawaitesianum, N. subdita and F. globosa were probably too small and hard to be
ground by teeth of proboscis monkeys.
4. 5. Seasonal trend of food menu diversity
The number of species consumed by the focal members of BE-Group seasonally
fluctuated, ranging from 36 species in September to 82 species in December, excepting
February when data was hardly obtained due to deep flooding (Fig. 26). The
Shannon-Wiener index of Diversity (H’) (Pielou, 1966) was used to calculate for food
menu diversity. Identified plant species were used in the analysis; unidentified plants
were not included. Except in February, food menu diversity H’ ranged from 2.28 to
3.37, with a low in July, September and May 2006, whereas evenness (J’) was nearly
constant at 0.6-0.8 (Fig. 26). The months with low diversity corresponded to the
seasons when the fruit consumption peaked (Fig. 21A). Stepwise regression analysis
detected a significantly negative correlation between the seasonal fluctuations of time
spent feeding on fruits and food menu diversity (H’) (p = 0.043, see Table 11).
4. 6. Consumption of tree barks, termite nests and water
In addition to fruits, flowers and young leaves, tree barks and termite nests were
consumed by proboscis monkeys (Fig. 27). In the study area, there were two species
of papery bark trees, Eugenia sp. 2 and Pternandra galeata. Whereas P. galeata was

- 23 -
more dominant than E. sp. 2, proboscis monkeys consumed papery bark of E. sp. 2 but
not of P. galeata. Since fruits and young leaves were negatively and flowers were
never consumed in P. galeata (Table 9), the trees of P. galeata might have some
chemicals repellent for proboscis monkeys. The bark of E. sp. 2 were consumed from
September to March (Fig. 28A). Especially in females, the bark feeding season was
restricted to three months from September to November. Although there were many
species of termite nests in the study area, proboscis monkeys consumed nests of only
arboreal species represented by Microcerotermes distans. Whereas the male Bejita
consumed the nests almost throughout a year, females consumed them only from
November to April (Fig. 28B).
In the study area, several 1-3 m wide streams were meandering through the forest
and many temporary pools appeared on the forest floor after heavy rains. Because in
leaf-eating monkeys, including proboscis monkeys, water is primarily supplied from
leaves in the process of digesting cellulose in their stomach, they rarely drank water.
Nonetheless, the focal male and female monkeys were observed drinking water 11 and
15 times, respectively. In addition, juveniles of BE-Group were facultatively observed
drinking water 14 times. When they drank water, the male always went down to the
forest floor to use such water sources as the river and small streams but juveniles almost
always hand-dipped from tree holes without descending to the forest floor (Fig. 29).
Females took water from the Menanggul River or small streams 12 times and from tree
holes three times. At the river, small streams and temporary pools, the monkeys drank
water for 21-80 seconds by putting their mouth into the water.

- 24 -
5. Ranging Behavior
5. 1. Home range
Over a total of 1,968 hours, BE-Group moved within a range of 138.3 ha, viz. 553
50 m × 50 m grids (Fig. 30). Because the group almost always had sleeping sites at
riversides, the frequently used grids were distributed along the Menanggul River. The
grids used 22 or more times were situated at 2,650-2,700 m, 3,500-3,550 m and
4,200-4,250 m where the Menanggul River was as narrow as 10-15 m in width and
BE-Group often crossed the river (cf. also Fig. 9). The core ranging area was located
around TR 13 where foods, in particular fruits, were most abundant from July to May
(Fig. 20C). Thus, Figure 30 suggests that the ranging of proboscis monkey is affected
by the location of river crossing points and the availability of foods, in particular fruits.
Whereas sleeping sites of one-male groups were often close to each other and they
exhibited less or no hostility near the riverside, different groups rarely encountered each
other in the deep forest and, if encountered, they showed aggressive behavior. During
the 13-month observation, the encounters (in which another one-male group was in a
radius of less than 50 m from BE-Group) were observed only three times, and in all of
the encounters Bejita drove off the rival α-males.
5. 2. Travel distance
Excepting the missing period in February, BE-Group traveled a total of 128.8 km
within the home range. The daily path length was from 220 m to 1,734 m, with a
mean distance of 799 m (Fig. 31). Although the group traveled long distances when
they moved along the Menanggul River, their daily path length rarely exceeded 1,000 m

- 25 -
when they traveled away from the river, evidently because they had to return to the
riverside for sleeping before sunset.
Figure 32 demonstrates the seasonal fluctuation of mean daily path length and
availability of fruits, flowers and young leaves. The daily path length significantly
correlated with the availability of fruits (stepwise regression analysis: p = 0.0028 see
Table 11) but not of flowers and young leaves. The negative correlation between the
daily path length and fruit availability indicates that proboscis monkeys were apt to stay
within a small range in fruit-abundant seasons. In addition, daily rainfall also seemed
to reduce the daily path length, though the rainfall accounts for only 4.8% of the
variation of daily path length (Spearman’s rank correlation tests: r2 = 0.048 and p <
0.01) (Fig. 33).
5. 3. Behavioral core trees
BE-Group sometimes stayed within limited areas to repeatedly visit particular
trees which produced their favorite foods. Out of positively preferred trees or vines
(Table 9), Crudia reticulate, Cynometra ramiflora and Carallia brachiata, which were
repeatedly visited (five or more times on different days), could be such behavioral core
trees. For instance, C. ramiflora had cigar like rolls of young leaves which seemed
very attractive to the proboscis monkeys. From 16 to 21 July, BE-Group was
frequently attracted to a large C. ramiflora tree near the riverside point which was about
300 m upstream from TR 16, and therefore the group traveled only 3,110 m during the
five days (Fig. 34). Out of tree species which were not described in the vegetation
survey but were observed to be consumed by proboscis monkeys, Artocarpus sp. 2 and

- 26 -
Garcinia rostrata could be behavioral core trees (cf. Table 6).
5. 4. Effects of water level on ranging
The ranging behavior of BE-Group dramatically changed when the study area
was partly flooded in early to mid January and entirely flooded from early February to
early March. The group came back to the riverside everyday until 10 January.
However, from 11 January when the water level reached 238 cm at the mouth of the
Menanggul River and the forest floor around trail 10 was covered by about 1 m deep
water, BE-Group started wandering in the forest without coming back to the riverside
until 17 January (Fig. 35A). While wandering in the forest, BE-Group had sleeping
sites at small open gaps or near former tractor roads (Fig. 36). From 18 January when
the water level was 185 cm at the river mouth and the water depth at TR 10 decreased to
about 40 cm, BE-Group began returning to the riverside again for sleeping (Fig. 35B).
Whereas BE-Group was lost in February, I happened to rediscover them on 3 March and
resumed following them by boat. In the second flood, the water covered a wide range
of forest including the southern area of the Menanggul River and the oil palm plantation
(Fig. 35C). Nonetheless, their traveling range was limited to within about 800 m from
the riverside as in the first flood, suggesting that proboscis monkeys can not be far away
from the river even in the deep floods.
During the 13-month observation, 270 sleeping sites of BE-Group were located:
261 sites on the riverbank and 9 sites inside the forest. The water level at the river
mouth ranged from 8 cm to 433 cm with a median 108 cm when the sleeping sites were
located on the riverbank, and from 220 cm to 398 cm with a median 250 cm when the

- 27 -
sleeping sites were located inside the forest (Fig. 37). The water level had a
statistically significant effect on the location of the sleeping site (logistic regulation
analysis: coefficient = 0.027 ± 0.006; likelihood ratio G-test: p < 0.0001).
DISCUSSION
Feeding Behavior
Although former studies on the feeding ecology of proboscis monkeys indicate a
high degree of leaf-eating and low food menu diversity (Kern, 1964; Kawabe and Mano,
1972; Macdonald, 1982), recent studies show a relatively high degree of fruit-eating and
food menu diversity: young leaves, fruits and flowers constitute 38%, 50% and 3% in
Samunsam, respectively (Benett and Sebastian, 1988) and 52%, 40% and 3% in Natai
Lengkus, respectively (Yeager, 1989); 90 plant species of 39 families in Bako (Salter et
al., 1985) and Samunsam and 47 plant species of 19 families in Natai Lengkus (Yeager,
1989) are reported for proboscis monkeys’ food habits. In this study, the feeding
behavior of proboscis monkeys also showed a high degree of fruit-eating in some
seasons although the tendency of consuming young leaves was strong in terms of total
food amount, and their extremely wide dietary diversity was demonstrated.
There are two expected possibilities as to why the amount of proboscis monkeys’
fruit-eating in Samunsam and Natai Lengkus is higher than this study site. One is that
the habitat types are different; Samunsam: mixed mangrove and lowland forests; Natai
Lengkus: peat swamp forests. The different habitat types between study sites may

- 28 -
have different food availability and induce different food preferences in proboscis
monkeys. However, it is difficult to fairly compare the food availability between study
sites as the estimation method in Natai Lengkus is different from the method used in
this study and there is no food availability data in Samunsam. Nonetheless, Yeager
(1989) suggests that the food availability in Natai Lengkus is higher than in Samunsam
due to the higher density of proboscis monkeys in Natai Lengkus (62.6 indeviduals /
km2) than Samunsam (5.93). As following the density calculation by Yeager (1989),
the density of proboscis monkeys in the present study site is 29.8 individuals / km2 (the
highest density is used during the study period) which is higher than Samunsam and
lower than Natai Lengkus. Thus, as the food availability expected by the density
shows various values between study sites, the different amount of proboscis monkeys’
fruit-eating (which, as previously showed, is largely dependant on fruit availability) in
each study site appears to result in their different food preference in each study site.
Another reason may be the methodological difference between researchers. In
Samunsam, the percentages of each food part are based on only 34 feeding observations
which are not taken systematically for 16 months, and in Natai Lengkus, the
percentages are based on 1,700 observation hours of data which were collected through
a scan sampling every 5 minutes for 12 months. Both studies were conducted mostly
by boat from the river while the monkeys were at the riverbank. Thus, the
methodological difference seems to be one of the reasons to explain the different
amount of fruit consumption between the studies. The observation time in the present
study, which was conducted not only by boat but also by following the group on foot in
the forest, was much longer than the two other studies, and thus the data in this study

- 29 -
would show the most exact tendency of feeding behaviors of proboscis monkeys. The
difference in food menu diversity between habitats may also be explained with the same
reasons, i. e. the difference of data collection method, observation hours and/or
observed place (only from the river by boat or on foot following the monkeys in the
forest). Detailed studies of proboscis monkeys that observe the monkeys in the forest
are awaited for performing a fair comparison.
The proboscis monkey was observed consuming termites and/or its nests and bark
of a specific tree, although it was a small amount in the present study, and the bark and
termite feeding seasons were more restricted in females than in the male. Red leaf
monkeys (Presbytis rubicunda) in Sabah, Malaysia feed on termite nests (Macrotermes
sp.) to supplement mineral intake, to buffer forestomach pH and to absorb toxins
(Davies and Baillie, 1988; Davis, 1991). In the howler monkey (Alouatta belzebul
discolor), which is a leaf eater similar to the proboscis monkey, geophagy occurs when
consumption of leaves increases considerably and bark-eating occurs in times of lower
and higher frugivory (De Souza et al., 2002; Pinto and Setz, 2004). Although the
hanuman langur (Semnopithecus entellus) is observed consuming insects such as larvae
when they are available (Newton, 1992), in Asian colobines, it is very rare to consume
animal matter due to their specific stomach structure (Kirkpatrick, 2007), and thus it
seems unlikely that proboscis monkeys consume termites as a protein source. In
proboscis monkeys, these specific food habits appear to serve different functions at
different times as reported on red leaf monkeys by Davies and Baillie (1988): to
supplement mineral nutrients, to absorb toxins and/or to assist digestion. The reason
why the feeding frequency of these specific food habits is higher in the male than the

- 30 -
females is unknown, but the male may need them more to maintain the larger body size.
According to Salter et al. (1985), proboscis monkeys reveal their daily feeding
rhythm with an active peak between 13:00 to 15:00. However, the feeding peak was
shown to be between 15:00 to 1700 in the present study. Although the two studies
indicate the same general trend: there is one feeding peak in the afternoon, the present
study showed the peak two hours later. This inconsistency between the two studies
may be a result of the small sample size of the study by Salter et al. (1985), which was
collected from several groups ranging in various forest types of Bako National Park:
tree mangrove, nipa swamp, riverine forest and dipterocarp / high kerangas forest.
Feeding trials of the proboscis monkeys in captivity report that the transit time, defined
as the elapsed time from feeding to the appearance of the marker in the feces is 14 hours
and the retention time, defined as the time between the appearance of 5% and 80% of
the markers, is 52 hours (Dierenfeld et al., 1992). As proboscis monkeys require a lot
of time to digest the foods, it may be preferable that they feed on a lot of food several
hours before they sleep to spend the night time not only for sleeping but also for
digestion.
Among the activities of the proboscis monkeys, feeding may be a key factor
which determines the seasonal fluctuation of their activity budget because moving and
others (grooming + copulation) constituted very small amount (2.4-4.3%). In the
feeding items of proboscis monkeys, they spent more time on feeding when they spent
more time on fruit-eating than on young leaf-eating, suggesting that fruit-eating is the
important factor to influence their activity budget. It also may indicate that the
monkeys can digest the fruits faster than young leaves. The amount of feeding was
- 31 -
estimated considering not only the time but also frequency of feces in this study. The
mean daily defecation of proboscis monkeys seasonally fluctuated with several peaks
which mostly corresponded to the peaks in the fluctuation of spending time on
fruit-eating, supporting that the fruits enable to be digested faster than other foods,
especially young leaves which are their main food items. In two African colobines
with a peculiar stomach which is suitable for leaf digestion as the proboscis monkey’s is,
the resting time of the white colobus monkey (Colobus guereza), which has a strong
tendency for leaf-eating, is longer than the red colobus (Colobus badius tephrosceles)
which has a strong tendency for fruit-eating (Dumber and Dumber, 1974; Clutton-Brock,
1975), and it suggests that digesting leaves takes more time compared with digesting
fruits. Accordingly, this instance also supports that the proboscis monkeys can digest
fruits faster than young leaves. In other words, they can digest larger amount of fruits
compared with young leaves. Waterman (1984) reports that the colobine monkeys
must either be able to exploit foliage highly favorable to their digestive system, or be
able to top up their diet with concentrates such as seeds or fruits, and Yeager (1989)
comments on Waterman’s report by saying that proboscis monkeys appear to top up
their diet with seeds. Although proboscis monkeys are suggested to be efficient
digesters of cell wall constituents (Dierenfeld et al., 1992), they may prefer fruits,
especially seeds, because seeds can be digested efficiently and contain rich
carbohydrates such as starch, though less protein than young leaves (Davies et al., 1988).
Proboscis monkeys may obtain enough protein from young leaves, which usually
contain rich protein (Choo et al., 1981; Waterman, 1984; Lambert, 2007), but they may
not obtain enough energy from young leaves alone, as young leaves are more difficult to

- 32 -
digest.
Regarding most plant species consumed by the proboscis monkeys, the actual
time observed consuming them was quite different from what was expected based on
food availability, suggesting that the proboscis monkey is a picky eater. Also, this
monkey changed its preference for which part in a fruit to feed on: flesh, seeds and/or
calyxes, in different months. The proboscis monkeys’ favorite part was the unripe fruit
seed, which it can easily consume by crunching with little effort. Seed predation is
characteristic in colobine frugivory (Davies, 1991), and Yeager (1989) reports that the
proboscis monkey is also a seed eater. Since proboscis monkeys feed especially on
dominant plant seeds, Yeager (1989) suggests that they may increase equitability and
permit a larger number of minor plant species to survive in the community. Proboscis
monkeys fed extensively on the seeds of Mallotus muticus trees and Lophopyxis
maingayi vines which were the most abundant plant species in this study area, although
some dominant and predominant species were not consumed or were shown negative
food preference. Ranglack and Yeager (1986), who examined over 100 proboscis
monkeys feces samples, did not find any seeds inside those feces, although the
undigested seeds of some plant species, which were small and relatively hard, were
found in perfect shape in the proboscis monkey feces in the present study which
examined 400 feces samples. This may be because of the difference of the sampling
efforts between the two studies. In the present study, especially seeds of Ficus spp.
were often found in feces when the proboscis monkeys often fed on its fruits. Ficus
species are one of the most important plant species for a lot of wildlife, suggesting that
proboscis monkeys play the seed dispersal role for some important plant species. If

- 33 -
proboscis monkeys assist proportion of some dominant or predominant plant species
and play a role as a seed dispersal animal for some important minor plant species, they
may be a key species in maintaining the forest and wildlife diversity in the areas they
inhabit.
Ranging Behavior and Predation Pressure
Proboscis monkeys appeared to be non-territorial at least at their sleeping sites in
this study, as all group types of proboscis monkeys overlapped their sleeping sites.
Yeager (1989) reports that the home ranges of the proboscis monkey’s one-male groups
overlap an average of more than 95% and Boonratana (2000) confirms the
non-territoriality of a one-male group using the formula devised by Mitani and Rodman
(1979). To predict whether the one-male group would be territorial in this study, I also
used Mitani and Rodman (1979)’s formula D = d / (4A / π) 0.5, where D is the index of
defensibility, d is the daily path length (km) and A is the home range area (km2). If D
is ≥ 1, the primate group is expected to be territorial, and if D is < 1, the primate group
is expected to be non-territorial. The index of defensibility of a one-male group in this
study is 0.60, indicating that the study group is non-territorial.
The home range size of proboscis monkeys is different between habitats: 315 ha
(Abai) in mangrove forest (Boonratana, 1993); 900 ha (Samunsam) in mixed mangrove
and lowland forests (Benett and Sebastian, 1988); 137 ha (Natai Lengkus) in peat
swamp forest (Yeager, 1989); 221 ha (Sukau) in riverine forest (Boonratana, 2000).
But, other than the figure of 221 ha by Boonratana (2000), all of the home range sizes
are estimated by the river length used by the one-male groups. As some studies on the

- 34 -
home range size of primates show that the size decreases when the food availability
becomes more abundant (Mckey and Waterman, 1982; Therborgh, 1983), the
differences of home range size between habitats in proboscis monkeys may also be
explained by food availability. Actually, Yeager (1989) proposes that the home range
size in Natai Lengkus is smaller than in Samunsam because the food availability of
Natai Lengkus is higher than that of Samunsam, and Boonratana (2000) also suggests
that the smallest home range size in Natai Lengus is due to its high food availability
throughout the year. However, the comparison of food availability between habitats is
difficult as it is mentioned above. Nonetheless, according to Yeager (1989), over 70%
of the stems located within the vegetational plots at Natai Lengkus are potential food
sources of the proboscis monkeys at some point during her study, and it was 67% in the
present study, suggesting that the food availability in these two study sites is similar as
well as the home range sizes: 138.3 ha in the present study site and 137 ha in Natai
Lengkus. The larger home range size of proboscis monkeys in Sukau (221 ha by
Boonratana (2000)) than in the present study may also be explained by the food
availability. The proboscis monkey group in Sukau (Sukau group) had home ranges in
both a lower area of the Menanggul River and a western area of the Kinabatanga River
(Boonratana, 2000). Since the present study indicated the low food availability in a
lower area of the Menanggul River compared with the upstream area of the river in
which the home range of BE-Group was located, the Sukau group may need a wider
home range size than that of BE-Group, although the research time in the two studies is
different and the food availability in the western area of the Kinabatanga River is
unknown. Food availability may be a barometer to explain the difference in the home

- 35 -
range size of proboscis monkey.
Primates’ ranging patterns are influenced by the spatial and temporal distribution
of food availability (Clutton-Brock, 1975; Raemaekers, 1980; Oates, 1987; Bennett and
Davies, 1994; Olupot et al., 1994; Boonratana, 2000; Koenig, 2000; Di Fiore, 2003;
Kirkpatrick, 2007; Lambert, 2007). In the proboscis monkeys’ home range area, the
core areas are located at relatively high fruit availability areas, and also, the daily path
length in each month showed a negative correlation with the amount of fruit availability.
Boonlatana (2000) reports that daily path length of one proboscis monkey group
increases on days when the group feeds more on young leaves, but the group does not
travel far on days when the diet includes a high proportion of fruits and seeds, indicating
the same general trend as found in this study. On the other hand, other Asian colobines
such as the banded langurs (Presbytis melalophos), hanuman langurs (Semnopithecus
entellus) and capped langurs (Trachypithecus pileatus) are reported to have traveled
farther in months when diet is based on fruits and/or flowers rather than young leaves or
mature leaves (Bennett, 1986c; Stanford, 1991; Newton, 1992), indicating the opposite
results of the ranging behavior related to diets of proboscis monkeys. Whereas other
colobines travel further to feed on the fruiting and/or flowering plant species which are
scattered in forests, proboscis monkeys feed on fruits without traveling further distance
because they prefer to feed on the fruits of dominant plant species in which the distance
between patches may be shorter. Not only this study but also Yeager (1989) reports
that proboscis monkeys prefer to feed on dominant plant species fruits, supporting why
their daily path length decreases on days when they feed on fruits. On the other hand,
Bonlatana (1993 and 2000) discusses the reason why the group of proboscis monkeys

- 36 -
travels farther each day during certain months when they tend to feed on young leaves.
He suggests that it is because they need to consume young leaves of different plant
species at different areas to reduce the risk of potential toxins they may ingest when
they feed on specific plant species. In fact, Yeager (1989) also indicates that food
menu diversity of proboscis monkys increases when their preferred foods (fruits) are
scarce, as well as this study. Thus, the decrease of their preferred fruits appears to
induce the increase of their leaf-eating amount and of their daily path length. It is
thought that fruit-eating, fruit availability and spatial and temporal distribution of major
foods are the key factors to influence the ranging behavior of proboscis monkeys.
Two cases of predation events on an adolescent female and an adult male
proboscis monkey by a crocodilian, false gavial (Tomistoma schlegeli) have been
reported at the riverside in Natai Lengkus (Galdikas, 1985; Yeager, 1991), suggesting
that the proboscis monkeys’ river crossing behavior exposes them to a high risk of
predation. Proboscis monkeys cross the river where the width is significantly narrower
(Yeager, 1991), and in addition to this, when proboscis monkeys crossed the river, they
often selected locations in which both genders of adult monkeys could safely cross to
the other side of the river from tree to tree in this study. Proboscis monkeys appear
unwilling to fall into the water, suggesting that those selections could be influenced by
the predation threat by crocodiles. Apart from the two predation events by clouded
leopards (Neofelis nebulosa) reported in this study, two additional observations of
predations on adult males have been reported (Davis, 1962; Nowell and Jackson, 1996),
indicating that not only crocodiles are possible predation threats for proboscis monkeys
but clouded leopards in trees also can be a serious threat for them.
- 37 -
It has been thought that proboscis monkeys almost always come back to the
riverbank to sleep for effective avoidance of predation, where predators can only
approach them from the landward side (Kern, 1964; Jeffrey, 1979; Bismark, 1981;
Onuma, 2002) although there is no certain data. However, this study showed that the
proboscis monkeys tended to select sleeping sites where they could cross the river to the
other side easily from tree to tree. This is thought to be a strategy to provide protection
against predators both from land and in the river. At the selected sleeping site, attacks
by the clouded leopard can be avoided by escaping to the other side of the river from
tree to tree while not falling into the river where there may be crocodiles. It can be
said that predation pressure is one of the important factors influencing why proboscis
monkeys sleep at the riverbank almost every night.
Although proboscis monkeys have been thought to almost always come back to
riverbanks for sleeping (Kern, 1964; Kawabe and Mano, 1972; Jeffrey, 1979; Bennett,
1986a; Bennett and Sebastion, 1988; Yeager, 1989) as mentioned above, the monkeys
were observed sleeping in the deep forest on flooded days. In this study, the water
level statistically influenced the ranging behavior of the proboscis monkeys, especially
sleeping site selection. Since a large group may reduce the hunting success of
predators by increasing the efficiency with which predators are detected through
increased vigilance, predation pressure may influence social group formation
(Alexander, 1974; Clutton-Brock and Harvey, 1977; van Schaik and van Hooff, 1983;
Cheney and Wrangham, 1987; Miller and Treves, 2007). Kummer (1971) also
considers that the multi-level society which has been reported in some primate species
may be effective predation avoidance. At the sleeping site on the riverbank, the
- 38 -
proboscis monkey is one of the species which has been reported to form a multi-level
society (Benett and Sebastian, 1988; Yeager, 1991b; Boonratana, 2002; Murai, 2004a),
and Murai (2004a) suggests that this multi-level society is also for avoiding predators.
The predation events on proboscis monkeys by crocodiles and clouded leopards listed
above support the idea that the monkeys are certainly exposed to predation threat. It
may be that the proboscis monkeys are not restricted to the riverbank, which has an
uncluttered view for easily finding predators, because of reduced predation pressure by
terrestrial animals during times when high water levels prevent predators from hunting.
Although Boonratana (2000) and this study suggests that the ranging behavior of
proboscis monkeys is affected by fruit-eating, fruit availability and spatial and temporal
distribution of major foods, the water level and/or the predation pressure may also be
important factors effecting their ranging behavior.
Yeager (1993) reports that the degree of association between one-male groups
of proboscis monkeys in a multi-level society shows a negative correlation with water
level because it may be that the monkeys sleep inside the forest as they are scared of
tree falls and the phenomenon which undermines vegetation and breaks off land masses
from the river’s edge during the high water level season. According to Murai (2004a)
who studied at the same site as the present study, the water level also negatively
correlates with the degree of association between one-male groups, though it is a
marginally insignificant correlation (p = 0.056). In this study, BE-Group solitarily
slept inside the forest on flooded days, although the group often slept close to other
one-male groups at riverside trees on non-flooded days, supporting the proposition that
water level influenced the social system between one-male groups. The low degree of

- 39 -
association, which was observed only during high water level, may also result from the
reduced predation pressure. Water level and/or predation pressure may influence not
only the ranging behavior of proboscis monkeys but also their multi-level society.
Whereas agonistic behaviors between one-male groups was rarely observed at
the sleeping site, even though they slept in the same tree, encounters with one-male
groups were observed only several times in the forest during the study period,
suggesting that one-male groups keep a certain distance in order to avoid encountering
each other in the forest. The degree of association between one-male groups in the
gelada baboon, which has the multi-level society the proboscis monkey has, may be
influenced by food availability (Ohsawa, 1979). On the other hand, the degree of
association of the proboscis monkeys’ one-male groups may not be attributed to food
availability because with their specialized physiology they appear to use widely
available and abundant food sources, especially leaves, high in digestion inhibitors and
low in nutrition (Yeager, 1993; Murai, 2004a). But as this study revealed, ranging
behaviors of proboscis monkeys were influenced by the availability of fruits and various
types of food parts (fruits, flowers and young leaves) were given strong preference, thus
it can be suggested that food competition between one-male groups is high. As a result,
there is a possibility that proboscis monkeys’ one-male groups avoid encounters with
each other in the forest to reduce the food competition between one-male groups,
although the monkeys, as they have been reported, appear not to have territoriality or a
high degree of association at the riverbank. Food competition may be one of the
factors influencing ranging behaviors of proboscis monkeys if one-male groups avoid
encounters with each other in the forest, although more systematic studies focusing on

- 40 -
their social system in the forest are needed to demonstrate this hypothesis.
Conservation Implications
In addition to the factors such as availability and distribution of food and
predation pressure which influence feeding, ranging and social structures of the
proboscis monkey, we may need to consider the possibility of environmental destruction
by human activities affecting monkeys’ behaviors. The major threat to the proboscis
monkeys, which prefer to inhabit the vicinity of riverside forests, is habitat loss through
logging and the spread of agriculture along river edges (IUCN, 1978; Jeffrey, 1982;
Salter and Mackenzie, 1985). Murai (2004a and 2004b) suggests that the large size of
the all-male group seems to be attributed to habitat fragmentation by the expansion of
oil palm plantations. The places where proboscis monkeys slept inside the forest were
the edge of open areas made by earlier logging or the edge of channels made by water
removal and supply for oil palm plantations, demonstrating the effect of human
activities on the ranging behaviors of proboscis monkeys in this study. As a general
trend, the density of proboscis monkeys in riverine and peat swamp forests are higher
than that of mangrove forests (Benett and Sebastian, 1988; Yeager, 1989; Boonlatana,
1993; Murai, 2004a; Sha, 2006) and the monkeys prefer the riverine forests to the
mangrove forests (Bernard and Hamzah, 2006). Considering those reports, the riverine
and peat swamp forests seem to be the areas where we need to put emphasis when
considering the proboscis monkeys’ conservation.
To estimate the populations of the proboscis monkey, the first step is to consider
their conservation. In the lower Kinabatangan areas, including the present study area,

- 41 -
several population surveys of proboscis monkeys by boat have been conducted. The
population numbers in each survey are different: Boonlatana (1993): 4.1 individuals /
km; Goossens et al. (2002): 6.9; Sha (2006): 7.9. Whereas proboscis monkeys mostly
sleep at the riverbank (Kern, 1964; Kawabe and Mano, 1972; Jeffrey, 1979; Bennett,
1986a; Bennett and Sebastion, 1988; Yeager, 1989), the number of the monkeys counted
in each boat census in this study fluctuated by each day as the number of monkeys
which came back to the riverbank depended on many factors. Especially in the flood
season, often no monkeys were found through the boat censuses. When we discuss
evaluation of the proboscis monkeys’ population, it may be important to consider the
factor of different population sizes estimated by different studies: whether the difference
is based on the encounter ratio by day or the real decreases caused by the deforestation.
It has been difficult to say how large of an area the proboscis monkeys need to
survive because most former researchers could not conduct studies on proboscis
monkeys, specifically following them in the forest where the terrain was frequently
swampy and impossible to walk on. Although only a little data has been obtained,
proboscis monkeys moved into the forest about 750 m (Salter et al., 1985), 600 m
(Benett and Sebastian, 1988; Boonlatana, 2000), 500 m (Yeager, 1989) and 800 m
maximum from the riverbank in this study, suggesting that forests of at least 800 m from
the both riverbanks are needed for proboscis monkeys’ survival.
A lot of tourists visited the Mennenggul River, including the present study site,
everyday by boat to enjoy the eco-tourism. In fact, the noisy boat engine sounds, and a
lot of camera flashes created by tourists sometimes interfered with the river crossing of
proboscis monkeys. Also, to attract the monkeys’ attention so as to satisfying the

- 42 -
picture taking needs of the tourists, some of the tour guides often shouted at the
monkeys. The excessive behavior of those guides and the behavior of tourists may be
influence some behaviors of proboscis monkeys. The construction of new lodges
around the study site is planned, and eco-tourism is becoming more popular as a leisure
activity. For prospective conservation, it is not only important to protect the proboscis
monkeys’ habitat, but also to educate and train the tour guides to behave properly and
the need to appeal to tourists to improve their manners around wildlife.

- 43 -
ACKNOWLEDGMENTS
The staff of the Economic Planning Unit in Malaysia, particularly Ms. M. Bt. A.
Manan and Ms. G. Vu, who kindly arranged permission to conduct my research in
Malaysia. The staff of the Sabah Wildlife Department, especially Mr. A. Tuuga (my
counterpart) and Mr. E. Tangon, who supported my research in the lower Kinabatangan
area. Mr. Haji H. Tukiman and Mr. L. Ruki in the Forestry Department, Sabah which
lent me the comfortable house in Sukau village. Mr. J. Sugau, Ms. J. T. Pereira and Mr.
P. Miun in the Forest Research Center of the Forestry Department, Sabah who identified
all the plants species in this study. Dr. I. Lackman-Ancrenaz, Dr. M. Ancrenaz, Dr. B.
Goossens, Dr. T. Tsubouti, Mr. A. Abulani, Mr. Z. A. Jaffer, Ms. A. B. Etin and all
members of KOCP (Kinabatangan Orangutan Conservation Project) who were helpful
with my research in Malaysia. Dr. M. Mohamed, Dr. H. Bernard who has been helpful
with research. Dr. T. Murai gave me information about research sites. Dr. G. Hanya
visited my research site before starting the project and provided useful information on
data collection in this research. Dr. A. Nishimura, Dr. K. Hirota and Mr. A Chijiiwa
also visited my research site during the study period and encouraged me. Dr. T Miura
assisted with the identification of the termite species. Dr. T. Kubo and Dr. Y. Akiyama
assisted the statistical analysis in this paper. Mr. T. Ikeda, Mr. T. Sugimoto and all of
the Higashi laboratory members provided useful discussion for me. All the Sukau
villagers, especially Mr. N. Bin Mokhsen, Mr. Haji S. Bin Ahmad and Mr. P. Haji
Mansor who are the leaders in the village, for assisting my peaceful and safe life in the
village. The staff of Hotel City View in Sandakan, especially Mr. T. S. Heng, who

- 44 -
provided comfortable and warm service for me whenever I spent time there. Mr. M. N.
Bin Hj. Siddek who is a bus driver from Sandakan to Sukau and Mr. L. M. Choi who is
a taxi driver in Sandakan who provided the safe and comfortable trip for me. Mr. A.
Bin Arsih, Mr. M. S. Bin A. Karim and Mr. M. Bin Ismail, who are my research
assistants in the field and who always assisted my hard research. I could not complete
my data collection without their assistance. Ms. H. Katsuta and Mr. R. Delatorre
kindly undertook proofreading of this manuscript. Dr. K. Watanabe, Dr. J. Yamagiwa,
Dr. T. Iwakuma and Dr. N. Agetsuma who took care of the deputy president of the board
of examiners of my thesis and gave me their valuable comments on this thesis. I am
grateful to all the people listed above.
My deepest appreciation goes to Dr. S. Higashi because, without his
supervision from the time this study was started until its bound form this thesis would
not have been possible. I am certainly indebted to Ms. Y. Katsuta who helped me to
overcome a lot of difficulties throughout my study life. Lastly, I truly appreciate my
family for supporting my research. I was able to be strong due to their encouragement
every time when I was discouraged.

- 45 -
REFERENCES
Alexander RD (1974) The evolution of social behaviour. Ann Rev Ecol Syst 5:325-383
Allen GM, Coolidge HJ (1940) Mammal and bird collections of the Asiatic primate
expedition. Bull Mus comp Zool Harvard 87:131-166
Altmann J 1974 Observational study of behavior: Sampling methods. Behaviour 69:
227-267
Basiuk R (1985) Samunsam Wildlife Sanctuary: A Management Plan, National Parks
and Wildlife Office, Sarawak Forest Department, Kuching.
Bauchop T (1978) Digestion of leaves in vertebrate arboreal folivores. In: Montgomery
GG (eds) The Ecology of Arboreal Folivores, Smithsonian Institution Press,
Washington D. C., pp 193-204
Bauchop T, Martucci RW (1968) Ruminant-like digestion of the langur monkey.
Science 161:698-700
Bennett EL (1986a) Proboscis monkeys in Sarawak: Their ecology, status, conservation
and management, World Wildlife Fund Malaysia, Kuala Lumpur, and New York
Zoological Society, New York
Bennett EL (1986b) Proboscis monkeys in Sarawak: Their ecology, status, conservation
and management. WWF-Malaysia/NYZS. NTIS.
Bennett EL (1986c) Environmental correlates of ranging behaviour in the banded langur,
Presbytis melalophus. Folia Primatol 47:26-38
Bennett EL, Sebastion AC (1988) Social organization and ecology of proboscis
monkeys (Nasalis larvatus) in mixed coastal forest in Sarawak. Int J Primatol
- 46 -
9:233-256
Bennett EL, Davies AG (1994) The ecology of Asian colobines. In Colobine Monkeys:
Their Ecology, Behaviour and Evolution. A.G. Davies and J.F. Oates (eds).
Cambridge University Press: Cambridge.
Bernard H, Hamzah Z (2006) Population size and distribution of the proboscis monkey
(Nasalis larvatus) in the Klias Peninsula, Sabah, Malaysia. Malayan Nature J
59:153-163
Bismark M (1981) Preliminary survey of the proboscis monkey at Tanjung Putting
Reserve, Kalimantan. Tigerpaper 8:26
Boonratana R (1993) The ecology and behaviour of the proboscis monkey (Nasalis
larvatus) in the Lower Kinabatangan, Sabah. PhD Thesis. Faculty of Graduate
Studies, Mahidol University
Boonratana R (2000) Ranging behavior of proboscis monkeys (Nasalis larvatus) in the
lower Kinabatangan, Northern Borneo. Int J Primatol 21:497-518
Boonratana R (2002) Social organization of proboscis monkeys (Nasalis larvatus) in the
Lower Kinabatangan, Sabah, Malaysia. Malayan Nature J 56:57-75
Cheney DL, Wrangham RW (1987) Predation. In: Smuts BB, Cheney DL, Seyfarth RM,
Wrangham RW, Struhsaker TT (eds) Primate societies. University of Chicago Press,
Chicago, pp 227-239
Chivers DJ and Hladik CM (1980) Morphology of the gastrointestinal tract in primates:
comparisons with other mammals in relation to diet. J Morphol 166:337-386
Choo GM, Waterman PG, Mackey DB, Gartlan JS (1981) A simple enzyme assay for
dry matter digestibility and its value in studying food selection by generalist

- 47 -
herbivores. Oecologia 49:170-178
Clutton-Brock TH (1975) Ranging behaviour of red colobus (Colobus badius
tephrosceles), in the Gombe National Park. Anim Behav 23:706-722
Clutton-Brock TH, Harvey PH (1977) Primate ecology and social organization. J Zool
Lond 183:1-39
Davis DD (1962) Mammals of the lowland rainforests of North Borneo. Bulletin of the
national museum of Singapore 31:1-129
Davies AG (1991) Seed-eating by red leaf monkeys (Presbytis rubicunda) in the
dipterocarp forest of northern Borneo. Int J Primatol 12:119-144
Davies AG, Ballie IC (1988) Soil-eating by red leaf monkeys (Presbytis rubicunda) in
Sabah, northern Borneo. Biotropica 20:252-258
Davies AG, Bennett EL, Waterman PG (1988) Food selection by two South-east Asia
colobine monkeys (Presbytis rubicunda and Presbytis melalophos) in relation to
plant chemistry. Biol J of the Linn Soc 34:33-56
De Souza LL, Ferrari SF, Costa ML, Kern DC (2002) Geophagy as a correlate of
folivory in red-handed howler monkeys (Alouatta belzebul) from Eastern Brazilian
Amazonia. J Chem Ecol 28:1613-1621
Dierenfeld ES, Koontz FW, Goldstein RS (1992) Feed intake, digestion and passage of
the proboscis monkey (Nasalis larvatus) in captivity. Primates 33:399-405
Di Fiore A (2003) Ranging behavior and foraging ecology of lowland woolly monkeys
(Lagothrix lagotricha poeppigii) in Yasuní National Park, Ecuador. Am J Primatol
59:47-66
Dumber RIM, Dumber P (1974) Ecology and population dynamics of Colobus guereza

- 48 -
in Ethiopia. Folia primatol 21:188-209
Fashing PJ (2007) African Colobine Monkeys: Patterns of Between-Group Interaction.
In: Campbell CJ, Fuentes A, Mackinnon KC, Panger M, Bearder SK (eds) Primats
in perspective. Oxford University Press, New York, pp 201-224
Galdikas BMF (1985) Crocodile predation on a proboscis monkey in Borneo. Primates
26:495-496
Goossens B, Setchell JM, Abulani DMA, Jalil F, James SS, Aris SH, Lakim MH,
Seventri AD, Sariningsih SS, Ancrenaz M (2002) A boat survey of primates in the
Lower Kinabatangan Wildlife Sanctuary. In. Maryati M, Takano A, Goossens B,
Indran R (Eds.) Lower Kinabatangan scientific expedition. Universiti Malaysia
Sabah. pp 37-45
Groves CP (2001) Primate Taxonomy. Smithsonian Institution Press, Washington DC
IUCN (1978) Proboscis or long-nosed monkey. Draft data sheet for Red Data Book.
International Union for Conservation of Nature and Natural Resources, Gland,
Switzerland
IUCN (2000) IUCN red list of threatened animals. Gland, Switzerland/Cambridge,
UK:IUCN
Jeffrey SM (1979) The proboscis monkey: some preliminary observations. Tigerpaper
6:5-6
Jeffrey SM (1982) Threats to the proboscis monkeys. Oryx 16:337-339
Kawabe M, Mano T (1972) Ecology and behaviour of the wild proboscis monkey,
Nasalis larvatus (wurmb.) in Sabah, Malaysia. Primates 13:213-227
Kay RNB, Hoppe P, Maloiy GM (1976) Fermentative digestion of food in the colobus

- 49 -
monkey, Colobus polykomos. Experimentia 32:485-487
Kern JA (1964) Observations on the habits of the proboscis monkey, Nasalis larvatus
(Wermb), made in the Brunai Bay area, Borneo. Zoologica 49:183-192
Kirkpatrick RC (2007) The Asian Colobines Diversity Among Leaf-Eating Monkeys.
In: Campbell CJ, Fuentes A, Mackinnon KC, Panger M, Bearder SK (eds) Primats
in perspective. Oxford University Press, New York, pp 186–200
Koenig A (2000) Competitive regimes in forest-dwelling Hanuman langur females
(Semnopithecus entellus). Behav Ecol Sociobiol 48:93–109
Kummer H (1971) Immediate case of primate social structures. In Proceeding 3rd
International Congress of Primatology, Zurich 1970, vol. 3, Basel: Kerger, pp. 1-11
Lambert JE (2007) Primate Nutritional Ecology. Feeding biology and diet at ecological
and evolutional scales. In: Campbell CJ, Fuentes A, Mackinnon KC, Panger M,
Bearder SK (eds) Primats in perspective. Oxford University Press, New York, pp
482-495
Macdonald DW (1982) Notes on the size and composition of groups of proboscis
monkey (Nasalis larvatus). Folia primatol 37:95-98
Makey D, Waterman PG (1982) Ranging behaviour of a group of black colobus
(Colobus satanas) in the Douala-Edea Reserve, Cameroon. Folia Primatol
39:264-304
Miller LE, Treves A (2007) Predation on primates. In: Campbell CJ, Fuentes A,
Mackinnon KC, Panger M, Bearder SK (eds) Primats in perspective. Oxford
University Press, New York, pp 525–543
Mitani JC and Rodman PS (1979) Territoriality: The relation of ranging patterns and

- 50 -
home range size to defensibility, with an analysis of territoriality among primate
species. Behav Ecol Sociobiol 5:241-251
Murai T (2004a) Social structure and mating behavior of proboscis monkey Nsalis
larvatus (Primates; Colobinae). PhD Thesis. Graduate School of Environmental
Earth Science, Hokkaido University
Murai T (2004b) Social behaviors of all-male proboscis monkeys when joined by
females. Ecological Research 19:451-454
Murai T (2006) Mating behaviors of the proboscis monkey (Nasalis larvatus). Am J
Primatol 68:832-837
Murai T, Mohamed M, Bernard H, Mahedi PA, Saburi R, Higashi S (2007) Female
transfer between one-male groups of proboscis monkey (Nasalis larvatus).
Primates 48:117-121
Napier PH (1985) Catalogue of Primates in the British Museum (Natural History) and
Elsewhere in the Subfamily Colobinae. British Museum (Natural History), London
Napier JR, Napier PH (1967) A Handbook of Living Primates. Academic Press, London
Napier JR, Napier PH (1985) The Natural History of the Primates, MIT Press:
Cambridge, Massachusetts, pp: 158
Newton PN (1992) Feeding and ranging patterns of forest hanuman langurs (Presbytis
entellus). Int J Primatol 13:245-285
Nowell K, Jackson P (1996) Wild Cats: Status survey and conservation action plan.
IUCN/SSC Cat Specialist Group, Cambridge
Oates (1987) Food distribution and foraging behavior. In: Smuts BB, Cheney DL,
Seyfarth RM, Wrangham RW, Struhsaker TT (eds) Primate societies. University of

- 51 -
Chicago Press, Chicago, pp 197-209
Ohsawa H (1979) Herd dynamics. In: Contributions to Primatology, Vol 16: Ecological
and sociological studies of gelada baboons. Kawai M (eds) Basel: S Karger, pp
47-80
Olupot W, Chapman CA, Brown CH, Waser PM (1994) Mangabey (Cercocebus
albigena) population density, group size, and ranging: A twenty year comparison.
Am J Primatol 32:197-205
Onuma M (2002) Daily ranging patterns of the proboscis monkey, Nasalis larvatus, in
coastal areas of Sarawak, Malaysia. Mammal study 27:141-144
Pielou EC (1966) Shannon’s formula as a measure of specific diversity: Its use and
misuses. Am Nat 104:463-465
Pinto LP and Setz EZF (2004) Diet of Alouatta belzebul discolor in an amazonian rain
forest of northern Mato Grosso State, Brazil. Int J Primatol 25:1197-1211
Raemaekers J (1980) Causes of variation between months in the distance traveled daily
by gibbons. Folia Primatol 34:46-60.
Ranglack GS and Yeager CP (1986) Survey of intestinal parasites found in proboscis
monkeys (Nsalis larvatus) and long-tailed macaques (Macaca fascicularis).
Primate Reports 14:249
Salter RE, Mackenzie NA (1985) Conservation status of the proboscis monkey in
Sarawak. Biological Conservation 33: 119-132
Salter RE, Mackenzie NA, Aken KM, Chai PPK (1985) Habitat use, ranging behaviour,
and food habits of the proboscis monkey, Nasalis larvatus (van Wurmb), in
Sarawak. Primates 26:436-451

- 52 -
van Schaik CP, van Hooff J (1983) On the ultimate causes of primate social systems.
Behaviour 85:91-117
Schultz AH (1942) Growth and development of the proboscis monkey. Bull Mus Comp
Zool (Harvard) 89:279-314
Sha JCM (2006) Distribution, abundance and conservation of proboscis monkey
(Nasalis larvatus) in Sabah, Malaysia. Master Thesis. Institute for Tropical
Biology and Conservation, Universiti Malaysia Sabah
Stanford CB (1991) The capped langur in Bangladesh: Behavioral ecology and
reproductive tactics. Karger, New York
Struhsaker TT, Leland L (1987) Colobines: Infanticide by adult males. In: Smuts BB,
Cheney DL, Seyfarth RM, Wrangham RW, Struhsaker TT (eds) Primate societies.
University of Chicago Press, Chicago, pp 83-97
Terborgh J (1983) Five New World Primates: A study in Comparative Ecology.
Princeton University Press, Princeton, New Jersey
Waterman PG (1984) Food acquisition and processing as a function of plant chemistry.
In: Chivers, DJ, Wood BA, Bilsborough A (eds), Food Acquisition and Processing
in Primates, Plenum Press, New York, pp 177-211
Yeager CP (1984) The proboscis monkey of Borneo. The Brookfield Bison 1:18
Yeager CP (1989) Feeding ecology of the proboscis monkey (Nasalis larvatus). Int J
Primatol 10:497-530
Yeager CP (1991a) Possible antipredator behavior associated with river crossings by
proboscis monkeys (Nasalis larvatus). Am J Primatol 24: 61-66
Yeager CP (1991b) Proboscis monkey (Nasalis larvatus) social organization: intergroup

- 53 -
patterns of association. Am J Primatol 23:73-86
Yeager CP (1992) Proboscis monkey (Nasalis larvatus) social organization: the nature
and possible functions of intergroup patterns of association. Am J Primatol
26:133-137
Yeager CP (1993) Ecological constraints on intergroup associations in the proboscis
monkey (Nasalis larvatus). Tropical Biodiversity 1:89-100
Yeager CP (1995) Does Intrasepcific variation in social systems explain reported
differences in the social srtucture of the proboscis monkey (Nasalis larvatus)?
Primates 36:575-582
Yeager, C. P. and Blondal, T. K. 1992. Conservation status of the proboscis monkeys
(Nasalis larvatus) at Tanjung Putting National Park, Kalimantan Tengah, Indonesia
In. Ismail et al. (eds) Forest biology and conservation in Borneo. Center for Borneo
Studies, Publication No. 2
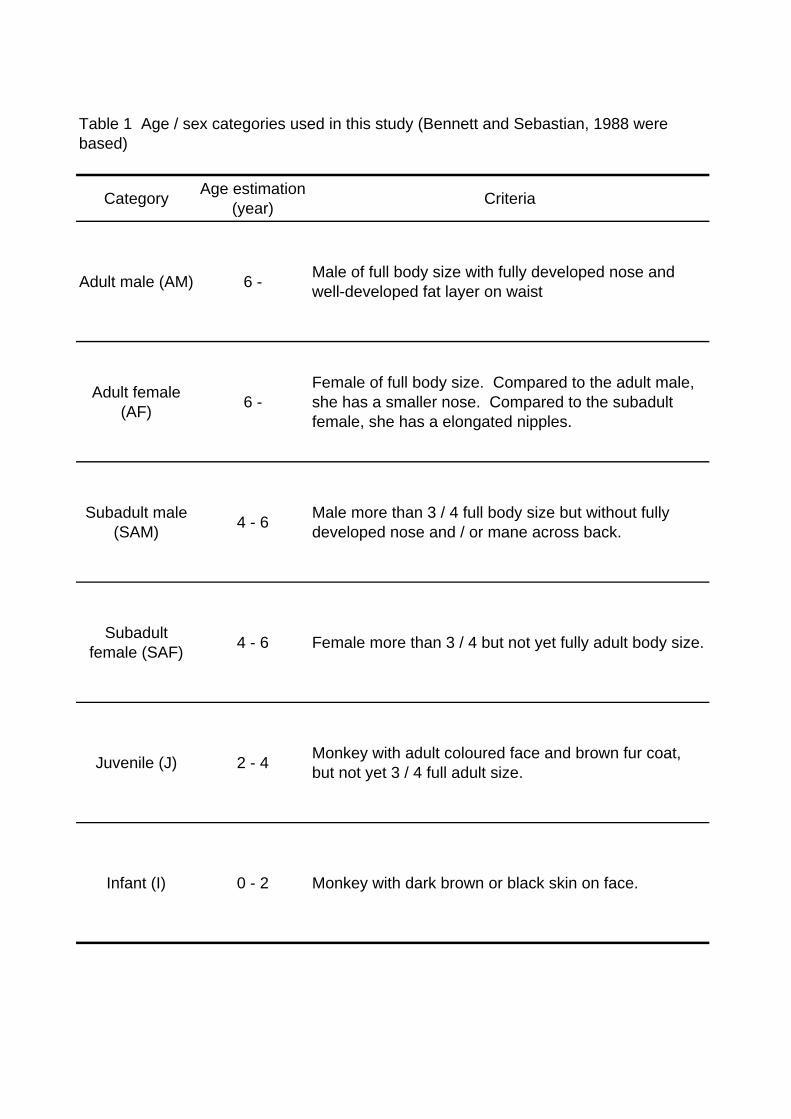
Category Age estimation(year) Criteria
Adult male (AM) 6 - Male of full body size with fully developed nose andwell-developed fat layer on waist
Adult female(AF) 6 -
Female of full body size. Compared to the adult male,she has a smaller nose. Compared to the subadultfemale, she has a elongated nipples.
Subadult male(SAM) 4 - 6 Male more than 3 / 4 full body size but without fully
developed nose and / or mane across back.
Subadultfemale (SAF) 4 - 6 Female more than 3 / 4 but not yet fully adult body size.
Juvenile (J) 2 - 4 Monkey with adult coloured face and brown fur coat,but not yet 3 / 4 full adult size.
Infant (I) 0 - 2 Monkey with dark brown or black skin on face.
Table 1 Age / sex categories used in this study (Bennett and Sebastian, 1988 werebased)

May
/ 05
Jun
Jul
Aug
Sep
Oct
Nov
Dec
Jan
/ 06
Feb
Mar
Apr
May
No.
of c
ensu
ses
78
612
912
1110
1322
1010
8N
o. o
f gro
ups
per c
ensu
s5-
103-
102-
113-
152-
112-
133-
82-
72-
110-
50-
102-
113-
11G
roup
siz
e3-
253-
243-
203-
213-
223-
293-
283-
242-
292-
243-
274-
314-
27M
ean
± S
D12
.1 ±
2.0
10.8
± 2
.211
.6 ±
3.1
11.8
± 3
.810
.1 ±
3.3
13.0
± 2
.813
.0 ±
1.7
12.3
± 1
.613
.6 ±
3.2
12.1
± 1
.512
.0 ±
3.7
15.8
± 2
.715
.3 ±
2.4
AM
1.0
1.0
1.0
1.0
1.0
1.0
1.0
1.0
1.0
1.0
1.0
1.0
1.0
AF
5.4
5.1
5.0
5.4
4.6
5.2
5.3
5.3
5.3
4.5
4.6
5.9
5.7
SA
F1.
10.
60.
20.
20.
50.
60.
40.
20.
10.
20.
40
0.7
J2.
52.
22.
42.
02.
03.
03.
22.
73.
43.
53.
04.
14.
1I
2.0
2.5
3.0
3.2
2.0
3.2
3.2
3.2
3.8
3.0
3.0
4.7
3.8
No.
of g
roup
s pe
r cen
sus
--
--
0-1
0-1
0-2
0-6
0-4
0-5
0-2
0-3
0-3
Gro
up s
ize
--
--
12-1
311
-13
5-15
6-11
2-11
5-14
3-10
4-11
2-18
Mea
n±S
D-
--
-12
.5 ±
0.4
12.0
± 0
.48.
5 ±
0.8
8.4
± 0.
56.
8 ±
1.1
9.8
± 0.
56.
6 ±
0.8
7.8
± 0.
910
.1 ±
0.9
AM
--
--
3.0
2.5
1.7
2.4
1.5
2.1
2.0
1.8
1.6
SA
M-
--
-6.
54.
51.
82.
41.
83.
02.
52.
63.
6J
--
--
2.0
5.0
3.5
3.6
3.5
4.6
2.1
3.4
4.9
I-
--
-1.
00
1.5
00
00
00
No.
of g
roup
s pe
r cen
sus
0-1
0-1
-0-
1-
0-1
--
0-2
0-2
0-1
0-1
0-1
Gro
up s
ize
13-1
521
-25
-12
-15
-7-
15-
-6-
176-
24-
--
Mea
n±S
D14
.0 ±
1.4
22.7
± 2
.1-
13.5
± 2
.1-
11.7
± 4
.2-
-11
.7 ±
5.5
15.0
± 1
2.7
10.0
11.0
9.0
AM
3.0
2.7
-2.
0-
2.3
--
1.3
1.0
3.0
2.0
4.0
AF
6.0
11.0
-7.
5-
5.0
--
2.3
2.5
1.0
1.0
2.0
SA
2.5
1.7
-0
-0
--
0.7
3.0
3.0
4.0
2.0
J1.
04.
0-
0.5
-1.
7-
-5.
77.
52.
04.
00
I1.
53.
3-
3.5
-2.
7-
-1.
71.
01.
00
1.0
AM
00
00
1.0
1.0
1.0
01.
01.
01.
01.
00
AF
00
00
00
00
01.
00
00
SA
M1.
00
00
00
00
00
1.0
00
J0
00
00
00
00
1.0
00
I0
00
00
00
00
00
00
65-1
4030
-144
21-1
1741
-178
35-1
0743
-179
34-1
3033
-101
33-1
600-
631-
141
44-1
5573
-218
AM
, AF,
MS
A, F
SA
, J a
nd I:
mea
n nu
mbe
r of a
dult
mal
es, a
dult
fem
ales
, sub
adul
ts m
ales
, sub
adul
t fem
ales
, juv
enile
s an
d in
fant
s, re
spec
tivel
y
Tabl
e 2
Com
posi
tion
of o
ne-m
ale,
all-
mal
e an
d m
ixed
gro
ups
in e
ach
mon
th.
Eac
h ce
nsus
was
con
duct
ed in
an
area
of 6
km
alo
ng th
e tri
buta
ryM
enan
ggul
Riv
er.
No.
of i
ndiv
idua
ls p
er c
ensu
s
Sol
itary
One
-mal
egr
oup
All-
mal
egr
oup
Mix
ed-g
roup

Adu
lt m
ale
Bej
iita
Chi
Chi
Bul
ma
Lunc
hA
rare
Big
mam
aM
idor
i*
2005
May
167.
997
.735
.424
.40
10.3
0-
June
279.
618
6.3
9.8
23.4
12.0
10.5
37.7
-Ju
ly27
0.1
171.
228
.124
.733
.812
.40
-A
ugus
t26
6.0
146.
010
6.6
011
.81.
60
-S
epte
mbe
r21
6.6
146.
258
.70
011
.70
-O
ctob
er33
1.9
179.
510
6.9
21.0
0.8
11.7
12.0
-N
ovem
ber
289.
614
6.6
60.5
11.6
12.0
23.6
35.4
-D
ecem
ber
365.
318
0.9
82.7
35.0
30.8
24.0
12.0
-20
06Ja
nuar
y30
5.8
155.
666
.328
.131
.712
.012
.1-
Febr
uary
69.2
35.0
00
034
.20
-M
arch
282.
916
0.9
37.0
23.9
36.4
24.7
00
Apr
il31
2.6
178.
342
.30
12.2
32.1
23.6
24.0
May
348.
718
3.7
47.6
36.1
11.7
35.5
9.9
24.2
Tota
l35
06.3
1967
.868
1.7
228.
119
3.2
244.
314
2.8
48.3
Tabl
e 3
Mon
thly
tota
l hou
rs fo
r obs
ervi
ng b
ehav
iors
of B
E-G
roup
adu
lt m
embe
rs.
* tra
nsfe
rred
into
the
grou
p in
Mar
ch 2
006
Adu
lt fe
mal
esTo
tal
Mon
th

Resting Feeding Moving OthersBejita 75.9 20.4 3.6 0.1SD 8.9 8.7 1.6 0.3
ChiChi 78.0 17.9 3.0 1.1SD 8.2 7.4 1.5 2.2
Bulma 78.4 17.7 3.2 0.7SD 10.3 8.6 2.0 2.2
Lunch 74.5 20.5 3.5 1.5SD 11.1 9.3 1.5 2.4
Arare 76.1 19.4 3.4 1.1SD 10.6 10.5 1.4 1.2
Bigmama 79.6 16.4 3.4 0.6SD 6.7 6.3 1.1 0.9
Midori 73.9 21.0 3.2 2.0SD 5.8 7.2 1.1 0.7
Total 76.4 19.5 3.5 0.5
Table 4 Percentages of activities in each adult of BE-Group, Others: grooming andcopulation. Observation was conducted from May 2005 to May 2006.

Density
Tree VineANACARDIACEAE Androtium astylum Tree 1 0.5 128 104.9 48.9 135
Buchanania arborescens Tree 10 4.7 52 736.1 3431.7 22Dracontomelon dao Tree 15 7.0 39 502.1 3511.4 20Koordersiodendron pinnatum Tree 2 0.9 105 770.5 718.4 61Mangifera parvifolia Tree 3 1.4 87 911.3 1274.6 48Melanochyla auriculata Tree 2 0.9 106 406.2 378.7 76
ANNONACEAE Artabotrys suaveolens Vine 26 12.1 24 50.7 614.4 6Cananga odorata Tree 4 1.9 79 718.1 1339.2 47Polyalthia sumatrana Tree 1 0.5 130 191.2 89.1 118P. sp. 1 Tree 1 0.5 129 131.2 61.2 129Uvaria lobbiana Vine 1 0.5 131 25.8 12.0 38U. sp. 1 Vine 1 0.5 132 27.0 12.6 35
APOCYNACEAE Parameria polyneura Vine 1 0.5 133 24.1 11.2 40Tabernaemontana macrocarpa Tree 1 0.5 134 575.2 268.2 90Urceola sp. 1 Vine 2 0.9 107 40.6 37.9 25Willughbeia angustifolia Vine 1 0.5 135 27.0 12.6 36
AQUIFOLIACEAE Ilex cymosa Tree 28 13.1 19 486.6 6352.1 12BOMBACACEAE Durio kutejensis Tree 1 0.5 136 140.4 65.5 125BURSERACEAE Canarium decumanum Tree 1 0.5 137 102.0 47.6 137
C. denticulatum Tree 2 0.9 108 107.0 99.8 115CELASTRACEAE Lophopetalum multinervium Tree 2 0.9 109 794.5 740.8 60CHRYSOBALANACEAEKostermanthus heteropetalus Tree 1 0.5 138 3316.6 1546.2 42
Maranthes corymbosa Tree 3 1.4 88 198.7 277.9 88Parinari oblongifolia Tree 3 1.4 89 2237.7 3129.7 23
CLUSIACEAE Calophyllum blancoi Tree 1 0.5 139 250.6 116.8 112C. pisiferum Tree 1 0.5 140 556.4 259.4 92Cratoxylum cochinchinense Tree 8 3.7 60 434.0 1618.5 39C. formosum Tree 3 1.4 90 619.7 866.7 56Garcinia brevipes Tree 1 0.5 141 103.2 48.1 136G. parvifolia Tree 23 10.7 26 144.2 1546.3 41G. sp. 1 Tree 1 0.5 142 353.1 164.6 109Kayea oblongifolia Tree 1 0.5 143 194.3 90.6 117Mesua elmeri Tree 23 10.7 27 473.3 5074.5 15M. macrantha Tree 1 0.5 144 392.4 182.9 106
COMBRETACEAE Combretum acuminatum Vine 5 2.3 73 25.8 60.2 22Terminalia citrina Tree 2 0.9 110 194.9 181.7 107
CONNARACEAE Agelaea borneensis Vine 1 0.5 145 26.4 12.3 37A. trinervis Vine 1 0.5 146 46.2 21.6 32Connarus grandis Vine 6 2.8 65 35.1 98.3 18Rourea mimosoides Vine 1 0.5 147 58.0 27.1 29R. minor Vine 11 5.1 49 97.2 498.4 11
CONVOLVULACEAE Erycibe grandifolia Vine 1 0.5 148 38.5 18.0 33DILLENIACEAE Dillenia excelsa Tree 98 45.7 4 171.2 7822.1 9
Tetracera scandens Vine 3 1.4 91 31.1 43.4 24DIPTEROCARPACEAE Dipterocarpus validus Tree 14 6.5 42 904.6 5904.5 13
Parashorea malaanonan Tree 2 0.9 111 448.8 418.4 75Vatica rassak Tree 52 24.2 10 338.0 8194.4 8V. umbonata Tree 2 0.9 112 308.5 287.7 85V. venulosa Tree 11 5.1 50 462.9 2373.8 30
EBENACEAE Diospyros curranii Tree 23 10.7 28 264.3 2833.9 27D. elliptifolia Tree 21 9.8 29 240.8 2357.4 31D. euphlehia Tree 3 1.4 92 135.0 188.9 105D. macrophylla Tree 1 0.5 149 407.0 189.8 104D. wallichii Tree 6 2.8 66 243.2 680.2 66D. sp. 1 Tree 6 2.8 67 182.7 511.0 74D. sp. 2 Tree 6 2.8 68 486.8 1361.7 46D. sp. 3 Tree 5 2.3 74 41.4 96.5 116
ELAEOCARPACEAE Elaeocarpus macrocarpus Tree 1 0.5 150 539.3 251.4 95E. nitidus Tree 15 7.0 40 325.9 2279.4 32E. stipularis Tree 6 2.8 69 328.2 917.9 55
/ ha/ tree or vineSpeciesFamily / ha
Basal area (cm2)RankNLife form Rank
Table 5 Floral makeup along 16 trails shown in Figure 1. The total distance of thetrails was 7.15 km and the vegetation survey was conducted for trees (> 10 cm inDBH) and vines (> 5 cm in diameter) on the trail or within 1 m from the edge of trail (i.e. survey area = 2.15 ha).

Table (Continued 1)Density
Tree VineERYTHROXYLACEAE Erythroxylum cuneatum Tree 2 0.9 113 251.3 234.3 98EUPHORBIACEAE Antidesma thwaitesianum Tree 33 15.4 14 423.6 6517.7 11
Aporosa acuminatissima Tree 1 0.5 151 175.1 81.6 120A. nigricans Tree 4 1.9 80 198.5 370.3 79Baccaurea bracteata Tree 3 1.4 93 240.6 336.5 82B. stipulata Tree 18 8.4 34 120.3 1009.1 53Bridelia penangiana Tree 3 1.4 94 167.2 233.8 99B. stipularis Vine 30 14.0 18 53.3 744.9 4Cleistanthus myrianthus Tree 19 8.9 33 313.6 2778.0 28Croton caudatus Vine 46 21.4 11 34.2 732.7 5C. oblongus Tree 82 38.2 5 182.3 6969.5 10Drypetes castilloi Tree 15 7.0 41 160.8 1124.7 52D. sp. 1 Tree 1 0.5 152 176.6 82.3 119 Excoecaria indica Tree 111 51.7 3 1454.3 75257.3 1Glochidion macrostigma Tree 2 0.9 114 59.3 55.3 131G. obscurum Tree 20 9.3 30 164.4 1532.8 43G. sp. 1 Tree 2 0.9 115 187.7 175.0 108Macaranga conifera Tree 5 2.3 75 303.5 707.4 62Mallotus floribundus Tree 1 0.5 153 47.4 22.1 139M. muticus Tree 149 69.5 1 642.4 44622.8 2M. penangensis Tree 18 8.4 35 181.9 1526.8 44Margaritaria indica Tree 5 2.3 76 346.0 806.5 57Paracroton pendulus Tree 8 3.7 61 182.1 679.1 67
FLACOURTIACEAE Hydnocarpus polypetalus Tree 4 1.9 81 176.3 328.7 83H. sumatrana Tree 36 16.8 13 316.3 5308.4 14H. woodii Tree 1 0.5 154 139.8 65.2 126Xylosma sumatrana Tree 67 31.2 7 317.4 9913.2 6
GNETACEAE Gnetum gnemonoides Vine 4 1.9 82 58.2 108.5 17LAMIACEAE Teijsmanniodendron bogoriense Tree 10 4.7 53 392.4 1829.5 36
Vitex pinnata Tree 55 25.6 9 659.9 16919.6 5LAURACEAE Cinnamomum sp. 1 Tree 1 0.5 155 160.5 74.8 121
Cryptocarya sp. 1 Tree 5 2.3 77 127.2 296.5 84C. sp. 2 Tree 1 0.5 156 123.0 57.3 130Dehaasia cuneata Tree 9 4.2 57 378.8 1589.4 40Endiandra sp. 1 Tree 12 5.6 45 248.2 1388.4 45E. sp. 2 Tree 8 3.7 62 327.6 1221.9 50Litsea sp. 1 Tree 1 0.5 157 541.9 252.6 94L. sp. 2 Tree 1 0.5 158 233.9 109.0 114Nothaphoebe sp. 1 Tree 2 0.9 116 687.5 641.0 68
LECYTHIDACEAE Barringtonia macrostachya Tree 32 14.9 16 180.4 2690.8 29Planchonia valida Tree 1 0.5 159 3846.5 1793.2 37
LEGUMINOSAE Acacia borneensis Vine 10 4.7 54 30.6 142.6 16Albizia corniculata Vine 28 13.1 20 63.1 824.2 3Bauhinia diptera Vine 26 12.1 25 47.4 574.1 7Cassia indica Tree 3 1.4 95 80.6 112.8 113Crudia ornata Tree 1 0.5 160 144.5 67.4 123C. reticulata Tree 27 12.6 22 278.5 3505.8 21Cynometra ramiflora Tree 3 1.4 96 177.8 248.6 96Dalbergia parvifolia Vine 38 17.7 12 30.6 542.0 8Derris elegans Vine 2 0.9 117 27.9 26.0 31D. sp. 1 Vine 5 2.3 78 31.9 74.2 20D. sp. 2 Vine 1 0.5 161 58.0 27.1 30Dialium indum Tree 1 0.5 162 4582.0 2136.1 33Entada rheedei Vine 32 14.9 17 75.3 1123.9 2Koompassia excelsa Tree 1 0.5 163 611.0 284.8 86Millettia nieuwenhuisii Vine 20 9.3 31 57.6 537.0 9M. sp. 1 Vine 4 1.9 83 94.2 175.6 14M. sp. 2 Vine 2 0.9 118 15.4 14.4 34Ormosia sumatrana Tree 2 0.9 119 298.1 278.0 87Pongamia pinnata Tree 11 5.1 51 573.8 2942.5 26Sindora leiocarpa Tree 2 0.9 120 243.9 227.4 100Spatholobus macropterus Vine 18 8.4 36 60.4 506.9 10
LOGANIACEAE Strychnos ignatii Vine 2 0.9 121 39.0 36.3 27S. minor Vine 3 1.4 97 45.5 63.6 21
LOPHOPYXIDACEAE Lophopyxis maingayi Vine 113 52.7 2 47.3 2491.8 1LYTHRACEAE Lagerstroemia speciosa Tree 6 2.8 70 227.4 636.0 69
Basal area (cm2)Rank/ ha Rank / tree or vine / haFamily Species Life form N

Table (Continued 2)Density
Tree VineMELASTOMATACEAE Memecylon edule Tree 1 0.5 164 116.8 54.4 132
M. paniculatum Tree 6 2.8 71 133.6 373.7 78Pternandra galeata Tree 65 30.3 8 1379.0 41789.1 3
MELIACEAE Aphanamixis sp. 1 Tree 1 0.5 165 106.7 49.7 134MENISPERMACEAE Haematocarpus validus Vine 1 0.5 166 25.8 12.0 39MORACEAE Artocarpus kemando Tree 2 0.9 122 238.4 222.3 102
Ficus benjamina Tree 1 0.5 167 1256.0 585.5 71F. binnendijkii Tree 14 6.5 43 665.3 4342.5 16F. cf. lanata Bl var foveolata Vine 2 0.9 123 39.8 37.1 26F. crassiramea Tree 4 1.9 84 2129.5 3971.1 19F. globosa Vine 1 0.5 168 98.4 45.9 23F. variegata Tree 1 0.5 169 803.8 374.8 77
MYRISTICACEAE Knema laurina Tree 4 1.9 85 115.6 215.6 103Myristica sp. 1 Tree 2 0.9 124 743.3 693.0 65M. sp. 2 Tree 8 3.7 63 256.0 954.6 54
MYRSINACEAE Ardisia sp. 1 Tree 1 0.5 170 133.8 62.4 128Embelia philippinensis Vine 2 0.9 125 35.9 33.4 28
MYRTACEAE Eugenia litseaefolia Tree 16 7.5 38 255.1 1902.8 35E. sandakanensis Tree 3 1.4 98 197.1 275.6 89E. sp. 1 Tree 3 1.4 99 94.5 132.2 111E. sp. 2 Tree 33 15.4 15 544.9 8383.6 7E. sp. 3 Tree 28 13.1 21 317.9 4149.6 18E. sp. 4 Tree 1 0.5 171 754.4 351.7 81E. sp. 5 Tree 1 0.5 172 99.8 46.5 138Syzygium fastigiatum Tree 12 5.6 46 133.8 748.3 59
OLEACEAE Chionanthus pluriflorus Tree 2 0.9 126 623.4 581.3 72POLYGALACEAE Xanthophyllum flavescens Tree 12 5.6 47 308.4 1725.1 38PROTEACEAE Helicia robusta Tree 3 1.4 100 188.8 264.0 91RHAMNACEAE Ventilago dichotoma Vine 12 5.6 48 37.6 210.3 13
Ziziphus borneensis Vine 3 1.4 101 56.6 79.2 19RHIZOPHORACEAE Carallia brachiata Tree 13 6.1 44 515.3 3122.9 25RUBIACEAE Diplospora sp. 1 Tree 1 0.5 173 159.1 74.2 122
Gardenia tubifera Tree 3 1.4 102 184.3 257.8 93Ixora elliptica Tree 2 0.9 127 150.9 140.7 110Nauclea orientalis Tree 3 1.4 103 496.8 694.8 64N. subdita Tree 77 35.9 6 490.4 17602.4 4Neolamarckia cadamba Tree 7 3.3 64 373.8 1219.9 51Neonauclea excelsa Tree 4 1.9 86 277.5 517.5 73Pleiocarpidia sandahanica Tree 18 8.4 37 146.7 1231.5 49Uncaria callophylla Vine 10 4.7 55 33.4 155.9 15U. ferrea Vine 20 9.3 32 30.4 283.8 12
RUTACEAE Clausena excavata Tree 3 1.4 104 171.0 239.2 97SAPINDACEAE Dimocarpus longan Tree 1 0.5 174 756.9 352.9 80
Lepisanthes amoena Tree 1 0.5 175 137.8 64.2 127Mischocarpus sundaicus Tree 1 0.5 176 112.6 52.5 133Nephelium uncinatum Tree 1 0.5 177 478.2 222.9 101Pometia sp. 1 Tree 1 0.5 178 142.5 66.4 124
SAPOTACEAE Madhuca dubardii Tree 9 4.2 58 178.8 750.3 58Payena microphylla Tree 1 0.5 179 1355.9 632.1 70
STERCULIACEAE Pterospermum macrocarpum Tree 10 4.7 56 903.6 4212.4 17SYMPLOCACEAE Symplocos celastrifolia Tree 6 2.8 72 248.5 695.0 63TILIACEAE Colona serratifolia Tree 9 4.2 59 481.4 2019.9 34
Grewia acuminata Vine 1 0.5 180 23.0 10.7 41Microcos crassifolia Tree 27 12.6 23 248.3 3125.5 24
Basal area (cm2)Rank/ ha Rank / tree or vine / haFamily Species Life form N

Family Species 2005May Jun Jul Aug Sep Oct Nov Dec 2006
Jan Feb Mar Apr May
ANACARDIACEAE Androtium astylum Lv Fr Lv
Buchanania arborescens Lv Lv Lv
Dracontomelon dao Lv Fl Lv Lv
Mangifera griffithii Lv Lv
Melanochyla auriculata Lv Lv Lv
M. caesia Lv Lv
Pegia sarmentosa Lv Lv
ANNONACEAE Alphonsea javanica Lv
Artabotrys suaveolens Lv Fl Lv Lv
Uvaria lobbiana Lv Lv Lv
APOCYNACEAE Chilocarpus vernicosus Lv
C. sp. 1 Lv Lv
Ichnocarpus frutescens Lv
Parameria polyneura Lv Lv Lv Lv Lv Lv Lv
Urceola sp. 1 Fl Lv Fl Lv
Willughbeia angustifolia Lv Lv Lv Lv
AQUIFOLIACEAE Ilex cymosa Lv Fl Fr Lv Lv
ARACEAE Pothos sp. 1 Lv
BLECHNACEAE Stenochlaena palustris Lv Lv Lv Lv
BOMBACACEAE Durio grandiflorus Lv
BURSERACEAE Canarium denticulatum Lv Lv Lv
C. odontophyllum Lv
C. sp. 1 Lv
C. sp. 2 Lv Lv
C. sp. 3 Lv
CECROPIACEAE Poikilospermum suaveolens Lv
CHRYSOBALANACEAE Atuna cordata Lv Lv Lv Lv Lv
Licania splendens Lv
Maranthes corymbosa Lv Lv Lv Lv Lv Lv
Parinari oblongifolia Lv Lv
CLUSIACEAE Cratoxylum formosum Lv Lv Lv Lv Lv Lv Lv Fl Lv
C. sumatranum Lv
Garcinia brevipes Lv
G. parvifolia Lv Fr
G. rostrata Lv Fr Fr Fr Lv
Kayea oblongifolia Lv
Mesua elmeri Lv Lv Lv Lv Lv
M. macrantha Lv
COMBRETACEAE Combretum acuminatum Lv Lv Fr Lv
Terminalia citrina Lv
CONNARACEAE Agelaea borneensis Lv Lv Lv
A. trinervis Lv Lv Lv Lv
Connarus grandis Lv
Rourea mimosoides Lv Lv
R. minor Fr Lv Lv Lv
R. sp. 1 Lv
CONVOLVULACEAE Erycibe grandifolia Lv
Merremia borneensis Lv
Lv: leaves; Fr: fruits; Fl: flowers; Cx: calyx; Ba: bark; Tn: termite nest
Table 6 Food items and parts of each item consumed by focal members of BE-Group from May 2005to May 2006.

Table (Continued 1)Family Species 2005
May Jun Jul Aug Sep Oct Nov Dec 2006Jan Feb Mar Apr May
CTENOLOPHONACEAE Ctenolophon parvifolius Lv
CUCURBITACEAE Zanonia indica Lv Lv Lv Lv
DILLENIACEAE Dillenia excelsa Lv Fl Fl Fl Fl Fl Fl Fr Fl Fr Lv Fl Fl
Tetracera scandens Lv Fr Fr Fr Fr Lv Fr Lv
DIOSCOREACEAE Dioscorea laurifolia Lv Lv
DIPTEROCARPACEAE Shorea leprosula Lv
Vatica rassak Lv Lv Lv Fl Lv Lv Lv Lv Lv
V. venulosa Lv Lv Fl Lv Fl Lv
EBENACEAE Diospyros curranii Lv Lv
D. sp. 4 Lv
D. sp. 5 Lv
ELAEOCARPACEAE Elaeocarpus nitidus Lv Lv Lv Lv Lv Lv Lv Fr Lv Lv Lv Lv
E. stipularis Lv Lv
EUPHORBIACEAE Antidesma thwaitesianum Lv Lv Lv Fl Lv Fr Lv Fr Lv Fl Fl
Aporosa acuminatissima Lv
Baccaurea stipulata Lv Lv Lv Lv Lv Lv Lv
Bridelia penangiana Lv Lv
B. stipularis Lv Lv Lv Lv Lv Fl Lv Fr Fl Lv Fr Lv Lv Lv Fr Lv Lv
Cleistanthus myrianthus Lv Lv Lv Lv Lv Lv Lv Lv Lv Lv
Croton caudatus Lv Lv
C. oblongus Lv Lv Lv
Drypetes castilloi Lv Lv Lv Lv
EUPHORBIACEAE Excoecaria indica Lv Lv Lv Lv Lv
Macaranga conifera Lv Lv
M. depressa Lv Lv
Mallotus floribundus Fr Lv Lv Lv
M. muticus Lv Lv Fr Fl Lv Fr Lv Fr Lv Lv Lv Fl Lv Fl Lv Lv Lv Lv Fl Lv Fl
M. penangensis Lv Lv Lv Fr
Margaritaria indica Lv Lv Fr Lv Fr Lv Lv Lv Fl Lv Lv Fr
Paracroton pendulus Lv
FLACOURTIACEAE Hydnocarpus sumatrana Lv Lv Lv Lv Lv Lv Lv Lv Lv Lv Lv Lv
Xylosma sumatrana Lv Lv Lv Fl Lv Lv
GNETACEAE Gnetum gnemonoides Lv Lv Lv Lv
LAMIACEAE Teijsmanniodendron bogoriense Lv Fr Lv Lv Fl
Vitex pinnata Lv Lv Lv Lv Lv Lv Fl Lv Lv
LAURACEAE Alseodaphne insignis Fr Lv Fr Cx Lv Fr Cx Fr Fr Cx
Cinnamomum sp. 1 Lv Lv
Dehaasia cuneata Lv Lv Fr Fr Lv Fr Lv Lv Fl Lv Fl Lv Lv
Endiandra sp. 1 Lv Lv
E. sp. 2 Lv
Litsea sp. 2 Lv
L. sp. 3 Lv
Nothaphoebe sp. 1 Lv Lv
LECYTHIDACEAE Barringtonia macrostachya Lv Lv
Planchonia valida Lv
LEGUMINOSAE Acacia borneensis Lv Lv Lv Lv Lv Lv Lv
Airyantha borneensis Lv Lv
Albizia corniculata Lv Lv Lv Fr Lv Lv Lv Lv Lv Lv Lv Lv Lv
Lv: leaves; Fr: fruits; Fl: flowers; Cx: calyx; Ba: bark; Tn: termite nest

Table (Continued 2)Family Species 2005
May Jun Jul Aug Sep Oct Nov Dec 2006Jan Feb Mar Apr May
LEGUMINOSAE A. dolichadena Lv Lv Lv Lv
Bauhinia diptera Lv Fr Lv Lv Lv Lv Lv Lv Lv Lv Lv
Caesalpinia crista Lv
Crudia ornata Lv Fr
C. reticulata Lv Lv Lv Fr Fr Lv
Cynometra ramiflora Lv Lv Lv Fr Lv Lv Fr Lv Lv Lv Lv
Dalbergia parvifolia Lv Lv Lv Lv Fr Lv Lv Lv Lv Lv Lv LV
Derris elegans Lv Lv Lv Lv Lv
D. sp. 1 Lv Lv Lv Lv Lv Lv
D. sp. 2 Lv Lv Lv
D. sp. 3 Lv
D. sp. 4 Lv
Dialium indum Lv
Entada rheedei Lv Lv Lv Lv Lv Lv Lv Lv
Millettia nieuwenhuisii Lv Fr Lv Lv
Ormosia sumatrana Lv Lv Lv Lv
Pongamia pinnata Lv Lv Lv Lv Lv Lv Lv Lv Lv
Sindora leiocarpa Lv Fr Lv Fl
Spatholobus macropterus Lv Lv Lv Lv Lv Lv LV Lv LV Lv Lv Lv Lv
LEGUMINOSAE 1 Fr
LOGANIACEAE Strychnos minor Fr Lv Fr Lv
LOPHOPYXIDACEAE Lophopyxis maingayi Lv Lv Fr Lv Fr Lv Fr Lv Fr Lv Fr Lv Lv Lv Lv Lv Lv Lv
LORANTHACEAE Dendrophthoe longituba Lv Fl
Macrosolen sp. 1 Lv Fl
LYTHRACEAE Lagerstroemia speciosa Lv Lv Lv
L. sp. 1 Fl Fl Fl
MELASTOMATACEAE Memecylon paniculatum Lv Lv Lv Lv
Pternandra galeata Lv Lv Fr Lv Lv Lv Lv Fr Lv
MELIACEAE Dysoxylum sp. 1 Lv
Walsura pinnata Lv
MENISPERMACEAE Haematocarpus validus Lv
MORACEAE Artocarpus sp. 1 Lv Fr Fr Lv Lv
A. sp. 2 Lv
Ficus annulata Fr Fr Lv Fr Fr
F. benjamina Lv Lv Lv
F. binnendijkii Lv Lv Lv Fr Lv Lv Lv Fr Lv Fr Lv Fr Lv Fr Lv Fr Lv Fr Lv Fr Lv Fr
F. crassiramea Lv Lv Lv Lv Lv Lv Lv
F. depressa Lv
F. forstenii var. villosa Lv Lv Lv Fr
F. globosa Lv Lv Fr Lv Fr Fr Fr Fr Fr
F. cf. lanata var foveolata Lv Lv Lv Fr Lv Fr
F. pellucidopunctata Fr
F. racemosa var. elongata Lv
F. sundaica var beccarianum Lv Fr Lv Lv Fr Lv Lv Fr Lv Lv
F. sundaica var. impressicostata Lv
MORACEAE F. virens var. glabella Lv Lv Fr Lv Fr
F. sp. 1 Lv Lv Lv Lv Fr Fr Lv
F. sp. 2 Lv Lv
F. sp. 3 Lv
F. sp. 4 Lv
Lv: leaves; Fr: fruits; Fl: flowers; Cx: calyx; Ba: bark; Tn: termite nest

Table (Continued 3)Family Species 2005
May Jun Jul Aug Sep Oct Nov Dec 2006Jan Feb Mar Apr May
MORACEAE Ficus sp. 5 Lv
F. sp. 6 Lv
F. sp. 7 Lv
F. sp. 8 Lv
F. spp. Lv Lv
MYRISTICACEAE Knema laurina Lv
Myristica sp. 1 Lv
M. sp. 2 Lv Lv
MYRTACEAE Eugenia litseaefolia Lv Fr Lv Lv Lv Fr
E. sp. 2 Fr Ba Lv Ba Ba Lv Ba Lv Ba Lv
E. sp. 4 Lv Lv Lv
E. sp. 6 Lv
E. sp. 7 Lv
E. sp. 8 Lv Lv Lv Fr
E. sp. 9 Lv Fr
E. spp. Lv Lv Lv Lv Lv Lv Lv
Syzygium fastigiatum Fl Fr Fl Fr Lv
OPILIACEAE Champereia manillana Lv
OXALIDACEAE Dapania grandifolia Lv
PASSIFLORACEAE Passiflora foetida Lv
POLYGALACEAE Xanthophyllum flavescens Lv Lv Lv Lv Lv
X. neglectum Lv Lv
PROTEACEAE Helicia robusta Fl
RHAMNACEAE Ventilago dichotoma Lv Lv Lv Lv Lv Lv Lv Lv Lv
Ziziphus borneensis Lv Fr Fr
Z. havilandii Lv Lv Lv Lv Lv Lv Lv
RHIZOPHORACEAE Carallia brachiata Lv Lv Lv Lv Lv Fr Fl Lv Fl Lv Fl Lv Lv Fr Lv Fl Lv
RUBIACEAE Gardenia tubifera Lv Lv Lv Lv Lv Lv
Nauclea orientalis Fl Fr Fr
N. subdita Lv Lv Fl Lv Fl Fr Lv Fr Fl Fr Lv Fr Fl Fr Lv Fr
Neolamarckia cadamba Lv
Neonauclea excelsa Lv Lv Lv Lv
Pleiocarpidia sandahanica Lv Lv
SANTALACEAE Scleropyrum wallichianum Lv
SAPINDACEAE Dimocarpus longan Lv Lv
SAPOTACEAE Madhuca dubardii Lv Lv Lv
Palaquium stenophyllum Lv
STERCULIACEAE Heritiera elata Lv Lv
Pterospermum macrocarpum Fl Lv Fl Fl Lv Lv Lv Lv Lv Lv Lv Fl
SYMPLOCACEAE Symplocos celastrifolia Lv Fl Fl
THEACEAE Camellia lanceolata Lv Lv
TILIACEAE Grewia acuminata Lv
Microcos crassifolia Lv Lv Lv
VITACEAE Cayratia trifolia Lv Lv Lv Lv Lv Lv Fl Lv
Termite nest Microcerotermes distans Tn Tn Tn Tn Tn Tn Tn Tn Tn Tn
Unknown (T or V) Lv Lv Lv Lv Lv Lv Lv Lv Lv Lv Lv Lv Lv
Unknown (T) Lv Lv Lv Lv Lv Lv Lv Lv Lv Lv Lv Lv Lv
Unknown (V) Lv Lv Lv Lv Lv Lv Lv Lv Lv Lv Lv Lv Lv
Lv: leaves; Fr: fruits; Fl: flowers; Cx: calyx; Ba: bark; Tn: termite nest

Fruits Young leaves Flowers Mature leaves OthersBejita 21.3 71.4 6.8 0.04 0.4SD 23.0 26.4 11.7 0.2 1.9
ChiChi 26.1 67.3 6.2 0 0.4SD 28.1 28.6 10.4 0 1.8
Bulma 21.3 73.3 5.4 0 0SD 24.9 27.3 11.0 0 0
Lunch 33.2 61.4 4.6 0 0.8SD 34.9 36.4 13.8 0 2.7
Arare 26.8 67.4 4.9 0 0.8SD 29.8 29.6 7.7 0 3.2
Bigmama 23.5 61.1 15.4 0 0SD 26.6 31.6 21.6 0 0
Midori 30.4 60.1 9.6 0 0SD 30.3 32.6 11.1 0 0
Total 25.9 65.9 7.7 0.03 0.5
Table 7 Time allocation to fruits, young leaves, flowers, mature leaves and others ineach adult of BE-Group. Observation was conducted from May 2005 to May 2006.

Ora
ngut
anLo
ng-ta
iled
mac
aque
Spe
cies
Life
form
NFr
uit
Flow
erLo
phop
yxis
mai
ngay
iV
ine
113
○×
Exco
ecar
ia in
dica
Tree
111
××
Frui
t*
Cro
ton
oblo
ngus
Tree
82×
×
Xylo
sma
sum
atra
naTr
ee67
×○
Pter
nand
ra g
alea
taTr
ee65
○×
Vite
x pi
nnat
a.Tr
ee55
×○
Frui
tVa
tica
rass
akTr
ee52
×○
Cro
ton
caud
atus
Vin
e46
××
Enta
da rh
eede
iV
ine
32×
×Fr
uit
Mic
roco
s cr
assi
folia
Tree
27×
×Fr
uit
Arta
botry
s su
aveo
lens
Vin
e26
×○
Glo
chid
ion
obsc
urum
Tree
20×
×
Unc
aria
ferre
aV
ine
20×
×
Bacc
aure
a st
ipul
ata
Tree
18×
×
Plei
ocar
pidi
a sa
ndah
anic
aTr
ee18
××
Dra
cont
omel
on d
aoTr
ee15
×○
Frui
t
Tabl
e 8
Dom
inan
t tre
e or
vin
e sp
ecie
s w
ith m
any
fruits
and
flow
ers
whi
ch w
ere
not c
onsu
med
by
prob
osci
s m
onke
ys a
t all,
with
resu
lts o
f fac
ulta
tive
obse
rvat
ion
of o
rang
utan
and
long
-taile
d m
acaq
ueco
nsum
ing
fruits
of s
ome
spec
ies.
Pro
bosc
is m
onke
y
* Lo
ng-ta
iled
mac
aque
s di
d no
t con
sum
e fre
sh fr
uits
on
the
trees
, tho
ugh
they
wer
e on
ce o
bser
ved
taki
ng s
ome
old
and
dry
fruits
floa
ting
in th
e riv
er

FruitsTreeSpecies Availability Observed Time (min.) Expected Time (min.) PreferenceAndrotium astylum 0 19.6 0Ilex cymosa 227 66.6 55.3Garcinia parvifolia 207 13.0 50.6Dillenia excelsa 718 7.6 175.2Elaeocarpus nitidus 165 6.2 40.2Antidesma thwaitesianum 1383 12.0 337.2 NGMallotus floribundus 0 1.0 0M muticus 2845 2059.5 694.0 POM penangensis 113 0.7 27.6Margaritaria indica 134 48.7 32.8Teijsmanniodendron bogoriense 76 15.8 18.6Dehaasia cuneata 74 284.4 17.9 POCrudia ornata 0 44.9 0C reticulata 43 574.9 10.6 POCynometra ramiflora 7 58.1 1.7Sindora leiocarpa 0 20.9 0Pternandra galeata 10608 8.4 2587.7 NGFicus binnendijkii 284 1162.0 69.4 POEugenia litseaefolia 10 1152.9 2.4 POE sp. 2 212 212.3 51.6 POSyzygium fastigiatum 26 59.6 6.3Carallia brachiata 300 62.3 73.2Nauclea orientalis 58 29.7 14.1N subdita 8134 330.0 1984.3 NG
VineSpecies Availability Observed Time (min.) Expected Time (min.) PreferenceBridelia stipularis 238 180.8 849.7 NGCombretum acuminatum 1 31.4 3.6Rourea minor 8 54.0 27.0Tetracera scandens 4 305.0 12.9 POAlbizia corniculata 128 4.5 455.4 NGBauhinia diptera 0 4.8 0Dalbergia parvifolia 31 8.0 110.3Millettia nieuwenhuisii 18 0.3 63.9Strychnos minor 2 38.8 6.3Lophopyxis maingayi 340 1612.3 1213.8 NUFicus cf. lanata Bl var foveolata 3 20.1 11.0F globosa 15 388.3 54.6 POZiziphus borneensis 15 215.4 55.0 PO
Table 9 Comparison between time spent for feeding on each species and time expected fromavailability estimated from vegetation survey. The availability was calculated using the followingformula. Availability = Bk・∑(nki / Nk) / 12 where Nk is the total number of plants, nki is the number oftree or vine plants with fruits, flowers or young leaves in month i and Bk is total basal area per hectarein the species k. For Nk and Bk, cf. Table 3. PO, NG and NU: positive, negative and neutral preferenceof proboscis monkeys, respectively.
G-test: G = 31307 and p < 0.0001
G-test: G = 4686 and p < 0.0001

(Continued 1)FlowersTreeSpecies Availability Observed Time (min.) Expected Time (min.) PreferenceDracontomelon dao 98 14.3 10.6Ilex cymosa 1361 18.1 148.0Cratoxylum formosum 24 26.2 2.6Dillenia excelsa 2774 405.6 301.6 NUVatica rassak 341 59.4 37.1V venulosa 0 31.0 0Antidesma thwaitesianum 1185 329.1 128.9 POMallotus muticus 4617 399.1 502.0 NUMargaritaria indica 27 182.4 2.9 POXylosma sumatrana 2071 7.2 225.2 NGTeijsmanniodendron bogoriense 122 17.0 13.3Vitex pinnata 6358 2.2 691.3 NGDehaasia cuneata 162 93.1 17.6Sindora leiocarpa 0 10.8 0Syzygium fastigiatum 73 32.7 7.9Helicia robusta 66 1.3 7.2Carallia brachiata 1942 240.7 211.1 NUNauclea orientalis 39 73.1 4.2N subdita 3277 246.2 356.3 NUPterospermum macrocarpum 211 456.4 22.9 POSymplocos celastrifolia 68 52.6 7.3
VineSpecies Availability Observed Time (min.) Expected Time (min.) PreferenceArtabotrys suaveolens 71 33.9 80.1Urceola sp. 1 3 297.1 3.6 POBridelia stipularis 257 42.8 290.0 NG
G-test: G = 2405 and p < 0.0001
G-test: G = 5860 and p < 0.0001

(Continued 2)Young leavesTreeSpecies Availability Observed Time (min.) Expected Time (min.) Preference Androtium astylum 49 11.2 2.4Buchanania arborescens 3317 27.3 160.1Dracontomelon dao 3375 33.7 162.9Melanochyla auriculata 331 90.0 16.0Ilex cymosa 6163 24.2 297.5 NGCanarium denticulatum 83 10.5 4.0Maranthes corymbosa 278 448.3 13.4 POParinari oblongifolia 2782 16.0 134.3Cratoxylum formosum 746 276.2 36.0 POGarcinia brevipes 40 4.4 1.9G parvifolia 1473 13.8 71.1Kayea oblongifolia 75 5.0 3.6Mesua elmeri 4100 488.6 197.9 POM macrantha 168 11.6 8.1Terminalia citrina 129 8.7 6.2Dillenia excelsa 7589 49.5 366.3 NGVatica rassak 6763 110.4 326.5 NGV venulosa 2140 75.4 103.3Diospyros curranii 2208 9.8 106.6Elaeocarpus nitidus 2165 720.6 104.5 POE stipularis 841 61.6 40.6Excoecaria indica 74353 92.5 3589.1 NGAntidesma thwaitesianum 5744 70.6 277.3 NGAporosa acuminatissima 143 5.7 6.9Baccaurea stipulata 953 138.8 46.0Bridelia penangiana 227 301.0 11.0 POCleistanthus myrianthus 2681 223.5 129.4 NUCroton oblongus 6807 41.6 328.6 NGDrypetes castilloi 1043 232.6 50.4 POMacaranga conifera 707 10.7 34.1Mallotus floribundus 22 79.1 1.1M muticus 38883 2687.1 1876.9 NUM penangensis 1435 13.3 69.3Margaritaria indica 780 558.3 37.6 POParacroton pendulus 651 1.0 31.4Hydnocarpus sumatrana 4706 316.0 227.2 NUXylosma sumatrana 9654 82.5 466.0 NGTeijsmanniodendron bogoriense 1723 5.6 83.2Vitex pinnata 16586 109.5 800.6 NGCinnamomum sp. 1 25 6.5 1.2Dehaasia cuneata 1516 222.3 73.2 POEndiandra sp. 1 1331 9.0 64.2E sp. 2 1196 19.9 57.8Litsea sp. 2 109 5.1 5.3Nothaphoebe sp. 1 561 2.4 27.1Barringtonia macrostachya 2600 15.6 125.5Planchonia valida 1793 2.0 86.6Crudia ornata 39 6.1 1.9C reticulata 2348 78.9 113.3Cynometra ramiflora 221 1697.2 10.7 PODialium indum 1780 12.4 85.9Ormosia sumatrana 232 217.2 11.2 PO

(Continued 3)TreeSpecies Availability Observed Time (min.) Expected Time (min.) PreferencePongamia pinnata 2251 206.5 108.7 NUSindora leiocarpa 218 9.3 10.5Lagerstroemia speciosa 442 15.1 21.3Memecylon paniculatum 358 32.1 17.3Pternandra galeata 39860 78.7 1924.1 NGFicus benjamina 586 387.8 28.3 POF binnendijkii 3464 1931.3 167.2 POF crassiramea 1737 141.6 83.9Knema laurina 193 7.6 9.3Myristica sp. 1 924 0.2 44.6M sp. 2 1004 18.2 48.5Eugenia litseaefolia 1596 35.3 77.0E sp. 2 8807 40.4 425.1 NGE sp. 5 352 24.2 17.0Syzygium fastigiatum 733 20.9 35.4Xanthophyllum flavescens 1605 60.0 77.5Carallia brachiata 3063 2258.1 147.8 POGardenia tubifera 222 65.8 10.7Nauclea subdita 16459 64.1 794.5 NGNeolamarckia cadamba 1191 14.2 57.5Neonauclea excelsa 517 21.5 25.0Pleiocarpidia sandahanica 1083 13.4 52.3Dimocarpus longan 323 33.1 15.6Madhuca dubardii 625 7.2 30.2Pterospermum macrocarpum 3230 158.1 155.9Symplocos celastrifolia 647 1.7 31.2Microcos crassifolia 2894 42.5 139.7
G-test: G = 56541 and p < 0.0001

(Continued 4)VineSpecies Availability Observed Time (min.) Expected Time (min.) PreferenceArtabotrys suaveolens 815 27.3 498.7 NGUvaria lobbiana 17 2.2 10.1Parameria polyneura 17 279.6 10.3 POUrceola sp. 1 57 50.7 34.8Willughbeia angustifolia 19 81.6 11.5Combretum acuminatum 83 61.5 50.7Agelaea borneensis 18 22.8 11.3A trinervis 30 30.2 18.1Connarus grandis 143 1.6 87.7Rourea mimosoides 30 62.5 18.6R minor 668 59.7 408.8 NGErycibe grandifolia 27 3.2 16.5Tetracera scandens 62 49.7 37.6Bridelia stipularis 1083 301.0 662.6 NUCroton caudatus 986 20.3 602.8 NGGnetum gnemonoides 125 12.8 76.8Acacia borneensis 214 663.0 130.8 POAlbizia corniculata 1155 258.6 706.7 NGBauhinia diptera 707 1081.3 432.2 PODalbergia parvifolia 713 1514.4 436.2 PODerris elegans 39 89.9 23.8D sp. 1 97 65.6 59.0Derris sp. 2 37 89.2 22.8Entada rheedei 1532 245.6 937.2 NGMillettia nieuwenhuisii 711 21.2 435.2 NGSpatholobus macropterus 739 1372.4 452.2 POStrychnos minor 90 26.0 55.1Lophopyxis maingayi 3062 1605.4 1873.1 NUHaematocarpus validus 17 1.2 10.1Ficus cf. lanata Bl var foveolata 28 40.1 17.0F globosa 264 59.5 161.3Ventilago dichotoma 300 320.5 183.6 POZiziphus borneensis 109 42.0 66.6Grewia acuminata 15 6.2 9.0
G-test: G = 11259 and p < 0.0001

Species Calyx Flesh Seed SeasonAndrotium astylum ○ ○ May / 05Ilex cymosa ○ ○ NovGarcinia parvifolia ○ ○ NovG. rostrata ○ Nov - JanCombretum acuminatum ○ ○ NovRourea minor ○ SepDillenia excelsa ○ ○ Oct - NovTetracera scandens ○ ○ Jun - Aug, Nov, JanElaeocarpus nitidus ○ ○ JanAntidesma thwaitesianum ○ ○ Nov - DecBridelia stipularis ○ ○ Nov - Dec, MarMallotus floribundus ○ JunM. muticus ○ ○ Jun -AugM. penangensis ○ JulMargaritaria indica ○ ○ Jul - Aug, MarTeijsmanniodendron bogoriense ○ OctAlseodaphne insignis ○ ○ ○ Oct - Jan, AprDehaasia cuneata ○ Jul - SepAlbizia corniculata ○ ○ JulBauhinia diptera ○ JunCrudia ornata ○ NovC. reticulata ○ Nov - DecCynometra ramiflora ○ Aug, DecDalbergia parvifolia ○ ○ AugMillettia nieuwenhuisii ○ AugSindora leiocarpa ○ OctLEGUMINOSAE 1 ○ NovStrychnos minor ○ ○ Aug -SepLophopyxis maingayi ○ Jun - OctPternandra galeata ○ ○ Aug, AprArtocarpus sp. 1 ○ Apr -SepFicus annulata ○ ○ Aug, Dec - Jan, MarF. binnendijkii ○ ○ Jul, Oct - MayF. forstenii var. villosa ○ ○ MarF. globosa ○ ○ Sep, Nov - Jan, Mar, May / 06F. cf. lanata var foveolata ○ ○ Mar -AprF. pellucidopunctata ○ ○ JulF. sundaica var beccarianum ○ ○ Aug, Nov, JanF. virens var. glabella ○ ○ Oct, MarF. sp. 1 ○ ○ Jan, AprEugenia litseaefolia ○ ○ May / 05, May / 06E. sp. 2 ○ JunE. sp. 8 ○ ○ DecE. sp. 9 ○ ○ May / 06Syzygium fastigiatum ○ ○ Jul - AugZiziphus borneensis ○ Nov - DecCarallia brachiata ○ ○ Nov, MarNauclea orientalis ○ ○ Nov -DecN. subdita ○ ○ Oct - Feb, Apr
Table 10 Parts of each fruit consumed by proboscis monkeys.
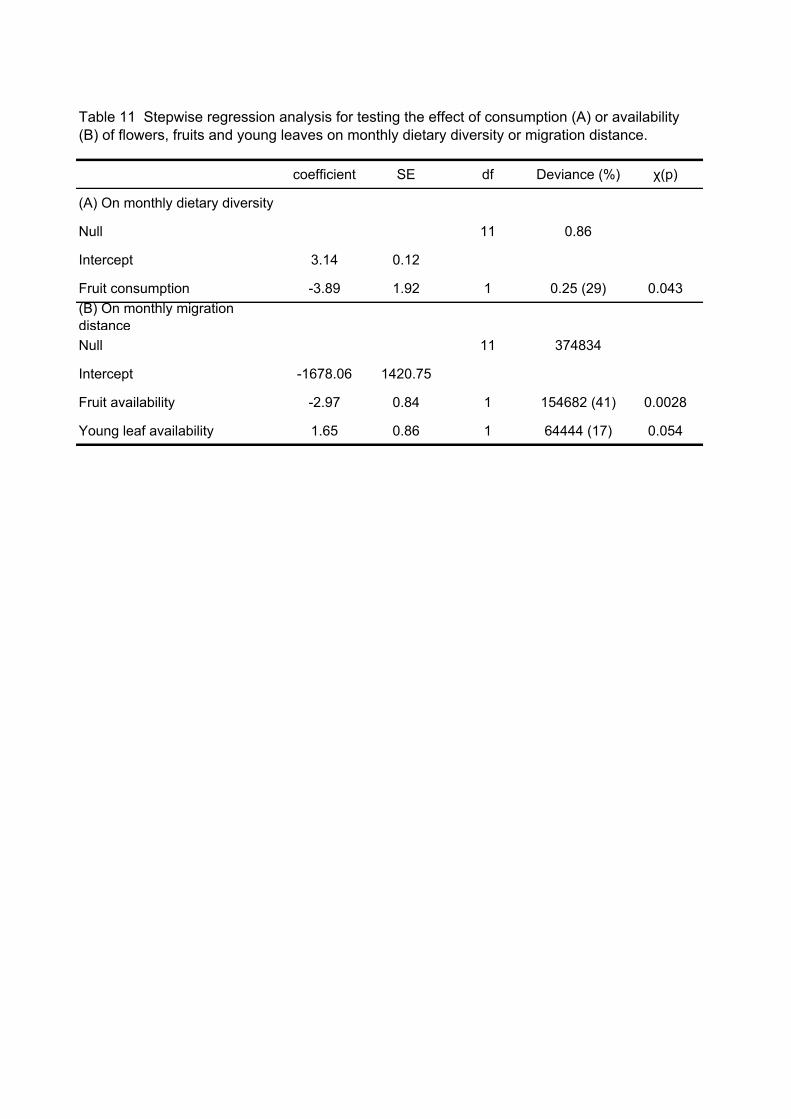
coefficient SE df Deviance (%) χ(p)
(A) On monthly dietary diversity
Null 11 0.86
Intercept 3.14 0.12
Fruit consumption -3.89 1.92 1 0.25 (29) 0.043(B) On monthly migrationdistanceNull 11 374834
Intercept -1678.06 1420.75
Fruit availability -2.97 0.84 1 154682 (41) 0.0028
Young leaf availability 1.65 0.86 1 64444 (17) 0.054
Table 11 Stepwise regression analysis for testing the effect of consumption (A) or availability(B) of flowers, fruits and young leaves on monthly dietary diversity or migration distance.

Fig.
1 S
tudy
are
a in
Sab
ah, M
alay
sia.
TR 1
–16
: Tra
il co
de

Fig. 2 The monthly mean number of boats (A) and tourists (B) per day in the MenanggulRiver. Vertical bars indicate standard deviation.
(A)
0
5
10
15
20
M / 05 J J A S O N D J / 06 F M A M
Mea
n nu
mbe
r of b
oats
with
SD
(B)
0
25
50
75
100
M / 05 J J A S O N D J / 06 F M A MMonth
Mea
n nu
mbe
r of t
ouris
ts w
ithSD

Fig. 3 Monthly averages of minimum and maximum daily temperatures at basecamp. Vertical bars indicate standard deviation.
21
23
25
27
29
31
33
M / 05 J J A S O N D J / 06 F M A M
Month
Ave
rage
tem
pera
ture
with
SD
( ℃)
Max. temperature
Min. temperature

Fig. 4 Monthly rainfall (A) and the average river level with standard deviation ineach month (B). * Only 25 days' rainfall data available in May 2005.
(A)
0
200
400
600
M / 06 J J A S O N D J / 06 F M A M
Mon
thly
rain
fall
(mm
)
(B)
0
100
200
300
400
500
M / 05 J J A S O N D J / 06 F M A M
Month
Mea
n w
ater
leve
l (cm
)
*

Fig. 5 One-male group at sleeping site

Fig.
6 T
empo
ral t
rend
of s
leep
ing
site
s of
BE
-Gro
up.
Ope
n an
d fil
led
circ
les
indi
cate
left
and
right
ban
ks, r
espe
ctiv
ely.
0
1000
2000
3000
4000
5000
6000
MJ
JA
SO
ND
JM
AM
Mon
th
Distance from river mouth (m)
M /
05J
/ 06

Fig. 7 Distribution of sleeping sites of BE-Group (A) and other groups (B) along riversidesof the Menanggul River from May 2005 to May 2006.
(A) BE-Group (N = 261)
0
5
10
15
20
25
0 1000 2000 3000 4000 5000 6000Distance from river mouth (m)
Num
ber o
f sle
epin
g si
tes
(B) Other groups (N = 621)
0
10
20
30
40
0 1000 2000 3000 4000 5000 6000
Distance from river mouth (m)
Num
ber o
f sle
epin
g si
tes

Fig. 8 Frequency distribution of distances between BE-Group and its nearest one-malegroup.
0
10
20
30
40
0-50m 50-100m 100-200m 200-300m 300-400m 400-500m
Distance from BE-Group to its nearest one-male group
Num
ber o
f cas
es
On the opposite riversideOn the same riverside
N = 148

Fig. 9 River width (A) and frequency of river crossing at each point of river (B). In B, top: data formale and female were pooled; middle: data for male; bottom: data for females.
(A) River width
10
20
30
40
0 1000 2000 3000 4000 5000 6000
Distance from river mouth (m)
Riv
er w
idth
(m)
(B) Frequency of river crossing(N = 155)
0
3
6
9
12
15
18
0 1000 2000 3000 4000 5000 6000Distance from river mouth (m)
Failure
Success
Male (N = 90)
0
3
6
9
12
15
18
0 1000 2000 3000 4000 5000 6000Distance from river mouth (m)
Female (N = 65)
0
3
6
9
12
15
18
0 1000 2000 3000 4000 5000 6000Distance from river mouth (m)
Freq
uenc
y of
rive
r cro
ssin
g

Fig. 10 Comparison of success ratio in river crossing among adult male, adultfemales with infant or without infant and juveniles. Data for juveniles werefacultatively taken when focal monkeys were followed.
0%
20%
40%
60%
80%
100%
Adult male (N=90) Adult females with infant
(N=38)
Adult femaleswithout infant
(N=27)
Juveniles (N = 50)
Success Failure

Fig.
11
Infa
nt (A
) and
juv
enile
(B) a
ttack
ed b
y cl
oude
d le
opar
ds w
hich
sud
denl
y bi
t nec
k of
the
vict
ims.
(A)
(B)

2005
2006
Mon
th5
67
89
1011
121
23
45
Bej
iita:
A ♂
Chi
Chi
: A ♀
Chi
-J ♀
Chi
-I ♂
Bul
ma:
A ♀
Bul
-J ♀
Bul
-I ♂
Lunc
h: A
♀Lu
n-J ♀
Lun-
I ♀A
rare
: A ♀
Ara
-J ♀
Ara
-I ♀
Ara
-I ♂
Big
mam
a: A
♀B
ig-J
♀B
ig-I ♂
Mid
ori:
A ♀
Mid
-J ♀
Ran
fan:
SA
♀Fi
g. 1
2 C
ompo
sitio
n of
BE
-Gro
up fr
om M
ay 2
005
to M
ay 2
006.
Dat
es o
f birt
h or
tran
sfer
are
sho
wn
only
whe
n th
e ev
ent w
as n
otob
serv
ed o
n th
e pr
evio
us d
ay.
A: a
dult;
SA
: sub
adul
t; J:
juve
nile
; I: i
nfan
t
B: b
irth;
T: t
rans
fer;
P: p
reda
tion;
D: d
isap
pear
(D)
(T)
(T)
(P, 2
1 / 7
/ 20
05)
(B, 2
7 / 1
/ 20
06)
(B, 1
5 / 3
/ 20
06)
(T, 1
5 / 3
/ 20
06)
(P, 8
/ 4
/ 200
6)

Fig. 13 Seasonal fluctuation of time allocation to three activities, i. e. feeding, moving andothers (grooming and copulation). A: Data for adult male and females are pooled. B-D :Data for male and females are separately shown.
(B) Feeding
0
10
20
30
M / 05 J J A S O N D J / 06 F M A M
Male Female
(C) Moving
0
3
6
M / 05 J J A S O N D J / 06 F M A M
Male Female
0
5
10
15
20
25
30
M / 05 J J A S O N D J / 06 F M A M
Feeding
Moving
(A) TotalP
erce
ntag
e of
tim
e%
%
%
(D) Others
0
0.5
1
1.5
2
2.5
3
M / 05 J J A S O N D J / 06 F M A M
Month
Male Female
Others
%

Fig. 14 Mean daily count of (A) defecation and (B) urination with standard deviation in eachmonth.
0
5
10
15
M / 05 J J A S O N D J / 06 F M A M
Mea
n da
ily c
ount
of d
efec
atio
n
Male Female
0
5
10
M / 05 J J A S O N D J / 06 F M A MMonth
Mea
n da
ily c
ount
of u
rinat
ion
Male Female
(A)
(B)

Fig. 15 Daily feeding rhythm of all focal members (A), adult male (B) and adultfemales (C). At intervals of one hour, monthly time allocation to feeding wascalculated in percentage and mean with SD (n: 13 months) is shown for each hour.
(A) Total
0
20
40
6:00 9:00 12:00 15:00 18:00
(B) Male
0
20
40
6:00 9:00 12:00 15:00 18:00
(C) Females
0
20
40
6:00 9:00 12:00 15:00 18:00
Time of day
Per
cent
age
of ti
me
for f
eedi
ng%
%
%

Fig. 16 Cumulative number of plant species found along trails from TR 1 to TR 16.
0
40
80
120
160
200
0 2000 4000 6000 8000
Trail distance (m)
Cum
ulat
ive
num
ber o
f pla
nt s
peci
es
180

Fig. 17 Cumulative number of plant species consumed by proboscis monkeys fromMay 2005 to May 2006.
0
40
80
120
160
200
0 500 1000 1500 2000 2500 3000 3500Observation time (hrs)
Cum
ulat
ive
num
ber o
f spe
cies
188

Fig.
18
Num
ber o
f pla
nt s
peci
es p
rovi
ding
you
ng le
aves
, fru
its a
nd /
or fl
ower
s.
You
ng le
aves
182
Frui
ts 4
9
Flow
ers
28
11
2

Fig.
19
Num
bers
of a
long
-trai
l tre
es a
nd v
ines
of p
lant
spe
cies
whi
ch w
ere
conf
irmed
to b
e co
nsum
ed y
oung
leav
es, f
ruits
or
flow
ers
by fo
cal a
dults
(see
Tab
les
3 an
d 4)
.
You
ng le
aves
189
9
Frui
ts 9
19Fl
ower
s 71
6
469
3
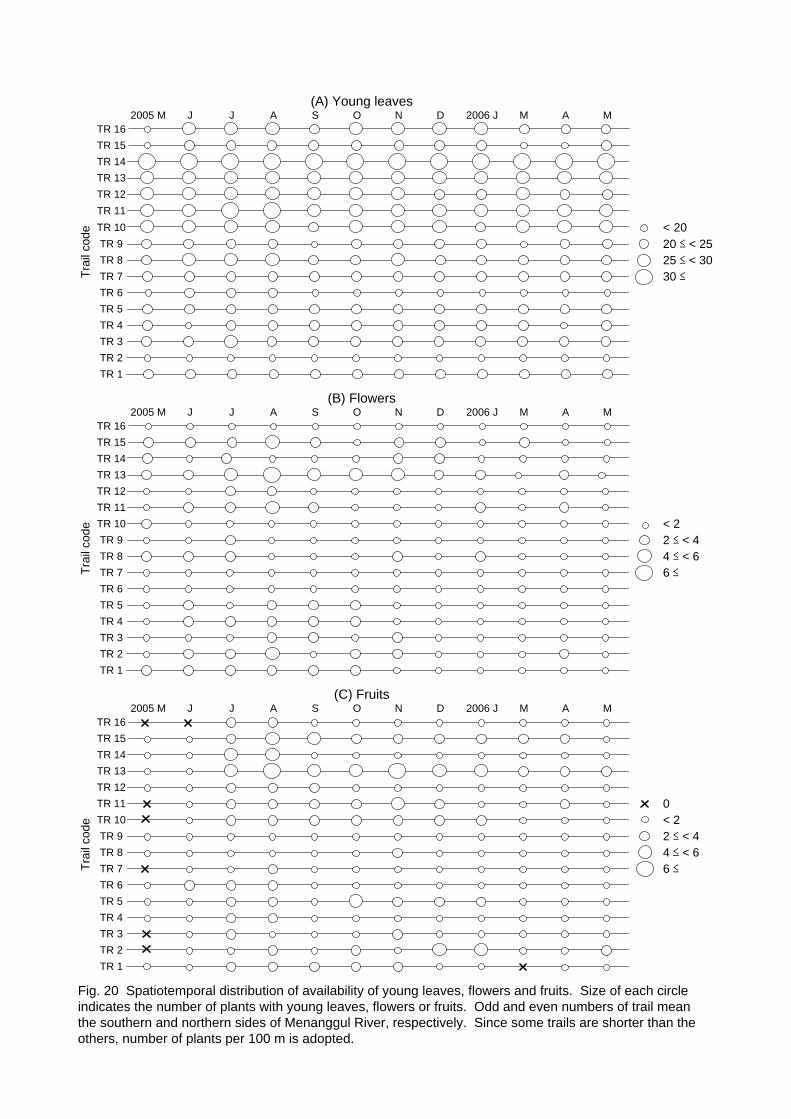
2005 M J J A S O N D 2006 J M A M
2005 M J J A S O N D 2006 J M A M
2005 M J J A S O N D 2006 J M A M
6 ≤
2 ≤ < 4
TR 8
< 2
30 ≤
4 ≤ < 6
TR 10TR 9
< 22 ≤ < 44 ≤ < 6
Fig. 20 Spatiotemporal distribution of availability of young leaves, flowers and fruits. Size of each circleindicates the number of plants with young leaves, flowers or fruits. Odd and even numbers of trail meanthe southern and northern sides of Menanggul River, respectively. Since some trails are shorter than theothers, number of plants per 100 m is adopted.
TR 2TR 1
TR 6TR 5TR 4TR 3
0
20 ≤ < 2525 ≤ < 30
< 20
TR 3TR 2
TR 7TR 6
TR 16TR 15TR 14
TR 5
TR 13TR 12TR 11TR 10TR 9
TR 7
TR 6TR 5
TR 12TR 11TR 10TR 9TR 8
TR 4
TR 4TR 3
6 ≤TR 7Trai
l cod
eTr
ail c
ode
Trai
l cod
e
(C) Fruits
(B) Flowers
TR 13
TR 2TR 1
TR 16TR 15
(A) Young leaves
TR 16TR 15TR 14
TR 14TR 13TR 12TR 11
TR 8
TR 1
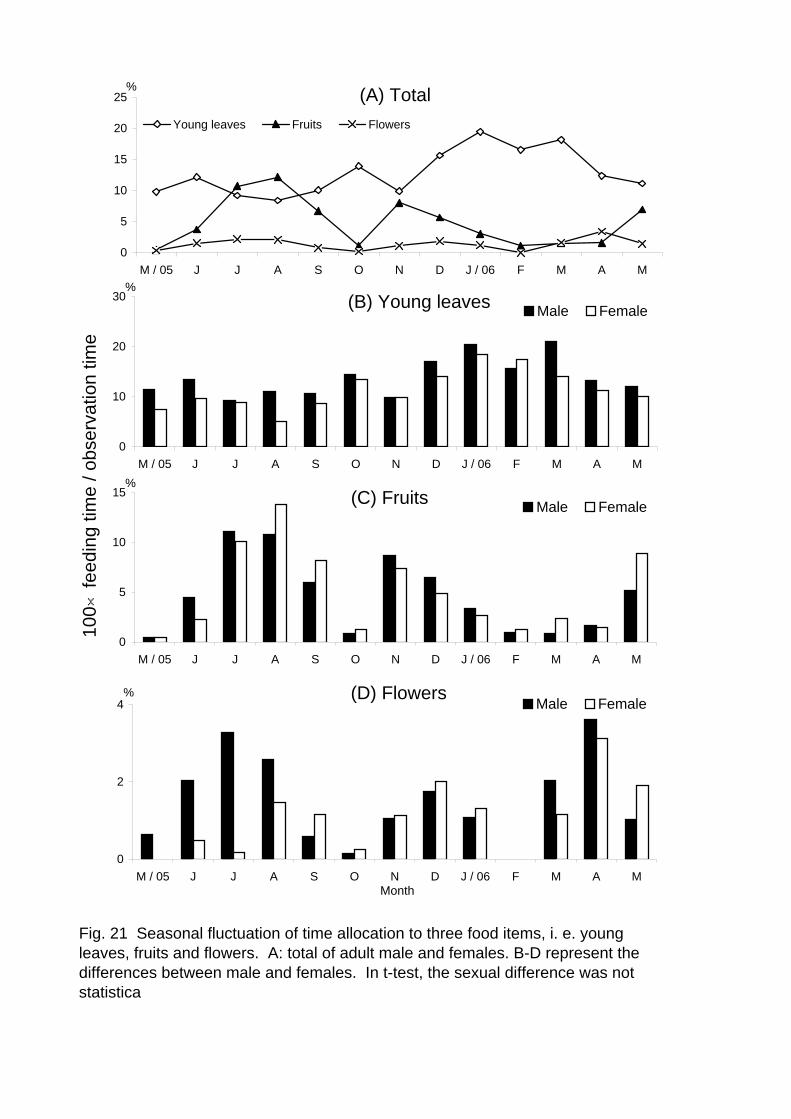
Fig. 21 Seasonal fluctuation of time allocation to three food items, i. e. youngleaves, fruits and flowers. A: total of adult male and females. B-D represent thedifferences between male and females. In t-test, the sexual difference was notstatistica
(A) Total
0
5
10
15
20
25
M / 05 J J A S O N D J / 06 F M A M
Young leaves Fruits Flowers
%
(B) Young leaves
0
10
20
30
M / 05 J J A S O N D J / 06 F M A M
Male Female
(C) Fruits
0
5
10
15
M / 05 J J A S O N D J / 06 F M A M
Male Female
(D) Flowers
0
2
4
M / 05 J J A S O N D J / 06 F M A MMonth
Male Female
100 ×
feed
ing
time
/ obs
erva
tion
time
%
%
%

Fig. 22 Time allocation to consumption of ripe or unripe fruits (A) and to four fruit parts, i.e. seed only, flesh & seed, flesh only, calyx (B).
Ripe fruit9.6%
Unripe fruit90.4%
Calyx0.9%
Flesh2.1%
Seed32.9%
Flesh & Seed64.1%
(A)
(B)

(A) U
nrip
e st
age
1(B
) Unr
ipe
stag
e 2
(C) U
nrip
e st
age
3(D
) Rip
e st
age
Fig.
23
Rip
enin
g of
Als
eoda
phne
insi
gnis
frui
t. A
: fru
it is
stil
l sm
all a
nd h
ard;
B: f
ruit
grow
s, b
ut s
till h
ard;
C: t
he fr
uit s
ize
near
ly re
ache
s m
axim
um, b
ut s
till u
nrip
e fru
it; D
: rip
e fru
it. P
robo
scis
mon
keys
eat
onl
y ca
lyx
at u
nrip
e st
age
1,oc
casi
onal
ly o
nly
caly
x an
d fre
quen
tly b
oth
the
caly
x an
d fle
sh a
t sta
ge 2
, and
onl
y se
ed a
t sta
ge 3
and
ripe
sta
ge.

Fig. 24 Monthly trends of time allocation to the consumption of Alseodaphneinsignis fruits. On trees I and III, the fruits grew from unripe stage in October toripe stage in January and proboscis monkeys consumed only calyxes in October,calyxes and flesh in November, calyxes, flesh and seeds in December and onlyseeds in January.
0
0.4
0.8
1.2
M / 05 J J A S O N D J / 06 F M A M
Month
100
× fe
edin
g tim
e / o
bs. t
ime
Unripe stage 1Unripe stage 2Unripe stage 3Ripe stage
%
Trees I & III
Tree II

Fig. 25 Species makeup of seeds contained in feces (A) and seasonal trends of timeallocation to fruit feeding (B). Whereas a total of 400 feces were examined during 13months, fruit seeds of only three species were found in 43 feces examined inNovember, December and March.
0
5
10
15
M / 05 J J A S O N D J / 06 F M A M
Tim
e al
loca
tion
to fr
uit f
eedi
ng fr
uits Antidesma thawaitesianum
Nouclea subditaFicusOther fruits
0
10
20
30
40
November (N=71) December (N=39) March (N=21)
Per
cent
age
of s
eed-
cont
aini
ng fe
ces Antidesma thawaitesianum
Nouclea subditaFicus
(A) Species makeup of seeds contained in feces
(B) Fruit feeding
%
%
spp.
spp.

Fig. 26 Seasonal trends of food menu diversity (H' ), evenness (J' ) and speciesrichness (number of species). Shannon-Wiener's diversity and evenness indiceswere calculated from data shown in Appendix I. Stepwise regression detected asignificantly negative correlation between the seasonal fluctuations of fruitsconsumption and food menu diversity (H’) (p = 0.043 see Table 8).* Only 3 days'data available for February 2006.
0.0
1.0
2.0
3.0
4.0
M / 05 J J A S O N D J / 06 F M A MMonth
Sha
nnon
-Wie
ner i
ndex
of d
iver
sity
(H')
and
eve
nnes
s (J
')
Spe
cies
rich
ness
H'
J'
*
Species richness
0
40
80

Fig.
27
A p
aper
y ba
rk tr
ee o
f Eug
enia
sp. 2
(A) a
nd a
nes
t of M
icro
cero
term
es d
ista
ns(B
).
(A)
(B)

Fig. 28 Seasonal fluctuation of feeding on Eugenia sp. 2 barks (A) andMicrocerotermes distans nest (B).
(B) Termite Nests (Microcerotermes distans )
0
0.1
0.2
0.3
0.4
0.5
M / 05 J J A S O N D J / 06 F M A M
Month
No.
of f
eedi
ngs
per d
ay
Male Female
(A) Tree barks (Eugenia sp. 2)
0
0.05
0.1
0.15
0.2
0.25
0.3
0.35
M / 05 J J A S O N D J / 06 F M A M
No.
of f
eedi
ngs
per d
ay
Male Female

Fig. 29 Comparison of water sources among male, female and juvenile.
0%
20%
40%
60%
80%
100%
Male (N = 11) Female (N = 15) Juvenile (N = 14)
Menanggul River Temporary pool Small stream Tree hole
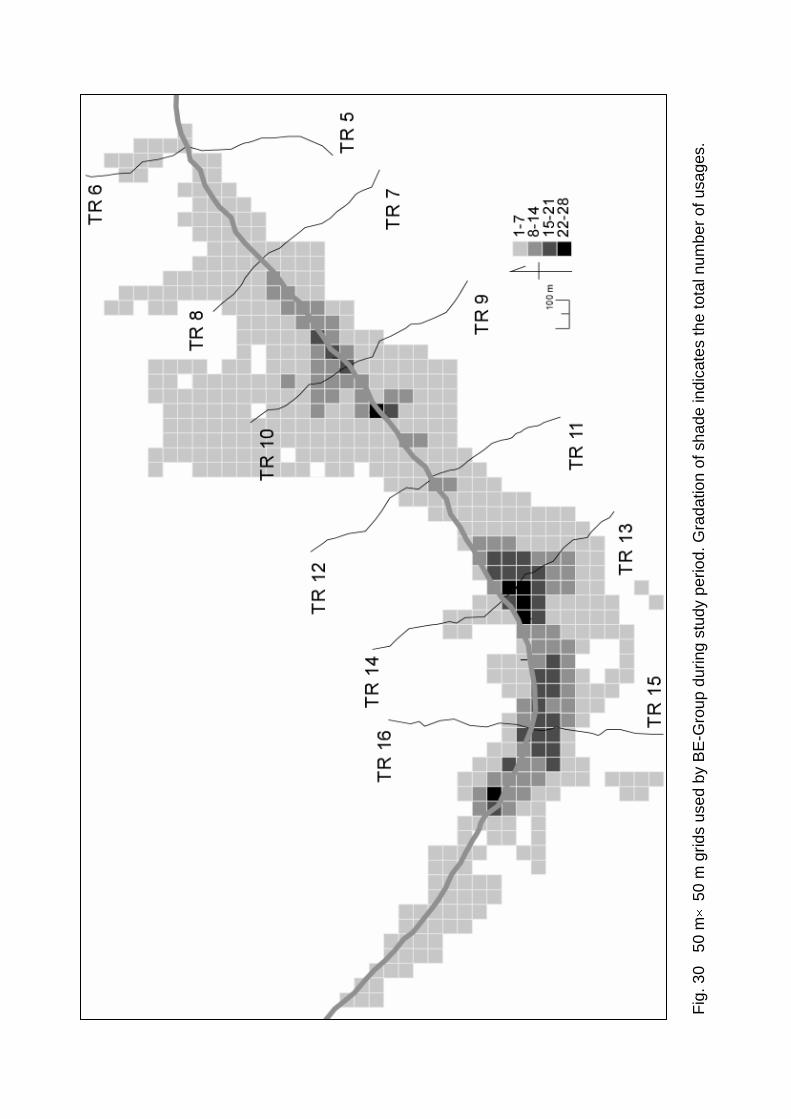
Fig.
30
50
m×
50 m
grid
s us
ed b
y B
E-G
roup
dur
ing
stud
y pe
riod.
Gra
datio
n of
sha
de in
dica
tes
the
tota
l num
ber o
f usa
ges.

Fig. 31 Frequency distribution of daily path length (N=161 days). Only days when thefull-day following of BE-Group was successful were used for this analysis.
0
20
40
60
80
0-500 500-1000 1000-1500 1500-2000Daily path length (m)
Freq
uenc
y
Mean: 799 m

Fig. 32 Seasonal fluctuation of mean daily path length with SD (A) andavailabilities of fruits (B), flowers (C) and young leaves (D). Stepwise test detectedthat grid usage was negatively correlated with availability of fruits (p = 0.0028 seeTable 8), but not of flowers and young leaves.
(B) Availability of fruits
0
50
100
150
200
250
M / 05 J J A S O N D J / 06 F M A M
(C) Availability of flowers
0
50
100
150
200
250
M / 05 J J A S O N D J / 06 F M A M
(D) Availability of young leaves
1600
1700
1800
1900
M / 05 J J A S O N D J / 06 F M A M
(A) Mean daily path length
0
400
800
1200
1600
M / 05 J J A S O N D J / 06 F M A M
Mea
n da
ily p
ath
leng
th (m
)N
umbe
r of t
rees
and
vin
es

Fig. 33 Correlation between daily path length (m) and daily rainfall (mm). r2:Spearman's rank correlation.
N = 161, r2 = 0.048, p < 0.01
0
300
600
900
1200
1500
1800
0 15 30 45 60
Daily rainfall (mm)
Dai
ly p
ath
leng
th

July 16th 17th
19th 20th
21st
TR16
TR15
TR16
TR15
TR16
TR15
TR16
TR15
TR16
TR15C. ramiflora tree
Fig. 34 Behavioral core tree species C. ramiflora with cigar like rolls of young leaves. BE-Group was frequently attracted to a large C. ramiflora tree when it had many cigar like rolls of young leaves.
(A)
(B)
(A): Mature leaves(B): Cigar like rolls of young leaves
100 m
4000 4000
4000

(A) 1
1th
–17
th J
anua
ry(B
) 18t
h –
20th
Jan
uary
(C) 3
rd –
8th
Mar
ch
Fig.
35
Com
paris
on o
f sle
epin
g-si
te d
istri
butio
n be
twee
n flo
oded
and
non
-floo
ded
days
. O
pen
circ
les
are
slee
ping
site
s. O
n flo
oded
day
s, s
leep
ing
site
s w
ere
frequ
ently
loca
ted
in th
e fo
rest
(A a
nd C
) whe
reas
BE
-Gro
up a
lway
s re
turn
ed to
rive
r ban
k on
non
-floo
ded
days
(B).
Floo
ded
area
Floo
ded
area

Fig. 36 Former tractor road in dry season (A) and rainy season (B).
(B)
(A)

0
100
200
300
400
River bankN = 261
InlandN = 9
Wat
er le
vel (
m)
Fig 37 Relation between water level and sleeping sites (river bank or inland). Bold line: median; dotted line: range; box: 25% range from the median to both sides.

Family Species name May / 05 Jun Jul Aug Sep Oct Nov Dec Jan / 06 Feb Mar Apr MayANACARDIACEAE Androtium astylum 0.47 0 0 0 0 0 0.04 0 0 0 0 0 0
Buchanania arborescens 0 0.21 0 0 0 0.17 0 0 0 0 0 0 0.08Dracontomelon dao 0.03 0 0 0 0 0 0.24 0.51 0 0 0 0 0Mangifera griffithii 0 0 0 0 0 0 0 0.12 2.15 0 0 0 0Melanochyla auriculata 0 0 0 0 0 0 0 0.46 0.57 0 0.46 0 0Melanochyla caesia 0 0 0 0 0 0 0 0 0 0.08 0 0 0.46Pegia sarmentosa 0 0 0 0 0 0 0 0.16 0.12 0 0 0 0
ANNONACEAE Alphonsea javanica 0 0 0 0 0 0.21 0 0 0 0 0 0 0Artabotrys suaveolens 0 0.15 0 0 0 0 0.56 0.30 0 0 0 0 0Uvaria lobbiana 0 0.03 0 0 0 0 0 0 0 0 0 0 0
APOCYNACEAE Chilocarpus vernicosus 0 0.18 0 0 0 0 0 0 0 0 0 0 0C. sp. 1 0 0 0 0 0 0 0.16 0 0 0 0 0 0Ichnocarpus frutescens 0 0 0 0 0 0 0 0 0 0 0.05 0 0Parameria polyneura 0.33 0.17 0 0 0 1.97 0.94 0.81 0 0 0.13 0.35 0Urceola sp. 1 0 0 0 0 0 0 0 0 0 0 0.52 5.00 0.28Willughbeia angustifolia 0 0.96 0.10 0 0 0.19 0.11 0 0 0 0 0 0
AQUIFOLIACEAE Ilex cymosa 0 0.09 0 0 0.39 0 1.11 0 0.08 0 0.15 0 0ARACEAE Pothos sp. 1 0 0 0 0 0 0 0 0 0 0 0 0 0.10BLECHNACEAE Stenochlaena palustris 0 0 0 0 0 0 0 0.04 0.03 0 0 0.05 0BOMBACACEAE Durio grandiflorus 0 0 0 0 0 0 0 0 0 0 0 0.25 0BURSERACEAE Canarium denticulatum 0 0 0.03 0 0 0 0 0.14 0 0 0 0 0
C. odontophyllum 0 0 0 0 0 0.07 0 0 0 0 0 0 0C. sp. 1 0 0 0 0 0 0 0 0.14 0 0 0 0 0C. sp. 2 0 0 0 0 0 0 0 0 0.06 0 0 0 0C. sp. 3 0 0 0 0 0 0 0 0 0 0 0 0.60 0
CECROPIACEAE Poikilospermum suaveolens 0 0 0 0 0.03 0 0 0 0 0 0 0 0CHRYSOBALANACEAE Atuna cordata 0.15 0 0 0 0 0 0 0 2.86 1.08 0.04 0 0
Licania splendens 0 0 0 0 0 0 0 0 0 0 0 1.72 0Maranthes corymbosa 0 0 1.76 0.59 0.96 1.42 0 1.69 0 0 1.05 0 0Parinari oblongifolia 0 0 0.10 0 0 0 0 0 0 0 0 0.16 0
CLUSIACEAE Cratoxylum formosum 0 0.11 0 0 0.35 0 0.05 0.49 0.33 0 3.07 0.62 0C. sumatranum 0 0 0 0 0 0.40 0 0 0 0 0 0 0Garcinia brevipes 0 0 0 0 0 0 0 0 0 0 0.07 0 0G. parvifolia 0 0 0 0 0 0.23 0.22 0 0 0 0 0 0G. rostrata 0 0 0 0 0 0 1.33 0.19 0 0 0 0 0Kayea oblongifolia 0 0 0 0 0.08 0 0 0 0 0 0 0 0Mesua elmeri 0 0 0 0 0 0.37 0 0 0 0.27 6.84 0.66 0M. macrantha 0 0 0 0 0 0 0 0 0 0 0.19 0 0
COMBRETACEAE Combretum acuminatum 0.35 0.20 0 0 0 0 0.52 0 0 0 0.48 0 0Terminalia citrina 0.14 0 0 0 0 0 0 0 0 0 0 0 0
CONNARACEAE Agelaea borneensis 0 0 0 0.11 0 0 0 0 0 0 0 0.25 0A. trinervis 0 0.23 0.17 0 0 0 0.06 0.04 0 0 0 0 0Connarus grandis 0 0 0 0 0 0 0 0 0 0 0 0 0Rourea mimosoides 0 0 0 0 0 0 0.85 0 0 0 0.19 0 0R. minor 0 0 0 0 0.90 0 0.21 0 0 0 0.44 0 0.35R. sp. 1 0.03 0 0 0 0 0 0 0 0 0 0 0 0
CONVOLVULACEAE Erycibe grandifolia 0 0 0 0 0 0.05 0 0 0 0 0 0 0Merremia borneensis 0 0 0 0 0 0 0 0.31 0 0 0 0 0
CTENOLOPHONACEAE Ctenolophon parvifolius 0 0 0 0 0 0.10 0 0 0 0 0 0 0CUCURBITACEAE Zanonia indica 0 0.20 0.04 0.20 0 0 0 0 0.03 0 0 0 0DILLENIACEAE Dillenia excelsa 0.40 0.87 2.64 1.51 0.39 0.18 0.28 0.74 0.34 0 0 0.36 0
Tetracera scandens 0 0.48 0.50 4.22 0 0 0.11 0.27 0.07 0 0 0 0.25DIOSCOREACEAE Dioscorea laurifolia 0 0 0 0 0 0.13 0 0.24 0 0 0 0 0DIPTEROCARPACEAE Shorea leprosula 0 0.14 0 0 0 0 0 0 0 0 0 0 0
Vatica rassak 0 0 0.09 0.14 1.03 0 0 0.04 1.01 0.24 0 0.24 0.04V. venulosa 0 0.04 0.31 1.40 0 0.03 0 0 0 0 0 0 0
EBENACEAE Diospyros curranii 0 0 0 0 0 0.09 0.08 0 0 0 0 0 0D. sp. 4 0 0 0.11 0 0 0 0 0 0 0 0 0 0D. sp. 5 0 0.35 0 0 0 0 0 0 0 0 0 0 0
ELAEOCARPACEAE Elaeocarpus nitidus 0.13 0.05 0.19 0.27 0 0 0.98 8.15 0.78 0.26 0.49 0.57 0.24E. stipularis 0 0 0 0 0 0 0 0.18 0.85 0 0 0 0
EUPHORBIACEAE Excoecaria indica 0.23 0.04 0 0.20 0 1.04 0 0 0 0 0 0.04 0Antidesma thwaitesianum 0.02 0.07 0.26 0 0 0 0.06 4.29 0 0 0 1.66 0.49Aporosa acuminatissima 0 0 0.10 0 0 0 0 0 0 0 0 0 0Baccaurea stipulata 0.34 1.63 0 0 0 0.05 0.07 0 0.19 0 0 0 0Bridelia penangiana 0 0 0 0.03 0 0 0 0 0 0 0 0 0B. stipularis 0 0.22 0.42 0.72 0.13 0.96 2.17 0.74 0.44 0.22 2.40 0.19 0.14Cleistanthus myrianthus 0 0.05 0 1.05 0.24 0.64 0 0.45 0.48 0.09 0.12 0.59 0Croton caudatus 0 0.22 0 0 0 0.12 0 0 0 0 0 0 0C. oblongus 0.22 0.27 0 0 0 0 0 0 0 0 0 0.20 0Drypetes castilloi 0 0 0 0.49 0 0 0 1.69 1.60 0 0.09 0 0Macaranga conifera 0 0 0 0 0 0 0 0 0 0 0 0.17 0M. depressa 0 0 0 0 0 0 0 0 0 0 0.03 0 0Mallotus floribundus 0 0 0 0 0 0 0 0 0 0 0 0.53 0.78M. muticus 2.73 12.21 21.83 7.59 0.23 6.00 3.53 1.21 7.76 3.50 9.08 8.94 1.14M. penangensis 0 0.06 0.17 0 0 0 0 0 0 0 0 0 0Margaritaria indica 0 1.28 0.40 1.12 0 0 0.49 0 0 0 5.53 0.77 3.54Paracroton pendulus 0 0 0 0 0 0 0 0 0 0 0 0 0
Appendix I Hours spent for consuming each plant species. This table was used for calculatingShannon-Wiener's diversity and evenness indices (see Figure 29).

AppendixⅠ(Continued 1)FLACOURTIACEAE Hydnocarpus sumatrana 0.03 0 0.02 0.41 0.26 0.84 0.28 0.94 0.74 0.04 0 1.48 0.22
Xylosma sumatrana 0 0.16 0 0 0 0.04 0 1.10 0.17 0 0.02 0 0GNETACEAE Gnetum gnemonoides 0.05 0 0 0 0 0.03 0 0.06 0 0 0 0 0.08LAMIACEAE Teijsmanniodendron bogoriense 0 0 0 0 0 0.28 0 0.36 0 0 0 0 0
Vitex pinnata 0 0.20 0.23 0.17 0.37 0.08 0.18 0.39 0 0 0 0.26 0LAURACEAE Alseodaphne insignis 0 0 0 0 0 0.41 0.62 4.01 1.61 0 0 0.42 0
Cinnamomum sp. 1 0 0 0 0 0 0 0 0.04 0 0 0 0.07 0Dehaasia cuneata 0 0.25 0.78 1.55 2.91 0.24 0 1.32 2.00 0.94 0 0 0Endiandra sp. 1 0 0 0 0 0 0.06 0 0.09 0 0 0 0 0E. sp. 2 0 0 0 0 0 0 0 0 0.33 0 0 0 0Litsea sp. 2 0 0 0 0 0 0.09 0 0 0 0 0 0 0L. sp. 3 0 0.19 0 0 0 0 0 0 0 0 0 0 0Nothaphoebe sp. 1 0 0 0 0 0 0 0 0 0 0 0.03 0 0
LECYTHIDACEAE Barringtonia macrostachya 0 0 0 0 0 0 0 0 0 0 0.25 0 0Planchonia valida 0 0 0 0 0 0 0 0 0.03 0 0 0 0
LEGUMINOSAE Acacia borneensis 0 0 0 0.02 0 1.41 0 4.27 3.43 0.79 0.86 0.26 0Airyantha borneensis 0.03 0 0 0.04 0 0 0 0 0 0 0 0 0Albizia corniculata 0.27 0.31 0.74 0.16 0.12 0.34 0.43 0.11 0 0.06 0.60 0.32 0.91A. dolichadena 0 0 0 0 0 0.50 0 0.06 0 0 0.09 0.07 0Bauhinia diptera 0 1.40 0.03 0.18 0 1.36 0.03 0.36 0.21 0 5.07 7.61 1.87Caesalpinia crista 0 0 0 0 0 0 0 0.06 0 0 0 0 0Crudia ornata 0 0 0 0 0 0 0.85 0 0 0 0 0 0C. reticulata 0 0.23 0.23 0 0 0 2.83 7.14 0.47 0 0 0 0Cynometra ramiflora 0 0 10.44 1.52 2.17 0 0 10.74 0.37 0.52 0 0.44 3.02Dalbergia parvifolia 1.83 1.46 0.60 1.27 2.05 0 1.80 0.90 0.54 0 5.44 0.06 9.57Derris elegans 0 0.36 0 0.37 0 0.19 0 0.33 0 0 0.25 0 0D. sp. 1 0 0.25 0 0 0.05 0.22 0.10 0 0 0 0 0 0.46D. sp. 2 0.70 0.76 0 0 0 0 0 0 0 0 0 0 0D. sp. 3 0 0 0 0 0 0 0 0 0 0 0 0 0D. sp. 4 0 0 0 0 0 0 0 0 0.39 0 0 0 0Dialium indum 0 0 0 0 0 0 0 0.21 0 0 0 0 0Entada rheedei 0.04 0.65 0.03 0.18 0 1.45 0.18 1.43 0.09 0 0 0 0.03Millettia nieuwenhuisii 0 0.12 0 0 0 0.07 0 0 0.15 0 0 0 0Ormosia sumatrana 0.35 0 0 0 0.67 0 0 2.24 0 0 0 0.35 0Pongamia pinnata 0.09 0 0.31 0.27 0.20 0 0.10 0 0 0 0.08 0.12 2.26Sindora leiocarpa 0 0.07 0 0 0 0.35 0.09 0 0 0 0.18 0 0Spatholobus macropterus 0.14 2.65 1.95 2.94 3.06 6.43 1.02 0 0 0.22 0.10 1.08 3.24
LEGUMINOSAE 1 0 0 0 0 0 0 0.29 0 0 0 0 0 0LOGANIACEAE Strychnos minor 0 0 0 0.33 0.74 0 0 0 0 0 0 0 0LOPHOPYXIDACEAE Lophopyxis maingayi 0.17 2.95 3.76 13.81 10.24 6.10 1.47 1.12 0.41 1.36 1.37 5.38 5.51LORANTHACEAE Dendrophthoe longituba 0 0 0 0 0 0.08 0.06 0 0 0 0 0 0
Macrosolen sp. 1 0 0 0 0 0 0 0 0 0 0 0.45 0 0LYTHRACEAE Lagerstroemia speciosa 0 0 0 0 0 0.18 0 0 0 0 0.04 0 0.03
L. sp. 1 0 0.06 0.10 0 0 0 0 0 0 0 0.14 0 0MELASTOMATACEAE Memecylon paniculatum 0 0.17 0 0 0.06 0.11 0 0 0 0 0 0.20 0
Pternandra galeata 0.03 0.33 0 0.03 0 0.11 0.56 0.27 0 0 0 0.11 0MELIACEAE Dysoxylum sp. 1 0 0 0 0 0 0 0 0.41 0 0 0 0 0
Walsura pinnata 0 0 0 0 0 0.68 0 0 0 0 0 0 0MENISPERMACEAE Haematocarpus validus 0 0 0 0 0 0 0 0 0 0 0 0 0MORACEAE Artocarpus sp. 1 0 0 0 3.44 0.58 0.08 0 0.66 0 0 0 0 0
A. sp. 2 0.15 0 0 0 0 0 0 0 0 0 0 0 0Ficus annulata 0 0 0 0.77 0 0 0 0.38 0.22 0 0 0 0F. benjamina 0 1.23 0 0 0 0 0 0 1.43 0 3.80 0 0F. binnendijkii 1.48 2.01 1.66 2.45 5.26 6.45 9.24 6.98 7.91 1.34 1.35 3.13 2.29F. cf. lanata var foveolata 0 0 0 0 0 0.16 0.17 0 0 0 0.04 0.62 0F. crassiramea 0.85 0.59 0.16 0.28 0.27 0.20 0 0 0 0 0 0 0F. depressa 0 0.03 0 0 0 0 0 0 0 0 0 0 0F. forstenii var. villosa 0 0 0 0.40 0 0.71 0 0 0.36 0 0.27 0 0F. globosa 0.61 0 0 0 1.05 0 3.90 0.14 1.02 0 0.52 0 0.23F. pellucidopunctata 0 0 0.31 0 0 0 0 0 0 0 0 0 0F. racemosa var. elongata 0 0 0.03 0 0 0 0 0 0 0 0 0 0F. sundaica var beccarianum 0 0 0 1.00 0.79 1.46 0.06 0.76 1.53 0 0.48 0 0.55F. sundaica var. impressicostata 0 0.33 0 0 0 0 0 0 0 0 0 0 0F. virens var. glabella 0 0.03 0 0 0 0.57 0 0.03 0 0 0.13 0 0F. sp. 1 0.37 0 0 0 0 0.19 0.05 0 4.05 0 0 0.83 0.42F. sp. 2 0 0.23 0 0 0 0 0 0 2.80 0 0 0 0F. sp. 3 0 0 0 0 0 0 0 0.07 0 0 0 0 0F. sp. 4 0 0 0 0 0.81 0 0 0 0 0 0 0 0F. sp. 5 0 0.03 0 0 0 0 0 0 0 0 0 0 0F. sp. 6 0 0 0 0 0 0 0 0.33 0 0 0 0 0F. sp. 7 0 0 0 0 0 0 0 0 0 0 0 0 1.24F. sp. 8 0.14 0 0 0 0 0 0 0 0 0 0 0 0
MYRISTICACEAE Knema laurina 0 0 0 0 0 0 0.13 0 0 0 0 0 0Myristica sp. 1 0.004 0 0 0 0 0 0 0 0 0 0 0 0M. sp. 2 0 0 0 0 0 0 0 0.13 0.18 0 0 0 0
MYRTACEAE Eugenia litseaefolia 0.73 0.05 0 0 0.19 0 0.11 0 0 0 0 0 18.72E. sp. 2 0 3.54 0 0 0.31 0.09 0.05 0.06 0.31 0 0.27 0.50 0E. sp. 4 0 0.02 0 0.15 0 0 0.23 0 0 0 0 0 0E. sp. 6 0 0 0 0 0 0 0.46 0 0 0 0 0 0E. sp. 7 0 0 0 0 0 0 0 0 0.03 0 0 0 0E. sp. 8 0.10 0 0 0.86 0 0 0 0.70 0 0 0 0 0E. sp. 9 0 0 0 0 0 0 0 0 0 0 0 0.12 4.04Syzygium fastigiatum 0 0.11 0.67 0.75 0 0 0 0 0.35 0 0 0 0

AppendixⅠ(Continued 2)OPILIACEAE Champereia manillana 0 0 0.12 0 0 0 0 0 0 0 0 0 0OXALIDACEAE Dapania grandifolia 0 0 0 0 0 0 0 0 0 0 0 0 0.16PASSIFLORACEAE Passiflora foetida 0 0 0 0 0 0 0 0.05 0 0 0 0 0POLYGALACEAE Xanthophyllum flavescens 0 0 0 0 0.29 0 0.23 0 0 0 0.20 0.12 0.15
X. neglectum 0 0 0 0 0 0 0 0 0 0 0.18 0.70 0PROTEACEAE Helicia robusta 0 0 0 0 0 0 0 0 0 0 0 0 0RHAMNACEAE Ventilago dichotoma 0 0.85 0 0.92 0.13 1.44 0.06 0.03 0 0 0.63 0.34 0.93
Ziziphus borneensis 0 0 0 0 0 0 3.28 1.01 0 0 0 0 0Z. havilandii 0 0.33 0 0 0 0.08 0 0.42 0.52 0 0.24 0.30 0
RHIZOPHORACEAE Carallia brachiata 1.12 0 0.63 0 0.08 0.52 9.54 4.49 19.09 1.10 3.37 2.62 0.11RUBIACEAE Gardenia tubifera 0 0 0 0 0 0 0.13 0.48 0.03 0 0.05 0.04 0.37
Nauclea orientalis 0 0 1.22 0 0 0 0.06 0.44 0 0 0 0 0N. subdita 0.19 2.62 0.99 0 0 0.90 1.98 2.40 1.48 0.06 0.04 0 0Neolamarckia cadamba 0 0 0 0 0 0 0 0.24 0 0 0 0 0Neonauclea excelsa 0 0 0 0 0 0 0 0 0.11 0 0 0.22 0Pleiocarpidia sandahanica 0 0 0 0 0 0 0.07 0.16 0 0 0 0 0
SANTALACEAE Scleropyrum wallichianum 0 0 0 0 0 0 0 0.23 0 0 0 0 0SAPINDACEAE Dimocarpus longan 0 0 0 0 0 0 0 0.24 0 0 0 0.31 0SAPOTACEAE Palaquium stenophyllum 0 0 0 0 0 0.08 0 0 0 0 0 0 0
Madhuca dubardii 0 0 0 0 0 0 0 0.07 0 0 0.04 0 0STERCULIACEAE Heritiera elata 0 0 0.14 0 0 0 0 0 0 0 0.04 0 0
Pterospermum macrocarpum 0.54 0.23 0.26 3.74 0 0.10 0.05 0.87 0 0.09 0.79 0.49 3.07SYMPLOCACEAE Symplocos celastrifolia 0 0 0 0 0 0 0 0 0 0 0.03 0.68 0.20THEACEAE Camellia lanceolata 0.14 0 0 0 0 0 0 0 0 0 0 0 0TILIACEAE Grewia acuminata 0 0 0 0 0 0.10 0 0 0 0 0 0 0
Microcos crassifolia 0 0 0 0 0 0 0 0 0.25 0 0 0.39 0.07VITACEAE Cayratia trifolia 0 0.04 0 0.61 0.55 0 0 0.12 0.12 0 0.47 0.32 0
Total feeding hrs 15.7 45.4 54.6 58.3 37.9 49.4 54.9 82.9 72.6 12.3 59.5 53.9 67.8Total observation hrs 167.9 279.6 264.1 266.0 216.6 339.7 289.6 358.7 305.8 69.2 280.2 312.6 348.7Shannon-Wiener Index (H' ) 3.02 3.07 2.28 2.90 2.72 3.15 3.05 3.37 2.91 2.34 3.01 3.11 2.68Evenness (J' ) 0.82 0.73 0.60 0.75 0.76 0.74 0.74 0.77 0.71 0.80 0.71 0.77 0.69