dokument copy1 - statens vegvesen...- cutback bitumen (e.g. mc3000, mc800, mc30) - penetration grade...
TRANSCRIPT

THE UNITED REPUBLIC TANZANIAMINISTRY WORKS
Field Testing Manual - 2003 - M
inistry of Works TAN
RO
ADS, Tanzania
April 2003ISBN 9987-8891-4-X ������

i
Field Testing Manual - 2003
TANROADS Central Materials Laboratory (CML)
THE UNITED REPUBLIC OF TANZANIA MINISTRY OF WORKS
Field TestingManual - 2003

ii
Field Testing Manual - 2003
TANROADS Central Materials Laboratory (CML)
April 2003ISBN 9987-8891-4-X
Reproduction of extracts from this Manual may be made subject to due acknowledgement of the source.
Although this Manual is believed to be correct at the time of printing, Ministry of Works does not accept any contractual, tortious or other form of liability for its contents or for any consequences arising from its use. People using the information contained in the Manual should apply and rely on their own skill and judgement to the particular issue that they are considering.
Printed by: Elanders Novum AS, Oslo NorwayLayout: Jan Edvardsen, Interconsult ASA Oslo Norway
iii
Field Testing Manual - 2003
TANROADS Central Materials Laboratory (CML)
PrefaceAn important part of a quality assurance system in civil construction works is a complete description of test procedures. This involves having a Laboratory Testing Manual and a Field Testing Manual comprising a precise and simple description of test procedures and necessary forms for records and presentation of the test results. It is in this context that this Field Testing Manual has been prepared. The Laboratory Testing Manual was prepared and launched in the year 2000 to form a complete system of testing standards for road works. This system is complemented by the launching of the Pavement an Materials Design Manual-1999 and the Standard Specifi cations for Road Works-2000 from where test limits for material quality and extent of testing programmes are specifi ed.
These manuals form part of the development of Tanzanian National Standards and Guidelines under the Institutional Co-operation in the Road Sector Programme Agreement between the Government of the United Republic of Tanzania and the Kingdom of Norway.
The Field Testing Manual describes techniques to be applied during testing in the fi eld of geotechnique, material prospecting and alignment surveys, construction control, pavement evaluation and axle load surveys. The testing and sampling proce-dures are clearly specifi ed and their fi elds of application and limitations are clearly described. Moreover, the test procedures are simplifi ed to a practical approach, without compromising the correct procedure to be followed for each test.
This Manual will provide an invaluable documentation of fi eld techniques to the benefi t of both engineers and technicians working in the road construction industry in the country and also other areas related to foundations for structures.
Dar es Salaam,April 2003April 2003
F. MarmoF. Marmoa.g Chief Executive Offi cer
TANROADS

iv
Field Testing Manual - 2003
TANROADS Central Materials Laboratory (CML)
AcknowledgementsThe Field Testing manual – 2003 has been prepared as a component under the Institutional Cooperation between TAN-ROADS, CML and the Norwegian Public Roads administration (NPRA). The Government of Tanzania and the Norwegian Agency for International Development (NORAD) have jointly fi nanced the project, which forms a part of a programme to establiosh technical standards and guidelines for highway engineering.
This Manual has been prepared by a Working Group consisting of the following members:
Mr. C. Overby NPRA ChairmanMr. S. Rutajama CML MemberMr. S. Nergaard Noteby, consultant MemberMr. R. Johansen ViaNova, consultant Secretary
The Working Group wish to acknowledge engineers and technicians at CML for their valuable comments during the prepara-tion of this Manual.
Photographs were provided by:C. Overby NPRAM. T. Keganne Roughton International- Rolf Johansen Vianova- M. Besta CML
v
Field Testing Manual - 2003
TANROADS Central Materials Laboratory (CML)
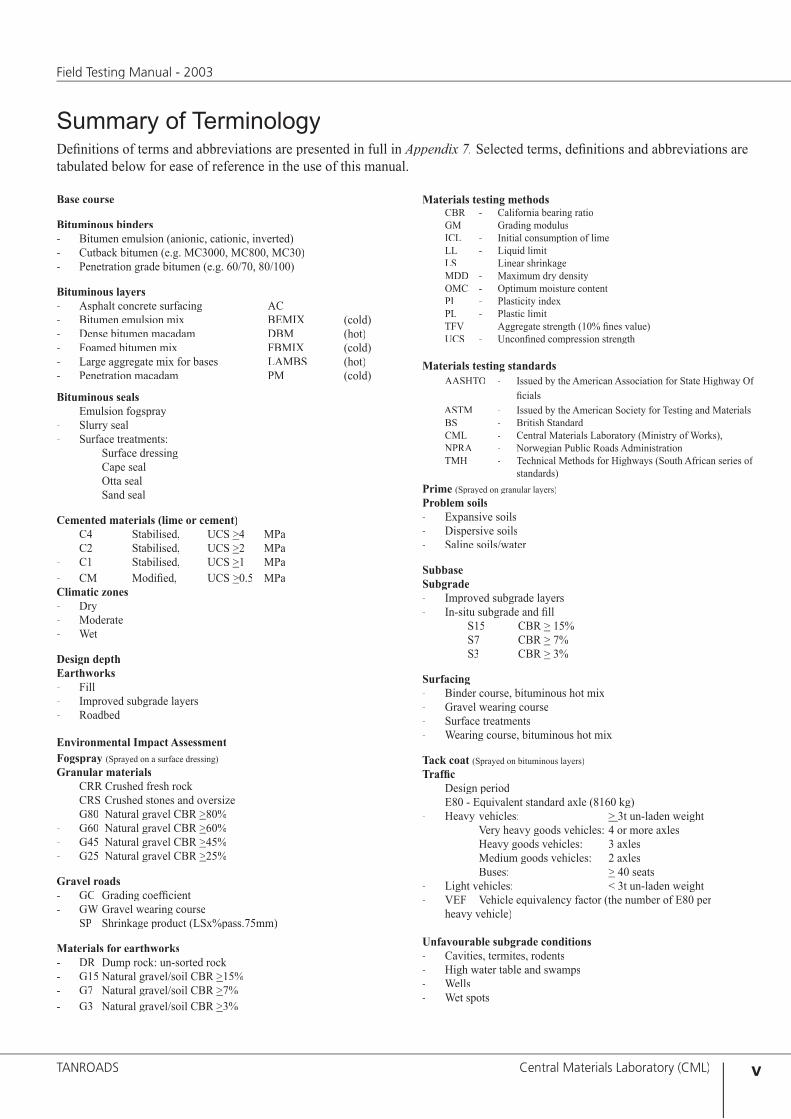
Summary of TerminologyDefi nitions of terms and abbreviations are presented in full in Appendix 7. Selected terms, defi nitions and abbreviations are tabulated below for ease of reference in the use of this manual.
Base course
Bituminous binders- Bitumen emulsion (anionic, cationic, inverted)- Cutback bitumen (e.g. MC3000, MC800, MC30)- Penetration grade bitumen (e.g. 60/70, 80/100)
Bituminous layers- Asphalt concrete surfacing AC- Bitumen emulsion mix BEMIX (cold)- Dense bitumen macadam DBM (hot)- Foamed bitumen mix FBMIX (cold)- Large aggregate mix for bases LAMBS (hot)- Penetration macadam PM (cold)
Bituminous seals- Emulsion fogspray- Slurry seal- Surface treatments: Surface dressing Cape seal Otta seal Sand seal
Cemented materials (lime or cement)- C4 Stabilised, UCS >4 MPa- C2 Stabilised, UCS >2 MPa- C1 Stabilised, UCS >1 MPa- CM Modifi ed, UCS >0.5 MPaClimatic zones- Dry- Moderate- Wet
Design depthEarthworks- Fill- Improved subgrade layers- Roadbed
Environmental Impact AssessmentFogspray (Sprayed on a surface dressing)Granular materials- CRR Crushed fresh rock - CRS Crushed stones and oversize- G80 Natural gravel CBR >80%- G60 Natural gravel CBR >60%- G45 Natural gravel CBR >45%- G25 Natural gravel CBR >25%
Gravel roads- GC Grading coeffi cient- GW Gravel wearing course- SP Shrinkage product (LSx%pass.75mm)
Materials for earthworks- DR Dump rock: un-sorted rock- G15 Natural gravel/soil CBR >15%- G7 Natural gravel/soil CBR >7%- G3 Natural gravel/soil CBR >3%
Materials testing methodsCBR - California bearing ratioGM - Grading modulusICL - Initial consumption of lime LL - Liquid limitLS - Linear shrinkageMDD - Maximum dry densityOMC - Optimum moisture contentPI - Plasticity indexPL - Plastic limitTFV - Aggregate strength (10% fi nes value)UCS - Unconfi ned compression strength
Materials testing standardsAASHTO - Issued by the American Association for State Highway Of
fi cials ASTM - Issued by the American Society for Testing and Materials BS - British Standard CML CML CML - Central Materials Laboratory (Ministry of Works), NPRA NPRA NPRA - Norwegian Public Roads AdministrationTMH - Technical Methods for Highways (South African series of
standards)Prime (Sprayed on granular layers)Problem soils- Expansive soils- Dispersive soils- Saline soils/water
SubbaseSubgrade- Improved subgrade layers- In-situ subgrade and fi ll S15 CBR > 15% S7 CBR > 7% S3 CBR > 3%
Surfacing- Binder course, bituminous hot mix- Gravel wearing course- Surface treatments- Wearing course, bituminous hot mix
Tack coat (Sprayed on bituminous layers)Traffi c- Design period- E80 - Equivalent standard axle (8160 kg)- Heavy vehicles: > 3t un-laden weight Very heavy goods vehicles: 4 or more axles Heavy goods vehicles: 3 axles Medium goods vehicles: 2 axles Buses: > 40 seats- Light vehicles: < 3t un-laden weight- VEF Vehicle equivalency factor (the number of E80 per
heavy vehicle)
Unfavourable subgrade conditions- Cavities, termites, rodents- High water table and swamps- Wells- Wet spots

vi
Field Testing Manual - 2003
TANROADS Central Materials Laboratory (CML)
�������� ������ �����
�������� ���� �����
�������� ������
���������������� ������
�������
������� ������������
��������� �����
��������
�������
������� �������� �������� ���� �������� �� ������� ���������������� ������
������ ������ ��� ���������
�������� ������������ ����
����������������
�������� ����
������ �����
������ ������� ������
���������� ����� ��������� ��������� �� ���������
��������
��� ���� �����
�������� ����������
�������� ��������
���������� ���� �����
�����������
�������
���� ���� �����
����������
���� ����
�
Pavement Details

vii
Field Testing Manual - 2003
TANROADS Central Materials Laboratory (CML)
Table of Contents1 INTRODUCTION...........................................................................................................................................................3
1.1 Background, purpose and scope.............................................................................................................................31.2 Structure of the Field Testing Manual 2003 ...........................................................................................................41.3 Layout.....................................................................................................................................................................4
2 GEOTECHNIQUE .........................................................................................................................................................72.1 Planning of investigations - methodology..............................................................................................................72.2 Ground investigations.............................................................................................................................................92.3 Soundings ............................................................................................................................................................122.4 Borings .................................................................................................................................................................132.5 Sampling ..............................................................................................................................................................152.6 Handling, transport and storage of samples .........................................................................................................192.7 Recording ............................................................................................................................................................192.8 Geotechnical test methods....................................................................................................................................20
3 PAVEMENT EVALUATION .......................................................................................................................................393.1 Pavement distress .................................................................................................................................................393.2 Methodology ........................................................................................................................................................423.3 Detailed condition surveys .................................................................................................................................. 453.4 Pavement strength – structural surveys ............................................................................................................... 493.5 Test pit profi ling and sampling ............................................................................................................................523.6 Homogenous sections...........................................................................................................................................55
4 AXLE LOAD SURVEYS..............................................................................................................................................584.1 Introduction ..........................................................................................................................................................584.2 Resources for axle load surveys ...........................................................................................................................584.3 Condition of survey sites ......................................................................................................................................594.4 Weighing...............................................................................................................................................................624.5 Recording and reporting.......................................................................................................................................64
5 MATERIAL PROSPECTING AND ALIGNMENT SURVEYS...............................................................................715.1 Introduction ..........................................................................................................................................................715.2 Methodology ........................................................................................................................................................715.3 Alignment soil surveys .........................................................................................................................................775.4 Soils and gravel sources .......................................................................................................................................805.5 Rock Sources ........................................................................................................................................................83
6 CONSTRUCTION CONTROL...................................................................................................................................896.1 Introduction ..........................................................................................................................................................896.2 Earthworks and unbound layers ...........................................................................................................................896.3 Cemented Layers ..................................................................................................................................................946.4 Bituminous Layers ...............................................................................................................................................956.5 Bituminous Seals ..................................................................................................................................................986.6 Concrete..............................................................................................................................................................1016.7 Construction control test methods ......................................................................................................................104
viii
Field Testing Manual - 2003
TANROADS Central Materials Laboratory (CML)
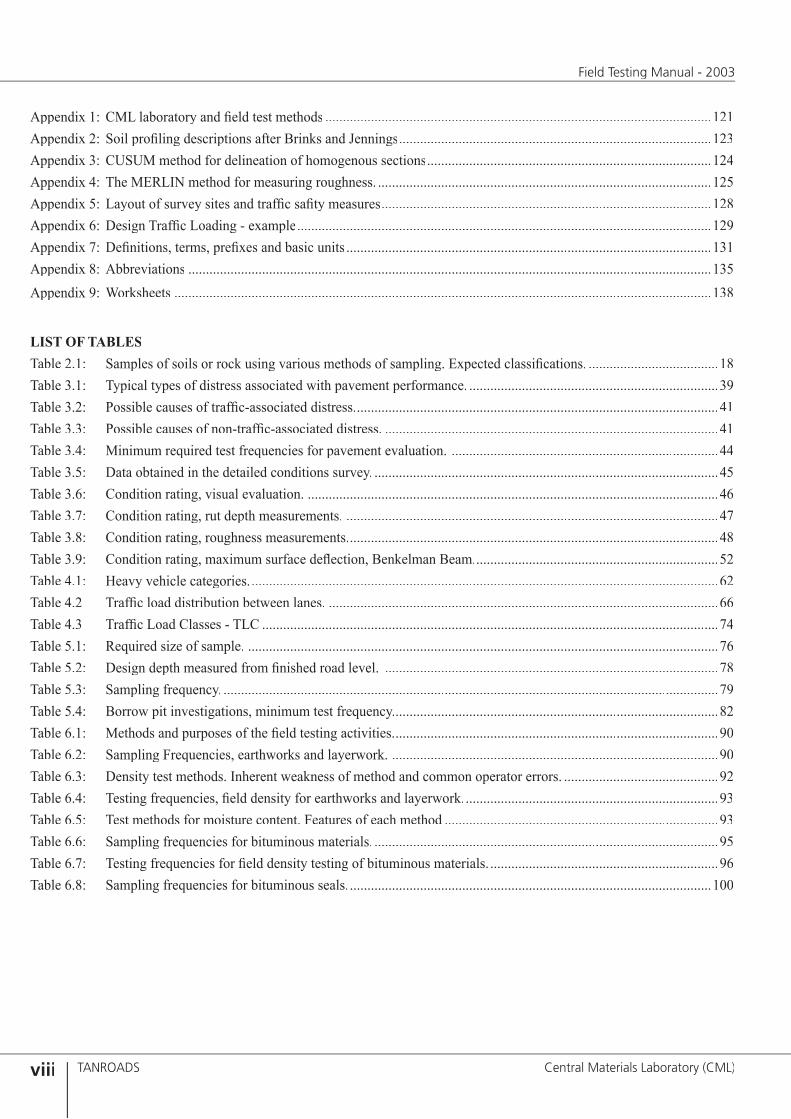
Appendix 1: CML laboratory and fi eld test methods ..............................................................................................................121Appendix 2: Soil profi ling descriptions after Brinks and Jennings.........................................................................................123Appendix 3: CUSUM method for delineation of homogenous sections.................................................................................124Appendix 4: The MERLIN method for measuring roughness. ...............................................................................................125Appendix 5: Layout of survey sites and traffi c safi ty measures..............................................................................................128Appendix 6: Design Traffi c Loading - example......................................................................................................................129Appendix 7: Defi nitions, terms, prefi xes and basic units ........................................................................................................131Appendix 8: Abbreviations .....................................................................................................................................................135Appendix 9: Worksheets .........................................................................................................................................................138
LIST OF TABLESTable 2.1: Samples of soils or rock using various methods of sampling. Expected classifi cations. .....................................18Table 3.1: Typical types of distress associated with pavement performance. .......................................................................39Table 3.2: Possible causes of traffi c-associated distress........................................................................................................41Table 3.3: Possible causes of non-traffi c-associated distress. ...............................................................................................41Table 3.4: Minimum required test frequencies for pavement evaluation. ............................................................................44Table 3.5: Data obtained in the detailed conditions survey. ..................................................................................................45Table 3.6: Condition rating, visual evaluation. .....................................................................................................................46Table 3.7: Condition rating, rut depth measurements. ..........................................................................................................47Table 3.8: Condition rating, roughness measurements..........................................................................................................48Table 3.9: Condition rating, maximum surface defl ection, Benkelman Beam......................................................................52Table 4.1: Heavy vehicle categories......................................................................................................................................62Table 4.2 Traffi c load distribution between lanes. ...............................................................................................................66Table 4.3 Traffi c Load Classes - TLC ..................................................................................................................................74Table 5.1: Required size of sample. ......................................................................................................................................76Table 5.2: Design depth measured from fi nished road level. ...............................................................................................78Table 5.3: Sampling frequency. .............................................................................................................................................79Table 5.4: Borrow pit investigations, minimum test frequency.............................................................................................82Table 6.1: Methods and purposes of the fi eld testing activities.............................................................................................90Table 6.2: Sampling Frequencies, earthworks and layerwork. .............................................................................................90Table 6.3: Density test methods. Inherent weakness of method and common operator errors. ............................................92Table 6.4: Testing frequencies, fi eld density for earthworks and layerwork.........................................................................93Table 6.5: Test methods for moisture content. Features of each method ..............................................................................93Table 6.6: Sampling frequencies for bituminous materials. ..................................................................................................95Table 6.7: Testing frequencies for fi eld density testing of bituminous materials. .................................................................96Table 6.8: Sampling frequencies for bituminous seals........................................................................................................100
1
Field Testing Manual - 2003
TANROADS Central Materials Laboratory (CML)
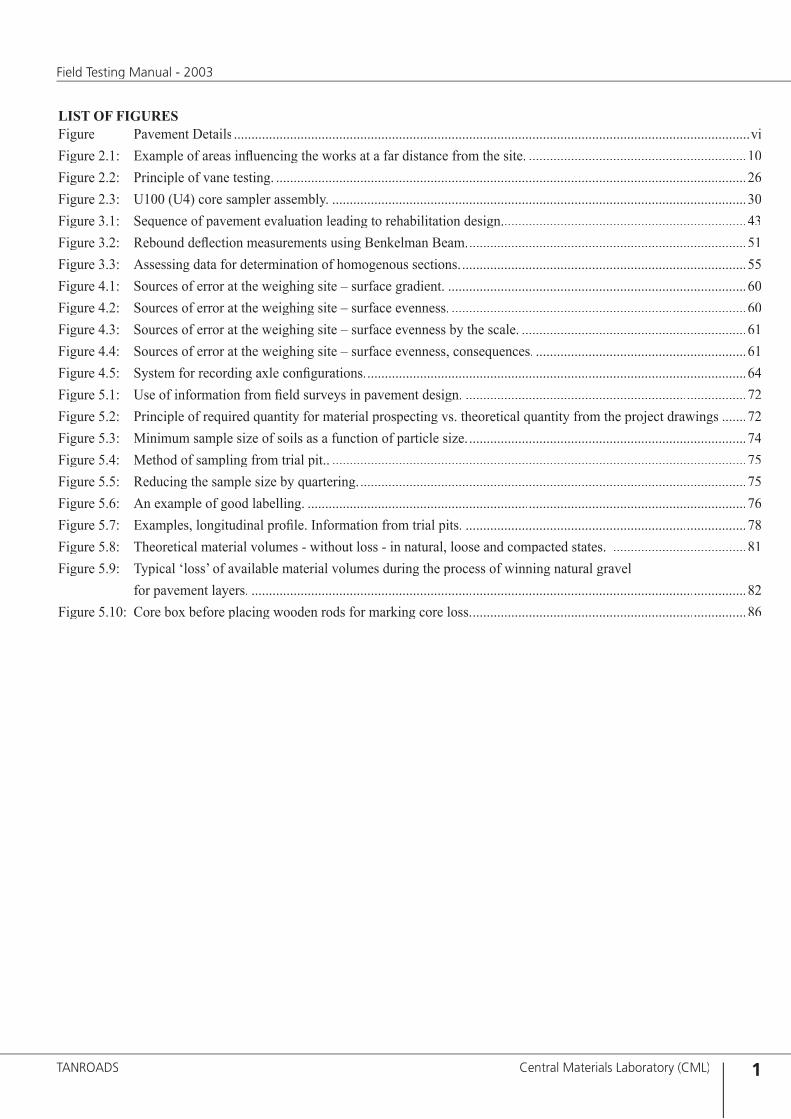
LIST OF FIGURESFigure Pavement Details ...................................................................................................................................................viFigure 2.1: Example of areas infl uencing the works at a far distance from the site. ..............................................................10Figure 2.2: Principle of vane testing. ......................................................................................................................................26Figure 2.3: U100 (U4) core sampler assembly. ......................................................................................................................30Figure 3.1: Sequence of pavement evaluation leading to rehabilitation design......................................................................43Figure 3.2: Rebound defl ection measurements using Benkelman Beam................................................................................51Figure 3.3: Assessing data for determination of homogenous sections..................................................................................55Figure 4.1: Sources of error at the weighing site – surface gradient. .....................................................................................60Figure 4.2: Sources of error at the weighing site – surface evenness. ....................................................................................60Figure 4.3: Sources of error at the weighing site – surface evenness by the scale. ................................................................61Figure 4.4: Sources of error at the weighing site – surface evenness, consequences. ............................................................61Figure 4.5: System for recording axle confi gurations.............................................................................................................64Figure 5.1: Use of information from fi eld surveys in pavement design. ................................................................................72Figure 5.2: Principle of required quantity for material prospecting vs. theoretical quantity from the project drawings .......72Figure 5.3: Minimum sample size of soils as a function of particle size................................................................................74Figure 5.4: Method of sampling from trial pit.. ......................................................................................................................75Figure 5.5: Reducing the sample size by quartering...............................................................................................................75Figure 5.6: An example of good labelling. .............................................................................................................................76Figure 5.7: Examples, longitudinal profi le. Information from trial pits. ................................................................................78Figure 5.8: Theoretical material volumes - without loss - in natural, loose and compacted states. ......................................81Figure 5.9: Typical ‘loss’ of available material volumes during the process of winning natural gravel for pavement layers. .............................................................................................................................................82Figure 5.10: Core box before placing wooden rods for marking core loss...............................................................................86

Field Testing Manual - 2003
TANROADS Central Materials Laboratory (CML)2 Chapter 1Introduction
ch1 ch11 INTRODUCTION
Chapter 1: Table of Contents1.1 Background, purpose and scope .......................................................... 2
1.2 Structure of the Field Testing Manual - 2003 ..................................... 3
1.3 Layout .................................................................................................... 3
1 Introduction
2
6
3
4
Construction control
Pavement evaluation
Axle load surveys
5 Material prospecting and alignment surveys
Appendices
Geotechnique

ch1Field Testing Manual - 2003
Central Materials Laboratory (CML) TANROADS 3Chapter 1
Introduction
ch11 INTRODUCTION1.1 Background, purpose and scopeThe Field Testing Manual - 2003 forms part of the development of Tanzanian Standards, Specifi cations and Guidelines for roads, that Ministry of Works and Tanroads are conducting under the programme for institutional cooperation with the Norwegian Public Roads Administration. The following documents have already been prepared and were launched under endorsement by the Ministry of Works:
► Pavement and Materials Design Manual - 1999► Laboratory Testing Manual - 2000 ► Standard Specifi cations for Road Works - 2000
It is vitally important that the documents are fi rmly based on the same platform regarding methods of testing, interpretation of results and application in the pro-cess for planning, design, construction and maintenance of roads. An important part of this process is the work being carried out in the fi eld, to form the basis for road design, quality control and methods applied during construction and maintenance.
The Field Testing Manual - 2003 serves the purpose of setting standards for fi eld investigations and fi eld testing, and is a reference book providing advice for engineers and technicians involved in such work. The Manual is prepared with links to the above documents in respect of method and minimum require-ments for investigations and data collection. This includes investigations for new projects as well as evaluation of existing roads with the purpose of utilising the pavement structure in rehabilitation and upgrading of the road. Appropriate standards of workmanship in road construction and maintenance, as described in the above documents, is refl ected in the Field Testing Manual - 2003 in de-scriptions of appropriate construction quality control.
The Manual is prepared with emphasis on being a practical handbook that provides appropriate cost effective investigations of suffi cient accuracy for the purpose.
Field Testing Manual - 2003
TANROADS Central Materials Laboratory (CML)4 Chapter 1Introduction
ch1 ch21.2 Structure of the Field Testing Manual - 2003The Field Testing Manual – 2003 is divided into its major chapters according to the purpose of collecting the information in the fi eld, i.e.:
1 Introduction:Purpose: Introduction to the Manual with backgraound and purpose and
scope.
2 Geotechnique: Purpose: Investigations related to stability of foundations for e.g. bridges
and other structures, stability of embankments and cuttings.
3 Pavement evaluation:Purpose: Assessment of the condition of existing pavements, to form
basis for optimal design of rehabilitation measures.
4 Axle load surveys:Purpose: Assessment of existing traffi c loading to form the basis for
projection of future traffi c loading for the purpose of pavement design and design of rehabilitation measures.
5 Material prospecting and alignment surveys:Purpose: Pavement design of new roads and supply of construction
materials for both new road construction and rehabilitation.
6 Construction control:Purpose: Quality Control during construction.
1.3 LayoutParts of the Manual are printed with the same layout as the method sheets of the Laboratory Testing Manual - 2000. This is considered a superior layout where a number of standardised methods are being described, but is not ideal way of presenting large amounts of informative text. A mixed layout has therefore been chosen for the Field Testing Manual - 2003 in order to make a user friendly format and to capture the best of both layouts. Wherever practical, the method sheet layout has been applied due to its more concise format.

ch1
5Chapter 2Geotechnique
ch2Field Testing Manual - 2003
Central Materials Laboratory (CML) TANROADS
2 Geotechnique
1 Introduction
6
3
4
Construction control
Pavement evaluation
Axle load surveys
5 Material prospecting and alignment surveys
Appendices
Chapter 2: Table of Contents2.1 Planning of investigations - methodology....................................... 7
2.1.1 General ................................................................................... 72.1.2 Objectives............................................................................... 72.1.3 Type, extent and stages of site investigations ........................ 72.1.4 Desk study.............................................................................. 82.1.5 Site reconnaissance ................................................................ 82.1.6 Detailed studies ...................................................................... 82.1.7 Construction and performance appraisal................................ 9
2.2 Ground investigations ...................................................................... 92.2.1 Purpose of ground investigations ........................................... 92.2.2 Project stages.......................................................................... 92.2.3 Requirements.......................................................................... 92.2.4 Procedures .............................................................................. 92.2.5 Types of ground investigations ............................................ 102.2.6 Extent of ground investigations ........................................... 102.2.7 Choice of methods for ground investigation........................ 112.2.8 Personnel .............................................................................. 11
2.3 Soundings ........................................................................................ 122.3.1 General ................................................................................. 122.3.2 Static soundings ................................................................... 122.3.3 Sounding tests in boreholes.................................................. 122.3.4 Dynamic soundings.............................................................. 12
2 GEOTECHNIQUE

6 Chapter 2Geotechnique
ch2Field Testing Manual - 2003
TANROADS Central Materials Laboratory (CML)
ch22.4 Borings............................................................................................. 13
2.4.1 General ................................................................................. 132.4.2 Boring methods .................................................................... 13
2.5 Sampling.......................................................................................... 152.5.1 Sampling techniques ............................................................ 152.5.2 Sample disturbance classes .................................................. 152.5.3 Disturbed samples ................................................................ 162.5.4 Un-disturbed samples........................................................... 172.5.5 Choice of sample method depending on soil conditions...... 172.5.6 Field classifi cation and sample size ..................................... 18
2.6 Handling, transport and storage of samples ................................ 19
2.7 Recording ........................................................................................ 192.7.1 Field recording ..................................................................... 192.7.2 Reporting.............................................................................. 19
2.8 Geotechnical test methods ............................................................. 20

ch2
7Chapter 2Geotechnique
ch2Field Testing Manual - 2003
Central Materials Laboratory (CML) TANROADS
2 GEOTECHNIQUE2.1 Planning of investigations - methodology2.1.1 GeneralIt is now common to use the term site investigation in a wide sense, considering not only the sampling or exploration of the ground, but the complete aspect of investigations to assess the suitability of a site for executing civil works.
Geotechnical ground investigation covers a series of investigation types from engineering geological mapping by various means to detailed boring and sam-pling for laboratory testing or in situ testing of soil/rock engineering properties.
The extent and method of investigation should fi rst be decided based on the technical requirements of the project, as established through the initial evalua-tion stages. This initial phase may include a preliminary ground investigation. Ground investigation specialists should be consulted at this stage.
The investigation programme thus planned by the specialist may be changed to utilize the available resources. However, the Client must be made aware of any particular aspects of the project which may not be properly investigated due to lack of resources, either fi nancial or technical, so that this may be properly ac-counted for in the design and subsequent construction of the works.
2.1.2 ObjectivesThe primary objective of most site investigations is to secure suffi cient informa-tion to enable a safe and economical design to be made. Thereby the construc-tion can proceed without any diffi culties and in-service performance or safety is not adversely affected.
An important objective of site investigations is to determine the effect of changes to the surroundings that will incur as a consequence of implementing the project. E.g. the construction of high embankments may affect large areas beyond the project location.
2.1.3 Type, extent and stages of site investigationsType and extentThe type and extent of site investigation depends on:● Proposed works.● Conditions of the site.● Project stage.● Available resources.
By proceding in stages the investigation can always seek to verify and expand information collected previously.
Procedure The general investigation procedure is proceeding in stages:1. Desk study.2. Site reconnaissance.3. Detailed study for design, including ground investigations.
By proceding in stages the investigation can always seek to verify and expand information collected previously.
8 Chapter 2Geotechnique
ch2Field Testing Manual - 2003
TANROADS Central Materials Laboratory (CML)
ch2During and after construction, the investigations may continue:4. Follow up during construction.5. Post-construction appraisal/performance evaluation.
2.1.4 Desk studyThe objectives of the desk study are:● Τo collect all existing information regarding the proposed works and the
conditions of the site. ● Τo learn as much as possible from previous experience and studies, and
about adjacent property that may be affected by the works. This includes a study of the previous use of the site and of previous projects in the area, their design, construction and performance.
The desk study should also obtain information regarding existing services etc. that must be considered for the project and when conducting the actual ground investigations. The following information may be required:● Land survey, i.e. maps, aerial photographs, ownership, present use, existing
structures.● Permitted use and restrictions, i.e. land acquisitions, general and local regu-
lations and rights of way.● Approaches and access.● Climate, i.e. temperature, rainfall, seasons etc.● Ground conditions, i.e. geology, soil and vegetation, maps and reports and
hydrogeology.● Sources of material for construction, e.g. existing borrow pits.● Services, i.e. drainage, water, electricity, telephone.
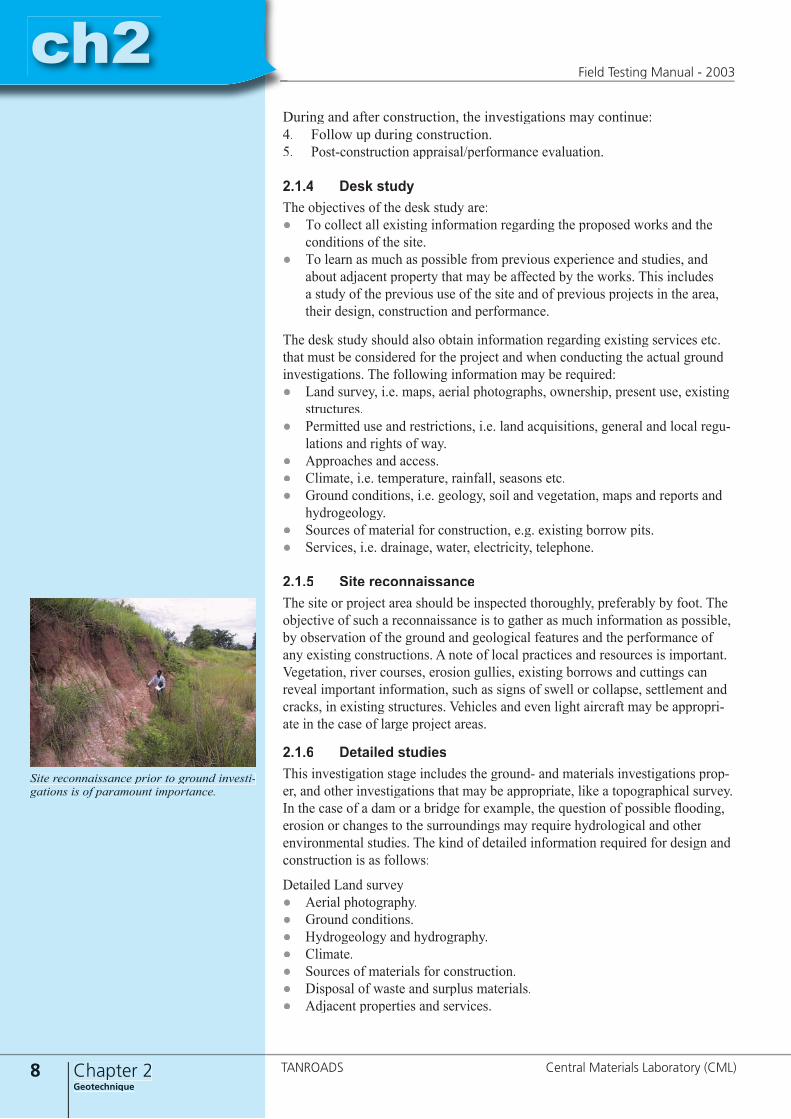
2.1.5 Site reconnaissanceThe site or project area should be inspected thoroughly, preferably by foot. The objective of such a reconnaissance is to gather as much information as possible, by observation of the ground and geological features and the performance of any existing constructions. A note of local practices and resources is important. Vegetation, river courses, erosion gullies, existing borrows and cuttings can reveal important information, such as signs of swell or collapse, settlement and cracks, in existing structures. Vehicles and even light aircraft may be appropri-ate in the case of large project areas.
2.1.6 Detailed studiesThis investigation stage includes the ground- and materials investigations prop-er, and other investigations that may be appropriate, like a topographical survey. In the case of a dam or a bridge for example, the question of possible fl ooding, erosion or changes to the surroundings may require hydrological and other environmental studies. The kind of detailed information required for design and construction is as follows:
Detailed Land survey● Aerial photography.● Ground conditions.● Hydrogeology and hydrography.● Climate.● Sources of materials for construction.● Disposal of waste and surplus materials.● Adjacent properties and services.
Site reconnaissance prior to ground investi-gations is of paramount importance.
ch2
9Chapter 2Geotechnique
ch2Field Testing Manual - 2003
Central Materials Laboratory (CML) TANROADS
2.1.7 Construction and performance appraisalThis stage is primarily to ensure that the design is adjusted as required if the conditions revealed by the construction differ from the results and assumptions of the pre-construction investigations.
2.2 Ground investigations2.2.1 Purpose of ground investigationsSite and ground investigations of several types may be required in a road con-struction project:● Sites for new works.● Defects or failures of existing works.● Safety of existing works or structures.● Materials for constructional purposes.
2.2.2 Project stages Engineering construction projects are usually carried out through different stages, normally identifi ed as:● Feasibility study and preliminary design.● Detailed design.● Construction stage.
The various planning stages are most distinct in major projects. The contractor or builder may be engaged at an early stage and thus take part in the fi nal design or more commonly come in after the fi nal design.
2.2.3 RequirementsTo meet the primary objectives of the site investigation, the ground investiga-tion should generally satisfy the following basic requirements:● Clarify the geology of the site.● Establish the soil and rock profi le.● Establish the ground water profi le.● Establish the engineering properties of the ground.● Cover all ground which may be permanently or temporarily changed by the
project.
There may also be other requirements particular to each project, and the basic requirements must be detailed.
2.2.4 ProceduresThe general procedures for ground investigations are as follows, based on the results of the desk study, site reconnaissance and an evaluation of the project type and stage:1. Defi ne the objective of the investigation.2. Decide the extent of the investigation.3. Decide the method of investigation.4. Carry out fi eld and laboratory work, possibly by stages.5. Reinstate all pits etc. by carefully backfi lled, and any pits that have to be
left open and unattended should be fenced off or properly secured with other appropriate methods.
The results should be continuously evaluated to see if the objectives are met, and plans and methods should be corrected if necessary.
10 Chapter 2Geotechnique
ch2Field Testing Manual - 2003
TANROADS Central Materials Laboratory (CML)
ch2Laboratory testing forms a considerable part of the total cost of investigation and the laboratory test programme shall therefore be devised by the engineer re-sponsibility for the overall execution of the project including the fi nancial side.
The extent of investigation conducted at the various planning stages may vary widely. Some feasibility studies may not require a detailed ground investigation at all, if all the necessary information is available from the desk study and site reconnaissance.
2.2.5 Types of ground investigationsThe type of ground investigations and the methods used will of course vary widely from case to case. The different methods of ground investigation are as follows:● Trial pits, shafts and headings.● Soundings, borings. Tests in boreholes.● Other in situ or fi eld tests.● Sampling, laboratory tests.● Geophysical methods.● Remote sensing.
The method of investigation to be used is decided by the:● Character of the ground.● Technical requirements.● Character of the site.● Availability of equipment and personnel.● Cost.
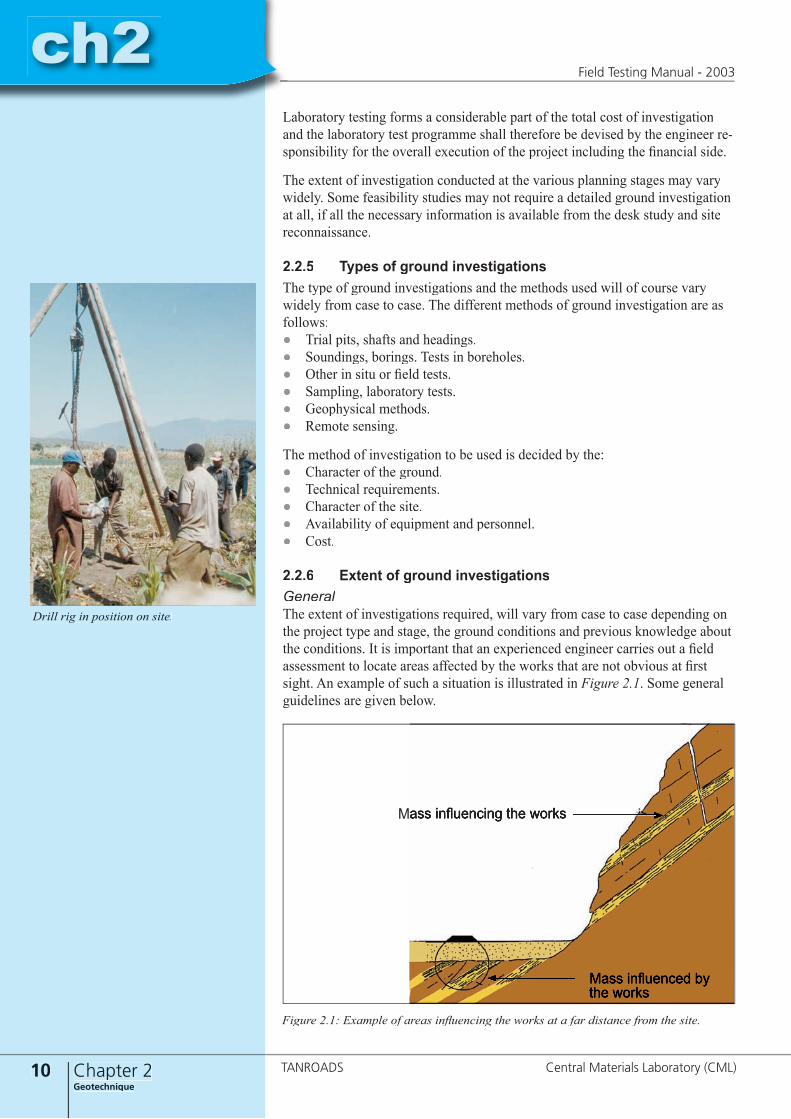
2.2.6 Extent of ground investigationsGeneralThe extent of investigations required, will vary from case to case depending on the project type and stage, the ground conditions and previous knowledge about the conditions. It is important that an experienced engineer carries out a fi eld assessment to locate areas affected by the works that are not obvious at fi rst sight. An example of such a situation is illustrated in Figure 2.1. Some general guidelines are given below.
Figure 2.1: Example of areas infl uencing the works at a far distance from the site.
Mass infl uencing the worksMass infl uencing the works
Mass infl uenced by the works
Drill rig in position on site.
ch2
11Chapter 2Geotechnique
ch2Field Testing Manual - 2003
Central Materials Laboratory (CML) TANROADS
LocationThe exploration points pits or boreholes should be located such that the general conditions of the site are established, at the same time ensuring that suffi cient detailed information is obtained. Consequently, the greater the ground variations the greater the number of exploration points required. For ordinary structures a grid pattern of spacing 10 to 30 metres is often used. Minor structures covering a small area should be investigated in a minimum of three points.
The exploration points, borings or pits should be positioned so as not to inter-fere with the proposed construction by disturbing the ground at the foundation level or by opening up for water from deep aquifers.
Depth of investigationThe general rule is to investigate to the depth which may be affected by the works
For foundations of structures, the stressed depth is normally one and a half times the loaded area, measured below the base of the foundation. In the case of light structures the project may infl uence the ground moisture regime, causing swell or collapse to greater depths. It is therefore always desirable to determine the total thickness of deposits of such soils.
For pile foundations simple rules cannot be given. The investigation depth has to be decided and revised on the basis of results of the investigations in each individual case. Suffi cient capacity to carry the pile loads has to be proven, and investigations for pile foundations may include test piling and load testing.
Embankments should be investigated to a depth suffi cient to check possible shear failures through the foundation strata, evaluate settlements and, in the case of dams, check seepage conditions. Cuts and excavations should be investigated to a depth suffi cient to evaluate the deformation and stability conditions, giving due regards to ground water and any soft strata.
2.2.7 Choice of methods for ground investigationThe following issues should be taken into consideration in the choice of method for ground investigations:● Project requirements.● ground conditions.● project budget.● available time, equipment and personnel resources.
When evaluating alternative ground investigation methods the logistics of operating in the local environment is important, such as access to water for drill-ing. E.g. both core drilling and cable percussion methods require water, whereas augers don’t.
2.2.8 PersonnelGround investigations should be planned and directed by a senior engineer or geologist also responsible for assessing and interpreting the results. The supervi-sion of fi eld work may be delegated to qualifi ed engineers or geologists assisted by trained senior fi eld technicians or drilling supervisors. This personnel should be conversant with fi eld description and classifi cation of soils and rock and the investigation methods used.
Borehole/test pits logging and fi eld material descriptions are normally the respon-sibility of the driller/technician and should be checked by the fi eld supervisor.
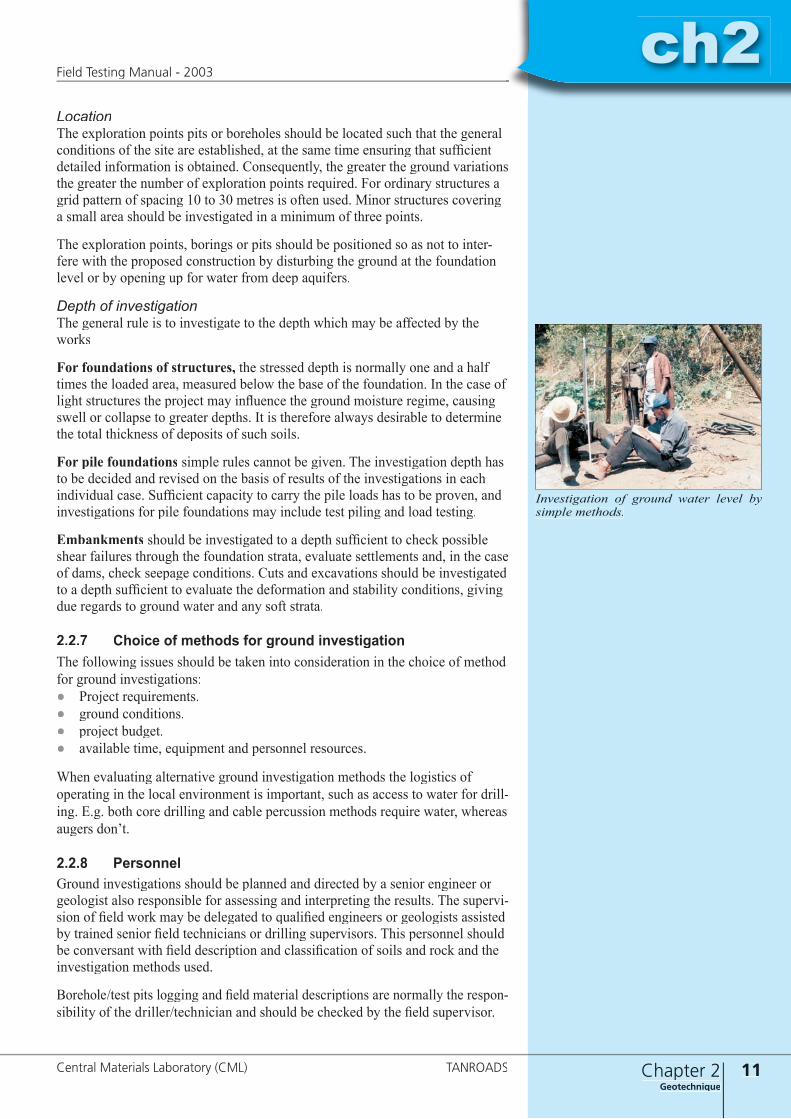
Investigation of ground water level by simple methods.
12 Chapter 2Geotechnique
ch2Field Testing Manual - 2003
TANROADS Central Materials Laboratory (CML)
ch22.3 Soundings 2.3.1 GeneralThe sounding tests are purely empirical. They are simple to perform and have been in use for many years. Consequently there is a wealth of experience, data and correlations from all parts of the world, linking the test results to soil parameters and performance of structures, to ensure a reasonably confi dent interpretation of the results.
Soundings from the surface without sampling and without pre-boring, may be carried out by several means; and consists in its simplest form of the driving of a steel rod into the ground until hard stratum is located. However, standard procedures have been developed to enable the systematic recording of relative resistance of various soil layers and the accumulation of empirical relationships between sounding resistance and soil engineering characteristics. Such meth-ods are:● Dynamic soundings.● Static soundings.● Weight- and Rotary soundings.
Both static and rotary sounding systems with electronic or hydraulic recording of the resistance to penetration have lately been developed.
2.3.2 Static soundingsStatic soundings or cone penetration tests (CPT) of several types are in wide spread use. The tests are known by a number of terms depending on manufac-turer etc., for example Dutch cone testing. The basic principle of all such tests is that a rod is pushed into the ground and the resistance on the point and/or the shaft is measured by various means. The equipment is either anchored to the ground by screws and/or employ heavy dead weights/drill rigs to give the neces-sary reaction forces for the penetration.
2.3.3 Sounding tests in boreholes Borehole tests are of several kinds and varies from the determination of resis-tance to penetration (SPT or CPT) to direct measurement of shear strength of clays. Some soundings normally carried out without the use of independent boreholes, may also be performed from the bottom of boreholes.
2.3.4 Dynamic soundingsThe main use of all direct dynamic soundings i.e. soundings not requiring bore-holes, is to give a rapid and cheap test of relative conditions within a site or to compare different sites.
The simple method of driving a steel rod into the soil until it meets resistance is only useful for determining the depth to a hard stratum like rock or calcrete/hard laterite, under a relatively shallow layer of softer soil. The most widely used dynamic sounding test is the Standard Penetration Tests (SPT). The sample obtained in SPT is used for soil identifi cation.
Simple soundings may give a relative measure of the hardness of the ground provided the penetration depth per hammer blow or within a certain time when using the percussion drill, is recorded. The resistance to penetration depends on the soil type, and experienced drillers may be able to distinguish cohesive and
ch2
13Chapter 2Geotechnique
ch2Field Testing Manual - 2003
Central Materials Laboratory (CML) TANROADS
frictional materials by the feel and sound of the drill steel. The dynamic sound-ing method has limited penetration in fi rm ground and are not suitable for use in coarse soils or soils containing rock fragments etc.
Standardisation of the sounding procedure and equipment; the drill steel rods and point, the hammer weight, drop height and blow rate etc., has increased the use of dynamic soundings to give a better indication of the type of soil present and to determine the bearing capacity of the ground by empirical means in the case of sands and gravels (frictional soils), particularly for the design of piles.
2.4 Borings2.4.1 GeneralBorings are required for sampling the ground or to provide a hole in which to conduct tests of the in-situ properties. The type of boring to be used depends on the purpose and the ground conditions. The most important ground parameters affecting the boring operations are:● The self supporting ability of the ground.● The content of larger particle size, cobbles etc.
In general cohesive soils are self supporting, so are some cemented sands and silts, whereas granular materials below the ground water level are unstable. The borehole sides may be supported by inserting linings of steel casing, or by fi lling the borehole with a head of water or heavy liquids like a bentonite suspension called mud or slurry. The worst ground conditions to drill through are layers of boulders.
2.4.2 Boring methodsBorings may be carried out by various methods: ● Auger borings. By hand or mechanical.● Percussion boring. Cable rig.● Rotary drilling. Core drilling.● Wash borings.● Other methods.
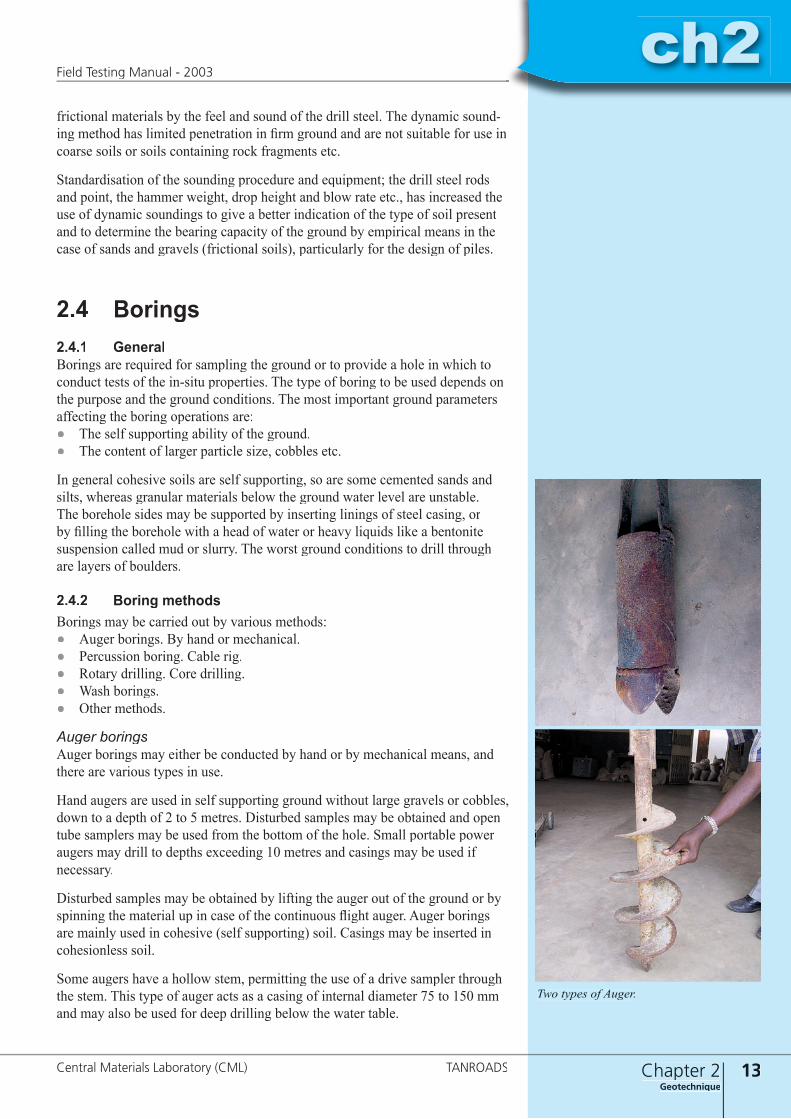
Auger boringsAuger borings may either be conducted by hand or by mechanical means, and there are various types in use.
Hand augers are used in self supporting ground without large gravels or cobbles, down to a depth of 2 to 5 metres. Disturbed samples may be obtained and open tube samplers may be used from the bottom of the hole. Small portable power augers may drill to depths exceeding 10 metres and casings may be used if necessary.
Disturbed samples may be obtained by lifting the auger out of the ground or by spinning the material up in case of the continuous fl ight auger. Auger borings are mainly used in cohesive (self supporting) soil. Casings may be inserted in cohesionless soil.
Some augers have a hollow stem, permitting the use of a drive sampler through the stem. This type of auger acts as a casing of internal diameter 75 to 150 mm and may also be used for deep drilling below the water table.
Two types of Auger.
14 Chapter 2Geotechnique
ch2Field Testing Manual - 2003
TANROADS Central Materials Laboratory (CML)
ch2A disadvantage with samples from mechanical augers is that the material brought up becomes mixed, layering is thus diffi cult to detect and so is the transition to rock particularly in the case of soft, weathered rocks so common in Tanzania. The basement gneisses for example will often appear as a sand.
Percussion borings Percussion borings loosens the ground with a drop chisel. The spoils are mixed with water and lifted out of the hole by a shell or baler.
The shell may be used as a boring tool in loose granular materials below the ground water level. Other tools used are a clay cutter.
The clay cutter and shell bring up disturbed material that are suffi ciently repre-sentative to identify the strata. Samples may also be taken from the bottom of the hole. However, some of the percussion boring procedures, such as adding water to a dry hole in clay or working with a water level other than the ground water level, may not be acceptable from a soil exploration point of view.
There is usually some disturbance of the soil below the bottom of the borehole, from which samples are taken, and it is very diffi cult to detect thin layers of soil and minor geological features with this method. Percussion boring can be em-ployed in most types of soil, including those containing cobbles and boulders. The rig for percussion boring is very versatile and can normally be fi tted with a hydraulic power unit and attachments for mechanical augering, rotary core drill-ing and cone penetration testing.
Rotary drilling Rotary drilling is the traditional drilling method for investigations of rock, but the method is also used in soils. It is particularly useful in the kind of layered hard/soft strata typical for the regions of volcanic rocks, tuff and ashes.
There are two forms of rotary drilling, open hole drilling and core drilling. Open hole drilling, which is generally used in soils and weak rock, uses a cutting bit to break down all the material within the diameter of the hole. Water or mud is used to fl ush out the material. Open hole drilling can only be used as a means of advancing the hole, the drilling rods can then be removed to allow tube samples to be taken or in situ tests to be carried out. In core drilling, which is used in rocks and hard clays, the bit cuts an annular hole in the material and an intact core enters the barrel, to be removed as a sample. However, the natural water content of the material is liable to be increased due to contact with the drilling fl uid. Typical core diameters are 41 mm, 54 mm and 76 mm, but can range up to 165 mm. The larger diameters are used in diffi cult rock.
The advantage of rotary drilling in soils is that progress is much faster than with other investigation methods and disturbance of the soil below the borehole is slight. The method is not suitable if the soil contains a high percentage of gravel (or larger) particles as they tend to rotate beneath the bit and are not broken up.
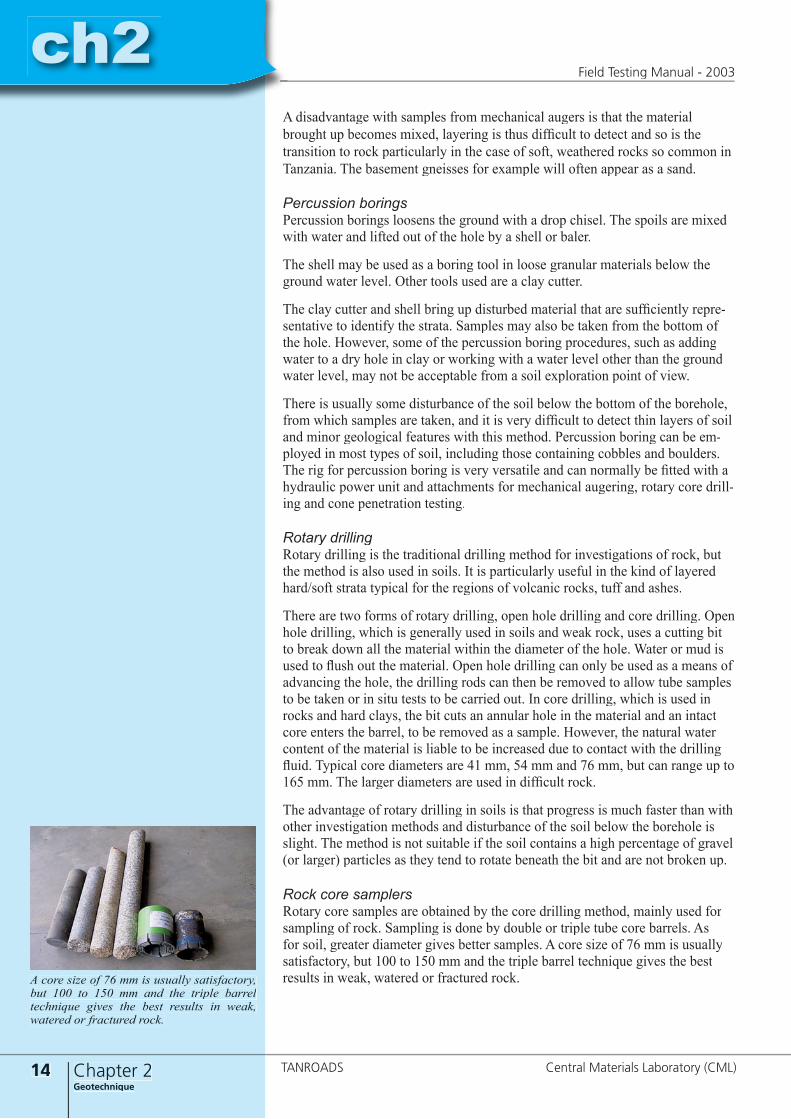
Rock core samplersRotary core samples are obtained by the core drilling method, mainly used for sampling of rock. Sampling is done by double or triple tube core barrels. As for soil, greater diameter gives better samples. A core size of 76 mm is usually satisfactory, but 100 to 150 mm and the triple barrel technique gives the best results in weak, watered or fractured rock. A core size of 76 mm is usually satisfactory,
but 100 to 150 mm and the triple barrel technique gives the best results in weak, watered or fractured rock.
ch2
15Chapter 2Geotechnique
ch2Field Testing Manual - 2003
Central Materials Laboratory (CML) TANROADS
Wash boringWash borings break up the ground by the percussive action of a chisel in com-bination with the erosive force of water being jetted out through narrow holes in the chisel. The water also washes the soil particles to the surface.
Wash boring is mostly used in sand and fi ner soils. Casing or drilling mud is used in collapsing ground. The method cannot be used to obtain soil samples as the soil brought to the surface is not representative of the strata being worked. However, this boring technique causes no or little disturbance to the soil im-mediately below the bottom of the hole, enabling tube samples to be taken or in situ tests like the SPT to be carried out. The method is also used to determine the depth to rock below fi ne grained soils.
2.5 Sampling 2.5.1 Sampling techniquesThere are four main techniques for sampling the ground:● Taking disturbed samples from the drill tools or from excavating equipment
in the course of boring or excavation.● Drive sampling, in which a tube or split tube sampler having a sharp cutting
edge at its lower end is forced into the ground either by a static thrust or by dynamic impact.
● Rotary sampling, in which a tube with a cutter at its lower end is rotated into the ground, thereby producing a core sample.
● Taking block samples specially cut by hand from a trial pit, shaft or heading.
2.5.2 Sample disturbance classesThere are fi ve disturbance classes for samples depending on the degree to which they have been disturbed by the process of sampling, handling and transport until fi nally laboratory testing:
Class 1 Classifi cation, moisture content, density, strength, deformation and consolidation characteristics.
Class 2 Classifi cation, moisture content, density.Class 3 Classifi cation, moisture content.Class 4 Classifi cation.Class 5 None – sequence of strata only.
Within the fi ve classes there are two main categories for practically denoting the samples:● Disturbed samples.● Undisturbed samples.
Class 1Class 1 samples for precise determination of strength and deformation charac-teristics may be impossible to obtain in sensitive cohesive soils, and of non-co-hesive soils from below the water table.
Residual soils represent a particular problem for Class 1 sampling as they tend to swell during sampling, often resulting in permanent damage to the soil struc-
The principal types of tube samplers are:● Open tube samplers● Stationary piston samplers● Continuous sampler● Compressed air sampler● Rotary core sampler
16 Chapter 2Geotechnique
ch2Field Testing Manual - 2003
TANROADS Central Materials Laboratory (CML)
ch2ture. This swell is due to lack of internal suction in partly saturated soils, and even in the case of saturated soils, an open structure with large voids will not be able to maintain suction without volumetric expansion and desaturation.
Class 2Class 2 is taking of disturbed samples with additional requirements to obtain fi eld/bulk density of the soils. Determination of the fi eld density may be ex-ecuted by:● Block sampling.● Core cutter method (shoe cutter).● Split spoon sampler.
Classes 3 to 5Classes 3 to 5 are the commonly called disturbed samples. Apart from the actual sampling, the quality also depends on how the sample is sealed, transported, stored, and treated in the laboratory. The most important consideration is to observe that class 3 requres sealed packaging for measuring moisture content in the laboratory.
2.5.3 Disturbed samplesObjectivesDisturbed samples, which are used mainly for soil classifi cation tests, visual classifi cation and compaction tests. Disturbed samples have the following fea-tures:● Τhe same particle size distribution (grading) as the in-situ soil.● Τhe soil structure has been signifi cantly damaged.● Τhe water content may be different from that of the in-situ soil.
Sampling methods Disturbed samples can be excavated from trial pits or obtained from the tools used to advance boreholes (e.g. from augers and the clay cutter) and from the sampler of the SPT tests. The soil recovered from the shell in percussion boring is defi cient in fi nes and is therefore unsuitable for use as a disturbed sample.
Trial pits, shafts and headings supply the most detailed and reliable data on the soil in-situ conditions, enabling visual examination of strata boundaries and soil fabric.
Trial pitsTrial pits may be dug by hand or a light mechanical excavator in all soil types above the ground water level. Excavation below the ground water level in permeable soils will require dewatering, and the safe excavation depth is very limited.
Shafts and headingsShafts are deep pits, normally hand excavated and supported by timbering or bored by piling rigs. Headings or edits are inspection galleries excavated later-ally into the side of a shaft or from the surface of a steep hill. Both roof and sides are supported.
Shafts and headings are not excavated below the ground water level of perme-able ground. Because of the expense, they are normally only used for very large and costly structures; dams, tunnelling projects etc. Headings are frequently used for the investigation of rock or soil/rock in the case of dam abutments.
Safety precautions must be observed, esecially sloping or supporting of the sides of deep pits be-fore personnel are allowed to enter trial pits. Sam-pling and inspection should be done immediately upon excavation of unsupported pits.
ch2
17Chapter 2Geotechnique
ch2Field Testing Manual - 2003
Central Materials Laboratory (CML) TANROADS
2.5.4 Un-disturbed samplesObjectives Undisturbed samples are required to determine the strength and volume stability characteristics of the soil. Undisturbed samples must preserve both the in-situ structure and water content of the soil.
Sampling methodsUndisturbed samples can be cut by hand from trial pits or obtained by special samplers, refer sample techniques b), c) and d) above. However, the quality of such samples can vary considerably, depending on the sampler, the sampling technique used and the ground conditions.
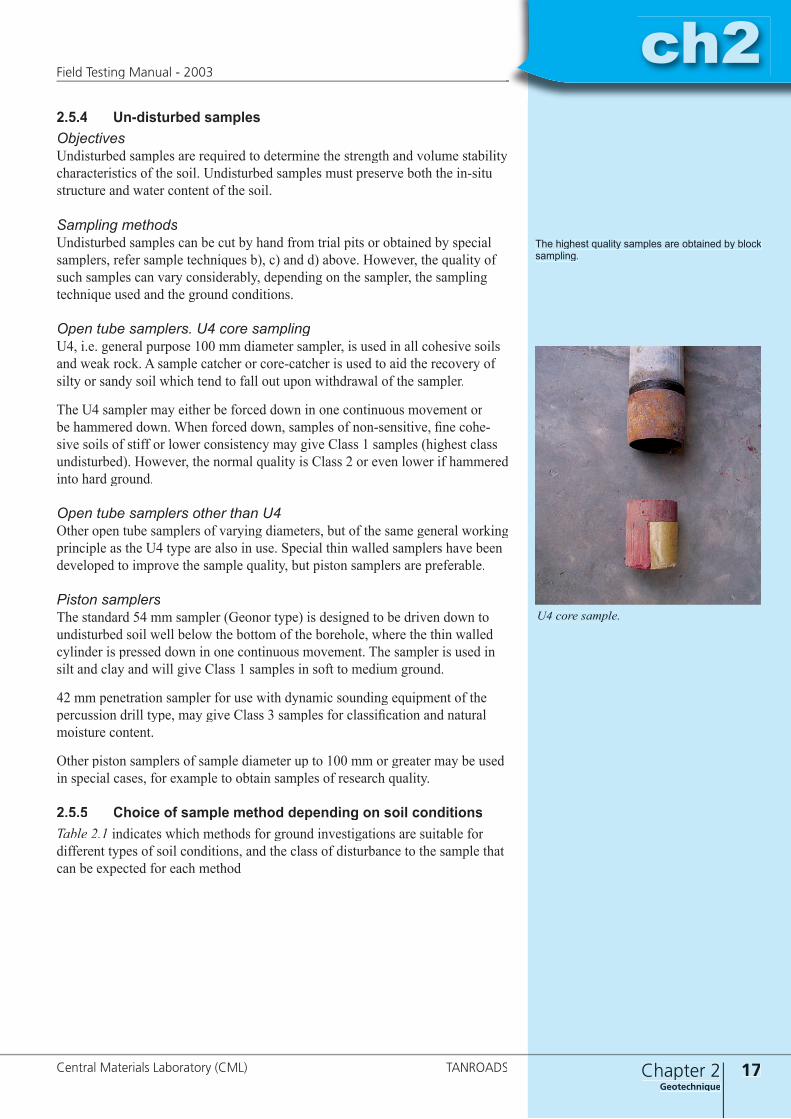
Open tube samplers. U4 core samplingU4, i.e. general purpose 100 mm diameter sampler, is used in all cohesive soils and weak rock. A sample catcher or core-catcher is used to aid the recovery of silty or sandy soil which tend to fall out upon withdrawal of the sampler.
The U4 sampler may either be forced down in one continuous movement or be hammered down. When forced down, samples of non-sensitive, fi ne cohe-sive soils of stiff or lower consistency may give Class 1 samples (highest class undisturbed). However, the normal quality is Class 2 or even lower if hammered into hard ground.
Open tube samplers other than U4Other open tube samplers of varying diameters, but of the same general working principle as the U4 type are also in use. Special thin walled samplers have been developed to improve the sample quality, but piston samplers are preferable.
Piston samplersThe standard 54 mm sampler (Geonor type) is designed to be driven down to undisturbed soil well below the bottom of the borehole, where the thin walled cylinder is pressed down in one continuous movement. The sampler is used in silt and clay and will give Class 1 samples in soft to medium ground.
42 mm penetration sampler for use with dynamic sounding equipment of the percussion drill type, may give Class 3 samples for classifi cation and natural moisture content.
Other piston samplers of sample diameter up to 100 mm or greater may be used in special cases, for example to obtain samples of research quality.
2.5.5 Choice of sample method depending on soil conditionsTable 2.1 indicates which methods for ground investigations are suitable for different types of soil conditions, and the class of disturbance to the sample that can be expected for each method
The highest quality samples are obtained by block sampling.
U4 core sample.

18 Chapter 2Geotechnique
ch2Field Testing Manual - 2003
TANROADS Central Materials Laboratory (CML)
ch2Soil type, rock Samplers, tests Classifi cation, commentsNon-cohesive soils containing boulders, cobbles or gravels
• Pit is desirable.• Percussion rigs with shell and chisel, with casing to support the borehole sides • Class 5 disturbed sample only
• Penetration tests are of imited use in ground with boulders and cobbles, but are useful in gravel and sandSand
• CPT tests are preferable to SPT below GWL.• Test pits or augers are useful, with casing or hollow stem below GWL.• Piston samplers or U4 tubes with core catcher.
Silt
Thin walled piston sampler Class 2 sampleU4 tubes without core catcher Class 3 sampleVane test Un-drained shear strength of clayey siltCPT tests are preferable to SPT. Below GWL
Hard, weathered tropical, or over-consolidated clay
Augers or cable percussion methods can be used. -Thin walled piston sampler Class 1 to 2U4 tubes Class 1 to 3Sample pit, cut block sampling Well suited
Core drilling equipment In very stiff materials (sample is affected by drilling water).
Soft clay
Augers or cable percussion methods can be used. -Thin walled piston sampler Class 1U4 tubes Class 2Vane test or CPT In-situ shear strength.
Clays with gravel, cobbles or boulders Test pit is preferable. -
RockNormally core drilling equipment is used. -Cable percussion methods, sampled using U4 tubes with reinforced cutting shoe. In weak and weathered rocks, tuffs etc
Table 2.1: Samples of soils or rock using various methods of sampling. Expected clas-sifi cations.
2.5.6 Field classifi cation and sample sizeClassifi cation of samples in the fi eld should follow the method after Brinks and Jennings as described in Appendix 2.
Determination of the fi eld density as part of the classifi cation may be executed by:● Block sampling.● Core cutter method (shoe cutter).● Split spoon sampler.
The required size of sample for indicator and compaction tests in the laboratory tests are given in Chapter 5.2.3 - Sampling for various types of soils. Minimum Chapter 5.2.3 - Sampling for various types of soils. Minimum Chapter 5.2.3 - Samplingsample sizes are specifi ed in the Laboratory Testing Manual - 2000 for each geotechnical laboratory test.
ch2
19Chapter 2Geotechnique
ch2Field Testing Manual - 2003
Central Materials Laboratory (CML) TANROADS
2.6 Handling, transport and storage of samplesLaboratory testing of samples shall be carried out as soon as possible after sam-pling. Any necessary storage and handling must be such that the quality of the sample is not reduced or the class of disturbance of the sample is not changed by the time they reach the laboratory. Undisturbed samples shall be cushioned against jolting and vibrations, especially during transportation when there is a great risk of such damage to the samples.
Loss of moisture from samples shall be prevented by appropriate means such as use of waxing, rubber capping, plastic cling foil or other means as appropriate. Special care should be taken if the samples have to be stored for an extended period of time before testing.
2.7 Recording 2.7.1 Field recordingSample descriptionField sample description and classifi cation is part of the sampling procedure and shall be carried out as set out in Chapter 5 - Materials prospecting and align-ment surveys.
The aims of fi eld descriptions, in-situ testing and laboratory testing of samples of soil and rock are:1. To identify and classify the samples with a view to making use of past expe-
rience with materials of similar geological age, origin and condition; and2. to obtain soil and rock parameters relevant to the technical objectives of the
investigation.
RecordingProper fi eld procedures include accurate setting out with reference to an identifi -able permanent physical object which should also be shown on the plan draw-ing of the investigation. Normally, the ground level of test pits, bore holes etc. should be determined.
All samples must be labelled with a unique sample identifi cation including:1. Project name. 2. Date.3. Location and elevation of borehole. 4. Depth. 5. Method of sampling. 6. Description. 7. Remarks etc.
2.7.2 ReportingGeneralAll fi eld work should be reported on standardised forms, which will also serve as check lists for the personnel, to ensure that all relevant data for interpreta-tion of the results are collected. A copy of the report should always follow the samples to the laboratory.
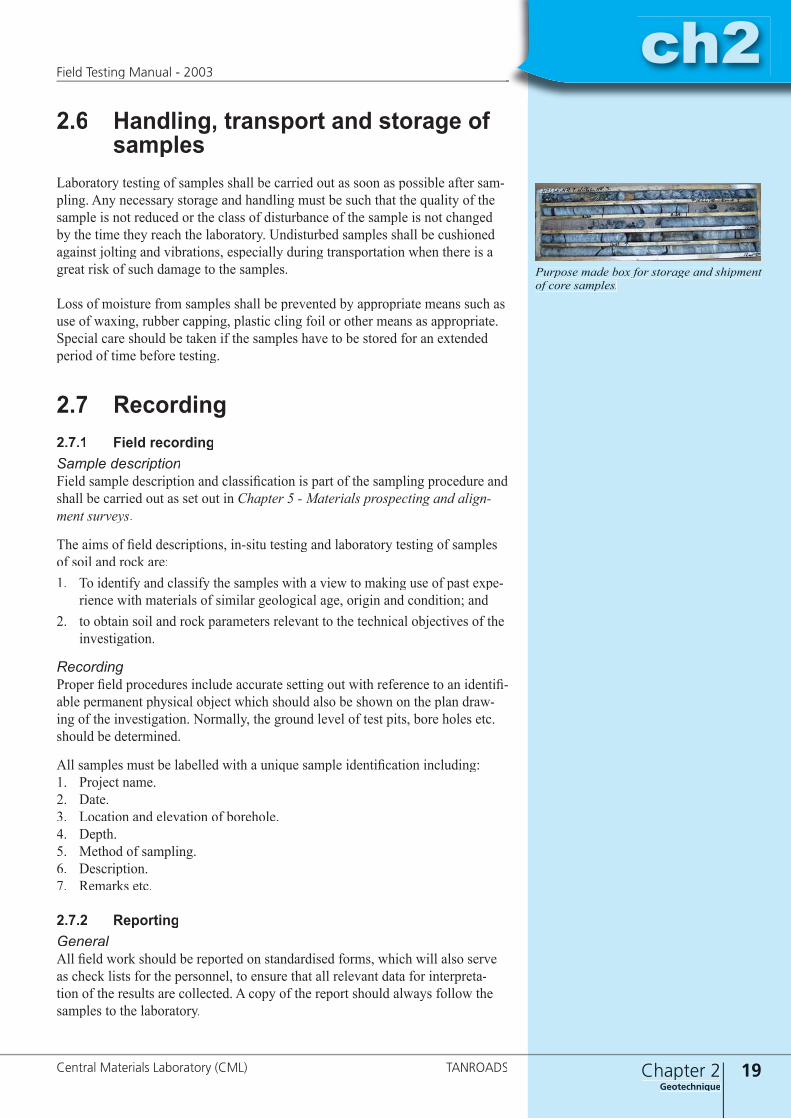
Purpose made box for storage and shipment of core samples.

20 Chapter 2Geotechnique
ch2Field Testing Manual - 2003
TANROADS Central Materials Laboratory (CML)
ch2Soils and materials distribution mapsIn most investigations, the preparation of special soils and materials maps is a very powerful way to compile, analyse and present all site investigation data. On maps one should combine on one map all known topographical and soils/materials features, such as: ● General geology.● Εxisting borrow pits.● Κnown areas of clay.● Rock outcrops etc.
The technique of compiling data on maps is particularly useful for feasibility- or preliminary studies, but will also aid the effi cient planning and execution of detailed ground investigations. Such maps are also very useful in locating the optimal road alignment or position of a dam or bridge site.
2.8 Geotechnical test methodsField TestsF2.01 Soundings Cone penetration - CPT BS1377: Part 9: 1990
BS5930: 1999
F2.02 Soundings Standard penetration test - SPT and continuous core penetration test - CCPT
BS1377: Part 9: 1990BS5930: 1999
F2.03 Soundings Vane test BS1377: Part 9: 1990BS5930: 1999
F2.04 Boring U100 (U4) sampling, undisturbed samples BS5930: 1999
F2.05 Ground water Pore pressure, ground water level BS5930: 1999
F2.06 Ground water Permeability tests for soils and rocks BS5930: 1999
F2.07 Ground water Ground water sampling BS5930: 1999
F2.08 In-situt strenght Plate loading test BS1377: Part 9: 1990
ch2
21Chapter 2Geotechnique
ch2Field Testing Manual - 2003
Central Materials Laboratory (CML) TANROADS
ObjectiveThe uses of the CPT test have traditionally been to predict pile driving resistance,skin friction and end bearing capacity of driven piles in non cohesive soils re-gardless of the groundwater conditions. The test with continuous resistance recording is also commonly used to investigate clays. As with other probing systems, the test only gives an indication of the soil type, and traditional boring and sampling is required for a positive soil determination, using the CPT for rapid interpolation between boreholes.
Description of methodThe basic test procedure is to record the resistance when pushing the cone a fi xed distance into the ground ahead of the outer rods, and then to push the outer rods down into contact with the point and further advancing the cone and outer rods together to the next test depth. The resistance when advancing the outer rods may also be recorded. The latest equipment registers the point resist-ance electrically by sensors inside the point, enabling the recording of a contin-uous resistance profi le, including the pore water pressures. This type of equip-ment may detect very thin soil layers. The cone or penetrometer point is at the end of a string of inner rods running inside hollow outer rods sleeve or shaft.
Use of the CPT test is limited by the safe load that can be carried by the cone, and the force available for pushing the penetrometer into the ground. Pene-tration will normally have to be terminated when dense sand or gravel, coarse gravels, cobbles or rock is encountered. Going from soft ground directly into rock or cobbles may break the point.
Note that although the results of the CPT test may be analysed by soil mecha-nics theory, the correlations between cone resistance bearing capacity, settle-ment and shear strength are partly based on experience with certain soil types and should thus be used with caution for other types of soil.
Cone penetration tests may also be conducted in boreholes.
References
● BS 1377 : Part 9 : 1990 gives details on test procedure for CPT.
● BS 5930 describes the procedure for a test variety called the Static Dynamic Probing, combining the advantages of the CPT with the greater penetration in fi rm ground of the dynamic penetration test.
Without friction sleeve
Witht friction sleeve
���
� � � ����
���������� ����
���� ����
���� ����
�����
�������� ������
������������������������
� �
� ����
���
� � � ����
���������� ����
���� ����
� ����
Field investigations
Central Materials Laboratory2 GeotechniqueTest Method no F 2.01Soundings:Cone Penetration Test - CPT
CPT test assembly.
22 Chapter 2Geotechnique
ch2Field Testing Manual - 2003
TANROADS Central Materials Laboratory (CML)
ch2
Objective and description of method The standard penetration test (SPT) is a dynamic penetration test for determi-nation of relative strength or relative density of soils and weathered rock, and for taking samples for identifi cation of soils in the ground. The test is carried out using a thick-walled sample tube with an open ended point “split spoon or split barrel sampler”. The outside diameter of the sampler is 50 mm. This is driven into the ground at the bottom of the borehole by blows from a standard weight falling through a standard distance. The blow count gives an indication of the density of the ground. The small sample that is recovered will have suffered some disturbance but can normally be used for identifi cation purposes.
The basis of the test consists of dropping with a free fall a hammer of mass 63.5 kg on to a drive head from a height of 760 mm. The number of such blows necessary to achieve a penetration of the split-barrel sampler of 300 mm, following a 150 mm seating drive, is regarded as the penetration resistance (N).
The SPT test may be carried out with a solid cone point suitable for hard ground. This test is denoted Continuous Cone Penetration Test (CCPT).
CCPTThe Continuous Cone Penetration Test (CCPT) is performed in gravel and coarse soils and is conducted in the usual way as for SPT except that the sampler is replaced by a solid steel cone of the same outside diameter, with a 60° apex cone. The continuation of this description refers to the SPT test.
Advantages and limitationsThe SPT is probably the most widely used in-situ test in the world. The test assumes a carefully cleaned out borehole, established by a method which will not disturb the ground below the bottom of the hole.
Advantages● Great merit of the test.● Simple and inexpensive test.● The soil strength parameters which can be inferred are approximate, but
may give a useful guide in ground conditions where it may not be possible to obtain borehole samples of adequate quality, e.g. gravels, sands, silts, clay containing sand or gravel and weak rock.
Limitations● Samples are disturbed, thus the soil strength parameters which can be in
ferred are approximate.● When the test is carried out in granular soils below groundwater level, the
soil may become loosened.
No disturbance may be impossible to achieve in granular soils below the ground water level, which may be loosened by fl ow towards the borehole. In such conditions, in-situ tests performed indepen-dently of a borehole should be considered, e.g. the CPT test.
BS 1377 : Part 9 : 1990 denotes the CCPT test SPT(C).
The test is sometimes carried out in boreholes considerably larger in diameter than those used for ground investigation work, e.g. in the construction of bored piles. The result of the SPT is dependent upon the diameter of the borehole. Tests should not be regarded as SPT when performed in boreholes with diameter larger than 150 mm. Boreholes with reduced diameter shall continue for min. 1m before SPT commences.
In conditions where the quality of the “undisturbed” sample is suspect, e.g. very silty or very sandy clays, or hard clays, it is often advantageous to alternate the sampling with standard penetration tests to check the strength.
Central Materials Laboratory
Field investigations
2 GeotechniqueTest Method no F 2.02Soundings:Standard penetration test - SPT andContinuous Cone Penetration Test - CCPT
SPT sampler.
ch2
23Chapter 2Geotechnique
ch2Field Testing Manual - 2003
Central Materials Laboratory (CML) TANROADS
ApparatusBoring equipment. The boring equipment shall be capable of providing a clean hole before insertion of the sampler and shall ensure that the penetration test can be performed in relatively undisturbed soil. When wash boring, a side-discharge bit shall be used and not a bottom-discharge bit. The process of jetting through an open tube samp-ler and then testing when the desired depth is reached shall not be permitted.
When boring in soil that will not allow a hole to remain stable, casing and/or mud shall be used. The area that is exposed in the base of the borehole prior to testing may infl uence the result and consequently the borehole diameter shall always be reported.
Split barrel sampler assemblyThe sampler assembly shall have the shape and dimensions shown in the fi gure to the left. The drive shoe and split barrel, both having a uniform bore of the same diameter, shall be made of steel with a smooth surface externally and internally. The drive shoe shall be made of hardened steel. It shall be replaced when it becomes damaged or distorted to avoid the test result being affected. The coupling shall contain a 25 mm nominal diameter ball check valve seated in an orifi ce of not less than 22 mm nominal diameter which shall be located below the venting. The ball and its seat shall be constructed and maintained to provide a watertight seal when the sampler is withdrawn. Alternative designs of check valves are permitted provided they give equal or better performance.
Drive rods The rods used for driving the sampler assembly shall be tightly coupled by screw joints and shall comply with BS 4019.● Minimum stiffness, general:.............................. type AW drill rods● Minimum stiffness, holes deeper than 20 m: .... type BW drill rods● Maximum rod weight: ....................................... 10.0 kg/mOnly straight rods shall be used and, the relative defl ections shall not be greater than 1 in 1000 when measured over the whole length of each rod.
Drive assemblyThe drive assembly of an overall mass not exceeding 115 kg shall comprise the following.● A hammer made of steel and weighing 63.5 + 0.5 kg.● A pick-up and release mechanism which shall ensure that the hammer has a
free fall of 760 + 20 mm, and shall not infl uence the acceleration and decel-eration of the hammer or the rods. The velocity of the hammer shall be neg-ligible when the hammer is released at its upper limit.
● A guide arrangement which shall permit the hammer to drop with minimal resistance and to ensure the hammer strikes the anvil squarely.
● A drive-head (anvil) made of steel, with a mass between 15 kg and 20 kg, which shall be tightly screwed to the top of the drive rods.
ProcedurePreparing the boreholeClean out the borehole carefully to the test elevation using equipment that will ensure the soil to be tested is not disturbed. When boring below the ground-water table maintain at all times the water or mud level in the borehole at a suffi cient distance above the groundwater level to minimize disturbance of the
Periodic checks for rod straightness shall be made on site, including the threaded connections between consecutive rods.
� �� " ���
� �� " ���
�� "������ " ���
��"
���
�
�
���
���
�����
����
�����
���
���
���
���
�������
�
���� ����������
� ����� � �� ������� ������������� ���
SPT slip barrel sampler assembly.
24 Chapter 2Geotechnique
ch2Field Testing Manual - 2003
TANROADS Central Materials Laboratory (CML)
ch2soil at the base of the borehole. Maintain the water or mud level in the borehole throughout the test to ensure hydraulic balance at the test elevation.
Executing the testLower the sampler assembly to the bottom of the borehole on the drive rods with the drive assembly on top. Record the initial penetration under this total dead-weight. Where this penetration exceeds 450 mm omit the seating drive and test drive and record the’ N’ value as zero. After the initial penetration, carry out the test in two stages:
1. Seating drive: Using standard blows the seating drive shall be a penetration of 150 mm or 25 blows whichever is fi rst reached.
2. Test drive: The number of blows required for a further penetration of 300 mm and this is termed the penetration resistance (N). If the 300 mm pene-tration cannot be achieved in 50 blows terminate the test drive. For test driv-ing in soft rock the test drive should be terminated after 100 blows if a pene-tration of 300 mm has not been achieved.
InterpretationInterpretation is part of foundation design, that should contain an site investi-gation report including interpretation of the data. There is a lack of enforced and consistent international standardization for the drilling technique and SPT tests equipment. SPT results and soil parameters derived from data outside Tanzania may therefore not correlate with results from SPTs derived in accordance with practices in the country.
References ● BS 5930 : 1999● BS 1377 : Part 9 : 1990● Review of relevant literature:
CLAYTON, C.R.I. The standard penetration test (SPT): Methods and use. CIRIA Report no. 143. London: CIRIA 1995.
Withdraw the drilling tools slowly from the ground and up the borehole (when fi lled with water) to pre-vent suction and consequent loosening of the soil to be tested. When casing is used, do not drive it below the level at which the test is to commence.
The rate of application of hammer blows shall not be excessive such that there is the possibility of not achieving the standard drop or preventing equilibrium conditions prevailing between succes-sive blows.
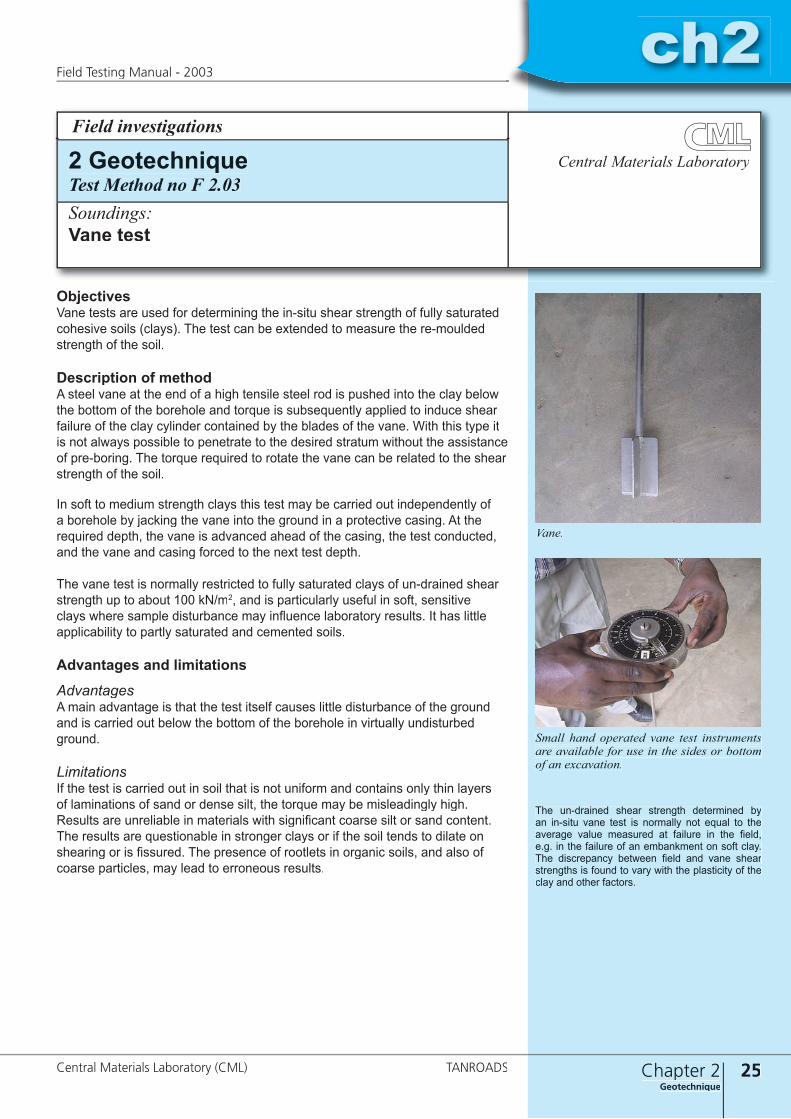
ch2
25Chapter 2Geotechnique
ch2Field Testing Manual - 2003
Central Materials Laboratory (CML) TANROADS
Field investigations
Central Materials Laboratory2 GeotechniqueTest Method no F 2.03Soundings:Vane test
Objectives Vane tests are used for determining the in-situ shear strength of fully saturated cohesive soils (clays). The test can be extended to measure the re-moulded strength of the soil.
Description of methodA steel vane at the end of a high tensile steel rod is pushed into the clay below the bottom of the borehole and torque is subsequently applied to induce shear failure of the clay cylinder contained by the blades of the vane. With this type it is not always possible to penetrate to the desired stratum without the assistance of pre-boring. The torque required to rotate the vane can be related to the shear strength of the soil.
In soft to medium strength clays this test may be carried out independently of a borehole by jacking the vane into the ground in a protective casing. At the required depth, the vane is advanced ahead of the casing, the test conducted, and the vane and casing forced to the next test depth.
The vane test is normally restricted to fully saturated clays of un-drained shear strength up to about 100 kN/m2, and is particularly useful in soft, sensitive clays where sample disturbance may infl uence laboratory results. It has little applicability to partly saturated and cemented soils.
Advantages and limitationsAdvantagesA main advantage is that the test itself causes little disturbance of the ground and is carried out below the bottom of the borehole in virtually undisturbed ground.
LimitationsIf the test is carried out in soil that is not uniform and contains only thin layers of laminations of sand or dense silt, the torque may be misleadingly high. Results are unreliable in materials with signifi cant coarse silt or sand content. The results are questionable in stronger clays or if the soil tends to dilate on shearing or is fi ssured. The presence of rootlets in organic soils, and also of coarse particles, may lead to erroneous results.
Small hand operated vane test instruments are available for use in the sides or bottom of an excavation.
The un-drained shear strength determined by an in-situ vane test is normally not equal to the average value measured at failure in the fi eld, e.g. in the failure of an embankment on soft clay. The discrepancy between fi eld and vane shear strengths is found to vary with the plasticity of the clay and other factors.
Vane.
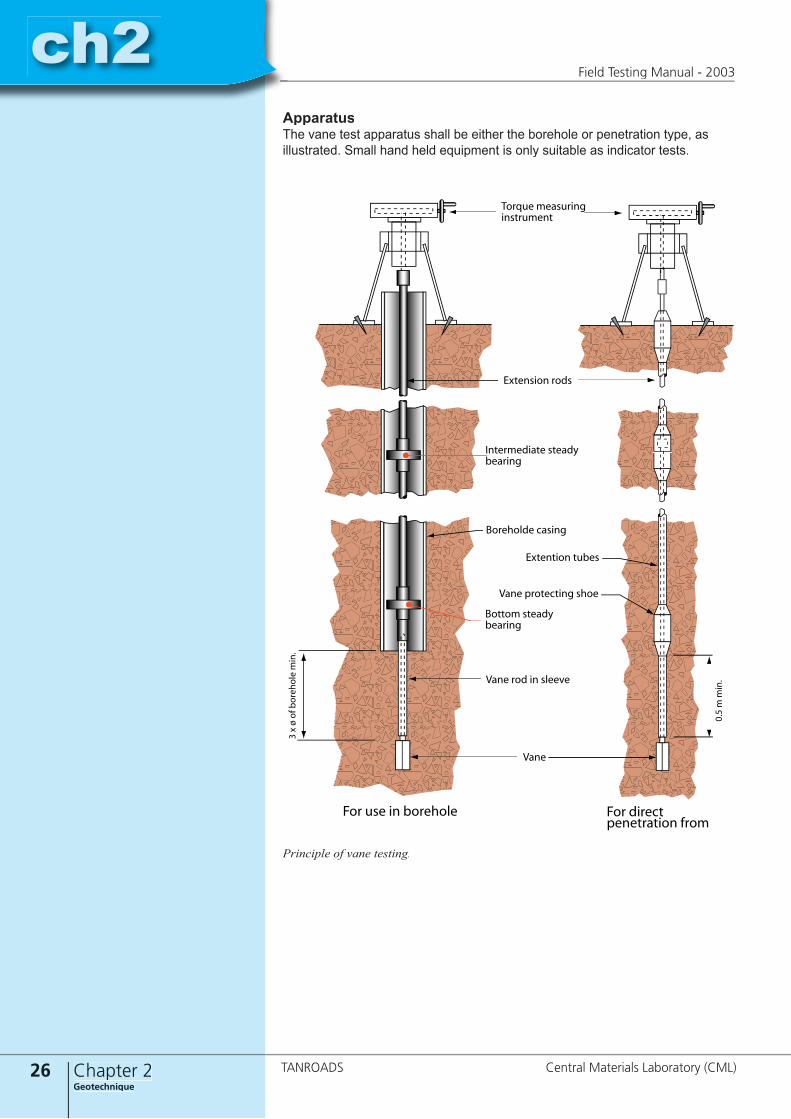
26 Chapter 2Geotechnique
ch2Field Testing Manual - 2003
TANROADS Central Materials Laboratory (CML)
ch2
������ �������������������
��������� ����
������������ �������������
��������� ������
��������� �����
���� ���������� ����
���� ��� �� ������
����
������ �������������
������
�������
����
����
����
��� ��� �� �������� ��� ����������������� ����
ApparatusThe vane test apparatus shall be either the borehole or penetration type, as illustrated. Small hand held equipment is only suitable as indicator tests.
Principle of vane testing.

ch2
27Chapter 2Geotechnique
ch2Field Testing Manual - 2003
Central Materials Laboratory (CML) TANROADS
VaneThe vane of cruciform shape, should be of preferably of high grade stainless steel with the following measurements, (reference to illustration).
Length (H): Shall be twice the overall blade width D
The design of the vane shall be such that it causes as little remoulding and disturbance as possible when inserted into the ground for a test. The blades shall be as thin as possible, consistent with the strength requirements, and have a cutting edge at the lower end. The rod on which the vane is mounted, normally of high tensile steel, shall preferably not exceed 13 mm in diameter.
RodsThe vane rod shall be enclosed by a suitably designed sleeve from just above the blades and throughout the length it penetrates the soil to exclude soil particles and the effects of soil adhesion. The sleeve shall be packed with grease. This sleeve shall commence above the blades at a distance equivalent to about two diameters of the vane rod.
Extension rods about 1 m in length. These shall be suffi ciently strong to be able to stand axial thrust, allow a reasonable amount of lack of linearity, and be fi tted with a coupling which makes it impossible for the rods to tighten or twist relative to each other.
InstrumentCalibrated torque measuring instrument preferably with height adjustment and capable of being clamped in the required position. The base of the instrument shall be capable of being fi xed to the ground. The instrument shall have a torque capacity of approximately 100 Nm and an accuracy of 1 % or better of the indicated torque from 10 Nm to the instrument’s maximum reading.
ProcedureThe following is specifi ed for performing the test.
● Place steady bearing minimum every 3 m in the case of tests in a borehole.
● Rotate the torque head throughout the test at a rate within the range 0.10°/second to 0.20°/second (equal to 6° /minute to 12° /minute).
● Rotate the torque head until the soil is sheared by the vane. Read the gauge at maximum defl ection, thus indicating the torque required to shear the soil.
RemouldingTest of re-moulded strength of soils is done by removing the torque-measuring instrument from the extension rods and turning the vane through six complete rotations. A period of 5 min is permitted to elapse after which the vane test is repeated in the normal way.
Shear strength of soil Suitable vane size, approximately< 50 kPa 150 mm long by 75 mm
50 - 100 kPa 100 mm long by 50 mm wide

28 Chapter 2Geotechnique
ch2Field Testing Manual - 2003
TANROADS Central Materials Laboratory (CML)
ch2Calculations and reportingThe shear strength of the soil, (kPa) is calculated from the following equation:
S = M
K
where
M is the torque to shear in the soil (in Nm);K is a constant depending on dimensions and shape of the vane.
Assuming the distribution of the shear strength is uniform across the ends of a cylinder and around the perimeter then:
K = � D2H (1+ D ) 10-6
� �
2 ( (1+ 1+ 3H
where
D is the measured width of vane (mm)H is the measured height of vane (mm)
As the ratio of length to width of the vane is 2 to 1 the value of K may be simplifi ed in terms of the diameter so that it becomes:
K = 3.66D3 X 10 –6
The test report shall contain the following information:
(a) The method of test used.(b) The vane shear strength (in kPa) to two signifi cant fi gures.(c) The type of vane test apparatus.
References• BS 5930 : 1999• BS 1377 : Part 9 : 1990
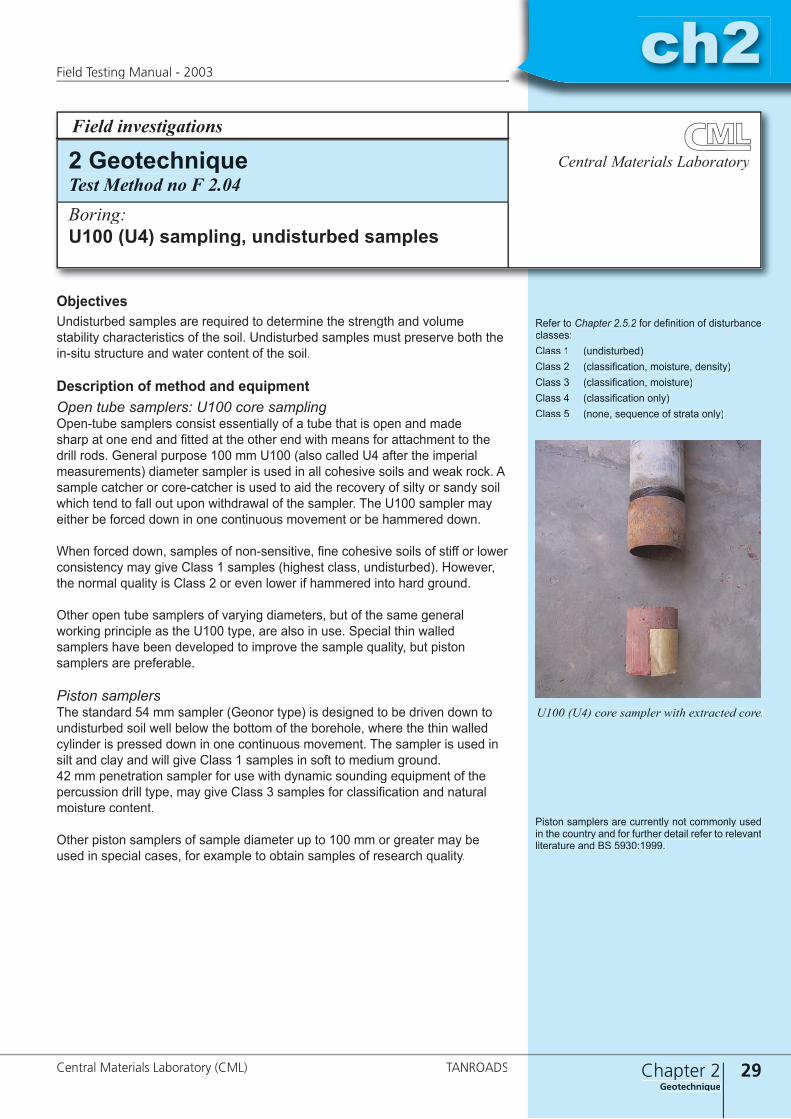
ch2
29Chapter 2Geotechnique
ch2Field Testing Manual - 2003
Central Materials Laboratory (CML) TANROADS
ObjectivesUndisturbed samples are required to determine the strength and volume stability characteristics of the soil. Undisturbed samples must preserve both the in-situ structure and water content of the soil.
Description of method and equipmentOpen tube samplers: U100 core samplingOpen-tube samplers consist essentially of a tube that is open and madesharp at one end and fi tted at the other end with means for attachment to the drill rods. General purpose 100 mm U100 (also called U4 after the imperial measurements) diameter sampler is used in all cohesive soils and weak rock. A sample catcher or core-catcher is used to aid the recovery of silty or sandy soil which tend to fall out upon withdrawal of the sampler. The U100 sampler may either be forced down in one continuous movement or be hammered down.
When forced down, samples of non-sensitive, fi ne cohesive soils of stiff or lower consistency may give Class 1 samples (highest class, undisturbed). However, the normal quality is Class 2 or even lower if hammered into hard ground.
Other open tube samplers of varying diameters, but of the same general working principle as the U100 type, are also in use. Special thin walled samplers have been developed to improve the sample quality, but piston samplers are preferable.
Piston samplersThe standard 54 mm sampler (Geonor type) is designed to be driven down to undisturbed soil well below the bottom of the borehole, where the thin walled cylinder is pressed down in one continuous movement. The sampler is used in silt and clay and will give Class 1 samples in soft to medium ground.42 mm penetration sampler for use with dynamic sounding equipment of the percussion drill type, may give Class 3 samples for classifi cation and natural moisture content.
Other piston samplers of sample diameter up to 100 mm or greater may be used in special cases, for example to obtain samples of research quality.
Refer to Chapter 2.5.2 for defi nition of disturbance classes:Class 1 (undisturbed)Class 2 (classifi cation, moisture, density)Class 3 (classifi cation, moisture)Class 4 (classifi cation only)Class 5 (none, sequence of strata only)
Piston samplers are currently not commonly used in the country and for further detail refer to relevant literature and BS 5930:1999.
Field investigations
Central Materials Laboratory2 GeotechniqueTest Method no F 2.04Boring:U100 (U4) sampling, undisturbed samples
U100 (U4) core sampler with extracted core.
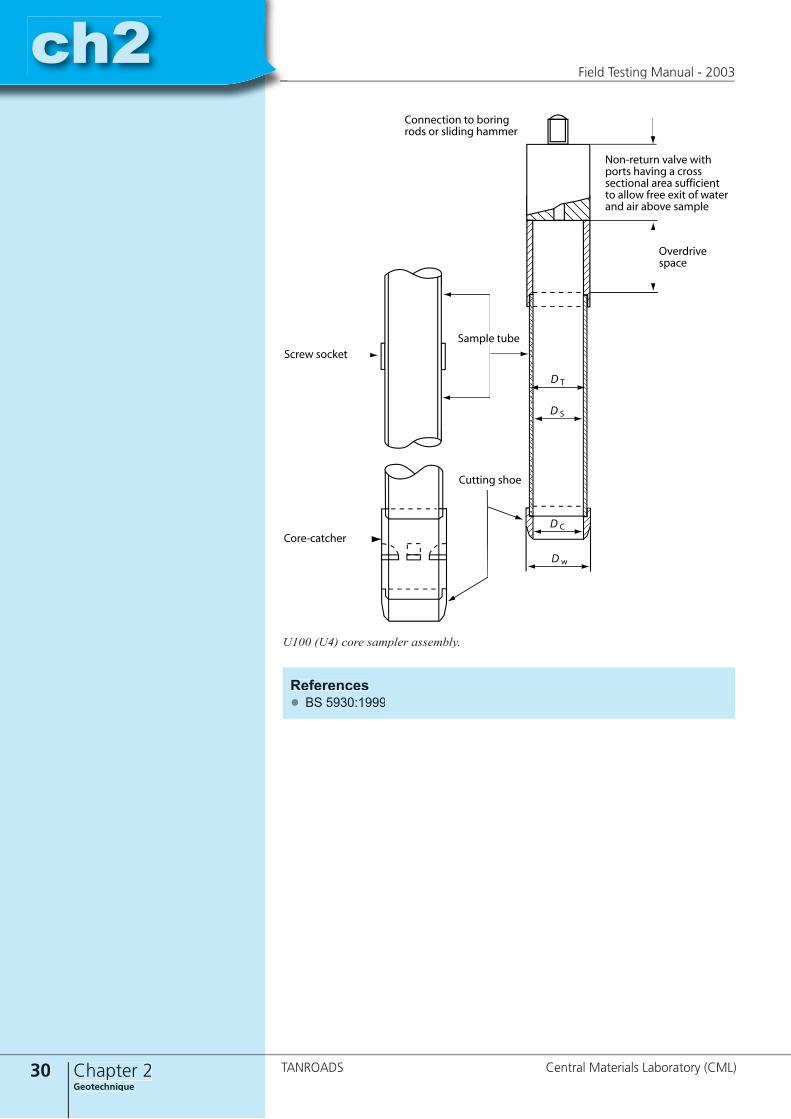
30 Chapter 2Geotechnique
ch2Field Testing Manual - 2003
TANROADS Central Materials Laboratory (CML)
ch2
���������� ����� ��������� ������ � �������������� ���� ������������ ����� ���� ���� �� �������� ��� ����� ������
��������������
���������� �� ���������� �� ������� ������
������� ����
����� ������
������������
� �
� �
� �
� �
������ ����
References ● BS 5930:1999
U100 (U4) core sampler assembly.
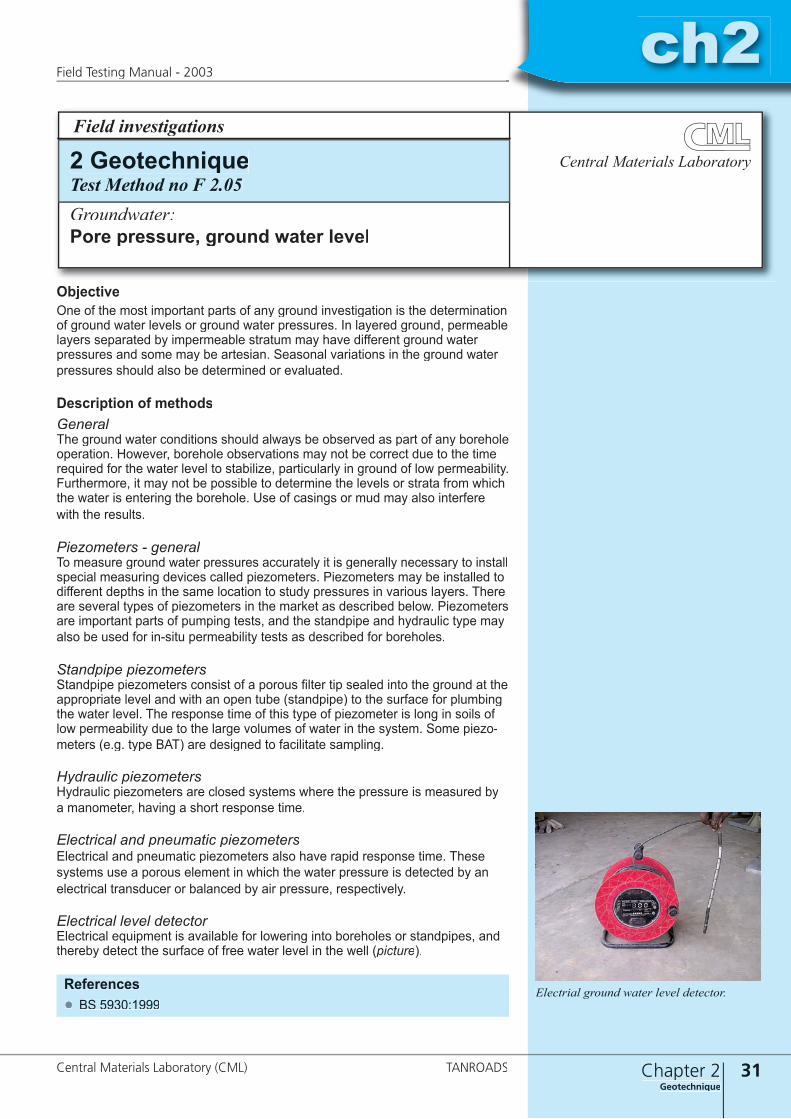
ch2
31Chapter 2Geotechnique
ch2Field Testing Manual - 2003
Central Materials Laboratory (CML) TANROADS
ObjectiveOne of the most important parts of any ground investigation is the determination of ground water levels or ground water pressures. In layered ground, permeable layers separated by impermeable stratum may have different ground water pressures and some may be artesian. Seasonal variations in the ground water pressures should also be determined or evaluated.
Description of methodsGeneralThe ground water conditions should always be observed as part of any borehole operation. However, borehole observations may not be correct due to the time required for the water level to stabilize, particularly in ground of low permeability. Furthermore, it may not be possible to determine the levels or strata from which the water is entering the borehole. Use of casings or mud may also interfere with the results.
Piezometers - generalTo measure ground water pressures accurately it is generally necessary to installspecial measuring devices called piezometers. Piezometers may be installed to different depths in the same location to study pressures in various layers. There are several types of piezometers in the market as described below. Piezometers are important parts of pumping tests, and the standpipe and hydraulic type may also be used for in-situ permeability tests as described for boreholes.
Standpipe piezometersStandpipe piezometers consist of a porous fi lter tip sealed into the ground at the appropriate level and with an open tube (standpipe) to the surface for plumbing the water level. The response time of this type of piezometer is long in soils of low permeability due to the large volumes of water in the system. Some piezo-meters (e.g. type BAT) are designed to facilitate sampling.
Hydraulic piezometers Hydraulic piezometers are closed systems where the pressure is measured by a manometer, having a short response time.
Electrical and pneumatic piezometersElectrical and pneumatic piezometers also have rapid response time. These systems use a porous element in which the water pressure is detected by an electrical transducer or balanced by air pressure, respectively.
Electrical level detectorElectrical equipment is available for lowering into boreholes or standpipes, and thereby detect the surface of free water level in the well (picture).
References● BS 5930:1999
Field investigations
Central Materials Laboratory2 GeotechniqueTest Method no F 2.05Groundwater:Pore pressure, ground water level
Electrial ground water level detector.

32 Chapter 2Geotechnique
ch2Field Testing Manual - 2003
TANROADS Central Materials Laboratory (CML)
ch2
ObjectivePermeability tests are carried out for the purpose of measuring underground fl ow characteristics of ground water through in-situ soils or rock. Pumping tests may be carried out to study the permeability, transmissivity and storage of an area of several square kilometres, as may be required in the evaluation of ground water resources or the design of subterrain cut-off barriers in dam design.
Description of methodOf the variety of in-situ permeability tests in boreholes the common tests are:A. Permeability of soils below the ground water level by the variable head
methods.B. Permeability of soils below the ground water level by the constant head
methods.C. Permeability of soils or rock by pumping tests.D. Permeability of rock subjected to water pressure, Packer test.
Tests A and B both apply a hydraulic pressure in the borehole different from that in the ground and observe the effect in the borehole.
Test C - pumping test for the permeability of the ground - involves a steady fl ow pumping from a well and observation of the drawdown effect on ground water levels in inspection wells (piezometers), at some distance away from the pumped well. The drawdown in ground water level thus created is termed the “cone of depression”.
Some particular problems encountered in in-situ permeability testing are:
● High test pressures may fracture, open up, the ground.
● Layers/fi ssures in the ground, and water tightness of the complete test system greatly affects the results.
● Test holes may erode, use of fi lters, screens etc. may be required.
● Results are affected by the effective stress which in turn will be effected by the test, in the case of compressible soils.
● The infl uence of partial saturation on permeability needs to be taken into account in interpreting results as long term infl ow tests are likely to give permeabilities which are close to those for the saturated soil.
References● BS 5930:1999
In-situ permeability testing is generally more reliable than tests performed on samples in the laboratory due to the large mass of ground involved and the lack of sample disturbance. However, permeability testing requires expert knowledge both to select the correct method and to evaluate the results.
As a rule, constant head borehole tests are likely to give more accurate results than variable head tests, but variable head tests are simpler to per-form. The more elaborate and expensive pumping tests with observation of the drawdown levels, give the most reliable results.
Central Materials Laboratory
Field investigations
2 GeotechniqueTest Method no F 2.06Groundwater:Permeability tests for soils and rock

ch2
33Chapter 2Geotechnique
ch2Field Testing Manual - 2003
Central Materials Laboratory (CML) TANROADS
ObjectiveGround water sampling is carried out for the purpose of chemical analysis, eitherfor evaluation as a water source for consumption or use in the works. Water for earthworks, layerworks or concrete requires testing against deleterious matter such as e.g. soluble salts or other substances causing damage.
Description of methodA sample should be taken immediately the water bearing stratum is reached during boring. It is preferable to obtain samples from the standpipe piezometers if these have been installed. It is important to ensure that samples are not cont-aminated or diluted.
References● BS 5930:1999
Field investigations
Central Materials Laboratory2 GeotechniqueTest Method no F 2.07Groundwater:Ground water sampling
Some piezometers (e.g. type BAT) are designed to facilitate sampling.

34 Chapter 2Geotechnique
ch2Field Testing Manual - 2003
TANROADS Central Materials Laboratory (CML)
ch2
Central Materials Laboratory
Field investigations
2 GeotechniqueTest Method no F 2.08Deformation test:Plate loading test
ObjectivesThe plate loading method is used for determination of the vertical deformation and strength characteristics of soil, primarily for foundation footings, but may also be requested for determination of in-situ E-modulus of pavement layers of for support of the pavement.
Description of method The test is conducted by penetrating a rigid, circular, plate into the soil in-situ and measuring the force and deformation strength of density of soils and compacted layers of primarily clay and soft materials. Core cutting gives volume by predetermining the size of the excavated hole with a calibrated core of known volume.
Advantages and limitationsAdvantagesThe method is a simple way of determining foundation support at shallow levels for smaller structures or for investigation of small areas. The test may be useful on construction sites during establishment of method specifi cations for compaction control of earthworks.
Limitations● The test is slow to perform and requires a considerable input of resources.
The method is therefore not well suited for investigations of large areas.
● The results are only valid for the site conditions under which the test is performed, e.g. with regards to moisture conditions.
ApparatusGeneralThe apparatus for determining penetration is normally the same as used for Benkelman beam testing. A hydraulic jack is used for applying the force, that is measured by aid of a calibrated manometer on the jack. Support to the jack may be a truck or other heavy equipment. Quick-setting plaster is required for preparation of the test site. Equipment for sampling and fi eld density measurement is required if such tests are requested at the same location as the plate loading test.
The test plateThe plate shall be circular and the diameter normally ranges between 150 and 300 mm. The plate diameter should be larger than fi ve times the diameter of the larges particles normally found in the soil. In case of measurement of fi ssured clay the plate diameter should be larger than fi ve times the spacing between the fi ssures, and have a diameter of minimum 300 mm.
The depth to which the measurement has effect is approximately1,5 times the diameter of the plate, as a rule of thumb.
ch2
35Chapter 2Geotechnique
ch2Field Testing Manual - 2003
Central Materials Laboratory (CML) TANROADS
Procedure1. Carefully trim off and remove all loose material and any embedded fragments
so that the area for the plate is generally level and as undisturbed as pos-sible. Hollows shall not be infi lled with soil. For tests on cohesive soils proceedas soon as possible thereafter to pour and spread the paste of the quick-setting plaster to obtain a level surface not more than 15 mm to 20 mm thick.Immediately the paste is spread, bed the plate. For tests on granular soils fi ll any hollows with clean dry sand to produce a level surface on which to bed the plate.
2. Apply a fi lm of oil on the plate and place it in postion. Rotate and tap the plate to bed it properly, and remov all surplus plaster.
3. Put in postion all equipment for loading and measurement of deformation.
4. Apply an initial load of 20 kN/m2 for a few secondes and thereafter set the measurement gauge to zero.
5. Load the plate in fi ve increments. The table below suggests increments to use in the test. The load at each increment shall be maintaned intil deforma-tion is negligible. Record the load and deformation at each load increment.
6. Off-load the plate slowly and repeat the test after the arm of the force gauge has settled.
Increment Load (kN/m2)1 502 1803 3004 4205 600
Calculations and reporting1. Calculate the bearing pressure (in kN/m2)at the load that causes failure. If
failure is not clearly defi ned, use the pressure causing a penetration of 15% of the diameter of the plate.
2. Calculate the E-modulus as follows:Plot the pressure (kN/m2) against deformation, and determine the points on the curve that represent 30% and 70% respectively, of the maximum pres-sure. Calculate as follows:
P1 = P70 – P30S1 = S70 – S30
E1 =3 P1 x D4
xS1
where:P70 is the pressure (kN/m2) at 70% of the maximum pressureP30 is the pressure (kN/m2) at 30% of the maximum pressureS70 is the deformation (metres) at 70% of the maximum pressureS30 is the deformation (metres) at 30% of the maximum pressureD is the diameter of the plate (metres)
References ● BS 1377 : Part 9 : 1990
If excavation to the test level as is required, carry out this work as quickly as practicable to minimize the effects of stress relief, particularly when in cohesive soils.
The increment loading method gives the strength characteristics under drained conditions.
It is desirable to load the plate at equal increments whereby the maximum load is near the design pressure. This is possibly to obtain where site conditions are familiar.

36 Chapter 2Geotechnique
ch2Field Testing Manual - 2003
TANROADS Central Materials Laboratory (CML)
ch3
ch2
37Chapter 3Pavement Evaluation
ch3Field Testing Manual - 2003
Central Materials Laboratory (CML) TANROADS
3 Pavement evaluation
1
2
Introduction
Geotechnique
6
4
Construction control
Axle load surveys
5 Material prospecting and alignment surveys
Appendices
3.1 Pavement distress ...................................................................................... 39 3.1.1 Types of distress ....................................................................... 39 3.1.2 Cause of distress....................................................................... 40
3.2 Methodology ........................................................................................ 42 3.2.1 Purpose of pavement evaluation .............................................. 42 3.2.2 Evaluation procedure ............................................................... 43 3.2.3 Test frequencies........................................................................ 43 3.2.4 Desk study................................................................................ 44 3.2.5 Initial assessment ..................................................................... 44
3.3 Detailed condition surveys.................................................................. 45 3.3.1 General ..................................................................................... 45 3.3.2 Condition rating and reporting ................................................. 45 3.3.3 Visual evaluation...................................................................... 46 3.3.4 Rut depth measurements .......................................................... 47 3.3.5 Roughness measurements ........................................................ 47
3.4 Pavement strength – structural surveys............................................ 49 3.4.1 General ..................................................................................... 49 3.4.2 DCP measurements .................................................................. 50 3.4.3 Defl ection measurements ......................................................... 50
3 PAVEMENT EVALUATION
Chapter 3: Table of Contents

38 Chapter 3Pavement Evaluation
ch3Field Testing Manual - 2003
TANROADS Central Materials Laboratory (CML)
ch3
Field Tests Chapter
Visual evaluation 3.3.3
Rut depthe measurements 3.3.4
Roughness measurements 3.3.5
DCP measurements 3.4.2
Defl ection measurements 3.4.3
Test pit profi ling and sampling in existing pavements 3.5
3.5 Test pit profi ling and sampling in existing pavements..................... 52 3.5.1 General ..................................................................................... 52 3.5.2 Test programme, frequency and location ................................. 52 3.5.3 Size and depth of test pits......................................................... 53 3.5.4 Sampling and testing in the trial pit ......................................... 53 3.5.5 Description and logging of the soil profi le, analysis and presentation.......................................................... 543.6 Homogenous sections .......................................................................... 55 3.6.1 General ..................................................................................... 55 3.6.2 Procedure.................................................................................. 55
References● Pavement and Materials Design Manual - 1999, Ministry of Works,
Tanzania● Guideline no. 2 Pavement Testing, Analysis and Interpretation of Test
Data. Roads Department, Botswana, 2000
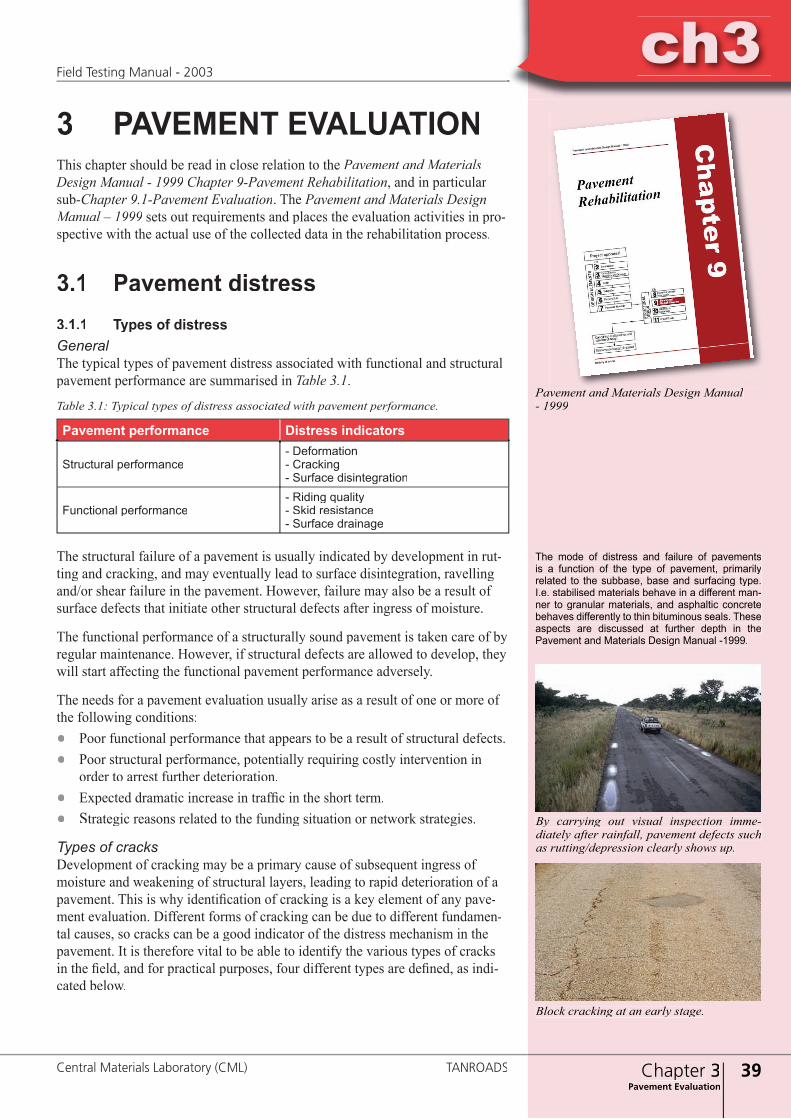
ch3
39Chapter 3Pavement Evaluation
ch3Field Testing Manual - 2003
Central Materials Laboratory (CML) TANROADS
3 PAVEMENT EVALUATIONThis chapter should be read in close relation to the Pavement and Materials Design Manual - 1999 Chapter 9-Pavement Rehabilitation, and in particular sub-Chapter 9.1-Pavement Evaluation. The Pavement and Materials Design Manual – 1999 sets out requirements and places the evaluation activities in pro-spective with the actual use of the collected data in the rehabilitation process.
3.1 Pavement distress3.1.1 Types of distressGeneral The typical types of pavement distress associated with functional and structural pavement performance are summarised in Table 3.1.
Table 3.1: Typical types of distress associated with pavement performance.
The structural failure of a pavement is usually indicated by development in rut-ting and cracking, and may eventually lead to surface disintegration, ravelling and/or shear failure in the pavement. However, failure may also be a result of surface defects that initiate other structural defects after ingress of moisture.
The functional performance of a structurally sound pavement is taken care of by regular maintenance. However, if structural defects are allowed to develop, they will start affecting the functional pavement performance adversely.
The needs for a pavement evaluation usually arise as a result of one or more of the following conditions:● Poor functional performance that appears to be a result of structural defects.● Poor structural performance, potentially requiring costly intervention in
order to arrest further deterioration.● Εxpected dramatic increase in traffi c in the short term.● Strategic reasons related to the funding situation or network strategies.
Types of cracksDevelopment of cracking may be a primary cause of subsequent ingress of moisture and weakening of structural layers, leading to rapid deterioration of a pavement. This is why identifi cation of cracking is a key element of any pave-ment evaluation. Different forms of cracking can be due to different fundamen-tal causes, so cracks can be a good indicator of the distress mechanism in the pavement. It is therefore vital to be able to identify the various types of cracks in the fi eld, and for practical purposes, four different types are defi ned, as indi-cated below.
Pavement performance Distress indicators
Structural performance- Deformation- Cracking- Surface disintegration
Functional performance- Riding quality- Skid resistance- Surface drainage
The mode of distress and failure of pavements is a function of the type of pavement, primarily related to the subbase, base and surfacing type. I.e. stabilised materials behave in a different man-ner to granular materials, and asphaltic concrete behaves differently to thin bituminous seals. These aspects are discussed at further depth in the Pavement and Materials Design Manual -1999.
Block cracking at an early stage.
By carrying out visual inspection imme-diately after rainfall, pavement defects such as rutting/depression clearly shows up.
Pavement and Materials Design Manual Pavement and Materials Design Manual - 1999
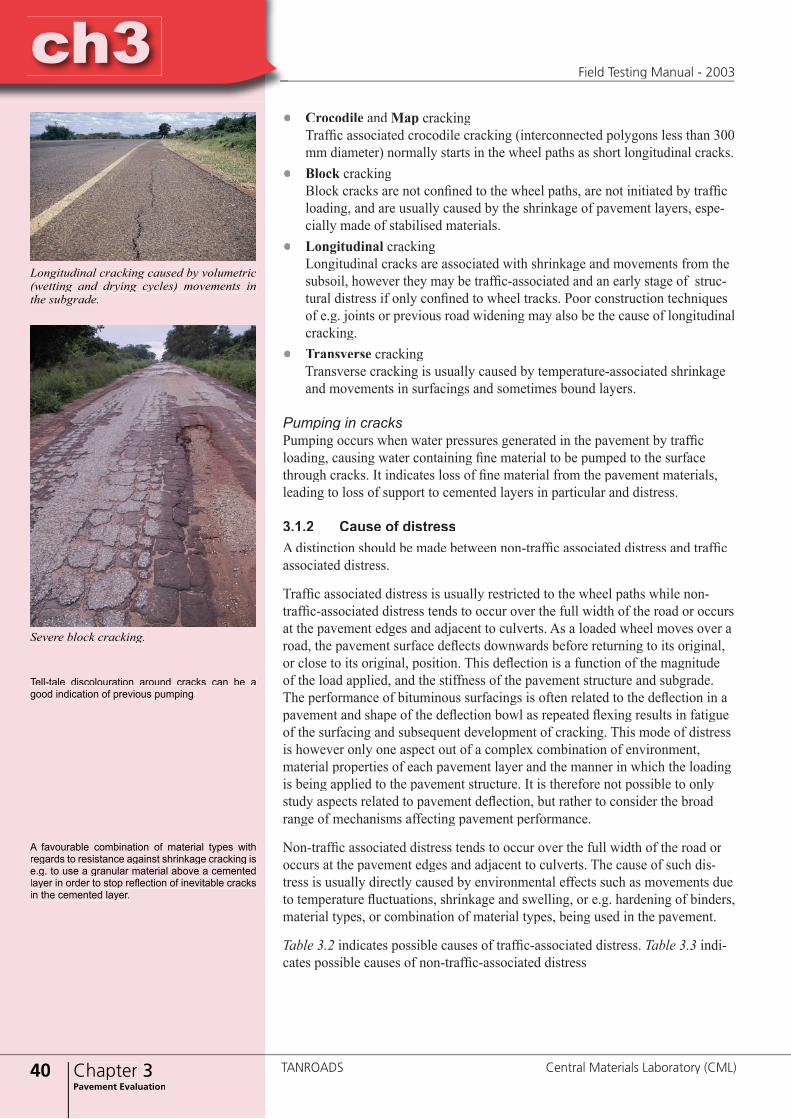
40 Chapter 3Pavement Evaluation
ch3Field Testing Manual - 2003
TANROADS Central Materials Laboratory (CML)
ch3● Crocodile and Map and Map and cracking
Traffi c associated crocodile cracking (interconnected polygons less than 300 mm diameter) normally starts in the wheel paths as short longitudinal cracks.
● Block crackingBlock cracks are not confi ned to the wheel paths, are not initiated by traffi c loading, and are usually caused by the shrinkage of pavement layers, espe-cially made of stabilised materials.
● Longitudinal crackingLongitudinal cracks are associated with shrinkage and movements from the subsoil, however they may be traffi c-associated and an early stage of struc-tural distress if only confi ned to wheel tracks. Poor construction techniques of e.g. joints or previous road widening may also be the cause of longitudinalcracking.
● Transverse crackingTransverse cracking is usually caused by temperature-associated shrinkage and movements in surfacings and sometimes bound layers.
Pumping in cracksPumping occurs when water pressures generated in the pavement by traffi c loading, causing water containing fi ne material to be pumped to the surface through cracks. It indicates loss of fi ne material from the pavement materials, leading to loss of support to cemented layers in particular and distress.
3.1.2 Cause of distressA distinction should be made between non-traffi c associated distress and traffi c associated distress.
Traffi c associated distress is usually restricted to the wheel paths while non-traffi c-associated distress tends to occur over the full width of the road or occurs at the pavement edges and adjacent to culverts. As a loaded wheel moves over a road, the pavement surface defl ects downwards before returning to its original, or close to its original, position. This defl ection is a function of the magnitude of the load applied, and the stiffness of the pavement structure and subgrade. The performance of bituminous surfacings is often related to the defl ection in a pavement and shape of the defl ection bowl as repeated fl exing results in fatigue of the surfacing and subsequent development of cracking. This mode of distress is however only one aspect out of a complex combination of environment, material properties of each pavement layer and the manner in which the loading is being applied to the pavement structure. It is therefore not possible to only study aspects related to pavement defl ection, but rather to consider the broad range of mechanisms affecting pavement performance.
Non-traffi c associated distress tends to occur over the full width of the road or occurs at the pavement edges and adjacent to culverts. The cause of such dis-tress is usually directly caused by environmental effects such as movements due to temperature fl uctuations, shrinkage and swelling, or e.g. hardening of binders, material types, or combination of material types, being used in the pavement.
Table 3.2 indicates possible causes of traffi c-associated distress. Table 3.3 indi-cates possible causes of non-traffi c-associated distress
Tell-tale discolouration around cracks can be a good indication of previous pumping.
A favourable combination of material types with regards to resistance against shrinkage cracking is e.g. to use a granular material above a cemented layer in order to stop refl ection of inevitable cracks in the cemented layer.
Longitudinal cracking caused by volumetric (wetting and drying cycles) movements in the subgrade.
Severe block cracking.
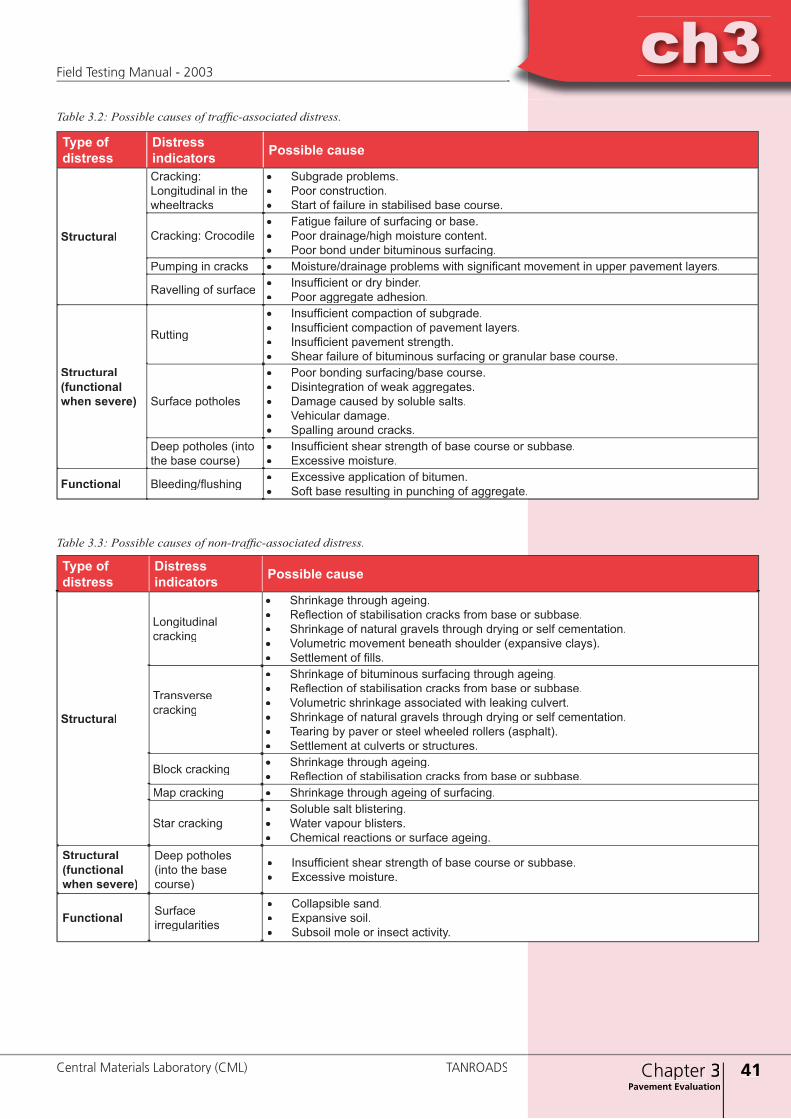
ch3
41Chapter 3Pavement Evaluation
ch3Field Testing Manual - 2003
Central Materials Laboratory (CML) TANROADS
Type of distress
Distress indicators Possible cause
Structural
Cracking: Longitudinal in the wheeltracks
• Subgrade problems. • Poor construction.• Start of failure in stabilised base course.
Cracking: Crocodile• Fatigue failure of surfacing or base. • Poor drainage/high moisture content. • Poor bond under bituminous surfacing.
Pumping in cracks • Moisture/drainage problems with signifi cant movement in upper pavement layers.
Ravelling of surface • Insuffi cient or dry binder.• Poor aggregate adhesion.
Structural (functional when severe)
Rutting
• Insuffi cient compaction of subgrade.• Insuffi cient compaction of pavement layers.• Insuffi cient pavement strength.• Shear failure of bituminous surfacing or granular base course.
Surface potholes
• Poor bonding surfacing/base course. • Disintegration of weak aggregates.• Damage caused by soluble salts.• Vehicular damage.• Spalling around cracks.
Deep potholes (into the base course)
• Insuffi cient shear strength of base course or subbase.• Excessive moisture.
Functional Bleeding/fl ushing • Excessive application of bitumen.• Soft base resulting in punching of aggregate.
Table 3.2: Possible causes of traffi c-associated distress.
Type of distress
Distress indicators Possible cause
Structural
Longitudinal cracking
• Shrinkage through ageing.• Refl ection of stabilisation cracks from base or subbase.• Shrinkage of natural gravels through drying or self cementation.• Volumetric movement beneath shoulder (expansive clays).• Settlement of fi lls.
Transverse cracking
• Shrinkage of bituminous surfacing through ageing.• Refl ection of stabilisation cracks from base or subbase.• Volumetric shrinkage associated with leaking culvert.• Shrinkage of natural gravels through drying or self cementation.• Tearing by paver or steel wheeled rollers (asphalt).• Settlement at culverts or structures.
Block cracking • Shrinkage through ageing.• Refl ection of stabilisation cracks from base or subbase.
Map cracking • Shrinkage through ageing of surfacing.
Star cracking• Soluble salt blistering.• Water vapour blisters.• Chemical reactions or surface ageing.
Structural (functional when severe)
Deep potholes (into the base course)
• Insuffi cient shear strength of base course or subbase.• Excessive moisture.
Functional Surface irregularities
• Collapsible sand.• Expansive soil.• Subsoil mole or insect activity.
Table 3.3: Possible causes of non-traffi c-associated distress.
42 Chapter 3Pavement Evaluation
ch3Field Testing Manual - 2003
TANROADS Central Materials Laboratory (CML)
ch33.2 Methodology3.2.1 Purpose of pavement evaluationGeneralThe purpose of pavement evaluation is to determine why the present condition prevails so that appropriate rehabilitation measures can be identifi ed, i.e. to provide the input for pavement rehabilitation designs. Before embarking on any pavement evaluation it is essential to understand its objective in each case, and to make use of evaluation techniques that will best achieve this objective. Plan-ning of pavement evaluations must be aimed at satisfying the requirements of the specifi c evaluation, which normally calls for a functional evaluation as well as a structural evaluation.
Functional evaluationFunctional evaluations identify the capability of the pavement structure to provide a comfortable and safe service to the road user. The primary parameters determined in functional evaluations are the riding quality, skid resistance and a visual evaluation of aspects such as potholes and edge break.
Structural evaluationStructural evaluations are carried out to determine whether the pavement will carry the traffi c it has been designed for and can be carried out at any time in the pavement’s life. The remaining structural capacity can be determined and compared with the traffi c that the pavement has carried, or is expected to carry, over the remainder of its life.
Structural evaluations involve the use of fi eld testing and detailed investiga-tions. Structural surveys may consist of pit excavations with associated labo-ratory testing, defl ection measurements and probing by e.g. Dynamic Cone Penetrometer (DCP).
Structural evaluations require an investigation of the strengths and thicknesses of the individual pavement layers as well as the overall interaction of the layers within the pavement structure. These evaluations may require testing of param-eters such as:● Probing with Dynamic Cone Penetrometer (DCP). ● Profi les or test pits.● Defl ection. ● Defl ection bowl parameters may give additional information to explain e.g.
the mode of distress when assessed together with layer thicknesses.
Visual evaluations of cracking, disintegration and potholing are necessary inputs for a structural evaluation. It is possible to obtain a preliminary indication of the possible causes of distress in a pavement from a simple visual evaluation.
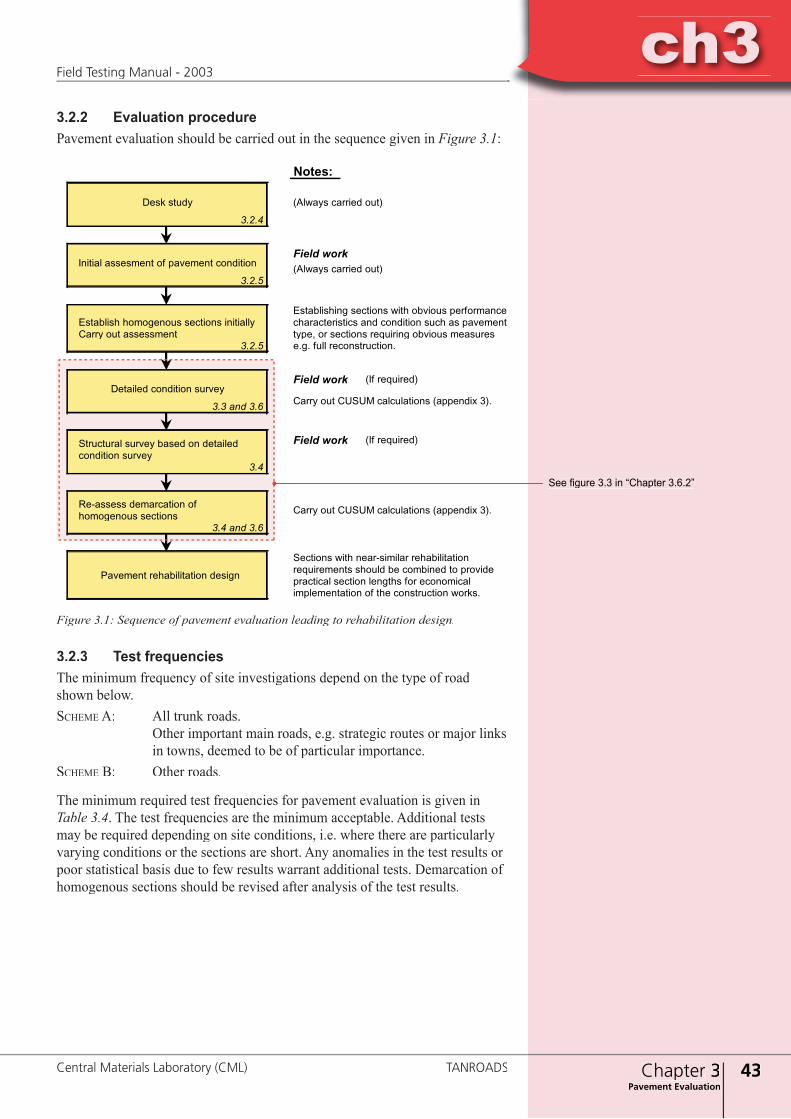
ch3
43Chapter 3Pavement Evaluation
ch3Field Testing Manual - 2003
Central Materials Laboratory (CML) TANROADS
������
�����
������� ������� ���������
������������ �������� ���� ������� �������������������� ���������� �������� ��������� ��������������� ��� ��������� ���� �� ������������� ��� ���������� ����� �� �������� ��������� ������� ��������
����� ���� ���� ���������������
��� ��� ���
���������� ������ ����� �� ����������������� ������
���
��������� ����������� ������������ ��������
��� ��� ���
�������� ���� ������������ �������������������������� ������ �� �������� �� ���������������� ������� ������� ��� ������������������������ �� ��� ������������ ������
���� ����� ������� ������� ����
����� ����������� ��������� �� �������� ���������
�������� ��������� ������
�������� �������������� ������
����� ��� ����� ������������ ��������� ���
����� ���� ��� ���������
����� ���� ��� ���������
����� ��� ����� ������������ ��������� ���
3.2.2 Evaluation procedurePavement evaluation should be carried out in the sequence given in Figure 3.1:
See fi gure 3.3 in “Chapter 3.6.2”
Figure 3.1: Sequence of pavement evaluation leading to rehabilitation design.
3.2.3 Test frequenciesThe minimum frequency of site investigations depend on the type of road shown below. SCHEME A: All trunk roads. Other important main roads, e.g. strategic routes or major links in towns, deemed to be of particular importance.SCHEME B: Other roads.
The minimum required test frequencies for pavement evaluation is given in Table 3.4. The test frequencies are the minimum acceptable. Additional tests may be required depending on site conditions, i.e. where there are particularly varying conditions or the sections are short. Any anomalies in the test results or poor statistical basis due to few results warrant additional tests. Demarcation of homogenous sections should be revised after analysis of the test results.

44 Chapter 3Pavement Evaluation
ch3Field Testing Manual - 2003
TANROADS Central Materials Laboratory (CML)
ch3
Test Min. test frequency (m)Scheme
AScheme
B
Detailed condition surveys
Rut depth measured both sides in outer wheel path only. 50 100Surface defects (visual evaluation)
Continuously measuredRoughness, IRI
Structural surveys
DCP, measured on the side with highest rutting values.500 1000
Minimum 3 per homogenous section
Maximum surface defl ection, measured on the side with highest rutting values, in outer wheel path only. 100 200
Test pits, excavated to design depths as defi ned in Chapter 5.3.3. 1000 2000
Table 3.4: Minimum required test frequencies for pavement evaluation.
3.2.4 Desk studyThe desk study comprises collection and processing of all relevant existing information that can be made available before going to the fi eld. Considerable amounts of information regarding road projects may be available from the road authorities (MOW/Tanroads), including:● Τhe original design, should however to be used with care as considerable
changes may have been made in the course of the implementation of the project.
● Αs-built records or completion data.● Ιnformation on traffi c and climate, preferably collected over many years.● Ρeports from previous investigations.● Μaintenance records and data in operational road management systems.
Other information such as the climatic records over the life of the road can be obtained from the relevant source and provide important information for plan-ning of the most effective evaluation procedure.
3.2.5 Initial assessmentThe initial assessment involves visual inspections on site, seen in conjunction with information from the desk study, for the purpose of establishing sections with obvious performance characteristics and condition. No comprehensive fi eld testing programme shall be commissioned without completion of the initial assessment. This stage is important for an optimal fi eld programme to be estab-lished, and to prevent waste of resources on e.g. carrying out comprehensive tests on sections of road where the pavement cannot be salvaged and therefore requires investigations with the view of designing and constructing a new pave-ment.● For pavement management data collection: from a moving vehicle (usu-
ally not exceeding 20 km/h) with periodic stops to get information that is more detailed.
● For pavement evaluation purposes for rehabilitation design: at walking pace.
The variability of the pavement structure and condition as well as the length of the project will normally dictate the number of sample/ readings - short projects will need more observations per kilometre on average than long projects.
ch3
45Chapter 3Pavement Evaluation
ch3Field Testing Manual - 2003
Central Materials Laboratory (CML) TANROADS
3.3 Detailed condition surveys3.3.1 GeneralDetailed condition surveys involve work to establish the surface characteris-tics of the exiting pavement and all other information that can be gathered by visual inspection and measurements on the surface, but not involving structural surveys such as defl ection measurements, DCP and trial pits.
Typically, pavement conditions surveys include observation and recording of the parameters listed in Table 3.5.
Table 3.5: Data obtained in the detailed conditions survey.
The parameters in Table 3.5 can be grouped into the following categories that practically are being measured or observed at the same time or with similar types of resources.● Visual evaluation.● Rut depth measurements.● Roughness measurements.
Reference pointsIt is of utmost importance to tie in the measured data with fi xed physical features along the road, as there is likely to be a difference between vehicle distance and project road distance. Established chainages may also be changed over time, rendering measured data unusable due to lack of reference. Any dif-ference in reference points should be accommodated during data processing to ensure all fi eld data can be directly correlated to fi xed fi eld features.
3.3.2 Condition rating and reportingThe condition rating for a section shall be reported in a standardised form in ac-cordance with threshold values given for each type of distress and for two traffi c loading categories respectively:● TLC 1 and lower.● TLC 3 and higher.
This means in practice traffi c loading lower or higher than 1 million E80s over the design period. Ref. Pavement and Materials Design Manual-1999.
The ratings are reported as:Sound: Adequate conditionWarning: Uncertainty exists about the adequacy of the conditionSevere: Inadequate condition
Parameters to be rated against criteria in the Pavement and Materials Design Manual-1999 Other important observations
Rutting (measurements) Pumping in cracks (visual evaluation)Potholing / failures (visual evaluation) Deformation (visual evaluation)Cracking (visual evaluation/measure) Edge-break (visual evaluation)Ravelling (visual evaluation) Bleeding (fl ushing) (visual evaluation)Patching (visual evaluation) Surfacing condition (visual evaluation)Roughness (measurements) Drainage (visual evaluation)
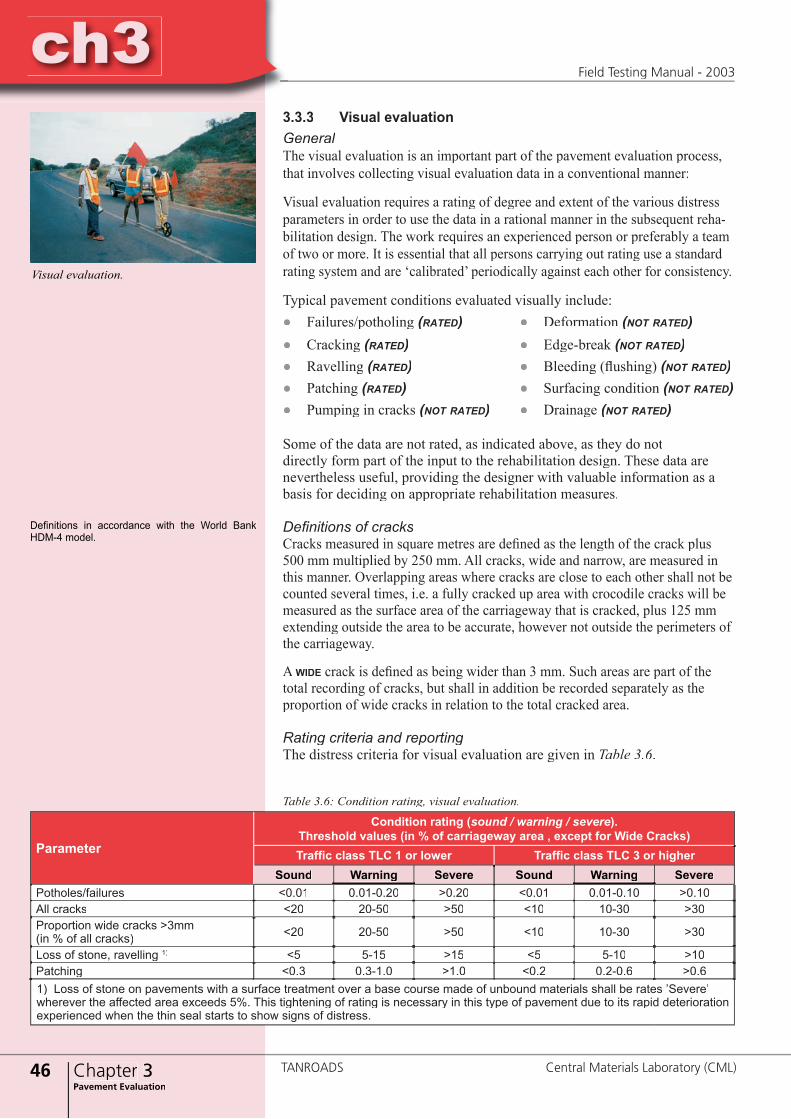
46 Chapter 3Pavement Evaluation
ch3Field Testing Manual - 2003
TANROADS Central Materials Laboratory (CML)
ch33.3.3 Visual evaluationGeneralThe visual evaluation is an important part of the pavement evaluation process, that involves collecting visual evaluation data in a conventional manner:
Visual evaluation requires a rating of degree and extent of the various distress parameters in order to use the data in a rational manner in the subsequent reha-bilitation design. The work requires an experienced person or preferably a team of two or more. It is essential that all persons carrying out rating use a standard rating system and are ‘calibrated’ periodically against each other for consistency.
Typical pavement conditions evaluated visually include:● Failures/potholing (RATED) ● Deformation (NOT RATED)● Cracking (RATED) ● Edge-break (NOT RATED)● Ravelling (RATED) ● Bleeding (fl ushing) (NOT RATED)● Patching (RATED) ● Surfacing condition (NOT RATED)● Pumping in cracks (NOT RATED) ● Drainage (NOT RATED)
Some of the data are not rated, as indicated above, as they do not directly form part of the input to the rehabilitation design. These data are nevertheless useful, providing the designer with valuable information as a basis for deciding on appropriate rehabilitation measures.
Defi nitions of cracksCracks measured in square metres are defi ned as the length of the crack plus 500 mm multiplied by 250 mm. All cracks, wide and narrow, are measured in this manner. Overlapping areas where cracks are close to each other shall not be counted several times, i.e. a fully cracked up area with crocodile cracks will be measured as the surface area of the carriageway that is cracked, plus 125 mm extending outside the area to be accurate, however not outside the perimeters of the carriageway.
A WIDE crack is defi ned as being wider than 3 mm. Such areas are part of the total recording of cracks, but shall in addition be recorded separately as the proportion of wide cracks in relation to the total cracked area.
Rating criteria and reportingThe distress criteria for visual evaluation are given in Table 3.6.
Table 3.6: Condition rating, visual evaluation.
Parameter
Condition rating (sound / warning / severe).Threshold values (in % of carriageway area , except for Wide Cracks)Traffi c class TLC 1 or lower Traffi c class TLC 3 or higher
Sound Warning Severe Sound Warning SeverePotholes/failures <0.01 0.01-0.20 >0.20 <0.01 0.01-0.10 >0.10All cracks <20 20-50 >50 <10 10-30 >30Proportion wide cracks >3mm (in % of all cracks) <20 20-50 >50 <10 10-30 >30
Loss of stone, ravelling 1) <5 5-15 >15 <5 5-10 >10Patching <0.3 0.3-1.0 >1.0 <0.2 0.2-0.6 >0.61) Loss of stone on pavements with a surface treatment over a base course made of unbound materials shall be rates ’Severe’ wherever the affected area exceeds 5%. This tightening of rating is necessary in this type of pavement due to its rapid deterioration experienced when the thin seal starts to show signs of distress.
Defi nitions in accordance with the World Bank HDM-4 model.
Visual evaluation.
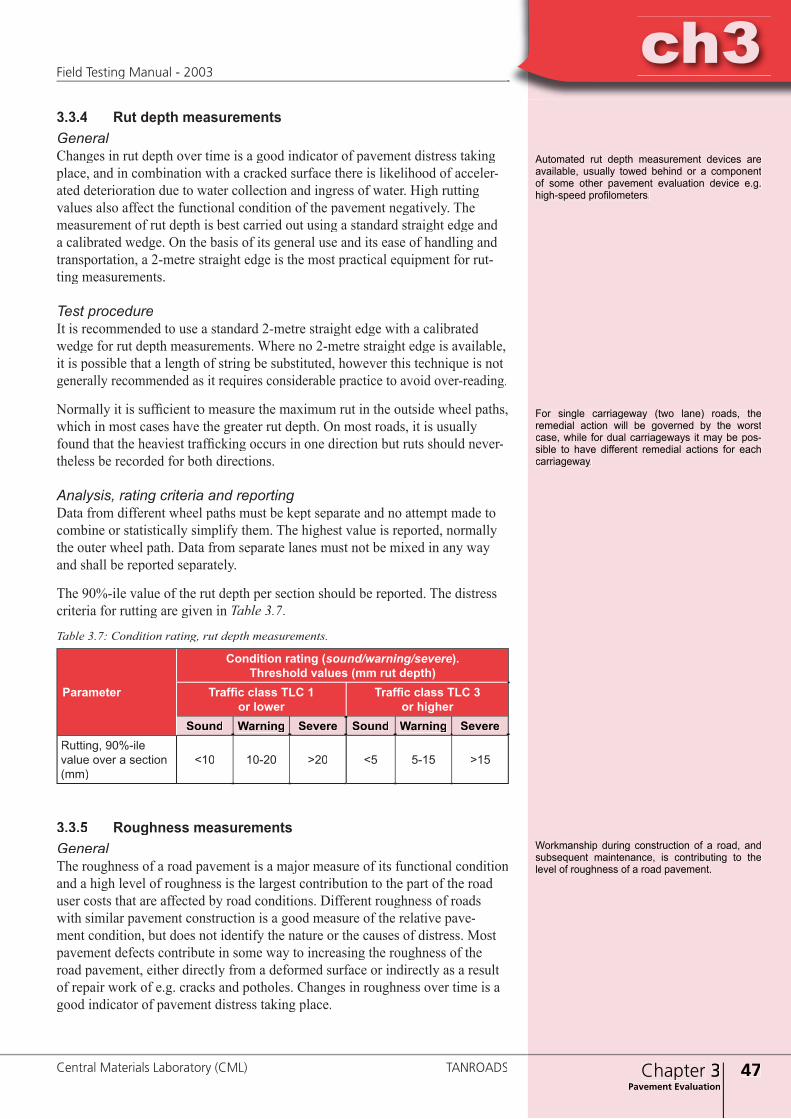
ch3
47Chapter 3Pavement Evaluation
ch3Field Testing Manual - 2003
Central Materials Laboratory (CML) TANROADS
Automated rut depth measurement devices are available, usually towed behind or a component of some other pavement evaluation device e.g. high-speed profi lometers.
3.3.4 Rut depth measurements GeneralChanges in rut depth over time is a good indicator of pavement distress taking place, and in combination with a cracked surface there is likelihood of acceler-ated deterioration due to water collection and ingress of water. High rutting values also affect the functional condition of the pavement negatively. The measurement of rut depth is best carried out using a standard straight edge and a calibrated wedge. On the basis of its general use and its ease of handling and transportation, a 2-metre straight edge is the most practical equipment for rut-ting measurements.
Test procedureIt is recommended to use a standard 2-metre straight edge with a calibrated wedge for rut depth measurements. Where no 2-metre straight edge is available, it is possible that a length of string be substituted, however this technique is not generally recommended as it requires considerable practice to avoid over-reading.
Normally it is suffi cient to measure the maximum rut in the outside wheel paths, which in most cases have the greater rut depth. On most roads, it is usually found that the heaviest traffi cking occurs in one direction but ruts should never-theless be recorded for both directions.
Analysis, rating criteria and reportingData from different wheel paths must be kept separate and no attempt made to combine or statistically simplify them. The highest value is reported, normally the outer wheel path. Data from separate lanes must not be mixed in any way and shall be reported separately.
The 90%-ile value of the rut depth per section should be reported. The distress criteria for rutting are given in Table 3.7.
Table 3.7: Condition rating, rut depth measurements.
3.3.5 Roughness measurementsGeneralThe roughness of a road pavement is a major measure of its functional condition and a high level of roughness is the largest contribution to the part of the road user costs that are affected by road conditions. Different roughness of roads with similar pavement construction is a good measure of the relative pave-ment condition, but does not identify the nature or the causes of distress. Most pavement defects contribute in some way to increasing the roughness of the road pavement, either directly from a deformed surface or indirectly as a result of repair work of e.g. cracks and potholes. Changes in roughness over time is a good indicator of pavement distress taking place.
Parameter
Condition rating (sound/warning/severe).Threshold values (mm rut depth)
Traffi c class TLC 1 or lower
Traffi c class TLC 3 or higher
Sound Warning Severe Sound Warning SevereRutting, 90%-ile value over a section (mm)
<10 10-20 >20 <5 5-15 >15
Workmanship during construction of a road, and subsequent maintenance, is contributing to the level of roughness of a road pavement.
For single carriageway (two lane) roads, the remedial action will be governed by the worst case, while for dual carriageways it may be pos-sible to have different remedial actions for each carriageway.

48 Chapter 3Pavement Evaluation
ch3Field Testing Manual - 2003
TANROADS Central Materials Laboratory (CML)
ch3Equipment typesThe following types of equipment are use for roughness measurements:● Measurement of surface geometry, e.g. MERLIN.● High speed equipment operating on vehicle motion, e.g. Bump Integrator.● High speed equipment for measurement of surface geometry operating with
laser or ultrasound.
All alternative equipment shall be calibrated against the MERLIN.
MERLINThe MERLIN is a simple equipment for measuring surface roughness by manu-al methods, providing reliable data without input of expensive technology, albeit at a rather low output. The MERLIN should be used for research and monitor-ing purposes, or routine evaluations of short pavement sections, preferably less than 20 km. The equipment can be maintained - and even manufactured - from readily available materials using moderately skilled artisans. The time and effort required for longer sections will normally make high speed devices more cost effective and practical.
Before use, the MERLIN shall be calibrated using a standard piece of steel, 6 mm thick placed under the measuring foot on a fl at surface (fl oor). Further detail on the procedure is given in Appendix 4.
Analysis, rating criteria and reportingData from different wheel paths must be kept separate and no attempt made to combine or statistically simplify them. The highest value is reported, normally the outer wheel path. Data from separate lanes must not be mixed in any way and shall be reported separately.
The roughness measurement unit shall be reported as the International Rough-ness Index (IRI) in metres per km over each section. The distress criteria for roughness measurements are given in Table 3.8.
Table 3.8: Condition rating, roughness measurements.
Own established chainage needs to be tied to fi xed features such as culverts, for suf-fi ciently secure identifi cation of the site.
Calibration of MERLIN.
Parameter
Condition rating (sound/warning/severe).Threshold values ( IRI value m/km )
All traffi c classes Sound Warning Severe
Roughness, IRI <3 3-6 >6
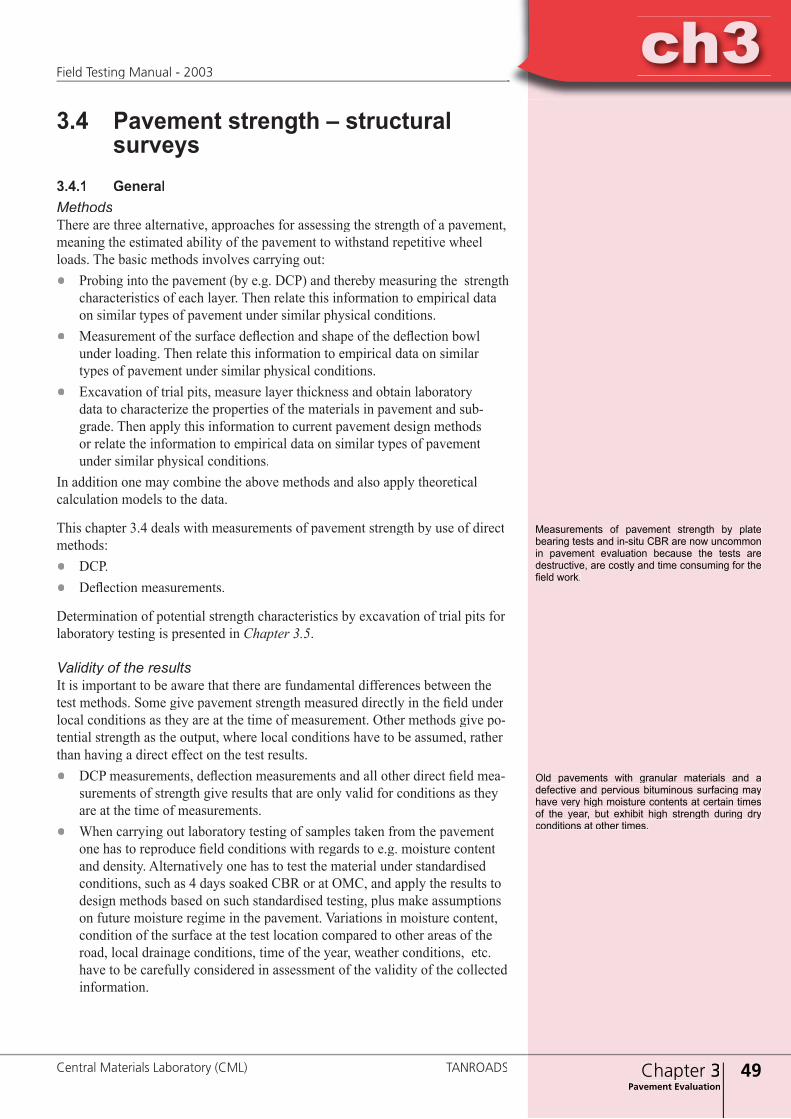
ch3
49Chapter 3Pavement Evaluation
ch3Field Testing Manual - 2003
Central Materials Laboratory (CML) TANROADS
3.4 Pavement strength – structural surveys3.4.1 GeneralMethodsThere are three alternative, approaches for assessing the strength of a pavement, meaning the estimated ability of the pavement to withstand repetitive wheel loads. The basic methods involves carrying out:● Probing into the pavement (by e.g. DCP) and thereby measuring the strength
characteristics of each layer. Then relate this information to empirical data on similar types of pavement under similar physical conditions.
● Measurement of the surface defl ection and shape of the defl ection bowl under loading. Then relate this information to empirical data on similar types of pavement under similar physical conditions.
● Excavation of trial pits, measure layer thickness and obtain laboratory data to characterize the properties of the materials in pavement and sub-grade. Then apply this information to current pavement design methods or relate the information to empirical data on similar types of pavement under similar physical conditions.
In addition one may combine the above methods and also apply theoretical calculation models to the data.
This chapter 3.4 deals with measurements of pavement strength by use of direct methods:● DCP.● Defl ection measurements.
Determination of potential strength characteristics by excavation of trial pits for laboratory testing is presented in Chapter 3.5.
Validity of the resultsIt is important to be aware that there are fundamental differences between the test methods. Some give pavement strength measured directly in the fi eld under local conditions as they are at the time of measurement. Other methods give po-tential strength as the output, where local conditions have to be assumed, rather than having a direct effect on the test results.● DCP measurements, defl ection measurements and all other direct fi eld mea-
surements of strength give results that are only valid for conditions as they are at the time of measurements.
● When carrying out laboratory testing of samples taken from the pavement one has to reproduce fi eld conditions with regards to e.g. moisture content and density. Alternatively one has to test the material under standardised conditions, such as 4 days soaked CBR or at OMC, and apply the results todesign methods based on such standardised testing, plus make assumptions on future moisture regime in the pavement. Variations in moisture content, condition of the surface at the test location compared to other areas of the road, local drainage conditions, time of the year, weather conditions, etc. have to be carefully considered in assessment of the validity of the collected information.
Measurements of pavement strength by plate bearing tests and in-situ CBR are now uncommon in pavement evaluation because the tests are destructive, are costly and time consuming for the fi eld work.
Old pavements with granular materials and a defective and pervious bituminous surfacing may have very high moisture contents at certain times of the year, but exhibit high strength during dry conditions at other times.
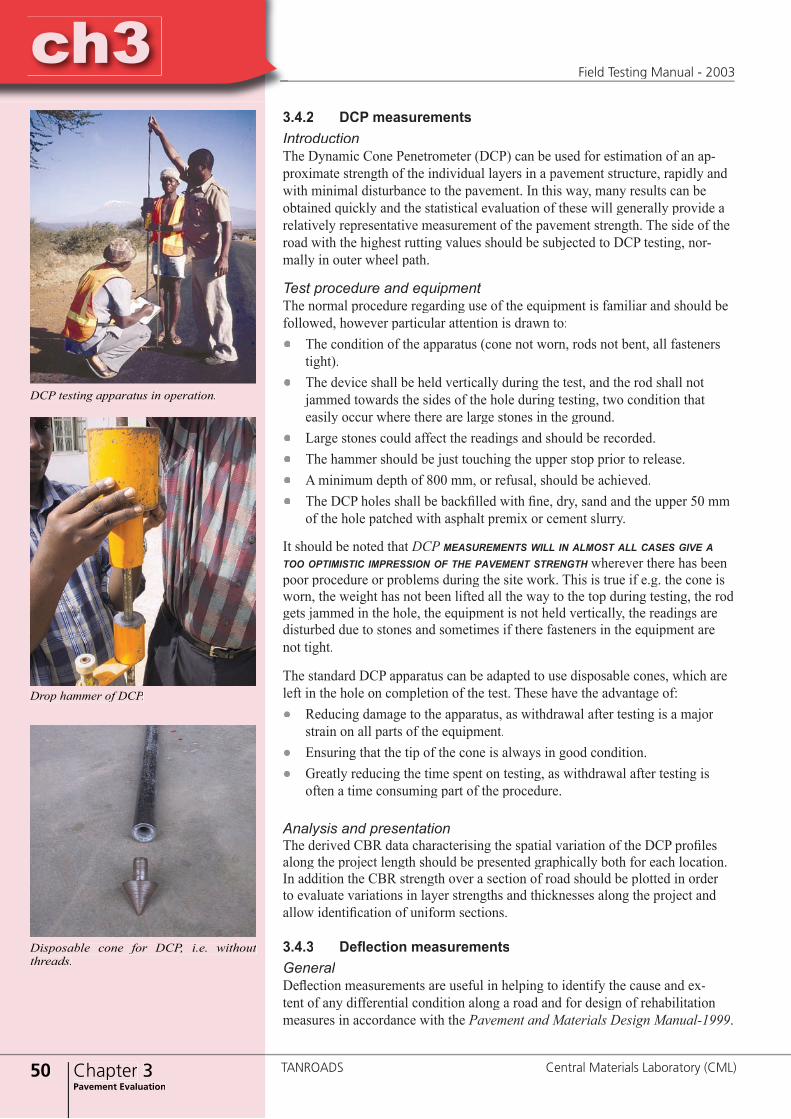
50 Chapter 3Pavement Evaluation
ch3Field Testing Manual - 2003
TANROADS Central Materials Laboratory (CML)
ch33.4.2 DCP measurementsIntroductionThe Dynamic Cone Penetrometer (DCP) can be used for estimation of an ap-proximate strength of the individual layers in a pavement structure, rapidly and with minimal disturbance to the pavement. In this way, many results can be obtained quickly and the statistical evaluation of these will generally provide a relatively representative measurement of the pavement strength. The side of the road with the highest rutting values should be subjected to DCP testing, nor-mally in outer wheel path.
Test procedure and equipmentThe normal procedure regarding use of the equipment is familiar and should be followed, however particular attention is drawn to:● Τhe condition of the apparatus (cone not worn, rods not bent, all fasteners
tight).● Τhe device shall be held vertically during the test, and the rod shall not
jammed towards the sides of the hole during testing, two condition that easily occur where there are large stones in the ground.
● Large stones could affect the readings and should be recorded.● The hammer should be just touching the upper stop prior to release. ● A minimum depth of 800 mm, or refusal, should be achieved.● The DCP holes shall be backfi lled with fi ne, dry, sand and the upper 50 mm
of the hole patched with asphalt premix or cement slurry.
It should be noted that DCP MEASUREMENTS WILL IN ALMOST ALL CASES GIVE A TOO OPTIMISTIC IMPRESSION OF THE PAVEMENT STRENGTH wherever there has been TOO OPTIMISTIC IMPRESSION OF THE PAVEMENT STRENGTH wherever there has been TOO OPTIMISTIC IMPRESSION OF THE PAVEMENT STRENGTHpoor procedure or problems during the site work. This is true if e.g. the cone is worn, the weight has not been lifted all the way to the top during testing, the rod gets jammed in the hole, the equipment is not held vertically, the readings are disturbed due to stones and sometimes if there fasteners in the equipment are not tight.
The standard DCP apparatus can be adapted to use disposable cones, which are left in the hole on completion of the test. These have the advantage of:● Reducing damage to the apparatus, as withdrawal after testing is a major
strain on all parts of the equipment.● Ensuring that the tip of the cone is always in good condition.● Greatly reducing the time spent on testing, as withdrawal after testing is
often a time consuming part of the procedure.
Analysis and presentationThe derived CBR data characterising the spatial variation of the DCP profi les along the project length should be presented graphically both for each location. In addition the CBR strength over a section of road should be plotted in order to evaluate variations in layer strengths and thicknesses along the project and allow identifi cation of uniform sections.
3.4.3 Defl ection measurementsGeneralDefl ection measurements are useful in helping to identify the cause and ex-tent of any differential condition along a road and for design of rehabilitation measures in accordance with the Pavement and Materials Design Manual-1999.
Disposable cone for DCP, i.e. without threads.
Drop hammer of DCP.
DCP testing apparatus in operation.
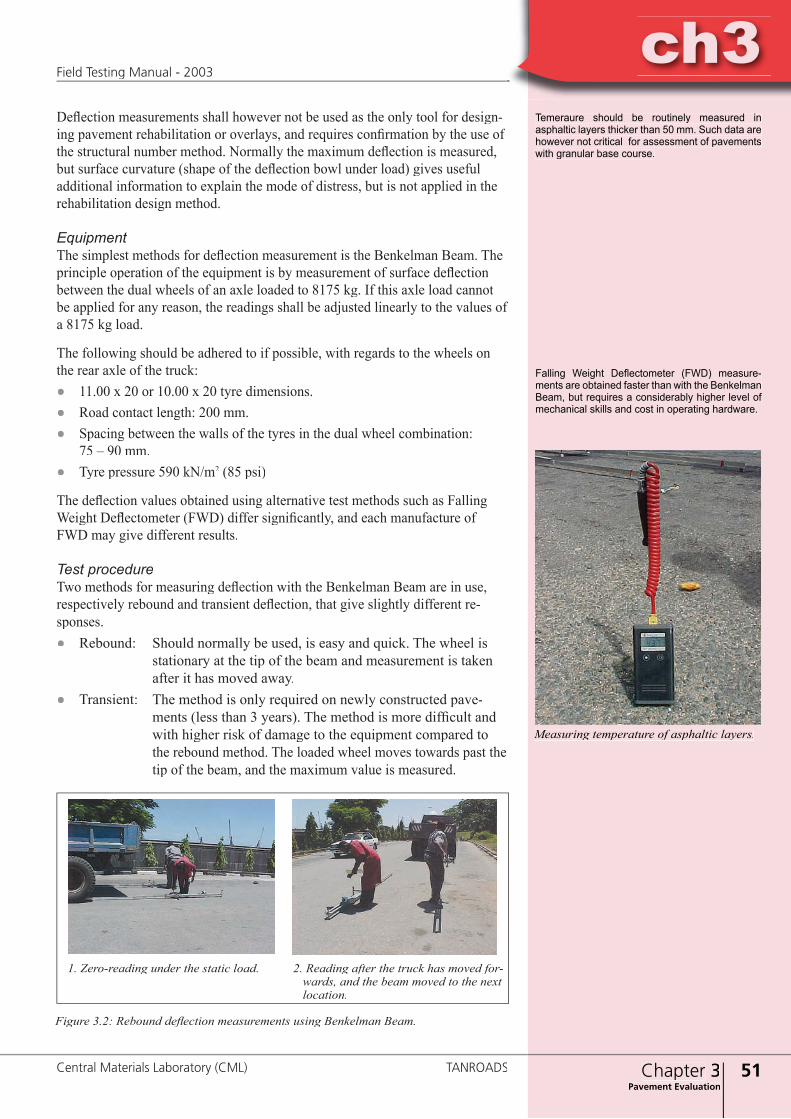
ch3
51Chapter 3Pavement Evaluation
ch3Field Testing Manual - 2003
Central Materials Laboratory (CML) TANROADS
Defl ection measurements shall however not be used as the only tool for design-ing pavement rehabilitation or overlays, and requires confi rmation by the use of the structural number method. Normally the maximum defl ection is measured, but surface curvature (shape of the defl ection bowl under load) gives useful additional information to explain the mode of distress, but is not applied in the rehabilitation design method.
EquipmentThe simplest methods for defl ection measurement is the Benkelman Beam. The principle operation of the equipment is by measurement of surface defl ection between the dual wheels of an axle loaded to 8175 kg. If this axle load cannot be applied for any reason, the readings shall be adjusted linearly to the values of a 8175 kg load.
The following should be adhered to if possible, with regards to the wheels on the rear axle of the truck:● 11.00 x 20 or 10.00 x 20 tyre dimensions.● Road contact length: 200 mm.● Spacing between the walls of the tyres in the dual wheel combination:
75 – 90 mm.● Tyre pressure 590 kN/m2 (85 psi)
The defl ection values obtained using alternative test methods such as Falling Weight Defl ectometer (FWD) differ signifi cantly, and each manufacture of FWD may give different results.
Test procedureTwo methods for measuring defl ection with the Benkelman Beam are in use, respectively rebound and transient defl ection, that give slightly different re-sponses.● Rebound: Should normally be used, is easy and quick. The wheel is stationary at the tip of the beam and measurement is taken after it has moved away.● Transient: The method is only required on newly constructed pave- ments (less than 3 years). The method is more diffi cult and with higher risk of damage to the equipment compared to the rebound method. The loaded wheel moves towards past the tip of the beam, and the maximum value is measured.
Falling Weight Defl ectometer (FWD) measure-ments are obtained faster than with the Benkelman Beam, but requires a considerably higher level of mechanical skills and cost in operating hardware.
1. Zero-reading under the static load. 2. Reading after the truck has moved for- wards, and the beam moved to the next location.
Figure 3.2: Rebound defl ection measurements using Benkelman Beam.
Measuring temperature of asphaltic layers.
Temeraure should be routinely measured in asphaltic layers thicker than 50 mm. Such data are however not critical for assessment of pavements with granular base course.
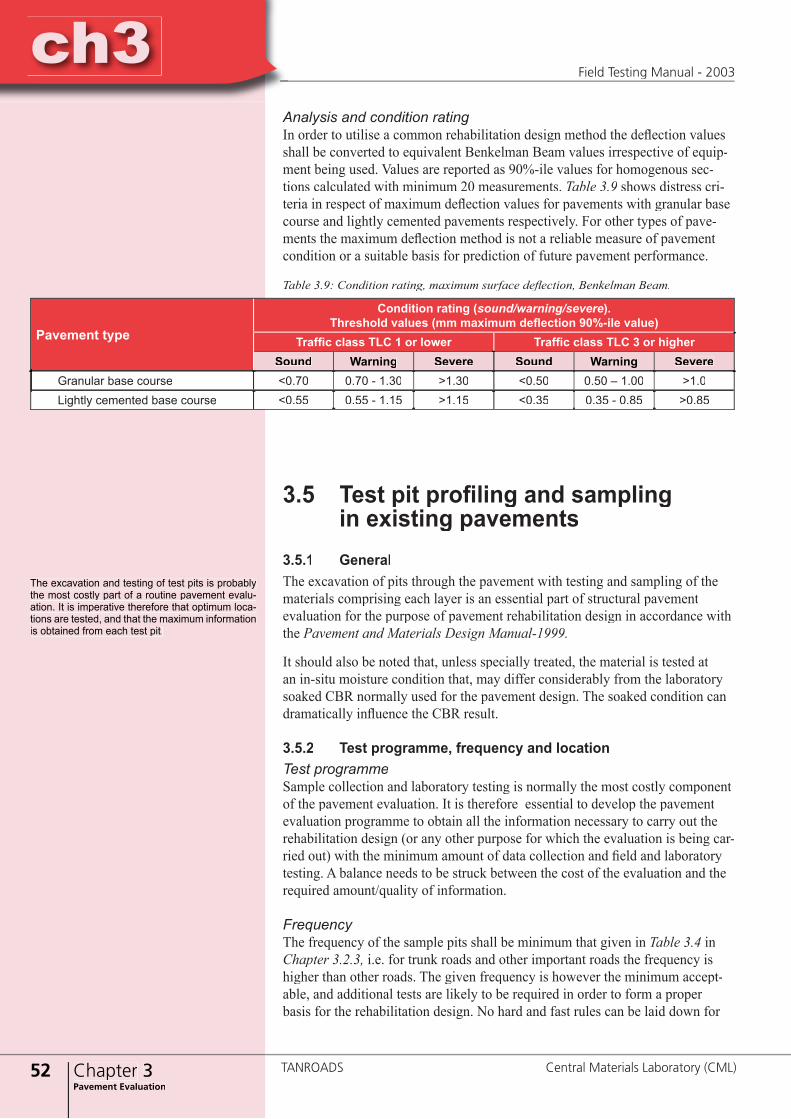
52 Chapter 3Pavement Evaluation
ch3Field Testing Manual - 2003
TANROADS Central Materials Laboratory (CML)
ch3Analysis and condition ratingIn order to utilise a common rehabilitation design method the defl ection values shall be converted to equivalent Benkelman Beam values irrespective of equip-ment being used. Values are reported as 90%-ile values for homogenous sec-tions calculated with minimum 20 measurements. Table 3.9 shows distress cri-teria in respect of maximum defl ection values for pavements with granular base course and lightly cemented pavements respectively. For other types of pave-ments the maximum defl ection method is not a reliable measure of pavement condition or a suitable basis for prediction of future pavement performance.
Table 3.9: Condition rating, maximum surface defl ection, Benkelman Beam.
Pavement type
Condition rating (sound/warning/severe).Threshold values (mm maximum defl ection 90%-ile value)
Traffi c class TLC 1 or lower Traffi c class TLC 3 or higherSound Warning Severe Sound Warning Severe
Granular base course <0.70 0.70 - 1.30 >1.30 <0.50 0.50 – 1.00 >1.0Lightly cemented base course <0.55 0.55 - 1.15 >1.15 <0.35 0.35 - 0.85 >0.85
3.5 Test pit profi ling and sampling in existing pavements3.5.1 GeneralThe excavation of pits through the pavement with testing and sampling of the materials comprising each layer is an essential part of structural pavement evaluation for the purpose of pavement rehabilitation design in accordance with the Pavement and Materials Design Manual-1999.
It should also be noted that, unless specially treated, the material is tested at an in-situ moisture condition that, may differ considerably from the laboratory soaked CBR normally used for the pavement design. The soaked condition can dramatically infl uence the CBR result.
3.5.2 Test programme, frequency and locationTest programmeSample collection and laboratory testing is normally the most costly component of the pavement evaluation. It is therefore essential to develop the pavement evaluation programme to obtain all the information necessary to carry out the rehabilitation design (or any other purpose for which the evaluation is being car-ried out) with the minimum amount of data collection and fi eld and laboratory testing. A balance needs to be struck between the cost of the evaluation and the required amount/quality of information.
FrequencyThe frequency of the sample pits shall be minimum that given in Table 3.4 in Chapter 3.2.3, i.e. for trunk roads and other important roads the frequency is higher than other roads. The given frequency is however the minimum accept-able, and additional tests are likely to be required in order to form a proper basis for the rehabilitation design. No hard and fast rules can be laid down for
The excavation and testing of test pits is probably the most costly part of a routine pavement evalu-ation. It is imperative therefore that optimum loca-tions are tested, and that the maximum information is obtained from each test pit.
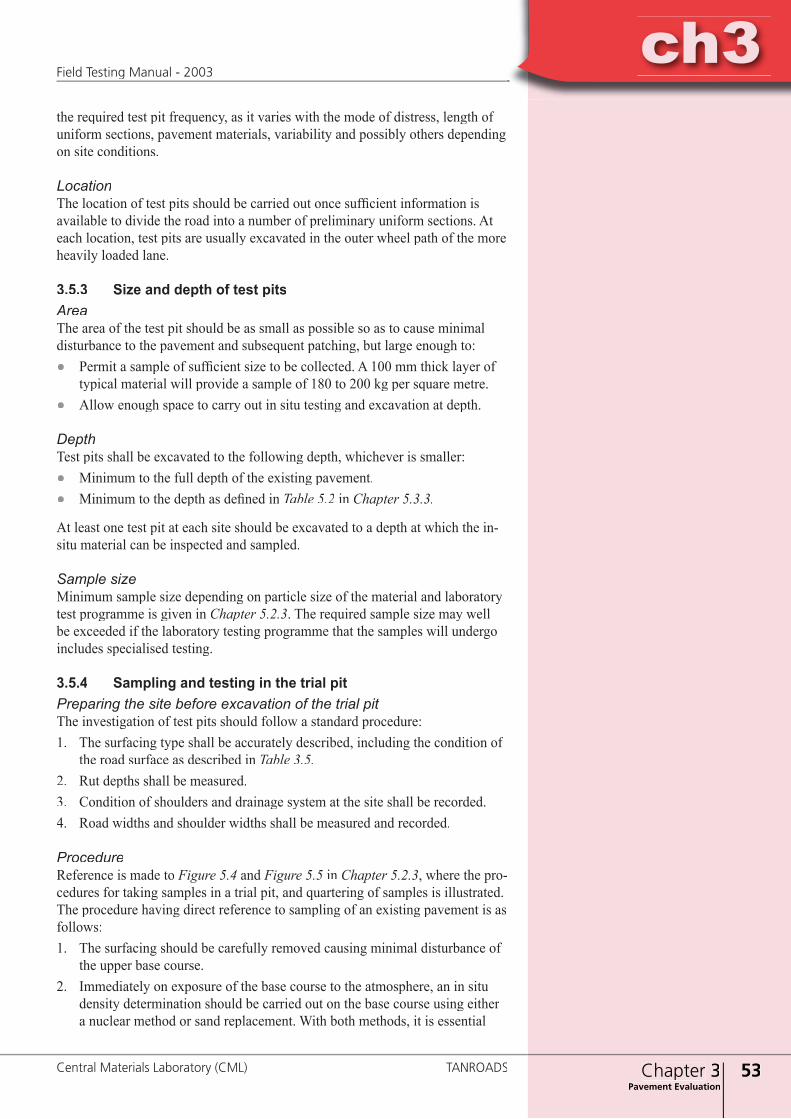
ch3
53Chapter 3Pavement Evaluation
ch3Field Testing Manual - 2003
Central Materials Laboratory (CML) TANROADS
the required test pit frequency, as it varies with the mode of distress, length of uniform sections, pavement materials, variability and possibly others depending on site conditions.
LocationThe location of test pits should be carried out once suffi cient information is available to divide the road into a number of preliminary uniform sections. At each location, test pits are usually excavated in the outer wheel path of the more heavily loaded lane.
3.5.3 Size and depth of test pitsAreaThe area of the test pit should be as small as possible so as to cause minimal disturbance to the pavement and subsequent patching, but large enough to: ● Permit a sample of suffi cient size to be collected. A 100 mm thick layer of
typical material will provide a sample of 180 to 200 kg per square metre. ● Αllow enough space to carry out in situ testing and excavation at depth.
Depth Test pits shall be excavated to the following depth, whichever is smaller:● Μinimum to the full depth of the existing pavement.● Μinimum to the depth as defi ned in Table 5.2 in Chapter 5.3.3.
At least one test pit at each site should be excavated to a depth at which the in-situ material can be inspected and sampled.
Sample size Minimum sample size depending on particle size of the material and laboratory test programme is given in Chapter 5.2.3. The required sample size may well be exceeded if the laboratory testing programme that the samples will undergo includes specialised testing.
3.5.4 Sampling and testing in the trial pitPreparing the site before excavation of the trial pitThe investigation of test pits should follow a standard procedure:1. The surfacing type shall be accurately described, including the condition of
the road surface as described in Table 3.5.2. Rut depths shall be measured.3. Condition of shoulders and drainage system at the site shall be recorded. 4. Road widths and shoulder widths shall be measured and recorded.
ProcedureReference is made to Figure 5.4 and Figure 5.5 in Chapter 5.2.3, where the pro-cedures for taking samples in a trial pit, and quartering of samples is illustrated. The procedure having direct reference to sampling of an existing pavement is as follows:1. The surfacing should be carefully removed causing minimal disturbance of
the upper base course.2. Immediately on exposure of the base course to the atmosphere, an in situ
density determination should be carried out on the base course using either a nuclear method or sand replacement. With both methods, it is essential
54 Chapter 3Pavement Evaluation
ch3Field Testing Manual - 2003
TANROADS Central Materials Laboratory (CML)
ch3to obtain samples for accurate gravimetric moisture content determinations. These samples should be at least one kilogram in mass and should be oven dried to constant mass. All dry densities should be calculated using the gravimetric moisture content and not the nuclear moisture contents.
3. Once the density of the base has been determined, the material should be loosened and sampled with suffi cient material being collected for the laboratory testing envisaged.
4. The test pit should then be carefully trimmed and cleaned until the next layer is exposed. If the materials in the two layers differ signifi cantly, it is easy to prepare a suitable surface on the next layer for density testing. If the material comprising the underlying layer is similar to the base, diffi culty is sometimes experienced in locating the top of the underlying layer. Well-defi ned compaction planes are, however, commonly observed.
5. Each pavement layer should then be tested and sampled in turn until the required depth is reached.
6. Test pits should be carefully reinstated with materials of at least similar quality to those removed, compacted well in layers as appropriate, and the hole sealed with cold-mix asphalt or other appropriate methods for surfac-ing as required.
During sampling of test pits a summary of all samples collected with their depth and description should be made. This can be included on the soil profi le descrip-tion form. The samples removed from the test pits should be carefully bagged and labelled prior to submitting to the laboratory for appropriate testing.
3.5.5 Description and logging of the soil profi le, analysis and presentationThe seal removed from the trial pit should be closely inspected and descriptions of the bituminous surfacing (type of surfacing, binder condition, adhesion to the base and to chippings, prime penetration depth, etc.) recorded.
Once the pit has been tested and sampled, one “wall” of it should be scraped clean with a spade and the pavement profi le described and measured. The de-scription should follow the method after Brink and Jennings as shown in Appendix 2. Graphic illustrations of the pit profi les, including depths and mate-rial descriptions, must be provided.
The condition and shapes of the layer interfaces should be examined to deter-mine the layer from where rutting and failure originates.
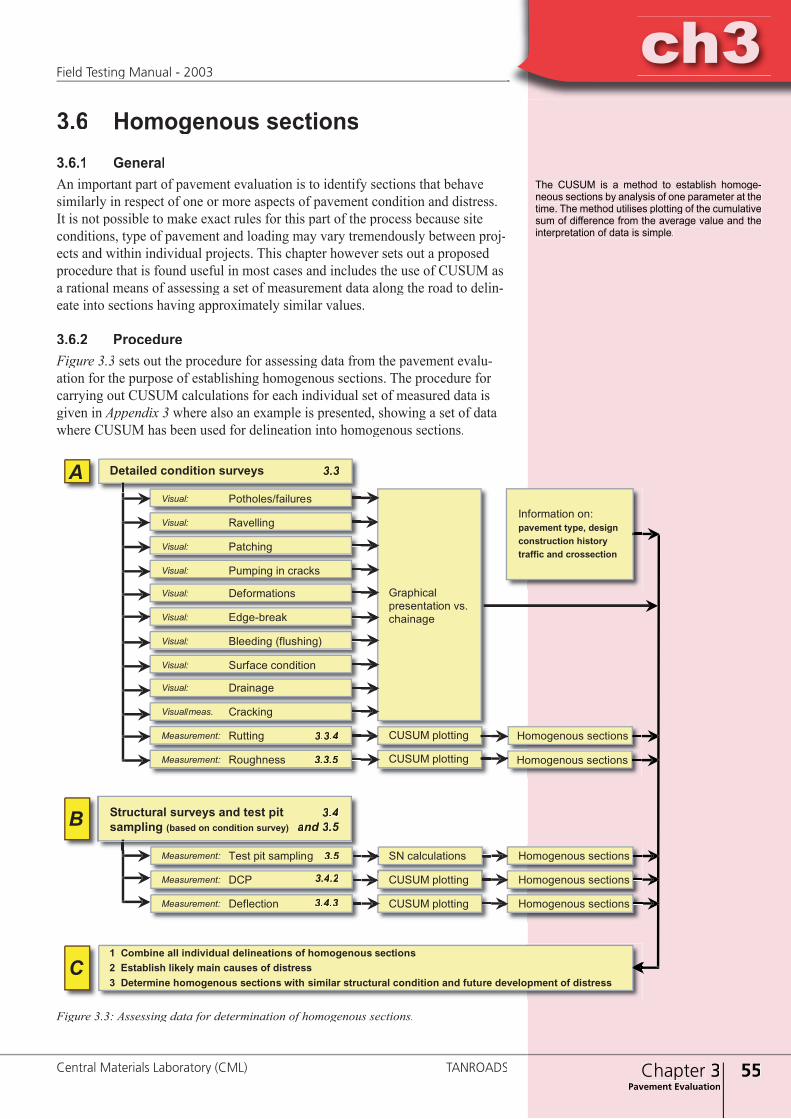
ch3
55Chapter 3Pavement Evaluation
ch3Field Testing Manual - 2003
Central Materials Laboratory (CML) TANROADS
3.6 Homogenous sections3.6.1 GeneralAn important part of pavement evaluation is to identify sections that behave similarly in respect of one or more aspects of pavement condition and distress. It is not possible to make exact rules for this part of the process because site conditions, type of pavement and loading may vary tremendously between proj-ects and within individual projects. This chapter however sets out a proposed procedure that is found useful in most cases and includes the use of CUSUM as a rational means of assessing a set of measurement data along the road to delin-eate into sections having approximately similar values.
3.6.2 ProcedureFigure 3.3 sets out the procedure for assessing data from the pavement evalu-ation for the purpose of establishing homogenous sections. The procedure for carrying out CUSUM calculations for each individual set of measured data is given in Appendix 3 where also an example is presented, showing a set of data where CUSUM has been used for delineation into homogenous sections.
The CUSUM is a method to establish homoge-neous sections by analysis of one parameter at the time. The method utilises plotting of the cumulative sum of difference from the average value and the interpretation of data is simple.
Figure 3.3: Assessing data for determination of homogenous sections.
�������� �����������������
����������� ����������� ����� ������������������ �������������� ��� �����������
������� ���������
������� ��������
������� ������� �� ������
��������������������� �����������
������� ������������
������� ����������
������� �������� ����������
������� ������� ���������
������� ��������
������������ ��������
������������ ������� ����� ��������
����� ��������
���������� ��������
���������� �������������������� ���������
������������ ���� ��� �������� �� ������������ ���������� ��������
������������ ��� ����� �������� ���������� ��������
������������ ���������� ����� �������� ���������� ��������
� ������� ��� ���������� ������������ �� ���������� ��������� ��������� ������ ���� ������ �� ��������� ��������� ���������� �������� ���� ������� ���������� ��������� ��� ������ ����������� �� ��������
�
�
�������� ��������� �������
���������� ������� ��� ���� ����������� ������ �� ��������� �������
�����
���
�����
�����
������ ���
���
�����

56 Chapter 3Pavement Evaluation
ch3Field Testing Manual - 2003
TANROADS Central Materials Laboratory (CML)
ch4
ch3
57Chapter 4Axel Load Surveys
ch4Field Testing Manual - 2003
Central Materials Laboratory (CML) TANROADS
4.1 Introduction......................................................................................... 584.2 Resources for axle load surveys............................................................ 58 4.2.1 Staff .......................................................................................... 58 4.2.2 Equipment ................................................................................ 584.3 Condition of survey sites..................................................................... 59 4.3.1 General ..................................................................................... 59 4.3.2 Site location for mobile weighbridges ..................................... 594.4 Weighing .............................................................................................. 62 4.4.1 Duration of the survey.............................................................. 62 4.4.2 Origin and Destination (O/D) surveys ..................................... 62 4.4.3 Vehicle categories..................................................................... 62 4.4.4 Accuracy .................................................................................. 62 4.4.5 Procedure for weighing ............................................................ 634.5 Recording and reporting .................................................................... 64 4.5.1 General ..................................................................................... 64 4.5.2 Axle confi guration.................................................................... 64 4.5.3 Equivalency factor ................................................................... 65 4.5.4 Axles loaded to above 13 tonnes.............................................. 65 4.5.5 Traffi c growth........................................................................... 65 4.5.6 Lane distribution ...................................................................... 66 4.5.7 Construction traffi c................................................................... 66 4.5.8 Traffi c Load Classes (TLC)...................................................... 66 4.5.9 Presentation of Data ................................................................. 67
References ● Pavement and Materials Design Manual - 1999, Ministry of Works, Tanzania● Guideline no. 4 Axle Load Surveys. Road Department, Botswana - 2000
4 Axle load surveys
1
3
2
Introduction
Pavement evaluation
Geotechnique
6 Construction control
5 Material prospecting and alignment surveys
Appendices
4 AXLE LOAD SURVEYS
Chapter 4: Table of ContentsChapter 4: Table of Contents
58 Chapter 4Axel Load Surveys
ch4Field Testing Manual - 2003
TANROADS Central Materials Laboratory (CML)
ch44 AXLE LOAD SURVEYS4.1 IntroductionTanzania has over the last decades made great efforts in expanding and improv-ing the road network as part of developing the infrastructure, thus enabling sus-tainable economic and social development throughout the country. In order to secure and preserve this valuable asset timely and appropriate maintenance and rehabilitation measures are essential. Accurate information on traffi c loading is one of the basic inputs for management of this network. Such data are required for design of new pavements and for pavement rehabilitation as well as forming a basis for making decisions on the most economical and appropriate manage-ment strategy for individual road links and for the network as a whole.
The main purpose of this chapter is to provide a practical guidance on how to conduct an axle load survey that gives suffi cient information for both pavement management and design purposes. Guidance is given for collection and presen-tation of the data in a manner that ensures all input to the pavement design is secured and no vital information is being lost or obscured through inappropriate summarisation of data. Since such surveys can be expensive they must be care-fully planned and organised to minimise resource wastage.
4.2 Resources for axle load surveys4.2.1 Staff Due to 24-hour operation of the axle load surveys, the team normally requires about 15 people working on a three shift basis with 4 -5 people on each shift. Proper training must be completed prior to letting the team operate on their own in the fi eld. Such training should be conducted by an experienced engineer fully conversant with the technical and logistics details. The minimum qualifi cations of the team members are as followsTeam leader: .......................................................... 1 technician or engineerScale reading and data recording: ......................... 6 technician/assistantTraffi c control: ....................................................... 5 assistant/labours Vehicle operation: .................................................. 3 driversThe exact number of people on a shift will vary depending conditions on site, such as traffi c intensity. The number of shifts will vary depending on the total survey schedule, i.e. the number of all-night measurements and also special site conditions such as border gates.
4.2.2 Equipment The following equipment is required to conduct an axle load survey. Personal equipment, water and fuel is not included in the listing:
General, for all surveys● fl atbed truck .....................................................(no 1)● pick-ups ...........................................................(no 2)● refl ective traffi c safety vests ............................(no 15)● traffi c cones .....................................................(no 20)● red stop fl ags ....................................................(no 2● road signs ..................................................... (no 10)● generator for lights ....................................... (no 1)
The Pavement and Material Design Manual-1999 requires that all pavement design of bitumen sur-faced roads shall be based on project dedicated axle load surveys.
The axle load weighing described in this chapter only deals with static weighing, and not weight of moving vehicles, commonly termed Weigh -in -motion (WIM).
In conjunction with a border gate the survey will follow the border post gate opening and closing schedules.
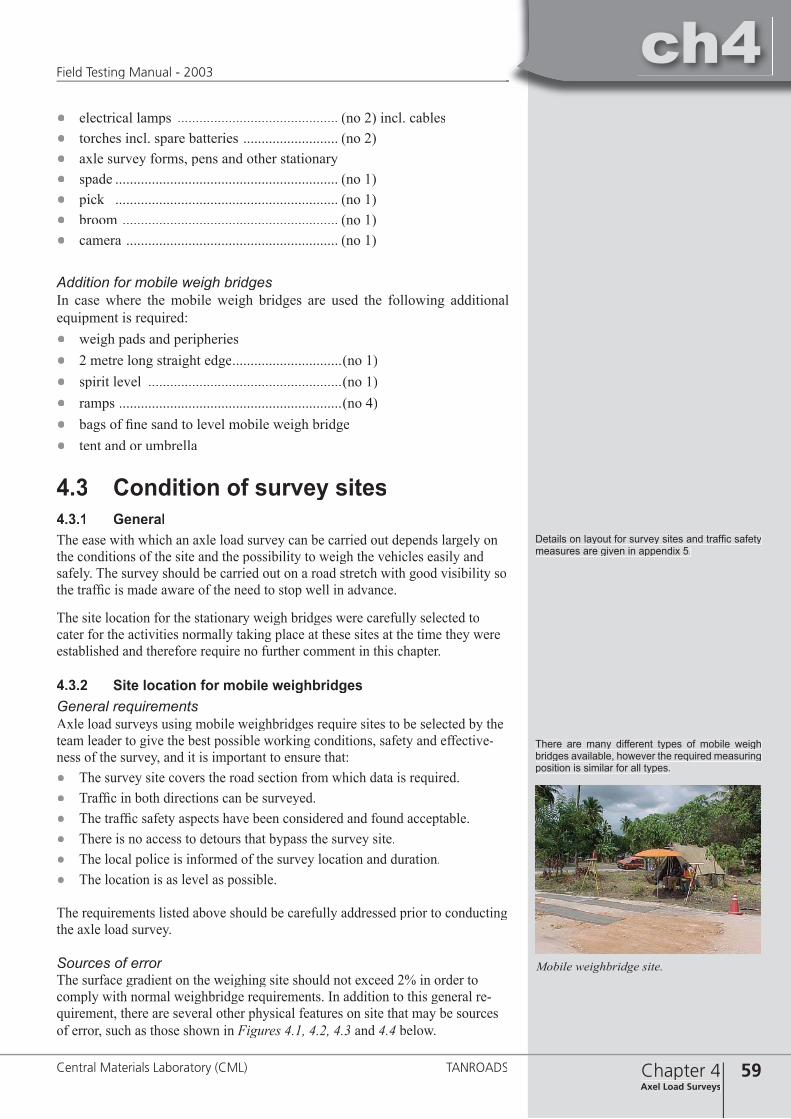
ch4
59Chapter 4Axel Load Surveys
ch4Field Testing Manual - 2003
Central Materials Laboratory (CML) TANROADS
● electrical lamps ............................................ (no 2) incl. cables● torches incl. spare batteries .......................... (no 2)● axle survey forms, pens and other stationary● spade ............................................................. (no 1)● pick ............................................................. (no 1)● broom ........................................................... (no 1)● camera .......................................................... (no 1)
Addition for mobile weigh bridgesIn case where the mobile weigh bridges are used the following additional equipment is required:● weigh pads and peripheries● 2 metre long straight edge..............................(no 1)● spirit level .....................................................(no 1)● ramps .............................................................(no 4)● bags of fi ne sand to level mobile weigh bridge● tent and or umbrella
4.3 Condition of survey sites4.3.1 GeneralThe ease with which an axle load survey can be carried out depends largely on the conditions of the site and the possibility to weigh the vehicles easily and safely. The survey should be carried out on a road stretch with good visibility so the traffi c is made aware of the need to stop well in advance.
The site location for the stationary weigh bridges were carefully selected to cater for the activities normally taking place at these sites at the time they were established and therefore require no further comment in this chapter.
4.3.2 Site location for mobile weighbridgesGeneral requirementsAxle load surveys using mobile weighbridges require sites to be selected by the team leader to give the best possible working conditions, safety and effective-ness of the survey, and it is important to ensure that:● The survey site covers the road section from which data is required.● Traffi c in both directions can be surveyed.● The traffi c safety aspects have been considered and found acceptable.● There is no access to detours that bypass the survey site.● The local police is informed of the survey location and duration.● The location is as level as possible.
The requirements listed above should be carefully addressed prior to conducting the axle load survey.
Sources of errorThe surface gradient on the weighing site should not exceed 2% in order to comply with normal weighbridge requirements. In addition to this general re-quirement, there are several other physical features on site that may be sources of error, such as those shown in Figures 4.1, 4.2, 4.3 and 4.4 below.
Details on layout for survey sites and traffi c safety measures are given in appendix 5.
There are many different types of mobile weigh bridges available, however the required measuring position is similar for all types.
Mobile weighbridge site.
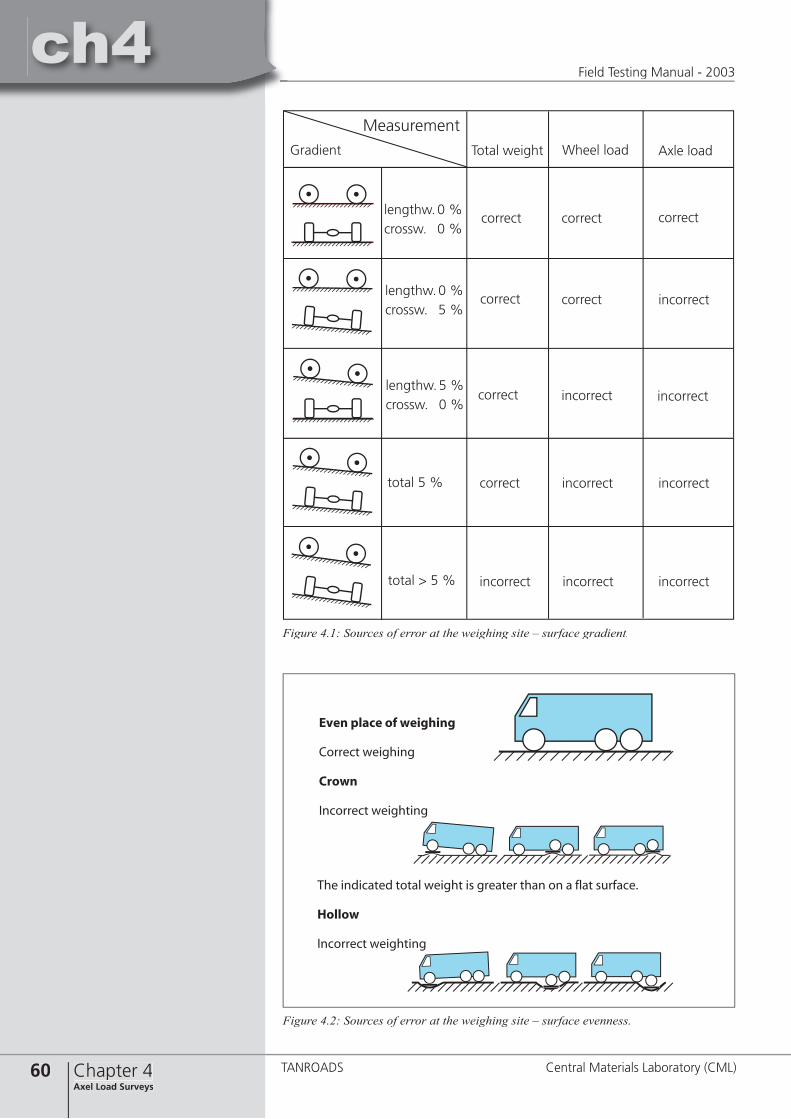
60 Chapter 4Axel Load Surveys
ch4Field Testing Manual - 2003
TANROADS Central Materials Laboratory (CML)
ch4���� ����
�����������
����� ������ ����� ����
���������
���������
���������
���������
���������
��������� ��������� ���������
��������
��������� �������� � �
��������� �������� � �
��������� �������� � �
����� � �
����� � � �
�������
�������
�������
�������
�������
�������
�������
���� ����� �� ��������
������� ��������
�����
��������� ���������
��� ��������� ����� ������ �� ������� ���� �� � ���� ��������
������
��������� ���������
Figure 4.1: Sources of error at the weighing site – surface gradient.
Figure 4.2: Sources of error at the weighing site – surface evenness.
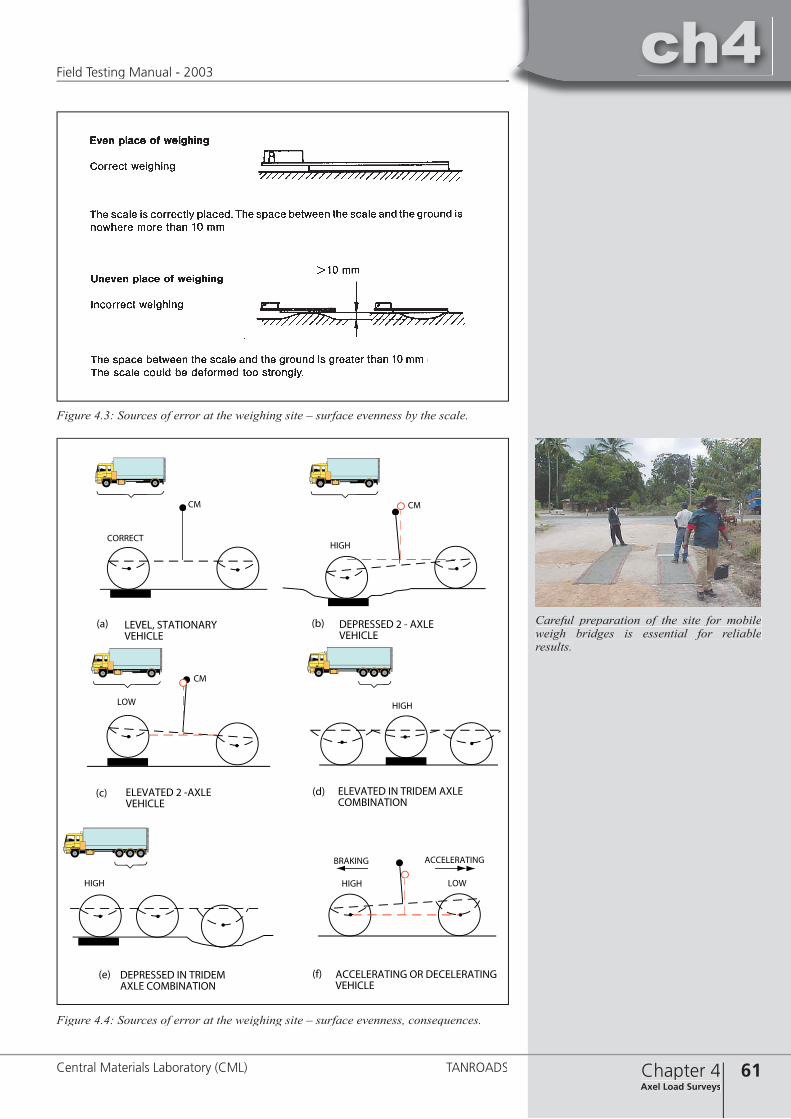
ch4
61Chapter 4Axel Load Surveys
ch4Field Testing Manual - 2003
Central Materials Laboratory (CML) TANROADS
�������
��
����
��
��
��� ����
����
������� ������������
���� ���
������ �����������������
��������� � � �����������
�������� � ������������
�������� �� ������ ���������������
��������� �� ���������� �����������
������������ �� �������������������
��� ���
��� ���
��� ���
Figure 4.3: Sources of error at the weighing site – surface evenness by the scale.
Figure 4.4: Sources of error at the weighing site – surface evenness, consequences.
Careful preparation of the site for mobile weigh bridges is essential for reliable results.
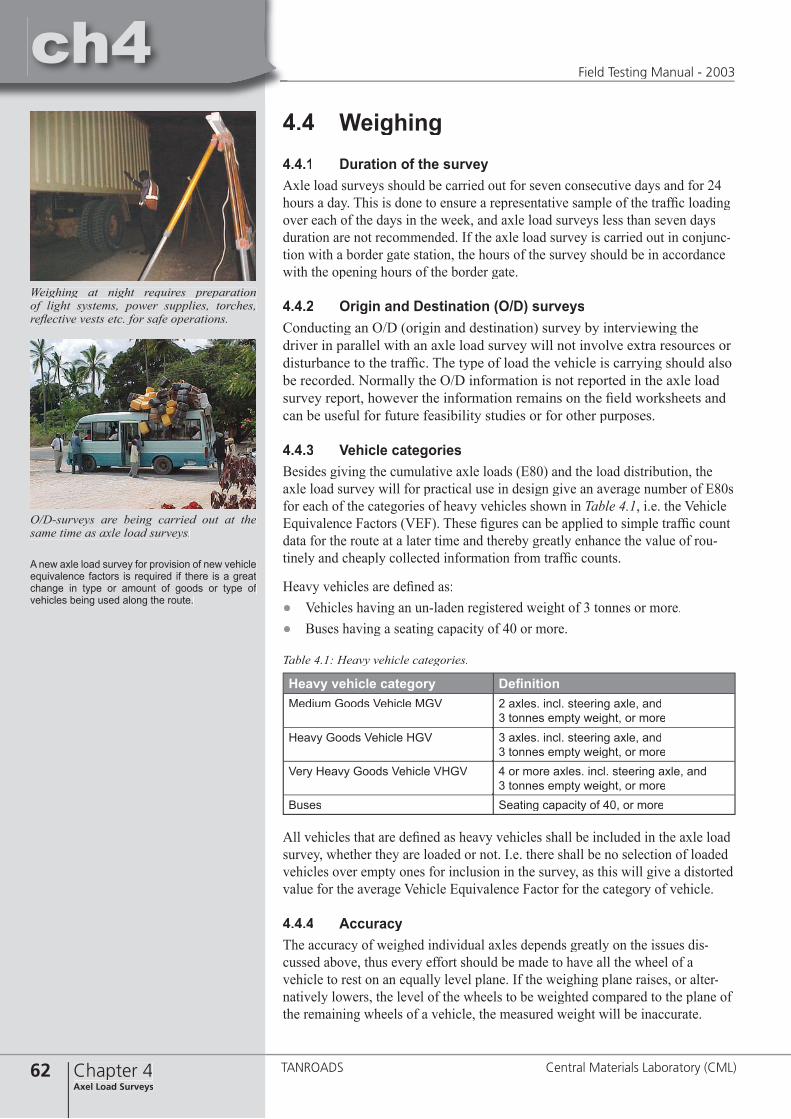
62 Chapter 4Axel Load Surveys
ch4Field Testing Manual - 2003
TANROADS Central Materials Laboratory (CML)
ch44.4 Weighing4.4.1 Duration of the surveyAxle load surveys should be carried out for seven consecutive days and for 24 hours a day. This is done to ensure a representative sample of the traffi c loading over each of the days in the week, and axle load surveys less than seven days duration are not recommended. If the axle load survey is carried out in conjunc-tion with a border gate station, the hours of the survey should be in accordance with the opening hours of the border gate.
4.4.2 Origin and Destination (O/D) surveysConducting an O/D (origin and destination) survey by interviewing the driver in parallel with an axle load survey will not involve extra resources or disturbance to the traffi c. The type of load the vehicle is carrying should also be recorded. Normally the O/D information is not reported in the axle load survey report, however the information remains on the fi eld worksheets and can be useful for future feasibility studies or for other purposes.
4.4.3 Vehicle categoriesBesides giving the cumulative axle loads (E80) and the load distribution, the axle load survey will for practical use in design give an average number of E80s for each of the categories of heavy vehicles shown in Table 4.1, i.e. the Vehicle Equivalence Factors (VEF). These fi gures can be applied to simple traffi c count data for the route at a later time and thereby greatly enhance the value of rou-tinely and cheaply collected information from traffi c counts.
Heavy vehicles are defi ned as:● Vehicles having an un-laden registered weight of 3 tonnes or more.● Buses having a seating capacity of 40 or more.
Table 4.1: Heavy vehicle categories.
All vehicles that are defi ned as heavy vehicles shall be included in the axle load survey, whether they are loaded or not. I.e. there shall be no selection of loaded vehicles over empty ones for inclusion in the survey, as this will give a distorted value for the average Vehicle Equivalence Factor for the category of vehicle.
4.4.4 AccuracyThe accuracy of weighed individual axles depends greatly on the issues dis-cussed above, thus every effort should be made to have all the wheel of a vehicle to rest on an equally level plane. If the weighing plane raises, or alter-natively lowers, the level of the wheels to be weighted compared to the plane of the remaining wheels of a vehicle, the measured weight will be inaccurate.
Weighing at night requires preparation of light systems, power supplies, torches, refl ective vests etc. for safe operations.
O/D-surveys are being carried out at the same time as axle load surveys.
A new axle load survey for provision of new vehicle equivalence factors is required if there is a great change in type or amount of goods or type of vehicles being used along the route.
Heavy vehicle category Defi nitionMedium Goods Vehicle MGV 2 axles. incl. steering axle, and
3 tonnes empty weight, or moreHeavy Goods Vehicle HGV 3 axles. incl. steering axle, and
3 tonnes empty weight, or moreVery Heavy Goods Vehicle VHGV 4 or more axles. incl. steering axle, and
3 tonnes empty weight, or moreBuses Seating capacity of 40, or more
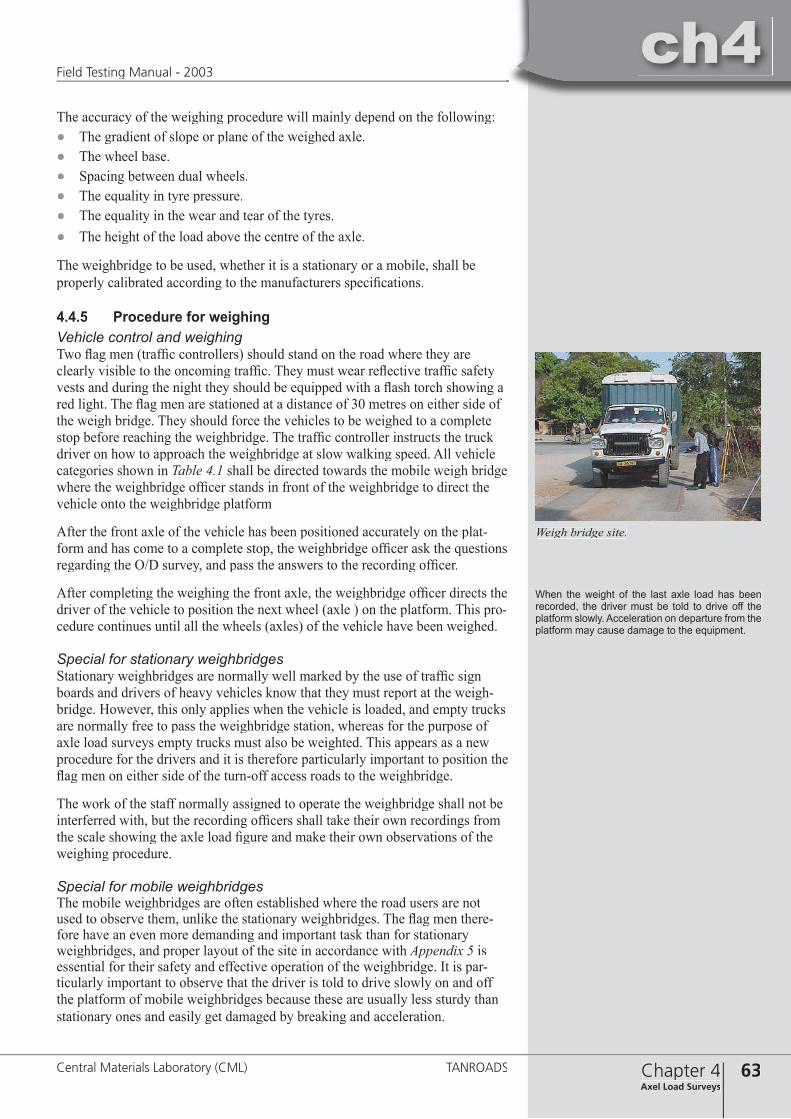
ch4
63Chapter 4Axel Load Surveys
ch4Field Testing Manual - 2003
Central Materials Laboratory (CML) TANROADS
The accuracy of the weighing procedure will mainly depend on the following:● The gradient of slope or plane of the weighed axle.● The wheel base.● Spacing between dual wheels.● The equality in tyre pressure.● The equality in the wear and tear of the tyres.● The height of the load above the centre of the axle.
The weighbridge to be used, whether it is a stationary or a mobile, shall be properly calibrated according to the manufacturers specifi cations.
4.4.5 Procedure for weighingVehicle control and weighing Two fl ag men (traffi c controllers) should stand on the road where they are clearly visible to the oncoming traffi c. They must wear refl ective traffi c safety vests and during the night they should be equipped with a fl ash torch showing a red light. The fl ag men are stationed at a distance of 30 metres on either side of the weigh bridge. They should force the vehicles to be weighed to a complete stop before reaching the weighbridge. The traffi c controller instructs the truck driver on how to approach the weighbridge at slow walking speed. All vehicle categories shown in Table 4.1 shall be directed towards the mobile weigh bridge where the weighbridge offi cer stands in front of the weighbridge to direct the vehicle onto the weighbridge platform
After the front axle of the vehicle has been positioned accurately on the plat-form and has come to a complete stop, the weighbridge offi cer ask the questions regarding the O/D survey, and pass the answers to the recording offi cer.
After completing the weighing the front axle, the weighbridge offi cer directs the driver of the vehicle to position the next wheel (axle ) on the platform. This pro-cedure continues until all the wheels (axles) of the vehicle have been weighed.
Special for stationary weighbridgesStationary weighbridges are normally well marked by the use of traffi c sign boards and drivers of heavy vehicles know that they must report at the weigh-bridge. However, this only applies when the vehicle is loaded, and empty trucks are normally free to pass the weighbridge station, whereas for the purpose of axle load surveys empty trucks must also be weighted. This appears as a new procedure for the drivers and it is therefore particularly important to position the fl ag men on either side of the turn-off access roads to the weighbridge.
The work of the staff normally assigned to operate the weighbridge shall not be interferred with, but the recording offi cers shall take their own recordings from the scale showing the axle load fi gure and make their own observations of the weighing procedure.
Special for mobile weighbridgesThe mobile weighbridges are often established where the road users are not used to observe them, unlike the stationary weighbridges. The fl ag men there-fore have an even more demanding and important task than for stationary weighbridges, and proper layout of the site in accordance with Appendix 5 is essential for their safety and effective operation of the weighbridge. It is par-ticularly important to observe that the driver is told to drive slowly on and off the platform of mobile weighbridges because these are usually less sturdy than stationary ones and easily get damaged by breaking and acceleration.
Weigh bridge site.
When the weight of the last axle load has been recorded, the driver must be told to drive off the platform slowly. Acceleration on departure from the platform may cause damage to the equipment.
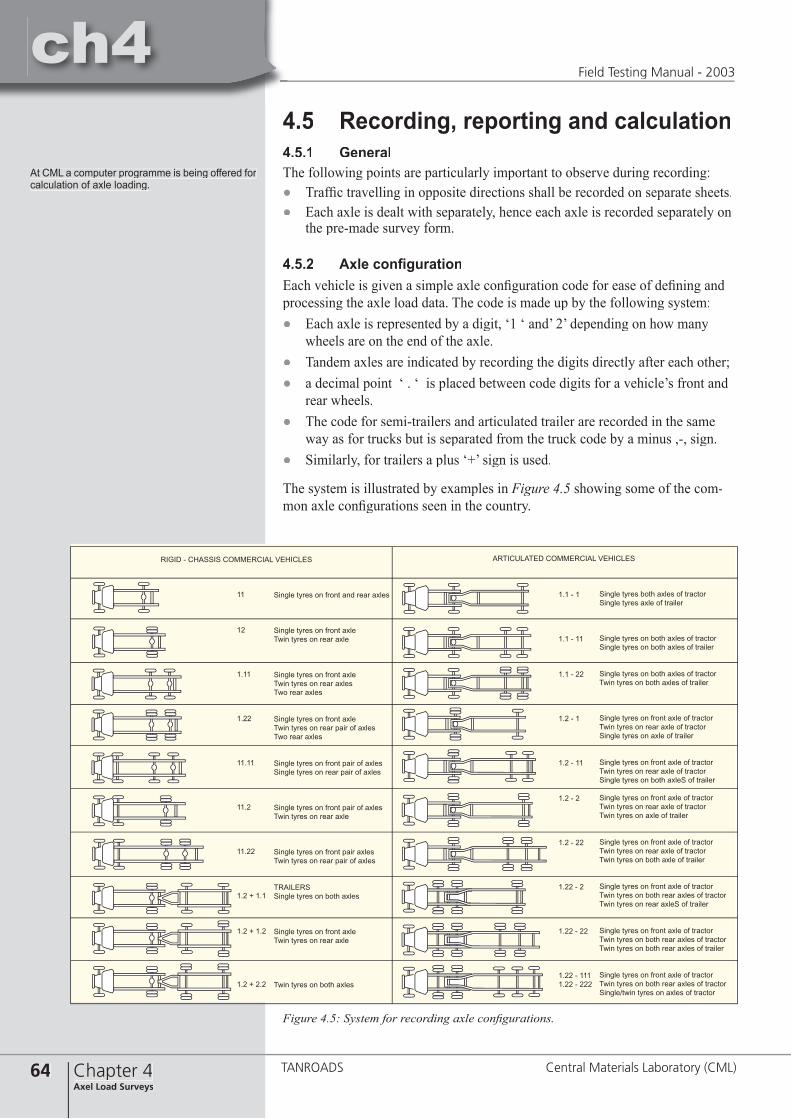
64 Chapter 4Axel Load Surveys
ch4Field Testing Manual - 2003
TANROADS Central Materials Laboratory (CML)
ch44.5 Recording, reporting and calculation4.5.1 GeneralThe following points are particularly important to observe during recording:● Traffi c travelling in opposite directions shall be recorded on separate sheets.● Εach axle is dealt with separately, hence each axle is recorded separately on
the pre-made survey form.
4.5.2 Axle confi gurationEach vehicle is given a simple axle confi guration code for ease of defi ning and processing the axle load data. The code is made up by the following system:● Each axle is represented by a digit, ‘1 ‘ and’ 2’ depending on how many
wheels are on the end of the axle.● Tandem axles are indicated by recording the digits directly after each other;● a decimal point ‘ . ‘ is placed between code digits for a vehicle’s front and
rear wheels.● The code for semi-trailers and articulated trailer are recorded in the same
way as for trucks but is separated from the truck code by a minus ,-, sign.● Similarly, for trailers a plus ‘+’ sign is used.
The system is illustrated by examples in Figure 4.5 showing some of the com-mon axle confi gurations seen in the country.
������ ����� �� ����� ��� ���� �����
������ ����� �� ����� �������� ����� �� ���� ����
������ ����� �� ����� �������� ����� �� ���� �������� ���� �����
������ ����� �� ����� �������� ����� �� ���� ���� �� �������� ���� �����
������ ����� �� ����� ���� �� ����������� ����� �� ���� ���� �� �����
������ ����� �� ����� ���� �� ��������� ����� �� ���� ����
������ ����� �� ����� ���� ��������� ����� �� ���� ���� �� �����
�������������� ����� �� ���� �����
������ ����� �� ����� �������� ����� �� ���� ����
���� ����� �� ���� �����
��
��
����
����
�����
����
�����
��� � ���
��� � ���
��� � ���
��� � �
��� � ��
��� � ��
��� � �
��� � ��
��� � �
��� � ��
���� � �
���� � ��
���� � ������� � ���
������ ����� ���� ����� �� ������������� ����� ���� �� �������
������ ����� �� ���� ����� �� ������������� ����� �� ���� ����� �� �������
������ ����� �� ���� ����� �� ����������� ����� �� ���� ����� �� �������
������ ����� �� ����� ���� �� ����������� ����� �� ���� ���� �� ������������� ����� �� ���� �� �������
������ ����� �� ����� ���� �� ����������� ����� �� ���� ���� �� ������������� ����� �� ���� ����� �� �������
������ ����� �� ����� ���� �� ����������� ����� �� ���� ���� �� ����������� ����� �� ���� �� �������
������ ����� �� ����� ���� �� ����������� ����� �� ���� ���� �� ����������� ����� �� ���� ���� �� �������
������ ����� �� ����� ���� �� ����������� ����� �� ���� ���� ����� �� ����������� ����� �� ���� ����� �� �������
������ ����� �� ����� ���� �� ����������� ����� �� ���� ���� ����� �� ����������� ����� �� ���� ���� ����� �� �������
������ ����� �� ����� ���� �� ����������� ����� �� ���� ���� ����� �� ������������������ ����� �� ����� �� �������
����� � ������� ���������� �������� ����������� ���������� ��������
Figure 4.5: System for recording axle confi gurations.
At CML a computer programme is being offered for calculation of axle loading.

ch4
65Chapter 4Axel Load Surveys
ch4Field Testing Manual - 2003
Central Materials Laboratory (CML) TANROADS
4.5.3 Equivalency factorsThe damaging effect of an axle passing over the pavement is expressed by the equivalency factor related to an equivalent standard axle (E80) of 8160 kg load:
Equivalency factor = [Axle Load (kg) / 8160] 4.5
The Vehicle Equivalency Factor (VEF) for every vehicle in the axle load survey is determined and an average value is subsequently calculated for each heavy vehicle category, for each lane separately. The average VEF for each heavy vehicle category, for each lane, can then be applied to the results from traffi c counts to give the cumulative E80s traffi c loading the pavement is subjected to over a given period.
4.5.4 Axles loaded to above 13 tonnesThe proportion of the design traffi c loading as a result of axles loaded to above 13 tonnes shall be calculated from axle load survey data. If this proportion is 50% or higher then the design traffi c loading is defi ned as Heavy, denoted by an index to the Traffi c Load Class as input to the pavement design catalogue. One should not confuse the proportion of the design traffi c loading as a result of ax-les loaded to above 13 tonnes with the counted proportion of these axles in the traffi c stream, the latter being incorrect. A moderate number of very heavy axles will make up a considerable proportion of the design traffi c loading.The percentage of the design traffi c load (E80) attributed to axles loaded to above 13 tonnes shall be calculated based on detailed data from project dedi-cated axle load surveys. The axle load data from the lane with the highest value of E80 shall be used.
The heavy axles’ proportion of E80 is calculated as follows:Heavy Axles’ Number of E80 from axles of 13 t and heavier in the surveyProportion = x 100 x 100of E80 [%] Total number of E80 from all heavy vehicles in the survey
4.5.5 Traffi c growth
GeneralThe following estimations of future growth are required:
● Growth in the number of heavy vehicles.
● Growth in the number of E80 per vehicle (Vehicle Equivalency Factor).
Types of traffi cThe forecasting of traffi c growth shall include separate estimates for the 4 ve-hicle categories. It is necessary to assess future traffi c in respect of the following types:
● normal traffi c:that would use the route regardless of the condition of the road
● diverted traffi c:that moves from an alternative route due to the improvement of the road, but at otherwise unchanged origin and destination
● generated traffi c: additional traffi c occurring due to the improvement of the road
Chapters 5, 8, 9 and 10 in the Pavement and Materials Design Manual - 1999/ set out measures in the design of pavement and improved subgrade layers to offset the effect of a large proportion of very heavy axle loads.
Research is not yet conclusive on issues related to the effect of very heavy axle loads on a variety of pavement types.
There is a considerable uncertainty and risk of making large errors in estimations of traffi c growth since a number of individually uncertain factors are brought together in the analysis. Where little information is available Historical data, origindesti-nation surveys and records from Ministry of Works Tanroads and Statistical Bureau are among the sources of information for assessment of traffi c growth. The designer may have to resort to the use of growth fi gures for GDP in the estimation of movement of goods.

66 Chapter 4Axel Load Surveys
ch4Field Testing Manual - 2003
TANROADS Central Materials Laboratory (CML)
ch4Total growth rateFor each heavy vehicle category the total E80 growth rate is calculated from the formula:
E80 growth rate = [(1+h/100) x (1+v/100) - 1] x 100
where:h = growth rate in traffi c volume for the heavy vehicle categoryv = growth rate in vehicle equivalency factor (E80 per vehicle) for the heavy
vehicle category
4.5.6 Lane distributionThe design traffi c loading shall be corrected for the distribution of heavy ve-hicles between the lanes in accordance with Table 4.2.
Table 4.2 Traffi c load distribution between lanes.
Cross section
Paved width
Corrected design traffi c loading – E80
Explanatory notes
Single carriageway
< 3.5 mDouble the sum of E80 in both directions
The driving pattern on this cross section is very channelled
Min. 3.5 m, but less than 4.5 m
The sum of E80 in both directions
Traffi c in both directions use the same lane
Min. 4.5 m, but less than 6 m
80% of the sum of E80 in both directions
To allow for overlap in the centre section of the road
6 m or widerTotal E80 in the heaviest loaded direction
Minimal traffi c overlap in the centre section of the road
More than one lane in each direction
-90% of the total E80 in the studied direction
The majority of heavy vehicles use one lane in each direction
4.5.7 Construction traffi cThe calculation of design traffi c loading shall include construction traffi c and public traffi c that is expected to use the completed pavement before the start of the design period.
4.5.8 Traffi c Load Classes (TLC)After fi nally determining the design traffi c loading, E80, and the heavy axles’ proportion of E80, the values are placed into their correct class in accordance with Table 4.3.
Table 4.3 Traffi c Load Classes - TLC
Design traffi c loading [E80 x 106] Traffi c Load Class (TLC)< 0.2 TLC 02
0.2 to 0.5 TLC 050.5 to 1 TLC 11 to 3 TLC 3
3 to 10 TLC 1010 to 20 TLC 2020 to 50 TLC 50
Loading from construction traffi c can have a signifi cant effect on pavements designed for low traffi c.
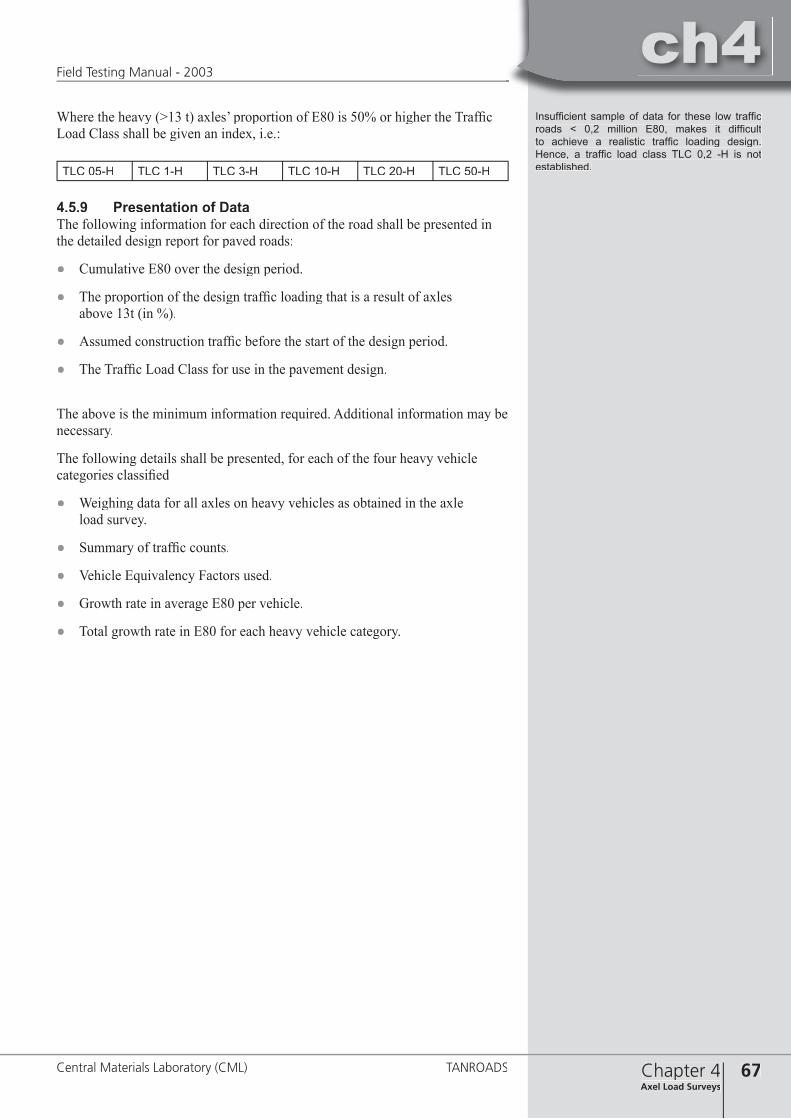
ch4
67Chapter 4Axel Load Surveys
ch4Field Testing Manual - 2003
Central Materials Laboratory (CML) TANROADS
Where the heavy (>13 t) axles’ proportion of E80 is 50% or higher the Traffi c Load Class shall be given an index, i.e.:
TLC 05-H TLC 1-H TLC 3-H TLC 10-H TLC 20-H TLC 50-H
4.5.9 Presentation of DataThe following information for each direction of the road shall be presented in the detailed design report for paved roads:
● Cumulative E80 over the design period.
● The proportion of the design traffi c loading that is a result of axles above 13t (in %).
● Assumed construction traffi c before the start of the design period.
● The Traffi c Load Class for use in the pavement design.
The above is the minimum information required. Additional information may be necessary.
The following details shall be presented, for each of the four heavy vehicle categories classifi ed
● Weighing data for all axles on heavy vehicles as obtained in the axle load survey.
● Summary of traffi c counts.
● Vehicle Equivalency Factors used.
● Growth rate in average E80 per vehicle.
● Total growth rate in E80 for each heavy vehicle category.
Insuffi cient sample of data for these low traffi c roads < 0,2 million E80, makes it diffi cult to achieve a realistic traffi c loading design. Hence, a traffi c load class TLC 0,2 -H is not established.

68 Chapter 4Axel Load Surveys
ch4Field Testing Manual - 2003
TANROADS Central Materials Laboratory (CML)
ch5

ch4
69Chapter 5Material Prospecting and
Alignment Surveys
ch5Field Testing Manual - 2003
Central Materials Laboratory (CML) TANROADS
5 Material prospecting and alignment surveys
1
3
4
2
Introduction
Pavement evaluation
Axle load surveys
Geotechnique
6 Construction control
Appendices
Chapter 5: Table of Contents5.1 Introduction......................................................................................... 715.2 Methodology ........................................................................................ 71
5.2.1 Planning.................................................................................... 715.2.2 Soil descriptions and profi ling ................................................. 735.2.3 Sampling .................................................................................. 73
5.3 Alignment soil surveys ........................................................................ 775.3.1 Introduction .............................................................................. 775.3.2 Establishment of centreline ...................................................... 775.3.3 Sampling depth......................................................................... 785.3.4 Sampling frequency ............................................................. 79
5.4 Soils and gravel sources ...................................................................... 805.4.1 Introduction .............................................................................. 805.4.2 Environmental considerations and occupied land.................... 805.4.3 Desk study for gravel and soil surveys .................................... 805.4.4 Quantity estimates.................................................................... 815.4.5 Minimum requirements, sampling frequency .......................... 82
5.5 Rock Sources ....................................................................................... 835.5.1 Introduction .............................................................................. 835.5.2 Desk study for rock quarry surveys ......................................... 835.5.3 Quantity estimates.................................................................... 835.5.4 Rock quality ............................................................................. 845.5.5 Surface sampling...................................................................... 845.5.6 Drilling ..................................................................................... 85
5 MATERIAL PROSPECTING AND ALIGNMENT SURVEYS

70 Chapter 5Material Prospecting and Alignment Surveys
ch5Field Testing Manual - 2003
TANROADS Central Materials Laboratory (CML)
ch5References ● Pavement and Materials Design Manual - 1999, Ministry of Works,
Tanzania● Guideline no. 2 Pavement Testing, Analysis and Interpretation of Test Data.
Road Department, Botswana - 2000● Guideline no. 3 Methods and Procedures for Prospecting for Road Con-
struction Materials. Road Depratment, Botswana - 2000.
ch5
71Chapter 5Material Prospecting and
Alignment Surveys
ch5Field Testing Manual - 2003
Central Materials Laboratory (CML) TANROADS
5 MATERIAL PROSPECTING AND ALIGNMENT SURVEYS5.1 IntroductionIn order to maintain, construct, rehabilitate or upgrade a road network, large quantities of soils and gravel materials are required and normally alignment soil surveys are needed for a reliable design of improved pavement layers, estimates of earthworks quantities to be made and the pavement design to be validated. This chapter describes the methods and procedures that are appropriate in Tan-zania for the location and proving of material sources for road construction as well as setting out procedures for alignment fi eld surveys.
5.2 Methodology5.2.1 PlanningGeneralIt important to gather as much information as available about the intended con-struction project where alignment surveys or material surveys are to be carried out. Large amounts of time consuming and expensive fi eld work may be carried out unnecessarily if the planning in advance has not been properly undertaken.
The following general points should be given attention in the planning of align-ment soils surveys and surveys for pavement and earthworks materials:
1. Establish the type of road (bituminised/gravel/earth), whether trunk road or not, road width, design traffi c loading and the designers’ preliminary views on alternative pavement types and material quantities for pavement con-struction.
2. Establish whether the horizontal alignment is fi xed, or can be moved, or is likely to be moved after the soil survey has been carried out.
3. Obtain as much information as possible about the vertical alignment and ar-eas of likely cut or fi ll, and the likely depth of cut and fi ll and locate these areas on maps for use in the fi eld.
4. Estimate the need for earthworks fi lls and their likely position along the road line.
Use of fi eld data in the pavement designSpecial attention is drawn to the awareness of the exact purpose of each part of the fi eld survey in accordance with the design method of the Pavement and Materials Design Manual-1999 as outlined below and illustrated in Figure 5.1.
As shown in Figure 5.1, the alignment soils survey does not determine the pave-ment structure, i.e. the layer thickness and required material type in subbase, base course and surfacing. The pavement structure is determined by traffi c load-ing and climate. The availability of pavement materials in the area is important for choice of the most economical pavement structure within a range determined by the traffi c loading and climate.
The parameters pavement layer thickness and pavement material types are not determined on the basis of the alignment soils survey, but by the availability of pavement materials, traffi c loading and climate. Ref. the pavement design method of the Pavement and Materials Design Manual-1999.
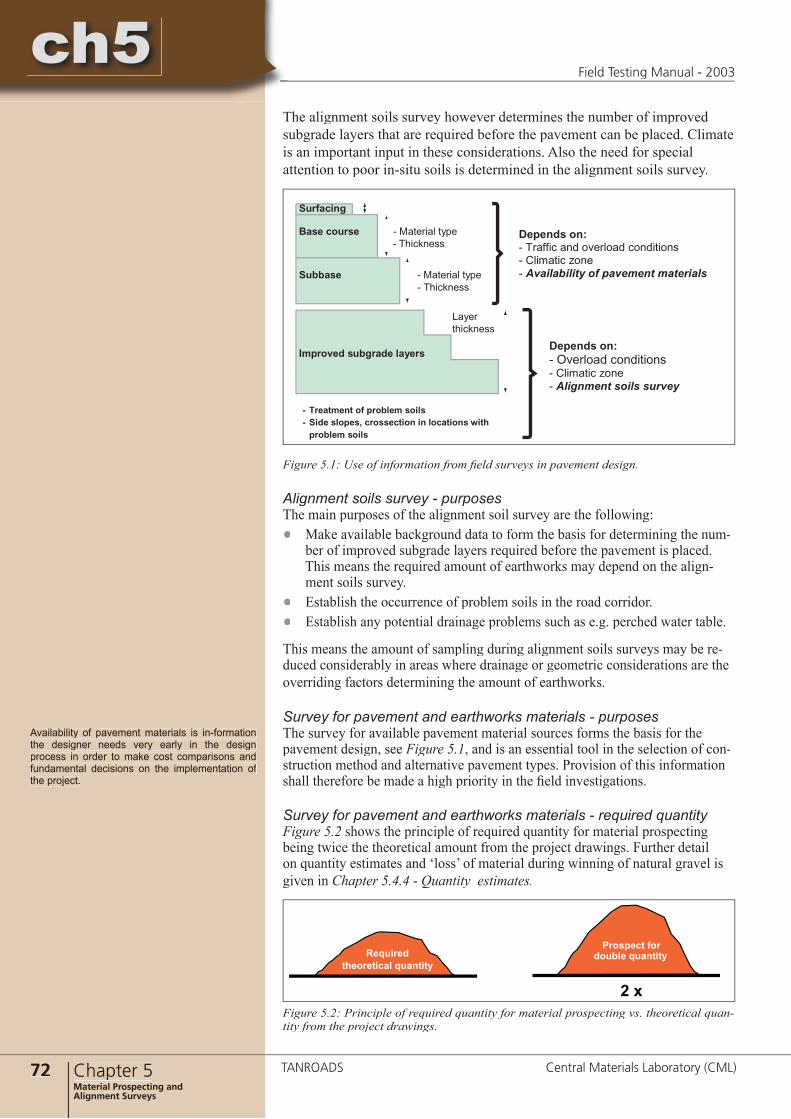
72 Chapter 5Material Prospecting and Alignment Surveys
ch5Field Testing Manual - 2003
TANROADS Central Materials Laboratory (CML)
ch5The alignment soils survey however determines the number of improved subgrade layers that are required before the pavement can be placed. Climate is an important input in these considerations. Also the need for special attention to poor in-situ soils is determined in the alignment soils survey.
Figure 5.1: Use of information from fi eld surveys in pavement design.
Alignment soils survey - purposesThe main purposes of the alignment soil survey are the following:● Make available background data to form the basis for determining the num-
ber of improved subgrade layers required before the pavement is placed. This means the required amount of earthworks may depend on the align-ment soils survey.
● Establish the occurrence of problem soils in the road corridor. ● Establish any potential drainage problems such as e.g. perched water table.
This means the amount of sampling during alignment soils surveys may be re-duced considerably in areas where drainage or geometric considerations are the overriding factors determining the amount of earthworks.
Survey for pavement and earthworks materials - purposesThe survey for available pavement material sources forms the basis for the pavement design, see Figure 5.1, and is an essential tool in the selection of con-struction method and alternative pavement types. Provision of this information shall therefore be made a high priority in the fi eld investigations.
Survey for pavement and earthworks materials - required quantity Figure 5.2 shows the principle of required quantity for material prospecting being twice the theoretical amount from the project drawings. Further detail on quantity estimates and ‘loss’ of material during winning of natural gravel is given in Chapter 5.4.4 - Quantity estimates.
Availability of pavement materials is in-formation the designer needs very early in the design process in order to make cost comparisons and fundamental decisions on the implementation of the project.
���������
���� ������ � �������� ����� ���������
������� � �������� ����� ���������
��������������
�������� �������� ������
� ��������� �� ������� ������ ���� ������� ����������� �� ��������� ����
������� �����
������� ���� ������� ��� �������� ����������� �������� ����� ������������ �� �������� ���������
������� ���� �������� ����������� �������� ����� ��������� ����� ������
������������������� ��������
�������� ��������� ��������
� �Figure 5.2: Principle of required quantity for material prospecting vs. theoretical quan-tity from the project drawings.
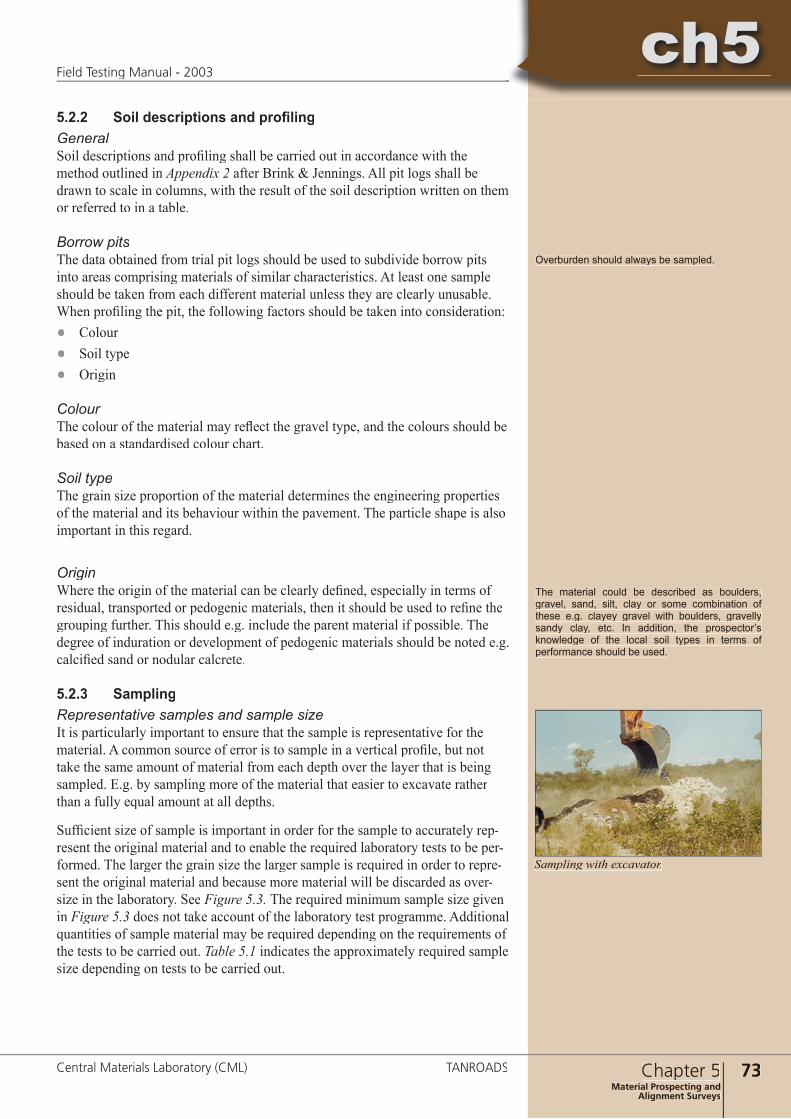
ch5
73Chapter 5Material Prospecting and
Alignment Surveys
ch5Field Testing Manual - 2003
Central Materials Laboratory (CML) TANROADS
5.2.2 Soil descriptions and profi lingGeneralSoil descriptions and profi ling shall be carried out in accordance with the method outlined in Appendix 2 after Brink & Jennings. All pit logs shall be drawn to scale in columns, with the result of the soil description written on them or referred to in a table.
Borrow pitsThe data obtained from trial pit logs should be used to subdivide borrow pits into areas comprising materials of similar characteristics. At least one sample should be taken from each different material unless they are clearly unusable. When profi ling the pit, the following factors should be taken into consideration:● Colour● Soil type● Origin
ColourThe colour of the material may refl ect the gravel type, and the colours should be based on a standardised colour chart.
Soil typeThe grain size proportion of the material determines the engineering properties of the material and its behaviour within the pavement. The particle shape is also important in this regard.
OriginWhere the origin of the material can be clearly defi ned, especially in terms of residual, transported or pedogenic materials, then it should be used to refi ne the grouping further. This should e.g. include the parent material if possible. The degree of induration or development of pedogenic materials should be noted e.g. calcifi ed sand or nodular calcrete.
5.2.3 SamplingRepresentative samples and sample sizeIt is particularly important to ensure that the sample is representative for the material. A common source of error is to sample in a vertical profi le, but not take the same amount of material from each depth over the layer that is being sampled. E.g. by sampling more of the material that easier to excavate rather than a fully equal amount at all depths.
Suffi cient size of sample is important in order for the sample to accurately rep-resent the original material and to enable the required laboratory tests to be per-formed. The larger the grain size the larger sample is required in order to repre-sent the original material and because more material will be discarded as over-size in the laboratory. See Figure 5.3. The required minimum sample size given in Figure 5.3 does not take account of the laboratory test programme. Additional quantities of sample material may be required depending on the requirements of the tests to be carried out. Table 5.1 indicates the approximately required sample size depending on tests to be carried out.
The material could be described as boulders, gravel, sand, silt, clay or some combination of these e.g. clayey gravel with boulders, gravelly sandy clay, etc. In addition, the prospector’s knowledge of the local soil types in terms of performance should be used.
Overburden should always be sampled.
Sampling with excavator.
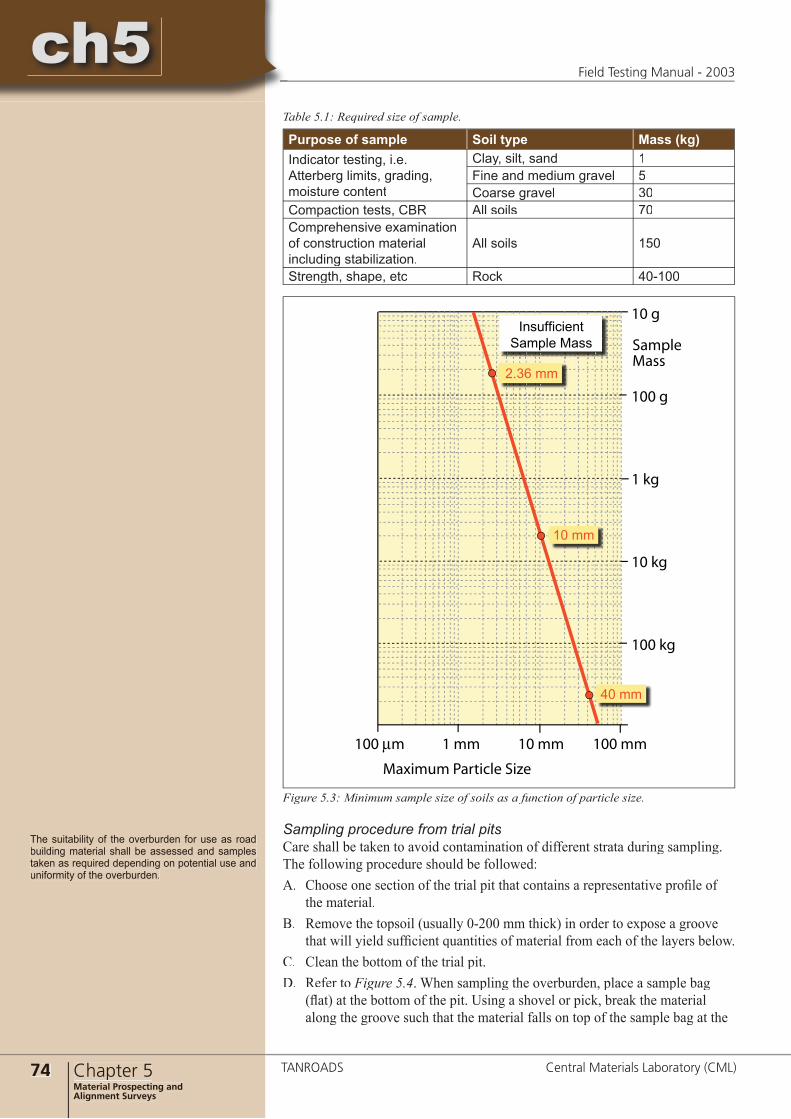
74 Chapter 5Material Prospecting and Alignment Surveys
ch5Field Testing Manual - 2003
TANROADS Central Materials Laboratory (CML)
ch5Purpose of sample Soil type Mass (kg)Indicator testing, i.e. Atterberg limits, grading, moisture content
Clay, silt, sand 1Fine and medium gravel 5Coarse gravel 30
Compaction tests, CBR All soils 70Comprehensive examination of construction material including stabilization.
All soils 150
Strength, shape, etc Rock 40-100
Table 5.1: Required size of sample.
�� �
��� �
� ��
�� ��
��� ��
����������
��� �� � �� �� �� ��� ��
������� �������� ����
������������������ ����
���� ��
�� ��
�� ��
Figure 5.3: Minimum sample size of soils as a function of particle size.
Sampling procedure from trial pitsCare shall be taken to avoid contamination of different strata during sampling. The following procedure should be followed:A. Choose one section of the trial pit that contains a representative profi le of
the material.B. Remove the topsoil (usually 0-200 mm thick) in order to expose a groove
that will yield suffi cient quantities of material from each of the layers below.C. Clean the bottom of the trial pit.D. Refer to Figure 5.4. When sampling the overburden, place a sample bag
(fl at) at the bottom of the pit. Using a shovel or pick, break the material along the groove such that the material falls on top of the sample bag at the
The suitability of the overburden for use as road building material shall be assessed and samples taken as required depending on potential use and uniformity of the overburden.
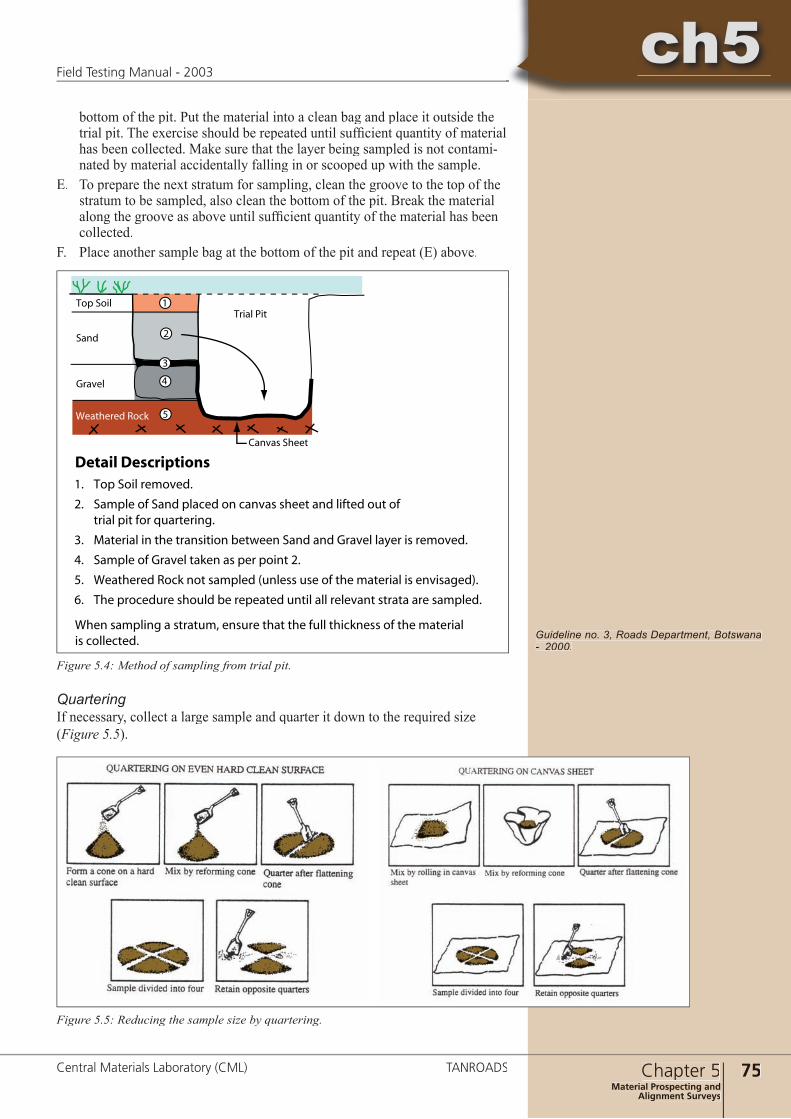
ch5
75Chapter 5Material Prospecting and
Alignment Surveys
ch5Field Testing Manual - 2003
Central Materials Laboratory (CML) TANROADS
bottom of the pit. Put the material into a clean bag and place it outside the bottom of the pit. Put the material into a clean bag and place it outside the trial pit. The exercise should be repeated until suffi cient quantity of material has been collected. Make sure that the layer being sampled is not contami-nated by material accidentally falling in or scooped up with the sample.
E. To prepare the next stratum for sampling, clean the groove to the top of the stratum to be sampled, also clean the bottom of the pit. Break the material along the groove as above until suffi cient quantity of the material has been collected.
F. Place another sample bag at the bottom of the pit and repeat (E) above.
��� ����
����
������
����� ���
��������� ����
������ �����
�
�
�
�
�
�� ��� ���� ��������
�� ������ �� ���� ������ �� ������ ����� ��� ������ ��� ������� ��� ��� �����������
�� �������� �� ��� ���������� ������� ���� ��� ������ ����� �� ��������
�� ������ �� ������ ����� �� ��� ����� ��
�� ��������� ���� ��� ������� ������� ��� �� ��� �������� �� �����������
�� ��� ��������� ������ �� �������� ����� ��� �������� ������ ��� ��������
���� �������� � �������� ������ ���� ��� ���� ��������� �� ��� ���������� ����������
������ ������������
Figure 5.4: Method of sampling from trial pit.
QuarteringIf necessary, collect a large sample and quarter it down to the required size (Figure 5.5(Figure 5.5( ).
Figure 5.5: Reducing the sample size by quartering.
Guideline no. 3, Roads Department, Botswana - 2000.
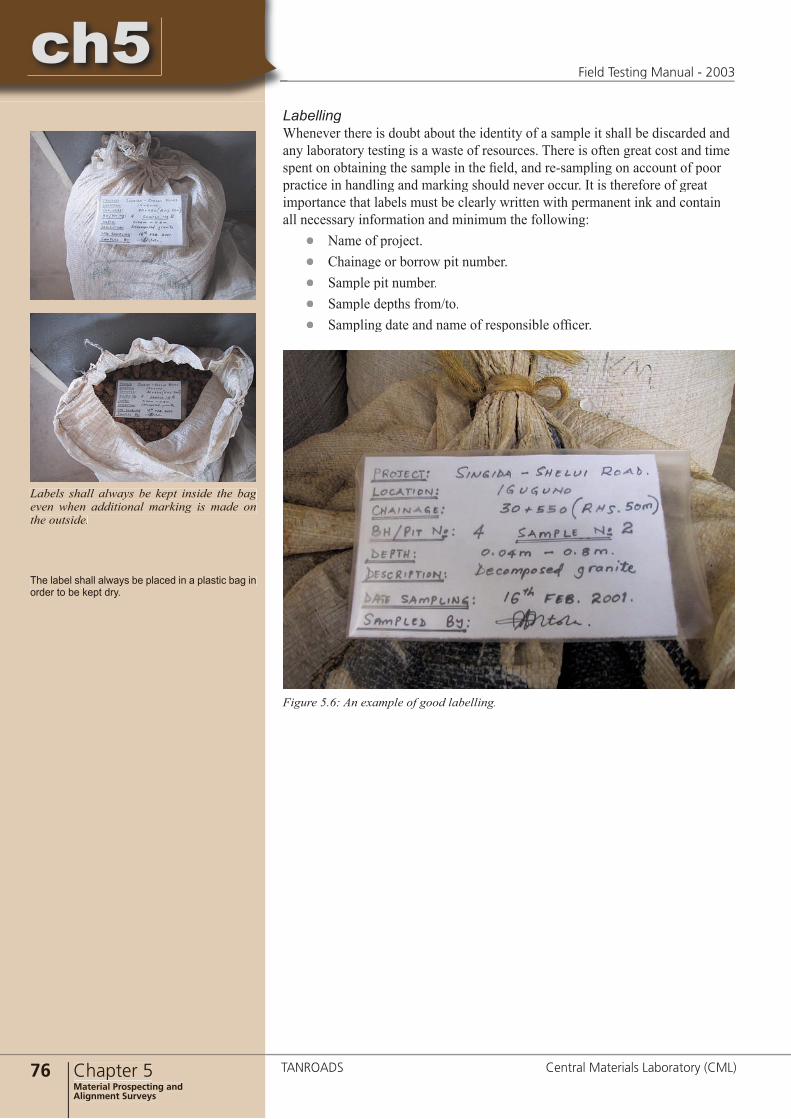
76 Chapter 5Material Prospecting and Alignment Surveys
ch5Field Testing Manual - 2003
TANROADS Central Materials Laboratory (CML)
ch5LabellingWhenever there is doubt about the identity of a sample it shall be discarded and any laboratory testing is a waste of resources. There is often great cost and time spent on obtaining the sample in the fi eld, and re-sampling on account of poor practice in handling and marking should never occur. It is therefore of great importance that labels must be clearly written with permanent ink and contain all necessary information and minimum the following:
● Name of project.● Chainage or borrow pit number.● Sample pit number.● Sample depths from/to.● Sampling date and name of responsible offi cer.
Figure 5.6: An example of good labelling.
Labels shall always be kept inside the bag even when additional marking is made on the outside.
The label shall always be placed in a plastic bag in order to be kept dry.
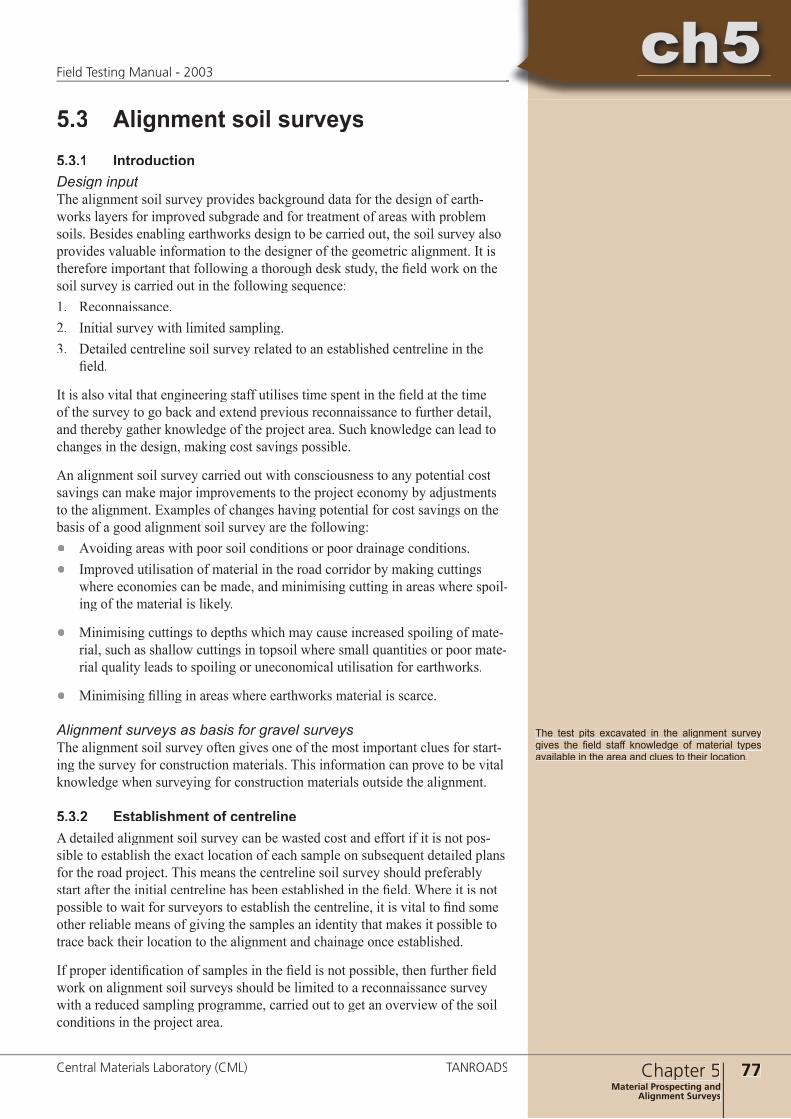
ch5
77Chapter 5Material Prospecting and
Alignment Surveys
ch5Field Testing Manual - 2003
Central Materials Laboratory (CML) TANROADS
5.3 Alignment soil surveys5.3.1 IntroductionDesign inputThe alignment soil survey provides background data for the design of earth-works layers for improved subgrade and for treatment of areas with problem soils. Besides enabling earthworks design to be carried out, the soil survey also provides valuable information to the designer of the geometric alignment. It is therefore important that following a thorough desk study, the fi eld work on the soil survey is carried out in the following sequence:1. Reconnaissance.2. Initial survey with limited sampling.3. Detailed centreline soil survey related to an established centreline in the
fi eld.
It is also vital that engineering staff utilises time spent in the fi eld at the time of the survey to go back and extend previous reconnaissance to further detail, and thereby gather knowledge of the project area. Such knowledge can lead to changes in the design, making cost savings possible.
An alignment soil survey carried out with consciousness to any potential cost savings can make major improvements to the project economy by adjustments to the alignment. Examples of changes having potential for cost savings on the basis of a good alignment soil survey are the following:● Αvoiding areas with poor soil conditions or poor drainage conditions.● Ιmproved utilisation of material in the road corridor by making cuttings
where economies can be made, and minimising cutting in areas where spoil-ing of the material is likely.
● Μinimising cuttings to depths which may cause increased spoiling of mate-rial, such as shallow cuttings in topsoil where small quantities or poor mate-rial quality leads to spoiling or uneconomical utilisation for earthworks.
● Minimising fi lling in areas where earthworks material is scarce.
Alignment surveys as basis for gravel surveysThe alignment soil survey often gives one of the most important clues for start-ing the survey for construction materials. This information can prove to be vital knowledge when surveying for construction materials outside the alignment.
5.3.2 Establishment of centrelineA detailed alignment soil survey can be wasted cost and effort if it is not pos-sible to establish the exact location of each sample on subsequent detailed plans for the road project. This means the centreline soil survey should preferably start after the initial centreline has been established in the fi eld. Where it is not possible to wait for surveyors to establish the centreline, it is vital to fi nd some other reliable means of giving the samples an identity that makes it possible to trace back their location to the alignment and chainage once established.
If proper identifi cation of samples in the fi eld is not possible, then further fi eld work on alignment soil surveys should be limited to a reconnaissance survey with a reduced sampling programme, carried out to get an overview of the soil conditions in the project area.
The test pits excavated in the alignment survey gives the fi eld staff knowledge of material types available in the area and clues to their location.
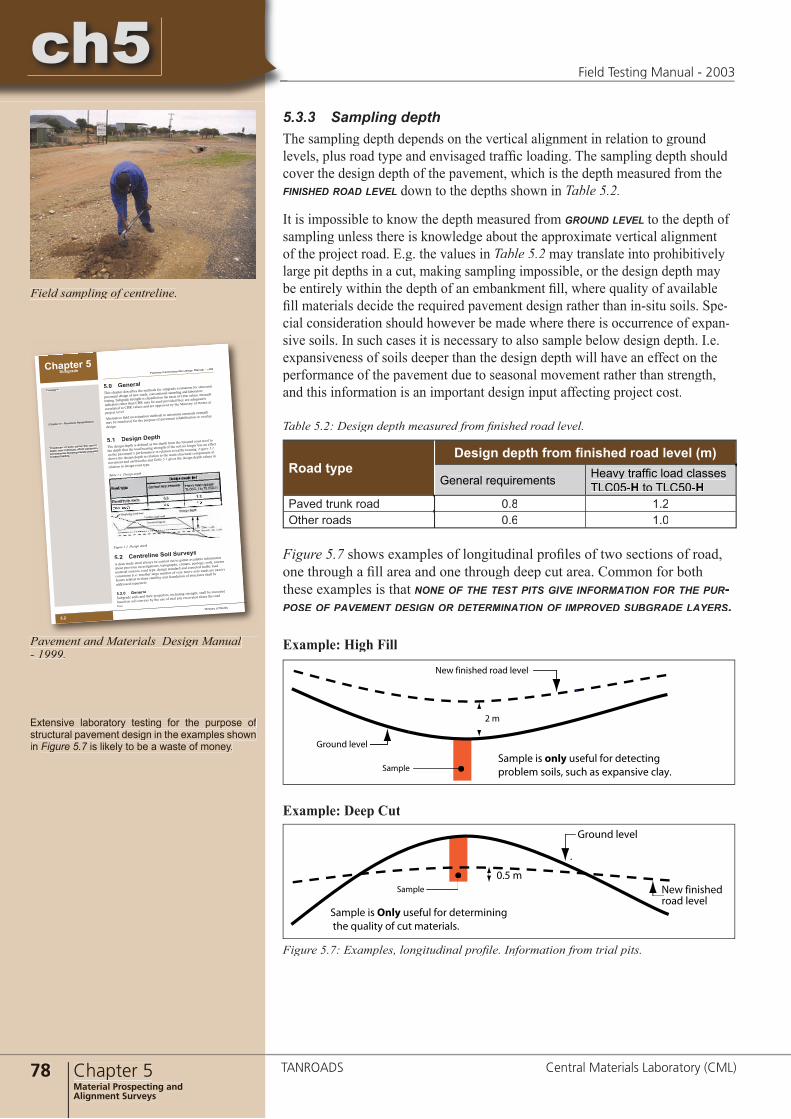
78 Chapter 5Material Prospecting and Alignment Surveys
ch5Field Testing Manual - 2003
TANROADS Central Materials Laboratory (CML)
ch55.3.3 Sampling depthThe sampling depth depends on the vertical alignment in relation to ground levels, plus road type and envisaged traffi c loading. The sampling depth should cover the design depth of the pavement, which is the depth measured from the FINISHED ROAD LEVEL down to the depths shown in Table 5.2.
It is impossible to know the depth measured from GROUND LEVEL to the depth of sampling unless there is knowledge about the approximate vertical alignment of the project road. E.g. the values in Table 5.2 may translate into prohibitively large pit depths in a cut, making sampling impossible, or the design depth may be entirely within the depth of an embankment fi ll, where quality of available fi ll materials decide the required pavement design rather than in-situ soils. Spe-cial consideration should however be made where there is occurrence of expan-sive soils. In such cases it is necessary to also sample below design depth. I.e. expansiveness of soils deeper than the design depth will have an effect on the performance of the pavement due to seasonal movement rather than strength, and this information is an important design input affecting project cost.
Figure 5.7 shows examples of longitudinal profi les of two sections of road, Figure 5.7 shows examples of longitudinal profi les of two sections of road, Figure 5.7one through a fi ll area and one through deep cut area. Common for both these examples is that NONE OF THE TEST PITS GIVE INFORMATION FOR THE PUR-POSE OF PAVEMENT DESIGN OR DETERMINATION OF IMPROVED SUBGRADE LAYERS.
Road typeDesign depth from fi nished road level (m)
General requirements Heavy traffi c load classesTLC05-H to TLC50-H
Paved trunk road 0.8 1.2Other roads 0.6 1.0
Table 5.2: Design depth measured from fi nished road level.
��� �������� ���� �����
� �
������ �����
������ �� ���� ������ ��� ���������������� ������ ���� �� ��������� �����������
������ �����
��� ������� ��� ��������
���� ����������� �� ���� ������ ��� �������������� ������� �� ��� ����������
Example: High Fill
Example: Deep Cut
Extensive laboratory testing for the purpose of structural pavement design in the examples shown in Figure 5.7 is likely to be a waste of money.Figure 5.7 is likely to be a waste of money.Figure 5.7
Figure 5.7: Examples, longitudinal profi le. Information from trial pits.
5.2
Chapter 5Subgrade Pavement and Materials Design Manual - 1999
Ministry of Works
Comments:
5.3
Chapter 5Subgrade
5.0 GeneralThis chapter describes the methods for subgrade evaluation for structural
pa ve ment design of new roads, conventional sampling and laboratory
testing. Subgrade strength is classifi ed on the basis of CBR values. Strength
indicators other than CBR may be used provided they are adequately
correlated to CBR values and are approved by the Ministry of Works at
project level.
Alternative fi eld investigation methods to determine subgrade strength
may be employed for the purpose of pavement rehabilitation or overlay
design.
5.1 Design DepthThe design depth is defi ned as the depth from the fi nished road level to
the depth that the load bearing strength of the soil no longer has an effect
on the pavement’s performance in relation to traffi c loading. Figure 5.1
shows the design depth in relation to the main structural components of
pavement and earthworks and Table 5.1 gives the design depth values in
relation to design road type.
5.2 Centreline Soil Surveys
A desk study shall always be carried out to gather available information
about previous investigations, topography, climate, geology, soils, known
material sources, road type, design standard and expected traffi c load
conditions (i.e. whether large number of very heavy axle loads are likely).
Issues related to slope stability and foundation of structures shall be
addressed separately.
5.2.0 GeneralSubgrade soils and their properties, including strength, shall be classifi ed
based on soil surveys by the use of trial pits excavated along the road
line.
������������������������
������������������������
/Chapter 9 – Pavement Rehabilitation/
Properties of soils below the design
depth may indirectly affect pavement
per-formance, but are generally unrelated
to traffi c loading.
Field sampling of centreline.
Pavement and Materials Design Manual - 1999.

ch5
79Chapter 5Material Prospecting and
Alignment Surveys
ch5Field Testing Manual - 2003
Central Materials Laboratory (CML) TANROADS
5.3.4 Sampling frequencyDistribution of pits and sampling locationsThe sampling frequency depends on a number of factor, where available funds for the actual survey work is one of them. This means the number of locations one can afford to sample has to be used to the maximum and distributed wisely to bring forward the following information that the alignment soil survey should give the designer:● Location of signifi cant changes in soil conditions.● Ρepresentative information about each signifi cant soil condition, suffi cient
to design the pavement for the area.
In order to utilise the resources optimally the following measures may be em-ployed by the fi eld staff:● Making uneven spacing of the sample pits to detect signifi cant changes in
soil conditions and reduce work in areas with similar conditions.
● Excavating more pits than what is sampled and using soil descriptions to reduce the need to carry out laboratory testing of material having the same characteristics.
Minimum requirements, average sampling frequencyThe average sampling frequency given in Table 5.3 is a measure of the total effort put into soil alignment surveys that one would expect for average condi-tions and project type.
There will be considerable variation in sampling frequency along the road line for one project, and there will also be a varying need for effort on soil surveys from project to project depending on site conditions and project type.
Table 5.3: Sampling frequency.
Additional investigations or specialised tests shall be scheduled separately as required.
Road type Indicator testing CBR strength testing
Minimum number of CBR tests for any homogenous sectionMin. for statistical analysis Absolute minimum
Paved trunk roads Minimum 4 per km Minimum 2 per km
5 tests 3 testsOther trunk roads Minimum 2 per km Minimum 1 per km
Gravel roads Minimum 2 per km Minimum 1 per 2 km
80 Chapter 5Material Prospecting and Alignment Surveys
ch5Field Testing Manual - 2003
TANROADS Central Materials Laboratory (CML)
ch55.4 Soils and gravel sources5.4.1 IntroductionThere is no map covering Tanzania to show construction materials for road works, similar to a geological map. Gravels often occur in relatively small localised deposits, scattered around the landscape and often hidden under over-burden. Material prospecting involves looking for clues to the occurrence of useful materials and then digging to see what may be there. Learning to identify features that indicate the presence of gravel from the interpretation of maps and other information is a central activity in prospecting. However, the most impor-tant parts are:1. Desk study, collect existing data and information about project requirements
regarding quantities and quality.2. Field reconnaissance. 3. Field survey, detailed investigations.4. Pit excavation, sampling.5. Testing, material evaluation and reporting.
5.4.2 Environmental considerations and occupied landResources Construction materials are among non-renewable resources and in view of the increasing importance of protecting the natural environment and resources, it is important to make the best use of a source, once found. This implies mapping it and describing it accurately so that it can be correctly classifi ed and therefore correctly applied to a specifi cation.
Confl ict of interestThe conduct of Environmental Impact Assessment (EIA) is a mandatory re-quirement in Tanzania, for new roads and road up-grading, as for other sub-stantial developments. The purpose of EIA is to ensure that a project does not achieve its own goals at the expense of loss or inconvenience to non-benefi cia-ries or future generations.
It is important to foresee potential confl icts of interest with the environment and occupants of land in the area already at the time of prospecting for materials. The responsible fi eld staff is required to obtain all required permissions accord-ing to legislations before starting their work. Wherever possible occupied land and sensitive areas should be avoided even though permission to prospect has been granted. Such areas are likely to be banned from full material exploitation at the time of construction and it does not gain the project to have its design based on material sources that are unlikely to be available.
5.4.3 Desk study for gravel and soil surveysIt is vital for an economical and successful fi eld survey that a thorough desk study is carried out. Normally the major cost of the survey is in the fi eld work, secondly the laboratory work, which value depends entirely of the quality of the fi eld survey.
The most important information required prior to the fi eld survey is in the an-swer to the following questions:● What alternative types of pavement that may be constructed and what are
the required material quality for the various pavement alternatives?● What quantities of material do we look for?
Commen land form in the country, where “good” gravel is found.
Borrow pit of natural gravel. Careful stockpiling is essential to obtain good quality material.
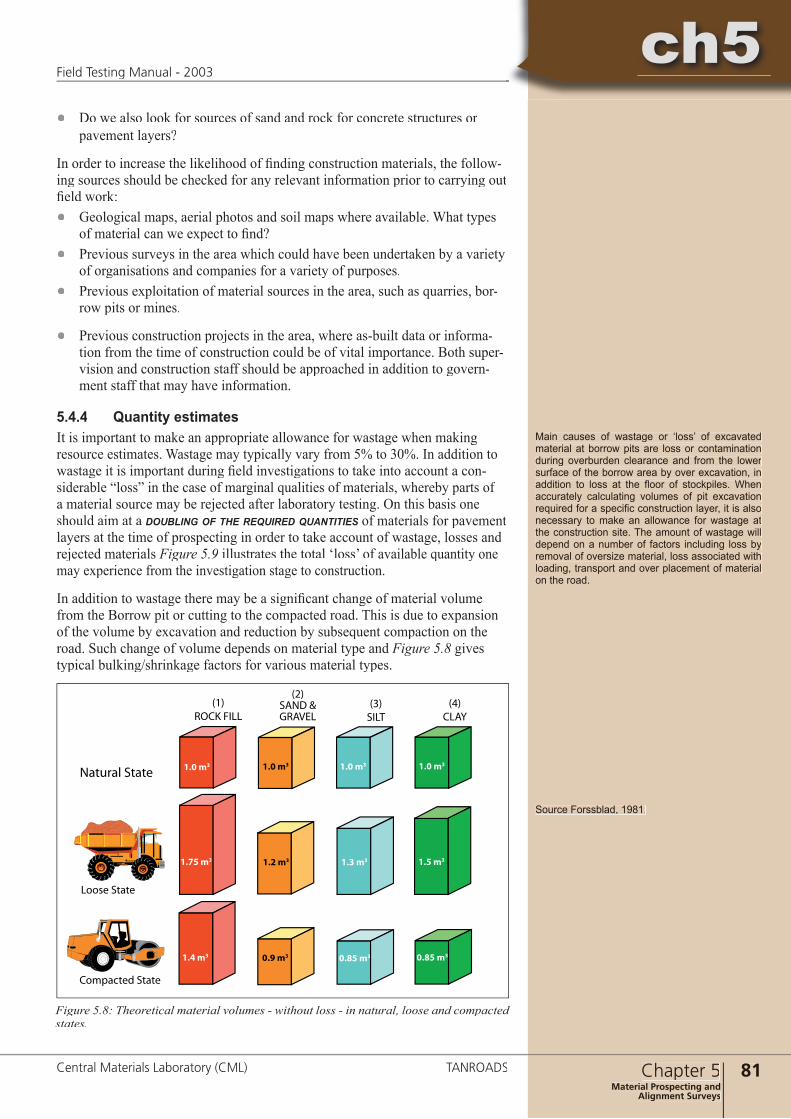
ch5
81Chapter 5Material Prospecting and
Alignment Surveys
ch5Field Testing Manual - 2003
Central Materials Laboratory (CML) TANROADS
● Do we also look for sources of sand and rock for concrete structures or pavement layers?
In order to increase the likelihood of fi nding construction materials, the follow-ing sources should be checked for any relevant information prior to carrying out fi eld work: ● Geological maps, aerial photos and soil maps where available. What types
of material can we expect to fi nd?● Previous surveys in the area which could have been undertaken by a variety
of organisations and companies for a variety of purposes.● Previous exploitation of material sources in the area, such as quarries, bor-
row pits or mines.
● Previous construction projects in the area, where as-built data or informa-tion from the time of construction could be of vital importance. Both super-vision and construction staff should be approached in addition to govern-ment staff that may have information.
5.4.4 Quantity estimatesIt is important to make an appropriate allowance for wastage when making resource estimates. Wastage may typically vary from 5% to 30%. In addition to wastage it is important during fi eld investigations to take into account a con-siderable “loss” in the case of marginal qualities of materials, whereby parts ofa material source may be rejected after laboratory testing. On this basis one should aim at a DOUBLING OF THE REQUIRED QUANTITIES of materials for pavement DOUBLING OF THE REQUIRED QUANTITIES of materials for pavement DOUBLING OF THE REQUIRED QUANTITIESlayers at the time of prospecting in order to take account of wastage, losses and rejected materials Figure 5.9 illustrates the total ‘loss’ of available quantity one may experience from the investigation stage to construction.
In addition to wastage there may be a signifi cant change of material volume from the Borrow pit or cutting to the compacted road. This is due to expansion of the volume by excavation and reduction by subsequent compaction on the road. Such change of volume depends on material type and Figure 5.8 gives typical bulking/shrinkage factors for various material types.
Main causes of wastage or ‘loss’ of excavated material at borrow pits are loss or contamination during overburden clearance and from the lower surface of the borrow area by over excavation, in addition to loss at the fl oor of stockpiles. When accurately calculating volumes of pit excavation required for a specifi c construction layer, it is also necessary to make an allowance for wastage at the construction site. The amount of wastage will depend on a number of factors including loss by removal of oversize material, loss associated with loading, transport and over placement of material on the road.
������� ����
������� �������
�������
�������
��� ��
���� ��
��� ��
��� ��
��� ��
��� �� ���� �� ���� ��
��� ��
��� ��
��� ��
��� ��
������� �����
����� �����
��������� �����
Figure 5.8: Theoretical material volumes - without loss - in natural, loose and compacted states.
Source Forssblad, 1981.
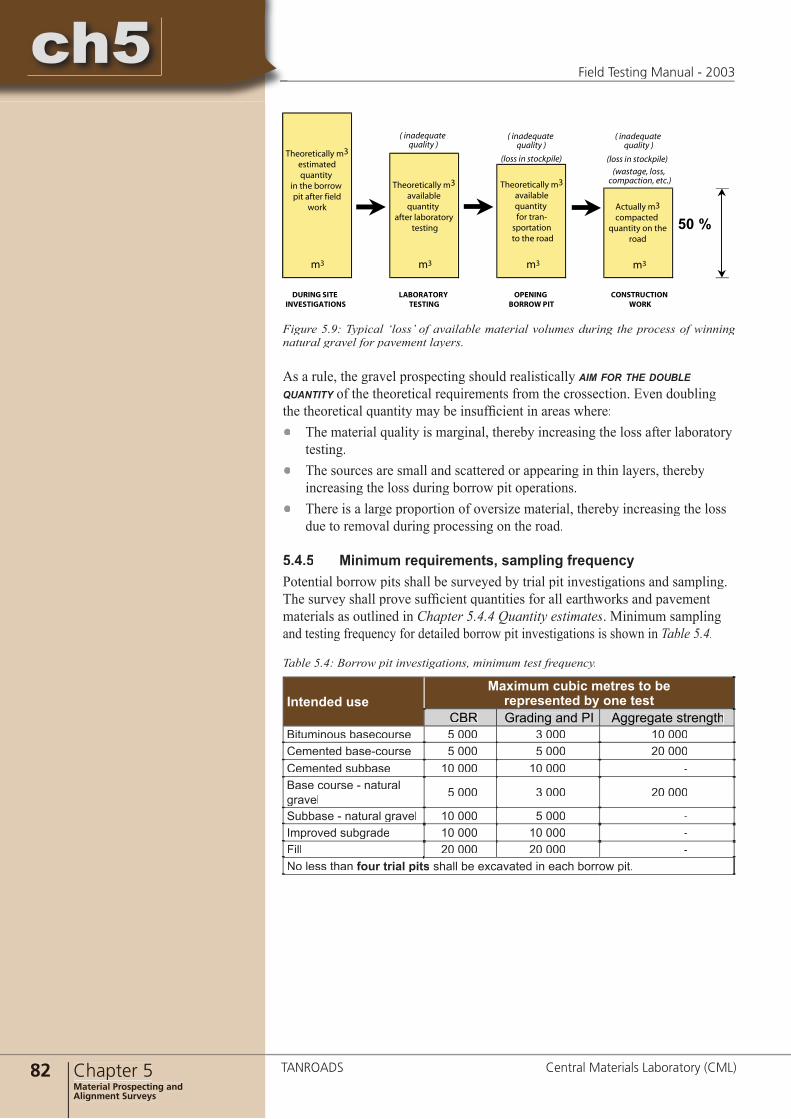
82 Chapter 5Material Prospecting and Alignment Surveys
ch5Field Testing Manual - 2003
TANROADS Central Materials Laboratory (CML)
ch5
������ ������������������
�����������������
������������� ���
����������������
�� �
������������� ��
�����������������
�� ��� ��������� ����� �����
����
������������� ��
�����������������
����� �����������������
������������� ��
�������������������� �����
������������ ��� ����
�������� �����������
�������� �� �������
� ����������������� �
� ����������������� �
� ����������������� �
����� �� ���������� ����� �� ����������
��������� ���������������� �����
�� �� �� ��
Figure 5.9: Typical ‘loss’ of available material volumes during the process of winning natural gravel for pavement layers.
As a rule, the gravel prospecting should realistically AIM FOR THE DOUBLE QUANTITY of the theoretical requirements from the crossection. Even doubling QUANTITY of the theoretical requirements from the crossection. Even doubling QUANTITYthe theoretical quantity may be insuffi cient in areas where:● The material quality is marginal, thereby increasing the loss after laboratory
testing.● Τhe sources are small and scattered or appearing in thin layers, thereby
increasing the loss during borrow pit operations.● Τhere is a large proportion of oversize material, thereby increasing the loss
due to removal during processing on the road.
5.4.5 Minimum requirements, sampling frequencyPotential borrow pits shall be surveyed by trial pit investigations and sampling. The survey shall prove suffi cient quantities for all earthworks and pavement materials as outlined in Chapter 5.4.4 Quantity estimates. Minimum sampling and testing frequency for detailed borrow pit investigations is shown in Table 5.4.
Table 5.4: Borrow pit investigations, minimum test frequency.
Intended useMaximum cubic metres to be
represented by one testCBR Grading and PI Aggregate strength
Bituminous basecourse 5 000 3 000 10 000Cemented base-course 5 000 5 000 20 000Cemented subbase 10 000 10 000 -Base course - natural gravel 5 000 3 000 20 000
Subbase - natural gravel 10 000 5 000 -Improved subgrade 10 000 10 000 -Fill 20 000 20 000 -No less than four trial pits shall be excavated in each borrow pit.

ch5
83Chapter 5Material Prospecting and
Alignment Surveys
ch5Field Testing Manual - 2003
Central Materials Laboratory (CML) TANROADS
5.5 Rock Sources5.5.1 IntroductionRock source prospecting involves looking for clues to the occurrence of useful materials. The engineer should be able to identify features that indicate the pres-ence of hard rock from the interpretation of available topographical and geo-logical maps and even more important, the careful assessment of aerial photo-graphs. Based on the initial study and fi eld reconnaissance sampling, laboratory testing and fi nally drilling is required where the initial samples are encouraging. A natural sequence of an investigation programme will be: 1. Desk study.2. Field reconnaissance.3. Initial sampling and testing of surface rock materials.4. Drilling and/or seismic refraction traversing to prove overburden, quantity,
uniformity and quality of rock (proof drilling and core drilling).5. Testing, material evaluation and reporting.
The selection of hard rock sources for road projects is a major consideration, and the engineer and geologist must be aware of all the factors which together produce a satisfactory hard rock source for full scale production. The nature, extent and accessibility of rock sources play an important role in construction costs. Transport of material is a major cost factor in all road construction, and to ensure economical construction it is important that sources of suitable rock are found in one, or preferably several, locations along the alignment.
5.5.2 Desk study for rock quarry surveysIt is vital for an economical and successful fi eld survey that a thorough desk study is carried out. The following sources of information should be checked for any relevant data prior to carrying out any fi eld work. ● Topographical maps and Geological maps where available.● Aerial photographs.● Collect existing data and information about project requirements regarding
quantities and quality.● Previous surveys in the area which could have been undertaken by a variety
of organisations and companies for a variety of purposes.● Previous construction projects in the area, where as-built data or informa-
tion from the time of construction could be of vital importance. Both supervision and construction staff should be approached in addition to govern-ment staff that may have information.
● Information on commercial or governmental exploitation of material sources in the area such as quarries, borrow pits or mines.
● Information on type of pavement to be constructed and required material quality for the various pavement alternatives.
5.5.3 Quantity estimatesWhen selecting a hard rock quarry for construction the quality and volume are naturally important factors. These factors must be revealed during the investiga-tions of the quarry. Suffi cient drilling to prove a quarry is most important.
Normally the overriding cost of quarry prospecting is in the drilling activity of the fi eld work, secondly the laboratory work, which value depends entirely of the quality of the fi eld survey.
The contractor may not opt to open more than one rock source on a project. However, identifying sev-eral potential quarry sites, increases the chance of receiving competitive bids from contractors having plant with higher mobility.
Potential quarry site at a rock outcrop.
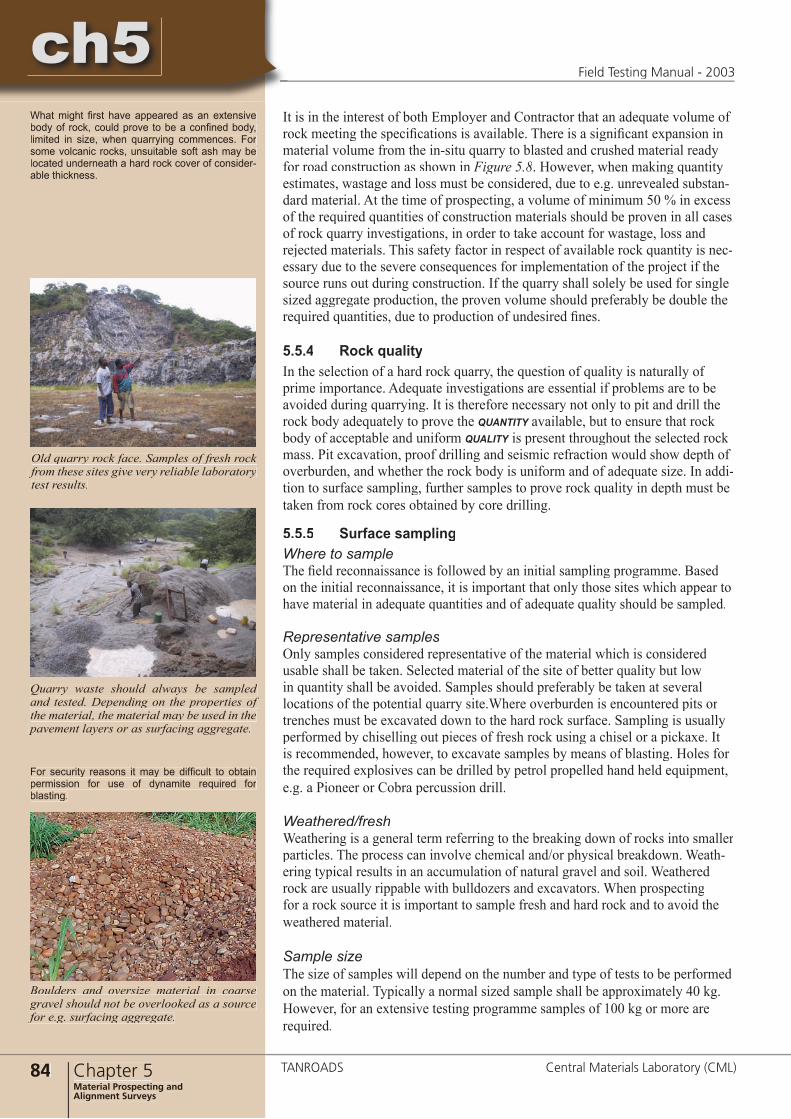
84 Chapter 5Material Prospecting and Alignment Surveys
ch5Field Testing Manual - 2003
TANROADS Central Materials Laboratory (CML)
ch5It is in the interest of both Employer and Contractor that an adequate volume of rock meeting the specifi cations is available. There is a signifi cant expansion in material volume from the in-situ quarry to blasted and crushed material ready for road construction as shown in Figure 5.8. However, when making quantity estimates, wastage and loss must be considered, due to e.g. unrevealed substan-dard material. At the time of prospecting, a volume of minimum 50 % in excess of the required quantities of construction materials should be proven in all cases of rock quarry investigations, in order to take account for wastage, loss and rejected materials. This safety factor in respect of available rock quantity is nec-essary due to the severe consequences for implementation of the project if the source runs out during construction. If the quarry shall solely be used for single sized aggregate production, the proven volume should preferably be double the required quantities, due to production of undesired fi nes.
5.5.4 Rock qualityIn the selection of a hard rock quarry, the question of quality is naturally of prime importance. Adequate investigations are essential if problems are to be avoided during quarrying. It is therefore necessary not only to pit and drill the rock body adequately to prove the QUANTITY available, but to ensure that rock QUANTITY available, but to ensure that rock QUANTITYbody of acceptable and uniform QUALITY is present throughout the selected rock mass. Pit excavation, proof drilling and seismic refraction would show depth of overburden, and whether the rock body is uniform and of adequate size. In addi-tion to surface sampling, further samples to prove rock quality in depth must be taken from rock cores obtained by core drilling.
5.5.5 Surface samplingWhere to sampleThe fi eld reconnaissance is followed by an initial sampling programme. Based on the initial reconnaissance, it is important that only those sites which appear to have material in adequate quantities and of adequate quality should be sampled.
Representative samplesOnly samples considered representative of the material which is considered usable shall be taken. Selected material of the site of better quality but low in quantity shall be avoided. Samples should preferably be taken at several locations of the potential quarry site.Where overburden is encountered pits or trenches must be excavated down to the hard rock surface. Sampling is usually performed by chiselling out pieces of fresh rock using a chisel or a pickaxe. It is recommended, however, to excavate samples by means of blasting. Holes for the required explosives can be drilled by petrol propelled hand held equipment, e.g. a Pioneer or Cobra percussion drill.
Weathered/freshWeathering is a general term referring to the breaking down of rocks into smaller particles. The process can involve chemical and/or physical breakdown. Weath-ering typical results in an accumulation of natural gravel and soil. Weathered rock are usually rippable with bulldozers and excavators. When prospecting for a rock source it is important to sample fresh and hard rock and to avoid the weathered material.
Sample sizeThe size of samples will depend on the number and type of tests to be performed on the material. Typically a normal sized sample shall be approximately 40 kg. However, for an extensive testing programme samples of 100 kg or more are required.
What might fi rst have appeared as an extensive body of rock, could prove to be a confi ned body, limited in size, when quarrying commences. For some volcanic rocks, unsuitable soft ash may be located underneath a hard rock cover of consider-able thickness.
For security reasons it may be diffi cult to obtain permission for use of dynamite required for blasting.
Boulders and oversize material in coarse gravel should not be overlooked as a source for e.g. surfacing aggregate.
Old quarry rock face. Samples of fresh rock from these sites give very reliable laboratory test results.
Quarry waste should always be sampled and tested. Depending on the properties of the material, the material may be used in the pavement layers or as surfacing aggregate.
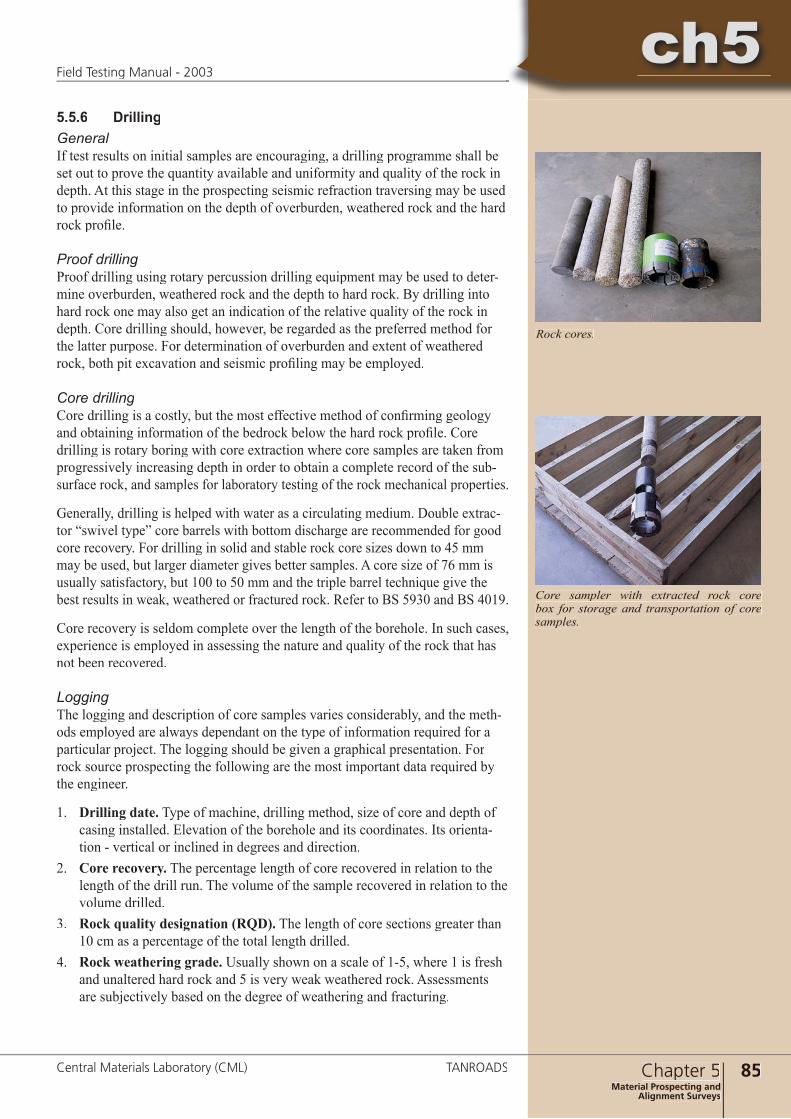
ch5
85Chapter 5Material Prospecting and
Alignment Surveys
ch5Field Testing Manual - 2003
Central Materials Laboratory (CML) TANROADS
5.5.6 DrillingGeneralIf test results on initial samples are encouraging, a drilling programme shall be set out to prove the quantity available and uniformity and quality of the rock in depth. At this stage in the prospecting seismic refraction traversing may be used to provide information on the depth of overburden, weathered rock and the hard rock profi le.
Proof drillingProof drilling using rotary percussion drilling equipment may be used to deter-mine overburden, weathered rock and the depth to hard rock. By drilling into hard rock one may also get an indication of the relative quality of the rock in depth. Core drilling should, however, be regarded as the preferred method for the latter purpose. For determination of overburden and extent of weathered rock, both pit excavation and seismic profi ling may be employed.
Core drillingCore drilling is a costly, but the most effective method of confi rming geology and obtaining information of the bedrock below the hard rock profi le. Core drilling is rotary boring with core extraction where core samples are taken from progressively increasing depth in order to obtain a complete record of the sub-surface rock, and samples for laboratory testing of the rock mechanical properties.
Generally, drilling is helped with water as a circulating medium. Double extrac-tor “swivel type” core barrels with bottom discharge are recommended for good core recovery. For drilling in solid and stable rock core sizes down to 45 mm may be used, but larger diameter gives better samples. A core size of 76 mm is usually satisfactory, but 100 to 50 mm and the triple barrel technique give the best results in weak, weathered or fractured rock. Refer to BS 5930 and BS 4019.
Core recovery is seldom complete over the length of the borehole. In such cases, experience is employed in assessing the nature and quality of the rock that has not been recovered.
LoggingThe logging and description of core samples varies considerably, and the meth-ods employed are always dependant on the type of information required for a particular project. The logging should be given a graphical presentation. For rock source prospecting the following are the most important data required by the engineer.
1. Drilling date. Type of machine, drilling method, size of core and depth of casing installed. Elevation of the borehole and its coordinates. Its orienta-tion - vertical or inclined in degrees and direction.
2. Core recovery. The percentage length of core recovered in relation to the length of the drill run. The volume of the sample recovered in relation to the volume drilled.
3. Rock quality designation (RQD). The length of core sections greater than 10 cm as a percentage of the total length drilled.
4. Rock weathering grade. Usually shown on a scale of 1-5, where 1 is fresh and unaltered hard rock and 5 is very weak weathered rock. Assessments are subjectively based on the degree of weathering and fracturing.
Core sampler with extracted rock core box for storage and transportation of core samples.
Rock cores.
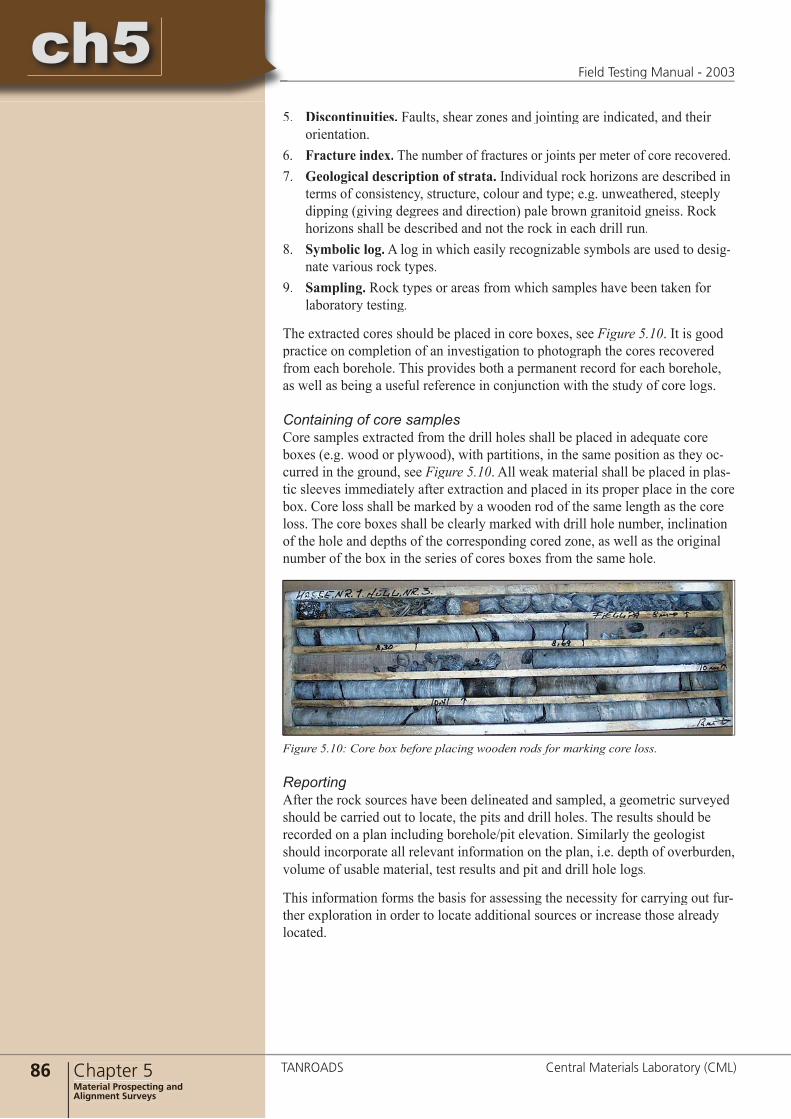
86 Chapter 5Material Prospecting and Alignment Surveys
ch5Field Testing Manual - 2003
TANROADS Central Materials Laboratory (CML)
ch65. Discontinuities. Faults, shear zones and jointing are indicated, and their
orientation. 6. Fracture index. The number of fractures or joints per meter of core recovered.7. Geological description of strata. Individual rock horizons are described in
terms of consistency, structure, colour and type; e.g. unweathered, steeply dipping (giving degrees and direction) pale brown granitoid gneiss. Rock horizons shall be described and not the rock in each drill run.
8. Symbolic log. A log in which easily recognizable symbols are used to desig-nate various rock types.
9. Sampling. Rock types or areas from which samples have been taken for laboratory testing.
The extracted cores should be placed in core boxes, see Figure 5.10. It is good practice on completion of an investigation to photograph the cores recovered from each borehole. This provides both a permanent record for each borehole, as well as being a useful reference in conjunction with the study of core logs.
Containing of core samplesCore samples extracted from the drill holes shall be placed in adequate core boxes (e.g. wood or plywood), with partitions, in the same position as they oc-curred in the ground, see Figure 5.10. All weak material shall be placed in plas-tic sleeves immediately after extraction and placed in its proper place in the core box. Core loss shall be marked by a wooden rod of the same length as the core loss. The core boxes shall be clearly marked with drill hole number, inclination of the hole and depths of the corresponding cored zone, as well as the original number of the box in the series of cores boxes from the same hole.
Figure 5.10: Core box before placing wooden rods for marking core loss.
Reporting After the rock sources have been delineated and sampled, a geometric surveyed should be carried out to locate, the pits and drill holes. The results should be recorded on a plan including borehole/pit elevation. Similarly the geologist should incorporate all relevant information on the plan, i.e. depth of overburden, volume of usable material, test results and pit and drill hole logs.
This information forms the basis for assessing the necessity for carrying out fur-ther exploration in order to locate additional sources or increase those already located.

ch5
87Chapter 6Construction Control
ch6Field Testing Manual - 2003
Central Materials Laboratory (CML) TANROADS
6 Construction control
1
3
4
2
Introduction
Pavement evaluation
Axle load surveys
Geotechnique
5 Material prospecting and alignment surveys
Appendices
6.1 Introduction......................................................................................... 896.2 Earthworks and unbound layers ....................................................... 89
6.2.1 Introduction .............................................................................. 896.2.2 Sampling on the road ............................................................... 906.2.3 Density measurement ............................................................... 906.2.4 Testing of moisture content ...................................................... 936.2.5 Direct strength measurements .................................................. 94
6.3 Cemented Layers................................................................................. 946.3.1 Scope ........................................................................................ 946.3.2 Sampling .................................................................................. 946.3.3 Density ..................................................................................... 946.3.4 Control of site operations ......................................................... 946.3.5 Coring....................................................................................... 95
6.4 Bituminous Layers .............................................................................. 956.4.1 Scope/introduction ................................................................... 956.4.2 Sampling .............................................................................. 956.4.3 Temperature.............................................................................. 966.4.4 Density ..................................................................................... 966.4.5 Moisture- and bitumen content in cold bituminous mixes....... 96
6.5 Bituminous Seals ................................................................................. 986.5.1 Scope ........................................................................................ 986.5.2 Application rate (binder, tack coat, prime and fogspray)......... 986.5.3 Temperature (binder, air, surface) ............................................ 996.5.4 Aggregate spread rate............................................................. 100
6 CONSTRUCTION CONTROL
Chapter 6: Table of Contents

88 Chapter 6Construction Control
ch6Field Testing Manual - 2003
TANROADS Central Materials Laboratory (CML)
ch66.5.5 Sampling (binder/prime) ........................................................ 1006.5.6 Application of precoater......................................................... 1006.5.7 Equipment control and calibration ......................................... 100
6.6 Concrete ............................................................................................. 1016.6.1 Introduction ............................................................................ 1016.6.2 Sampling of fresh concrete..................................................... 1016.6.3 Slump of concrete .................................................................. 1016.6.4 Making and curing specimens for compression test .............. 1026.6.5 Taking core samples of hardened concrete ............................ 1026.6.6 Special tests............................................................................ 103
6.7 Construction control test methods................................................... 104
References ● Pavement and Materials Design Manual - 1999. Ministry of Works, Tanzania.● Standard Specifi cations for Road Works - 2000. Ministry of Works,
Tanzania.● Guideline no. 2 Pavement Testing, Analysis and Interpretation of Test Data.
Roads Department, Botswana - 2000● Guideline no. 3. Methods and Procedures for Prospecting for Road Con-
struction Materials, Roads Department, Botswana - 2000.

ch6
89Chapter 6Construction Control
ch6Field Testing Manual - 2003
Central Materials Laboratory (CML) TANROADS
6 CONSTRUCTION CONTROL6.1 IntroductionThis chapter should be read in close conjunction with the Standard Specifi cationsfor Road Works-2000, where the requirements for testing and quality control is set out in full detail.
Construction control for contract roadworks is divided into:
Production control: Production control is carried out by the contractor for the purpose of satisfying himself that chosen methods and materials meet the specifi ed standards. The production control serves as an early warning for the contractor and helps reduce his risk of failure and associated additional cost to himself of remedial work. The contractor may be obliged to submit results from the production control to the supervising engineer and may in some cases be taken as part of the acceptance control.
Acceptance control: Acceptance control is carried out by the supervising engineer, or on his behalf, to ensure compliance with the specifi ed standards and to enable payments to be made. Results from acceptance control will normally form part of the as-built data as documentation of quality submitted to road inventories of the agency.
This chapter contains guidelines for fi eld testing carried out in the acceptance control, whereas the production control is mentioned where appropriate, how-ever at lesser detail.
It is essential for an effective construction control that there is suffi cient and equal motivation for achieving correct quality of the fi nal product on the sides of both the contractor and the representatives for the controlling authority. One should always aim for a situation whereby all parties see benefi ts in striving for the highest possible quality of materials and workmanship under the circum-stances.
6.2 Earthworks and unbound layers6.2.1 IntroductionTesting on the road and sampling from the road is carried to provide documen-tation of the quality of materials and workmanship as part of the acceptance control. The following categories of fi eld testing work are described here:● Sampling for laboratory testing.● Density tests.● Tests of moisture content.● Strength measurements of compacted layers or in-situ.
Sampling from stockpiles or production plant is normally part of the production control carried out by the Contractor and choice of type and amount of control lies with him unless otherwise specifi ed or directed.
Having to re-do work, or replace mate-rial (picture), is a loss to all involved in the construction.
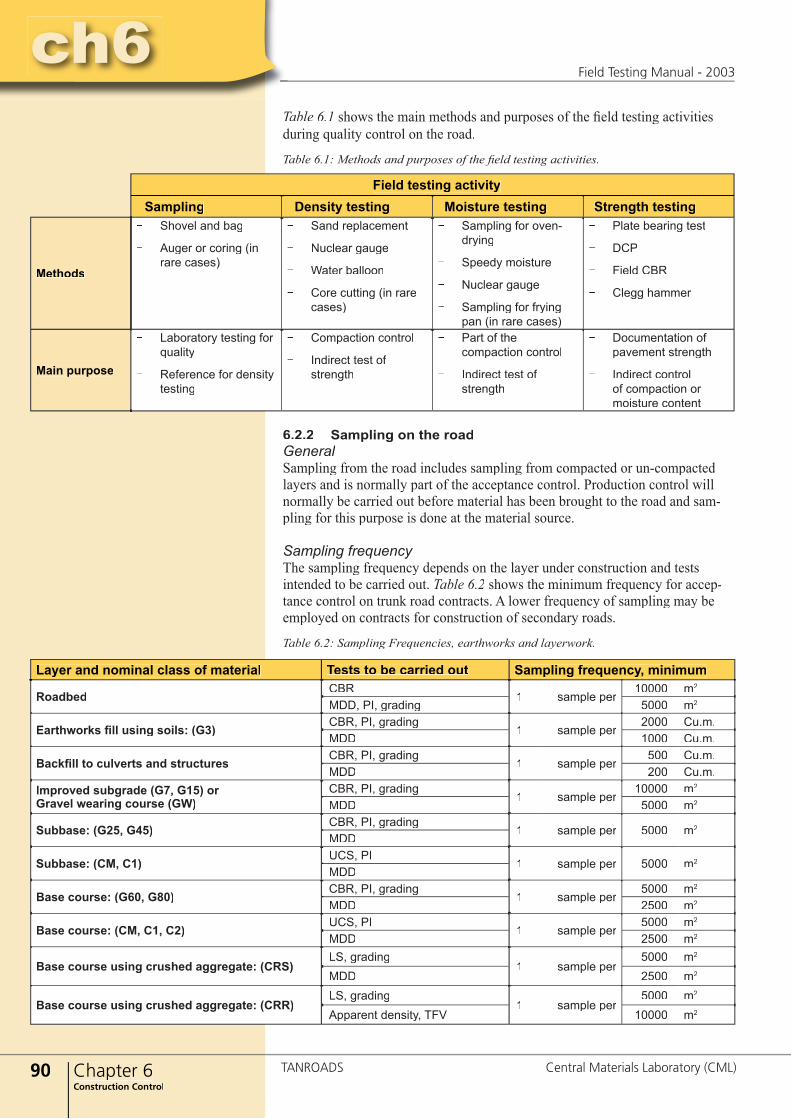
90 Chapter 6Construction Control
ch6Field Testing Manual - 2003
TANROADS Central Materials Laboratory (CML)
ch6Table 6.1 shows the main methods and purposes of the fi eld testing activities during quality control on the road.
Table 6.1: Methods and purposes of the fi eld testing activities.
6.2.2 Sampling on the roadGeneralSampling from the road includes sampling from compacted or un-compacted layers and is normally part of the acceptance control. Production control will normally be carried out before material has been brought to the road and sam-pling for this purpose is done at the material source.
Sampling frequencyThe sampling frequency depends on the layer under construction and tests intended to be carried out. Table 6.2 shows the minimum frequency for accep-tance control on trunk road contracts. A lower frequency of sampling may be employed on contracts for construction of secondary roads.
Table 6.2: Sampling Frequencies, earthworks and layerwork.
Field testing activitySampling Density testing Moisture testing Strength testing
Methods
− Shovel and bag
− Auger or coring (in rare cases)
− Sand replacement
− Nuclear gauge
− Water balloon
− Core cutting (in rare cases)
− Sampling for oven-drying
− Speedy moisture
− Nuclear gauge
− Sampling for frying pan (in rare cases)
− Plate bearing test
− DCP
− Field CBR
− Clegg hammer
Main purpose
− Laboratory testing for quality
− Reference for density testing
− Compaction control
− Indirect test of strength
− Part of the compaction control
− Indirect test of strength
− Documentation of pavement strength
− Indirect control of compaction or moisture content
Layer and nominal class of material Tests to be carried out Sampling frequency, minimum
Roadbed CBR 1 sample per
10000 m2
MDD, PI, grading 5000 m2
Earthworks fi ll using soils: (G3) CBR, PI, grading1 sample per
2000 Cu.m.MDD 1000 Cu.m.
Backfi ll to culverts and structures CBR, PI, grading1 sample per
500 Cu.m.MDD 200 Cu.m.
Improved subgrade (G7, G15) orGravel wearing course (GW)
CBR, PI, grading1 sample per
10000 m2
MDD 5000 m2
Subbase: (G25, G45) CBR, PI, grading1 sample per 5000 m2
MDD
Subbase: (CM, C1) UCS, PI1 sample per 5000 m2
MDD
Base course: (G60, G80) CBR, PI, grading1 sample per
5000 m2
MDD 2500 m2
Base course: (CM, C1, C2) UCS, PI1 sample per
5000 m2
MDD 2500 m2
Base course using crushed aggregate: (CRS)LS, grading
1 sample per5000 m2
MDD 2500 m2
Base course using crushed aggregate: (CRR)LS, grading
1 sample per5000 m2
Apparent density, TFV 10000 m2

ch6
91Chapter 6Construction Control
ch6Field Testing Manual - 2003
Central Materials Laboratory (CML) TANROADS
Sampling procedureSampling from the road should be carried out at one chainage profi le, i.e. not by taking many partial samples along the road to make up a combined sample. Sampling from chainage profi les gives the correct impression of the variability of the material whereas adding small amounts of material along the road will make a mixture of material that in practice will not be mixed on the road by the processing equipment. Effective deliberate mixing of different materials on the road can be expected only where the material has been dumped in the same profi le chainages by dumping one material on top of the other, or by dumping in separate rows next to each other.
Samples for tests of grading and Atterberg limits should be taken AFTER COMPACTION
on the road. This is particularly important where the material contains soft par-ticles that break down easily during compaction. The alternative, if this is not possible, is to ensure that the sample for tests of Atterberg limits are taken after the material has been compacted in the laboratory.
Samples for tests of MDD and CBR should always be taken BEFORE COMPACTION
on the road as the MDD reference value and measured CBR strength will be incorrect if the material is compacted for the second time in the laboratory.
In all cases samples should preferably be taken AFTER MIXING of the material by AFTER MIXING of the material by AFTER MIXING
the equipment on the road. If this is not possible, sampling should be carried out by taking several partial samples within the vicinity of the chainage profi le that is the reference identifi cation of the sample.
6.2.3 Density measurementGeneralThe principle of the conventional methods to measure density is to excavate a hole in the layer - which gives the weight of material - and to measure the vol-ume of the hole. The diffi culty is associated with fi nding the volume in the layer that the excavated material occupied. ● Sand replacement and the water balloon methods rely on fi nding the volume
by replacing the excavated material with a medium of known density, eitherwater or loose, dry sand. The water balloon method is today not very com-mon due to practical problems in execution of the test and is generally not recommended.
● Density measurements with nuclear gauges rely on the instrument’s inter-pretation of differences in resistance to penetration of nuclear radiation through media of different density.
● Core cutting gives volume by predetermining the size of the excavated hole with a calibrated core of known volume.
In all cases the DRY density is the parameter that shows degree of compaction, i.e. describing how closely the solid particles are packed together, and is the reported result of density measurements for construction control. The moisture content of the tested material is therefore an essential part of the measurements and will have a direct infl uence on the reported results. See further in Chapter 6.2.4.
Choice of methodIn Table 6.3 the weaknesses and common errors of the various methods are described, and the consequences of errors are described in broad terms.
The risk of errors by mixing material of different types when changing material source is minimised by adherence to the procedure of taking samples in chainage profi les.
Sand replacement testing is slow, but is the reference method that most contract specifi -cations revert to in case of disputes.
Time of sampling Tests
After compaction Grading, Atterberg limits
Before compaction CBR, MDD
Core drilling in existing pavement.

92 Chapter 6Construction Control
ch6Field Testing Manual - 2003
TANROADS Central Materials Laboratory (CML)
ch6
Method Inherent weakness of the test method
Common operator error while performing the test
Consequences for the test results
Sand replacement or water balloon
• Small sample size • Variation in the density of refe-
rence medium (sand or water)Variable
Wrong shape of the hole, usually narrower towards the bottom
Varies, usually too high density
Irregular sides of the hole, especiallyin materials with high content ofcoarse particles
Too high density
• Leaving out stones when measuring moisture content of the excavated material
• Failure to take account of irre-gularities in the surface of the layer
Too low density
Nuclear gauge
Depth of measurement does notcoincide with thickness of measuredlayer
• Failure to compensate for inherent statistical variation in nuclear radiation counts by repeating the counts
• Failure to carry out regular calibration and service of the instrument
Variable
Wrong or inaccurate reference countsLocation near vertical structures while measuring Too high density
• Location near vertical structures while taking daily standard counts
• Failure to apply moisture correction
• Air gap between source and measured material
Too low density
Core cutting
Small sample size Variable
Change of soil density during coringVaries, usually too high density
Leaving out stones when measuringmoisture content of the excavatedmaterial
Too low density
Table 6.3: Density test methods. Inherent weakness of method and common operator errors.
Test frequencyTable 6.4 shows the minimum frequency of fi eld density testing for acceptance control on trunk road contracts. A lower frequency of density testing may be employed on contracts for construction of secondary roads. The frequencies in the Table 6.4 are set out for conventional methods such as sand replacement and water balloon. Required test frequency will depend on e.g. the capacity of the equipment in use, and one should take advantage of high capacity equipment such as nuclear gauges by increasing the frequency well above the minimum set out in Table 6.4.

ch6
93Chapter 6Construction Control
ch6Field Testing Manual - 2003
Central Materials Laboratory (CML) TANROADS
Layer and nominal class of material Frequency, minimum Absolute minimum
Roadbed 1 test per 1000 m2 3 tests per section and1 test per 50 m
Earthworks fi ll using soils: (G3) 1 test per 200 Cu.m. 3 per section per layerBackfi ll to culverts and structures 2 tests per 10 Cu.m. 2 per section Fill or improved subgrade layers using dump rock: (DR) Method specifi cationImproved subgrade layers using gravel/soils: (G7, G15) 1 test per 1000 m2 4 per section per layerGravel wearing course used on gravel roads: (GW) 1 test per 1000 m2 4 per section Subbase: (G25, G45, CM, C1) 1 test per 750 m2 5 per section Base course: (G60, G80, CRS, CRR, CM, C1, C2) 1 test per 500 m2 6 per section Frequencies should be increased when using high capacity equipment such as nuclear gauges.
Table 6.4: Testing frequencies, fi eld density for earthworks and layerwork.
6.2.4 Testing of moisture contentTable 6.5 shows the weaknesses and common errors of the various methods for testing fi eld moisture content in construction control, and the consequences of errors are briefl y described.
Table 6.5: Test methods for moisture content. Features of each method.
MethodFeatures of methods for testing moisture content:Advantages: +Limitations: -
Sampling and oven-drying+ Large sample size is possible.+ Results are reliable when sampling testing is carried out correctly.- Results take long to be available, normally over night.
Speedy moisture
+ Results are obtained very fast.
- Coarse material cannot be included and requires correction in order to fi nd moisture content of total sample. This leads to lesser accuracy and may introduce errors.
- Results vary more than tests by oven-drying.- Small sample size reduces accuracy.- Calibration is required.
Nuclear gauge
+ Results are obtained very fast.
+/- The accuracy of the results depends on applying moisture correction against oven-drying for each new tested material type.
-The depth of measurement is normally varying depending on the moisture content (moist makes shallow and dry makes deep) and measurements cannot normally be directed to a certain desired depth by the operator unless special equipment is used.
- Calibration is required.
Sampling and pan-drying
+ Large sample size is possible.+ Results are obtained fast.
- Results are not reliable on materials having high organic contents, that will combust and give a wrong impression of the moisture content.
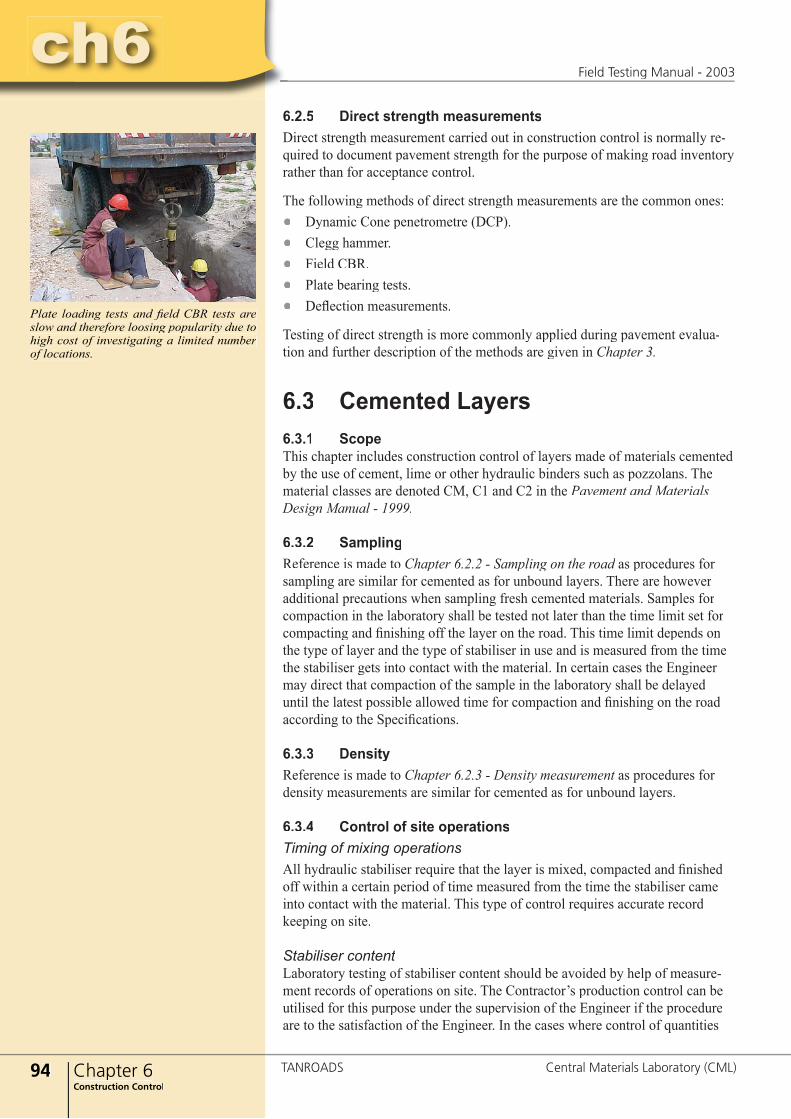
94 Chapter 6Construction Control
ch6Field Testing Manual - 2003
TANROADS Central Materials Laboratory (CML)
ch66.2.5 Direct strength measurementsDirect strength measurement carried out in construction control is normally re-quired to document pavement strength for the purpose of making road inventory rather than for acceptance control.
The following methods of direct strength measurements are the common ones:● Dynamic Cone penetrometre (DCP).● Clegg hammer.● Field CBR.● Plate bearing tests. ● Defl ection measurements.
Testing of direct strength is more commonly applied during pavement evalua-tion and further description of the methods are given in Chapter 3.
6.3 Cemented Layers6.3.1 ScopeThis chapter includes construction control of layers made of materials cemented by the use of cement, lime or other hydraulic binders such as pozzolans. The material classes are denoted CM, C1 and C2 in the Pavement and Materials Design Manual - 1999.
6.3.2 SamplingReference is made to Chapter 6.2.2 - Sampling on the road as procedures for Chapter 6.2.2 - Sampling on the road as procedures for Chapter 6.2.2 - Sampling on the roadsampling are similar for cemented as for unbound layers. There are however additional precautions when sampling fresh cemented materials. Samples for compaction in the laboratory shall be tested not later than the time limit set for compacting and fi nishing off the layer on the road. This time limit depends on the type of layer and the type of stabiliser in use and is measured from the time the stabiliser gets into contact with the material. In certain cases the Engineer may direct that compaction of the sample in the laboratory shall be delayed until the latest possible allowed time for compaction and fi nishing on the road according to the Specifi cations.
6.3.3 DensityReference is made to Chapter 6.2.3 - Density measurement as procedures for Chapter 6.2.3 - Density measurement as procedures for Chapter 6.2.3 - Density measurementdensity measurements are similar for cemented as for unbound layers.
6.3.4 Control of site operationsTiming of mixing operationsAll hydraulic stabiliser require that the layer is mixed, compacted and fi nished off within a certain period of time measured from the time the stabiliser came into contact with the material. This type of control requires accurate record keeping on site.
Stabiliser contentLaboratory testing of stabiliser content should be avoided by help of measure-ment records of operations on site. The Contractor’s production control can be utilised for this purpose under the supervision of the Engineer if the procedure are to the satisfaction of the Engineer. In the cases where control of quantities
Plate loading tests and fi eld CBR tests are slow and therefore loosing popularity due to high cost of investigating a limited number of locations.
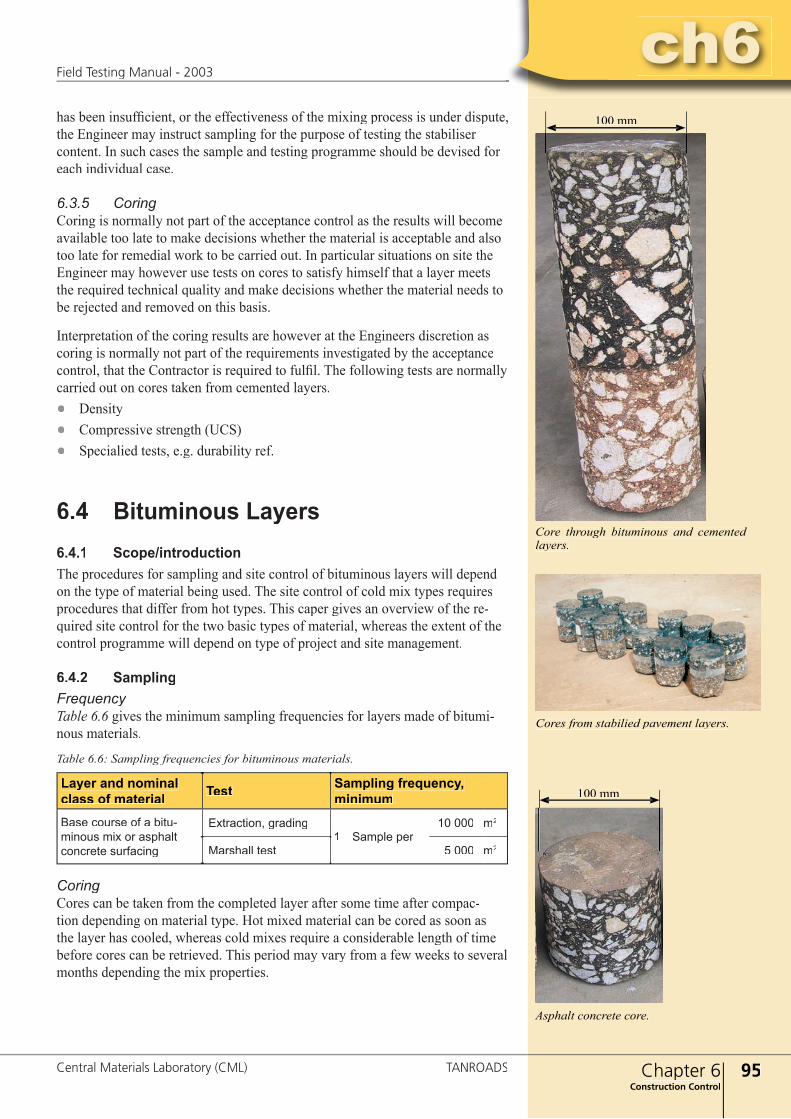
ch6
95Chapter 6Construction Control
ch6Field Testing Manual - 2003
Central Materials Laboratory (CML) TANROADS
has been insuffi cient, or the effectiveness of the mixing process is under dispute, the Engineer may instruct sampling for the purpose of testing the stabiliser content. In such cases the sample and testing programme should be devised for each individual case.
6.3.5 CoringCoring is normally not part of the acceptance control as the results will become available too late to make decisions whether the material is acceptable and also too late for remedial work to be carried out. In particular situations on site the Engineer may however use tests on cores to satisfy himself that a layer meets the required technical quality and make decisions whether the material needs to be rejected and removed on this basis.
Interpretation of the coring results are however at the Engineers discretion as coring is normally not part of the requirements investigated by the acceptance control, that the Contractor is required to fulfi l. The following tests are normally carried out on cores taken from cemented layers.● Density● Compressive strength (UCS)● Specialied tests, e.g. durability ref.
6.4 Bituminous Layers6.4.1 Scope/introduction The procedures for sampling and site control of bituminous layers will depend on the type of material being used. The site control of cold mix types requires procedures that differ from hot types. This caper gives an overview of the re-quired site control for the two basic types of material, whereas the extent of the control programme will depend on type of project and site management.
6.4.2 SamplingFrequencyTable 6.6 gives the minimum sampling frequencies for layers made of bitumi-Table 6.6 gives the minimum sampling frequencies for layers made of bitumi-Table 6.6nous materials.
Table 6.6: Sampling frequencies for bituminous materials.
CoringCores can be taken from the completed layer after some time after compac-tion depending on material type. Hot mixed material can be cored as soon as the layer has cooled, whereas cold mixes require a considerable length of time before cores can be retrieved. This period may vary from a few weeks to several months depending the mix properties.
Layer and nominal class of material Test Sampling frequency,
minimumBase course of a bitu-minous mix or asphalt concrete surfacing
Extraction, grading1 Sample per
10 000 m2
Marshall test 5 000 m2
100 mm
100 mm
Core through bituminous and cemented layers.
Asphalt concrete core.
Cores from stabilied pavement layers.
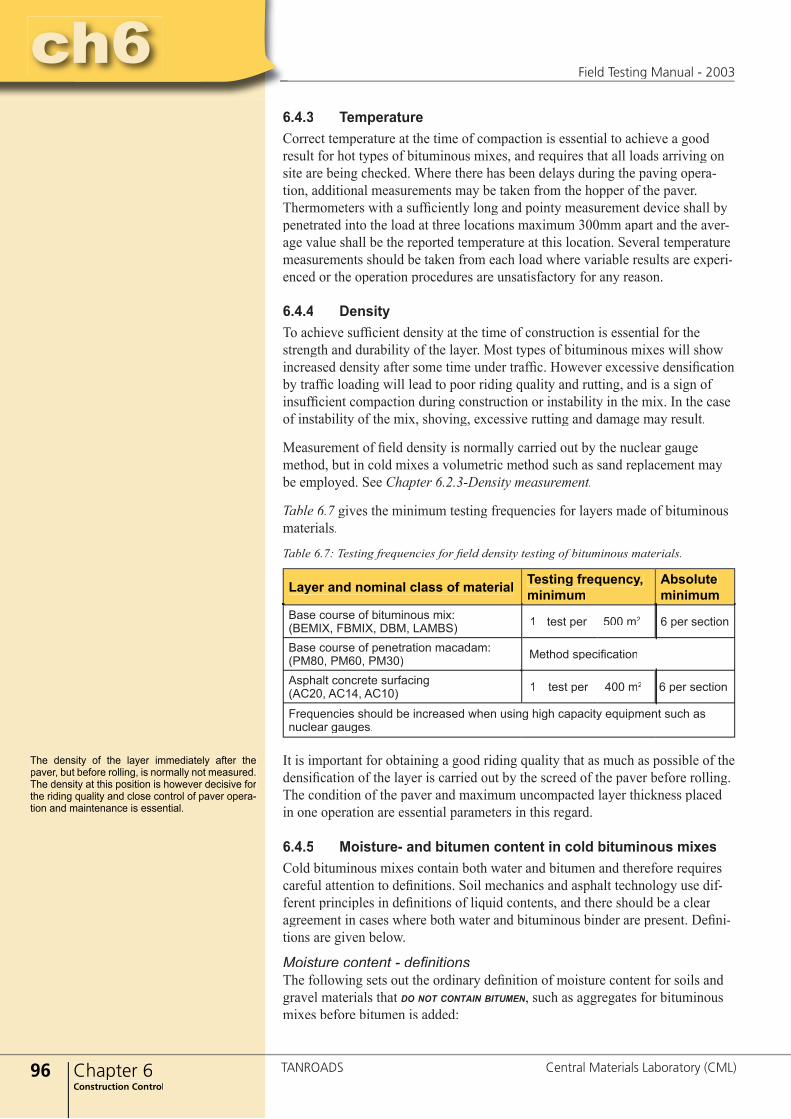
96 Chapter 6Construction Control
ch6Field Testing Manual - 2003
TANROADS Central Materials Laboratory (CML)
ch66.4.3 Temperature Correct temperature at the time of compaction is essential to achieve a good result for hot types of bituminous mixes, and requires that all loads arriving on site are being checked. Where there has been delays during the paving opera-tion, additional measurements may be taken from the hopper of the paver. Thermometers with a suffi ciently long and pointy measurement device shall by penetrated into the load at three locations maximum 300mm apart and the aver-age value shall be the reported temperature at this location. Several temperature measurements should be taken from each load where variable results are experi-enced or the operation procedures are unsatisfactory for any reason.
6.4.4 DensityTo achieve suffi cient density at the time of construction is essential for the strength and durability of the layer. Most types of bituminous mixes will show increased density after some time under traffi c. However excessive densifi cation by traffi c loading will lead to poor riding quality and rutting, and is a sign of insuffi cient compaction during construction or instability in the mix. In the case of instability of the mix, shoving, excessive rutting and damage may result.
Measurement of fi eld density is normally carried out by the nuclear gauge method, but in cold mixes a volumetric method such as sand replacement may be employed. See Chapter 6.2.3-Density measurement.
Table 6.7 gives the minimum testing frequencies for layers made of bituminous Table 6.7 gives the minimum testing frequencies for layers made of bituminous Table 6.7materials.
Table 6.7: Testing frequencies for fi eld density testing of bituminous materials.
It is important for obtaining a good riding quality that as much as possible of the densifi cation of the layer is carried out by the screed of the paver before rolling. The condition of the paver and maximum uncompacted layer thickness placed in one operation are essential parameters in this regard.
6.4.5 Moisture- and bitumen content in cold bituminous mixesCold bituminous mixes contain both water and bitumen and therefore requires careful attention to defi nitions. Soil mechanics and asphalt technology use dif-ferent principles in defi nitions of liquid contents, and there should be a clear agreement in cases where both water and bituminous binder are present. Defi ni-tions are given below.
Moisture content - defi nitionsThe following sets out the ordinary defi nition of moisture content for soils and gravel materials that DO NOT CONTAIN BITUMEN, such as aggregates for bituminous mixes before bitumen is added:
Layer and nominal class of material Testing frequency, minimum
Absolute minimum
Base course of bituminous mix: (BEMIX, FBMIX, DBM, LAMBS) 1 test per 500 m2 6 per section
Base course of penetration macadam:(PM80, PM60, PM30) Method specifi cation
Asphalt concrete surfacing(AC20, AC14, AC10) 1 test per 400 m2 6 per section
Frequencies should be increased when using high capacity equipment such as nuclear gauges.
The density of the layer immediately after the paver, but before rolling, is normally not measured. The density at this position is however decisive for the riding quality and close control of paver opera-tion and maintenance is essential.

ch6
97Chapter 6Construction Control
ch6Field Testing Manual - 2003
Central Materials Laboratory (CML) TANROADS
wN =mW x 100mS
where: wN is moisture content where bitumen is NOT present in the mate- rial, i.e. before adding of bitumen (in % )
mW is mass of water (in g )
mS is mass of dry material (in g )
The following is the defi nition of moisture content for cold bituminous materi-als, i.e. AFTER BITUMEN IS ADDED:
wB =mW x 100mSB
where: wB is moisture content where bitumen is present in the material, (in % ) mW is mass of water (in g ) mSB is mass of dry material including bitumen (in g)
This means the dry density of a cold bituminous mix is defi ned as the density of the material including bitumen, but excluding water.
Method for measuring moisture contentCold bituminous mixes contain water as an important part of the composition of the materials. In order to obtain the density value of the material excluding water, it is necessary to fi nd the moisture content. Due to the presence of bitu-men (that contains hydrogen) the nuclear gauge cannot be used for measuring moisture content, and drying of a sample is required.
Bitumen content - defi nitionThe following is the defi nition of bitumen content for cold bituminous materials:
B =mB x 100mSB
where: B is bitumen content (in % )
mB is mass of bitumen (in g )
mSB is mass of dry material including bitumen (in g)
If moisture content of materials containing bitumen was calculated on the basis of dry aggregate weight without bitumen, one would have to carry out bitumen extraction test every time moisture content was to be determined.
It is worth noticing that moisture content is a percentage of the mass of material without water, while bitumen content is a percentage of the total dry mass including the bitumen itself.
W
98 Chapter 6Construction Control
ch6Field Testing Manual - 2003
TANROADS Central Materials Laboratory (CML)
ch66.5 Bituminous Seals6.5.1 GeneralThis chapter includes procedures for sampling and site control of all work where bituminous distributors are in use, i.e. surface treatments, tack coat, prime, fogspray and work with related aggregates for these seals.
6.5.2 Application rate (binder, tack coat, prime and fogspray)GeneralControl of application rates of bituminous binders requires knowledge about the aimed application rates and sometimes the relationship between weight, volume and temperature of the sprayed material. Bituminous materials change their den-sity as a function of temperature and it is important to clarify whether the aimed application rate is by weigh in kg per area, or whether it is a volume measure in litres per area.
It is important to obtain fi eld testing results that are either directly comparable with the aimed spray rates, or to make sure that reliable conversion factors are applied where fi eld results are not comparable with the aimed results. Examples of conversion using dipstick measurements and respectively sample plates, are given below, with the following legend:
Legend:RVCRVCR is corrected rate, cold binder (in l/m2 )RVHRVHR is corrected rate, hot binder, i.e. spraying temperature (in l/m2 )RMRMR is corrected rate, (in kg/m2)
MVH is measured rate, hot binder, i.e. spraying temperature (in l/m2)MM is measured rate, (in kg/m2)
ρH is the density of hot binder, i.e. spraying temperature (in Mg/m3)ρC is the density of cold binder (in Mg/m3)
Site measurement by volume (dipstick)Measurement by DIPSTICK gives the application rate in DIPSTICK gives the application rate in DIPSTICK VOLUME AT SPRAYING TEMPERATURE. This is usually the most convenient and reliable method for site control, but requires that the Contractor’s equipment is calibrated to the satisfaction of the Engineer. Measurement by dipstick has a further advantage that it gives a measure of consumed material. This eliminates any temptation to under-apply binder and compensate for this by manually adjusting the spray rate where sample plates are placed.
● Where aimed (specifi ed) application rate is given in l/m2 COLD rate:COLD rate:COLD
RVCRVCR = MVH xρH
ρC
● Where aimed (specifi ed) application rate is given in kg/m2:
RM = MVH x ρH
● Where aimed (specifi ed) application rate is given in l/m2 HOT rate:HOT rate:HOT
Dipstick measurements in l/m2 at spraying temperature is used directly without correction.
Measurement of application rate by volume requires further clarifi cation of the temperature to which the rate applies in order to be a meaningful parameter.
Cold binder refers to the standard temperature at which density testing of the binder has been performed, usually 20oC.
Surfacing operation.
Spraying tack coat.
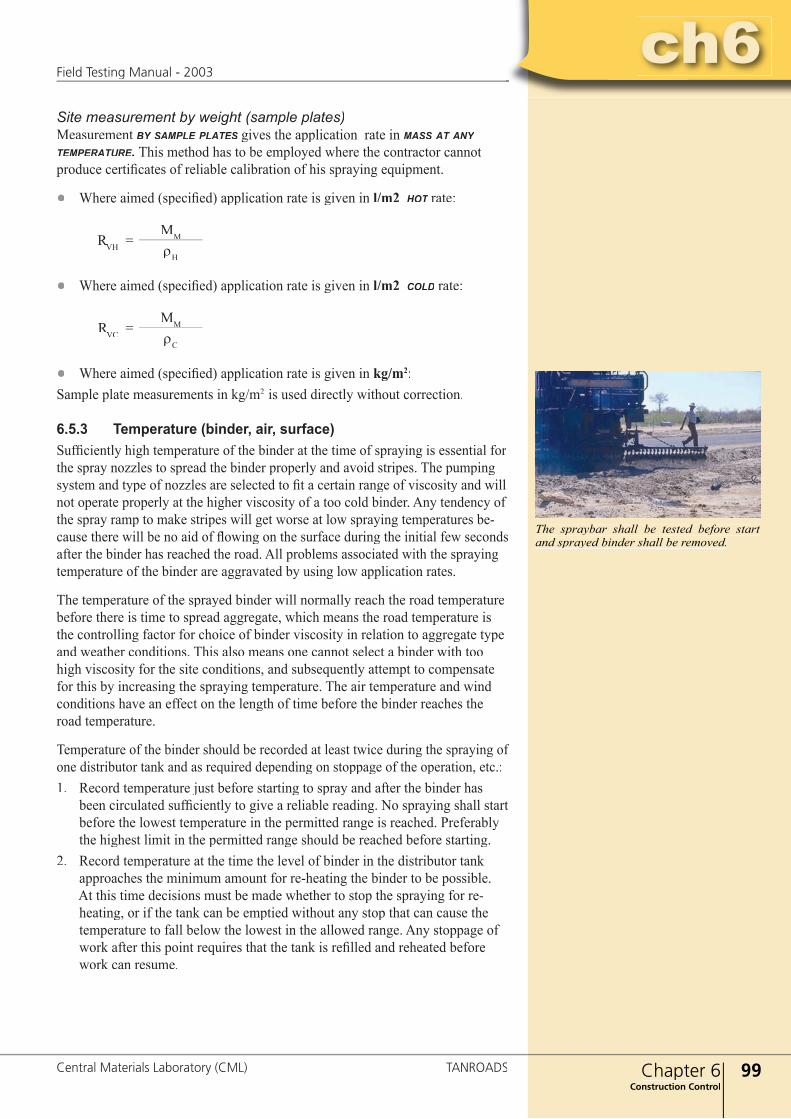
ch6
99Chapter 6Construction Control
ch6Field Testing Manual - 2003
Central Materials Laboratory (CML) TANROADS
Site measurement by weight (sample plates)Measurement BY SAMPLE PLATES gives the application rate in BY SAMPLE PLATES gives the application rate in BY SAMPLE PLATES MASS AT ANY TEMPERATURE. This method has to be employed where the contractor cannot produce certifi cates of reliable calibration of his spraying equipment.
● Where aimed (specifi ed) application rate is given in l/m2 HOT rate:
RVHRVHR =MM
ρH
● Where aimed (specifi ed) application rate is given in l/m2 COLD rate:COLD rate:COLD
RVCRVCR =MM
ρC
● Where aimed (specifi ed) application rate is given in kg/m2:Sample plate measurements in kg/m2 is used directly without correction.
6.5.3 Temperature (binder, air, surface)Suffi ciently high temperature of the binder at the time of spraying is essential for the spray nozzles to spread the binder properly and avoid stripes. The pumping system and type of nozzles are selected to fi t a certain range of viscosity and will not operate properly at the higher viscosity of a too cold binder. Any tendency of the spray ramp to make stripes will get worse at low spraying temperatures be-cause there will be no aid of fl owing on the surface during the initial few seconds after the binder has reached the road. All problems associated with the spraying temperature of the binder are aggravated by using low application rates.
The temperature of the sprayed binder will normally reach the road temperature before there is time to spread aggregate, which means the road temperature is the controlling factor for choice of binder viscosity in relation to aggregate type and weather conditions. This also means one cannot select a binder with too high viscosity for the site conditions, and subsequently attempt to compensate for this by increasing the spraying temperature. The air temperature and wind conditions have an effect on the length of time before the binder reaches the road temperature.
Temperature of the binder should be recorded at least twice during the spraying of one distributor tank and as required depending on stoppage of the operation, etc.:1. Record temperature just before starting to spray and after the binder has
been circulated suffi ciently to give a reliable reading. No spraying shall startbefore the lowest temperature in the permitted range is reached. Preferably the highest limit in the permitted range should be reached before starting.
2. Record temperature at the time the level of binder in the distributor tank approaches the minimum amount for re-heating the binder to be possible. At this time decisions must be made whether to stop the spraying for re-heating, or if the tank can be emptied without any stop that can cause the temperature to fall below the lowest in the allowed range. Any stoppage of work after this point requires that the tank is refi lled and reheated before work can resume.
The spraybar shall be tested before start and sprayed binder shall be removed.
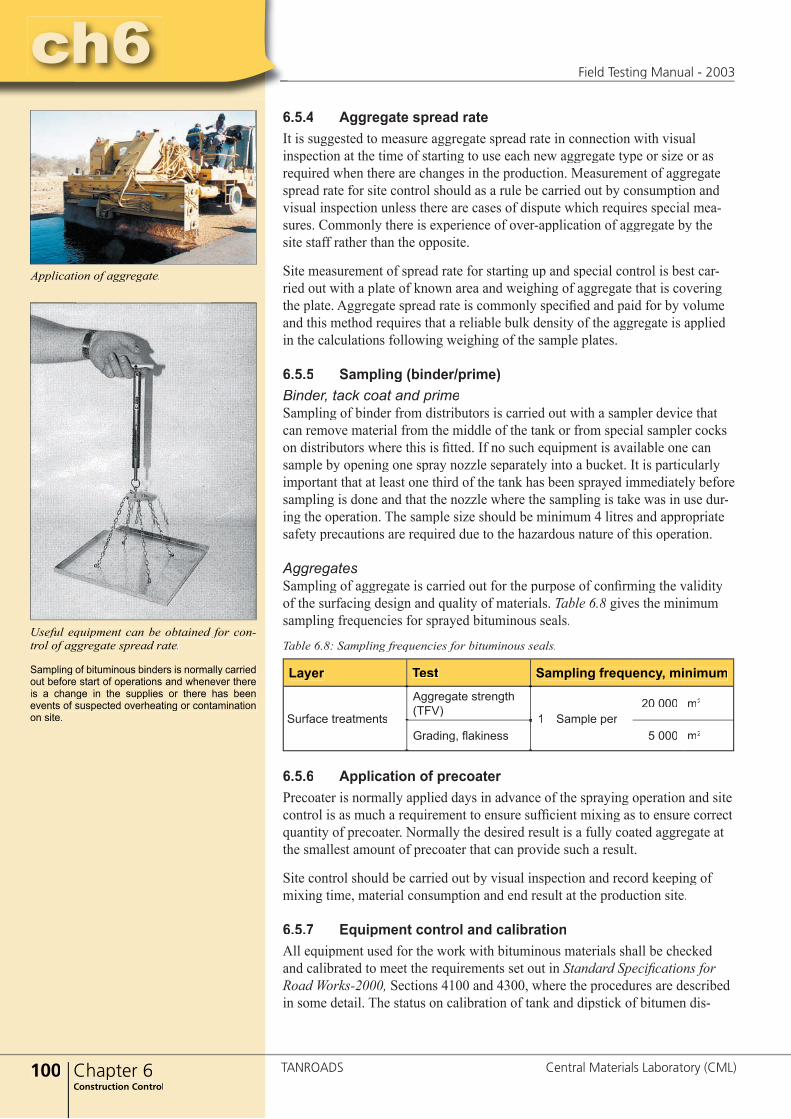
100 Chapter 6Construction Control
ch6Field Testing Manual - 2003
TANROADS Central Materials Laboratory (CML)
ch66.5.4 Aggregate spread rateIt is suggested to measure aggregate spread rate in connection with visual inspection at the time of starting to use each new aggregate type or size or as required when there are changes in the production. Measurement of aggregate spread rate for site control should as a rule be carried out by consumption and visual inspection unless there are cases of dispute which requires special mea-sures. Commonly there is experience of over-application of aggregate by the site staff rather than the opposite.
Site measurement of spread rate for starting up and special control is best car-ried out with a plate of known area and weighing of aggregate that is covering the plate. Aggregate spread rate is commonly specifi ed and paid for by volume and this method requires that a reliable bulk density of the aggregate is applied in the calculations following weighing of the sample plates.
6.5.5 Sampling (binder/prime)Binder, tack coat and primeSampling of binder from distributors is carried out with a sampler device that can remove material from the middle of the tank or from special sampler cocks on distributors where this is fi tted. If no such equipment is available one can sample by opening one spray nozzle separately into a bucket. It is particularly important that at least one third of the tank has been sprayed immediately before sampling is done and that the nozzle where the sampling is take was in use dur-ing the operation. The sample size should be minimum 4 litres and appropriate safety precautions are required due to the hazardous nature of this operation.
AggregatesSampling of aggregate is carried out for the purpose of confi rming the validity of the surfacing design and quality of materials. Table 6.8 gives the minimum sampling frequencies for sprayed bituminous seals.
Table 6.8: Sampling frequencies for bituminous seals.
6.5.6 Application of precoaterPrecoater is normally applied days in advance of the spraying operation and site control is as much a requirement to ensure suffi cient mixing as to ensure correct quantity of precoater. Normally the desired result is a fully coated aggregate at the smallest amount of precoater that can provide such a result.
Site control should be carried out by visual inspection and record keeping of mixing time, material consumption and end result at the production site.
6.5.7 Equipment control and calibrationAll equipment used for the work with bituminous materials shall be checked and calibrated to meet the requirements set out in Standard Specifi cations for Road Works-2000, Sections 4100 and 4300, where the procedures are described in some detail. The status on calibration of tank and dipstick of bitumen dis-
Useful equipment can be obtained for con-trol of aggregate spread rate.
Sampling of bituminous binders is normally carried out before start of operations and whenever there is a change in the supplies or there has been events of suspected overheating or contamination on site.
Layer Test Sampling frequency, minimum
Surface treatments
Aggregate strength (TFV)
1 Sample per20 000 m2
Grading, fl akiness 5 000 m2
Application of aggregate.
ch6
101Chapter 6Construction Control
ch6Field Testing Manual - 2003
Central Materials Laboratory (CML) TANROADS
tributors will determine whether the site control can be undertaken by volume measurements with dipstick or whether control by sample plates on the road has to be undertaken. The two methods are described in Chapter 6.5.2- Spray rate (binder, tack coat, prime and fogspray).
6.6 Concrete 6.6.1 Introduction The main objective of concrete control is to prove that the concrete itself or structural members meet given requirements. In order to do so, representative sampling and uniform test performances are of great importance. This chapter describes procedures for appropriate sampling and testing methods of fresh and hardened concrete in the fi eld.
6.6.2 Sampling of fresh concreteA sample of fresh concrete is normally taken as close to the construction as possible. The sample is extracted from the transporter by taking 3 part samples from the middle of the batch. The sample is to be taken continuously in clean and dry plastic buckets, 11⁄2 times the volume required for the tests to be per-formed. The samples are to be protected from drying, direct sunlight or rain and are to be covered by a lid, plastic sheeting or other suitable item.
The part samples should be homogenized before any testing take place. Consis-tence, air-entrainment and temperatures are to be measured immediately after sampling.
Registration and identifi cation
The following data shall be registered for each sample:● Sample identifi cation.● Place, time and date of the sampling.● Batch and recipe identifi cation (concrete class). ● Concrete and air temperatures, weather conditions.● Construction member to be cast.
6.6.3 Slump of concreteThe slump test is used for determining the workability of fresh concrete. The test procedure for testing is similar for testing both in the laboratory and in the fi eld, ref. test 2.11 in the Laboratory Testing Manual-2000. The working sheet in the Manual may be used. The apparatus shall consist of a specimen mould made of metal and in the form of the lateral surfaces of the frustum of a cone and a tamping rod, all to measures given in the Laboratory Testing Manual-2000. The method is regarded as suitable up to aggregate size of approximately 35 mm within normal range of consistency.
Slump specimens that break or slump laterally give incorrect results. In such cases, the test shall be repeated with a new sample. A shearing slump is a sign of poor cohesion in the concrete and the slump test may in such case be inapplicable.
Slump equipment concrete.
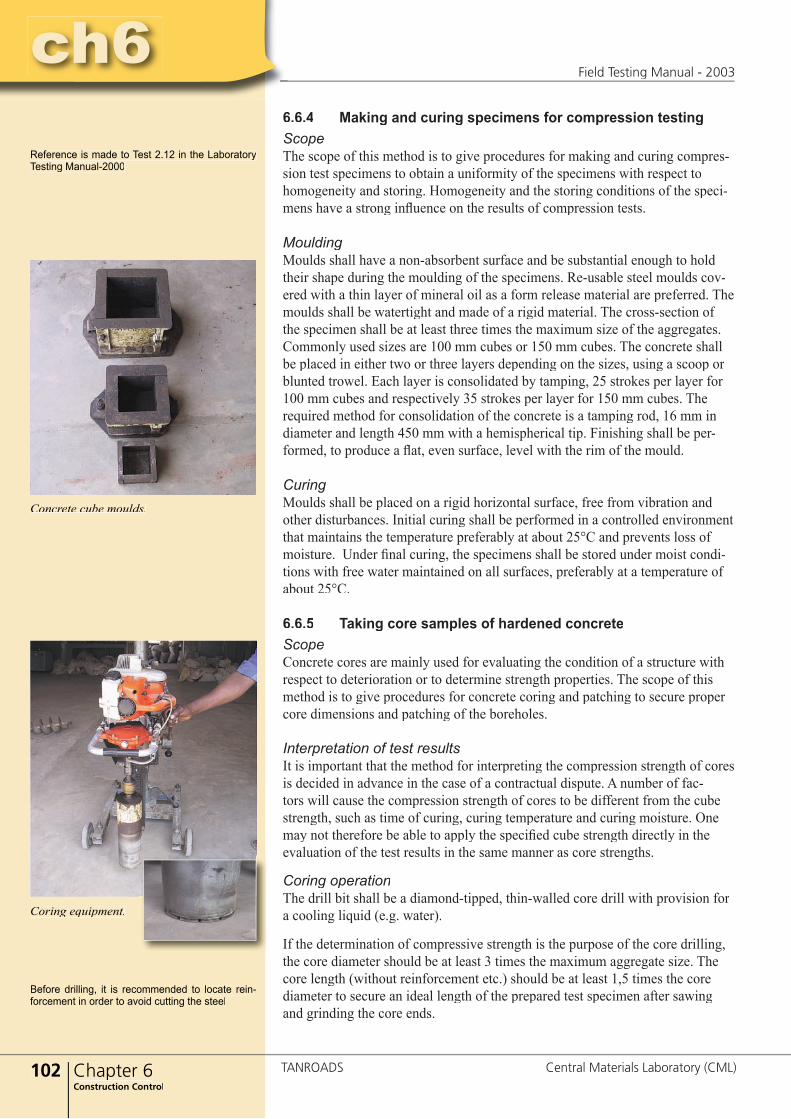
102 Chapter 6Construction Control
ch6Field Testing Manual - 2003
TANROADS Central Materials Laboratory (CML)
ch66.6.4 Making and curing specimens for compression testingScopeThe scope of this method is to give procedures for making and curing compres-sion test specimens to obtain a uniformity of the specimens with respect to homogeneity and storing. Homogeneity and the storing conditions of the speci-mens have a strong infl uence on the results of compression tests.
MouldingMoulds shall have a non-absorbent surface and be substantial enough to hold their shape during the moulding of the specimens. Re-usable steel moulds cov-ered with a thin layer of mineral oil as a form release material are preferred. The moulds shall be watertight and made of a rigid material. The cross-section of the specimen shall be at least three times the maximum size of the aggregates. Commonly used sizes are 100 mm cubes or 150 mm cubes. The concrete shall be placed in either two or three layers depending on the sizes, using a scoop or blunted trowel. Each layer is consolidated by tamping, 25 strokes per layer for 100 mm cubes and respectively 35 strokes per layer for 150 mm cubes. The required method for consolidation of the concrete is a tamping rod, 16 mm in diameter and length 450 mm with a hemispherical tip. Finishing shall be per-formed, to produce a fl at, even surface, level with the rim of the mould.
CuringMoulds shall be placed on a rigid horizontal surface, free from vibration and other disturbances. Initial curing shall be performed in a controlled environment that maintains the temperature preferably at about 25°C and prevents loss of moisture. Under fi nal curing, the specimens shall be stored under moist condi-tions with free water maintained on all surfaces, preferably at a temperature of about 25°C.
6.6.5 Taking core samples of hardened concreteScopeConcrete cores are mainly used for evaluating the condition of a structure with respect to deterioration or to determine strength properties. The scope of this method is to give procedures for concrete coring and patching to secure proper core dimensions and patching of the boreholes.
Interpretation of test resultsIt is important that the method for interpreting the compression strength of cores is decided in advance in the case of a contractual dispute. A number of fac-tors will cause the compression strength of cores to be different from the cube strength, such as time of curing, curing temperature and curing moisture. One may not therefore be able to apply the specifi ed cube strength directly in the evaluation of the test results in the same manner as core strengths.
Coring operationThe drill bit shall be a diamond-tipped, thin-walled core drill with provision for a cooling liquid (e.g. water).
If the determination of compressive strength is the purpose of the core drilling, the core diameter should be at least 3 times the maximum aggregate size. The core length (without reinforcement etc.) should be at least 1,5 times the core diameter to secure an ideal length of the prepared test specimen after sawing and grinding the core ends.
Reference is made to Test 2.12 in the Laboratory Testing Manual-2000
Before drilling, it is recommended to locate rein-forcement in order to avoid cutting the steel
Concrete cube moulds.
Coring equipment.
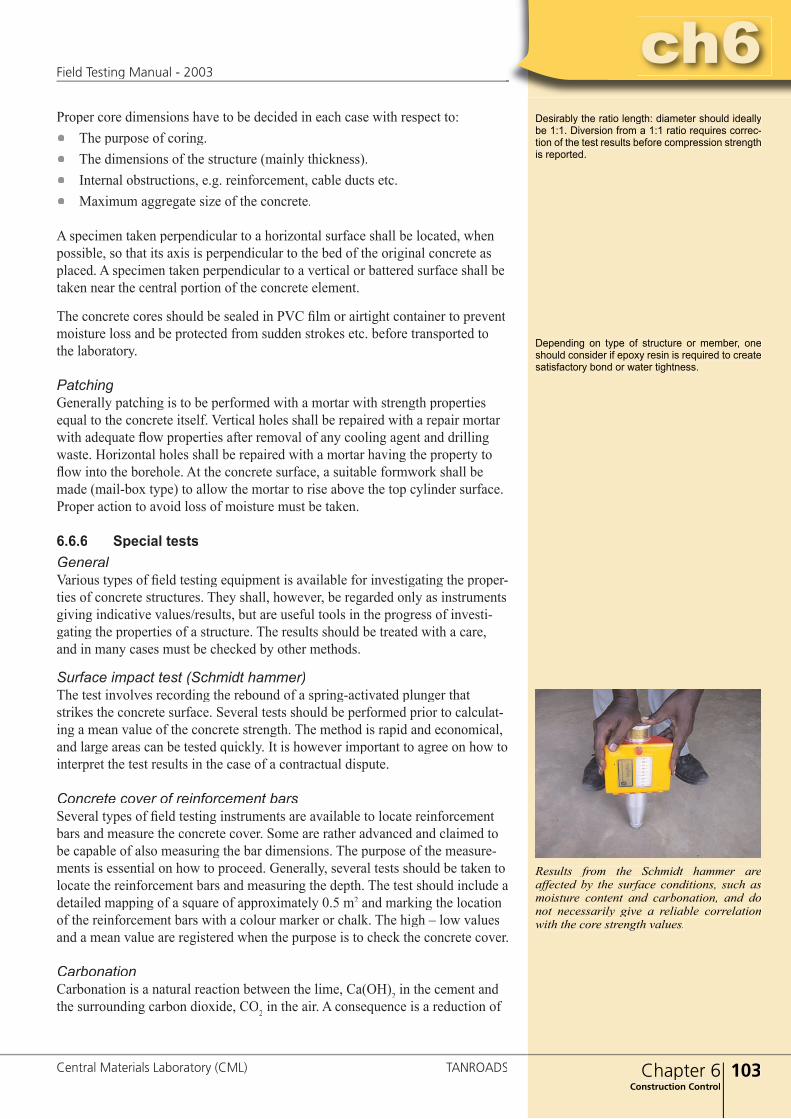
ch6
103Chapter 6Construction Control
ch6Field Testing Manual - 2003
Central Materials Laboratory (CML) TANROADS
Proper core dimensions have to be decided in each case with respect to: ● Τhe purpose of coring.● Τhe dimensions of the structure (mainly thickness).● Ιnternal obstructions, e.g. reinforcement, cable ducts etc.● Μaximum aggregate size of the concrete.
A specimen taken perpendicular to a horizontal surface shall be located, when possible, so that its axis is perpendicular to the bed of the original concrete as placed. A specimen taken perpendicular to a vertical or battered surface shall be taken near the central portion of the concrete element.
The concrete cores should be sealed in PVC fi lm or airtight container to prevent moisture loss and be protected from sudden strokes etc. before transported to the laboratory.
PatchingGenerally patching is to be performed with a mortar with strength properties equal to the concrete itself. Vertical holes shall be repaired with a repair mortar with adequate fl ow properties after removal of any cooling agent and drilling waste. Horizontal holes shall be repaired with a mortar having the property to fl ow into the borehole. At the concrete surface, a suitable formwork shall be made (mail-box type) to allow the mortar to rise above the top cylinder surface. Proper action to avoid loss of moisture must be taken.
6.6.6 Special testsGeneralVarious types of fi eld testing equipment is available for investigating the proper-ties of concrete structures. They shall, however, be regarded only as instruments giving indicative values/results, but are useful tools in the progress of investi-gating the properties of a structure. The results should be treated with a care, and in many cases must be checked by other methods.
Surface impact test (Schmidt hammer)The test involves recording the rebound of a spring-activated plunger that strikes the concrete surface. Several tests should be performed prior to calculat-ing a mean value of the concrete strength. The method is rapid and economical, and large areas can be tested quickly. It is however important to agree on how to interpret the test results in the case of a contractual dispute.
Concrete cover of reinforcement barsSeveral types of fi eld testing instruments are available to locate reinforcement bars and measure the concrete cover. Some are rather advanced and claimed to be capable of also measuring the bar dimensions. The purpose of the measure-ments is essential on how to proceed. Generally, several tests should be taken to locate the reinforcement bars and measuring the depth. The test should include a detailed mapping of a square of approximately 0.5 m2 and marking the location of the reinforcement bars with a colour marker or chalk. The high – low values and a mean value are registered when the purpose is to check the concrete cover.
CarbonationCarbonation is a natural reaction between the lime, Ca(OH)2 in the cement and the surrounding carbon dioxide, CO2 in the air. A consequence is a reduction of
Desirably the ratio length: diameter should ideally be 1:1. Diversion from a 1:1 ratio requires correc-tion of the test results before compression strength is reported.
Depending on type of structure or member, one should consider if epoxy resin is required to create satisfactory bond or water tightness.
Results from the Schmidt hammer are affected by the surface conditions, such as moisture content and carbonation, and do not necessarily give a reliable correlation with the core strength values.

104 Chapter 6Construction Control
ch6Field Testing Manual - 2003
TANROADS Central Materials Laboratory (CML)
ch6the alkaline level in the pore water from pH 13 to below 12.4, which may result in reinforcement corrosion. The depth of carbonation (front) will vary for one particular surface.
The test method is based on the use of an indicator fl uid, consisting of 1 gramme of phenolphthalein, dissolved in 50 ml ethanol and diluted with 50 ml water. The carbonation front is shown as the boundary between original colour and a pinkish taint representative for the un-carbonated concrete after applying the fl uid.
6.7 Construction control test methods
The test is preferably applied on split cores or concrete pieces that have been chiselled out.
Field TestsF6.01 Density Sand replacement B51377: Part 9: 1990
F6.02 Density Nuclear gauge B51377: Part 9: 1990ASTM D2922ASTM D 2950 - 91ASTM D3717
F6.03 Density Core cutting BS 1377: Part 9: 1990
F6.04 Preparation for bituminous sealing
Sand patch test TMH6: Method ST 1
F6.05 Preparation for bituminous sealing
Ball preparation test TMH6: Method ST 4
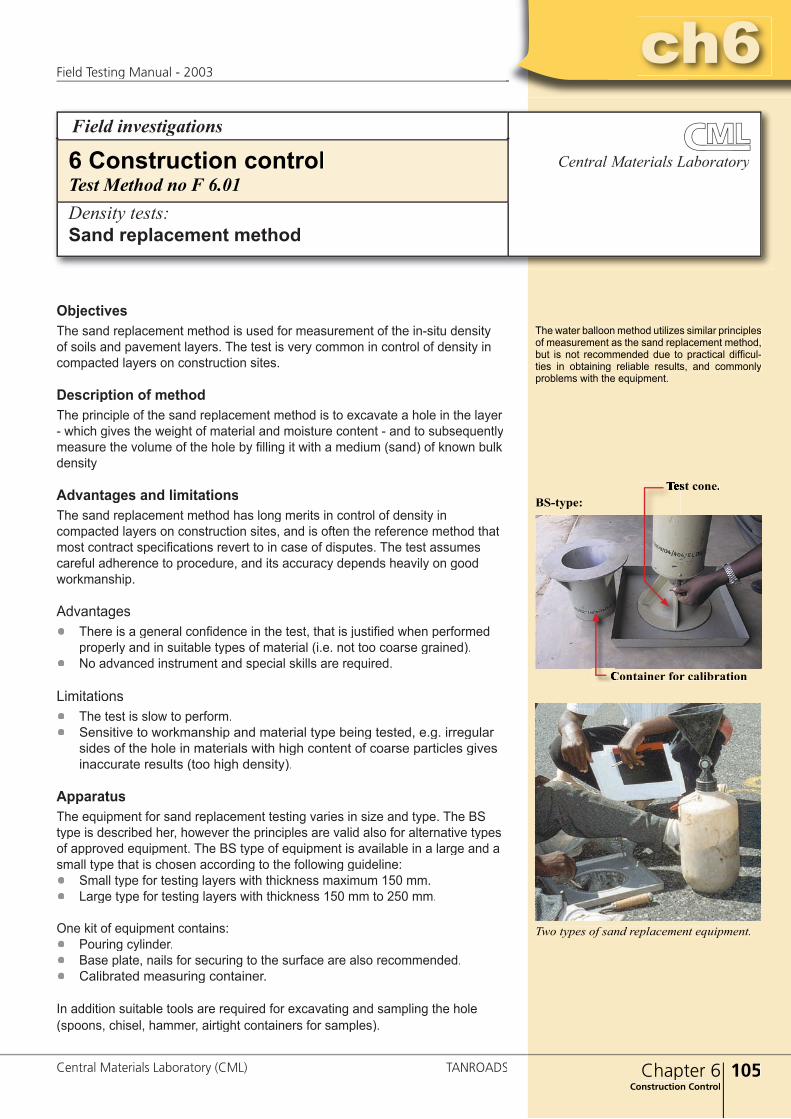
ch6
105Chapter 6Construction Control
ch6Field Testing Manual - 2003
Central Materials Laboratory (CML) TANROADS
Field investigations
Central Materials Laboratory6 Construction controlTest Method no F 6.01Density tests:Sand replacement method
ObjectivesThe sand replacement method is used for measurement of the in-situ density of soils and pavement layers. The test is very common in control of density in compacted layers on construction sites.
Description of method The principle of the sand replacement method is to excavate a hole in the layer - which gives the weight of material and moisture content - and to subsequently measure the volume of the hole by fi lling it with a medium (sand) of known bulk density
Advantages and limitationsThe sand replacement method has long merits in control of density in compacted layers on construction sites, and is often the reference method that most contract specifi cations revert to in case of disputes. The test assumes careful adherence to procedure, and its accuracy depends heavily on good workmanship.
Advantages● There is a general confi dence in the test, that is justifi ed when performed
properly and in suitable types of material (i.e. not too coarse grained).● No advanced instrument and special skills are required.
Limitations● The test is slow to perform.● Sensitive to workmanship and material type being tested, e.g. irregular
sides of the hole in materials with high content of coarse particles gives inaccurate results (too high density).
ApparatusThe equipment for sand replacement testing varies in size and type. The BS type is described her, however the principles are valid also for alternative types of approved equipment. The BS type of equipment is available in a large and a small type that is chosen according to the following guideline:● Small type for testing layers with thickness maximum 150 mm.● Large type for testing layers with thickness 150 mm to 250 mm.
One kit of equipment contains:● Pouring cylinder.● Base plate, nails for securing to the surface are also recommended.● Calibrated measuring container.
In addition suitable tools are required for excavating and sampling the hole (spoons, chisel, hammer, airtight containers for samples).
The water balloon method utilizes similar principles of measurement as the sand replacement method, but is not recommended due to practical diffi cul-ties in obtaining reliable results, and commonly problems with the equipment.
BS-type:
Container for calibrationContainer for calibration
Two types of sand replacement equipment.
Test cone.Test cone.
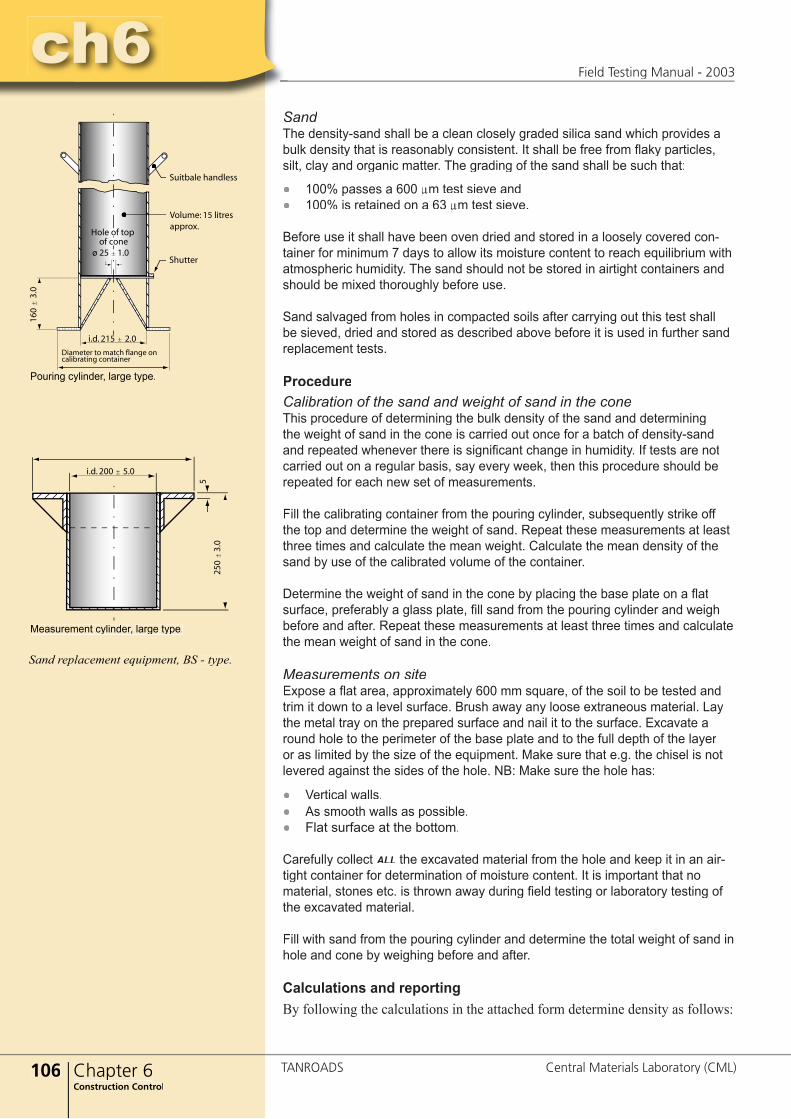
106 Chapter 6Construction Control
ch6Field Testing Manual - 2003
TANROADS Central Materials Laboratory (CML)
ch6SandThe density-sand shall be a clean closely graded silica sand which provides a bulk density that is reasonably consistent. It shall be free from fl aky particles, silt, clay and organic matter. The grading of the sand shall be such that:
● 100% passes a 600 µm test sieve and ● 100% is retained on a 63 µm test sieve.
Before use it shall have been oven dried and stored in a loosely covered con-tainer for minimum 7 days to allow its moisture content to reach equilibrium with atmospheric humidity. The sand should not be stored in airtight containers and should be mixed thoroughly before use.
Sand salvaged from holes in compacted soils after carrying out this test shall be sieved, dried and stored as described above before it is used in further sand replacement tests.
ProcedureCalibration of the sand and weight of sand in the coneThis procedure of determining the bulk density of the sand and determining the weight of sand in the cone is carried out once for a batch of density-sand and repeated whenever there is signifi cant change in humidity. If tests are not carried out on a regular basis, say every week, then this procedure should be repeated for each new set of measurements.
Fill the calibrating container from the pouring cylinder, subsequently strike off the top and determine the weight of sand. Repeat these measurements at least three times and calculate the mean weight. Calculate the mean density of the sand by use of the calibrated volume of the container.
Determine the weight of sand in the cone by placing the base plate on a fl at surface, preferably a glass plate, fi ll sand from the pouring cylinder and weigh before and after. Repeat these measurements at least three times and calculate the mean weight of sand in the cone.
Measurements on siteExpose a fl at area, approximately 600 mm square, of the soil to be tested and trim it down to a level surface. Brush away any loose extraneous material. Lay the metal tray on the prepared surface and nail it to the surface. Excavate a round hole to the perimeter of the base plate and to the full depth of the layer or as limited by the size of the equipment. Make sure that e.g. the chisel is not levered against the sides of the hole. NB: Make sure the hole has:
● Vertical walls.● As smooth walls as possible.● Flat surface at the bottom.
Carefully collect ALL the excavated material from the hole and keep it in an air-tight container for determination of moisture content. It is important that no material, stones etc. is thrown away during fi eld testing or laboratory testing of the excavated material.
Fill with sand from the pouring cylinder and determine the total weight of sand in hole and cone by weighing before and after.
Calculations and reportingBy following the calculations in the attached form determine density as follows:
Pouring cylinder, large type.
Measurement cylinder, large type.
���� �� ����� ����
�������� ��������
������� �� �������������
�������
�������� �� ����� ������ ������������� ���������
�
Sand replacement equipment, BS - type.

ch6
107Chapter 6Construction Control
ch6Field Testing Manual - 2003
Central Materials Laboratory (CML) TANROADS
1. Calculate the mass of sand in the hole (m1):
m1 = m2 - m3 - m4
where:m2 is the mass of sand and pouring cylinder before pouring (in g)m3 is the mass of sand and pouring cylinder after pouring (in g)m4 is the mass of sand in the cone, determined by previous calibration (in g)
2. Calculate the volume of the hole (V) in mL:
V =m1
ρS
where:
m1 is the mass of sand in the hole (in g)ρS is the density of the sand, determined by previous calibration (in Mg/m3)
3. Calculate the bulk density of the soil, ρ (in Mg/m3), from the equation:
ρ =mS
V
where:
mS is the mass of all the soil in the hole (in g)V is the volume of the hole (in mL)
4. Calculate the dry density ρd (in Mg/m3), from the equation:
ρd =100ρ
100+w
where:
w is the moisture content of the material in the hole (in %)
The test report shall contain the following information:
(a) The method of test used.
(b) The in-situ bulk and dry densities of the soil (in Mg/m3) to the nearest 0.01 Mg/m3.
(c) the moisture content, (in %), to two signifi cant fi gures.
References ● BS 1377 : Part 9 : 1990

108 Chapter 6Construction Control
ch6Field Testing Manual - 2003
TANROADS Central Materials Laboratory (CML)
ch6
Central Materials Laboratory
Field investigations
6 Construction controlTest Method no F 6.02Density tests:Nuclear gauge method
ObjectivesGeneral The objective of this method is determination of the in-situ density and moisture content of fi ne-, medium-, and coarse-grained soils by means of a nuclear gauge.Such gauges provide a rapid non-destructive technique for determining in-situ bulk and dry density as well as the moisture content.
Bituminous materialsThe nuclear gauge method is also suitable for determination of bulk density of bituminous layers. For bituminous layers, with thickness up to maximum 75 mm,measurement in ‘backscatter’ mode is common. Layers thicker than 75 mm ‘backscatter’ mode is common. Layers thicker than 75 mm ‘backscatter’require ‘direct transmission’ mode. ‘direct transmission’ mode. ‘direct transmission’ See fi gure. Errors may occur when measuringthe bulk density of thin bituminous layers overlying a pavement layer with a considerably different density. When measuring bituminous materials containing water (e.g. cold mixes), the moisture content needs to be determined using conventional sampling and laboratory testing in each location.
SafetyThe equipment used in this test utilizes radioactive materials emitting ionising radiations which may be hazardous to health unless proper precautions are taken. Before testing starts it is essential that users of this equipment are aware of the potential hazards and comply with all applicable government regulations concerning the precautions to be taken and routine procedures to be followed with this type of equipment. This includes regular tests for radioactive leakage according to manufacturer´s specifi cation.
The following are general guidelines that are valid in handling of nuclear gauges in order to minimize radiation effects:
● Keep at a distance to the gauge when it is not necessary to be near during operation of the equipment.
● Keep the time spent near the gauge to a minimum.
● Store the equipment away from people, i.e. use a locked store room and not a room used regularly by personnel.
Description of equipment and method The nuclear gauges normally measure both bulk density and moisture content using respectively two nuclear sources with corresponding sensors. See fi gure below Some types of gauges have sensors that can be inserted into the ground in the same manner as for the nuclear sources, and the moisture source is movable. These gauges are normally used for research purposes due to ela-borate calibration procedures and high cost.
There is a variety of manufactures and designs of the nuclear gauges. It is therefore impossible to detail fully the operation of the gauge and refer-ence is made to the manufacturer’s handbook.
Problems caused by the effect of underlying materials often occur in construction of new roads Also overlays where vastly different aggregate sources have been used in the underlying pave-ment compared to the new bituminous layer may give the same errors.
Transportation of radioactive material in e.g. air-craft is restricted.
A manufacturer’s handbook and an approved transport case shall be kept with the gauge.
Routinely move back a couple of steps while tak-ing counts with the gauge.
Moisture content by mass of soil is not measured directly by the gauge, but is being calculated by the on-board calculator that is fi tted in most brands of equipment.
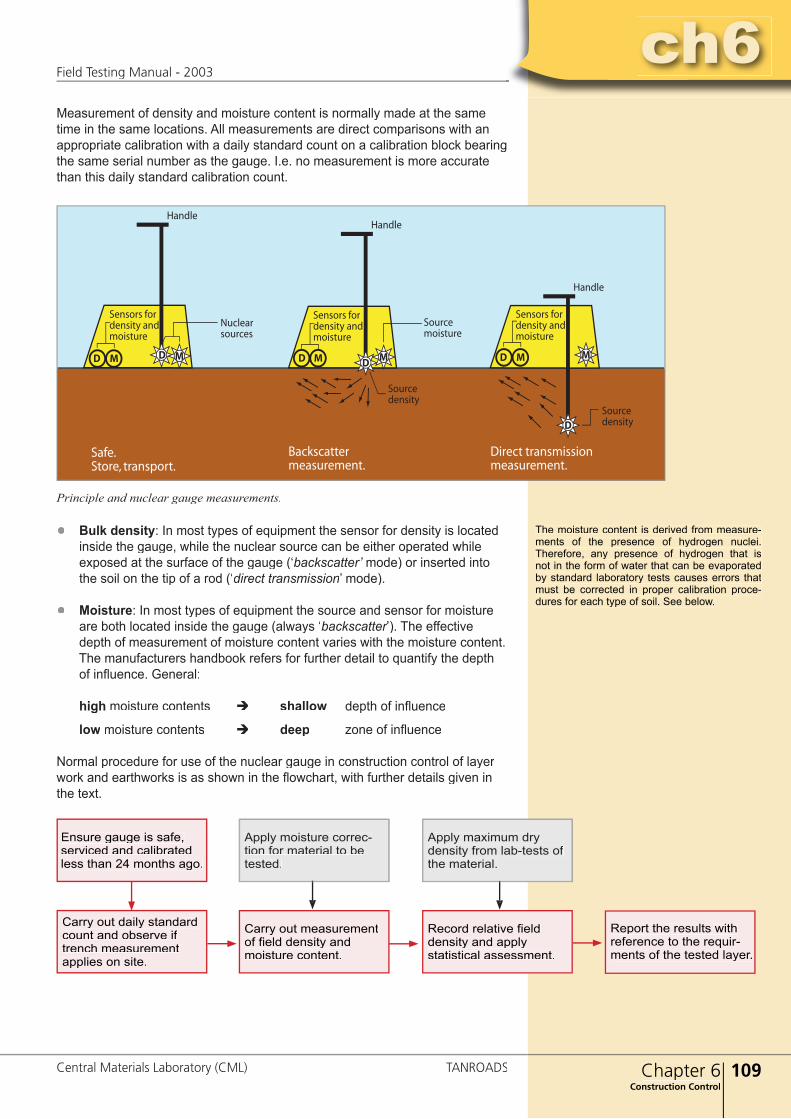
ch6
109Chapter 6Construction Control
ch6Field Testing Manual - 2003
Central Materials Laboratory (CML) TANROADS
Measurement of density and moisture content is normally made at the same time in the same locations. All measurements are direct comparisons with an appropriate calibration with a daily standard count on a calibration block bearing the same serial number as the gauge. I.e. no measurement is more accurate than this daily standard calibration count.
Principle and nuclear gauge measurements.
● Bulk density: In most types of equipment the sensor for density is located inside the gauge, while the nuclear source can be either operated while exposed at the surface of the gauge (‘backscatter’ mode) or inserted into backscatter’ mode) or inserted into backscatter’the soil on the tip of a rod (‘direct transmission’ mode).
● Moisture: In most types of equipment the source and sensor for moisture are both located inside the gauge (always ‘backscatter’). The effective backscatter’). The effective backscatter depth of measurement of moisture content varies with the moisture content. The manufacturers handbook refers for further detail to quantify the depth of infl uence. General:
high moisture contents è shallow depth of infl uence
low moisture contents è deep zone of infl uence
Normal procedure for use of the nuclear gauge in construction control of layer work and earthworks is as shown in the fl owchart, with further details given in the text.
� � � �
������
������� ���������� �����������
������� ���������� �����������
������� ���������� �����������
��������������
� � � �
������
��������������
� �
�
�
������
�������������
����������� ����������
�����������������������
������ ������������������������
�������������
The moisture content is derived from measure-ments of the presence of hydrogen nuclei. Therefore, any presence of hydrogen that is not in the form of water that can be evaporated by standard laboratory tests causes errors that must be corrected in proper calibration proce-dures for each type of soil. See below.
Ensure gauge is safe, serviced and calibrated less than 24 months ago.
Apply moisture correc-tion for material to be tested.
Apply maximum dry density from lab-tests of the material.
Carry out daily standard count and observe if trench measurement applies on site.
Carry out measurement of fi eld density and moisture content.
Record relative fi eld density and apply statistical assessment.
Report the results with reference to the requir-ments of the tested layer.

110 Chapter 6Construction Control
ch6Field Testing Manual - 2003
TANROADS Central Materials Laboratory (CML)
ch6Advantages and limitations
AdvantageThe main advantage of measurements with nuclear gauges is that the results are obtained very fast. The accuracy of the results depends on applying correct procedure including moisture correction against oven-drying for each new tested type of material. Measurement of bulk density is generally far more reliable than for moisture content.
Materials and over-sized particlesThe test is suitable for most fi ne-, medium- and coarse grained soils where the surface is suffi ciently even to provide a smooth base for the gauge. The test is valid where the material falls within both the following limits in respect of over-sized particles:
Sieve size (mm) Maximum amount retained on sieve (%)37.5 1020 30
Field measurements include all particles present in the material at the test location. It is important to observe that material with larger amounts of over-sized particles than given in the above table will give fi eld test results that do not correspond with the reference value for Maximum Dry Density found in the laboratory. In such case the relative density measured in the fi eld will be incorrect (normally too high). The presence of occasional over-sized particles in the soil will also give unusually high fi eld density results when encountered at the test location. Inspection holes should be excavated in case of doubt.
LimitationsMeasurements on materials with special chemical composition of soil, such as blast furnace, is unsuitable for testing with nuclear gauges. Material that is very inhomogeneous and having large variation in density or moisture at different depths is not suitable for testing with nuclear gauges because the zone of infl uence of the nuclear rays is not exactly defi ned.
Compensation shall be made by applying moisture correction for materials containing hydrogen which is not removed during the standard oven-drying process. However, where the material contains very large and varying amounts of hydrogen the nuclear gauge shall not be used for measurement of moisture content, and a sample shall be taken for laboratory testing of moisture at each location. Examples of such materials are those containing:
● Βitumen.
● Large amounts of organic matter.
● Οther materials where the moisture correction shows large variation.
Periodic calibrationMinimum every 24 months the nuclear gauge shall be serviced and calibrated in accordance with ASTM D2922 and ASTM D3017 at a workshop facility with appropriate equipment and skilled staff, preferably approved by the manufacturerof the equipment. A valid certifi cate of calibrations less than 24 months old shall be kept with the gauge.
Chapter 6.2.4 presents the relative advantages/limitations of various types of methods for measur-ing fi eld density.
Use of direct transmission instead of backscatter mode gives a better result in respect of density measurements, especially where the material is inhomogeneous.
This calibration is necessary in order to compen-sate for the normal long-term ageing of the nuclear sources and to check the stability of electronics besides carrying out mechanical service under safe conditions by specially trained personnel.
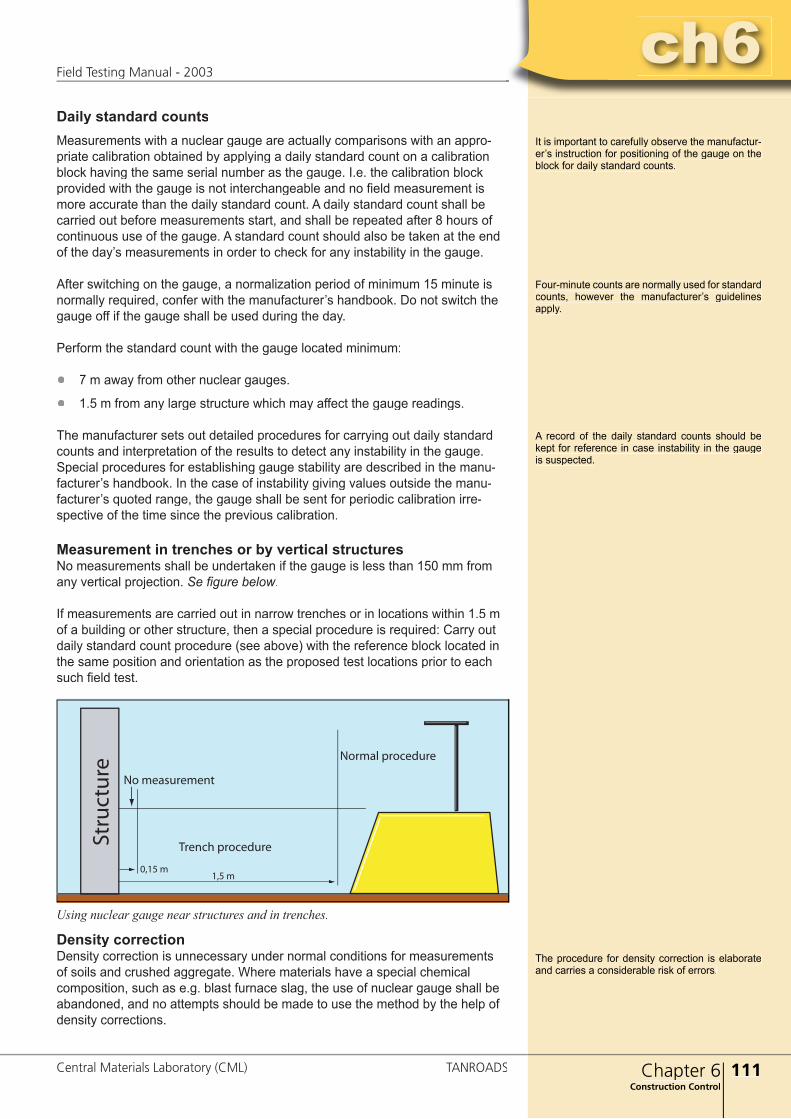
ch6
111Chapter 6Construction Control
ch6Field Testing Manual - 2003
Central Materials Laboratory (CML) TANROADS
Daily standard countsMeasurements with a nuclear gauge are actually comparisons with an appro-priate calibration obtained by applying a daily standard count on a calibration block having the same serial number as the gauge. I.e. the calibration block provided with the gauge is not interchangeable and no fi eld measurement is more accurate than the daily standard count. A daily standard count shall be carried out before measurements start, and shall be repeated after 8 hours of continuous use of the gauge. A standard count should also be taken at the end of the day’s measurements in order to check for any instability in the gauge.
After switching on the gauge, a normalization period of minimum 15 minute is normally required, confer with the manufacturer’s handbook. Do not switch the gauge off if the gauge shall be used during the day.
Perform the standard count with the gauge located minimum:
● 7 m away from other nuclear gauges.
● 1.5 m from any large structure which may affect the gauge readings.
The manufacturer sets out detailed procedures for carrying out daily standard counts and interpretation of the results to detect any instability in the gauge. Special procedures for establishing gauge stability are described in the manu-facturer’s handbook. In the case of instability giving values outside the manu-facturer’s quoted range, the gauge shall be sent for periodic calibration irre-spective of the time since the previous calibration.
Measurement in trenches or by vertical structures No measurements shall be undertaken if the gauge is less than 150 mm from any vertical projection. Se fi gure below.
If measurements are carried out in narrow trenches or in locations within 1.5 m of a building or other structure, then a special procedure is required: Carry out daily standard count procedure (see above) with the reference block located in the same position and orientation as the proposed test locations prior to each such fi eld test.
Using nuclear gauge near structures and in trenches.
Density correctionDensity correction is unnecessary under normal conditions for measurements of soils and crushed aggregate. Where materials have a special chemical composition, such as e.g. blast furnace slag, the use of nuclear gauge shall be abandoned, and no attempts should be made to use the method by the help of density corrections.
It is important to carefully observe the manufactur-er’s instruction for positioning of the gauge on the block for daily standard counts.
Four-minute counts are normally used for standard counts, however the manufacturer’s guidelines apply.
A record of the daily standard counts should be kept for reference in case instability in the gauge is suspected.
�� �����������
������ ���������
������ ���������
����
���
��
���� ���� �
The procedure for density correction is elaborate and carries a considerable risk of errors.
112 Chapter 6Construction Control
ch6Field Testing Manual - 2003
TANROADS Central Materials Laboratory (CML)
ch6Moisture correctionFrequencyNo measurements of moisture content are reliable unless moisture correction has been carried out. Moisture correction shall be carried out when:
● Use of a new material source is about to start.
● Τhere is change in material type or properties within a material source.
● Α period of 3 months has elapsed since the last time moisture correction for the particular material was determined.
● Whenever there is doubt or dispute over test results.
ProcedureSelect 5 locations on a smooth, newly (same day) compacted layer constructed with the material for which moisture correction shall be determined. In each of the 5 locations carry out the following procedure:
1. Place the gauge in a location with an even surface.
2. Carve a line on the surface along the outline of the gauge.
3. Measure moisture content using the nuclear gauge as described under Field measurements below. Use backscatter mode (direct transmission Field measurements below. Use backscatter mode (direct transmission Field measurementsmode only applies to density measurements and is not of interest for this procedure).
4. Remove the gauge from the surface.
5. Take a sample in the centre of the outline of the gauge for the purpose of measuring fi eld moisture content by oven drying in the laboratory, i.e. the sample shall be placed in a water tight container immediately. The sample shall be taken from a circular hole approximately 100 mm in diameter and cylindrical approximately 100 mm deep. Where the material has a con-siderable proportion of particles larger than 20 mm the size of the hole should be widened to 150 mm diameter. If a single, large, particle is en-countered, then abandon the measurement and fi nd an alternative location.
6. Test the sample for moisture content in the laboratory by standard oven dry-ing of the entire sample including all large particles. Test no. 1.1. of the Lab-oratory Testing Manual-2000 shall be applied.
After the above procedure is completed for all 5 locations, calculate the mois-ture correction factor for the material by combining the laboratory test results with the results from the nuclear gauge in accordance with procedures set out in the manufacturer’s handbook. Apply the correction factor in all subsequent fi eld measurements of materials from the same source unless determination of a new moisture correction factor is required for reasons given above.
Field measurementGeneral Direct transmission mode shall be used where fi eld density will be measured, due to the better accuracy of measurement compared to backscatter mode. Select the depth of gauge probe insertion that corresponds with the thickness of the layer to be measured.
Preparation of the siteIf the layer has a very coarse texture giving poor contact with the bottom surface of the gauge, and better alternative locations cannot be found, the surface shouldbe sprinkled with fi ne, dry, sand that is subsequently levelled to a smooth sur-
Validation:If the correction shows that the nuclear gauge gives a substantially lower moisture content lower moisture content lowerthan the laboratory test results, there is a great possibility of errors in the procedure. Most likely the error is with the handling of the sample for laboratory testing. Do check in particular that the large particles have not been removed from the material sample by fi eld- or laboratory staff prior to testing moisture content.
Direct transmission is preferred due to its ability to test equally all parts of the layer to the total depth to which the gauge probe is inserted.
Field measurement using nuclaer gauge.

ch6
113Chapter 6Construction Control
ch6Field Testing Manual - 2003
Central Materials Laboratory (CML) TANROADS
face where the gauge is to be bedded. It is important that the sand is used in moderation and shall not form an added layer. I.e. the higher points of the layer to be tested shall be seen protruding through the sand across the entire surface area before the gauges is placed.
Use suitable tools, such as trowel, straightedge and scraping plate for levelling the surface at the site of the test as required. Make a hole for the direct transmission measurement by use of a hammer and a steel drive pin to produce a hole with diameter up to 3 mm larger than the gauge probe. The hole should be slightly deeper than the depth to which the gauge probe will be inserted. It is important to use a suitable guide tool made from a pipe welded on a steel plate to direct the drive pin accurately true to the surface without disturbing the sides of the hole. Take particular care not disturb the hole and the surface when the drive pin is extracted. Use spanners to turn the drive pin at the same time as it is gradually withdrawn from the hole.
Positioning of the gaugePlace the gauge on the surface and insert the gauge probe into the whole to the required depth. After the gauge is properly seated, pull the gauge back in order for the probe to obtain proper contact with the wall of the hole. See fi gure below.
Placing nuclear gauge into position.
Measurement countsAfter the gauge is properly positioned, take a one-minute measurement count and record the results for density and moisture. Repeat the measurement count, record the result and use the average of the two results as the reported value at the location. If there is considerable difference between the two measurements, take two more counts and use the average value. Retract the extendable probe into the gauge, ensure the shutter is closed and check that the radioactive source is safely housed. A procedure whereby the gauge is rotated and reposi-tioned between each repeated measurement at the same location, should be avoided because it may increase the risk of errors.
Apply the relevant moisture correction if the gauge does not provide calculation of corrected values on the basis of user-determined calibration values.
Patch the hole by pouring fi ne sand in the hole and tamp with a steel rod until level with the surface of the layer.
Use of sand is normally not required, but where it is needed the sand should be of similar geological origin as the material to be tested, preferably made of screened fi nes from the same material source.
������
�� ������
������� ��������������
������
�� ����
������ ���� ��� ����� �� ������� ������� ���� �� ��� ����
One-minute counts are normally used for fi eld measurements, however the manufacturer’s guidelines apply. Longer count duration statisti-cally improves the test result, thereby the accuracy increases.
By repeating the count and using the average value with the gauge in the same position, one does improve the accuracy of the measurement considerably.

114 Chapter 6Construction Control
ch6Field Testing Manual - 2003
TANROADS Central Materials Laboratory (CML)
ch6Reporting
The attached worksheet shall be fi lled in and the test report shall contain the following information:
Equipment● Μodel and serial number of the gauge.
● Date of last calibration, reference to certifi cate.
● Μethod of test being used (backscatter or direct transmission, depth of measurement and whether trench procedures have been applied).
● Standard count values.
Location● Τype of layer (e.g. earthworks, type of pavement layer, material type).
● Μaterial source being used.
● Μoisture correction value and date of its determination.
● Τime since compaction was completed (in the case of construction control).
Test ● Maximum Dry Density and Optimum Moisture Content (CML test no 1.9)
in the respective locations where measurements are carried out.
● Average percentage over-sized particles larger than 20 mm and 37.5 mm respectively.
● Τest results from the fi eld density and moisture tests using the nuclear gauge.
In the case of construction control the fi eld density and moisture content values shall be calculated and reported using statistical methods as appropriate to meet the requirements of the Standard Specifi cation for Road Works-2000.
References● BS 1377:Part 9:1990● ASTM D2922● ASTM D2950-91● ASTM D3717
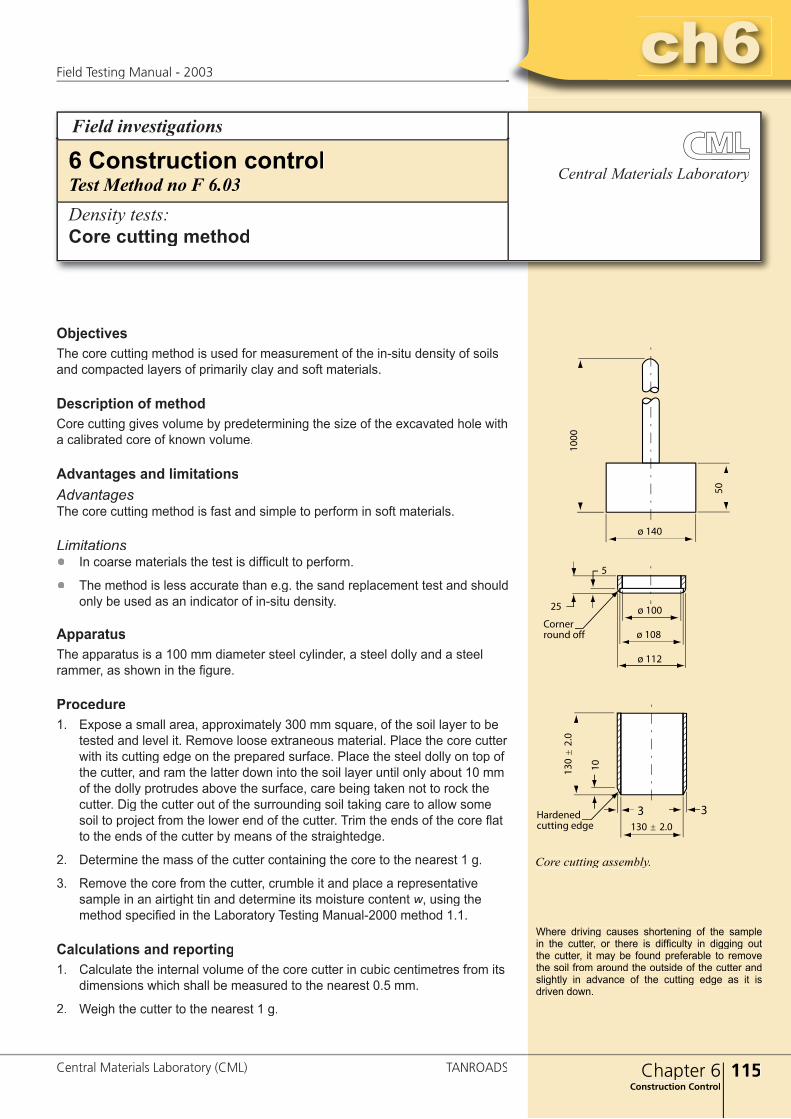
ch6
115Chapter 6Construction Control
ch6Field Testing Manual - 2003
Central Materials Laboratory (CML) TANROADS
ObjectivesThe core cutting method is used for measurement of the in-situ density of soils and compacted layers of primarily clay and soft materials.
Description of method Core cutting gives volume by predetermining the size of the excavated hole with a calibrated core of known volume.
Advantages and limitationsAdvantagesThe core cutting method is fast and simple to perform in soft materials.
Limitations● In coarse materials the test is diffi cult to perform.
● The method is less accurate than e.g. the sand replacement test and should only be used as an indicator of in-situ density.
ApparatusThe apparatus is a 100 mm diameter steel cylinder, a steel dolly and a steel rammer, as shown in the fi gure.
Procedure1. Expose a small area, approximately 300 mm square, of the soil layer to be
tested and level it. Remove loose extraneous material. Place the core cutter with its cutting edge on the prepared surface. Place the steel dolly on top of the cutter, and ram the latter down into the soil layer until only about 10 mm of the dolly protrudes above the surface, care being taken not to rock the cutter. Dig the cutter out of the surrounding soil taking care to allow some soil to project from the lower end of the cutter. Trim the ends of the core fl at to the ends of the cutter by means of the straightedge.
2. Determine the mass of the cutter containing the core to the nearest 1 g.
3. Remove the core from the cutter, crumble it and place a representative sample in an airtight tin and determine its moisture content w, using the method specifi ed in the Laboratory Testing Manual-2000 method 1.1.
Calculations and reporting1. Calculate the internal volume of the core cutter in cubic centimetres from its
dimensions which shall be measured to the nearest 0.5 mm.
2. Weigh the cutter to the nearest 1 g.
Where driving causes shortening of the sample in the cutter, or there is diffi culty in digging out the cutter, it may be found preferable to remove the soil from around the outside of the cutter and slightly in advance of the cutting edge as it is driven down.
��
����
� ���
�
� �����
� ���
� ���
��
� �
����������� ���
��������������� ����
Core cutting assembly.
Field investigations
Central Materials Laboratory6 Construction controlTest Method no F 6.03Density tests:Core cutting method

116 Chapter 6Construction Control
ch6Field Testing Manual - 2003
TANROADS Central Materials Laboratory (CML)
ch6Calculate the bulk density of the soil, ρ (in Mg/m3), from the equation:
ρ =mS - mC
VC
where:
mS is the mass of soil and core cutter (in g)mC is the mass of core cutter (in g)VC is the internal volume of core cutter (in mL)
Calculate the dry density ρd (in Mg/m3), from the equation:
ρd =100ρ
100+w
where:
w is the moisture content in the soil (in %)
The test report shall contain the following information:
(a) The method of test used.
(b) The in-situ bulk and dry densities of the soil (in Mg/m3) to the nearest 0.01 Mg/m3.
(c) The moisture content, (in %), to two signifi cant fi gures.
References ● BS 1377 : Part 9 : 1990
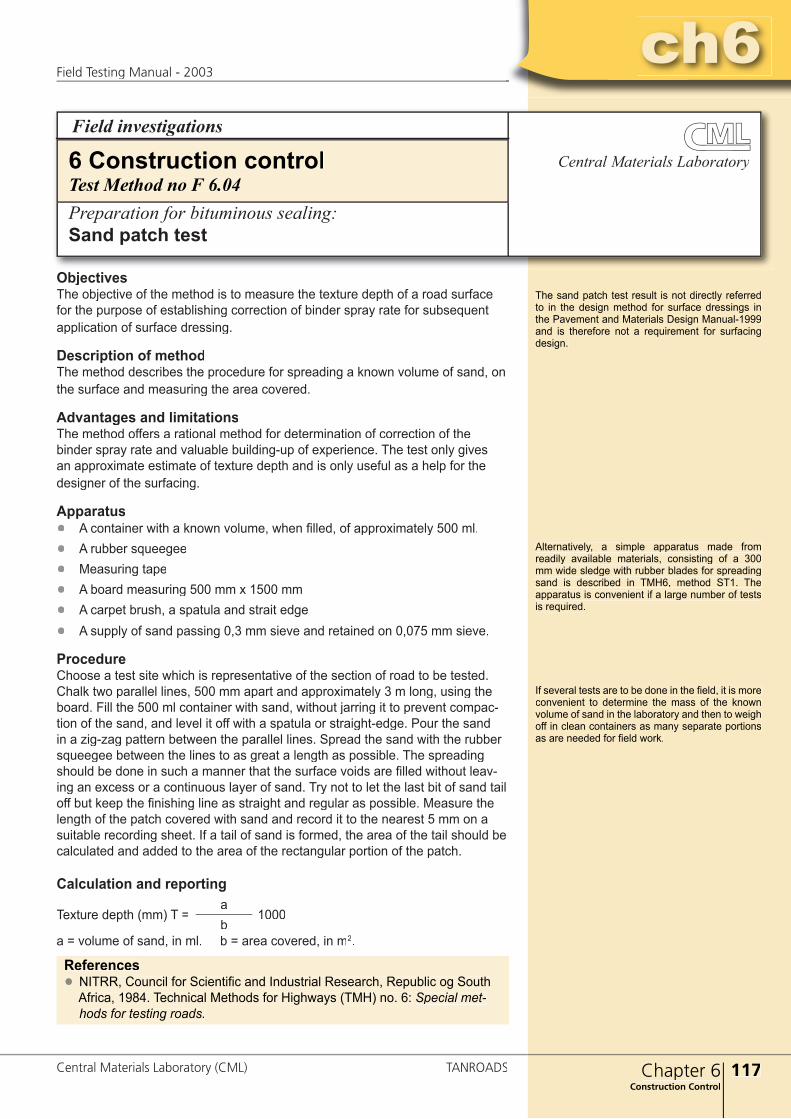
ch6
117Chapter 6Construction Control
ch6Field Testing Manual - 2003
Central Materials Laboratory (CML) TANROADS
ObjectivesThe objective of the method is to measure the texture depth of a road surface for the purpose of establishing correction of binder spray rate for subsequent application of surface dressing.
Description of methodThe method describes the procedure for spreading a known volume of sand, on the surface and measuring the area covered.
Advantages and limitationsThe method offers a rational method for determination of correction of the binder spray rate and valuable building-up of experience. The test only gives an approximate estimate of texture depth and is only useful as a help for the designer of the surfacing.
Apparatus● A container with a known volume, when fi lled, of approximately 500 ml.● A rubber squeegee● Measuring tape● A board measuring 500 mm x 1500 mm● A carpet brush, a spatula and strait edge● A supply of sand passing 0,3 mm sieve and retained on 0,075 mm sieve.
Procedure Choose a test site which is representative of the section of road to be tested. Chalk two parallel lines, 500 mm apart and approximately 3 m long, using the board. Fill the 500 ml container with sand, without jarring it to prevent compac-tion of the sand, and level it off with a spatula or straight-edge. Pour the sand in a zig-zag pattern between the parallel lines. Spread the sand with the rubber squeegee between the lines to as great a length as possible. The spreading should be done in such a manner that the surface voids are fi lled without leav-ing an excess or a continuous layer of sand. Try not to let the last bit of sand tail off but keep the fi nishing line as straight and regular as possible. Measure the length of the patch covered with sand and record it to the nearest 5 mm on a suitable recording sheet. If a tail of sand is formed, the area of the tail should be calculated and added to the area of the rectangular portion of the patch.
Calculation and reporting
Texture depth (mm) T =a
1000b
a = volume of sand, in ml. b = area covered, in m2.
References● NITRR, Council for Scientifi c and Industrial Research, Republic og South
Africa, 1984. Technical Methods for Highways (TMH) no. 6: Special met-hods for testing roads.
The sand patch test result is not directly referred to in the design method for surface dressings in the Pavement and Materials Design Manual-1999 and is therefore not a requirement for surfacing design.
Alternatively, a simple apparatus made from readily available materials, consisting of a 300 mm wide sledge with rubber blades for spreading sand is described in TMH6, method ST1. The apparatus is convenient if a large number of tests is required.
If several tests are to be done in the fi eld, it is more convenient to determine the mass of the known volume of sand in the laboratory and then to weigh off in clean containers as many separate portions as are needed for fi eld work.
Field investigations
Central Materials Laboratory6 Construction controlTest Method no F 6.04Preparation for bituminous sealing:Sand patch test
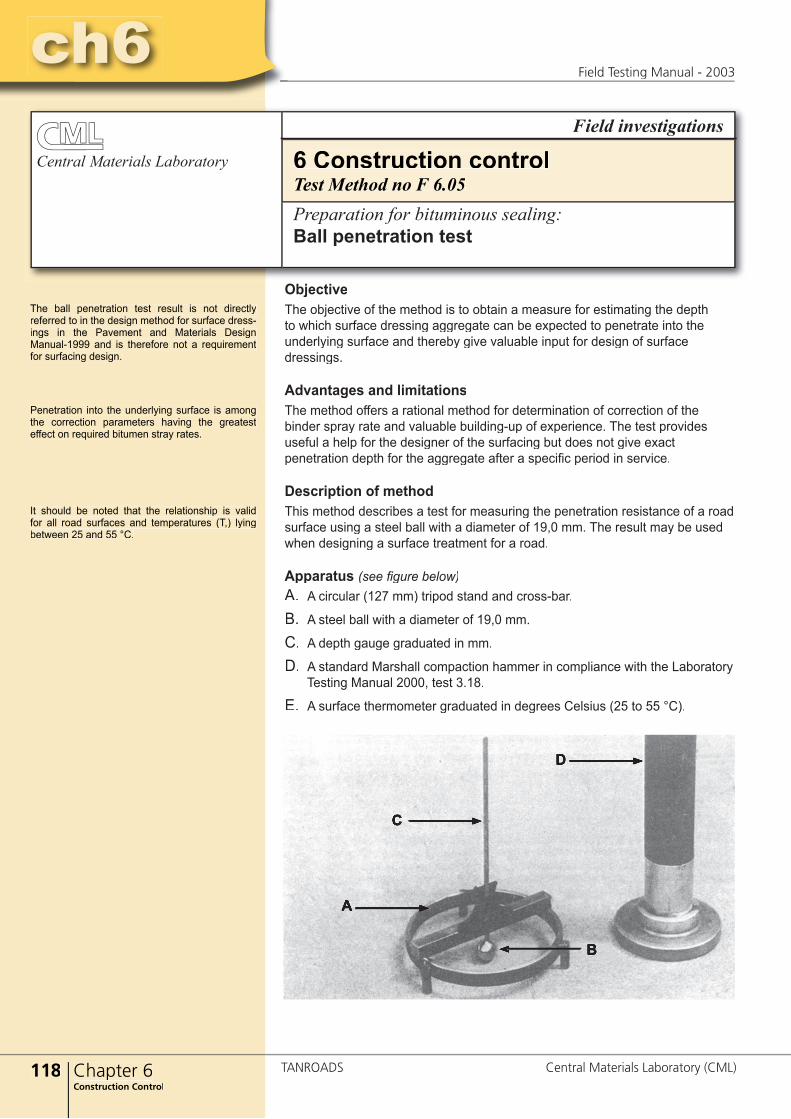
118 Chapter 6Construction Control
ch6Field Testing Manual - 2003
TANROADS Central Materials Laboratory (CML)
ch6
ObjectiveThe objective of the method is to obtain a measure for estimating the depth to which surface dressing aggregate can be expected to penetrate into the underlying surface and thereby give valuable input for design of surface dressings.
Advantages and limitationsThe method offers a rational method for determination of correction of the binder spray rate and valuable building-up of experience. The test provides useful a help for the designer of the surfacing but does not give exact penetration depth for the aggregate after a specifi c period in service.
Description of methodThis method describes a test for measuring the penetration resistance of a roadsurface using a steel ball with a diameter of 19,0 mm. The result may be usedwhen designing a surface treatment for a road.
Apparatus (see fi gure below)Α. A circular (127 mm) tripod stand and cross-bar.
B. A steel ball with a diameter of 19,0 mm.
C. A depth gauge graduated in mm.
D. A standard Marshall compaction hammer in compliance with the Laboratory Testing Manual 2000, test 3.18.
E. A surface thermometer graduated in degrees Celsius (25 to 55 °C).
The ball penetration test result is not directly referred to in the design method for surface dress-ings in the Pavement and Materials Design Manual-1999 and is therefore not a requirement for surfacing design.
Penetration into the underlying surface is among the correction parameters having the greatest effect on required bitumen stray rates.
It should be noted that the relationship is valid for all road surfaces and temperatures (T,) lying between 25 and 55 °C.
Central Materials Laboratory
Field investigations
6 Construction controlTest Method no F 6.05Preparation for bituminous sealing:Ball penetration test
A
B
C
D

ch6
119Chapter 6Construction Control
ch6Field Testing Manual - 2003
Central Materials Laboratory (CML) TANROADS
Procedure Subdivide the road into a number of representative sites. Toss the steel ball onto the road at each site in a random manner.
Place the circular tripod stand over the ball at the point where it comes to rest so that the ball is in the centre of the circular frame. Place the cross-bar in the slots provided on the stand so that the forward edge of the bar is vertically above the centre of the ball. Take an initial reading by means of a depth gauge from the top of the cross-bar to the top of the ball and remove the bar without disturbing the tripod stand.
Give the ball one blow with the Marshall hammer and replace the cross-bar in the same position as before. Take a second reading as above. The depth of penetration is the difference between the two readings. Repeat the procedure at least 10 times at each site and report the mean depth of penetration of the steel ball.
Take the temperature of the road surface at each site for each set of penetration readings.
Calculation and reporting Correct the penetration reading by means of the following formula:
PenT0 = PenT1 - K(T1 – T0)
Where:Pen T0 = penetration depth at suggested road surface temperature (mm)Pen T1 = penetration depth at measured road surface temperature (mm)T1 = temperature of road at time of ball test ( 0C)T0 = temperature of road suggested for particular location ( 0C)K = temperature-susceptibility of penetration (mm/OC).
The following K-factors are recommended:0,04 mm/0C Single and multiple seals (not fatty)0,05 mm/0C Slurry seals (not fatty)0,07 mm/0C Cape seals (not fatty)0,08 mm/0C Fatty roads and premix surfacings.
References● NITRR, Council for Scientifi c and Industrial Research, Republic og South
Africa, 1984. Technical Methods for Highways (TMH) no. 6: Special methods for testing roads
120
Field Testing Manual - 2003
TANROADS Central Materials Laboratory (CML)
APPENDICES
Appendix 1: CML Laboratory and test methodsAppendix 2: Soil profi ling descriptions after Briks and JenningsAppendix 3: CUSUM method for delineation of homogenous sectionsAppendix 4: The MERLIN method for measuring roughnessAppendix 5: Layout of survey sites and traffi c safety measuresAppendix 6: Design Traffi c Loading - exampleAppendix 7: Defi nition of terms Appendix 8: AbbreviationsAppendix 9: Worksheets
References● Pavement and Materials Design Manual - 1999, Ministry of Works, Tanzania● Laboratory Testing Manual - 2000, Ministry of Works● Guideline no 2 Pavement Testing, Analysis and Interpretation of Test Data, Roads Department, Botswana - 2000● Guideline no 3 Methods and Procedures for Prospecting for Road Construction Materials, Roads Department, Botswana - 2000● Guideline no 4 Axle Load Surveys, Roads Department, Botswana - 2000
Appendices
1
6
3
4
2
Introduction
Construction control
Pavement evaluation
Axle load surveys
Geotechnique
5 Material prospecting and alignment surveys
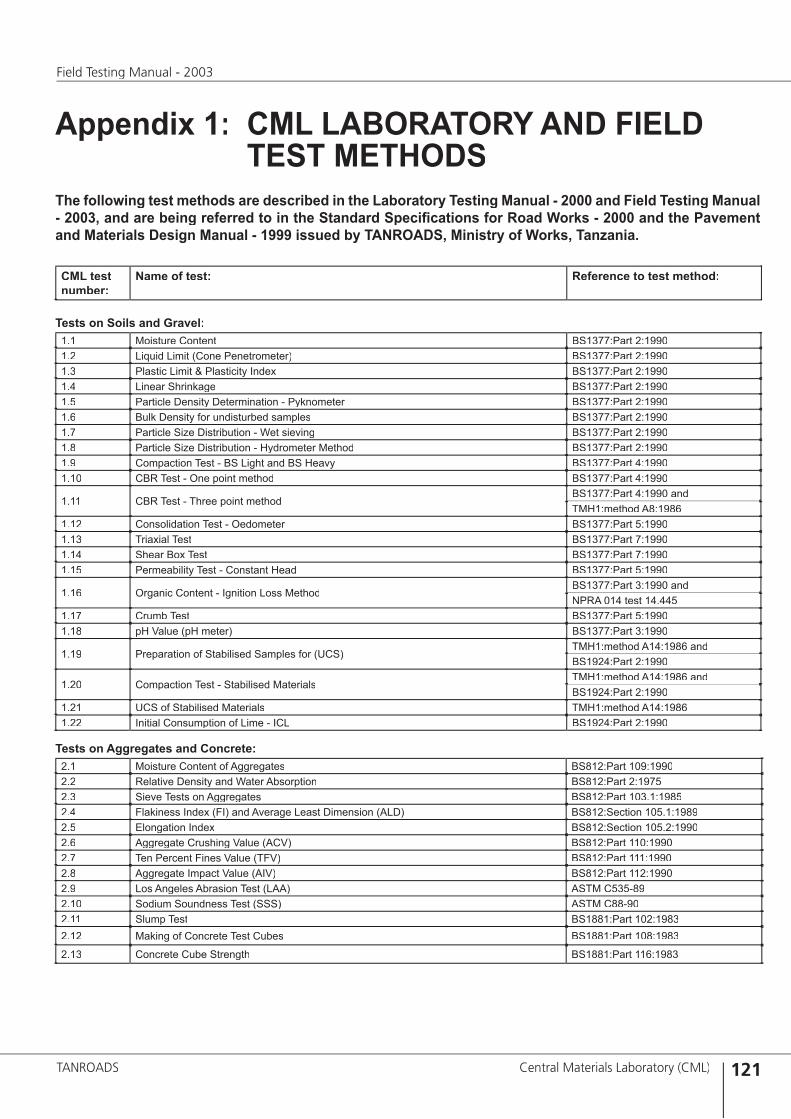
121
Field Testing Manual - 2003
TANROADS Central Materials Laboratory (CML)
Appendix 1: CML LABORATORY AND FIELD TEST METHODSThe following test methods are described in the Laboratory Testing Manual - 2000 and Field Testing Manual - 2003, and are being referred to in the Standard Specifi cations for Road Works - 2000 and the Pavement and Materials Design Manual - 1999 issued by TANROADS, Ministry of Works, Tanzania.
CML test number:
Name of test: Reference to test method:
Tests on Soils and Gravel:1.1 Moisture Content BS1377:Part 2:19901.2 Liquid Limit (Cone Penetrometer) BS1377:Part 2:19901.3 Plastic Limit & Plasticity Index BS1377:Part 2:19901.4 Linear Shrinkage BS1377:Part 2:19901.5 Particle Density Determination - Pyknometer BS1377:Part 2:19901.6 Bulk Density for undisturbed samples BS1377:Part 2:19901.7 Particle Size Distribution - Wet sieving BS1377:Part 2:19901.8 Particle Size Distribution - Hydrometer Method BS1377:Part 2:19901.9 Compaction Test - BS Light and BS Heavy BS1377:Part 4:19901.10 CBR Test - One point method BS1377:Part 4:1990
1.11 CBR Test - Three point methodBS1377:Part 4:1990 and TMH1:method A8:1986
1.12 Consolidation Test - Oedometer BS1377:Part 5:19901.13 Triaxial Test BS1377:Part 7:19901.14 Shear Box Test BS1377:Part 7:19901.15 Permeability Test - Constant Head BS1377:Part 5:1990
1.16 Organic Content - Ignition Loss MethodBS1377:Part 3:1990 and NPRA 014 test 14.445
1.17 Crumb Test BS1377:Part 5:19901.18 pH Value (pH meter) BS1377:Part 3:1990
1.19 Preparation of Stabilised Samples for (UCS)TMH1:method A14:1986 andBS1924:Part 2:1990
1.20 Compaction Test - Stabilised MaterialsTMH1:method A14:1986 andBS1924:Part 2:1990
1.21 UCS of Stabilised Materials TMH1:method A14:19861.22 Initial Consumption of Lime - ICL BS1924:Part 2:1990
Tests on Aggregates and Concrete:2.1 Moisture Content of Aggregates BS812:Part 109:19902.2 Relative Density and Water Absorption BS812:Part 2:19752.3 Sieve Tests on Aggregates BS812:Part 103.1:19852.4 Flakiness Index (FI) and Average Least Dimension (ALD) BS812:Section 105.1:19892.5 Elongation Index BS812:Section 105.2:19902.6 Aggregate Crushing Value (ACV) BS812:Part 110:19902.7 Ten Percent Fines Value (TFV) BS812:Part 111:19902.8 Aggregate Impact Value (AIV) BS812:Part 112:19902.9 Los Angeles Abrasion Test (LAA) ASTM C535-892.10 Sodium Soundness Test (SSS) ASTM C88-902.11 Slump Test BS1881:Part 102:19832.12 Making of Concrete Test Cubes BS1881:Part 108:1983
2.13 Concrete Cube Strength BS1881:Part 116:1983

122
Field Testing Manual - 2003
TANROADS Central Materials Laboratory (CML)
Tests on Asphalt and Bituminous Materials3.1 Preconditioning of Bitumen Samples Prior to Mixing or Testing NPRA 014 test 14.5113.2 Density of Bituminous Binders ASTM D70-973.3 Flash and Fire Point by Cleveland Open Cup ASTM D92-903.4 Thin-Film Oven Test (TFOT) ASTM D1754-873.5 Penetration of Bituminous Materials ASTM D5-863.6 Softening Point Test ASTM D36-703.7 Ductility ASTM D113-863.8 Viscosity Determination using the Brookfi eld Thermosel Apparatus ASTM D4402-913.9 Density and Water Absorption of Aggregates Retrieved on a 4.75 mm Sieve ASTM C127-883.10 Density and Water Absorption of Aggregates Passing the 4.75 mm Sieve ASTM C128-883.11 Calibration of Glass Pycnometers (0.5-1 litre) NPRA 014 test 14.59223.12 Mixing of Test Specimens; Hot Bituminous Mixes NPRA 014 test 14.5532
3.13 Determination of Maximum Theoretical Density of Asphalt Mixesand Absorption of Binder into Aggregates ASTM D2041-95 and D4469-85
3.14 Bulk Density of Saturated Surface Dry Asphalt Mix Samples ASTM D2726-963.15 Bulk Density of Paraffi n-Coated Asphalt Mix Samples ASTM D1188-893.16 Bulk Density of Asphalt Mix Samples, Calliper Measurements NPRA 014 test 14.56223.17 Calculation of Void Content in Bituminous Mixes ASTM D3203 and AASHTO pp19-933.18 Marshall Test ASTM D1559-893.19 Marshall Mix Design ASTM D1559-89
3.20 Refusal Density Mix Design TRL Overseas Road Note 31, app. D:1990
3.21 Indirect Tensile Strength Test ASTM D3967 and NPRA 014 test 14.554
3.22 Determination of Binder Content and Aggregate Grading by Extraction ASTM D2172-88, method B3.23 Effect of Water on Bituminous Coated Aggregates, Boiling Test ASTM D3625-96
Field TestsF2.01 Soundings Cone penetration - CPT B51377: Part 9: 1990
B55930: 1999
F2.02 Soundings Standard penetration test - SPT and continuous core penetration test - CCPT
B51377: Part 9: 1990B55930: 1999
F2.03 Soundings Vane test B51377: Part 9: 1990B55930: 1999
F2.04 Boring U100 (U4) sampling, undisturbed samples B55930: 1999F2.05 Ground water Pore pressure, ground water level B55930: 1999F2.06 Ground water Permeability tests for soils and rocks B55930: 1999F2.07 Ground water Ground water sampling B55930: 1999
F2.08 Deformation test Plate loading test BS 1377:Part 9: 1990
F6.01 Density Sand replacement B51377: Part 9: 1990F6.02 Density Nuclear gauge B51377: Part 9: 1990
ASTM D2922ASTM D 2950 - 91ASTM D3717
F6.03 Density Core cutting BS 1377: Part 9: 1990
F6.04 Preparation for bituminous sealing Sand patch test TMH 6: Method ST 1
F6.05 Preparation for bituminous sealing Ball penetration test TMH 6: Method ST 4
Pavement evaluation Visual evaluation Chapter 3.3.3Rut depth measurements Chapter 3.3.4Roughness measurements Chapter 3.3.5DCP measurements Chapter 3.4.2Defl ection measurements Chapter 3.4.3Test pit profi ling and sampling in existing pavements Chepter 3.5
CML test number:
Name of test: Reference to test method:
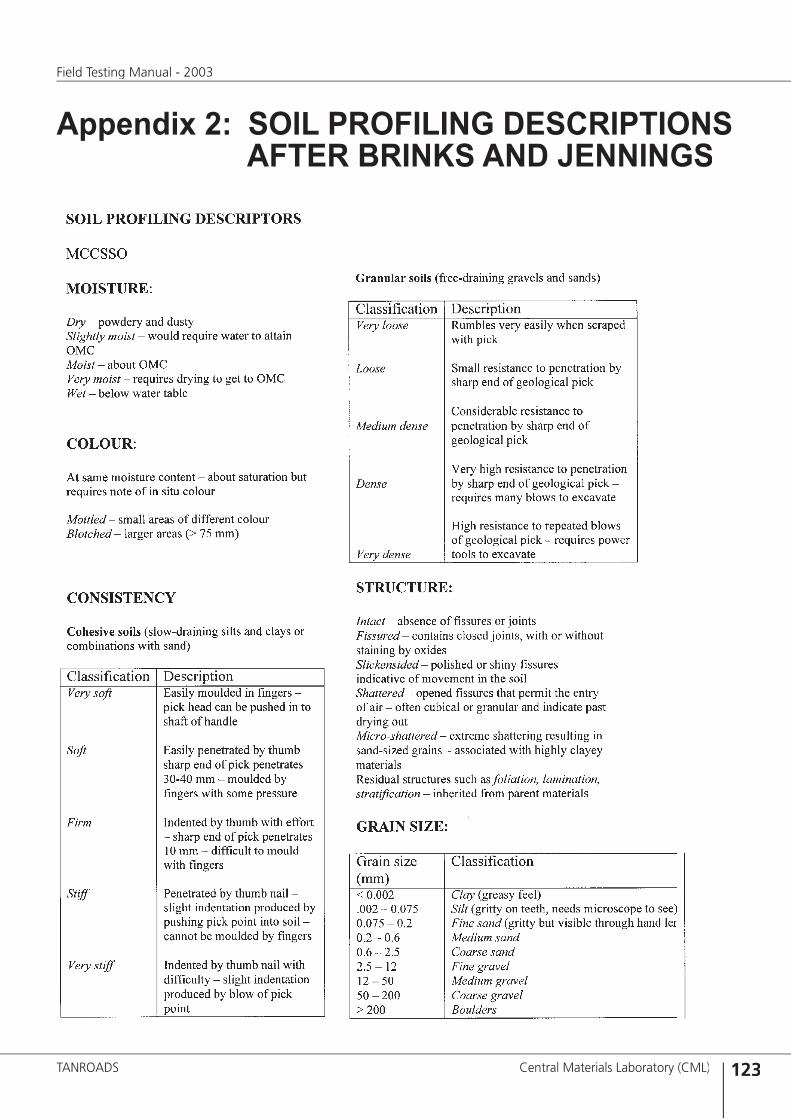
123
Field Testing Manual - 2003
TANROADS Central Materials Laboratory (CML)
Appendix 2: SOIL PROFILING DESCRIPTIONS AFTER BRINKS AND JENNINGS
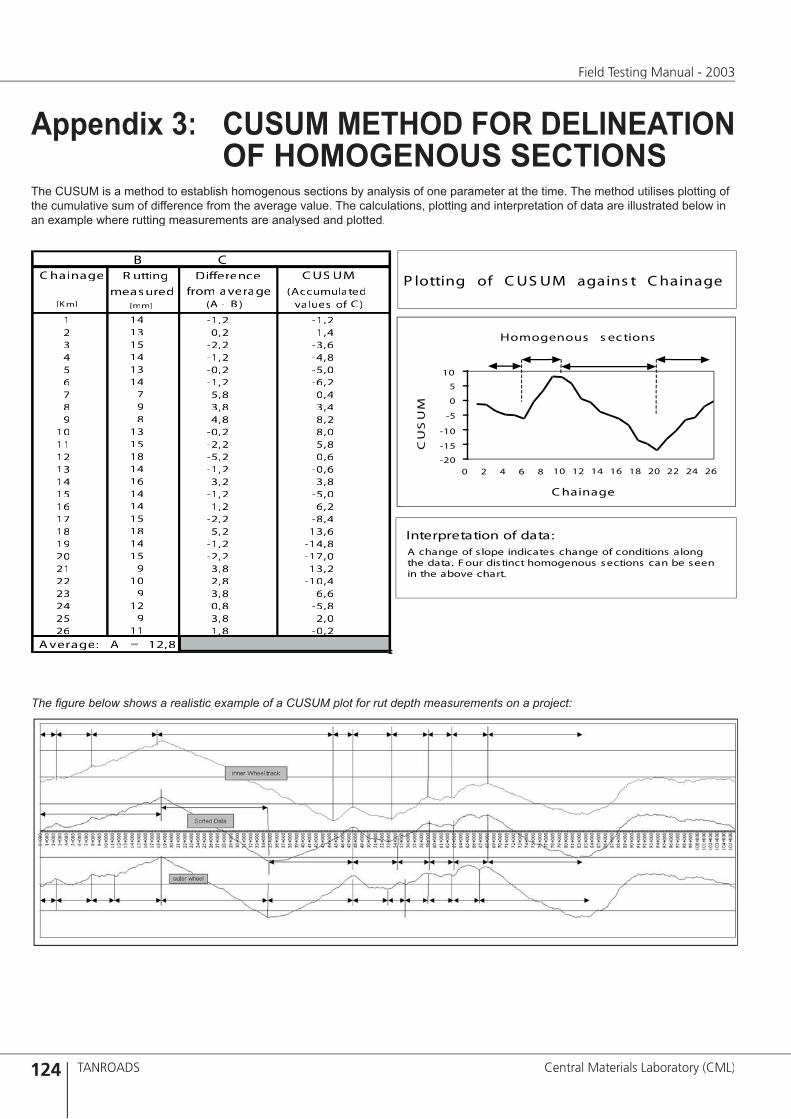
124
Field Testing Manual - 2003
TANROADS Central Materials Laboratory (CML)
Appendix 3: CUSUM METHOD FOR DELINEATION OF HOMOGENOUS SECTIONSThe CUSUM is a method to establish homogenous sections by analysis of one parameter at the time. The method utilises plotting of the cumulative sum of difference from the average value. The calculations, plotting and interpretation of data are illustrated below in an example where rutting measurements are analysed and plotted.
The fi gure below shows a realistic example of a CUSUM plot for rut depth measurements on a project:
� ��������� � ������ ��� ������� ���� ����� ��� ��
�������� ���� ������� ���������������� ���� �� � �� ������ �� ��
� �� ���� ����� �� ���� ����� �� ���� ����� �� ���� ����� �� ���� ����� �� ���� ����� � ��� ����� � ��� ���� � ��� ���
�� �� ���� ����� �� ���� ����� �� ���� ����� �� ���� ������ �� ���� ������ �� ���� ������ �� ���� ������ �� ���� ������ �� ���� ������� �� ���� ������� �� ���� ������� � ��� ������� �� ��� ������� � ��� ������ �� ��� ������ � ��� ������ �� ��� ����
�������� � � ������ �� �� ��
���������� � �������
���
���
���
��
�
�
��
� � � � � �� �� �� �� �� �� �� �� ��
��������
��
��
�
� ������� �� ��� �� ������ � � �������
�������������� �� ������ ������ �� � ���� ��������� ������ �� ���������� �������� ����� ���� �������� ���������� �������� ��� �� ������ ��� ����� ������
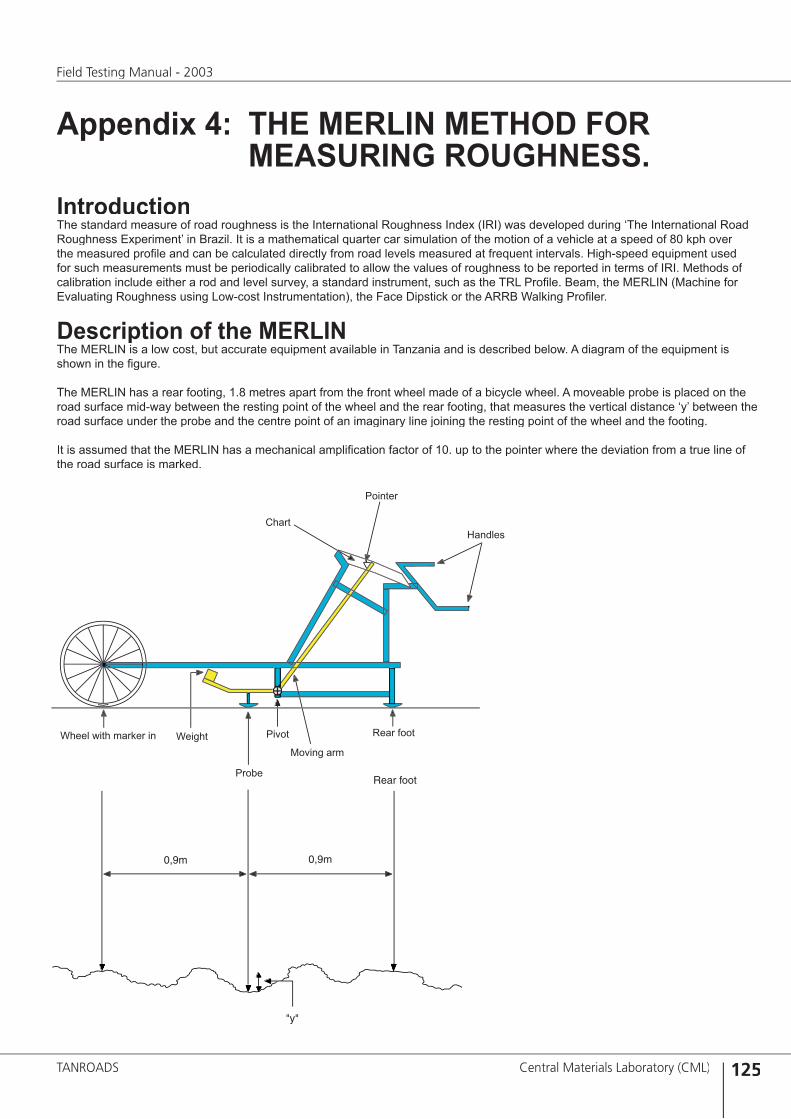
125
Field Testing Manual - 2003
TANROADS Central Materials Laboratory (CML)
Appendix 4: THE MERLIN METHOD FOR MEASURING ROUGHNESS.IntroductionThe standard measure of road roughness is the International Roughness Index (IRI) was developed during ‘The International Road Roughness Experiment’ in Brazil. It is a mathematical quarter car simulation of the motion of a vehicle at a speed of 80 kph over the measured profi le and can be calculated directly from road levels measured at frequent intervals. High-speed equipment used for such measurements must be periodically calibrated to allow the values of roughness to be reported in terms of IRI. Methods of calibration include either a rod and level survey, a standard instrument, such as the TRL Profi le. Beam, the MERLIN (Machine for Evaluating Roughness using Low-cost Instrumentation), the Face Dipstick or the ARRB Walking Profi ler.
Description of the MERLINThe MERLIN is a low cost, but accurate equipment available in Tanzania and is described below. A diagram of the equipment is shown in the fi gure.
The MERLIN has a rear footing, 1.8 metres apart from the front wheel made of a bicycle wheel. A moveable probe is placed on the road surface mid-way between the resting point of the wheel and the rear footing, that measures the vertical distance ‘y’ between the road surface under the probe and the centre point of an imaginary line joining the resting point of the wheel and the footing.
It is assumed that the MERLIN has a mechanical amplifi cation factor of 10. up to the pointer where the deviation from a true line of the road surface is marked.
Wheel with marker in Weight
Probe
Pivot
Moving arm
Rear foot
Handles
Pointer
Chart
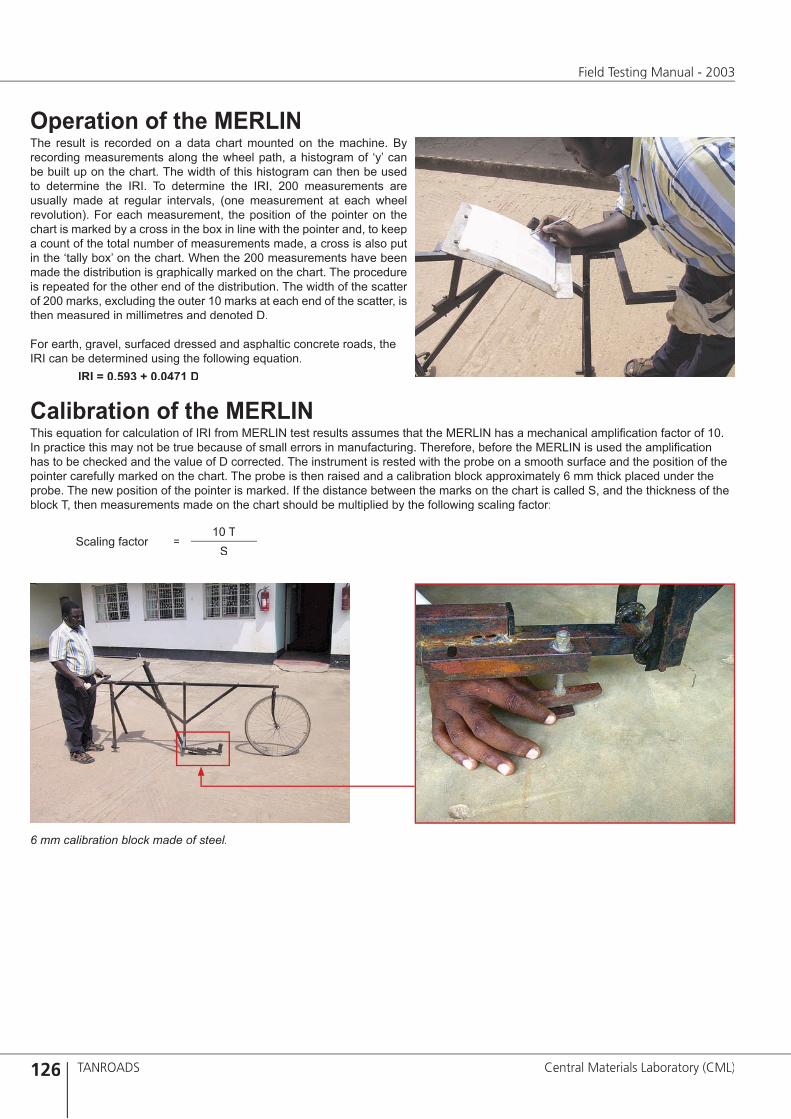
126
Field Testing Manual - 2003
TANROADS Central Materials Laboratory (CML)
Operation of the MERLINThe result is recorded on a data chart mounted on the machine. By recording measurements along the wheel path, a histogram of ‘y’ can be built up on the chart. The width of this histogram can then be used to determine the IRI. To determine the IRI, 200 measurements are usually made at regular intervals, (one measurement at each wheel revolution). For each measurement, the position of the pointer on the chart is marked by a cross in the box in line with the pointer and, to keep a count of the total number of measurements made, a cross is also put in the ‘tally box’ on the chart. When the 200 measurements have been made the distribution is graphically marked on the chart. The procedure is repeated for the other end of the distribution. The width of the scatter of 200 marks, excluding the outer 10 marks at each end of the scatter, is then measured in millimetres and denoted D.
For earth, gravel, surfaced dressed and asphaltic concrete roads, the IRI can be determined using the following equation.
IRI = 0.593 + 0.0471 D
Calibration of the MERLINThis equation for calculation of IRI from MERLIN test results assumes that the MERLIN has a mechanical amplifi cation factor of 10. In practice this may not be true because of small errors in manufacturing. Therefore, before the MERLIN is used the amplifi cation has to be checked and the value of D corrected. The instrument is rested with the probe on a smooth surface and the position of the pointer carefully marked on the chart. The probe is then raised and a calibration block approximately 6 mm thick placed under the probe. The new position of the pointer is marked. If the distance between the marks on the chart is called S, and the thickness of the block T, then measurements made on the chart should be multiplied by the following scaling factor:
Scaling factor =10 T
S
6 mm calibration block made of steel.
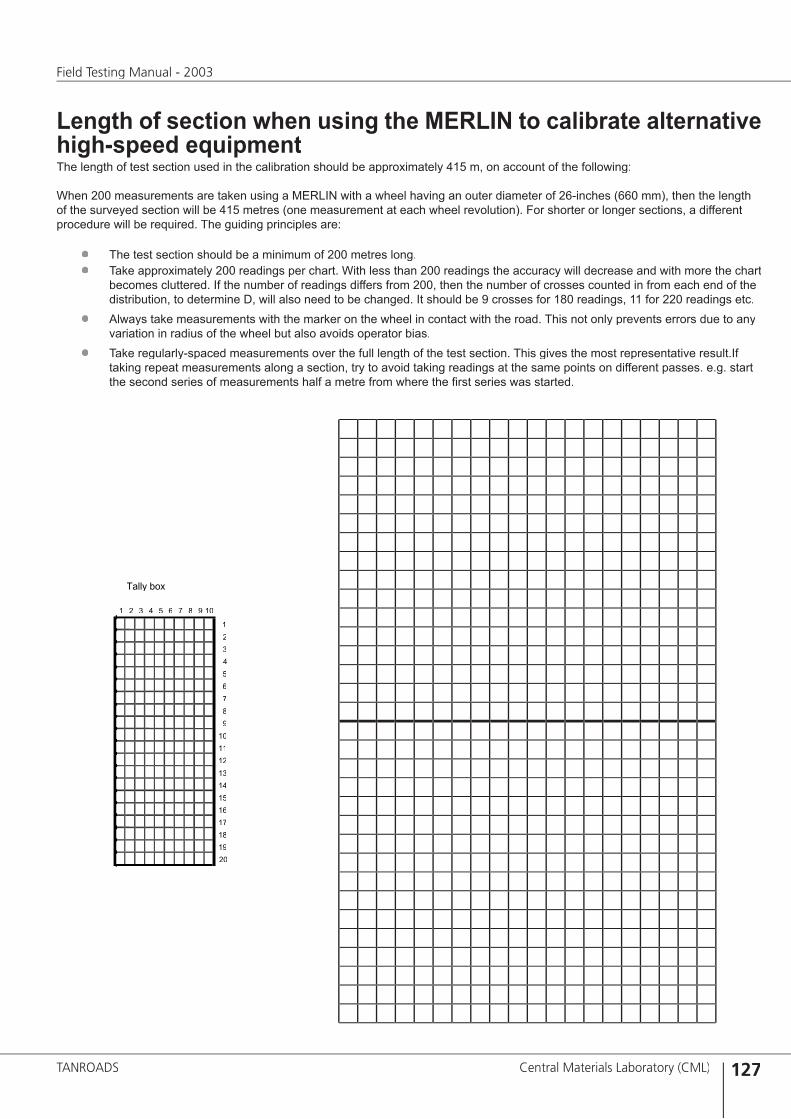
127
Field Testing Manual - 2003
TANROADS Central Materials Laboratory (CML)
Length of section when using the MERLIN to calibrate alternative high-speed equipmentThe length of test section used in the calibration should be approximately 415 m, on account of the following:
When 200 measurements are taken using a MERLIN with a wheel having an outer diameter of 26-inches (660 mm), then the length of the surveyed section will be 415 metres (one measurement at each wheel revolution). For shorter or longer sections, a different procedure will be required. The guiding principles are:
● The test section should be a minimum of 200 metres long.● Take approximately 200 readings per chart. With less than 200 readings the accuracy will decrease and with more the chart
becomes cluttered. If the number of readings differs from 200, then the number of crosses counted in from each end of the distribution, to determine D, will also need to be changed. It should be 9 crosses for 180 readings, 11 for 220 readings etc.
● Always take measurements with the marker on the wheel in contact with the road. This not only prevents errors due to any variation in radius of the wheel but also avoids operator bias.
● Take regularly-spaced measurements over the full length of the test section. This gives the most representative result.If taking repeat measurements along a section, try to avoid taking readings at the same points on different passes. e.g. start the second series of measurements half a metre from where the fi rst series was started.
Tally box
1 2 3 4 5 6 7 8 9 10
1
2
3
4
5
6
7
8
9
10
11
12
13
14
15
16
17
18
19
20
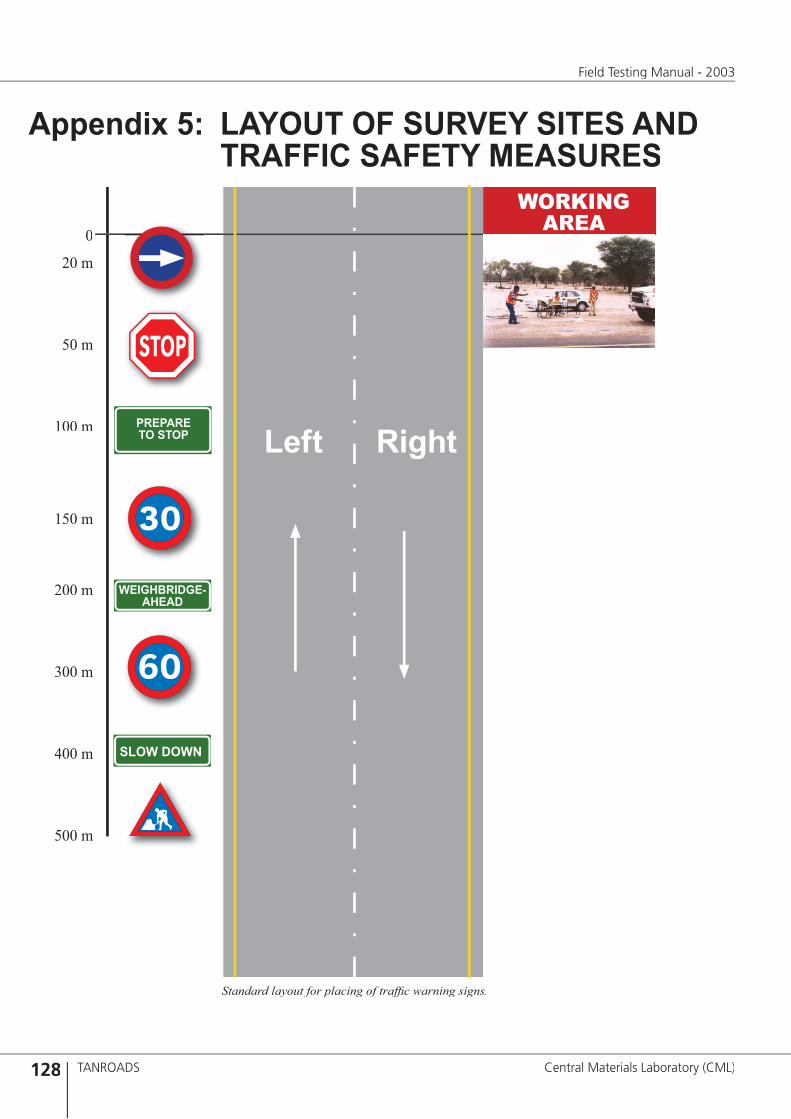
128
Field Testing Manual - 2003
TANROADS Central Materials Laboratory (CML)
Appendix 5: LAYOUT OF SURVEY SITES AND TRAFFIC SAFETY MEASURES
0
20 m
50 m
100 m
150 m
200 m
300 m
400 m
500 m
WORKING AREA
SLOW DOWN
WEIGHBRIDGE-AHEAD
PREPARETO STOP
Standard layout for placing of traffi c warning signs.
Left Right
129
Field Testing Manual - 2003
TANROADS Central Materials Laboratory (CML)
Appendix 6: DESIGN TRAFFIC LOADING - EXAMPLE
Input datan Design period = 20 years. n Pavement construction is expected to be completed 3 years after the time of traffi c survey.n Traffi c growth rate = 3.5% (for all heavy vehicle categories).
Direction 1 Direction 2Vehicle category/counts Vehicle category/counts
Buses MGV HGV VHGH Buses MGV HGV VHGHDay 1 0 13 11 24 13 24 11 9Day 2 11 17 5 17 14 26 9 12Day 3 15 28 11 20 15 13 16 20Day 4 13 19 15 24 10 29 9 26Day 5 11 36 9 26 15 30 10 38Day 6 14 18 15 33 13 25 12 21Day 7 16 9 8 11 13 16 13 28Day 8 17 11 4 2 0 5 7 9Total 92 151 78 157 93 168 87 163Daily 13 19 10 20 13 21 11 20
Summary of axle load survey and equivalency factors. Assessment of axles heavier than 13 tonnes. (Chapters 4.5.2, 4.2.3 and 4.5.4 in the Pavement and Materials Design Manual - 1999)
Vehicle category
Direction 1 Direction 2Avg. Gross wt.(ton)
Avg. VEF(80 kN)
Total No. of veh.
E80 from all axles
E80 from axles heavier than 13 tonnes
Avg. Gross wt.(ton)
Avg. VEF(80kN)
Total No. of veh.
E80 from all axles
E80 from axles heavier than 13 tonnes
Buses 17.396 3.922 92 360.824 0 17.265 4.033 93 375.069 13.25
MGV 12.217 3.705 151 559.455 280.19 12.615 3.262 168 548.016 220.93
HGV 23.146 8.959 78 698.802 282.40 22.480 8.557 87 744.459 359.15
VHGV-SEMI 39.196 8.087 114 921.918 133.57 45.160 13.81 131 1809.11 128.35
-TR 40.548 10.031 43 431.333 204.72 33.987 7.936 32 253.952 173.58 -ST 0.000 0.000 0 0 0 0.000 0.000 0 0 0
Avg. of all VHGV’s
39.566 8.620 42.966 12.657
SUM of VHGV’s
157 1353.25 338.29 163 2063.06 301.93
Total 478 a=2972.33 b=900.88 511 a=3730.60 b=895.26
From the heaviest loaded direction, proportion of E80 made up from axles heavier than 13tonnes (in direction 2):
= (b/a) x 100 = (895.26/3730.60) x 100 = 24%This value is less than 50%, thus the Traffi c Load Class will not be denoted heavy (-H) and no special measures are required in the pavement design or design of improved subgrade.
Traffi c growth and design traffi c loading (Chapters 4.5.5 and 4.5 in the Pavement and Materials Design Manual - 1999)
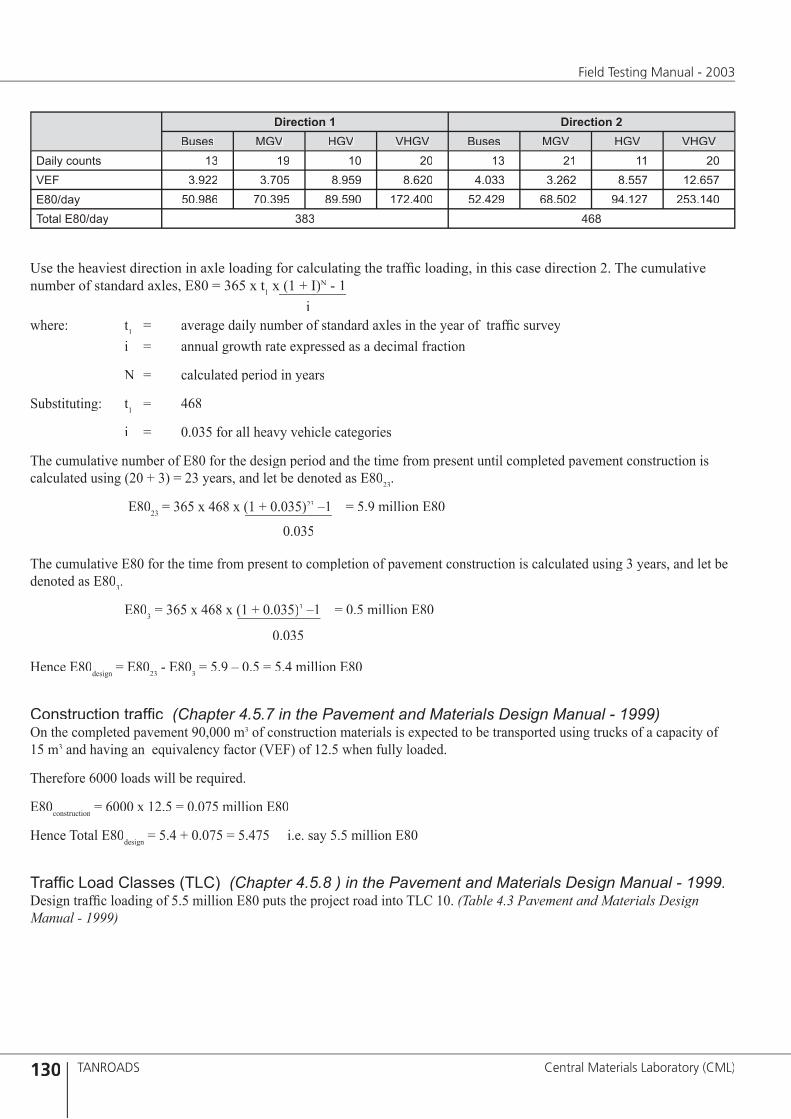
130
Field Testing Manual - 2003
TANROADS Central Materials Laboratory (CML)
Direction 1 Direction 2Buses MGV HGV VHGV Buses MGV HGV VHGV
Daily counts 13 19 10 20 13 21 11 20VEF 3.922 3.705 8.959 8.620 4.033 3.262 8.557 12.657E80/day 50.986 70.395 89.590 172.400 52.429 68.502 94.127 253.140Total E80/day 383 468
Use the heaviest direction in axle loading for calculating the traffi c loading, in this case direction 2. The cumulative number of standard axles, E80 = 365 x t1 x (1 + I)N - 1
iwhere: t1 = average daily number of standard axles in the year of traffi c survey
i = annual growth rate expressed as a decimal fraction
N = calculated period in years
Substituting: t1 = 468
i = 0.035 for all heavy vehicle categories
The cumulative number of E80 for the design period and the time from present until completed pavement construction is calculated using (20 + 3) = 23 years, and let be denoted as E8023.
E8023 = 365 x 468 x (1 + 0.035)23 –1 = 5.9 million E80
0.035
The cumulative E80 for the time from present to completion of pavement construction is calculated using 3 years, and let be denoted as E803.
E803 = 365 x 468 x (1 + 0.035)3 –1 = 0.5 million E80
0.035
Hence E80design = E8023 - E803 = 5.9 – 0.5 = 5.4 million E80
Construction traffi c (Chapter 4.5.7 in the Pavement and Materials Design Manual - 1999)On the completed pavement 90,000 m3 of construction materials is expected to be transported using trucks of a capacity of 15 m3 and having an equivalency factor (VEF) of 12.5 when fully loaded.
Therefore 6000 loads will be required.
E80construction = 6000 x 12.5 = 0.075 million E80
Hence Total E80design = 5.4 + 0.075 = 5.475 i.e. say 5.5 million E80
Traffi c Load Classes (TLC) (Chapter 4.5.8 ) in the Pavement and Materials Design Manual - 1999.Design traffi c loading of 5.5 million E80 puts the project road into TLC 10. (Table 4.3 Pavement and Materials Design Manual - 1999)

131
Field Testing Manual - 2003
TANROADS Central Materials Laboratory (CML)
Appendix 7: DEFINITIONS AND TERMS Asphalt Concrete (AC) A group of hot bituminous mixtures used for surfacing. They normally consist of a well
graded mixture of coarse aggregate, fi ne aggregate and fi ller, bound together with penetration grade bitumen.
Base course The layer(s) occurring immediately below the surfacing and above the surfacing and above the surfacing subbase or, if there is no subbase, above the improved subgrade layers.
Behaviour The function of the condition of the pavement with time (see also performance).
Binder course, bituminous The surfacing layer immediately below the surfacing layer immediately below the surfacing bituminous wearing course above the base course.
Bitumen emulsion A binder in which bitumen has been dispersed in fi nely divided droplets in water by the aid of mechanical means and an emulsifying agent. Bitumen emulsion is made in an anionic and a cationic type depending on the particle charge of the bitumen droplets in solution. Bitumen emulsions are classifi ed according to percentage of bitumen in the material and the physical properties related to their behaviour during construction, (See also break).
Bitumen stabilised material A material made of natural- or crushed aggregate with a bituminous binder admixed. Used in pavement layers - primarily for base course.
Bitumen-rubber A binder in which bitumen is modifi ed with more than 15% ground rubber. (See alsomodifi ed binder).
Bituminous binders Petroleum derived adhesives used for sealing of surfaces and binding of aggregates in pavement layers. Classifi ed according to their composition and physical properties. (See also penetration grade bitumen, cutback bitumen, bitumen emulsion, bitumen rubber, and modifi ed binders).
Bituminous seals A general term for thin bituminous wearing courses made of surface treatments or slurry seals, or a combination of these.
Borrow pit A borrow pit is a site from which natural material, other than solid stone, is removed for use in construction of the works. The term borrow area is also used.
Break of emulsions ‘Break’ of a bitumen emulsion is when the water and bitumen separates so that the water will evaporate, leaving behind the bitumen to perform its function.
Buses All buses with a seating capacity of 40 or more.
Cement- or lime modifi ed Naturally occurring gravel and soils which are modifi ed by the addition of either lime ormaterial (CM) Portland cement so that their engineering properties such as strength and plasticity are im
proved, but the materials still remain fl exible. Used in pavement- and improved subgrade layers. (See also Cement- or lime stabilised material).
Cement- or lime stabilised A material that consists of snatural- or crushed gravel stabilised with ordinary Port material (C4, C2, C1)material (C4, C2, C1)material land cement or lime such that a semirigid material is produced. Classifi ed according
to their minimum unconfi ned compressive strength. Used in pavement layers. (See also Cement- or lime modifi ed material).
132
Field Testing Manual - 2003
TANROADS Central Materials Laboratory (CML)
Crushed rock (CRR) Crushed material made from fresh quarried rock or clean, un-weathered boulders of min 0.3 m diameter. All particles shall be crushed. The material is compacted to a specifi ed percentage of the aggregate’s apparent density.
Crushed stone (CRS) Crushed stones. Min 50% by mass of particles larger than 5 mm shall have at least one crushed face. Made from crushing of stones, boulders or oversize from natural gravel. Max 30% of the fraction passing the 4.75 mm sieve can be soil fi nes. The material is compacted to a specifi ed relative density of BS-Heavy.
Curing membrane A bituminous binder, usually made of bitumen emulsion, applied immediately after construction of a completed surface of modifi ed or stabilised materials with lime or or stabilised materials with lime or orcement. Its purpose is to prevent early drying out of the cemented layer and to mini-mise adverse effects of the stabiliser’s contact with CO2 in the air.
Cutback bitumen A penetration bitumen which viscosity has been temporarily reduced by blending with solvents. The solvents are expected to evaporate during the early part of the pavement’s service life. Classifi ed according to their viscosity.
Cutting A cutting is a section of the road where the formation level is below the original ground level.
Defl ection (surface) The recoverable vertical movements of the pavement surface caused by the applica-tion of a wheel load.
Deformation A mode of distress, unevenness of the surface profi les.
Degree of distress A measure of severity of the distress.
Distress The visible manifestation of deterioration of the pavement with respect to either the serviceability of the structural capacity.
Dry Density and Moisture Con- The moisture content, in %, to use for calculation of dry density of materials that tent of bituminous materials contain both bitumen and water, e.g. FBMIX and BEMIX, is defi ned as follows:
(weight of water) MC = x 100 (weight of aggregate + weight of bitumen) Dump rock (DR) Un-graded rock or boulder material with a suffi ciently low fi nes content so that the
large particles are in contact with each other when placed in earthworks layers. Used in fi ll and improvedand improvedand subgrade layers.
Dynamic Cone Penetrometer An instrument for assessing the in-situ CBR strength of granular materials/soils.(DCP)
Shrinkage Limit The saturated moisture content corresponding to the void ratio of a dried sample. In practise this is the moisture content below which little or no further volume change occurs in a soil being dried.
Skid resistance The general ability of a particular road surface to prevent skidding of vehicles.
MC =

133
Field Testing Manual - 2003
TANROADS Central Materials Laboratory (CML)
Slurry seal A cold premixed material of creamy consistency in a fresh state, made of crusher-dust, bitumen emulsion and cement fi ller. Water is added for adjustments of the consistency. If constructed in combination with a new surface dressing, it is named a Cape seal.
Structural capacity The ability of the pavement to withstand the effects of climate and traffi c loading.
Structural design The design of the pavement layers for adequate structural strength under the design conditions of traffi c loading, environment and subgrade support.
Structural distress Distress pertaining to the load bearing capacity of the pavement.
Structural evaluation The assessment of the structural capacity of a pavement.
Subbase The layer(s) occurring below the base course and above the improved subgrade layer.
Subgrade The completed earthworks within the road prism before the construction of the pavement layers.
Surface dressing A surface treatment made of single sized aggregates of crushed material. Can be surface treatment made of single sized aggregates of crushed material. Can be surface treatmentconstructed in single- or multiple layers.
Surface treatment A general term for thin bituminous wearing courses made by lightly rolling aggre-gate into a sprayed thin fi lm of bitumen. Aggregates can alternatively be made of crushed or natural material with a grading depending on the desired type of surface treatment to be produced. Can be constructed in single- or multiple layers.treatment to be produced. Can be constructed in single- or multiple layers.treatment
Surfacing integrity A measure of the condition of the surfacing as an intact and durable matrix (it in-cludes values of porosity and texture).
Surfacing, bituminous The uppermost pavement layer(s), which provides the riding surface for vehicles. Includes bituminous wearing course and bituminous binder course where used.
Tack coat An application of bituminous binder to a bituminous surface subsequent to placing bituminous binder to a bituminous surface subsequent to placing bituminous bindera bituminous layer. Usually made of bitumen emulsion with the purpose to improve the bond between bituminous layers.
Terminal level A minimum acceptable level of some feature of the road in terms of its service-ability.
Types of distress The sub-classifi cation of the various manifestations of a particular mode of distress.
Vehicle Equivalency Factor (VEF) The total number of equivalent standard axles calculated for one vehicle. The average of all these values within one vehicle category is subsequently calculated for ease of reference to traffi c count data.
Very Heavy Goods Vehicles (VHGV) All goods vehicles having 4 axles or more.
Wearing course, bituminous The uppermost surfacing layer. Can consist of a surfacing layer. Can consist of a surfacing bituminous mix or a bituminous seal, or both in combination.
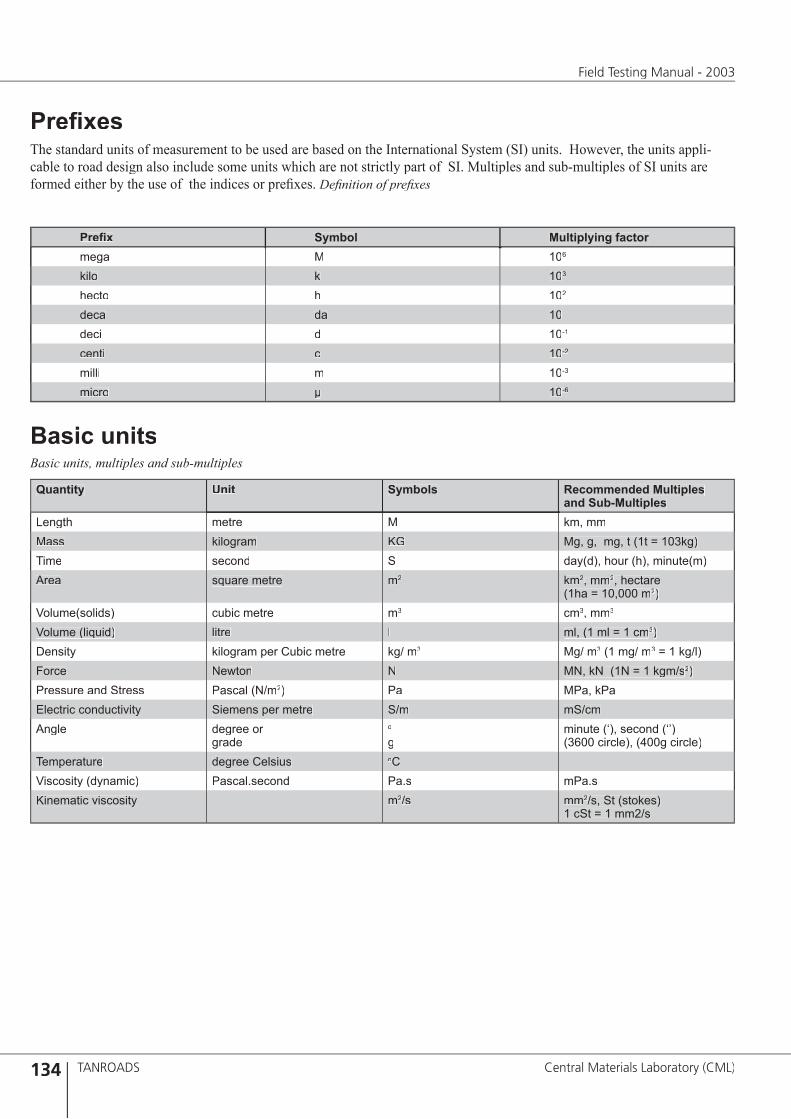
134
Field Testing Manual - 2003
TANROADS Central Materials Laboratory (CML)
Prefi x Symbol Multiplying factormega M 106
kilo k 103
hecto h 102
deca da 10deci d 10-1
centi c 10-2
milli m 10-3
micro µ 10-6
Prefi xesThe standard units of measurement to be used are based on the International System (SI) units. However, the units appli-cable to road design also include some units which are not strictly part of SI. Multiples and sub-multiples of SI units are formed either by the use of the indices or prefi xes. Defi nition of prefi xes
Quantity Unit Symbols Recommended Multiples and Sub-Multiples
Length metre M km, mmMass kilogram KG Mg, g, mg, t (1t = 103kg)Time second S day(d), hour (h), minute(m)Area square metre m2 km2, mm2, hectare
(1ha = 10,000 m2)Volume(solids) cubic metre m3 cm3, mm3
Volume (liquid) litre l ml, (1 ml = 1 cm3)Density kilogram per Cubic metre kg/ m3 Mg/ m3 (1 mg/ m3 = 1 kg/l)Force Newton N MN, kN (1N = 1 kgm/s2)Pressure and Stress Pascal (N/m2) Pa MPa, kPaElectric conductivity Siemens per metre S/m mS/cmAngle degree or
gradeo
gminute (‘), second (‘’) (3600 circle), (400g circle)
Temperature degree Celsius oCViscosity (dynamic) Pascal.second Pa.s mPa.sKinematic viscosity m2/s mm2/s, St (stokes)
1 cSt = 1 mm2/s
Basic unitsBasic units, multiples and sub-multiples
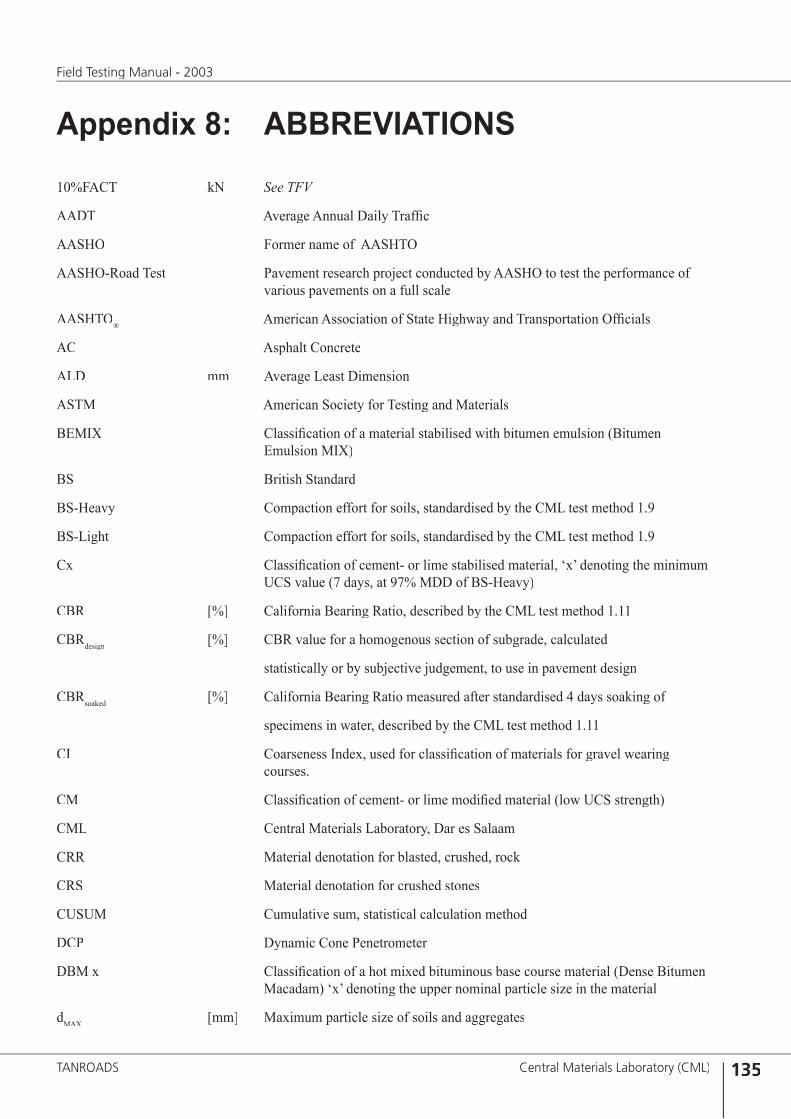
135
Field Testing Manual - 2003
TANROADS Central Materials Laboratory (CML)
Appendix 8: ABBREVIATIONS
10%FACT kN See TFV
AADT Average Annual Daily Traffi c
AASHO Former name of AASHTO
AASHO-Road Test AASHO-Road Test AASHO-Road Test Pavement research project conducted by AASHO to test the performance of various pavements on a full scale
AASHTO® American Association of State Highway and Transportation Offi cials
AC Asphalt Concrete
ALD mm Average Least Dimension
ASTM American Society for Testing and Materials
BEMIX Classifi cation of a material stabilised with bitumen emulsion (Bitumen Emulsion MIX)
BS British Standard
BS-Heavy Compaction effort for soils, standardised by the CML test method 1.9
BS-Light BS-Light BS-Light Compaction effort for soils, standardised by the CML test method 1.9
Cx Classifi cation of cement- or lime stabilised material, ‘x’ denoting the minimum UCS value (7 days, at 97% MDD of BS-Heavy)
CBR [%] California Bearing Ratio, described by the CML test method 1.11
CBRdesign [%] CBR value for a homogenous section of subgrade, calculated
statistically or by subjective judgement, to use in pavement design
CBRsoaked [%] California Bearing Ratio measured after standardised 4 days soaking of
specimens in water, described by the CML test method 1.11
CI Coarseness Index, used for classifi cation of materials for gravel wearing courses.
CM Classifi cation of cement- or lime modifi ed material (low UCS strength)
CML CML CML Central Materials Laboratory, Dar es Salaam
CRR CRR CRR Material denotation for blasted, crushed, rock
CRS Material denotation for crushed stones
CUSUM Cumulative sum, statistical calculation method
DCP DCP DCP Dynamic Cone Penetrometer
DBM x Classifi cation of a hot mixed bituminous base course material (Dense Bitumen Macadam) ‘x’ denoting the upper nominal particle size in the material
dMAX [mm] Maximum particle size of soils and aggregates
136
Field Testing Manual - 2003
TANROADS Central Materials Laboratory (CML)
dMIN [mm] Minimum particle size of soils and aggregates
dX [mm] The sieve size through which ‘x’% of all particle pass
E80 Equivalent Standard Axle (8160 kg)
EIA EIA EIA Environmental Impact Assessment
EIS Environmental Impact Statement
E-Modulus [MPa] Elasticity Modulus, describing stress/strain properties of structural pavement layers
ESA ESA ESA Equivalent Standard Axle (=E80)
FBMIX Classifi cation of a material stabilised with foamed bitumen (Foamed Bitumen MIX)
FDD [%] Field Dry Density
FI [%] Flakiness Index, described by the CML test method 2.4
FMC [%] Field Moisture Content
Gx Classifi cation of gravel and soil materials, ‘x’ denoting the minimum CBR
GC Grading Coeffi cient = [ (%pass28mm) – (%pass0.425mm) ] x (%pass5mm) /100
GDP GDP GDP Gross Domestic Product
GM Grading Modulus = (300 - %pass2mm - %pass0.425mm - %pass0.075mm) / 100
GW GW GW Gravel Wearing course materials
ICL [%] Initial Consumption of Lime, derived from laboratory test CML 1.22
IRI m/km International Roughness Index
ISO International Standard Organisation
lab Laboratory
LAMBS Classifi cation of a hot mixed bituminous base course material (Large Aggregate Mixes for Base)
LL [%] Liquid Limit, described by the CML test method 1.2
LS [%] Linear Shrinkage, described by the CML test method 1.4
max Maximum
MC [%] Moisture Content
MC x Medium Curing (type of cutback bitumen), ‘x’ denotes the upper nominal viscosity limit
MDD [kg/m3] Maximum Dry Density (compaction effort shall be stated)
MoW MoW MoW Ministry of Work
min Minimum
MSS Magnesium Sulphate Soundness test
NEMC National Environment Management Council

137
Field Testing Manual - 2003
TANROADS Central Materials Laboratory (CML)
NPRA NPRA NPRA Norwegian Public Roads Administration
NORAD Norwegian Agency for International Development
OMC [%] Optimum Moisture Content (at MDD of BS-Heavy unless stated)
pen Penetration, used to identify a type of bitumen (penetration grade)
PI [%] Plasticity Index, described by the CML test method 1.3
PIw [%] Plasticity Index, weighted for the sample’s amount of material passing 0.425 mm, based on the CML test method 1.3
PMx Penetration Macadam, ‘x’ denoting the upper nominal particle size in mm
PSI Pavement Serviceability Index
RAP RAP RAP Resettlement Action Plan
RC x Rapid Curing (type of cutback bitumen), ‘x’ denotes the upper nominal viscosity limit
Sx Subgrade classifi cation, ‘x’ denoting minimum CBR value
SC x Slow Curing (type of cutback bitumen), ‘x’ denotes the upper nominal viscosity limit
SI International standardisation by International Organization for Standardization
SIA SIA SIA Social Impact Assessment
SL SL SL Shrinkage Limit
SP SP SP Shrinkage Product = [ LS x (%pass 0.425mm) ]
ST Surface Treatment, a general term for all types of sprayed bituminous seals
SSS Sodium Sulphate Soundness test
TFV kN Ten percent Fines Value, described by the CML test method 2.7
TFVdry kN As TFV. Used when dry test conditions need to be emphasised in the text
TFVsoaked kN As TFV. Ten percent Fines Value measured after 24 hours soak in water
TLCX [million E80] Traffi c load class, ‘x’ denoting maximum number (in million) of E80 in the class
TLCX -H [million E80] Traffi c Load Class, ‘x’ denoting maximum number (in million) of E80 in the class, ‘-H’ denoting that there is a large proportion of very heavy loads in the traffi c stream
TMH Technical Methods for Highways (South African series of standards)
UCS [MPa] Unconfi ned Compressive Strength, described by the CML tests 1.9 and 1.21 method for cement- or lime stabilised materials
VEF Vehicle Equivalency Factor

138
Field Testing Manual - 2003
TANROADS Central Materials Laboratory (CML)
Appendix 9: Worksheets
BORE LOG
TEST PIT LOG
FIELD DENSITY, Sand replacement method
FIELD DENSITY, Nuclear gauge metod
DCP
ROUGHNESS, MERLIN method
DEFLECTION, Benkelman Beam
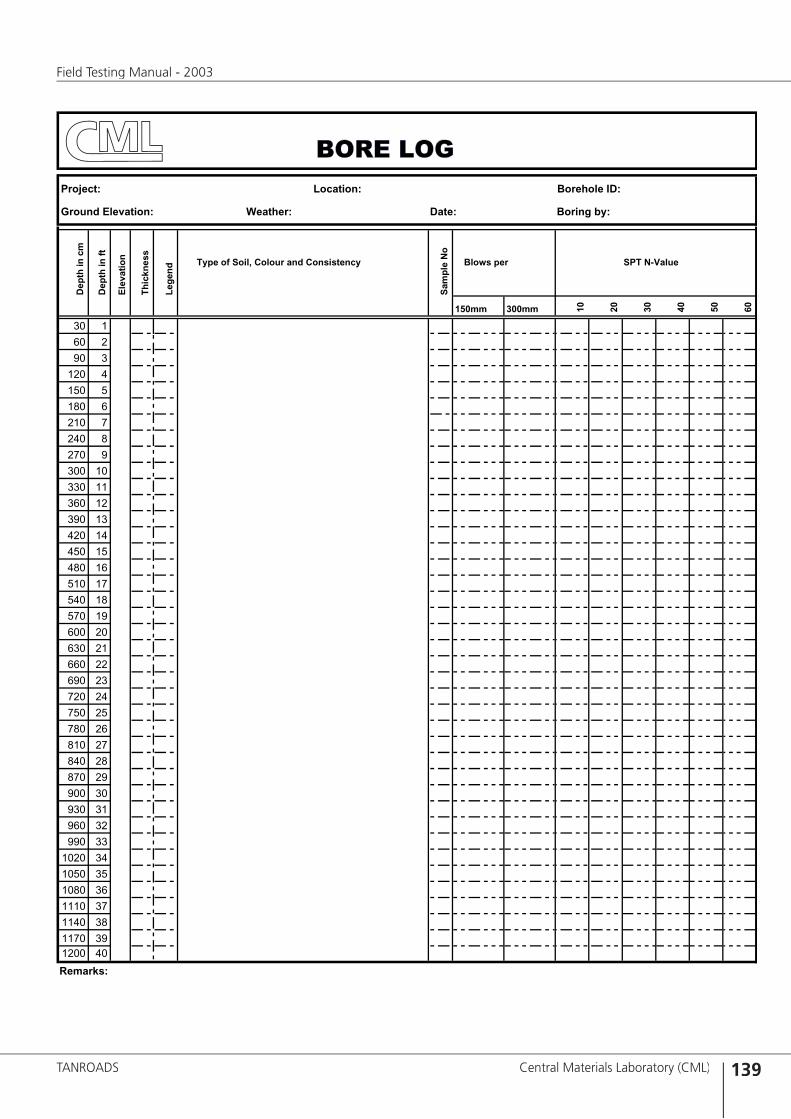
139
Field Testing Manual - 2003
TANROADS Central Materials Laboratory (CML)
BORE LOG�������� ��������� ������������
����������������� �������� ����� ����������
���
�����
���
���
�����
���
���������
������
���
���
��� �������������������������������������������
���
������
������������� �����������
����� ����� �� �� �� �� �� ��
�� �
�� �
�� �
��� �
��� �
��� �
��� �
��� �
��� �
��� ��
��� ��
��� ��
��� ��
��� ��
��� ��
��� ��
��� ��
��� ��
��� ��
��� ��
��� ��
��� ��
��� ��
��� ��
��� ��
��� ��
��� ��
��� ��
��� ��
��� ��
��� ��
��� ��
��� ��
���� ��
���� ��
���� ��
���� ��
���� ��
���� ������ ��
��������
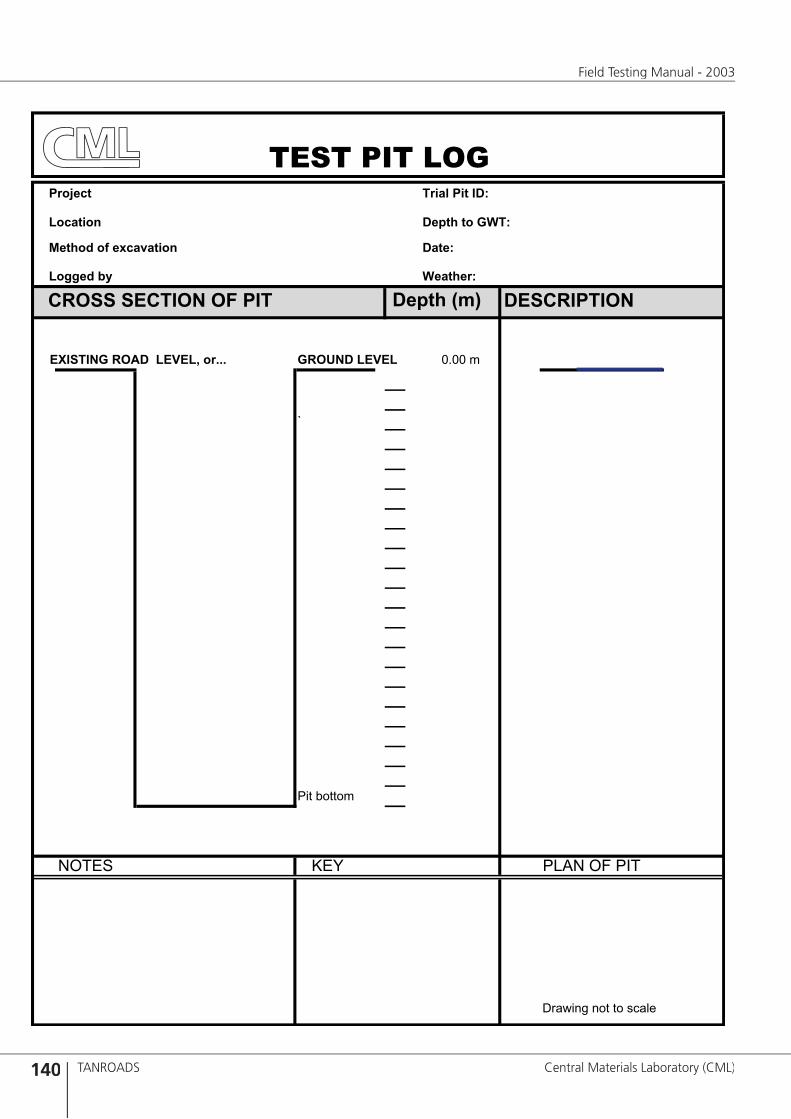
140
Field Testing Manual - 2003
TANROADS Central Materials Laboratory (CML)
������� �������������
�������� �������������
�������������������� �����
��������� ��������
�������������������� �����������
��������������������������� ������������ ������
�
����������
����� ��� �����������
��������������������
TEST PIT LOG
���������

141
Field Testing Manual - 2003
TANROADS Central Materials Laboratory (CML)
�������� �������
��������� ������������� �
���������� �����
��������������������
��������������������������
�������������������������������
����������������������������
���������������������������
������������������������
��������
�������������������
�����������
������������������������
�����������������������
����������������������
�����������������
�����������������
��������������������
���������������
�����������������������
�������������������
����������������������������������
�������������
�������������������������
�������������������������
��������������������
�����������������
����������
�������������������
�������������������
��������������������������
������������������������
���������������������
Sand replacement testFIELD DENSITY

142
Field Testing Manual - 2003
TANROADS Central Materials Laboratory (CML)
�������� �������
��������� ������������� �
���������� �����
Nuclear gauge methodFIELD DENSITY
Mod. AASHTOMDD/OMC
THICKNESSmm
CHAINAGEKm
TROXLER AverComp
WD DD %M %PRO AVER
AVERAGE:

143
Field Testing Manual - 2003
TANROADS Central Materials Laboratory (CML)
�������� ���������
��������� ������������� �
���������� �����
DCP
BLOW No. READING mm DN mm/BLOW BLOW No. READING mm DN mm/BLOW
0 (zero-reading)
Sign. Technician:...............................................................................

144
Field Testing Manual - 2003
TANROADS Central Materials Laboratory (CML)
�������� �����������������
���������� �����������
���������� �����
Tally box
1 2 3 4 5 6 7 8 9 10
1
2
3
4
5
6
7
8
9
10
11
12
13
14
15
16
17
18
19
20
Roughness measurmentsMERLIN

145
Field Testing Manual - 2003
TANROADS Central Materials Laboratory (CML)
�������� �����������������
���������� �����������
���������� �����
Chainage
Defl ection reading, x 10-2
Inside wheeltrack Outside wheeltrack
Initialreading
Max.reading
Finalreading
Defl .mm -2
Initialreading
Max.reading
Finalreading
Defl .mm-2
DEFLECTIONBenkelman Beam

THE UNITED REPUBLIC TANZANIAMINISTRY WORKS
Field Testing Manual - 2003 - M
inistry of Works TAN
RO
ADS, Tanzania
April 2003ISBN 9987-8891-4-X ������