domestic health hazard and indoor air-pollution: an
TRANSCRIPT
University of New MexicoUNM Digital Repository
Himalayan Research Papers Archive Nepal Study Center
9-21-2007
Domestic Health Hazard and Indoor Air-Pollution:An Approach to Find Alternative Energy Source forRural Bangladesh to Minimize the ThreatReazul S.M. Ahsan
Jinia Afrin
Follow this and additional works at: https://digitalrepository.unm.edu/nsc_research
This Article is brought to you for free and open access by the Nepal Study Center at UNM Digital Repository. It has been accepted for inclusion inHimalayan Research Papers Archive by an authorized administrator of UNM Digital Repository. For more information, please contact [email protected].
Recommended CitationAhsan, Reazul S.M. and Jinia Afrin. "Domestic Health Hazard and Indoor Air-Pollution: An Approach to Find Alternative EnergySource for Rural Bangladesh to Minimize the Threat." (2007). https://digitalrepository.unm.edu/nsc_research/10
Domestic Health Hazard and Indoor Air-Pollution: An Approach to Find
Alternative Energy Source for Rural Bangladesh to Minimize the Threat
S. M. Reazul Ahsan
Lecturer
Urban and Rural Planning Discipline
Khulna University
Khulna Bangladesh.
E-mail: [email protected]
and
Jinia Afrin
BSC Urban and Rural Planning
Khulna University, Bangladesh
E-mail: [email protected]
Abstarct:
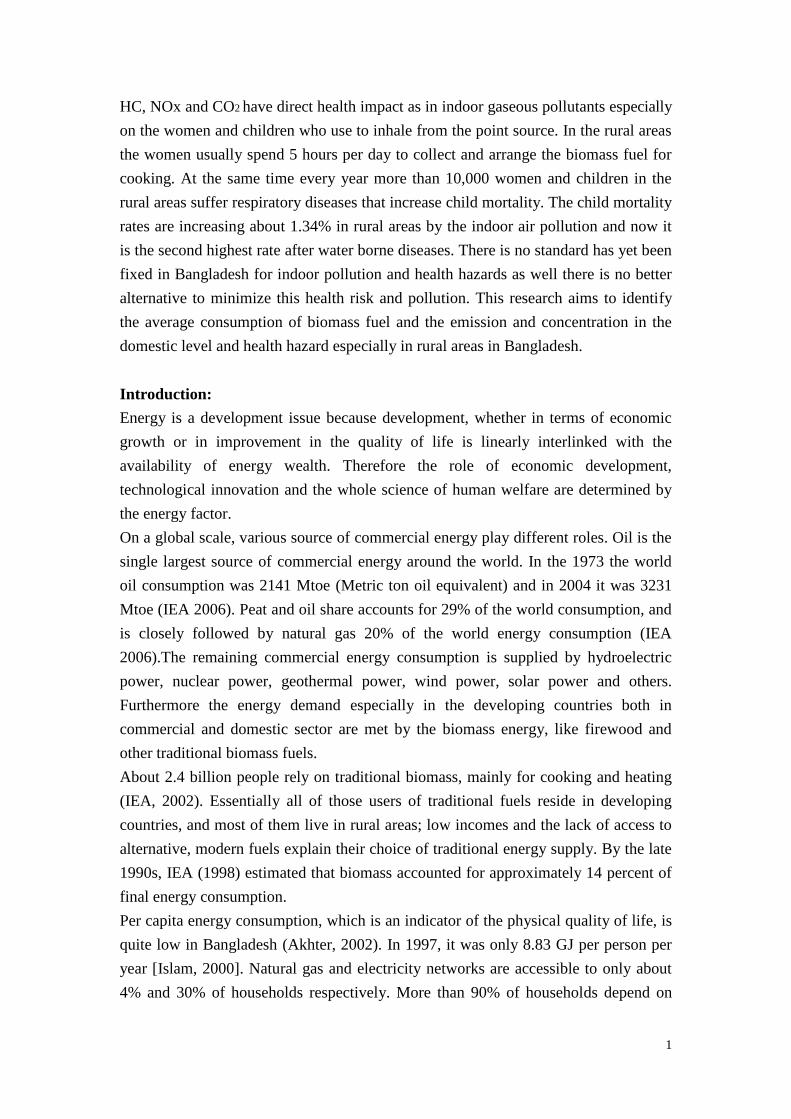
Indoor air pollution and health hazards for women and child especially in the
developing countries have been overlooked for decades. It happened because there
was no specific indoor pollution standard and alternative energy solution to minimize
the indoor gaseous emissions at the domestic end-use level of energy. Traditional
biomass fuel is one of the major sources of energy in the developing countries. About
2.4 billion people rely on traditional biomass, mainly for cooking and heating as they
have limited access to better alternative energy sources like Natural Gas or Electricity.
In Bangladesh per capita energy consumption is only 8.83 GJ by the year 2000 and
4% of this energy was served by electricity, 30% by natural gas and rest is from
biomass. The biomass fuels are mostly used in the rural areas where the supplies of
commercial fuels are very low. Biomass fuels are usually collected from the forests,
agricultural residues and the solid form of cow dung. Rapid increase of biomass fuels
consumption in the rural areas through indigenous technology causes deforestation
and vast amounts of human effort being diverted to fuel collection, besides worsening
indoor environment by emitting hazardous pollutants. About 90% people in the rural
Bangladesh, use traditional mud made stoves for cooking and other heating purpose.
Those mud stoves act as a point source for continuous hydrocarbon pollution. Burning
biomass in the traditional cook stoves produce number of other air pollutants
including suspended particulate matters, carbon monoxide, and carcinogenic organic
compounds in an order of higher magnitude because incomplete combustion and less
efficient combustion chamber use. The most hazardous pollutant that emits from
biomass fuel is Hydro Carbon (HC). Other secondary pollutants are NOx and CO2.
1
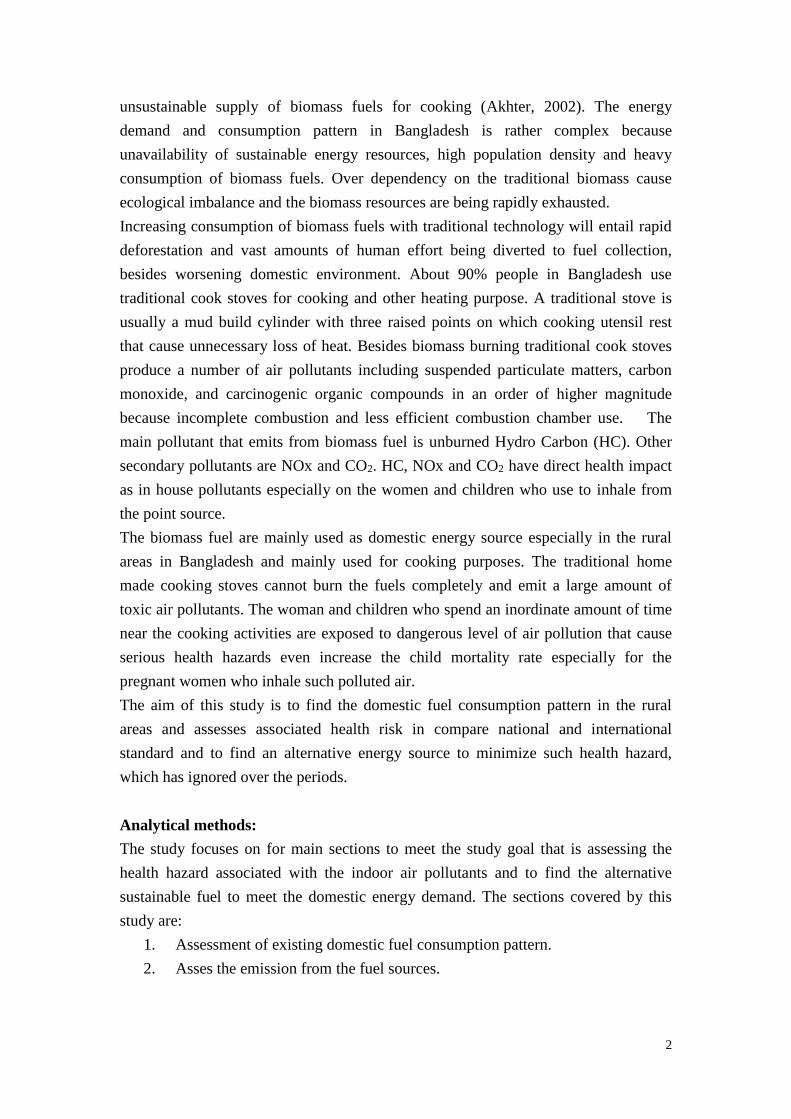
HC, NOx and CO2 have direct health impact as in indoor gaseous pollutants especially
on the women and children who use to inhale from the point source. In the rural areas
the women usually spend 5 hours per day to collect and arrange the biomass fuel for
cooking. At the same time every year more than 10,000 women and children in the
rural areas suffer respiratory diseases that increase child mortality. The child mortality
rates are increasing about 1.34% in rural areas by the indoor air pollution and now it
is the second highest rate after water borne diseases. There is no standard has yet been
fixed in Bangladesh for indoor pollution and health hazards as well there is no better
alternative to minimize this health risk and pollution. This research aims to identify
the average consumption of biomass fuel and the emission and concentration in the
domestic level and health hazard especially in rural areas in Bangladesh.
Introduction:
Energy is a development issue because development, whether in terms of economic
growth or in improvement in the quality of life is linearly interlinked with the
availability of energy wealth. Therefore the role of economic development,
technological innovation and the whole science of human welfare are determined by
the energy factor.
On a global scale, various source of commercial energy play different roles. Oil is the
single largest source of commercial energy around the world. In the 1973 the world
oil consumption was 2141 Mtoe (Metric ton oil equivalent) and in 2004 it was 3231
Mtoe (IEA 2006). Peat and oil share accounts for 29% of the world consumption, and
is closely followed by natural gas 20% of the world energy consumption (IEA
2006).The remaining commercial energy consumption is supplied by hydroelectric
power, nuclear power, geothermal power, wind power, solar power and others.
Furthermore the energy demand especially in the developing countries both in
commercial and domestic sector are met by the biomass energy, like firewood and
other traditional biomass fuels.
About 2.4 billion people rely on traditional biomass, mainly for cooking and heating
(IEA, 2002). Essentially all of those users of traditional fuels reside in developing
countries, and most of them live in rural areas; low incomes and the lack of access to
alternative, modern fuels explain their choice of traditional energy supply. By the late
1990s, IEA (1998) estimated that biomass accounted for approximately 14 percent of
final energy consumption.
Per capita energy consumption, which is an indicator of the physical quality of life, is
quite low in Bangladesh (Akhter, 2002). In 1997, it was only 8.83 GJ per person per
year [Islam, 2000]. Natural gas and electricity networks are accessible to only about
4% and 30% of households respectively. More than 90% of households depend on
2
unsustainable supply of biomass fuels for cooking (Akhter, 2002). The energy
demand and consumption pattern in Bangladesh is rather complex because
unavailability of sustainable energy resources, high population density and heavy
consumption of biomass fuels. Over dependency on the traditional biomass cause
ecological imbalance and the biomass resources are being rapidly exhausted.
Increasing consumption of biomass fuels with traditional technology will entail rapid
deforestation and vast amounts of human effort being diverted to fuel collection,
besides worsening domestic environment. About 90% people in Bangladesh use
traditional cook stoves for cooking and other heating purpose. A traditional stove is
usually a mud build cylinder with three raised points on which cooking utensil rest
that cause unnecessary loss of heat. Besides biomass burning traditional cook stoves
produce a number of air pollutants including suspended particulate matters, carbon
monoxide, and carcinogenic organic compounds in an order of higher magnitude
because incomplete combustion and less efficient combustion chamber use. The
main pollutant that emits from biomass fuel is unburned Hydro Carbon (HC). Other
secondary pollutants are NOx and CO2. HC, NOx and CO2 have direct health impact
as in house pollutants especially on the women and children who use to inhale from
the point source.
The biomass fuel are mainly used as domestic energy source especially in the rural
areas in Bangladesh and mainly used for cooking purposes. The traditional home
made cooking stoves cannot burn the fuels completely and emit a large amount of
toxic air pollutants. The woman and children who spend an inordinate amount of time
near the cooking activities are exposed to dangerous level of air pollution that cause
serious health hazards even increase the child mortality rate especially for the
pregnant women who inhale such polluted air.
The aim of this study is to find the domestic fuel consumption pattern in the rural
areas and assesses associated health risk in compare national and international
standard and to find an alternative energy source to minimize such health hazard,
which has ignored over the periods.
Analytical methods:
The study focuses on for main sections to meet the study goal that is assessing the
health hazard associated with the indoor air pollutants and to find the alternative
sustainable fuel to meet the domestic energy demand. The sections covered by this
study are:
1. Assessment of existing domestic fuel consumption pattern.
2. Asses the emission from the fuel sources.
3
3. Health risk assessment according WHO and DoE (Department of
Environment) standard.
4. Asses the least cost alternatives for domestic fuel.
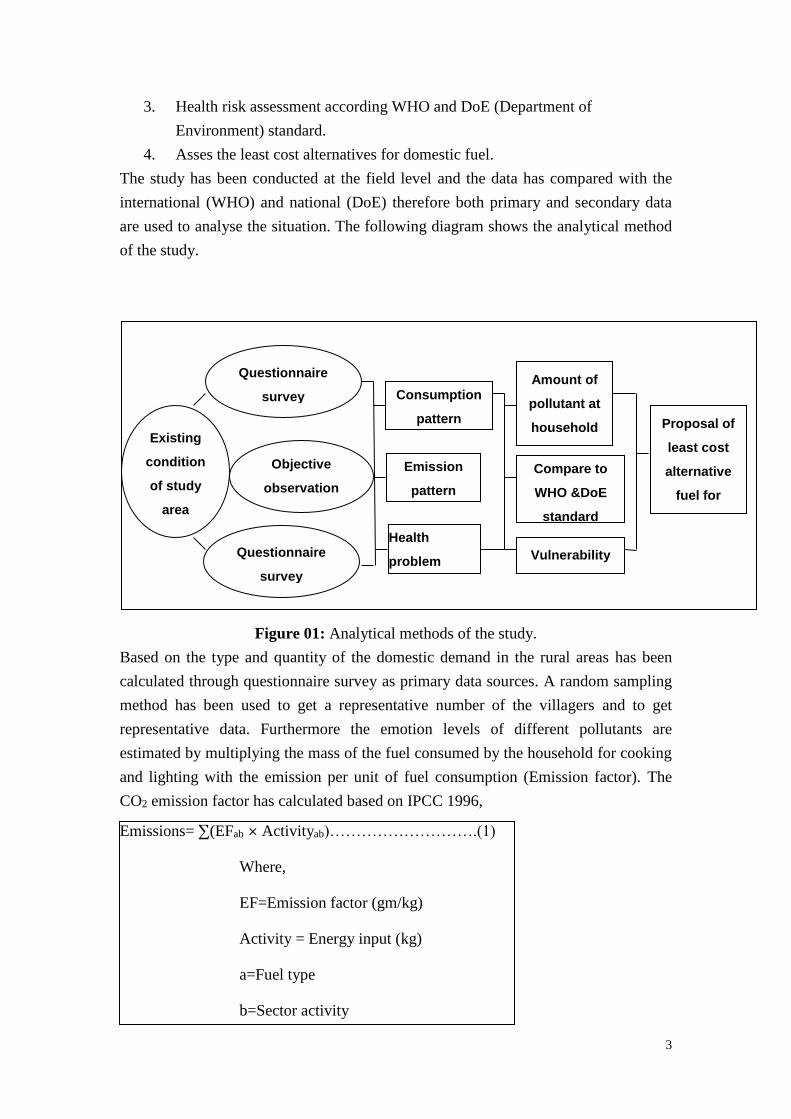
The study has been conducted at the field level and the data has compared with the
international (WHO) and national (DoE) therefore both primary and secondary data
are used to analyse the situation. The following diagram shows the analytical method
of the study.
Figure 01: Analytical methods of the study.
Based on the type and quantity of the domestic demand in the rural areas has been
calculated through questionnaire survey as primary data sources. A random sampling
method has been used to get a representative number of the villagers and to get
representative data. Furthermore the emotion levels of different pollutants are
estimated by multiplying the mass of the fuel consumed by the household for cooking
and lighting with the emission per unit of fuel consumption (Emission factor). The
CO2 emission factor has calculated based on IPCC 1996,
Emissions= ∑(EFab × Activityab)……………………….(1)
Where,
EF=Emission factor (gm/kg)
Activity = Energy input (kg)
a=Fuel type
b=Sector activity
Existing
condition
of study
area
Objective
observation
Questionnaire
survey Consumption
pattern
Emission
pattern
Health
problem
Compare to
WHO &DoE
standard
Vulnerability
Amount of
pollutant at
household
level
Proposal of
least cost
alternative
fuel for
domestic
use Questionnaire
survey
4
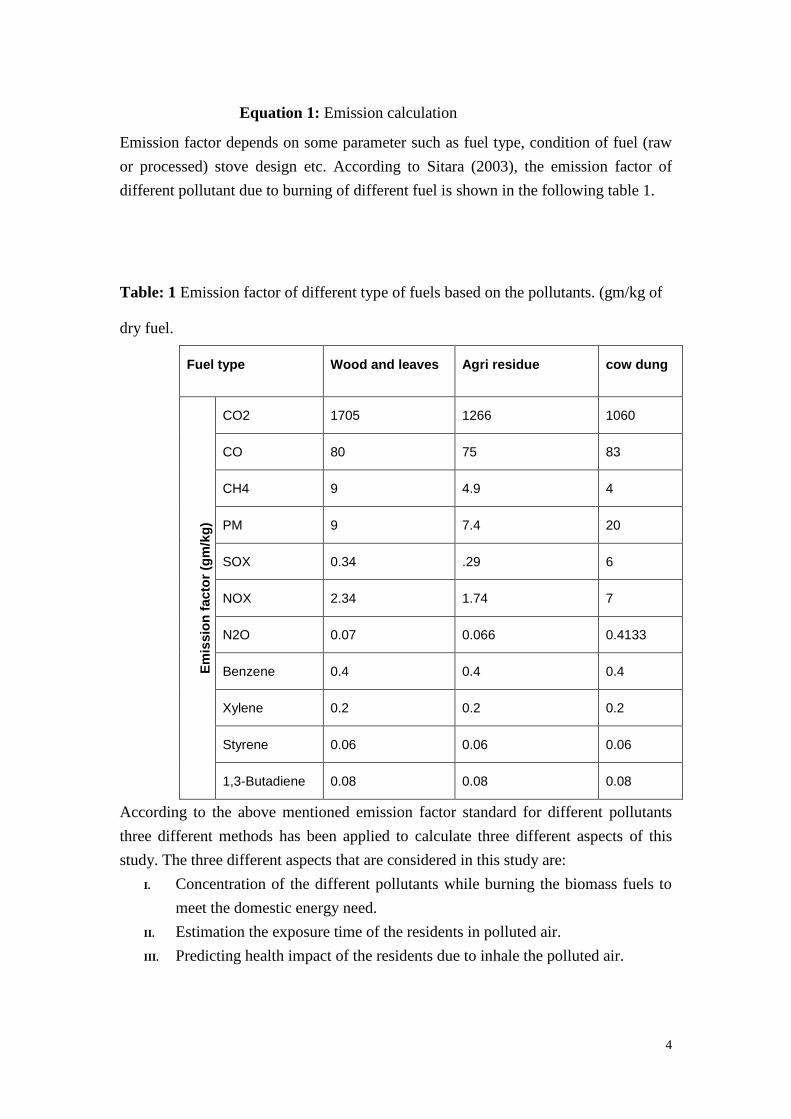
Equation 1: Emission calculation
Emission factor depends on some parameter such as fuel type, condition of fuel (raw
or processed) stove design etc. According to Sitara (2003), the emission factor of
different pollutant due to burning of different fuel is shown in the following table 1.
Table: 1 Emission factor of different type of fuels based on the pollutants. (gm/kg of
dry fuel.
Fuel type Wood and leaves Agri residue cow dung
Em
issio
n f
acto
r (g
m/k
g)
CO2 1705 1266 1060
CO 80 75 83
CH4 9 4.9 4
PM 9 7.4 20
SOX 0.34 .29 6
NOX 2.34 1.74 7
N2O 0.07 0.066 0.4133
Benzene 0.4 0.4 0.4
Xylene 0.2 0.2 0.2
Styrene 0.06 0.06 0.06
1,3-Butadiene 0.08 0.08 0.08
According to the above mentioned emission factor standard for different pollutants
three different methods has been applied to calculate three different aspects of this
study. The three different aspects that are considered in this study are:
I. Concentration of the different pollutants while burning the biomass fuels to
meet the domestic energy need.
II. Estimation the exposure time of the residents in polluted air.
III. Predicting health impact of the residents due to inhale the polluted air.
5
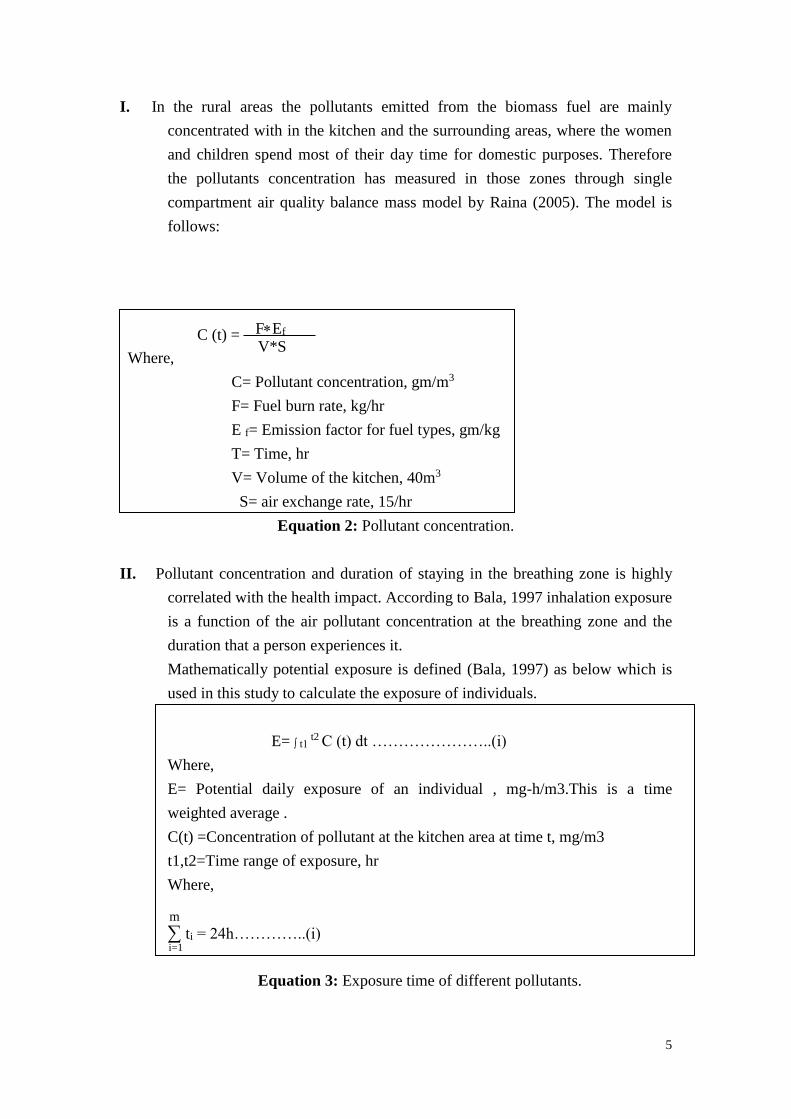
I. In the rural areas the pollutants emitted from the biomass fuel are mainly
concentrated with in the kitchen and the surrounding areas, where the women
and children spend most of their day time for domestic purposes. Therefore
the pollutants concentration has measured in those zones through single
compartment air quality balance mass model by Raina (2005). The model is
follows:
FEf
Where,
C= Pollutant concentration, gm/m3
F= Fuel burn rate, kg/hr
E f= Emission factor for fuel types, gm/kg
T= Time, hr
V= Volume of the kitchen, 40m3
S= air exchange rate, 15/hr
Equation 2: Pollutant concentration.
II. Pollutant concentration and duration of staying in the breathing zone is highly
correlated with the health impact. According to Bala, 1997 inhalation exposure
is a function of the air pollutant concentration at the breathing zone and the
duration that a person experiences it.
Mathematically potential exposure is defined (Bala, 1997) as below which is
used in this study to calculate the exposure of individuals.
E= ∫ t1 t2 C (t) dt …………………..(i)
Where,
E= Potential daily exposure of an individual , mg-h/m3.This is a time
weighted average .
C(t) =Concentration of pollutant at the kitchen area at time t, mg/m3
t1,t2=Time range of exposure, hr
Where,
∑ ti = 24h…………..(i)
Equation 3: Exposure time of different pollutants.
C (t) = V*S
m
i=1
6
Mainly the rural women are highly exposed to the air pollutants as they spend
a big share of their day time in kitchen to prepare three meals per day using
traditional biomass fuels.
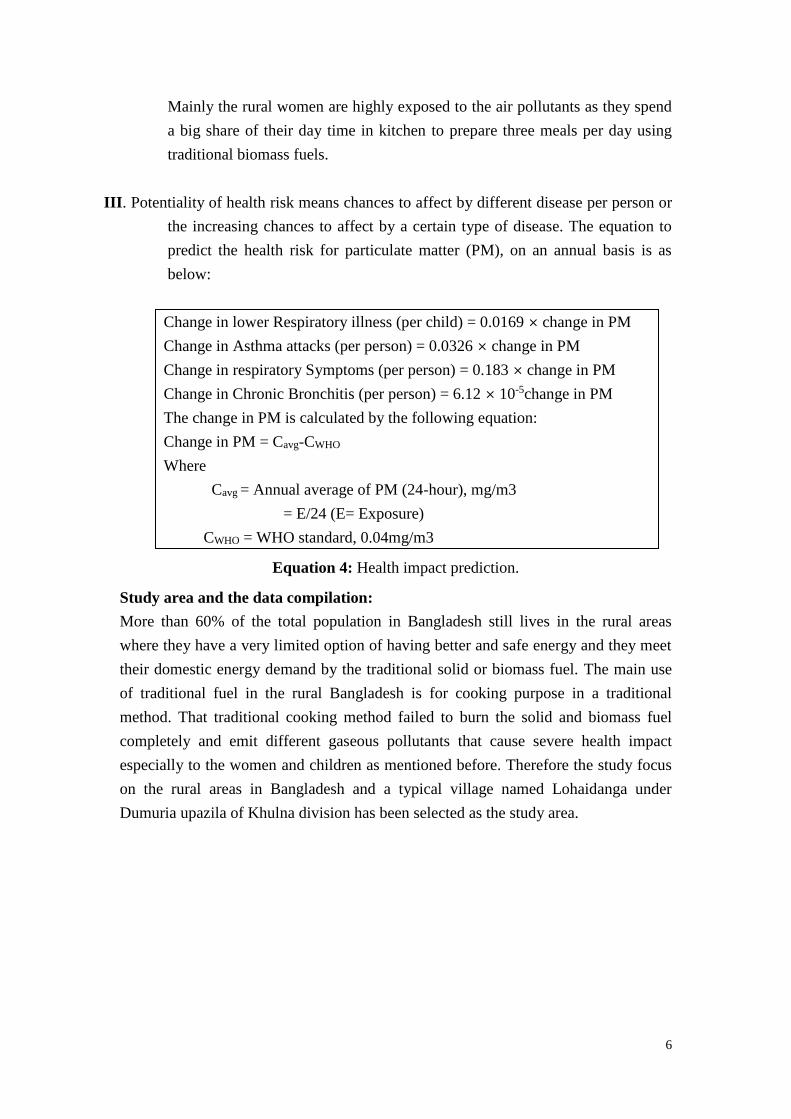
III. Potentiality of health risk means chances to affect by different disease per person or
the increasing chances to affect by a certain type of disease. The equation to
predict the health risk for particulate matter (PM), on an annual basis is as
below:
Change in lower Respiratory illness (per child) = 0.0169 × change in PM
Change in Asthma attacks (per person) = 0.0326 × change in PM
Change in respiratory Symptoms (per person) = 0.183 × change in PM
Change in Chronic Bronchitis (per person) = 6.12 × 10⁻⁵change in PM
The change in PM is calculated by the following equation:
Change in PM = Cavg-CWHO
Where
Cavg = Annual average of PM (24-hour), mg/m3
= E/24 (E= Exposure)
CWHO = WHO standard, 0.04mg/m3
Equation 4: Health impact prediction.
Study area and the data compilation:
More than 60% of the total population in Bangladesh still lives in the rural areas
where they have a very limited option of having better and safe energy and they meet
their domestic energy demand by the traditional solid or biomass fuel. The main use
of traditional fuel in the rural Bangladesh is for cooking purpose in a traditional
method. That traditional cooking method failed to burn the solid and biomass fuel
completely and emit different gaseous pollutants that cause severe health impact
especially to the women and children as mentioned before. Therefore the study focus
on the rural areas in Bangladesh and a typical village named Lohaidanga under
Dumuria upazila of Khulna division has been selected as the study area.
7
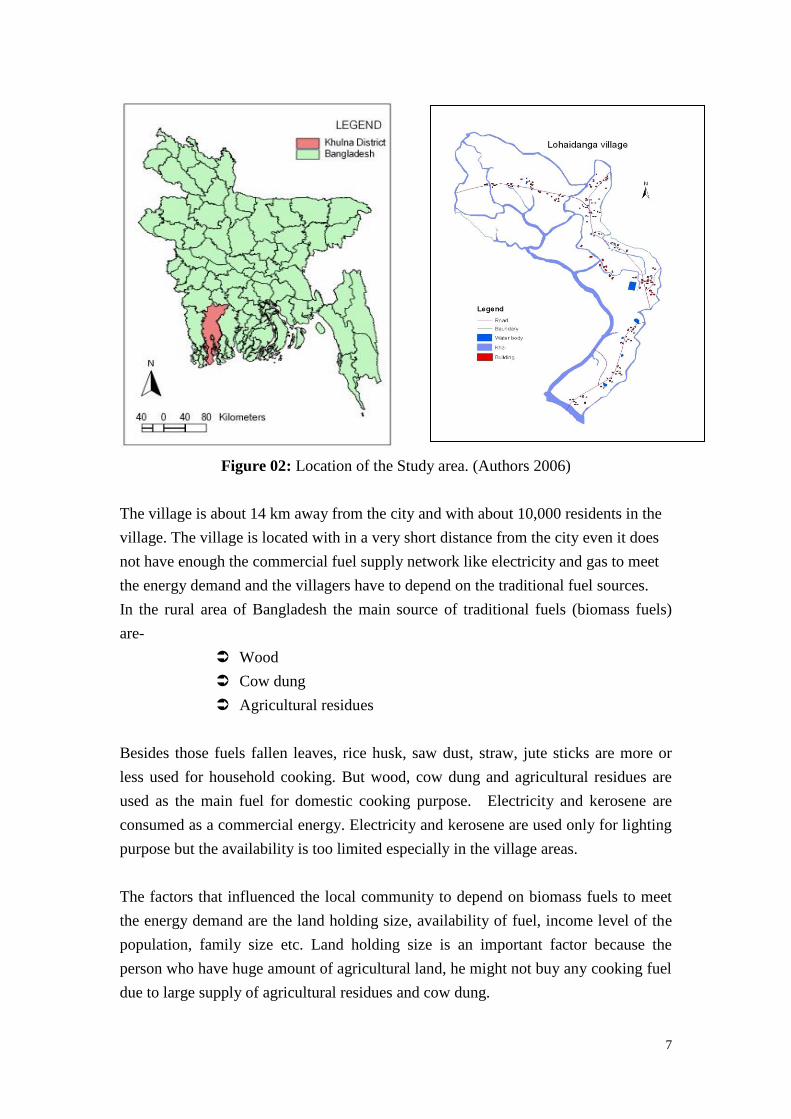
Figure 02: Location of the Study area. (Authors 2006)
The village is about 14 km away from the city and with about 10,000 residents in the
village. The village is located with in a very short distance from the city even it does
not have enough the commercial fuel supply network like electricity and gas to meet
the energy demand and the villagers have to depend on the traditional fuel sources.
In the rural area of Bangladesh the main source of traditional fuels (biomass fuels)
are-
Wood
Cow dung
Agricultural residues
Besides those fuels fallen leaves, rice husk, saw dust, straw, jute sticks are more or
less used for household cooking. But wood, cow dung and agricultural residues are
used as the main fuel for domestic cooking purpose. Electricity and kerosene are
consumed as a commercial energy. Electricity and kerosene are used only for lighting
purpose but the availability is too limited especially in the village areas.
The factors that influenced the local community to depend on biomass fuels to meet
the energy demand are the land holding size, availability of fuel, income level of the
population, family size etc. Land holding size is an important factor because the
person who have huge amount of agricultural land, he might not buy any cooking fuel
due to large supply of agricultural residues and cow dung.
8
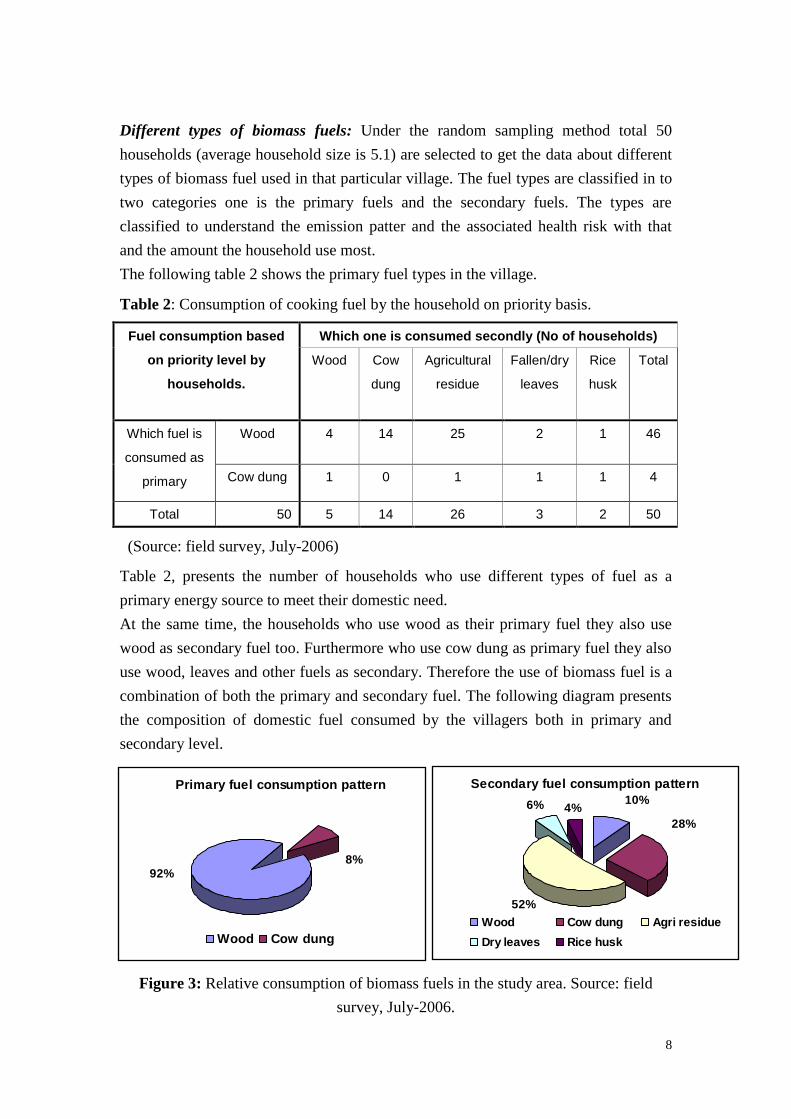
Different types of biomass fuels: Under the random sampling method total 50
households (average household size is 5.1) are selected to get the data about different
types of biomass fuel used in that particular village. The fuel types are classified in to
two categories one is the primary fuels and the secondary fuels. The types are
classified to understand the emission patter and the associated health risk with that
and the amount the household use most.
The following table 2 shows the primary fuel types in the village.
Table 2: Consumption of cooking fuel by the household on priority basis.
Fuel consumption based
on priority level by
households.
Which one is consumed secondly (No of households)
Wood Cow
dung
Agricultural
residue
Fallen/dry
leaves
Rice
husk
Total
Which fuel is
consumed as
primary
Wood 4 14 25 2 1 46
Cow dung 1 0 1 1 1 4
Total 50 5 14 26 3 2 50
(Source: field survey, July-2006)
Table 2, presents the number of households who use different types of fuel as a
primary energy source to meet their domestic need.
At the same time, the households who use wood as their primary fuel they also use
wood as secondary fuel too. Furthermore who use cow dung as primary fuel they also
use wood, leaves and other fuels as secondary. Therefore the use of biomass fuel is a
combination of both the primary and secondary fuel. The following diagram presents
the composition of domestic fuel consumed by the villagers both in primary and
secondary level.
Figure 3: Relative consumption of biomass fuels in the study area. Source: field
survey, July-2006.
Primary fuel consumption pattern
8%92%
Wood Cow dung
Secondary fuel consumption pattern
52%
6% 4%
28%
10%
Wood Cow dung Agri residue
Dry leaves Rice husk
9
According to the above figure most of the villagers use wood as their main fuel source
to meet the domestic energy need, cow dung and agricultural residues are in second
choice to meet their demand. Therefore these figures conclude that the use of biomass
fuel types is related with the land holding size of the households.
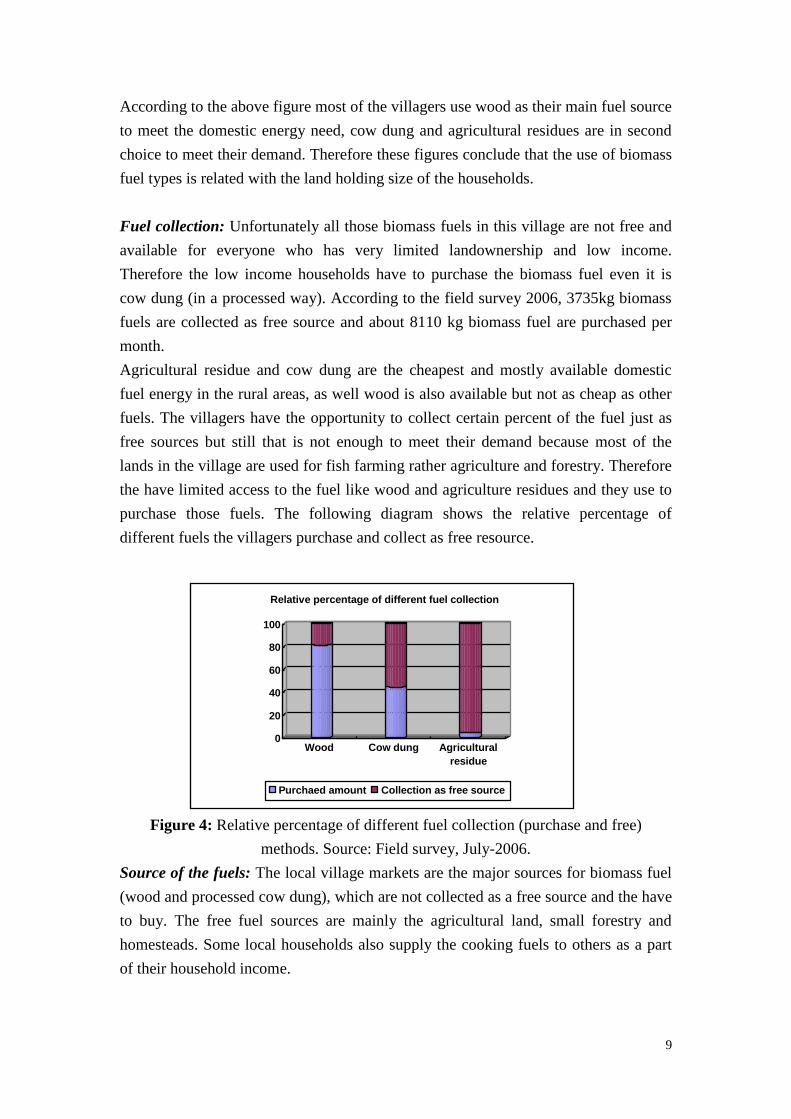
Fuel collection: Unfortunately all those biomass fuels in this village are not free and
available for everyone who has very limited landownership and low income.
Therefore the low income households have to purchase the biomass fuel even it is
cow dung (in a processed way). According to the field survey 2006, 3735kg biomass
fuels are collected as free source and about 8110 kg biomass fuel are purchased per
month.
Agricultural residue and cow dung are the cheapest and mostly available domestic
fuel energy in the rural areas, as well wood is also available but not as cheap as other
fuels. The villagers have the opportunity to collect certain percent of the fuel just as
free sources but still that is not enough to meet their demand because most of the
lands in the village are used for fish farming rather agriculture and forestry. Therefore
the have limited access to the fuel like wood and agriculture residues and they use to
purchase those fuels. The following diagram shows the relative percentage of
different fuels the villagers purchase and collect as free resource.
Figure 4: Relative percentage of different fuel collection (purchase and free)
methods. Source: Field survey, July-2006.
Source of the fuels: The local village markets are the major sources for biomass fuel
(wood and processed cow dung), which are not collected as a free source and the have
to buy. The free fuel sources are mainly the agricultural land, small forestry and
homesteads. Some local households also supply the cooking fuels to others as a part
of their household income.
0
20
40
60
80
100
Wood Cow dung Agricultural
residue
Relative percentage of different fuel collection
Purchaed amount Collection as free source
10
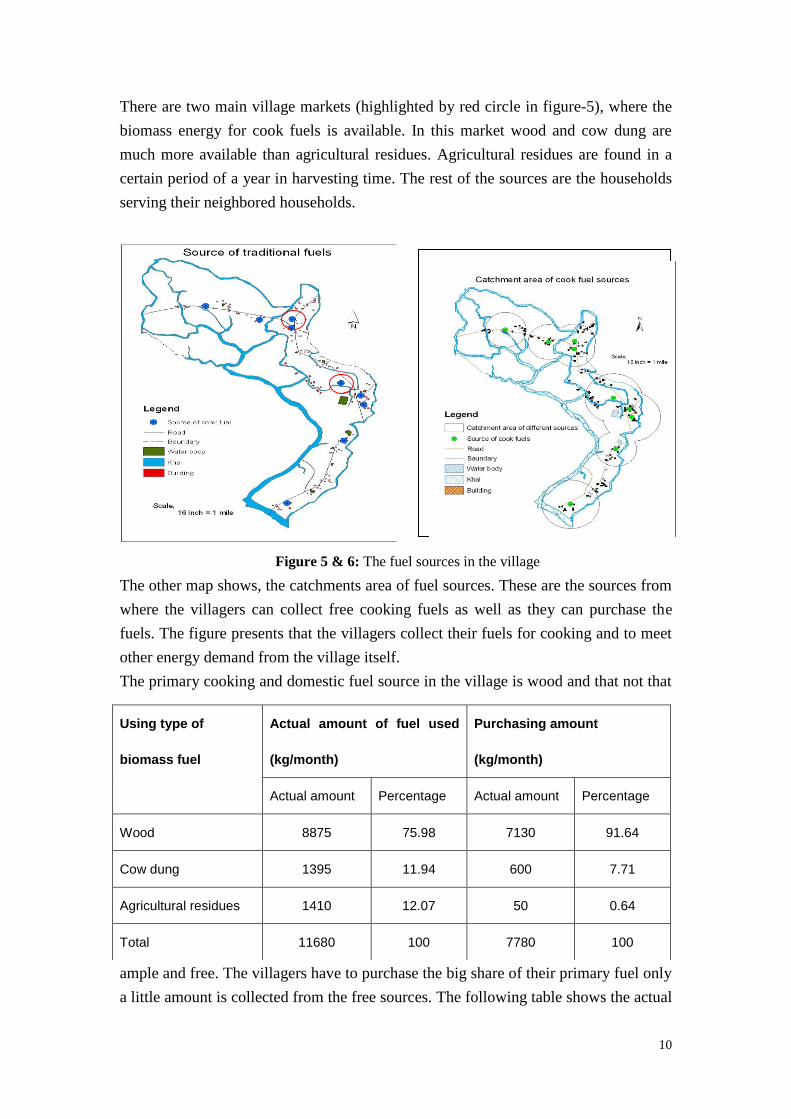
There are two main village markets (highlighted by red circle in figure-5), where the
biomass energy for cook fuels is available. In this market wood and cow dung are
much more available than agricultural residues. Agricultural residues are found in a
certain period of a year in harvesting time. The rest of the sources are the households
serving their neighbored households.
The other map shows, the catchments area of fuel sources. These are the sources from
where the villagers can collect free cooking fuels as well as they can purchase the
fuels. The figure presents that the villagers collect their fuels for cooking and to meet
other energy demand from the village itself.
The primary cooking and domestic fuel source in the village is wood and that not that
ample and free. The villagers have to purchase the big share of their primary fuel only
a little amount is collected from the free sources. The following table shows the actual
Using type of
biomass fuel
Actual amount of fuel used
(kg/month)
Purchasing amount
(kg/month)
Actual amount Percentage Actual amount Percentage
Wood 8875 75.98 7130 91.64
Cow dung 1395 11.94 600 7.71
Agricultural residues 1410 12.07 50 0.64
Total 11680 100 7780 100
Figure 5 & 6: The fuel sources in the village
11
0
50
100
150
200
250
300
350
2 3 4 5 6 7 8 9
Family member (Person)
Month
ly f
uel
consu
mption
in k
g
Wood
Cow dung
Agricultural
residues
amount of biomass fuel consumed by the villagers and the share they have to
purchase.
Table 3: Total consumption of biomass fuel and the expenditure in this purpose.
Source: field survey, July 2006.
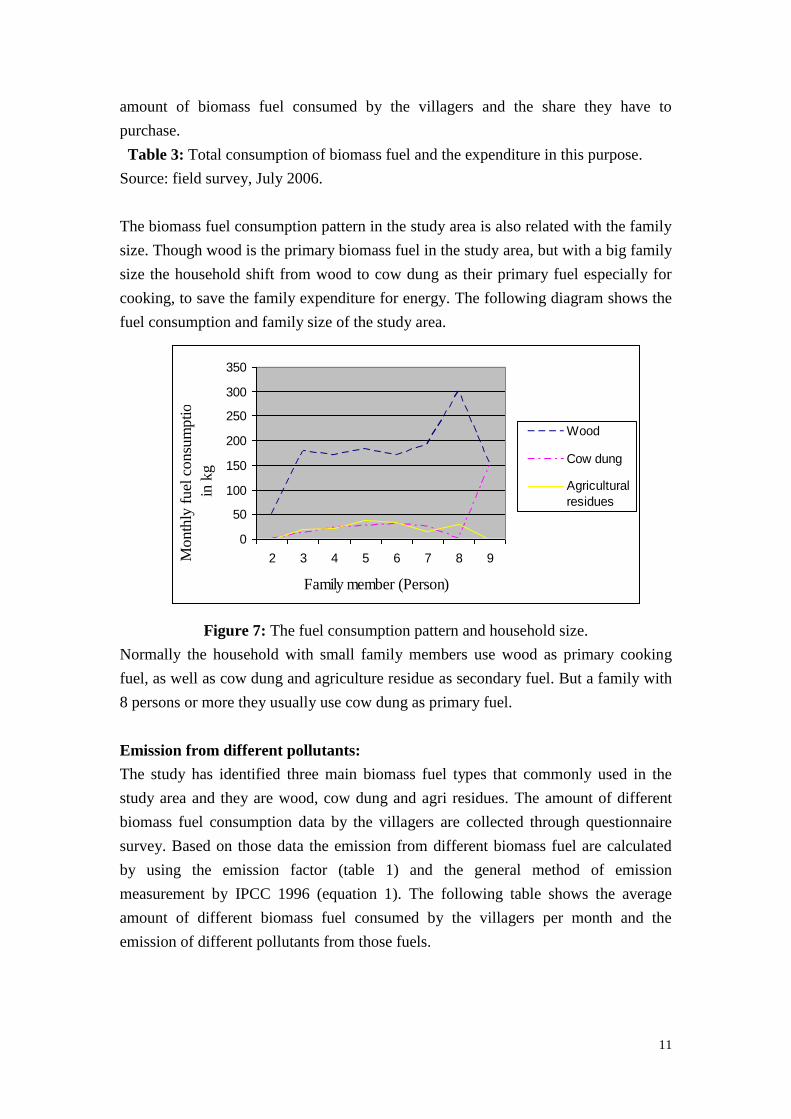
The biomass fuel consumption pattern in the study area is also related with the family
size. Though wood is the primary biomass fuel in the study area, but with a big family
size the household shift from wood to cow dung as their primary fuel especially for
cooking, to save the family expenditure for energy. The following diagram shows the
fuel consumption and family size of the study area.
Figure 7: The fuel consumption pattern and household size.
Normally the household with small family members use wood as primary cooking
fuel, as well as cow dung and agriculture residue as secondary fuel. But a family with
8 persons or more they usually use cow dung as primary fuel.
Emission from different pollutants:
The study has identified three main biomass fuel types that commonly used in the
study area and they are wood, cow dung and agri residues. The amount of different
biomass fuel consumption data by the villagers are collected through questionnaire
survey. Based on those data the emission from different biomass fuel are calculated
by using the emission factor (table 1) and the general method of emission
measurement by IPCC 1996 (equation 1). The following table shows the average
amount of different biomass fuel consumed by the villagers per month and the
emission of different pollutants from those fuels.
12
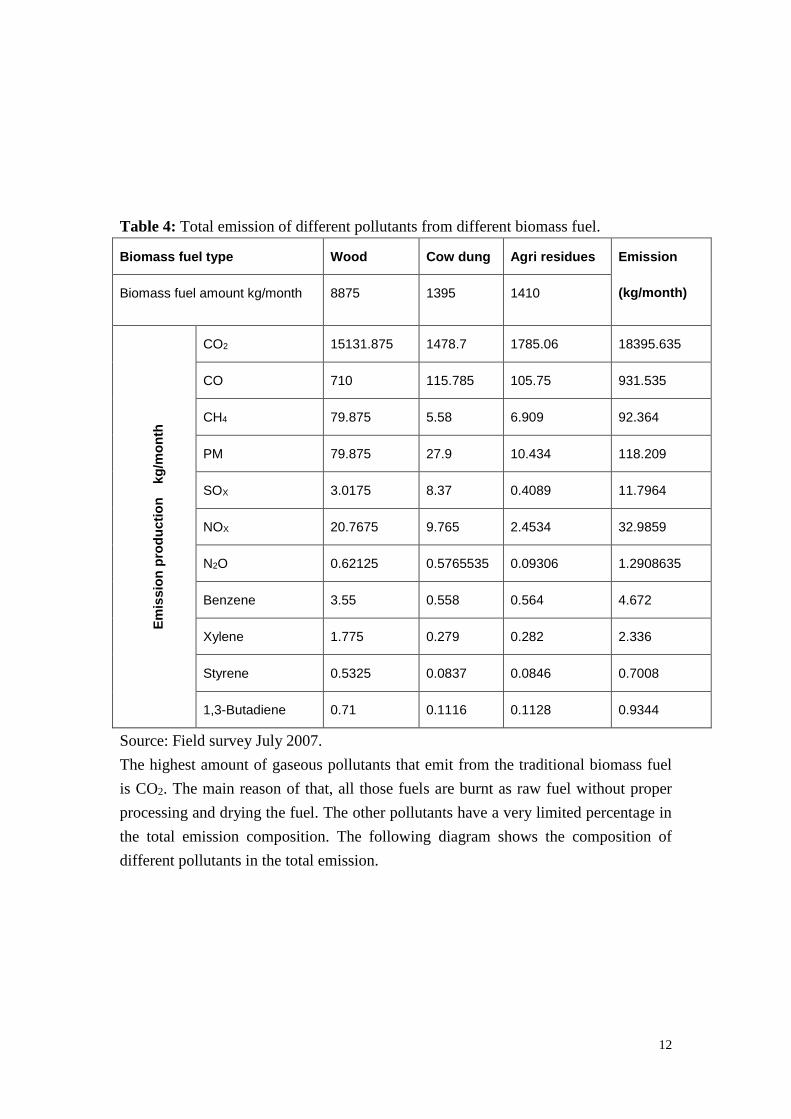
Table 4: Total emission of different pollutants from different biomass fuel.
Biomass fuel type Wood Cow dung Agri residues Emission
(kg/month) Biomass fuel amount kg/month 8875 1395 1410
Em
issio
n p
rod
ucti
on
kg
/mo
nth
CO2 15131.875 1478.7 1785.06 18395.635
CO 710 115.785 105.75 931.535
CH4 79.875 5.58 6.909 92.364
PM 79.875 27.9 10.434 118.209
SOX 3.0175 8.37 0.4089 11.7964
NOX 20.7675 9.765 2.4534 32.9859
N2O 0.62125 0.5765535 0.09306 1.2908635
Benzene 3.55 0.558 0.564 4.672
Xylene 1.775 0.279 0.282 2.336
Styrene 0.5325 0.0837 0.0846 0.7008
1,3-Butadiene 0.71 0.1116 0.1128 0.9344
Source: Field survey July 2007.
The highest amount of gaseous pollutants that emit from the traditional biomass fuel
is CO2. The main reason of that, all those fuels are burnt as raw fuel without proper
processing and drying the fuel. The other pollutants have a very limited percentage in
the total emission composition. The following diagram shows the composition of
different pollutants in the total emission.

13
Figure 8: Composition of different pollutants.
In the total pollutants composition about 94% pollutants are CO2 rest of the 6%
pollutants cover all other pollutants. According to the field study the main health risk
associated with CO2 emission from the biomass fuel and that mainly affect the women
and children in the village. The health risk also associated with the concentration of
indoor pollution and the exposure time.
Indoor pollutants concentration:
The combustion of domestic cook fuel in traditional stove release smoke, which
contain a complex and unstable mixture of huge pollutants with different chemicals.
The indoor concentration of those gaseous pollutants is highly hazardous for human
health. Therefore this study also measured the concentration of all those gaseous
pollutants by using the pollutant concentration model (equation 2).
The domestic health hazard in the village area is highly related with the pollutant
concentration level. The villagers use the biomass fuel three times per day to cook
their meal and most of those fuels are not processed well and increase the level of
pollutants concentration. The total concentration of different pollutants at the
household level have been calculated and shown in the figure below by using
different color for different concentration.
Percentage of emission of different types of
pollutantCO2
CO
CH4
PM
Sox
Nox
N2O
Benzene
Xylene
Styrene
1,3-Butadiene
94%
14
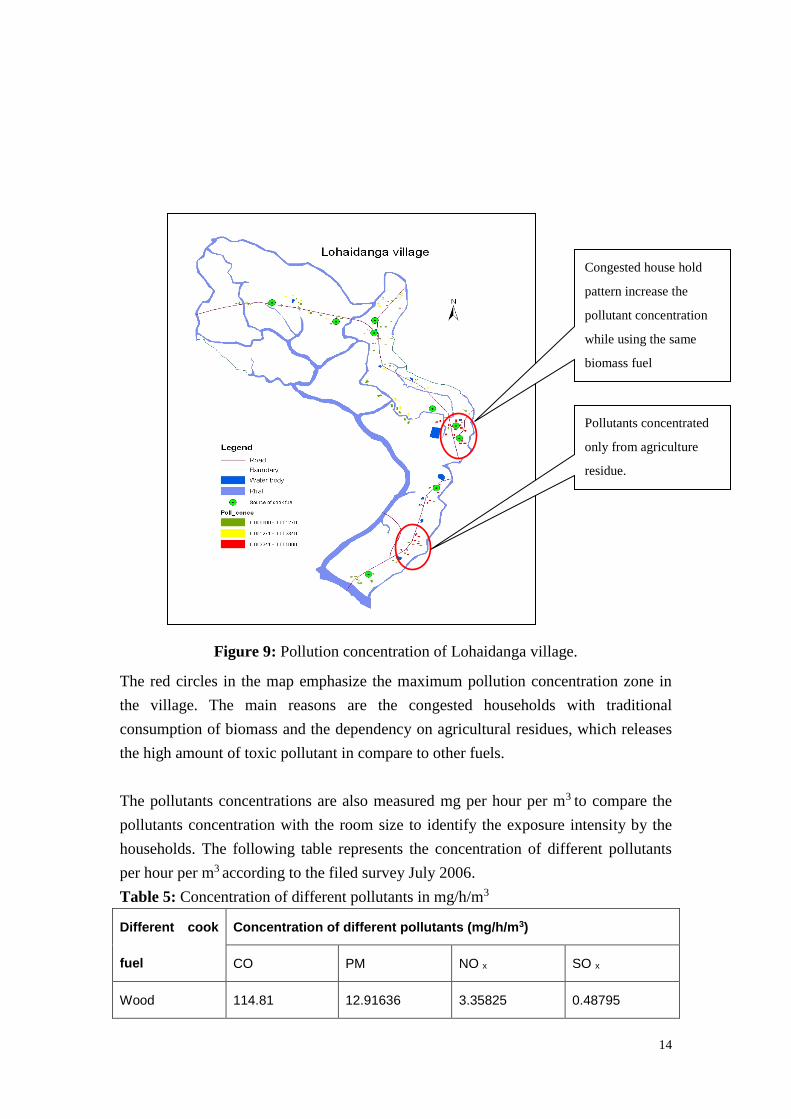
Figure 9: Pollution concentration of Lohaidanga village.
The red circles in the map emphasize the maximum pollution concentration zone in
the village. The main reasons are the congested households with traditional
consumption of biomass and the dependency on agricultural residues, which releases
the high amount of toxic pollutant in compare to other fuels.
The pollutants concentrations are also measured mg per hour per m3 to compare the
pollutants concentration with the room size to identify the exposure intensity by the
households. The following table represents the concentration of different pollutants
per hour per m3 according to the filed survey July 2006.
Table 5: Concentration of different pollutants in mg/h/m3
Different cook
fuel
Concentration of different pollutants (mg/h/m3)
CO PM NO x SO x
Wood 114.81 12.91636 3.35825 0.48795
Congested house hold
pattern increase the
pollutant concentration
while using the same
biomass fuel
Pollutants concentrated
only from agriculture
residue.
15
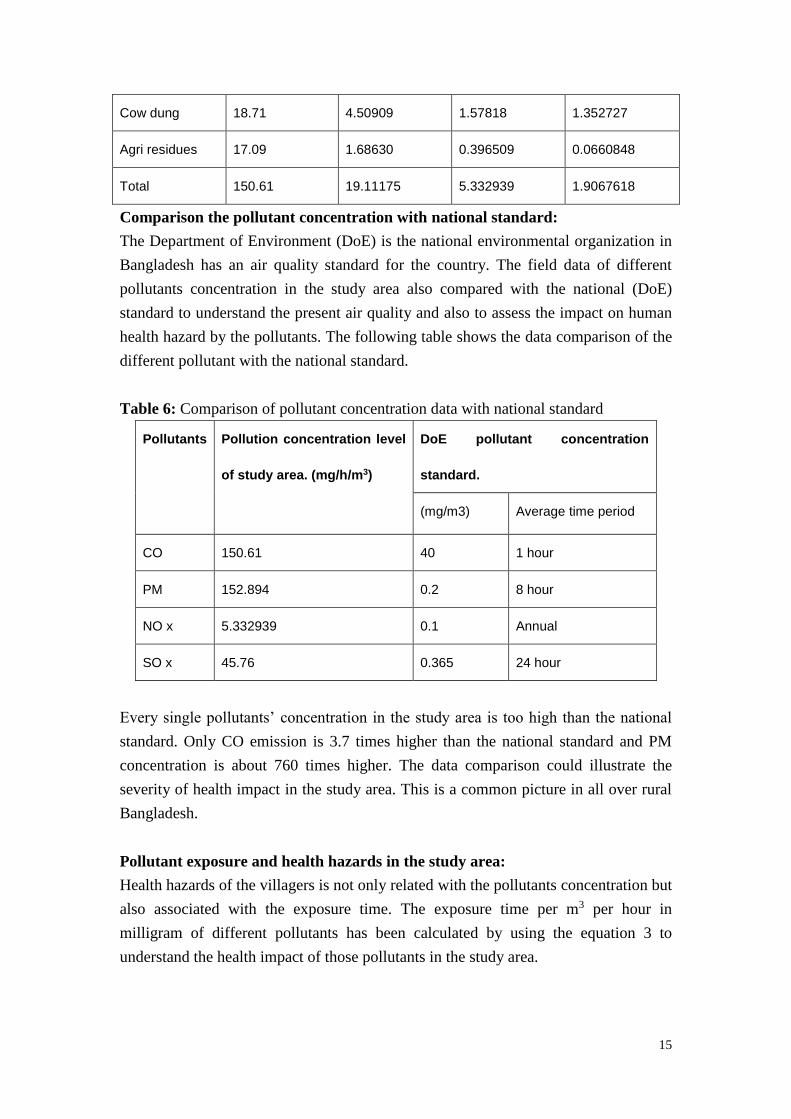
Cow dung 18.71 4.50909 1.57818 1.352727
Agri residues 17.09 1.68630 0.396509 0.0660848
Total 150.61 19.11175 5.332939 1.9067618
Comparison the pollutant concentration with national standard:
The Department of Environment (DoE) is the national environmental organization in
Bangladesh has an air quality standard for the country. The field data of different
pollutants concentration in the study area also compared with the national (DoE)
standard to understand the present air quality and also to assess the impact on human
health hazard by the pollutants. The following table shows the data comparison of the
different pollutant with the national standard.
Table 6: Comparison of pollutant concentration data with national standard
Pollutants
Pollution concentration level
of study area. (mg/h/m3)
DoE pollutant concentration
standard.
(mg/m3) Average time period
CO 150.61 40 1 hour
PM 152.894 0.2 8 hour
NO x 5.332939 0.1 Annual
SO x 45.76 0.365 24 hour
Every single pollutants’ concentration in the study area is too high than the national
standard. Only CO emission is 3.7 times higher than the national standard and PM
concentration is about 760 times higher. The data comparison could illustrate the
severity of health impact in the study area. This is a common picture in all over rural
Bangladesh.
Pollutant exposure and health hazards in the study area:
Health hazards of the villagers is not only related with the pollutants concentration but
also associated with the exposure time. The exposure time per m3 per hour in
milligram of different pollutants has been calculated by using the equation 3 to
understand the health impact of those pollutants in the study area.
16
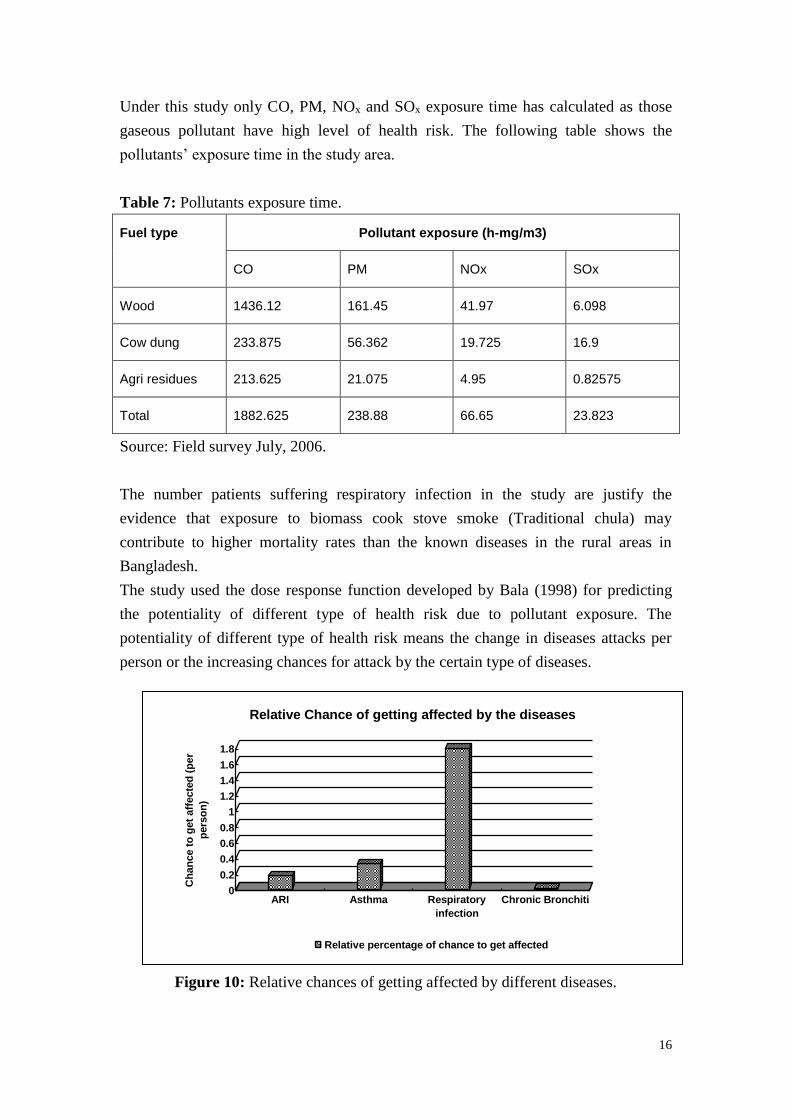
Under this study only CO, PM, NOx and SOx exposure time has calculated as those
gaseous pollutant have high level of health risk. The following table shows the
pollutants’ exposure time in the study area.
Table 7: Pollutants exposure time.
Fuel type Pollutant exposure (h-mg/m3)
CO PM NOx SOx
Wood 1436.12 161.45 41.97 6.098
Cow dung 233.875 56.362 19.725 16.9
Agri residues 213.625 21.075 4.95 0.82575
Total 1882.625 238.88 66.65 23.823
Source: Field survey July, 2006.
The number patients suffering respiratory infection in the study are justify the
evidence that exposure to biomass cook stove smoke (Traditional chula) may
contribute to higher mortality rates than the known diseases in the rural areas in
Bangladesh.
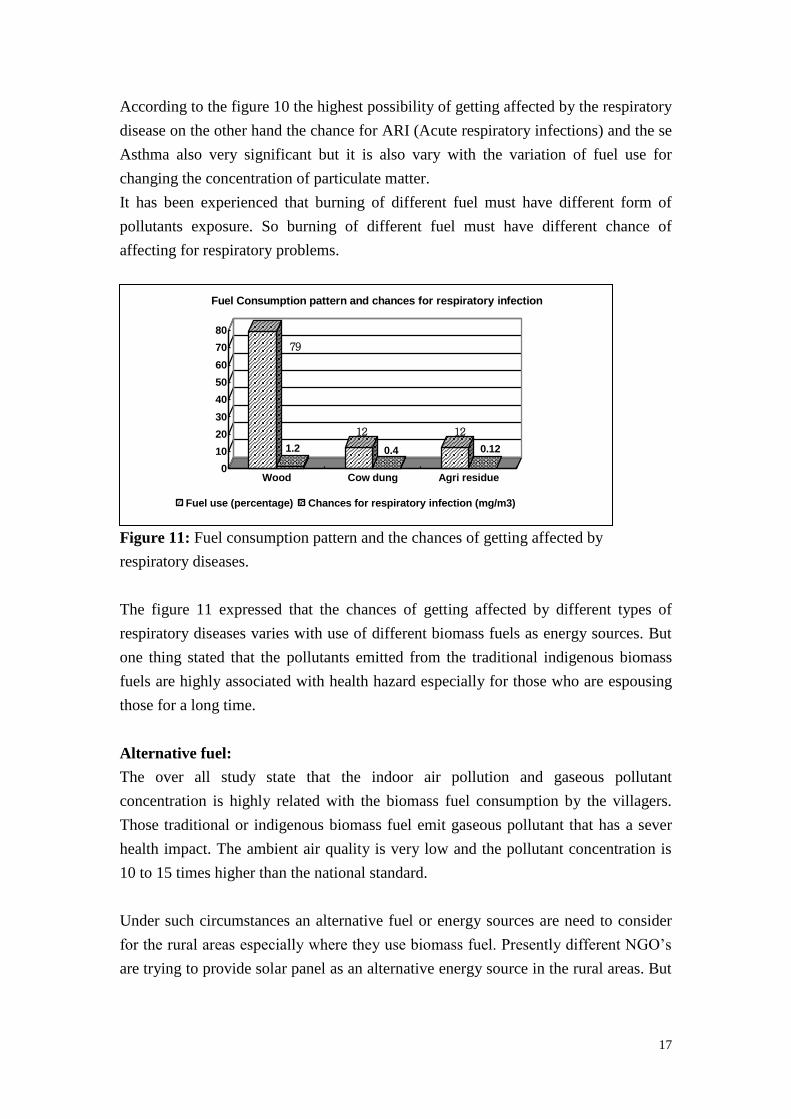
The study used the dose response function developed by Bala (1998) for predicting
the potentiality of different type of health risk due to pollutant exposure. The
potentiality of different type of health risk means the change in diseases attacks per
person or the increasing chances for attack by the certain type of diseases.
Figure 10: Relative chances of getting affected by different diseases.
0
0.2
0.4
0.6
0.8
1
1.2
1.4
1.6
1.8
Ch
an
ce t
o g
et
aff
ecte
d (
per
pers
on
)
ARI Asthma Respiratory
infection
Chronic Bronchiti
Relative Chance of getting affected by the diseases
Relative percentage of chance to get affected
17
According to the figure 10 the highest possibility of getting affected by the respiratory
disease on the other hand the chance for ARI (Acute respiratory infections) and the se
Asthma also very significant but it is also vary with the variation of fuel use for
changing the concentration of particulate matter.
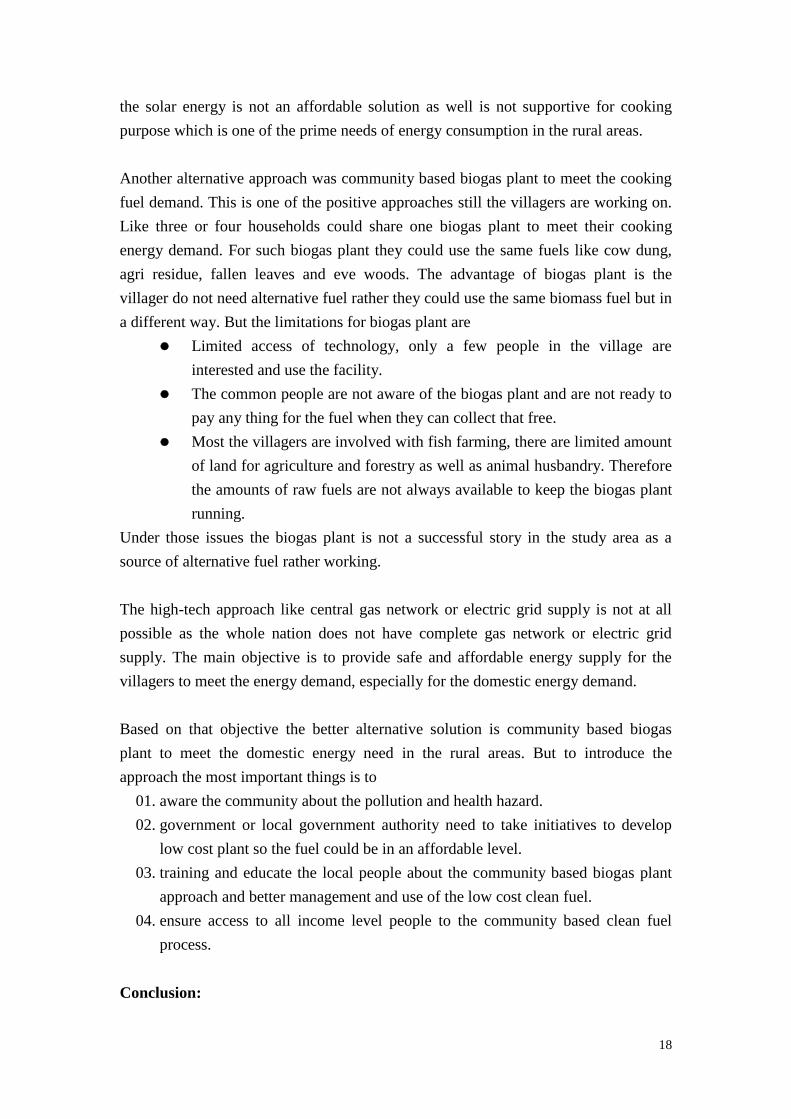
It has been experienced that burning of different fuel must have different form of
pollutants exposure. So burning of different fuel must have different chance of
affecting for respiratory problems.
Figure 11: Fuel consumption pattern and the chances of getting affected by
respiratory diseases.
The figure 11 expressed that the chances of getting affected by different types of
respiratory diseases varies with use of different biomass fuels as energy sources. But
one thing stated that the pollutants emitted from the traditional indigenous biomass
fuels are highly associated with health hazard especially for those who are espousing
those for a long time.
Alternative fuel:
The over all study state that the indoor air pollution and gaseous pollutant
concentration is highly related with the biomass fuel consumption by the villagers.
Those traditional or indigenous biomass fuel emit gaseous pollutant that has a sever
health impact. The ambient air quality is very low and the pollutant concentration is
10 to 15 times higher than the national standard.
Under such circumstances an alternative fuel or energy sources are need to consider
for the rural areas especially where they use biomass fuel. Presently different NGO’s
are trying to provide solar panel as an alternative energy source in the rural areas. But
79
1.2
12
0.4
12
0.12
0
10
20
30
40
50
60
70
80
Wood Cow dung Agri residue
Fuel Consumption pattern and chances for respiratory infection
Fuel use (percentage) Chances for respiratory infection (mg/m3)
18
the solar energy is not an affordable solution as well is not supportive for cooking
purpose which is one of the prime needs of energy consumption in the rural areas.
Another alternative approach was community based biogas plant to meet the cooking
fuel demand. This is one of the positive approaches still the villagers are working on.
Like three or four households could share one biogas plant to meet their cooking
energy demand. For such biogas plant they could use the same fuels like cow dung,
agri residue, fallen leaves and eve woods. The advantage of biogas plant is the
villager do not need alternative fuel rather they could use the same biomass fuel but in
a different way. But the limitations for biogas plant are
Limited access of technology, only a few people in the village are
interested and use the facility.
The common people are not aware of the biogas plant and are not ready to
pay any thing for the fuel when they can collect that free.
Most the villagers are involved with fish farming, there are limited amount
of land for agriculture and forestry as well as animal husbandry. Therefore
the amounts of raw fuels are not always available to keep the biogas plant
running.
Under those issues the biogas plant is not a successful story in the study area as a
source of alternative fuel rather working.
The high-tech approach like central gas network or electric grid supply is not at all
possible as the whole nation does not have complete gas network or electric grid
supply. The main objective is to provide safe and affordable energy supply for the
villagers to meet the energy demand, especially for the domestic energy demand.
Based on that objective the better alternative solution is community based biogas
plant to meet the domestic energy need in the rural areas. But to introduce the
approach the most important things is to
01. aware the community about the pollution and health hazard.
02. government or local government authority need to take initiatives to develop
low cost plant so the fuel could be in an affordable level.
03. training and educate the local people about the community based biogas plant
approach and better management and use of the low cost clean fuel.
04. ensure access to all income level people to the community based clean fuel
process.
Conclusion:
19
The national energy supply like electricity and gas are very limited in Bangladesh
villagers especially for the students it is too limited. Therefore the villagers have to
depend on the locally available energy sources like biomass fuels; fro example wood,
cow dung and agricultural residues. In the study are the villagers completely
dependent on biomass fuel to meet theis domestic needs like cooking and thy collect
those fuels around the locality and some time thay have to purchase it. Most of those
fuels are not at all processed to burn in a proper way therefore they emit sever gaseous
pollutant like CO. CO2 SOx, NOx and even PM. Those pollutants are highly
hazardous for human health especially for women and children who exposue that air
for a long time.
There are almost no researches have focused on these particular issues before, to find
out what are the pollutants emitted from the traditional biomass fuel used by the
villagers and their concentration and health impact. Under this research we try to find
type of biomass fuels are used in the rural areas in Bangladesh, the pollutants they
emit, the pollution concentration and the associated health hazard.
Based on this research the pollutants concentration in the study are is about 10 times
higher even some time more than the national ambient air quality standard That
concentration has a high risk for human health. Unfortunately in the rural areas mostly
women and child spend most of their time in such polluted air and get affected. The
child death rate in the village area and the chances to get affected by other disease
associated with air pollution is quite high in the village area in Bangladesh because of
using unprocessed biomass fuel to meet domestic energy need. As well there are no
awareness about that.
This research tries to focus on that particular issue and try to find current situation and
to get an alternative solution to get a safe energy for the villagers. Still the
government and local level authority need to perform more actively to get an
alternative to protect women and child health from gaseous air pollutants emitted
from traditional biomass fuels.
20
Reference:
Akhter J. 2002,Trends of Biomass Energy Consumption in Bangladesh, Unpublished
Undergraduate Thesis, Institute of Forestry and Environmental Sciences, Chittagong
University, Chittagong.
Bala B.K, 1998. Energy and Environment: Modeling and Simulation, New York:
Nova Science Publishers, Inc.
Bala B.K, 1997. Computer modeling of the rural energy system and of CO2 emissions
for Bangladesh. Energy, the international journal22, pp771-776.
International Energy Agency (2006, 2002 & 1998). Key World Energy Statistics.
France. URL:
http://www.iea.org/Textbase/publications/free_new_Desc.asp?PUBS_ID=1199
Inter Governmental Panel on Climate Change (1996). The national report on CO2
imitation and concentration, Netherlands.
Raina D.N. 2005,World energy council, Regional Energy Cooperation in South
Asia: A vehicle for poverty Alleviation, URL:
http://www.worldenergy.org/wecgeis/wec_info/work_programme2007/regional/asia/s
asia/raina0905.pdf, explored on March 15, 2006.
Sitara J, 2003, Cost of air pollution of Dhaka city, Unpublished Undergraduate
Thesis, Environmental science discipline, Khulna University, Khulna.