domestic payments cards networks › de-de › wp-content › uploads › sites › 5 › … ·...
TRANSCRIPT

in collaboration with
Business Technology Performance Index 2015/2016
iptb

The information contained in this document is proprietary. ©2015 Capgemini. All rights reserved. Rightshore® is a trademark belonging to Capgemini.
Contents
Introduction 1
1. Executive Summary 2
2. Digital Transformation: Leveraging the Building Blocks 3 TechnoVision Framework Overview 3 Introduction to TechnoVision’s Seven Clusters 4 TechnoVision and the Equipment Finance Industry 7
3. Solution Provider’s Point of View 14 CHP Consulting 14 SAP 15
4. Understanding Digital Transformation 18 Digital Strategy 18 Digital Maturity 19
5. The Total Cost of IT 21 What is TCO and Why Does it Matter? 21 Keys to Manage IT Spend Effectiveness 21 Conclusions 25
6. BTPI Survey Findings 27 Front Office 27 Back Office 29 Movement to Mobile 29
7. Technology Trends 2014 versus 2015 31
8. Capgemini Point of View 33
9. BTPI Survey Response Statistics 35
About the Report 45
About the Authors 46

Banking | the way we see it
1
Introduction We are proud to present the 2015/2016 Business Technology Performance Index (BTPI) in collaboration with the Equipment Leasing and Finance Association (ELFA). The BTPI provides insight into the technology trends and forward-looking initiatives that equipment finance companies have begun, are anticipating, or have recently completed in efforts to drive their firms into new markets and opportunities, and improved and more efficient operations.
The main objective of the BTPI is to understand the current thinking of market-leading equipment finance firms relative to decision processes associated with operations and technology initiatives. The report also reveals the current state of technology in the equipment finance industry.
We believe the findings in the following pages can help in the construction of equipment finance business plans and the technology strategies to support those plans. The BTPI can also assist in efficiently benchmarking and refining your existing information technology (IT) strategic direction against the market.
Cordially,
Steven Byrnes Michael Donnary

2 Business Technology Performance Index 2015/2016
1. Executive Summary The trend to close gaps within digital channels in the equipment finance industry continues. As stated in last year’s BTPI report, a good number of these innovations to date have been primarily focused around front-end originations platforms leaving the back-end servicing platforms to chance.
For example, while slow there has been a noticeable shift that has begun toward adapting increased mobile functionality. In contrast though, there has been non-existent or very low adoption of cloud computing in the industry.
That being said, in 2015 we are starting to see more equipment finance companies looking to undertake initiatives to replace back-end servicing platforms. Forty percent (40%) of the respondents to our annual survey have stated that they will look to undertake back-end system replacement over the next 18 months.
As reported by our survey respondents, the current average life in use of these back-end platforms is 11 years and concerns are awash about meeting their needs. Sixty percent (60%) of respondents indicated that their core back-end platform does not meet their future needs and in fact, forty percent (40%) indicated that their back-end platform does not meet their current needs.
These are all very telling signs that the trend in digital transformation in the equipment finance industry has now also morphed over to the servicing side of the equation. There is no doubt that back-end system replacement is one concern that may be keeping folks up at night.
The 13th annual Business Technology Performance Index will help to provide some insights for equipment finance professionals into:
• Leveraging the building blocks of TechnoVision, Capgemini’s framework that can be used as enabler for digital transformation
• Solution provider points of view on digital transformation, market perspective and what their customers are asking them
• The importance of having a digital strategy and its impact on financial results and operational efficiency
• The total cost of IT including a checklist for system replacement costs
Having a disciplined approach around digital transformation and strategy will be critical to success and drive competitive advantage for equipment finance companies. This will be especially true as we start to see more companies undertake initiatives to replace back-end servicing platforms.
60%
of survey respondents said their core back-end platform does not meet their future needs

Banking | the way we see it
3
2. Digital Transformation: Leveraging the Building Blocks TechnoVision Framework Overview
TechnoVision is Capgemini’s visionary thought leadership put together by a network of experts to expose how new technologies impact our clients’ business. This framework allows the user to access the business potential of new technologies, design principles, and trends to transform business. This visionary model categorizes technologies with business change potential into seven clusters:
• Design for Digital • Invisible Infostructure • Applications Unleashed • Thriving on Data
• Process on the Fly • You Experience • We Collaborate
The one overarching design principle that is applied throughout is called Design for Digital. Each of these categories is further broken down into 37 building blocks that collectively support digital transformation.
The Design for Digital principle embodies contemporary design that applies to all technology challenges within transformation. Invisible Infostructure and Applications Unleashed take a deeper dive into the foundational building blocks of any IT landscape. Invisible Infostructure evolves into an invisible, yet information-rich platform for business while Applications Unleashed rationalizes core applications landscape while benefiting from cloud solutions.
Thriving on Data and Process on the Fly focus on IT capabilities that have constant digital change. Thriving on Data provides business value through insights derived from hard data. Process on the Fly creates and manages processes with the growth of business.
Lastly, You Experience and We Collaborate provide organizational access to the rest of the world. You Experience explores the highly individual digital user experience while We Collaborate focuses on exploring the power of the world to generate more business.
Through these clusters and principles, organizations can explore how the power of understanding new technologies impacts the rapid growth of business.

4 Business Technology Performance Index 2015/2016
Introduction to TechnoVision’s Seven Clusters
TechnoVision structures technologies into seven clusters: one Design cluster and six Operational clusters. These clusters were first defined by Capgemini back in 2007, but have retained their value throughout the years while the building blocks have been revised several times, radically renewed last year, and again, significantly reviewed for TechnoVision 2015 to keep up with the rapid pace of change. Technology developments come so fast and furious that even professional watchers have a hard time keeping pace. To IT professionals, they can be distracting, even paralyzing. To business users, they often look promising individually, but collectively they are confusing.
Exhibit 1. TechnoVision’s Design and Operational Clusters
This is where TechnoVision 2015 helps. The clusters provide order and a form of stability. They’re easily understood and positioned. These are the seven clusters of TechnoVision.
• Design for Digital. Seven contemporary design principles that should be applied to all business technology challenges with digital transformation
• Invisible Infostructure. Infrastructure that evolves into an invisible but extremely information-rich and powerful platform for business
• Applications Unleashed. Radically rationalizing the core applications landscape while benefiting from an abundance of next generation, cloud-based solutions
• Thriving on Data. Providing real business value through actionable insights, distilled from an abundance of data
• Process on the Fly. Creating and managing flexible, responsive processes that are in sync with the growth of business
• You Experience. Exploring the potential of the highly individualized, digital user experience
• We Collaborate. Building on the power of the crowd to do better, different and more business
New technology developments come so
fast and furious that professional watchers have a hard time keeping pace

Banking | the way we see it
5
Exploring the Design for Digital Cluster
The first cluster Design for Digital surrounds all other clusters. It is used to describe the evolving environment — open, service-oriented, in the cloud, social — in which modern systems and applications are designed, developed, and operate.
The Design for Digital cluster comes with seven contemporary design principles that should be applied to all business technology challenges within digital transformation. These principles are not just merely descriptive, but prescriptive and instead show what it takes for organizations to successfully enter the digital war battlefield that has begun. In a nutshell, these are the seven Design for Digital principles:
• Digitally Intense and What’s Your Story? build on some of the key lessons digital masters taught us. The successful digital enterprise combines the right digital capabilities with the right leadership.
• Business Mon Amour advocates striving for the fusion of business and technology, rather than just alignment.
• Bon Risk Appétit emphasizes taking a balanced approach to risk and security. It recognizes the growing importance of security as a concern, but even more so as an opportunity.
• From Train to Scooter suggests we should understand and master business/IT transformation at different speeds and dynamics. The sturdiness of a train, mobility of a car, and agility of a scooter — a multi-speed IT world needs it all.
• Platform No 3 is a plea to build digital platforms that marry enterprise grade stability with next-generation agility; central with de-central.
• Hack My Business Model promotes a disruptive mindset for reinventing business models through new technology.
These design principles resonate individually, but are best applied as a set of seven and they propose a very different way of looking at business, users, technology integration, and applications. It is important to note that these seven design principles can be used as a state of mind, to shape an approach, and simply as a checklist for assessing and creating solutions.
Exploring the Operational Clusters
The six operational clusters, the ones that help to go from design to execution, are grouped in three tandems.
First Tandem: The Foundations of the Enterprise
The first tandem associates the two clusters Invisible Infostructure and Applications Unleashed.
Design for Digital is used to describe the evolving environment — open, service-oriented, in the cloud, social — in which modern systems and applications are designed, developed, and operate.

6 Business Technology Performance Index 2015/2016
In our personal use of technology, we are happy to ignore infrastructure. The Invisible Infostructure cluster groups the technologies that will allow enterprises to achieve an infrastructure that evolves into an invisible, but extremely information-rich and powerful, platform for business. Technologies like the cloud, Internet of Things, virtual Lego, and DevOps are part of this cluster and are applied as enablers of this transformation.
For more than twenty years, ERPs have dominated and shaped the application landscape. The cloud now frees up the application landscape. Applications are no longer dominated by ERPs and traditional development. They now come from a wide range of sources. Radically rationalizing the core applications landscape, i.e. using simplified and standardized core applications, enables more innovation. Combined with the abundance of next-generation, cloud-based solutions, the whole world are now the enterprise’s development organization. The Applications Unleashed cluster shows the magical trinity of the cloud, catalogs, and API to unleash the power of organizations’ applications.
Second Tandem: Bridging Systems and People
While the first tandem addresses the technologies that are the foundations of the enterprise, the second tandem has different character. It groups those technologies that are needed to bridge the systems and software foundations on one hand, and people experience on the other. These are devised into two clusters: Thriving on Data and Process on the Fly. Without them, an enterprise cannot participate in the modern use of technologies and therefore, cannot not be digital.
When Thriving on Data was created as a cluster, it could have been called Thriving on Big Data. However, the expression had not been crafted yet. This cluster deals with more than just big data. It also delves into data management, analytics, and real time data. Data is no longer the purview of IT and their systems; it is now used and generated by customers, networks, and social media. The digital enterprise is as much outside-in as it is inside-out, providing real business value through actionable insights, distilled from an abundance of data.
The internal workings of a company obey well-defined processes. It used to be a major event when these processes were substantially modified. For the company to entertain a different, permanent, and close relationship with its customers, and more generally with the world, fixed ways of working will not suffice anymore. The digital enterprise needs to react appropriately to customer situations and wishes. The Process-on-the-Fly technologies serve this purpose, and help achieve a long-held ambition to make the digital enterprise adaptive by creating and managing flexible, responsive processes that are in sync with the growth
TechnoVision’s 6 operational clusters help to go from design to execution

Banking | the way we see it
7
of business. Along with the Thriving on Data cluster, it forms the digital spine that helps enterprises withstand the unpredictability of the outside world.
Third Tandem: The Visible Side of Technologies
With the third tandem of clusters, we come to the visible side of technologies, the ones we use every day. It is by now clear that they can bloom and provide the bridges between the enterprise foundations and the new world of technology, as we live it.
You Experience groups the technologies that give us a different way of working and living. The best of the smart phone apps embody them, with unique functions, power and ease-of-use — not to mention fun. This cluster explores the potential of the highly individualized, digital user experience. It includes a disappearing keyboard, gamification-led responsive apps, a novel Bring Your Own Device (BYOD) policy, APIs, a decentralized approach to app development, and the man-machine convergence. User experience has gained an all-new meaning.
The technologies make it easy for us not to remain alone. Thanks to them, We Collaborate, not only achieves levels of awareness and affiliation, but also of social power, crowd thinking, crowd creating, and crowd producing. With the next level of social collaboration, a social power is unleashed that makes a lasting impact on customers and business.
TechnoVision and the Equipment Finance Industry
The TechnoVision seven-element framework and its building blocks — led by the Design for Digital principles — have been applied successfully and continually to industry segments, a vast range of diverse enterprises, and countless process domains and technology environments. Likewise, the framework and the seven clusters can be applied to the equipment finance industry and the challenges that are faced there. In the wake of intensified competition, increasing compliance, shrinking margins and evolving customer demands, leading equipment finance firms are trying to meet these challenges by building more sophisticated and agile systems. The seven design principles can be applied to ensure successful system transformations.
One of the common challenges that equipment finance companies face is how to integrate their back-end servicing platforms and front-end CRM and originations systems. Over the years, companies have placed a focus on improving the front-end systems, leaving their back-end technology behind in the process of modernization. In this respect, the Invisible Infostructure and Applications Unleashed clusters demonstrate
One of the most common challenges for equipment finance companies is how to integrate back-end servicing platforms with front-end CRM and originations systems

8 Business Technology Performance Index 2015/2016
how cloud-based solutions and technologies like DevOps can be applied to enable a smooth and powerful integration of an organization’s applications.
In addition, achieving operational agility is often experienced to be a struggle in the equipment finance industry. Traditional database technologies are not up to par with the need to integrate large amounts of real-time business information coming from various sources. This is where big data tools and data analytics of the Thriving on Data cluster can contribute especially through predictive analytics that provide valuable insights for understanding market trends, customer behavior and needs, and regulations. Combined with flexible and responsive process design from the Process on the Fly cluster, companies can build operational agility and design improved customer experiences. Leveraging the next level digital trends of the You Experience and We Collaborate clusters, early adopters of these new ways of working can become game changers in the industry.
In our next section, we will cover two specific clusters, Process on the Fly and Thriving on Data, in some further detail which have specific applicability to the equipment finance industry. For more details on Capgemini’s TechnoVision framework, visit www.capgemini.com/ TechnoVision.
Process on the Fly: Designing Flexible and Responsive Processes
There are many ways to define, run and manage processes. The state of the art in business process management (BPM) tooling makes it possible to improve processes in many different ways. Forget carving these process definitions in stone. Nowadays, depending on the specific improvement needs, BPM can provide various flavors of agility, ranging from classic, pre-defined, workflow-style process integration to dynamic, rules- and policy-based process choreography.
The next generation of BPM and business rules management tools is so powerful that it actually can be seen as the successor to custom-built applications. Being able to define detailed process flows and decision trees helps on both the business and IT side to create powerful, differentiating solutions that would have required extensive custom
Banking | the way we see it
9
coding in the past. Now much of the definition can be done on the fly, using visual models and (semi) natural language in the nearest proximity to the business. Too few know it, but process technologies are now so versatile and powerful that they enable ways of doing business that yesterday were deemed impossible, even across silos.
Process on the Fly is a new wave of service-oriented solutions enabling business analysts to quickly simulate, describe, model, execute and manage business processes. The Process on the Fly cluster (together with Thriving on Data) provides the technologies that support the new user experiences – individual and social – and in turn feed the enterprise applications with outside knowledge.
The internal workings of an organization traditionally followed well-defined, and extremely stable, processes. It used to be a life changing event when these processes had to be substantially modified. Nowadays, few things are carved in stone, and processes are certainly not among them. For the organization to entertain permanent, close relationships with its customers, and more generally with the inside and outside world, fixed ways of working will not suffice anymore. Agility and responsiveness are key attributes of the digital enterprise.
Over the years, ERP systems have been customized to enter organization specific functionality into the ERP application. This leads to better support for the business, but at the same time involves higher costs for maintenance, high dependency on the personnel involved in this customization, long timelines to deliver change to the system and increased risk involved in upgrading the ERP system.
However, the best of both worlds can be created by bringing back the functionality to out-of-the-box usage of the ERP system and at the same time introducing change and flexibility by means of externalized “process apps” in direct connection with the ERP system. The ERP system (or legacy customized system, for that matter) is used as originally intended and designed, resulting in more predictable behavior of the system. The process app externalizes the needed functionality into a highly customizable application outside the ERP for which it is supported by rules engines and task inboxes and can be delivered to different channels.
Few things are carved in stone and processes are certainly not among them

10 Business Technology Performance Index 2015/2016
The reasons for needing process apps may include the following: the ERP system just doesn’t deliver this functionality in a specific industry; the volatility of changing certain functionality is high; or an umbrella type of functionality across (ERP) silos is needed.
Bringing It All Together
An example of bringing all this together, let’s look at the originations process within a typical asset finance company. A standard leasing package could be used to store the transactional details. However, in the originations process, a set of complex rules and routing logic is involved for getting the proper approvals. In the diversified finance world, approval logic can be complex and often involve involvement from multiple organizational groups.
Including such complex logic into your package solution may require a lot of customization. By adding a call to an external BPM tool, the execution of the rules and workflow is done outside the system, in a tool that is aimed to deliver industrial strength rules and workflow functionality.
The process app here works as an add-on to the core package solution, but can also be extended to support the full lifecycle of the transaction process with the possibility to involve multiple applications. The actual core functionality is kept in the supporting systems, while at the same time the process app acts as an umbrella function.
How to Get There
Bringing the flexibility outside a core package solution into a process app can be brought into the landscape from two extremes:
First of all, the most basic one: At some point in time a technical upgrade is needed for the package solution because the product version is out of support or the version is not working on a higher version of the operating system. Technical upgrades are a good time to understand and reiterate the need for excess customization in the system. Aim for a plain vanilla upgrade and investigate the potential for flexibility outside your legacy system, which can be implemented via process apps.
The second reason aligns with the String of Silos concept of TechnoVision 2014: An umbrella function may be needed across silos, and process apps can contain the process logic, rules and information that are essential to deliver the business outcome, supported by the functionality contained in the systems underneath.
Technical upgrades are a good time to understand customization in your current system and look to process apps for flexibility

Banking | the way we see it
11
Thriving on Data: Turning Data into Insights and Business Value
When data is turned into insight – provided at the point of action – it becomes a true business value. Organizations can benefit from next-generation big data technologies by reshaping their existing data landscape into a more cost-effective, yet increasingly agile foundation for business. They thus enable themselves to deal with the flood of data that will come from connected people and things. But there’s more: predictive analytics – delivered in real time – can substantially redefine business models. And there’s no end to the disruptive potential of cognitive computing and deep machine-learning. Organizations that manage to create an Insight Everywhere culture will truly thrive on data.
From Buzzwords to Real Business Value
The potential for big data is huge for many organizations. The latest research by Capgemini Consulting shows most enterprises put better insights from data at the very top of their digital priority list1
Two years ago, big data was the much-hyped term analysts, consultants, and customers were still trying to define. Nowadays, the Internet of Things, m-Health, online retail, energy consumption, and connected cars all rely on big data as a key component to make the promise real. After having done many proofs of concepts to explore the opportunities, enterprise momentum is now moving from analytics to production usage and daily business impact.
. The reality is that it is difficult to get beyond the proof of concept and actually start monetizing the promise.
Disruption is looming around the corner as shown in our most recent report. The majority of the companies interviewed believe that the new data landscape will thoroughly shake up business as we know it. New entrants will use data to create brilliant, intelligent products and services and with equally superior delivery.
1 Cracking the Data Conundrum: How Successful Companies Make Big Data Operational. Capgemini
Consulting, January 2015, https://www.capgemini-consulting.com/cracking-the-data-conundrum
The majority of companies believe that the new data landscape will thoroughly shake up business as we know it
Cracking the Data Conundrum: How
Successful Companies Make Big Data
Operational

12 Business Technology Performance Index 2015/2016
Luckily, enterprises still have the option to be at the positive end of disruption. As we stipulate elsewhere, it’s not all about ending up in the Valley of Doom. By embracing data – living and breathing it – enterprises can take the lead to become truly insightful, making better use of the assets they possess and thus outsmarting competition.
More agility, less infrastructural constraints, and a tight relationship between business and IT are at the heart of making better and new businesses with data. It’s at the very heart of digital transformation and what Thriving on Data is all about.
Four Ways Big Data is Changing Data Driven Insights
Efficiency and Cost Focus. In a recent Capgemini study, 65% of respondents see big data as a key enabler their organization’s effectiveness and competitiveness2
• Use of insights from big data to help identify potential operational efficiencies in order to reduce costs. An example of this in the equipment finance industry is firms utilizing large data sets to analyze and forecast residual values of the equipment the finance.
. This could manifest itself in many different ways, but we find that many organizations see big data’s ability to help them identify opportunities for cost savings as a primary driver for adoption. This question for cost reduction is seen in two primary ways:
• For very large institutions, the modernization of the information landscape – e.g. big data technologies that are open-source and use commodity hardware – reduce costs as this combination can be as much as 20-30 times cheaper per terabyte than traditional data warehouse technology.
Growth of Existing Business Streams. While cost reduction and savings may keep you in the game, organizations must do more to thrive in highly competitive markets. About 61% of respondents to the Capgemini survey state that big data is becoming a driver of current revenues in its own right. For many industries, including equipment finance, this means developing a much more granular understanding of their customers by aggregating and analyzing all relevant data per customer from both inside and outside the company, including social media.
2 Big & Fast Data: The Rise of Insight-Driven Business. Capgemini and EMC, March 2015,
https://www.capgemini.com/thought-leadership/big-fast-data-the-rise-of-insight-driven-business
1
2
61% of respondents say big data is becoming a driver of current revenues in its own right
Big & Fast Data: The Rise of the Insights-
Driven Business

Banking | the way we see it
13
Growth Through Market Disruption. Nearly two-thirds of these respondents also believe that big data is changing their traditional business boundaries. While it may be more common in B2C businesses, there are examples across the B2B landscape and it is something to pay attention to in asset finance. Examples of this include telecoms using the data they have about their customers to develop new revenue streams such as geo-located marketing services and utilities using smart meter read data to provide household equipment monitoring and servicing offers.
Monetization of Data. In some industries, it is already apparent that the data organizations hold is becoming their major product. Many large financial services firms already have specific information services divisions whose prime aim is to monetize their data. GE is an example of an organization using big data to create a new revenue streams by monetizing their data, providing their Predix platform in the cloud, enabling operators of their traditional products (e.g. wind turbines) to use machine date faster and more efficiently, saving them billions annually.
Working with the Models
You don’t have to choose between the four models above, or progress from one to the next. The four models do not constitute a maturity model and we expect that equipment finance companies will create a mix of these to suit their needs, likely focusing on cost savings and increasing existing revenue streams.
3
4

14 Business Technology Performance Index 2015/2016
3. Solution Provider’s Point of View We interviewed two solution providers in the leasing and asset finance industry for insights into digital transformation, the current market, and the needs of their customers.
CHP Consulting
CHP Consulting is the supplier of ALFA Systems, the leading software platform for top asset finance companies worldwide. Capgemini caught up with Andrew Robertson, Associate Director of CHP Consulting, to get his thoughts on digital transformation. CHP Consulting is the supplier of ALFA Systems, a global enterprise leasing and leading platform.
Q: What does digital transformation mean for you and, perhaps more importantly, your customers?
Andrew Robertson: Based on the aims of customers on current projects and the aspirations of industry prospects we’ve spoken to, digital transformation represents a shift in the corporate mindset. Previously, technology projects were focused on the systemization of traditional processes; for example, a desire to operate a paperless office would result in identical processes except for documents appearing on screens rather than on desks.
Digital transformation places the user – customers, employees, external partners – at the center of the operational strategy. It focuses on their digital needs and delivers to their heightened expectations built on the rise of social media and personalized services. On our projects we are finding that technology is no longer a limiting factor; instead, success is being driven by innovation in the design and execution of this new business model.
Q: What kind of digital transformation investments or initiatives is CHP working on?
AR: CHP is investing heavily in its ALFA Systems and has active initiatives across the application stack:
• We are focusing on every aspect of application performance to support the ongoing increases in the volume of digital transactions, and to maintain the quality of the user experience.

Banking | the way we see it
15
• We are building on the core application API to improve the speed with which complex system interactions can be developed.
• We are enhancing the user interface to work seamlessly across multiple devices to meet the demands of an omni-channel digital ecosystem.
Q: What kind of requests are you hearing from customers and where can your digital transformation strategy address those requests?
AR: Across our customer base we are working on requests to help expose data and processes usually restricted to back-office systems. For customers, this includes making account information accessible on mobile devices. For external partners, this covers communication through bespoke portals and enabling core system integrations to limit or remove dependence on manual processes.
Within our customers’ operations, we are delivering minimal touch business processes that are initiated through intuitive, task-focused wizards and then automated through workflows controlled by business rules.
SAP
Capgemini spoke with Richard Marshall, Solution Executive for SAP’s leasing product, regarding their digital strategy. Founded in the early 1970s, SAP has become a global software giant with close to 300,000 customers and a focus on innovation. SAP has been a solution provider to the asset finance market for over 10 years, with a primary focus on organizations that are users of the larger SAP enterprise solutions. SAP’s leasing solution has been deployed to many customers across North America, Europe and Asia-Pac and there is currently a strong push to broaden the customer base in the U.S.
Q: What does digital transformation mean for you and, perhaps more importantly, your customers?
Richard Marshall: Digitalization of the financial services industry enables unprecedented connectivity and engagement with customers and partners in real-time, while at the same time enabling complete disintegration and reassembly of traditional value chains. The intimate relationship with the customer through omni-channel interaction, the ability to interact in real-time with customers and partners and process huge amounts of data at the same time, enables new, refined, dramatically simplified and accurate business processes. There are high expectations of service levels and the need for a convergence of people and technology to complete more complex tasks.

16 Business Technology Performance Index 2015/2016
Q: What kind of digital transformation investments or initiatives is SAP working on?
RM: SAP has built a structured framework to think through how to develop and execute on the financial services provider digital enterprise strategy: the Digital Business Framework. The digital core is the platform for innovation and business process optimization, connecting the workforce, the Internet of Things, the partner network, and the customers. While everyone is educating customers on the digital mandate, SAP has built a practical framework that makes it a reality, based on proven solutions and trusted partners. Through significant innovation and billions in technology investment, SAP has built the most comprehensive digital platform in the global technology market.
Q: What does your cloud strategy look like, what are you offering now, what is on the roadmap?
RM: Cloud is a key component of the Digital Business Framework. The digital core is the platform for innovation and S/4 HANA is key. A significant part of the aggressive investment strategy has been focused on cloud. To SAP, cloud is about enabling connections to the workforce, the partner network and customers.
Q: What do you see as some of the biggest concerns and/or opportunities for your company as it relates to digital transformation?
RM: As an example and as it relates to asset finance, the main concern is that organizations will be slow to adapt. McKinsey estimates that from 20% to 60% of profits could be at risk as business shifts and margin compression occurs3
Q: What do you see as some of the trends, where do you see digital transformation headed in the next few years?
. Guiding asset finance through the unchartered waters of digital transformation is a key opportunity for SAP. No other company can offer a complete end-to-end solution for the client like SAP.
RM: Financial service providers will adapt and embrace SAP’s digital framework as a key component to retaining, expanding and attracting as well as managing risk and operations. Financial service providers need to capitalize on their number one asset: big data. Having a complete command of this data and being able to leverages all that SAP has to
3 The Fight for the Customer: McKinsey Global Banking Annual Review 2015, McKinsey & Company,
September 2015

Banking | the way we see it
17
offer in the four key areas of the digital framework will surely increase sales and decrease cost while managing risk in line with both clients and governmental regulations.
Q: What kind of requests are you hearing from customers and where can your digital transformation strategy address those requests?
RM: Chief Marketing Officers are engaging and interested in the 360 degree customer view and predictive analytics. However, the complete transformation is challenging for asset finance organizations. SAP is a true market maker in this space and we have a global perspective and corresponding capabilities to deliver for an end-to-end digital experience from quote through termination.

18 Business Technology Performance Index 2015/2016
4. Understanding Digital Transformation Digital Strategy
What is Digital Strategy?
Digital strategy is the integration of digital technologies into business strategies and operations in ways that fundamentally alter the value chain. As shown in the following exhibit, digital strategy leverages the enhanced connectivity and mobility, insights and innovations, and speed and cost afforded by these technologies to achieve improvements in operational productivity, customer engagement, and in some cases, entire business models.
Exhibit 2. Digital Strategy
Why Does it Matter?
Effective digital strategies can afford equipment finance companies competitive advantages across their value chains − from operational efficiency to product innovation and access to new channels and markets. As described in the sidebar, evidence suggests that companies that leverage digital strategy to capitalize on this trend are achieving better financial results than their peers. In some cases, it is not just a matter of advantage but survival.
Where Does it Matter?
Capgemini’s and MIT’s research indicates that companies in all industries can earn a digital dividend by investing in digital strategy. At the same time, the relatively low cost of digital devices and infrastructure facilitates their proliferation across geographic regions. And executives across the C-suite are taking notice.
Connectivity & mobility Insights &
innovation Speed & cost
Benefits Customer facing Operational
productivity Transformation
Impacts Social Mobile Cloud Analytics
Technologies

Banking | the way we see it
19
Capgemini and MIT surveyed 469 senior executives in 391 large companies around the world to assess digital maturity. The study distinguished two dimensions of digital maturity: Digital Intensity (the “what”) and Transformation Management Intensity (the “how”). Companies that achieved maturity along both dimensions (the “Digirati”) outperformed their industry competitors on multiple financial metrics,
averaging 9% more revenues relative to assets, 26% higher profitability, and 12% higher market valuations.4
Digital Maturity
New digital technologies like social media, mobile, and analytics are advancing rapidly on the economic landscape. These innovations are used widely by consumers and employees alike. Facebook has more than 1.4 billion monthly active users today. Whatsapp has nearly 900 million monthly active users5. There are an estimated 3.6 billion unique mobile users globally which represents over half the world’s population6
Executives in every industry – from media to manufacturing to equipment finance – face a bewildering array of new digital opportunities. Some companies are what we call the Digirati. They have the digital maturity not only to build digital innovations, but also to drive enterprise-wide transformation. And they benefit from their actions. Digirati have significantly higher financial performance than their less digitally-mature competitors.
. Employees often have better digital solutions at home than they do at work, and many customers are more technology savvy than the people trying to sell to them.
Digital maturity is a combination of two separate but related dimensions. The first, digital intensity, is investment in technology-enabled initiatives to change how the company operates – its customer engagements, internal operations, and even business models. Companies in all industries are investing in interesting digital initiatives. However, in many firms, these investments are uncoordinated and sometimes duplicative.
Firms maturing in the second dimension, transformation management intensity, are creating the leadership capabilities necessary to drive digital transformation in the organization. Transformation intensity consists of the vision to shape a new future, governance and
4 “MIT/Capgemini Consulting Research Initiative 2014 “Embracing Digital Technology: A New Strategic
Imperative,” MIT Sloan Management Review 5 Leading social networks worldwide, as of August 2015, ranked by active users.
http://www.statista.com/statistics/272014/global-social-networks-ranked-by-number-of-users/ 6 Unique mobile users and world population figures from http://wearesocial.net/blog/2014/09/world-
mobile-phone/
There are
3.6 billion
unique mobile users globally or over half the world’s population

20 Business Technology Performance Index 2015/2016
engagement to steer the course, and IT/business relationships to implement technology-based change. The elements of transformation management intensity work together – through a combination of top-down leadership and bottom-up innovation –to drive ongoing digital transformation. However, in many companies, these elements are overly slow or conservative, preventing the company from investing in innovative opportunities.
The two dimensions spell out four different types of digital maturity as shown in the following exhibit. Companies in the lower left are Digital Beginners. These firms do very little with advanced digital capabilities, although they may be mature with more traditional applications such as ERP or electronic commerce. Though companies may be beginners by
choice, more often than not they are in this quadrant by accident. They may be unaware of the opportunities, or may be starting some small investments without effective transformation management in place.
Firms in the top left are Digital Fashionistas. These companies have implemented or experimented with many sexy digital applications. Some of these initiatives may create value, but many do not. While they may look good together, they are not implemented with the vision of gaining synergies among the items. Digital Fashionistas are motivated to bring on digitally-powered change, but the digital transformation strategy is not founded on real knowledge of how to maximize business benefits. Companies lacking enterprise-level governance may find they are in this quadrant at the corporate level, even if digital efforts are more mature in some business units.
Companies in the bottom right are Digital Conservatives. They favor prudence over innovation. Conservatives understand the need for a strong unifying vision as well as for governance and corporate culture to ensure investments are managed well. They are typically skeptical of the value of new digital trends, sometimes to their detriment. Though aiming to spend wisely, their careful approach may cause them to miss valuable opportunities upon which their more stylish competitors will pounce.
Firms at the top right are Digirati. They truly understand how to drive value with digital transformation. They combine a transformative vision, careful governance and engagement, with sufficient investment in new opportunities. Through vision and engagement, they develop a digital culture that can envision further changes and implement them wisely. By investing and carefully coordinating digital initiatives, they continuously advance their digital competitive advantage.
Exhibit 3. Digital Maturity

Banking | the way we see it
21
5. The Total Cost of IT Nearly 40% of BTPI survey respondents will be replacing their aging back office systems in the next 18 months. These legacy systems are, on average, 11 years old and lack robust workflow capabilities, advanced data analytics, portals and integrations to front-end and other systems required to deliver competitive solutions customers expect these days.
By looking at responses to the top three initiatives, we have a good idea of what our industry’s executives most want to see from their IT organizations. But for most organizations, more than half the time and resources are spent, not on innovative projects, but on ‘keep the lights on’ activities whose sole purpose is to prevent existing systems from breaking down. And sometimes the percentage is a lot higher than that.
This leaves only 30% for growth-oriented, innovation and transformational IT spending — investments that can boost a company’s financial performance and improve the customer experience. Most equipment finance leaders would like to see a reduction in spending to keep-it-running and turn their attention, and dollars, to the latter.
What is TCO and Why Does it Matter?
Total cost of ownership (TCO) calculates the direct and indirect costs of IT over its lifecycle. It's important because it gives a realistic picture of the true cost of IT, and from there it's possible to decide how to make IT expenditure most cost-effective.
Prior to the 2015 ELFA Operations and Technology Conference, a short survey was conducted to obtain some otherwise unavailable market comparisons, craft some benchmarks for IT leaders to use and get clarity around the level of IT spend. The findings of this Total Cost of IT survey are summarized in this section.
Keys to Manage IT Spend Effectiveness
Measuring the level of IT investment relative to business results is an important tool in developing and executing IT strategies and budgets. Industry analysts like Gartner and Forrester suggest financial services companies view IT investment against multiple measures of business volume and financial performance. Then analyze these as compared with various ratios of business efficiency and productivity.
For most organizations,
over half of IT time and resources are spent on ‘keep the lights on’ activities

22 Business Technology Performance Index 2015/2016
The four key financial services measures to understand relative effectiveness are:
IT Spend as Percent of Revenue
IT spending as a percent of revenue is the most recognized measure of total IT investment relative to top-line business results. The value of this measure is that it assists in identifying the competitiveness of investment levels relative to the most fundamental measure of business performance: revenue.
Exhibit 4. IT Spend as a Percentage of Revenue or Operating Expenses, Equipment Finance Companies versus Financial Services Industry
In the broader financial services industry, banks and other financial services organizations spend on IT at a rate of 6.3% of revenue. In our survey sample, the cost of IT as a percent of revenue ran from 2.6% to 7.2% with an average of 4.6% in 2014. At a 4.6% average, the sample population does appear favorable in relation to the financial services industry average at 6.3%.
IT Spend as Percent of Operating Expense
Equipment finance companies with a greater level of IT investment relative to operating expense view IT as a strategic enabler, and this can
IT Spend as Percent of Revenue
IT Spend per Company Employee
IT Spend as Percent of Operating Expense
Maintenance Expenses as a Percent of Overall IT
Spend
2.6%
7.2%
4.6%3.3%
24.9%
21.0%
0%
5%
10%
15%
20%
25%
30%
Low High Average
IT Cost as Percent of Revenue
IT Cost as Percent of Operating Expenses
Broad FS Index
Broad FS Index8.0%6.3%

Banking | the way we see it
23
improve business performance and productivity levels, especially over the long-run with sustained investment. In the broader financial services market, banks and other financial services organizations spend on average 8% of total operating expenses on IT.
In this survey sample, the cost of IT as a percent of operating expenses ran from 3.3% to 24.9% with an average of 21.0% in 2014. With a 21% average, our industry is higher than the 2014 Gartner financial services average of 8%. But IT expense investment — particularly innovation as opposed to maintenance — can be genuine strategic enablers.
IT Spend per Company Employee
IT spending per employee is often used to determine the amount of IT support the average organization’s work force receives. This measure helps to establish a link between IT investment and automation levels within the context of the workforce that it supports. An increase in IT spending per employee is often viewed as a negative trend. However, this may not always be the case. For information intensive enterprises, an increase in their figure for IT spending per employee may actually indicate a productivity improvement, due to automation or a high level of digital maturity.
In the broader financial services market, banks and other financial services organizations spend on IT at a rate of $25,088 per employee. In the survey the IT cost per employee range ran from $5,152 to $44,991 with an average of $39,252 for 2014.
Exhibit 5. IT Spend per Employee, Equipment Finance Companies versus Financial Services Industry
$5,152
$44,991
$39,252
$0
$10,000
$20,000
$30,000
$40,000
$50,000
Low High Average
IT Cost per Employee
Broad FS Index
$25,088

24 Business Technology Performance Index 2015/2016
Maintenance Expenses as a Percent of Overall IT Spend
Maintenance expense levels are critical to measure because they are generally more stable than total IT costs. It provides better comparisons over time within a firm and better comparisons between firms. By identifying the major categories of ongoing and repetitive spending, organizations can better target where they should focus their efforts to control this portion of the IT budget.
Exhibit 6. Maintenance as a Percent of IT Spend, Equipment Finance Companies versus Financial Services Industry
In the broader financial services market, banks and other financial services organizations maintenance as a percent of total IT costs average 72%. In the survey we found the maintenance percent of total IT spend ranged from 0% to 72% with an average of 55%.
Exhibit 7. IT Spend from Equipment Finance Companies versus the Financial Services Industry
Target Metric Low High Average Broad FS
Index
IT Spend as Percent of Revenue
2.6% 7.2% 4.6% 6.3%
IT Spend as Percent of Operating Expenses
3.3% 24.9% 21.0% 8.0%
IT Spend per Employee $5,152 $44,991 $39,252 $25,088
Maintenance as Percent of IT Spend
0% 72% 55% 72%
0%
72%
55%
0%
10%
20%
30%
40%
50%
60%
70%
80%
Low High Average
Maintenance as Percent of IT Costs
Broad FS Index
72%

Banking | the way we see it
25
Conclusions
Based on responses from the BTPI and Total Cost of IT surveys, Capgemini recommends that companies contemplate the following five concepts to improve their return on IT investment:
Separate ‘keep-it-running’ from ‘improve-the-business’ IT costs for budgeting, tracking, benchmarking and management purposes. Partition projects and IT activities separately into maintenance versus innovation based on the type and purpose of the project.
Aggressively drive ‘keep-it-running’ IT costs down each year. Closely monitor IT maintenance expenses and look for efficiencies. Absolute IT maintenance costs may increase driven by overall originations and/or portfolio outstandings or with inflation. But notable increases or increased percentages may signal a need for closer IT controls. Look for opportunities to offshore or outsource some aspects of IT to gain cost savings. Use outside contractors to explore how to lower maintenance costs and be more productive overall. Good maintenance management will provide a downward trend in maintenance as a percent of IT spend.
Manage ‘improve-the-business’ IT costs with the same rigor as you do non-IT expenditures for the same purpose.
Exhibit 8. Managing IT Costs
1
2
3

26 Business Technology Performance Index 2015/2016
Support IT in coming up with new ways to improve operating profit, including ideas to enable specific business processes to become more flexible, higher quality and lower cost.
Closely scrutinize the business cases of transformational IT and make sure that strategic and tactical, less-risky alternatives are considered.
To help facilitate improving return on IT investment, equipment finance companies should consider all internal, external and post project costs when contemplating a system replacement. Below is a checklist of costs to consider that can be used to help with the analysis:
Exhibit 9. System Replacement Cost Checklist
Internal Costs External Costs
Business Resources
Requirements
Vendor Selection
System Testing
Implementation
Training
IT Resources
Vendor Selection
Installation
System Configuration
Migration
Report Writing
Hardware
New Hardware
Software Provider
License
Implementation
Training
Implementation Partners
Configuration
Implementation
Training
Consultants
Business Process Definition
Migration
Post Project Costs
Maintenance and Support
Vendor Support
Internal IT Support
Internal Business Support
Releases and Upgrades
Releases
Upgrades
4
5

Banking | the way we see it
27
6. BTPI Survey Findings The core front end and back end systems were reported at an average life of 8.4 and 11 years respectively in terms of their time in use. Therefore, it is not all that surprising to see the replacement of the front and back end systems remains a top initiative for companies in the near future. Approximately 40% of respondents indicated a back end replacement would be considered in the next year and a half and a quarter of respondents indicated the front end would be looked at as well.
What Systems are Trending?
The trend away from custom solutions has continued and the data shows the majority of companies are more interested in establishing a single, enterprise-wide, package-based solution. Almost 40% of respondents reported interest in implementing best-of-breed solutions from multiple vendors.
Why are Companies Looking to Replace Core Originations & Servicing Systems?
The technology landscape of the equipment finance industry is evolving to pursue and incorporate the more innovative and fresh technological concepts available today. The contemporary focus on more data and quicker access to the data has the equipment finance industry looking into how best to satisfy the desire for more access. Modern applications will have better tools to take advantage of some of these technologies.
Front Office
Nearly half of the respondents indicated that their core front end system does not meet their future needs. So what may be missing and in which areas are companies looking to build out in the future? We continue to see a focus and desire to move toward a Process on the Fly7
The trend to the Internet of Things and the interconnectivity of systems, applications and devices seems to be a big deficiency in front office systems. Many respondents marked deficiencies in these areas. Even more noticeable, 60% of respondents reported at least one deficiency in
approach with approximately 40% of the respondents looking for increased workflow capabilities.
7 See section 2, Digital Transformation for more information on Process on the Fly
Approximately
40% of respondents are looking for increased workflow capabilities for front office

28 Business Technology Performance Index 2015/2016
one of these areas of integration and almost half (48%) reported multiple issues in integration to CRM, back office or other systems.
In addition to calling out missing pieces from front office integration, two thirds ranked themselves as either conservative or beginner when it comes to the Internet of Things and bringing pieces of the company together in an automated fashion.
Two other trends in the marketplace were seen as integral pieces missing from respondents’ front end: improved data management and analytics (big data) and cloud capabilities. Not only are they missing but a majority of respondents rank themselves in the lower half of the technology lifecycle adoption just like when it comes to integrations within the front office.
In regards to cloud computing, a quarter of respondents claimed it missing and 60% marked themselves low in the adoption of cloud technologies. Thirty five percent of companies called out data analytics and management as a deficiency in the front office and three quarters ranked themselves at the bottom of adoption lifecycle.
It seems that many equipment finance companies, while recognizing these features as important and the way forward, are waiting to see how leaders in technology adoption fare with tackling items such as big data, integrations and cloud capabilities.
Exhibit 10. Replacing Front & Back End Systems Remains a Top Priority

Banking | the way we see it
29
Back Office
When compared to the front office, a greater number of respondents stated that their current system would be able to meet their future needs but still 60% indicated they believed it would not. In fact 40% of respondents indicated that even today back end systems are not meeting their current needs. We notice similar issues in the back office that we saw on the originations side. The top features as indicated by respondents as missing from the back office are:
• Improved workflow capabilities (Process on the Fly) • Data analytics, data management, reporting (Thriving on Data8
• Partner/customer portal )
• Integrations to front office and other systems
We expect that these themes will be large factors as companies begin to look at implementing a new front or back office system.
Exhibit 11. What’s Missing from Back-Office Platforms?
Movement to Mobile
While slow, we have noticed that a shift has begun toward adapting increased mobile functionality. Despite 60% of companies still ranking themselves at the bottom of an adoption lifecycle when it comes to mobile devices and applications, there has been a movement toward offering a larger set of mobile capabilities. When looking at mobile areas, the ability of 2014 respondents to offer any of the below options were minimal and in four cases nonexistent. This year, we’ve seen exponential jumps in the following areas (numbers represent the increase year-over-year):
8 See section 2, Digital Transformation for more information on Thriving on Data
Approximately
60% of respondents say their core back office system cannot meet future needs

30 Business Technology Performance Index 2015/2016
• Request/view changes to all contract and asset information (4x) • Electronic presentment of documents/invoices (2x) • Execute documents electronically (3x) • Request support e.g. customer service or sales (2x)
Growth and adoption in the following areas has been seen despite previously little to no adoption in 2014:
• Request a funding under a line of credit or master agreement • View cross-sell product offerings • Make payments or view payment history • View balance and payoff quote information
Even in 2015 adoption has been low with no more than a quarter of respondents having the mobile capabilities listed above. However the movement to take these initiatives on is clear. Almost half of respondents have indicated this is a best-in-class offering they have planned for the future so the expectation is that the numbers will continue to grow when it comes to mobile capabilities in the equipment finance technology landscape.

Banking | the way we see it
31
7. Technology Trends 2014 versus 2015 Before we compare the technology trends of this year against 2014, let’s do a quick recap of what our findings were in that year. In last year’s BTPI survey results we asked respondents where their organization fell on the technology adoption lifecycle for six specific digital initiatives:
• Mobile devices • Mobile applications • Cloud computing • Big data
• Internet of Things; interconnectivity of devices and physical items
• Advanced analytics
We found that about two third of all respondents had implemented none or one of these initiatives, showing the beginner classification (slow adoption and/or skepticism towards more advanced digital technologies) still being the bulk of organizations. Although many organizations had not yet fully adopted and implemented digital transformation, it appeared to be on the mind of respondents and was considered a priority.
If we look at this year’s results, we can see our respondents losing some confidence in their systems capabilities in different areas (e.g. customer relationship management or customer self service capabilities via mobile technology). So why did some of the numbers drop? Shouldn’t we expect to see these numbers improve as the years pass? Each year’s numbers can of course differ based on participating candidates; however we can derive some patterns.
Last year we mentioned that the awareness of system limitations is growing and this growth goes in harmony with the explosion of today’s (and tomorrow’s) technologies. The extensive list of vendors who are expanding their applications and services – including cloud –also plays into this. Exposure to the expansive catalog stimulates companies to reflect on their current business process and/or supporting systems. Following a growing demand for mobile and cloud solutions, some of these reflections are raising eyebrows and wallets are being drawn to keep up and stay ahead of the competition.
Our respondents find that the biggest limitations are in their customer relationship management (CRM), customer self service via mobile technology, employee and partner mobility, and cloud technology capabilities. Initiatives for improving these areas are considered non-existent or in very early stages. Looking at the six digital initiatives from

32 Business Technology Performance Index 2015/2016
last year (shown above), it is evident that at least four of these trends are very much existing today as the survey pattern overlaps last year’s trends. With the measurement being only two years, these initiatives seem to be beginning to simmer. Companies are on the lookout for new systems and are talking to both system vendors as well as system integrators for advice as evidenced during a recent Q&A session at the ELFA Operations & Technology conference.
Our conclusion is that for this year’s technology trends we are very much following a path that was set last year. Mobile and cloud capabilities are visible all around us, whether on a social or professional level, and we expect these area to continue to grow for years to come.

Banking | the way we see it
33
8. Capgemini Point of View For most equipment finance companies, the focus on digital transformation to date has been on closing front office gaps albeit those innovations have been slow to market. For example, increased mobile capabilities and cloud computing are in the early stages of adoption.
In our 2014/2015 BTPI report, we had stated that in our point of view, equipment finance companies needed to consider the digitization of their back-end processes, operations and platforms. The shift of focus to the back office is now ever-present in the industry with companies becoming more quickly and perhaps equally or more concerned about their back office systems and processes than the front-end. These back office systems and process are antiquated, operationally inefficient and a product of disconnected silos — all things that result in a significantly negative customer experience.
We are not suggesting though that equipment finance companies lose sight of closing the front office gaps while exploring the back office. Companies will need to strike a delicate balance between closing the digital transformation gaps for both the front and back office and ensure that one is not being sacrificed for the other. Companies that leverage a sound digital strategy and approach across the board will gain significant competitive advantage and ultimately drive operational efficiencies and better financial results.
Equipment finance companies need to strike a delicate balance between closing the digital transformation gap for both front and back office

34 Business Technology Performance Index 2015/2016

Banking | the way we see it
35
9. BTPI Survey Response Statistics The following section of the report provides a summary of the 28 responses to the survey. Since respondents did not always provide information for each question, each table in the survey may have a different number of respondents. Due to rounding, total percentages do not always equal 100.
2015 BTPI Survey
Response Percent Response Count
Bank 42.9% 12
Captive 7.1% 2
Independent, Financial Services 50.0% 14
Response Percent Response Count
Micro Ticket 10.7% 3
Small Ticket 46.4% 13
Mid-Ticket 42.9% 12
Large Ticket 0.0% 0
The following 12 questions focus on the respondents’ rating of internal capabilities in terms of IT and Operations abilities. The respondents were asked to rate each area based on the following table of maturity definitions:
Initial Ad-hoc processes. Systems not industry standard and do not cover the entire leasing lifecycle. Widespread use of Excel and stand-alone, nonintegrated systems and tools.
Repeatable Core processes established, although inefficient. Duplication of data entry prevalent. Core systems integration with supporting systems is non-existent or poorly executed. Front-end and back-end platforms have limited interface. Reporting is manual and ad-hoc. Organization is dependent on good people, not good processes and systems.
Defined Processes are documented, standardized and well integrated with core systems. Some consideration of processes and systems is given prior to new market entry or new program development. Workflow drives processes. Two-way integration between front-end and back-end platforms. Partners are linked in through the web for new business origination.
Managed KPIs and metrics established for processes. Systems and processes drive financial offerings. Web presence extends to partners and customers and covers a wide range of front-end and back-end capabilities. Manual data entry is minimized or outsourced, focusing internal resources on analysis and customer serving activities.

36 Business Technology Performance Index 2015/2016
Optimizing Continuous processes improvement. Processes and systems have become a competitive advantage for business. Financial products are highly integrated with processes and systems and some aspects of them are difficult to duplicate by competitors. Customers and markets drive system investments.
4a. How would you rate your company’s customer relationship management (CRM) capabilities?
Rating Percentage of Respondents
Initial 22%
Repeatable 30%
Defined 22%
Managed 9%
Optimizing 17%
4b. How would you rate your company’s new business processing capabilities?
Rating Percentage of Respondents
Initial 4%
Repeatable 17%
Defined 40%
Managed 17%
Optimizing 22%
4c. How would you rate your company’s back end portfolio servicing capabilities?
Rating Percentage of Respondents
Initial 9%
Repeatable 9%
Defined 43%
Managed 30%
Optimizing 9%
4d. How would you rate your company’s collections and customer service capabilities?
Rating Percentage of Respondents
Initial 13%
Repeatable 13%
Defined 30%
Managed 31%
Optimizing 13%
Banking | the way we see it
37
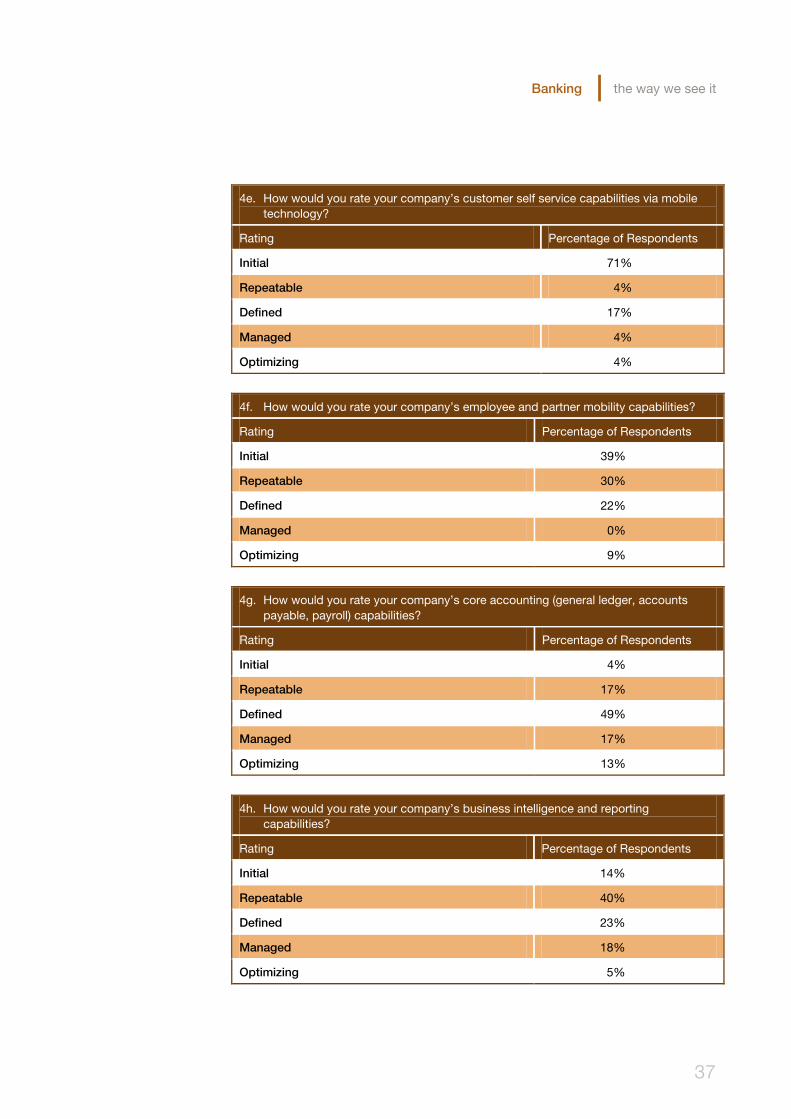
4e. How would you rate your company’s customer self service capabilities via mobile technology?
Rating Percentage of Respondents
Initial 71%
Repeatable 4%
Defined 17%
Managed 4%
Optimizing 4%
4f. How would you rate your company’s employee and partner mobility capabilities?
Rating Percentage of Respondents
Initial 39%
Repeatable 30%
Defined 22%
Managed 0%
Optimizing 9%
4g. How would you rate your company’s core accounting (general ledger, accounts payable, payroll) capabilities?
Rating Percentage of Respondents
Initial 4%
Repeatable 17%
Defined 49%
Managed 17%
Optimizing 13%
4h. How would you rate your company’s business intelligence and reporting capabilities?
Rating Percentage of Respondents
Initial 14%
Repeatable 40%
Defined 23%
Managed 18%
Optimizing 5%

38 Business Technology Performance Index 2015/2016
4i. How would you rate your company’s compliance and controls capabilities?
Rating Percentage of Respondents
Initial 13%
Repeatable 17%
Defined 36%
Managed 30%
Optimizing 4%
4j. How would you rate your company’s enterprise risk management abilities: liquidity, operations, credit, residual value, reputation, and market risk?
Rating Percentage of Respondents
Initial 13%
Repeatable 30%
Defined 22%
Managed 26%
Optimizing 9%
4k. How would you rate your company’s cloud technology capabilities?
Rating Percentage of Respondents
Initial 44%
Repeatable 13%
Defined 22%
Managed 17%
Optimizing 4%
4l. How would you rate your company’s integration of systems (internal and/or third party)?
Rating Percentage of Respondents
Initial 9%
Repeatable 34%
Defined 22%
Managed 22%
Optimizing 13%

Banking | the way we see it
39
The following questions focus on the respondents’ rating of future capabilities in terms of IT and operations abilities.
5. Please identify the top 3 key IT related initiatives you will undertake within the next 18 months:
Service Count %
Back end (servicing) system replacement 9 39%
Portal for partners 7 30%
Front end (originations) system replacement 6 26%
Consolidate multiple front end platforms 5 22%
Build or improve systems integrations 5 22%
Process efficiency improvement initiative 5 22%
Integration of systems (internal and/or third party) 5 22%
360 degree view of customer / CRM 4 17%
Business intelligence improvements 4 17%
Expand financial product offerings 3 13%
Compliance improvement initiatives 3 13%
Customer self service (including web, mobile, phone) 2 9%
Business process management (automation of workflow) 2 9%
Electronic signature solutions 2 9%
Consolidate multiple back end platforms 1 4%
Buy or build business specific applications 1 4%
Invoicing / payment processing initiative 1 4%
Outsourcing of processes 1 4%
Risk management initiatives focused on credit, residual value, l iquidity or Interest rate risk
1 4%
Cloud technology 1 4%
6. In today’s environment Social, Mobile, Analytics and Cloud (SMAC) plays a key role in becoming a truly digital enterprise. Where do you see your company in terms of the following key drivers?
Social Social media allows for rapid sharing and creation of knowledge over social networks, which enhance collaboration and information distribution across an equipment finance company.
Mobile Mobile capabilities have become one of the first communication channels that come to mind (i.e. phones and tablets). They can provide an alternate way for equipment finance companies to connect with customers, business partners and employees.

40 Business Technology Performance Index 2015/2016
6. In today’s environment Social, Mobile, Analytics and Cloud (SMAC) plays a key role in becoming a truly digital enterprise. Where do you see your company in terms of the following key drivers?
Analytics (Big Data)
Big data analytics refers to the process of collecting, organizing and analyzing large sets of data to discover patterns and useful information.
Cloud Cloud technology provides equipment finance companies with various capabilities to store and process their data in third-party data centers. It relies on the sharing of resources to achieve coherence and economies of scale.
6. Social, Mobile, Analytics and Cloud Capabilities
7. There has been a constant movement to deliver IT projects and solutions faster to reduce time to market. Which of the following do you leverage as tools to deliver IT projects and solutions faster?
30%
9% 9%
35%
13%
43%
30%
13%
0%
9%13%
9%
52%
26%
43%
30%
4%
13%
4%
13%
0%
10%
20%
30%
40%
50%
60%
Social Mobile Analytics Cloud
Not planning at this time Plan to partially migrate over the next 2 yearsPlan to fully migrate over the next 2 years Partially adoptedFully adopted
0% 20% 40% 60% 80% 100%
Never Sometimes Always
Dedicated project resources vs. using staff with day-to-day responsibilities
Applications development & production support (dedicated teams)
Robust project prioritization methodology
Deploy configurable applications
Cloud solutions
Levering business resources for technical configuration
Organized innovation teams
Service-oriented architecture
Use of Agile methodology

Banking | the way we see it
41
8. Number of years using front-end system
Average 8.4
9. Please identify the top 3 features missing in your front-end systems
Note: Results represent the percentage of respondents who selected the feature as one of their top 3
10. Number of years using back-end system
Average 11.0
11. Please identify the top 3 features missing in your back-end systems
Note: Results represent the percentage of respondents who selected the feature as one of their top 3
26%
17%
35%
39%
30%
35%
30%
22%
22%
30%
0% 10% 20% 30% 40% 50%
Cloud capabilities
Compliance controls / monitoring
Improved data analytics / data management
Improved workflow capabilities
Integration to a CRM
Integration to back office
Integration to other systems
Mobile capabilities
Partner or customer portal
Performance improvements
22%
17%
43%
26%
22%
30%
22%
39%
13%
48%
0% 10% 20% 30% 40% 50% 60%
Asset management / asset level invoicing
Cloud capabilities
Data analytics / data management / reporting
Front office integration
GUI interface
Integration to other systems
Mobile capabilities
Partner / customer portal
System documentation
Improved workflow

42 Business Technology Performance Index 2015/2016
12. Your customers can perform the following via the web, mobile device or other self-service technology?
Note: Respondents could select more than one response
13. Please specify your level of agreement or disagreement with the following statements as they pertain to your organization?
14. For your core, front-end origination and back-end servicing system applications, your company's preference tends toward?
Note: Respondents could only select one preference
0% 20% 40% 60% 80% 100%
Other self-service technology Mobile device Via the web
View cross-sell product offerings
Request support (customer service, sales)
Request a funding under a line of credit or master agreement
Execute documents electronically
View balance and payoff quote informationMake payments or
view payment historyElectronic presentment of
documents or invoicesRequest or view changes to all contract and asset information
0%
20%
40%
60%
80%
100%
Core back-end system(s) meet current needs
Back-end system(s) meet
future needs
Core front-end system(s) meet current needs
Front-end system(s) meet
future needs
Somewhat AgreeAgreeStrongly AgreeSomewhat DisagreeDisagreeStrongly Disagree
56.5%
39.1%
4.3%
Purchasing an enterprise wide, package based solution from a single vendor
Purchasing best of breed package based solutions from multiple solution providers
Building a custom application(s) tailored to your company needs

Banking | the way we see it
43
15. What are the top 3 offerings/capabilities that your customers are demanding but you are unable to provide at this time?
Note: Results represent the percentage of respondents who selected the offering as one of their top 3
16. What barriers are you encountering in fully providing these offerings to your customers?
Note: Respondents could select more than one response
18%
27%
9%
18%
5%
32%
36%
18%
27%
18%
18%
18%
32%
0% 10% 20% 30% 40%
Online application submittal
Online credit decisioning
Instant online quote
Support for mobile devices
Ability to price deals themselves
Online execution of documents
Online payment capabilities
Online billing statements
Customizable reporting formats
Access to asset management …
Asset level invoicing
Ability to view payment history …
Ability to obtain buyout quote online
45.5%
54.5%
63.6%
40.9%
18.2%
31.8%
27.3%
0% 20% 40% 60% 80%
Overall complexity
Limited and/or lack of internal expertise
Lack of business support
Inability to integrate with current technology
Other competing priorities
Resource availability
Financial cost

44 Business Technology Performance Index 2015/2016
17. Top organizations in financial services have enabled certain capabilities in order to deliver best in class service to their customers. Please identify your current delivery capability for each of the following:
18. Where does your organization fall on the technology adoption life-cycle for the following digital initiatives?
0% 20% 40% 60% 80% 100%
No plan to provide capability at this time Planned future capability Partially available Fully available
Integration of systems (internal and/or third party)
Cloud technology
Customized customer product & service offerings
Enhanced customer reporting capabilities
Deliver product and services info via social media channels
Mobile device capabilities
Robust web-enabled customer self-service channel
360 degree view of the customer across your organization
0% 10% 20% 30% 40% 50% 60% 70% 80% 90% 100%
Beginner Conservative Aggressive Market Leader
Advanced analytics
Internet of Things
Big data
Cloud computing
Mobile applications
Mobile devices

Banking | the way we see it
45
About the Report The 2015/2016 BTPI is the latest report in a series of publications on business trends, systems and technology available through the ELFA, the Equipment Leasing and Finance Foundation (ELFF) and Capgemini. Focusing specifically on trends in technology and operations and the adoption of these trends, the BTPI serves as the equipment finance industry’s benchmark for information technology, operations direction, and spending in both areas.
Presented in the report are a summary of BTPI survey responses and a discussion of key findings. Also provided are insights into the continuing evolution of technology in the equipment finance marketplace collected from outside research, including the MIT/Capgemini Consulting Research Initiative 2014 “Embracing Digital Technology: A New Strategic Imperative,” MIT Sloan Management Review and Gartner, Inc.’s “Top Ten Strategic Technology Trends for 2014.”
The BTPI was written and compiled by Capgemini during the period August through October 2015. It is based on industry research and responses from 27 participants representing bank, captive and independent finance companies across a spectrum of ticket sizes, market approaches and geographies. Most respondent companies are members of the ELFA. Other ELFA resources were also used to support the research, analysis and conclusions found in this report.
Participation in the BTPI is voluntary and free of charge. All equipment finance companies were welcome to participate, and were invited to provide survey responses through an online survey. Those who participated received a free advance copy of the report before formal introduction of the report occurred at the 2015/2016 ELFA Annual Conference in October.

46 Business Technology Performance Index 2015/2016
About the Authors Authors of the 2015/2016 BTPI are members of Capgemini’s Banking and Diversified Financials practice. This group focuses on the equipment leasing and finance market and works daily with equipment finance companies to help them create more efficient and profitable operations. With more than 180,000 people in over 40 countries, Capgemini is one of the world's foremost providers of consulting, technology and outsourcing services, reporting 2014 global revenues of €10.573 billion.
The authors would like to thank all participating companies and Capgemini associates who assisted with this report. They would also like to acknowledge and thank Ralph Petta, Bill Choi, and Amy Vogt of the ELFA as well as Dave Weiner of the Alta Group and Jeff Lezinski of Odessa Technologies for their contributions in this year’s report. They were instrumental in ensuring that this effort receives appropriate coverage, exposure and industry participation.
Steve Byrnes is the global subject matter leader for Capgemini’s Banking and Diversified Financials practice. His professional experience includes more than 30 years of direct employment in, and consulting to, the equipment finance industry. He is a results oriented leader who uses his finance, operations and technology background to assist companies with transformational initiatives that range from business and IT strategy and organization assessment, through to the implementation of systems and processes required to execute those strategies. Steve holds a Master of Banking and Finance from Hofstra University and a B.B.A. in Accounting from Dowling College.
Michael Donnary is a Principal in Capgemini’s Global Financial Services business unit, and a leader of the Banking and Diversified Financials practice covering asset, auto, banking and captive finance. From our Chicago office, Michael has major client delivery and industry domain responsibilities for the practice. He has over 17 years of experience consulting to the asset and captive finance industry. He is the immediate past chair of the Equipment Leasing and Finance Association Operations and Technology Committee, a regular industry speaker, author of numerous industry articles and holds a degree in Business from Northern Illinois University.

Banking | the way we see it
47
Michael Baez is a Delivery Manager in Capgemini’s Global Financial Services business unit, and a subject matter specialist in credit risk and business process re-engineering. For over 30 years, he has worked extensively in the financial services industry with global experience in asset finance, credit risk, corporate treasury, cash and wealth management, process and risk management, operations and technology. He received both his undergraduate and post-graduate education at Long Island University.
Jeff Boots is a Delivery Manager in Capgemini’s Global Financial Services business unit, and a subject matter specialist in U.S. and international business processes and project delivery in the Banking and Diversified Financials practice. Jeff has worked with technology solution providers and industry clients for the past 16 years, working and living in the U.S. and Europe. He received his education at Concordia College.
Christine Williams is a Senior Manager in Capgemini’s Global Financial Services business unit, and a subject matter specialist in lease and loan accounting in the Banking and Diversified Financials practice. She has consulted to clients in multiple industries over the past 22 years and has co-authored several industry studies. She received her education at the University of Minnesota.
Josh Bridge is a Delivery Manager in Capgemini’s Global Financial Services business unit, and a subject matter specialist in the originations process. For the past decade, he has worked in industry and with an extensive number of diversified finance clients to help deliver complex business and technology projects. He is a former member on the ELFA’s Service Provider Committee, and former member of ELFA’s FLL Committee.

48 Business Technology Performance Index 2015/2016
Jason DePew is a Lead Consultant in Capgemini’s Global Financial Services business unit, and a subject matter specialist in business process re-engineering and project delivery in the Banking and Diversified Financials practice. Jason has worked in the financial services industry for over a decade with experience in asset finance, process and risk management. He received his education at Waynesburg College.
Bryan Parfitt is a Lead Consultant in Capgemini’s Global Financial Services business unit, and subject matter specialist in complex business analysis in diversified finance, technology platforms, and credit risk. For the past 10 years with Capgemini, he has helped to lead delivery in business streams for an extensive number of banking and captive finance clients in the U.S. and Canada.
Shanty Singh is a Lead Consultant in Capgemini’s Global Financial Services Business Unit, and subject matter specialist in BPM, core banking, payments and credit management. For the past seven plus years with Capgemini, he has worked with a broad set of international banking and diversified finance clients in global delivery roles and acts as a BPM facilitator to new hires. In his 15 years of experience, he has fulfilled project delivery lead roles in Europe, North America and the Middle East.
Dieter De Schrijver is a Senior Consultant in Capgemini’s Global Financial Services Business Unit. Since Dieter joined Capgemini in 2010, he has been working as a business analyst, Scrum master/product owner for different large financial firms in Belgium, Canada and the U.S. Having both a technical and business background, he uses Scrum and efficient requirement management at the intersection of banking and technology. In his spare time, Dieter does extensive research in new innovations in payments and banking, more recently in cryptocurrencies, blockchain technology and smart contracts.

Banking | the way we see it
49
Sandra Brittijn is a Lead Consultant in Capgemini’s Global Financial Services Business Unit, and subject matter specialist in the areas of change and business process management, project management, as well as business analysis. She has strong global experience having worked on various large-scale international projects across the Netherlands, Canada and the U.S. For the past nine years with Capgemini, she has fulfilled project delivery lead roles for a large number of banking and captive finance clients in the domains of core banking, diversified finance, payments, and cards.
Taylor Williams is a Consultant in Capgemini’s Global Financial Services Business Unit. Taylor has over three years experience working in the finance industry. His experience draws from having worked for several companies and client engagements ranging from asset finance to bank leasing. He has worked for Capgemini for the past year after previously having worked for two wealth management companies as a client services associate. He received his education from the Georgia Institute of Technology.

Learn more about the Business Technology Performance Index at
www.capgemini.com/btpi or contact us at [email protected].
About Capgemini
Now with 180,000 people in over 40 countries, Capgemini is one of the
world’s foremost providers of consulting, technology and outsourcing services. The Group reported 2014 global revenues of EUR 10.573 billion. Together with its clients, Capgemini creates and delivers business, technology and digital solutions that fit their needs, enabling them to achieve innovation and competitiveness. A deeply multicultural organization, Capgemini has developed its own way of working, the Collaborative Business Experience™, and draws on Rightshore®, its worldwide delivery model.
Learn more about us at www.capgemini.com/banking or e-mail
[email protected] The information contained in this document is proprietary. ©2015 Capgemini. All rights reserved. Rightshore® is a trademark belonging to Capgemini.