domestic uk retrofit challenge: current performance and barriers leading into the green deal dr mark...
TRANSCRIPT

Domestic UKRetrofit Challenge:
Current performance and barriers leading into the Green Deal
Dr Mark Dowson
Mr Adam Poole

Presentation Overview
Overview of domestic UK retrofit challenge
General barriers to retrofitting
Specific challenges for the Green Deal
Outputs of internal business modelling / ‘war-gaming’ workshops

UK Retrofit Challenge
UK must reduce its CO2 emissions by 80% by 2050 (against 1990 baseline)
Over a quarter of current emissions are attributed to the 26 million homes in the UK
Approximately 80% of the homes we live in today will still be in use in 2050

UK housing stock
CLG. 2001. English house condition survey - supporting tables, profile of the stock, table a1.3 dwelling type by age category, raw statistics available online.

UK housing stock
millions of terracehouses built before the 1930s
CLG. 2001. English house condition survey - supporting tables, profile of the stock, table a1.3 dwelling type by age category, raw statistics available online.

UK housing stock
millions of terracehouses built before the 1930s
millions of semi-detached houses built after the war
CLG. 2001. English house condition survey - supporting tables, profile of the stock, table a1.3 dwelling type by age category, raw statistics available online.

UK housing stock
millions of terracehouses built before the 1930s
millions of semi-detached houses built after the war
millions of flatsbuilt in the 1960s
Solid walls werecommon until 1930s
Cavity walls introducedto prevent dampness
Only in the 1976 Building Regulationswas insulation a legal requirement
CLG. 2001. English house condition survey - supporting tables, profile of the stock, table a1.3 dwelling type by age category, raw statistics available online.

Thermal efficiency of the stock
CLG. 2006. Review of sustainability of existing buildings, raw statistics available online.

Thermal efficiency of the stock
Millions of homes built before Building Regulations have lowest energy efficiency
CLG. 2006. Review of sustainability of existing buildings, raw statistics available online.

Hard to treat stock
BRE. 2008. A study of hard-to-treat homes using the English house condition survey, Part 1 – dwelling and household characteristics of hard-to-treat homes

BRE. 2008. A study of hard-to-treat homes using the English house condition survey, Part 1 – dwelling and household characteristics of hard-to-treat homes
Hard to treat stock

8 million homes in England are not fully double glazed
Utley J and Shorrock LD. 2008. Domestic energy fact-file 2008, Building Research Establishment, BRE press, Watford, UK.

BRE. 2008. A study of hard-to-treat homes using the English house condition survey, Part 1 – dwelling and household characteristics of hard-to-treat homes
Up to 14 million homes have double glazing installed over 20 years ago

Barriers to retrofitting
Up to 1.2 million homes are in conservation areas
Up to 300,000 homes are listed
Added cost, disruption, time, planning issues and technical expertise (e.g. moisture control) required to improve these properties
Boardman B, Darby S, Killip G, Hinnels M, Jardine C and Palmer J. 2005. 40% house, University of Oxford, Environmental Change Institute, Oxford, UK

Barriers to retrofitting
Discrepancies between predicted and actual savings• UCL1 modelled the predicted energy savings of 1372 dwellings retrofitted with loft and
cavity wall insulation. 49% energy savings were predicted across the stock. In reality the average savings were 10% in central heated homes and 17% in homes without central heating.
Combination of gaps in insulation and thermal comfort “take-back” (i.e. occupants raising the temperature of their homes after the refurbishment) reduced energy savings by up to 39%.
Hong, S., Oreszczyn, T., Ridley, I., 2006. The impact of energy efficient refurbishment on the space heating and fuel consumption in English dwellings

Barriers to retrofitting
Uncertainty regarding capital costs & payback periods
Not all properties and/or occupants qualify for grants
Too much insulation could cause summertime overheating
UKGBC. 2008. Low carbon existing homes, United Kingdom Green Building Council

Barriers to retrofitting
Industry does not have the capacity to retrofit all solid walled homes by 2050• ~180,000 installations/year required to retrofit all 6.6 million by 2050
• EEPH estimate the industries maximum capacity is 15,000-20,000 installations/year
• Capacity (and expertise) must increase 10 fold.
Energy efficient partnership for housing 2008. The insulation industry, working in partnership with government to insulate the existing housing stock by 2050

Barriers to retrofitting
Lack of public incentives and marketing
Energy efficiency not viewed as a priority when upgrading homes
Lack of incentives for landlords (if tenants are reaping the benefits)
UKGBC. 2008. Low carbon existing homes, United Kingdom Green Building Council

Specific challenges for the Green Deal
All of the above, plus more!
Lack of public engagement with scheme – low penetration rates in early trials• Only 4.8% of customers signed up to Affinity Suttons “FutureFit” project (resembling the Green
Deal finance mechanism) in 2011. A further 23% of people dropped out before retrofit works.
• B&Q offered a 40% grant to clear out a homeowners loft and install loft insulation. Out of 400 homes that expressed interest, only 126 went ahead with an energy audit and only 66 went ahead with the retrofit works. Follow up surveys revealed that people who dropped out followiing the audit were sceptical that long term savings would be achieved.
Specific challenges for the Green Deal
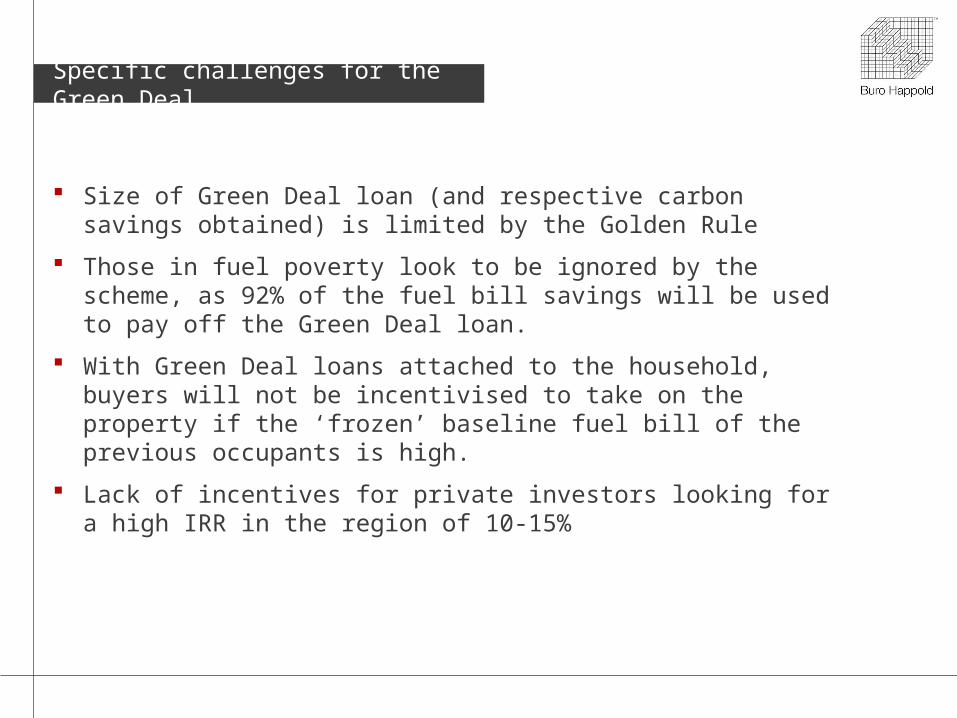
Size of Green Deal loan (and respective carbon savings obtained) is limited by the Golden Rule
Those in fuel poverty look to be ignored by the scheme, as 92% of the fuel bill savings will be used to pay off the Green Deal loan.
With Green Deal loans attached to the household, buyers will not be incentivised to take on the property if the ‘frozen’ baseline fuel bill of the previous occupants is high.
Lack of incentives for private investors looking for a high IRR in the region of 10-15%

Cost effectiveness of measures
Investors will want to target low hanging fruit
Lack of incentives for measures with long paybacks
Shorrock L, Henderson J and Utley J. 2005. Reducing carbon emissions from the UK housing stock, raw statistics available online

What does all of this mean?
Complex agenda and a very challenging target
A lot of technical expertise is required
A greater appreciation for marketing and public engagement
Better understanding of investor incentives required
How the finance market will operate in a competitive situation
Shorrock L, Henderson J and Utley J. 2005. Reducing carbon emissions from the UK housing stock, raw statistics available online

War-gaming the Green Deal

War-gaming the Green Deal
Q: What does a policy look like that has not been wargamed?
A: Lansley’s Health Service reforms
Interested in policy and what goes wrong

Untended Consequences
Effect of competition
Why

Leading companies use war games to focus better on their competitors, while improving the way they identify, shape, and seize opportunities to innovate.
You thought you did everything right—gathered market research and consumer insights; brainstormed, prototyped, and tested a promising new idea; developed detailed financial models and a solid marketing plan. Yet your company’s new product or service didn’t perform as expected. What did you overlook?
If you answered “the competition,” you’re far from alone. In our experience, companies making decisions about developing and launching new products commonly fail to anticipate their rivals’ motivations and actions. Moreover, the failure often contributes to innovation-related disappointments, many of which are below the radar and quite insidious: your rival, for example, discounts prices to encourage customers to stock up on its product rather than try yours, ties up distributors so you can’t get shelf space, or duplicates your service to dissuade consumers from switching.
https://www.mckinseyquarterly.com/Strategy/Strategy_in_Practice/Battle-test_your_innovation_strategy_3038
Battle Test Your Innovation Strategy

By borrowing from the military
Forces/investments are assembled
Each sides’ objectives can only be guessed at
There is negotiation and subterfuge
Unforeseen things happen
They do ‘battle’
There is an outcome
People may or may not live to invest another day
How to anticipate rivals’ motivations and actions?

Wanted to ‘reverse engineer’ the business game concept
Wanted something difficult• Multiple stakeholders• Widely different objectives• Unsteady coalitions• Endless negotiation• Ambitious wrecking agenda
Wargaming the Green Deal

This was everything we knew about the green deal
Verified by insiders
We started with a briefing book

Green Deal – Where to focus
Government Energy Companies Banks Selling Training
Accreditation
Assessment Warranties Manufacturing Innovation InstallationUser behaviour

In a universe of fictitious energy companies, retailers and banks
Between each company’s main board and its Green Deal Department
Within alliances between 1 energy company, 1 retailer and 1 bank (a consortium)
Between consortia
Between government and consortia
Where the action takes place

Consortium members are required to keep the alliance together while
Producing & presenting a business plan
Negotiating around differing attitudes to risk, reward and return
Managing cashflow and the supply chain
Pursuing individual rather than group victory
Competing with other consortia • over particular segments of the market • and parts of the supply chain
Identifying lobbying positions to get government to change the rules
Coping with changing external events such as the oil price,
The Process
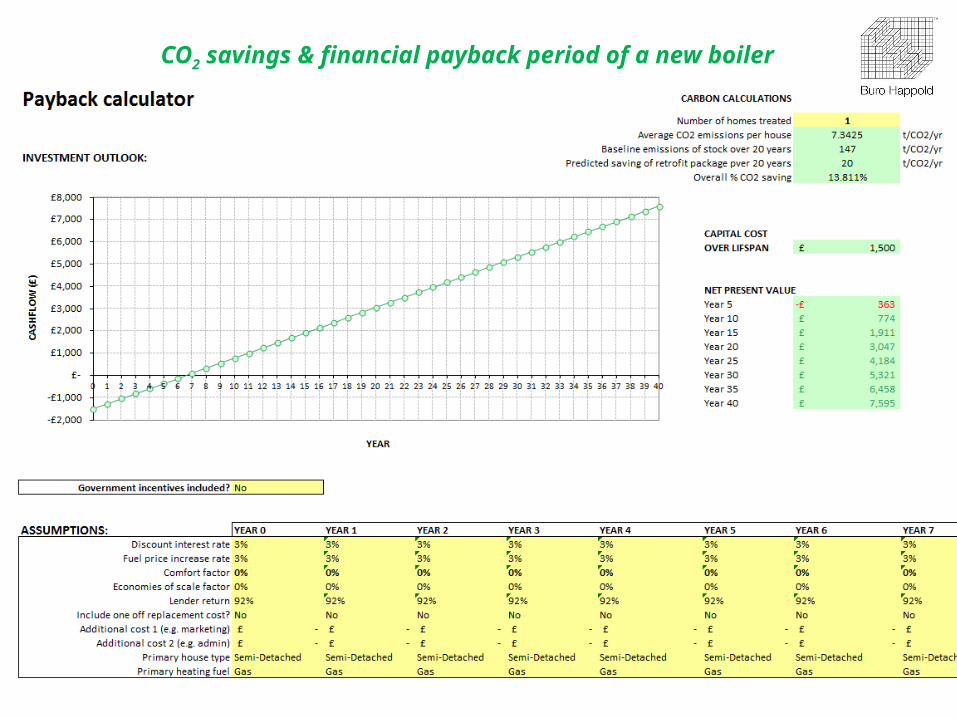
CO2 savings & financial payback period of a new boiler

Impact of fuel price rises

Impact of thermal comfort take-back

Impact of one-off replacement

500 homes with insulation, new glazing, new boiler, PV panels & solar thermal

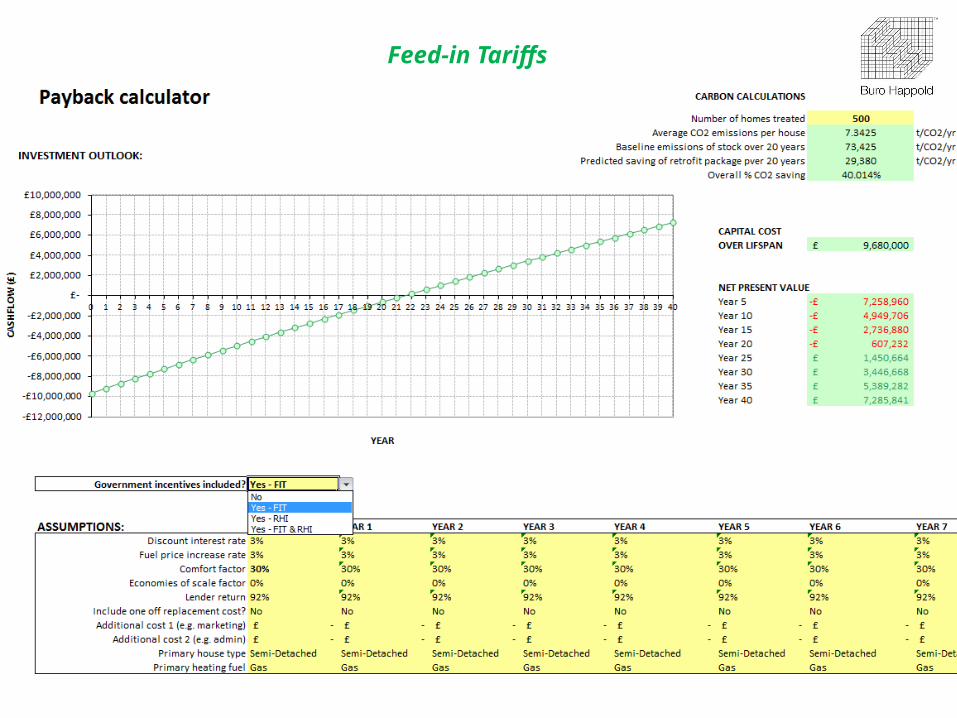
Feed-in Tariffs

Feed-in Tariffs & Renewable Heat Incentive

Reduced capital costs from economies of scale

Marketing & Admin costs

Repeat investment over next 5 years

Net present value of all measures

Involves a number of assumptions, particularly• household sales conversion rates• required internal rates of return (11+%)
Involves chance events and randomised outcomes so illustrative than predictive
Scope for Machiavellian gaming verified by energy insiders
We have run 4 teams that have produced a range of outcomes that are pretty similar
How accurate is the process?

Who took part: 24 engineers / MBAs / students + industry people
Results reflect team modelling exercise – this is what they report back to their boards
Not yet made the scheme work for the game parameters we have set:• IRR targets, • amount of capital • conversion rates
This process is generating a series of useful policy suggestions
Results

Results: Round 1
IRR: 6.52%, spent 84% of funds
IRR: 6.52%, spent 84% of funds
IRR: 8.54%, spent 81% of funds
IRR: 3.61% overspent funds by 485%
World may change at this point: Saudi says it will stop exporting oil
Energy companies are being invited to sell substantially less product
Doesn’t work with cost of money
How ECO funding gets spent looks to be poorly policed
Effort being put into increasing demand while leaving supply unaddressed
Suppliers have created a monopoly vehicle
Everyone went after the low-hanging fruit.
There is an endgame: where you are when the scheme might be rescued
Conclusions

And not forgetting..
Non-domestic stock accounts for a further 20% of UK CO2 emissions
Over half of the stock constructed before Building Regulations

Journal paper with more information >>>>
(Search “Green Deal” on www.sciencedirect.com)
Thanks for listening.
Office telephone: 020 7927 9700