dominic harrison - final year research project
TRANSCRIPT

THE ATTRIBUTION OF FUND SELECTION ON REDUCING
VOLATILITY Final Year Research Project
N0424662 - Dominic Harrison
BA (Hons) Business Management and Accounting and Finance
2
N0424662 | Attribution of Fund Selection on Reducing Volatility | Research Project 2016
Acknowledgements This research paper is made possible through the help and support of a number
of individuals, organisations and Nottingham Trent University.
First and foremost, I would like to thank Ivan Whiston for his support and
encouragement. He kindly acted as the sole academic advisor and offered
invaluable, detailed advice on every aspect of the paper’s structure and focus.
Secondly, I would like to thank my close family and friends for their help and
support throughout the completion of this project.
Finally, this paper would not have been possible without the support of DB Wood
Limited. The use of the company’s financial analytics software enabled the
production of all charts produced and the incorporation of three of the company’s
portfolios helped to provide the context for the research. Special thanks to Alex
Chappell, who inspired the choice of research questions and acted as a key advisor
throughout.

3
N0424662 | Attribution of Fund Selection on Reducing Volatility | Research Project 2016
Abstract This paper provides a new perspective on the Active vs. Passive investment
debate, by taking the position of an Independent Financial Advisor (“IFA”) as
opposed to the more commonly researched private investor. Whilst current
literature is dominated by arguments over whether active or passive investment
management will be likely to achieve a greater return for the investor, little
consideration has been given to portfolios with differing objectives. This paper
acknowledges that volatility reduction is a likely objective for any IFA wanting to
preserve their clients’ capital, and so analyses the extent to which active fund
selection and management within a mutual fund aids volatility reduction.
By analysing a sample of DB Wood Limited’s (a Wealth Management company
based in Newark, Nottinghamshire) portfolio range, over a 5-year time horizon,
conclusions are drawn to benefit the company specifically and the wider IFA
industry. Furthermore, this paper finds that, whilst there are areas of the market
where a passive bias should be adopted, on the whole active fund selection and
investment management is more effective at reducing the volatility levels of
portfolios, compared to passive alternatives.

4
N0424662 | Attribution of Fund Selection on Reducing Volatility | Research Project 2016
Table of Contents Acknowledgements.............................................................................................................2!
Abstract..............................................................................................................................3!
1! Introduction..................................................................................................................5!
2! Critical.Literature.Review..............................................................................................8!2.1! Defining.Terms...................................................................................................................8!2.2! The.Debate.......................................................................................................................10!
3! Research.Methods......................................................................................................14!3.1! Research.Approach...........................................................................................................14!3.2! Portfolio.Selection............................................................................................................14!3.3! Portfolio.Creation.............................................................................................................15!3.4! Analysis............................................................................................................................18!
4! Analysis.and.Discussion...............................................................................................19!4.1! Analysis............................................................................................................................19!4.1.1! DBW!Very!Low!................................................................................................................!19!4.1.2! DBW!Low!........................................................................................................................!22!4.1.3! DBW!Low!to!Medium!.....................................................................................................!25!
4.2! Discussion.........................................................................................................................28!
5! Limitations..................................................................................................................31!
6! Conclusion..................................................................................................................32!
7! References..................................................................................................................34!
8! Appendices.................................................................................................................36!8.1! Appendix.1:.Glossary.of.Terms..........................................................................................36!8.2! Appendix.2:.IA.Sector.Criteria...........................................................................................39!8.3! Appendix.3:.Calculations.for.Analysis................................................................................42!8.4! Appendix.4:.Ethics………………………………………………………………………………………………………….46!

5
N0424662 | Attribution of Fund Selection on Reducing Volatility | Research Project 2016
1 Introduction In the January-February 1991 volume of the Financial Analysts Journal, William F.
Sharpe claimed that:
Properly measured, the average actively managed dollar must
underperform the average passively managed dollar, net of costs.
Empirical analyses that appear to refute this principle are guilty of improper
measurement. (Sharpe 1991, p. 8)
Since these comments were made, the argument surrounding the benefits and
potential drawbacks of active investment management has become one of the
most extensive, far-reaching and popular debates in the investment industry.
With a primary focus on return, academics and industry professionals alike have
attempted to prove or disprove that, after adjusting for the additional costs
associated with active investing, a passive investment strategy will be more
beneficial over the longer term.
There has, however, been little coverage of the implications and considerations
that should be taken into account by investors and portfolio managers with
differing objectives to that of maximising returns. For example, IFAs who run
their own investment propositions, are handling the money of clients who have
worked hard for their money over the years. Consequently, IFAs must consider
the collective objectives of their client base, which are likely skewed towards
capital preservation and financial security (DB Wood Limited 2016). Behavioural
bias causes individuals, who have sought financial advice, to place more emphasis
on a significant loss than the equivalent gain. Loss aversion is the term used by
behavioural economists to explain that an investment loss results in greater
disutility than an equally-sized gain results in positive utility. It follows that one
derives more economic utility from capital preservation than from capital
appreciation (Davidson 2012). Further to loss aversion is the presence of
negativity bias among clients.
Negativity bias describes a cognitive bias in which more attention and
importance are placed on negative experiences and information… This
particular bias makes negative information have a larger impact on
behaviour and perception than positive information. (AlleyDog n.d.)
6
N0424662 | Attribution of Fund Selection on Reducing Volatility | Research Project 2016
Both loss aversion and negativity bias could mean that if an IFA were to report
frequent fluctuations in performance, the net psychological effect of the combined
losses would significantly outweigh the equivalent gains; inevitably leading to
funds flowing out of the IFAs portfolios. A situation such as this could also limit
the value added by other services the IFA provides. For example, if a client is
unhappy with the returns being generated (because they are subconsciously
placing a greater emphasis on the losses rather than equivalent gains) they may
focus on this, which will detract from the value being added through other services
such as retirement or inheritance tax planning.
In order to produce a range of portfolios that limits return fluctuations as much as
possible, an emphasis on reducing volatility becomes increasingly necessary.
“Historical statistical volatility is a measure of how much share price fluctuated
during a given time period” (Morningstar 2016). A strategy that aims to reduce
volatility levels, is in affect aiming to maximise the amount of downside-protection
and achieve the best possible risk-adjusted returns. Further, the right downside-
protection strategies can help to protect clients from significant losses, which is
important for preserving portfolios and helps to allow maximum participation in
future gains (State Street Corporation 2015).
DB Wood Limited (DB Wood) is a Wealth Management company based in Newark,
Nottinghamshire which prioritises volatility reduction across it’s portfolio range.
The company run six (Fund of Funds) portfolios that aim to achieve different return
outcomes for given levels of risk. One of the ways the company attempts to
achieve this is through active investment management, both in respect of their
fund selection process and the managers of the funds themselves. In order to
assess the extent to which active fund management and selection aids volatility
reduction, further research is required.
The main aim of this project is to provide DB Wood with a critical evaluation of
how it’s policy of actively managing the funds held, and only selecting funds with
active managers, has helped to reduce the volatility of their three lowest risk
portfolios. The following portfolios: DB Wood Very-Low Risk Portfolio, DB Wood
Low Risk Portfolio and DB Wood Low-Medium Risk Portfolio have been analysed

7
N0424662 | Attribution of Fund Selection on Reducing Volatility | Research Project 2016
over the last five years. Although the majority of the research methods used will
incorporate DB Wood’s portfolios specifically, it is hoped that the conclusions
drawn will benefit the IFA industry as a whole.
The format of this paper is as follows:
• Critical Literature Review
This chapter contains a critical review of the current literature surrounding
the Active vs. Passive debate, to explain popular themes and beliefs before
highlighting areas of further research.
• Research Methods
This chapter outlines the research methods that have been used for this
paper, justifying the reasons why such methods have been utilised and
explaining the benefits.
• Analysis and Discussion
This chapter is split into two main sections; Analysis and Discussion. Firstly,
analysis is carried out for each of DB Wood’s portfolios in turn, the results
of which are then discussed in greater detail and links are established with
the currently available literature.
• Limitations
This chapter outlines the limitations of this study and outlines areas for
further research.
• Conclusion
This chapter concludes the paper by providing a summary of findings;
outlining how these compare or contrast to current inherent beliefs and
explaining the implications for DB Wood and the wider industry.
• Appendices
Attached at Appendix 1 is a ‘Glossary of Terms,’ which should be used as a
point of reference for any terms deemed to require prior knowledge and/or
understanding.

8
N0424662 | Attribution of Fund Selection on Reducing Volatility | Research Project 2016
2 Critical Literature Review 2.1 Defining Terms This literature review will examine the current research surrounding the age old
debate of Active vs. Passive investing. It is therefore imperative to define exactly
what it means to be an active or passive investor.
A passive investor always holds every security from the market, with each
represented in the same manner as in the market. Thus if security X
represents 3 percent of the value of the securities in the market, a passive
investor’s portfolio will have 3 percent of its value invested in X. (Sharpe
1991, p. 7)
In short, passive investors believe in the Efficient Market Hypothesis (EMH). EMH
is a market theory that evolved from the work of Eugene Fama (see Malkiel 2003,
p. 59) and was formed on the belief that securities markets were extremely
efficient in reflecting information about individual stocks, and the stock market as
a whole. The theory contends that because prices fully reflect all available
information, neither technical, nor fundamental analysis will enable investors to
achieve a return greater than those achieved from holding a randomly selected
portfolio of individual stocks. Working on this assumption, Vanguard Asset
Management (2015, p. 6) explain:
They [Passive investors] try to match the performance of the market (or
their chosen sector) as a whole. They tend to do this by closely following
or tracking an investment index, such as the FTSE 100 index.
This is the reason passive funds are often referred to as index funds or tracker
funds. They have the simple objective of matching the index, rather than beating
it and do this by buying and holding all or a representative sample of the securities
in the index (Vanguard Asset Management 2015). However, there is a growing
body of evidence to suggest that modern day passive investing might not be so
clear cut. For example, in a white paper written for Robeco, Blitz (2014) highlights
the large number of varied passive products that are now available to investors,
due to high levels of competition, among other factors. This paper also highlights
the dangers of accepting that any product branded as passive, is in fact a truly
passive fund. Blitz (2014) explains:
Another issue with passive funds in practice is that they typically track a
liquid market index, such as the S&P 500, rather than the broad market

9
N0424662 | Attribution of Fund Selection on Reducing Volatility | Research Project 2016
portfolio containing all listed securities. This approach is known to
significantly distort market prices and negatively affect the performance of
passive investors.
It is suggested that in order to ensure a truly passive approach, investors should
consider the most broadly defined capitalisation-weighted index (Blitz 2014).
As with the passive investment definition, the earliest definition of an active
investor came from the work of Sharpe (1991, p. 7):
An active investor, is one who is not passive. His or her portfolio will differ
from that of the passive manager’s at some or all time. Because active
managers usually act on perceptions of mispricing, and because such
perceptions change relatively frequently, such managers tend to trade fairly
frequently - hence the term active.
However, when reviewing the literature, it is important to consider only those
active managers who are genuinely active. Research completed by Standard Life
Investments (2015) has found that while broadly categorised as ‘active,’ in truth,
there are likely to be many ‘closet index huggers’ or ‘enhanced index funds’ in any
given peer group. If this is the case, such supposed ‘active funds’ will likely distort
the active universe’s overall performance (Standard Life Investments 2015). A
further factor that can cause analysis to be misleading, is the use of ‘average
active manager performance’ to assess active fund performance. In a report
released by Premier Asset Management (2012), they argued that the use of
‘weighted sector averages’ would generally give a more accurate view of whether
active funds are collectively beneficial or detrimental, as they are closely aligned
with how people are really invested. One example used to support this claim, is
that at the start of 2012, the IMA’s (Investment Management Association) UK
Equity Income Sector contained 92 funds. Three of which were managed by one
manager - Neil Woodford of Invesco Perpetual. These three funds represented
around 40% of the sectors total assets, and were bigger than 84 of the remaining
89 funds combined. “And yet, when the conventional sector average is calculated,
Mr Woodford’s funds will account for just 3.3% of that sector average’s
performance in 2012” (Premier Asset Management 2012, p. 3). This reinforces
the need to scrutinise literature to ensure that any analysis undertaken carefully
considers how active management is being analysed.

10
N0424662 | Attribution of Fund Selection on Reducing Volatility | Research Project 2016
2.2 The Debate The majority of the literature surrounding the Active vs. Passive debate is focussed
on the relative impact on portfolio returns. Although this project aims to examine
the literature from the viewpoint of volatility reduction, certain key themes need
to be understood irrespective of their focus.
For example, it is worth noting the earliest arguments that were presented in
favour of passive investing, or rather, the case that was built against active
management. ‘The Arithmetic of Active Management’ is an article that was written
by Sharpe (1991) for the Financial Analysts Journal, and was the first major
contributor to the debate. Using simple arithmetic and an exploration of weighted
average, Sharpe (1991) theorised that before costs, the average actively
managed dollar must equal the average passively managed dollar (because
markets are fully efficient and so share prices reflect all available information). It
follows that when the increased cost, and indeed fee charged, of an actively
managed fund is taken into account, the return of an average actively managed
dollar will be less than the return on the average passive managed dollar. The
use of higher fees and expenses to explain why active management
underperforms passive, is common throughout the literature. Some state that a
typical active mutual fund has an expense ratio of just less than 150 basis points,
whilst index funds can be run with minimal expense ratios less than 20 basis
points, even for small investors. In addition to fees, the amount of trades per
year is significantly higher in an active fund, which further increases expenses in
the form of brokerage and other associated costs (Malkiel 2005). With such high
costs, it is argued that active investment management will always underperform
a more passive approach. However, both these elements are questioned by some
active advocates. For example, according to Standard Life Investments (2015),
passive investors cannot ‘buy the index’ at no cost, and must pay the Ongoing
Charges Figure (OCF), which can range from 0.1% to 0.75% depending on
provider. In addition to the OCF, Standard Life Investments (2015, p. 13) also
identify certain ‘hidden costs’ that may also be incurred for two main reasons:
11
N0424662 | Attribution of Fund Selection on Reducing Volatility | Research Project 2016
• Passive funds need to trade constantly in order to track changes in weights
of index constituents, incurring significant cumulative dealing costs (bid-
offer spreads, broker commissions etc.)
• In less efficient markets where liquidity is low, as in many emerging
markets, dealing spreads can be significant.
Standard Life Investments (2015) claim that all mutual funds (be that passive or
active) pay these costs, which would mean that any argument for a more passive
approach that neglects such costs, would not be comparing investment styles on
a “fair and equitable basis”. Reference is also made to the trading costs of active
funds, and a case is built to suggest that these might not be as high as commonly
believed. It is suggested that many active managers will have a long-term
investment horizon, as they allow the companies they select “time to realise the
benefits of their corporate strategies”. The longer the investment horizon, the
fewer trades that will take place and the lower the resulting trading charges will
be (Standard Life Investments 2015, p. 13).
It becomes apparent that the core argument for both sides of the debate revolves
around fees, additional costs and discrepancies over how these are calculated.
The argument that active management is a zero-sum game before fees and a
negative-sum afterwards is indeed a compelling one. However, can the additional
costs of active management be justified when a portfolio’s objectives include
volatility reduction and downside protection, in addition to return maximisation?
In reality, there is research to suggest that the two objectives need not be
mutually exclusive. In his paper for Robeco, Blitz (2014) explores the ‘dark side’
of passive investing. By exploring historical performance of the US Equity Sector,
Blitz noted that performance varies significantly by market segment. Further, he
concluded:
A passive approach involves intentionally investing large parts of one’s
portfolio in segments of the market that are known to be associated with
disappointing historical performance characteristics. (Blitz 2014, p. 7)

12
N0424662 | Attribution of Fund Selection on Reducing Volatility | Research Project 2016
Figure 2.2.1 displays the various sectors identified, and their historical
performance relative to volatility and the market:
Figure 2.2.1
In this example, the Low Volatility segment outperformed the market, for fewer
units of volatility, arguing the case that actively increasing exposure to this
segment over ‘loser’ growth stocks would have undoubtedly increased returns
whilst simultaneously reducing volatility of the portfolio. As such, Blitz (2014)
recommends a ‘factor investing approach’ which “avoids going against proven
factors such as value, momentum and low-volatility, and actively seeks to benefit
from these factors instead” (Blitz 2014, p. 10).
Although Robeco’s study could be criticised for only considering a single sector of
the market (US Equities), the work of Li (2010) also recognises the importance of
considering market segments when assessing how, and where, active managers
can add value. The study examined Real Alpha in five full market cycles over the
30-year period ending 28 February 2010 and found that:
On average, before adjusting for risk, active managers were found to have
generated positive excess returns in bear markets and negative excess
returns in bull markets. However, the situation reverses after adjusting for
risk, as active managers in general have higher risk-adjusted returns than
Historical performance characteristics of US equity factor portfolios, 1963:07 - 2010:12
Source: Kenneth French, Robeco

13
N0424662 | Attribution of Fund Selection on Reducing Volatility | Research Project 2016
their passive benchmarks in bull markets, and lower risk-adjusted returns
than their benchmarks in bear markets. (Li 2010, p. 11)
That said, this particular study also found that active managers were more
conservative in their approach and took less market risk regardless of bull or bear
markets and provided some downside protection in bear markets (Li 2010). On
the whole, Li’s research supported active management, with the majority of the
categories analysed showing an active management bias. However, certain areas
of her research was consistent with a passive investor’s belief in the EMH;
“categories consisting of a great number of funds resulted in a lower category
average alpha” (Li 2010, p. 12). To what extent this research contributes to the
debate over whether active management does in fact aid volatility reduction within
portfolios is unclear. On the one hand it has adopted an approach similar to Blitz
(2014) factor investing and identified that through active management, areas
where value can be added most successfully can be targeted, however, on the
other hand, in well established markets where the quality of information is high
and readily available, EMH principles might prevent any value being added by an
active investor.
It is apparent that further research is required in this area to determine whether
active management can be utilised to satisfy the objective of volatility reduction
with an IFAs portfolio. By carefully considering the sectors that portfolios are
exposed to, it will be possible to expand on the work of Li (2010) and Blitz (2014).
Further, focussing on one specific area of active management (Fund Selection)
will allow for new, potentially enlightening conclusions to be drawn. Finally, by
also observing portfolio returns, a contribution to the wider Active vs Passive
debate should also be possible.

14
N0424662 | Attribution of Fund Selection on Reducing Volatility | Research Project 2016
3 Research Methods 3.1 Research Approach For this study, a purely quantitative approach has been taken. This reflects the
need to critically analyse past performance of DB Wood’s portfolios over a three
to five-year time horizon and assess whether the active approach taken by DB
Wood has aided volatility reduction across the portfolio range. A five-year time
horizon also coincides with the time horizon upon which DB Wood base their
investment decisions (DB Wood Limited 2016). Justification for why a quantitative
approach to research is necessary for this project can be found in the work of
Leedy and Ormrod (see Williams 2007, p. 65):
Quantitative researchers seek explanations and predictions that will
generate to other persons and places. The intent is to establish, confirm, or
validate relationships and to develop generalisations that contribute to
theory.
This project seeks to explain how IFAs can effectively reduce the volatility levels
of their portfolios, and by validating relationships and past trends, draw
conclusions on whether active fund selection contributes to such a reduction.
Although past performance is not always indicative of future expected returns,
this approach follows the work of Li (2010), who analysed the past performance
of over 30,000 mutual funds over the 30-year period ending 28 February 2010, in
order to draw assumptions on when active management should be preferred by
investors.
3.2 Portfolio Selection The following three, of the six portfolios run by DB Wood have been chosen for
analysis, together referred to as “The Sample Portfolios”:
• DB Wood Very Low Risk Portfolio (DBW Very Low)
• DB Wood Low Risk Portfolio (DBW Low)
• DB Wood Low to Medium Risk Portfolio (DBW Low to Medium)

15
N0424662 | Attribution of Fund Selection on Reducing Volatility | Research Project 2016
Whilst volatility reduction is important for the entire range of portfolios, it is widely
acknowledged that the higher one moves up the risk spectrum, the higher the
expected level of volatility will need to be to achieve the expected level of return;
placing too much emphasis on volatility reduction in higher risk portfolios will likely
prevent the objectives of the portfolio being met. This assumption can be
explained by the Efficient Frontier model, as illustrated in Figure 3.2.1:
Figure 3.2.1
Harry Markowitz (see The Mutual Fund Store n.d.) Efficient Frontier model
highlights that as expected return increases, so does the level of risk/volatility
within the portfolio. DB Wood’s Medium Risk Portfolio aims to achieve a 6% return
per annum over five years and has an equity weighting which is disproportionate
to the Sample Portfolios, hence it’s inclusion in the testing would have led to
incomparable results.
3.3 Portfolio Creation Through the use of FE Analytics, various ‘comparison’ portfolios have been created
for each of the Sample Portfolios, as outlined below:
Source: The Mutual Fund

16
N0424662 | Attribution of Fund Selection on Reducing Volatility | Research Project 2016
Sector Portfolios
An attempt has been made to replicate the blend of funds held within each of the
Sample Portfolios. Each sector comparison portfolio contains all funds held within
each sector of the Sample Portfolios, with weightings adjusted accordingly.
For example, assume DB Wood Very Low had a 20% weighting in the property
sector, made up of two property funds (Fund A and Fund B), which both have an
equal weighting of 10%. The respective Property Sector Comparison Portfolio
would be made constructed as follows: Fund A weighting 50%, Fund B weighting
50% ("#$%&$% +#$%&$% = 100%").
Creating a range of comparison portfolios in this way allows for DB Wood’s blend
of funds to be compared against the Investment Association (IA) sector average
performance.
IA Sector Averages are a popular comparison for IFA’s and investors generally.
Each of the IA Sector funds has a strict set of criteria they must fulfil, primarily
focussed around the principle asset types in which the funds should invest. For
example, “the UK All Companies sector comprises funds that invest at least 80%
of their assets in UK equities, which have a primary objective of achieving capital
growth” (The Investment Association 2016). For a full list of IA Sector definitions
and criteria, please see Appendix 2.
Figure 3.3.1 outlines the comparison portfolios that have been created for each of
the Sample Portfolios:
Figure 3.3.1

17
N0424662 | Attribution of Fund Selection on Reducing Volatility | Research Project 2016
DBW Very Low does not hold any direct equity funds, hence the lack of equity
sector comparison portfolios. The fund’s (minimal) equity exposure comes from
the absolute return funds held, which are already incorporated within the Absolute
Return Sector Portfolio.
The purpose of these comparisons is to consider the added value of DB Wood’s
fund selection in isolation, albeit excluding the correlation and diversification
benefit with other asset classes.
Asset Allocation Portfolios
An attempt has been made to replicate the asset allocation of the Sample
Portfolios whilst removing any fund bias.
A set of Asset Allocation comparison portfolios has been created, with the IA
Sector Averages being used as a proxy for each asset class. For example, assume
Sample Portfolio 1 has equal weightings across the following asset classes:
Property, UK Equities, Fixed Income, Absolute Return. The Asset Allocation
portfolio would be constructed as follows:
Asset Class Proxy Weightings Property IA Property – Nov 90 25% UK Equities IA UK Equity Income 25% Fixed Income IA Sterling Strategic
Bond 25%
Absolute Return
IA Targeted Absolute Return
25%
A full list of the IA sector’s that have been used as proxies can be found at
Appendix 2.
The purpose of these comparisons is to consider the added value of DB Wood’s
choice of asset allocation in isolation, excluding any fund selection benefit.

18
N0424662 | Attribution of Fund Selection on Reducing Volatility | Research Project 2016
3.4 Analysis
The following approach will be taken for the analysis of each of the Sample
Portfolio:
1. Scatter Charts will be created displaying the Sample Portfolio, Asset
Allocation Comparison Portfolio and a benchmark portfolio. Visually
displaying the relationship between volatility and return will allow for DB
Wood’s added value to be assessed against the Sample Portfolio’s
benchmark. This chart will also help to identify whether asset allocation
alone has helped to reduce volatility levels of the Sample Portfolio relative
to the Benchmark and provide some indication as to how fund selection and
correlation/diversification benefit has contributed to any volatility
differences.
2. Further scatter charts will be created displaying each of the Sector
Comparison Portfolios relative to their IA Sector Averages. This will allow
for conclusions to be drawn as to whether DB Wood’s choice of funds alone
within each sector of the Sample Portfolios has affected volatility levels in
any way.
3. Finally, the main findings will be discussed, with reference being made to
any recurring themes. This will allow for final conclusions to be drawn.

19
N0424662 | Attribution of Fund Selection on Reducing Volatility | Research Project 2016
4 Analysis and Discussion 4.1 Analysis 4.1.1 DBW Very Low
Asset Allocation Portfolios
Figure 4.1.1.1 displays the performance, relative to volatility of DBW Very Low,
DBW Very Low’s Asset Allocation Comparison portfolio (AA Comparison) and DBW
Very Low’s Benchmark Portfolio (the Benchmark) over the 5-year period ending
29 February 2016:
Figure 4.1.1.1
• AA Comparison has produced an increased return over the Benchmark of
2.14%, with Annualised Volatility 0.08 units lower.
• AA Comparison has produced a return 1.90% lower than DBW Very Low,
with Annualised Volatility 1.45 units higher.
• DBW Very Low has produced an increased return over the Benchmark of
4.04%, with Annualised Volatility 1.53 units lower.
It can therefore be deduced that 2.14% of DBW Very Low’s 4.04% outperformance
over the period, and -0.08 units of DBW Very Low’s -1.53 unit reduction in
Annualised Volatility is attributable to Asset Allocation alone. Therefore, it follows
that DB Wood’s choice of asset allocation has effectively reduced volatility levels
within DBW Very Low over the period, as well as increasing overall return.

20
N0424662 | Attribution of Fund Selection on Reducing Volatility | Research Project 2016
In order to determine whether the remaining volatility reduction of -1.45 units
(-1.53 + 0.08 = -1.45) is attributable to fund selection or diversification benefit
between funds, further analysis is required. By comparing the historic volatility
of each fund within DBW Very Low to its corresponding IA Sector Average and
multiplying this difference by the fund’s weighting within the portfolio, it is possible
to work out the overall reduction, or increase in volatility that is attributable to
fund selection alone. Results of this analysis can be found below, and a full
calculation breakdown is attached at Appendix 3:
The combined, weighted volatility reduction of all funds held within DBW Very Low
equates to -1.25 units. Therefore, the remaining -0.20 unit reduction (-1.53 +
0.08 + 1.25 = -0.20) must be attributable to the diversification benefit between
funds.
Sector Comparison Portfolios
Figure 4.1.1.2 displays the performance, relative to volatility of all Sector
Comparison Portfolios that have been created for DBW Very Low and their
corresponding IA Sector Averages, over the 5-year period ending 29 February
2016:
Figure 4.1.1.2
• Property Sector Portfolio (A) produced an increased return over IA Property
(B) of 6.02%, with Annualised Volatility 4.77 units lower.

21
N0424662 | Attribution of Fund Selection on Reducing Volatility | Research Project 2016
• Fixed Income Sector Portfolio (F) produced a return 20.85% lower than IA
Sterling Corporate Bond (C), with Annualised Volatility 3.41 units lower.
• Absolute Return Sector Portfolio (D) produced an increased return over IA
Targeted Absolute Return (E) of 4.44%, with Annualised Volatility 0.08 units
lower.
It can therefore be deduced that the blend of funds actively selected by DB Wood
in every sector of their portfolio has effectively reduced volatility compared to their
IA Sector Averages, and in two of the three sectors DBW Very Low is exposed to,
has also increased returns.
22
N0424662 | Attribution of Fund Selection on Reducing Volatility | Research Project 2016
4.1.2 DBW Low
Asset Allocation Portfolios
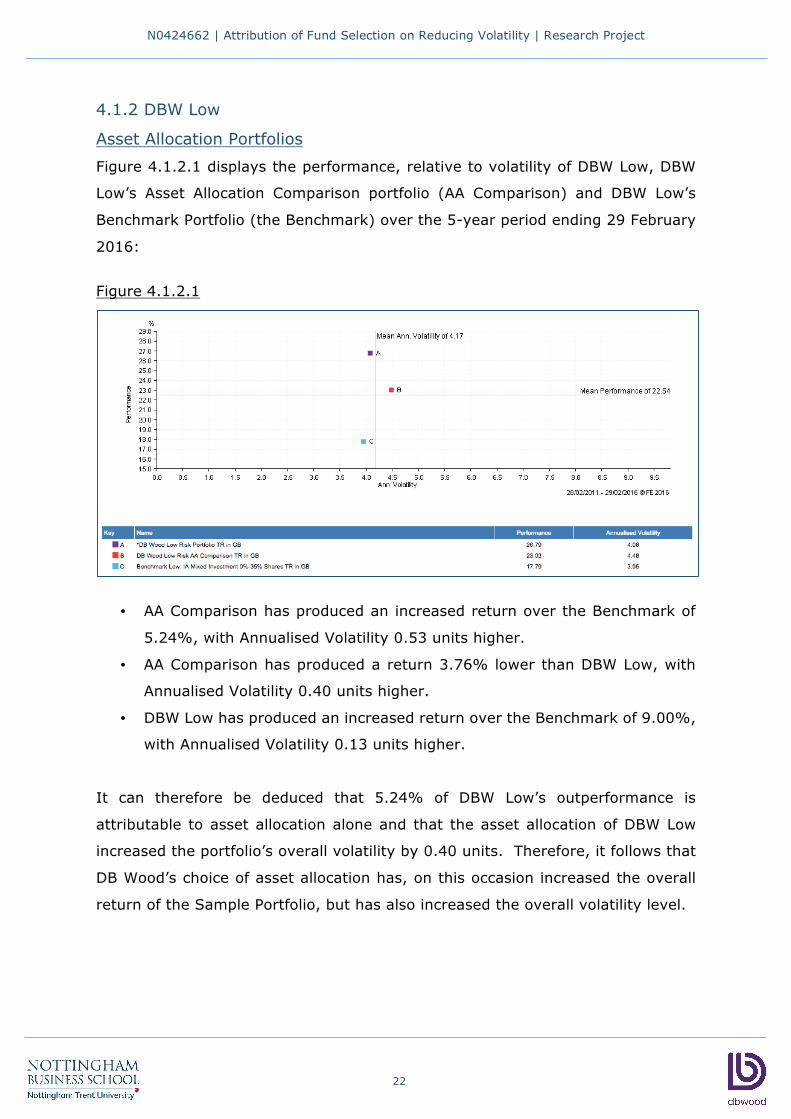
Figure 4.1.2.1 displays the performance, relative to volatility of DBW Low, DBW
Low’s Asset Allocation Comparison portfolio (AA Comparison) and DBW Low’s
Benchmark Portfolio (the Benchmark) over the 5-year period ending 29 February
2016:
Figure 4.1.2.1
• AA Comparison has produced an increased return over the Benchmark of
5.24%, with Annualised Volatility 0.53 units higher.
• AA Comparison has produced a return 3.76% lower than DBW Low, with
Annualised Volatility 0.40 units higher.
• DBW Low has produced an increased return over the Benchmark of 9.00%,
with Annualised Volatility 0.13 units higher.
It can therefore be deduced that 5.24% of DBW Low’s outperformance is
attributable to asset allocation alone and that the asset allocation of DBW Low
increased the portfolio’s overall volatility by 0.40 units. Therefore, it follows that
DB Wood’s choice of asset allocation has, on this occasion increased the overall
return of the Sample Portfolio, but has also increased the overall volatility level.

23
N0424662 | Attribution of Fund Selection on Reducing Volatility | Research Project 2016
In order to determine whether fund selection, or diversification benefit between
funds is causing volatility to then reduce by 0.40 units (4.48 – 4.08 = 0.40) to
arrive at DBW Low’s volatility figure of 4.08, calculations were carried out in an
equivalent fashion to those performed for DBW Very Low (above). This analysis,
attached at Appendix 3, found that the combined, weighted volatility reduction of
all funds held within DBW Low equates to -0.30 units. Therefore, the remaining -
0.10 unit reduction (0.40 – 0.30 = 0.10) must be attributable to the diversification
benefit between funds.
Sector Comparison Portfolios
Figure 4.1.2.2 displays the performance, relative to volatility of all Sector
Comparison Portfolios that have been created for DBW Low, with the exception of
the UK Equity Sector Portfolio. This has been excluded because one of the funds
held within this sector has only one year of available information and hence, it’s
inclusion would lead to incomparable results. Also displayed are the corresponding
IA Sector Averages, over the 5-year period ending 29 February 2016:
Figure 4.1.2.2

24
N0424662 | Attribution of Fund Selection on Reducing Volatility | Research Project 2016
• Global Equities Sector Portfolio (A) produced an increased return over IA
Global Equity Income (C) of 19.23%, with Annualised Volatility 0.02 units
lower.
• European Equities Sector Portfolio (B) produced an increased return over
IA Europe Excluding UK (F) of 27.40%, with Annualised Volatility 0.68 units
lower.
• Property Sector Portfolio (D) produced an increased return over IA Property
(E) of 6.02%, with Annualised Volatility 4.74 units lower.
• Fixed Income Sector Portfolio (G) produced an increased return over IA
Sterling Strategic Bond (H) of 4.60%, with Annualised Volatility 0.93 units
higher.
• Absolute Return Sector Portfolio (I) produced an increased return over IA
Targeted Absolute Return (J) of 5.13% with Annualised Volatility 1.02 units
higher.
It can therefore be deduced that the blend of funds actively selected by DB Wood
has effectively reduced volatility in three of the five sectors analysed compared to
their IA Sector Averages, and has increased returns across every sector.

25
N0424662 | Attribution of Fund Selection on Reducing Volatility | Research Project 2016
4.1.3 DBW Low to Medium
Asset Allocation Portfolios
Figure 4.1.3.1 displays the performance, relative to volatility of DBW Low to
Medium, DBW Low to Medium’s Asset Allocation Comparison portfolio (AA
Comparison) and DBW Low’s Benchmark Portfolio (the Benchmark) over the 5-
year period ending 29 February 2016:
Figure 4.1.3.1
• AA Comparison has produced an increased return over the Benchmark of
8.30%, with Annualised Volatility 0.60 units higher.
• AA Comparison has produced a return 2.37% lower than DBW Low to
Medium, with an equal Annualised Volatility level.
• DBW Low to Medium has produced an increased return over the Benchmark
of 10.67%, with Annualised Volatility 0.60 units higher.
It can therefore be deduced that 8.30% of DBW Low to Medium’s outperformance
is attributable to asset allocation alone and that the asset allocation of DBW Low
to Medium increased the portfolio’s overall volatility by 0.60 units. Therefore, it
follows that DB Wood’s choice of asset allocation has, on this occasion increased
the overall return of the Sample Portfolio, but has also increased the overall
volatility level.

26
N0424662 | Attribution of Fund Selection on Reducing Volatility | Research Project 2016
Although the volatility level of DBW Low to Medium and AA Comparison were equal
over the period, fund selection analysis was still completed, to remain consistent
across the portfolio range. This analysis, attached at Appendix 3, found that the
combined, weighted volatility reduction of all funds held within DBW Low equates
to -0.35 units. Therefore, on this occasion, diversification between funds has
increased the volatility of the portfolio by 0.35 units (-0.35 + 0.35 = 0).
Sector Comparison Portfolios
Figure 4.1.3.2 displays the performance, relative to volatility of all Sector
Comparison Portfolios that have been created for DBW Low to Medium, with the
exception of the UK Equity Sector Portfolio. This has been excluded for the same
reason as above; one of the funds held within this sector has only one year of
available information and hence, it’s inclusion would lead to incomparable results.
Also displayed are the corresponding IA Sector Averages, over the 5-year period
ending 29 February 2016:
Figure 4.1.3.2
• US Equities Sector Portfolio (A) produced an increased return over IA North
America (B) of 11.92%, with Annualised Volatility 0.73 units lower.

27
N0424662 | Attribution of Fund Selection on Reducing Volatility | Research Project 2016
• Global Equities Sector Portfolio (C) produced an increased return over IA
Global Equity Income (E) of 19.23%, with Annualised Volatility 0.02 units
lower.
• European Equities Sector Portfolio (D) produced an increased return over
IA Europe Excluding UK (H) of 27.40%, with Annualised Volatility 0.68 units
lower.
• Property Sector Portfolio (F) produced an increased return over IA Property
(G) of 6.02%, with Annualised Volatility 4.74 units lower.
• Fixed Income Sector Portfolio (I) produced an increased return over IA
Targeted Absolute Return (J) of 4.60% with Annualised Volatility 0.93 units
higher.
• Absolute Return Sector Portfolio (K) produced an increased return over IA
Targeted Absolute Return (L) of 5.27% with Annualised Volatility 1.02 units
higher.
It can therefore be deduced that the blend of funds actively selected by DB Wood
has effectively reduced volatility in four of the six sectors analysed compared to
their IA Sector Averages and has increased returns across every sector.

28
N0424662 | Attribution of Fund Selection on Reducing Volatility | Research Project 2016
4.2 Discussion
Active Fund Managers
This research has allowed for the performance of each individual ‘actively
managed’ fund held by DB Wood across the Sample Portfolios to be analysed.
Below is a summary of the main conclusions:
• Of the 20 funds analysed, 11 have achieved lower volatility than their
respective IA Sector Average. This suggests that on the whole, active fund
management has been effective at reducing volatility. The funds that
increased volatility relative to their sector average were generally concentrated
in the Absolute Return and Fixed Income sectors. However, without further
analysis of the relative outperformance (increase in returns), it is unknown
whether certain funds deliberately allowed volatility to increase, to generate
higher returns.
• The 2 funds held in the US Equities Sector (DBW Low to Medium only) only
made a minimal net reduction in volatility of -0.02 units (-0.07 + 0.05). This
corresponds with the research of Li (2010) in which the US Equities sector was
shown to be one of the most difficult to add value. Passive advocates would
argue that this is due to the US market being one of the most established, and
hence there is more available information, allowing the principles of EMH to
hold true. It is however, important to note that one of the two US funds held
is run by a passive manager. Whilst not satisfying Blitz (2014) criteria of a
‘truly passive’ fund, this fund may have skewed results in this sector.
• When combining the reduction/increase in volatility of all funds held within
each sector, a net volatility increase attributable to fund selection, was only
observed in one sector; the Absolute Return Sector of DBW Low and DBW Low
to Medium. All sectors of DBW Very Low produced a combined volatility
reduction.
• Active fund managers were most successful in reducing volatility against their
sector’s in the property sector, reducing by a combined -3.64 units, -3.90 units
and -3.96 units for DBW Very Low, DBW Low and DBW Low to Medium
respectively. These findings compliment the findings of Blitz (2014); Property

29
N0424662 | Attribution of Fund Selection on Reducing Volatility | Research Project 2016
is known for being a ‘Low Volatility’ holding, and funds performing in this sector
have shown to not only reduce volatility, but also significantly outperform their
sector average returns. This suggests that a factor investing approach, which
places a heavier weighting in Property would be effective.
Active Fund Management (By DB Wood)
This research also analysed the value added by DB Wood, through the selection
of funds that effectively reduce volatility vs. their corresponding IA Sector Average
and through the company’s ability to manipulate fund weightings to optimise
diversification benefit. Further, as well as holistically analysing the diversification
benefit between all funds and sectors, this project has also analysed on a sector
by sector basis, the relationship (diversification benefit) of the individual funds
within each sector. Below is a summary of the main conclusions:
• Although significantly enhancing the returns of all the Sample Portfolios, DB
Wood’s choice of Asset Allocation only reduced volatility within DBW Very Low,
and increased volatility for the remaining two Sample Portfolios. However,
these volatility increases were marginal in comparison to the increases in
returns (5.24% for 0.53 units and 8.30% for 0.6 units). Relationships such as
this fall in-line with Markowitz (see The Mutual Fund Store n.d.) efficient
frontier model and should therefore be acceptable to both DB Wood and their
clients.
• DB Wood were able to add value through in-sector diversification in four of the
six sectors of DBW Low and DBW Low to Medium, and in every sector of DBW
Very Low. It can therefore be concluded that the blend of funds, actively
determined by DB Wood has aided volatility reduction.
• The overall outperformance (increased returns) of the Sample Portfolios over
their Benchmarks are as follows:
o DBW Very Low – 4.04%
o DBW Low – 9.00%
o DBW Low to Medium – 10.67%

30
N0424662 | Attribution of Fund Selection on Reducing Volatility | Research Project 2016
These results contradict the findings of Sharpe (1991) and Malkiel (2005)
because even after subtracting company fees and platform charges
(0.65%-0.85% per annum), the active management of the Sample
Portfolios has been more beneficial than the passive alternative over the
period.
On the whole, for the five-year period ending 29 February 2016, DB Wood has
successfully reduced the volatility of the Sample Portfolios, through active
management of the funds they hold, and by selecting funds that are run by active
managers.
Whilst Asset Allocation was able to reduce the volatility of DBW Very Low, overall,
the selection of active funds has shown to be the superior method to reduce
volatility. To that end, successfully selecting the right active funds and actively
managing the weightings held within a portfolio, should result in a range of
portfolios that outperform passive alternatives per unit of risk.

31
N0424662 | Attribution of Fund Selection on Reducing Volatility | Research Project 2016
5 Limitations First and foremost, a main limitation of this project is the small sample size. All
analysis has been completed using the past performance of a single company’s
portfolios and whilst this provides a strong and relevant focus, any generalised
conclusions may not hold true.
Secondly, this project compared results against the benchmarks that are used by
DB Wood and for the sector comparisons, the IA Sector Average. However, certain
funds that are held within the Sample Portfolios may use alternative benchmarks
when monitoring performance, which may have led to incomparable results.
Furthermore, while five-year back-testing timeframe was deemed most
appropriate for this project, an extended time period may have led to more reliable
results. For example, the results of this analysis may have been skewed by how
the market has performed over the past five years. Any further research
completed in the area should analyse performance over several different market
conditions, such as generally bullish (as seen over the last five years) and
generally bearish (such as in times of financial crisis).
This project was also limited by the analytics software used. All charts produced
use current fund composition only, and in doing so do not account for historical
changes throughout the time period. Furthermore, the investment philosophy of
DB Wood may have also skewed the data. For example, tactical plays within the
portfolios, such a being over exposed to the Property Sector, may have artificially
increased volatility reduction over the period. Taking the property sector as an
example, also helps to explain a further limitation of this research; only focussing
on volatility as a measure of reducing risk. Whilst this project found property to
be a low volatility asset class, no analysis was completed to establish whether it
also has low liquidity or interest rate risk for example.
To expand on this research, further papers should analyse the performance of a
wider range of IFA’s portfolios, over a longer time frame that incorporates multiple
market cycles and consider alternative risk measures, such as maximum
drawdown.

32
N0424662 | Attribution of Fund Selection on Reducing Volatility | Research Project 2016
6 Conclusion It is apparent that the majority of current literature is dominated by themes
concerning the returns a portfolio can achieve. Whether an active investment
strategy is able to outperform passive alternatives after fees and associated costs
is the core underpinning for the debate. This paper attempts to review the
literature from the perspective of an IFA, whose objectives are skewed towards
capital preservation and in doing so highlighted the objective of volatility reduction
as an area scarcely covered by prior research.
A link was established between increased returns and a reduction in volatility
levels and whether the two objectives must be mutually exclusive was explored.
By adopting a ‘factor investing’ approach, it is possible to increase returns by
increasing exposure to low-volatile sectors, such as property. That said, it is also
acknowledged that volatility is not only a measure of downside risk, but also a
measure of upside potential. It follows that as one moves up the risk spectrum,
there is an expectation for an efficient frontier to develop, which ensures the
maximum risk-adjusted returns are achieved.
An efficient frontier appeared to be present when assessing the Sample Portfolios,
with both returns and volatility increasing relative to the Benchmarks from DBW
Very Low to DBW Low and onto DBW Low to Medium. However, this was not the
main focus of this project. Instead, focus was placed on how DB Wood has
reduced the volatility of it’s portfolios and the amount of volatility reduction that
can be attributed to active fund selection.
On the whole, active fund selection was shown to be the superior method of all
methods analysed. In particular, whilst asset allocation was an effective way for
DB Wood to increase returns over the period, it appeared ineffective at reducing
volatility. Although there may be reasons for this, such as allocation restraints
put in place by DB Wood, fund selection alone was able to reduce volatility of all
the Sample Portfolios significantly.
By critically analysing sector performance, it was discovered that fund selection is
more effective at reducing volatility in certain sectors. The reason for this is

33
N0424662 | Attribution of Fund Selection on Reducing Volatility | Research Project 2016
unknown; passive advocates may attribute it to the EMH and the quality of
information available while others might mention the differing expectations of fund
managers. For example, a manager of a US Equity fund might be expected to
focus more heavily on returns than volatility, compared to a property fund
manager whose main objective might be volatility reduction.
These findings in particular have industry wide implications. An IFA choosing a
passive approach to the management of it’s portfolios, is choosing to neglect
sectors of opportunity for volatility reduction and runs the risk of exposing its
portfolio to areas of the market that might also lower return potential.
Alternatively, in adopting an active, ‘factor investing’ approach, an IFA is able to
utilise the benefits of fund selection where it’s advantageous to do so (Property
Sector), and adopt a passive bias in sectors where adding value is difficult (US
Equities).
The main conclusions that can be drawn for the benefit of DB Wood specifically are as follows: • The company’s active investment philosophy has been successful over the
period, both in terms of volatility reduction and return maximisation; and!
• Value appears to have been added in two main ways over the period; once
through actively selecting active fund managers, and again through active
management of the funds held, which included sector diversification, and
manipulation of weightings; and!
• Diversification within DBW Low to Medium increased volatility over the period,
which may require further investigation; and!
• The company’s decision to hold a passive fund in the US Equities sector appears
to have benefitted the portfolio over the period, which suggests a passive bias
in this sector should remain.!
!In summary, some of this paper’s findings compliment and support the principles
of the EMH and hence, a more passive approach. However, the benefits of active
fund selection and investment management have shown to far outweigh these
advantages both from the perspective of enhanced returns and volatility
reduction.

34
N0424662 | Attribution of Fund Selection on Reducing Volatility | Research Project 2016
7 References AlleyDog, n.d. Negativity Bias [online]. Glossary: AlleyDog. Available at:
http://www.alleydog.com/glossary/definition.php?term=Negativity%20Bias#ixzz
421ZwpCrP [Accessed 5 March 2016].
Blitz, D., 2014. The Dark Side of Passive Investing [online]. White Paper:
Robeco. Available at: http://www.robeco.com/images/the-dark-side-of-passive-
investing-february-2014.pdf [Accessed 17 November 2015].
Davidson, L., 2012. Investors Behaving Badly: Loss Aversion [online]. London:
Morningstar. Available at:
http://www.morningstar.co.uk/uk/news/69193/investors-behaving-badly-loss-
aversion.aspx [Accessed 24 February 2016].
DB Wood Limited, 2016. This is Investment Management [online]. DB Wood
Limited: Investment Management. Available at:
http://www.dbwood.co.uk/financial-planning/#bs-tab-serv2 [Accessed 10 March
2016].
Li, J., 2010. When Active Management Shines vs. Passive [online]. White Paper:
FundQuest. Available at:
http://www.thinkadvisor.com/SiteCollectionDocuments/FundQuestAP%20Whitep
aper%20FundQuest%20version%20FINAL%20June%202010.pdf [Accessed 4
January 2016].
Malkiel, B.G., 2003. The Efficient Market Hypothesis and Its Critics. Journal of
Economic Perspectives, 17 (1), 59-82.
Malkiel, B.G., 2005. Reflections on the Efficient Market Hypothesis: 30 Years
Later. Financial Review, 40 (1), 1-9.
Morningstar, 2016. Historical Volatility [online]. Morningstar: Investing Glossary.
Available at: http://www.morningstar.com/invglossary/historical_volatility.aspx
[Accessed 27 February 2016].

35
N0424662 | Attribution of Fund Selection on Reducing Volatility | Research Project 2016
Premier Asset Management, 2012. The State of the Universe: 2012 [online].
Premier Fund Managers Limited: Premier Asset Management. Available at:
https://www.premierfunds.co.uk/media/58013/state-of-the-universe-2012-a-
review-of-fund-management-in-the-uk.pdf [Accessed 13 December 2015].
Sharpe, W.F., 1991. The Arithmetic of Active Management. Financial Analysts
Journal, 47 (1), 7-9.
Standard Life Investments, 2015. Defining the Benefits, Challenging the Myths
[online]. Scotland: Standard Life Investments. Available at:
http://www.standardlifeinvestments.com/market_views/investment_insight/inde
x.html?option=by_name [Accessed 21 November 2015].
State Street Global Advisors, 2015. Equity Market Risk [online]. London: State
Street Global Advisors. Available at: https://www.ssga.com/investment-
topics/risk-management/Equity-Market-Risk.pdf [Accessed 9 March 2016].
The Investment Association, 2016a. Fund Sectors [online]. London: The
Investment Association. Available at:
http://www.theinvestmentassociation.org/investment-industry-
information/fund-sectors/ [Accessed 29 January 2016].
The Mutual Fund Store, 2016. Modern Portfolio Theory and The Efficient Frontier
[online]. The Mutual Fund Store: Smart 401K. Available at:
https://www.smart401k.com/resource-center/advanced-investing/modern-
portfolio-theory-and-the-efficient-frontier [Accessed 15 February 2016].
Vanguard Asset Management, 2015. Active and Passive Investing – What You
Need to Know [online]. London: Vanguard Asset Management. Available at:
https://www.vanguard.co.uk/documents/portal/literature/active-passive-
investing-guide.pdf [Accessed 16 January 2016].
Williams, C., 2007. Research Methods. Journal of Business & Economic Research,
5 (3), 65.

36
N0424662 | Attribution of Fund Selection on Reducing Volatility | Research Project 2016
8 Appendices 8.1 Appendix 1: Glossary of Terms Below is a list of terms that have been deemed to require specialist knowledge.
These definitions are taken directly from the Investor Words website, unless
otherwise stated and are available at: http://www.investorwords.com/.
Alpha
• A coefficient which measures risk-adjusted performance, factoring in
the risk due to the specific security, rather than the overall market.
Basis points
• One hundredth of a percentage point (0.01%). Basis points are often used to
measure changes in or differences between yields on fixed income securities,
since these often change by very small amounts.
.
Bear market
• A prolonged period in which investment prices fall, accompanied by
widespread pessimism.
.
Bid-offer spreads *Definition provided by the Finance Glossary. Available at:
http://www.finance-glossary.com/define/bid-offer-spread/1859.
• The difference between the selling price and the purchase price for
investments.
.
Bull market
• A prolonged period in which investment prices rise faster than
their historical average.
.
Capitalisation-weighted index
• A stock index in which each stock affects the index in proportion to its market
value.
.

37
N0424662 | Attribution of Fund Selection on Reducing Volatility | Research Project 2016
Downside Protection
• A position that limits the potential loss that would result from a decline in
a security or market.
Economic utility
• The capacity of a good or service to meet the demand of a consumer.
The amount of economic utility of a good or service determines what the
demand will be for that good or service, which impacts the price that people
will be willing to pay to obtain it.
Index
• A statistical indicator providing a representation of the value of
the securities which constitute it. Indices often serve as barometers for a
given market or industry and benchmarks against which financial or economi
c performance is measured.
.
Index fund
• A passively managed mutual fund that tries to mirror the performance of a
specific index, such as the S&P 500. Since portfolio decisions are automatic
and transactions are infrequent, expenses tend to be lower than those of
actively managed funds.
.
Market cycle
• Periodic up-down, high-low movements that happen in all markets;
any price that goes up must come down too. In stock markets, a market cycle is
said to be complete when the Standard & Poor composite index (S&P 500) is
15 percent above the lowest point or 15 percent below the highest point.
.
S&P 500
• Standard & Poor's 500. A basket of 500 stocks that are considered to be
widely held. The S&P 500 index is weighted by market value, and
its performance is thought to be representative of the [US] stock market as a
whole.
.
38
N0424662 | Attribution of Fund Selection on Reducing Volatility | Research Project 2016
Security
• An investment instrument, other than an insurance policy or fixed annuity,
issued by a corporation, government, or
other organization which offers evidence of debt or equity.
.
Tracker fund
• A fund which tracks one of the stock market indices, such as the FTSE.
.

39
N0424662 | Attribution of Fund Selection on Reducing Volatility | Research Project 2016
8.2 Appendix 2: IA Sector Criteria Below is a list of sector definitions for all sectors analysed. These definitions are
taken directly from the Investment Association (2016) website and is available at:
http://www.theinvestmentassociation.org/investment-industry-
information/fund-sectors/sector-definitions.html. For fund numbers, see Appendix
3.
IA Targeted Absolute Return: Used as a proxy for funds 1,2,3,4,5,6,7 and 8
and Absolute Return Sector comparisons.
• Funds managed with the aim of delivering positive returns in any market
conditions, but returns are not guaranteed.
Funds in this sector may aim to achieve a return that is more demanding than
a “greater than zero after fees objective.”
Funds in this sector must clearly state the timeframe over which they aim to
meet their stated objective to allow the Investment Association and investors
to make a distinction between funds on this basis. The timeframe must not be
longer than three years.
IA Global Equity Income: Used as a proxy for fund 9 and Global Equity Sector comparisons. • Funds which invest at least 80% of their assets globally in equities. Funds must
be diversified by geographic region and intend to achieve a historic yield on
the distributable income in excess of 110% of the MSCI World Index yield at
the fund’s year end.
IA North America: Used as a proxy for fund 11 and 12 and US Equity Sector
comparisons.
• Funds which invest at least 80% of their assets in North American equities.

40
N0424662 | Attribution of Fund Selection on Reducing Volatility | Research Project 2016
IA Europe Excluding UK: Used as a proxy for fund 13 and European Equity Sector comparisons. • Funds which invest at least 80% of their assets in European equities and
exclude UK securities.
IA UK All Companies: Used as a proxy for fund 14 and 17 and UK Equity Sector
comparisons.
• Funds which invest at least 80% of their assets in UK equities which have a
primary objective of achieving capital growth.
IA Strategic Bond: Used as a proxy for Fixed Income funds 18 and 20 and Fixed
Income Sector comparisons for DBW Low and DBW Low to Medium.
• Funds which invest at least 80% of their assets in Sterling denominated (or
hedged back to Sterling) fixed interest securities. This excludes convertibles,
preference shares and permanent interest bearing shares (PIBs). At any point
in time the asset allocation of these funds could theoretically place the fund in
one of the other Fixed Interest sectors. The funds will remain in this sector on
these occasions since it is the Manager's stated intention to retain the right to
invest across the Sterling fixed interest credit risk spectrum.
IA Corporate Bond: Used as a proxy for Fixed Income fund 19 and Fixed Income
Sector comparisons for DBW Very Low.
• Funds which invest at least 80% of their assets in Sterling denominated (or
hedged back to Sterling), Triple BBB minus or above corporate bond securities
(as measured by Standard & Poors or an equivalent external rating agency).
This excludes convertibles, preference shares and permanent interest bearing
shares (PIBs).

41
N0424662 | Attribution of Fund Selection on Reducing Volatility | Research Project 2016
IA Property: Used as a proxy for funds 21, 22 and 23 and Property Sector comparisons. • Funds which predominantly invest in property. In order to invest
"predominantly" in property, funds should either: o invest at least 60% of their assets directly in property; or o invest at least 80% of their assets in property securities; or o when their direct property holdings fall below the 60% threshold for a
period of more than 6 months, invest sufficient of the balance of their assets in property securities to ensure that at least 80% of the fund is invested in property, whereupon it becomes a hybrid fund.

42
N0424662 | Attribution of Fund Selection on Reducing Volatility | Research Project 2016
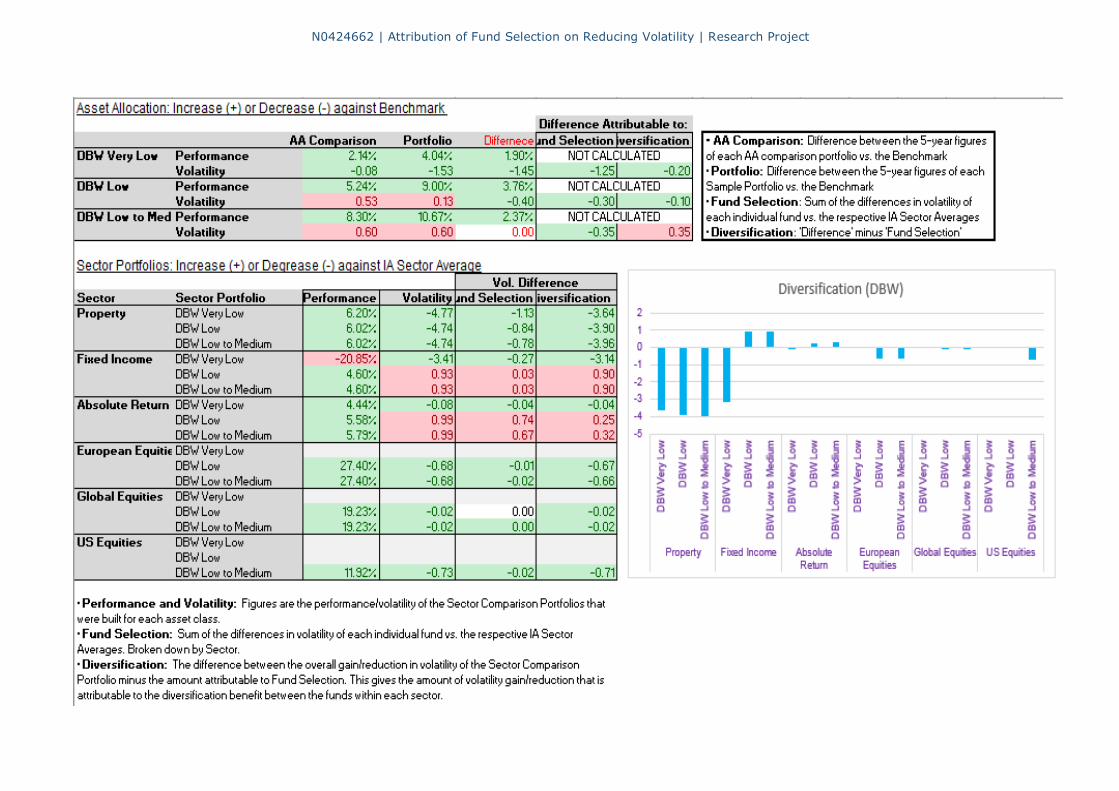
8.3 Appendix 3: Calculations for Analysis
N0424662 | Attribution of Fund Selection on Reducing Volatility | Research Project 2016

N0424662 | Attribution of Fund Selection on Reducing Volatility | Research Project 2016

N0424662 | Attribution of Fund Selection on Reducing Volatility | Research Project 2016
BLANK PAGE

N0424662 | Attribution of Fund Selection on Reducing Volatility | Research Project 2016
8.4 Appendix 4: Ethics
N0424662 | Attribution of Fund Selection on Reducing Volatility | Research Project 2016