donald bren school of environmental science and … · table 8.27 substitution of pineapple for...
TRANSCRIPT
Kaiser Permanente Group Project
Final Report
Page | i
DONALD BREN SCHOOL OF ENVIRONMENTAL SCIENCE AND MANAGEMENT University of California, Santa Barbara
Estimating and Reducing the Climate Footprint of Food Served by Kaiser Permanente 2011 Group Project Final Report Researched and Produced by: Scott Eaton Erin Masuda Ryan Moin Goldamer Thach Shivira Tomar Faculty Advisor: Roland Geyer [email protected]
www.bren.ucsb.edu/~kaiser
Kaiser Permanente Group Project
Final Report
Page | ii
Table of Contents Table of Contents ................................................................................................................................................... ii
List of Tables ......................................................................................................................................................... iii
List of Figures ........................................................................................................................................................ iv
1. Abstract .......................................................................................................................................................... 6
2. Executive Summary......................................................................................................................................... 6
2.1 Purpose ................................................................................................................................................. 6
2.2 Background ........................................................................................................................................... 6
2.3 Methods ................................................................................................................................................ 6
2.4 Results ................................................................................................................................................... 7
2.5 Conclusion and Recommendations ........................................................................................................ 7
3. Project Objectives ........................................................................................................................................... 8
4. Project Significance ......................................................................................................................................... 8
5. Background .................................................................................................................................................... 9
5.1 Climate Footprint................................................................................................................................... 9
Climate Footprint Models ............................................................................................................................. 10
Shortcomings and Strengths ......................................................................................................................... 10
5.2 Life Cycle Assessment .......................................................................................................................... 11
Production Systems ...................................................................................................................................... 14
Foods from Overseas Commodities ............................................................................................................... 16
Industrial Food Products ............................................................................................................................... 16
Complex Food Products ................................................................................................................................ 16
Packaging ..................................................................................................................................................... 17
Food Miles .................................................................................................................................................... 18
Food Waste Management Systems ............................................................................................................... 18
6. Methodology ................................................................................................................................................ 19
6.1 Economic Input-Output Models ........................................................................................................... 19
6.2 Comprehensive Environmental Data Archive 4.0 .................................................................................. 26
6.3 Calculating Emissions Using CEDA 4.0 ...................................................................................................... 29
6.4 Process-Based Models ......................................................................................................................... 37
7. Data Management ........................................................................................................................................ 39
8. Results .......................................................................................................................................................... 40
8.1 CEDA Results ....................................................................................................................................... 40
8.2 Process-Based Model Results ............................................................................................................... 60
8.3 CMU Toxic Results ............................................................................................................................... 68
Ecotoxicity .................................................................................................................................................... 68
Acidification .................................................................................................................................................. 70
Respiratory Emissions ................................................................................................................................... 71
Carcinogenic Emissions ................................................................................................................................. 73
Kaiser Permanente Group Project
Final Report
Page | iii
Eutrophication .............................................................................................................................................. 73
Assumptions and Limitations of Toxic Release Results ....................................................................................... 74
9. Conclusions and Recommendations .................................................................................................................. 77
9.1 Recommendations from Substitutions and Toxic Analysis ..................................................................... 77
9.2 Limitations of the Models .................................................................................................................... 78
9.3 Emissions from Transportation ............................................................................................................ 80
List of Appendices Appendix A – Substitution Scenarios
Appendix B- CMU Toxic Data
Appendix C – CEDA CMU Comparison
Appendix D- Literature Emissions Data
List of Tables Table 6-1: Environmental Data Sources for CEDA .................................................................................................. 27
Table 6-3: Toxic Release Description ..................................................................................................................... 36
Table 8.1: CEDA and CMU Emissions Comparison.................................................................................................. 43
Table 8.2: Substitution Scenarios for Beef ............................................................................................................ 45
Table 8.3: Substitution Scenarios for Juice Beverages ............................................................................................ 47
Table 8.4: Substitution Scenarios for Coffee .......................................................................................................... 47
Table 8.5: Dual Substitution Scenarios for Milk and Soymilk .................................................................................. 48
Table 8.6: Substitution Scenario of Frozen Carrots ................................................................................................ 49
Table 8.7: Substitution Scenario for Frozen Spinach .............................................................................................. 49
Table 8.8: Substitution Scenario for Fresh Broccoli ................................................................................................ 50
Table 8.9: Substitution Scenario for Canned Apples .............................................................................................. 51
Table 8.10: Substitution Scenario for Fresh Blueberries ......................................................................................... 52
Table 8.11: Substitution Scenario for Processed Cheese and Cheese Snacks .......................................................... 53
Table 8.12: Substitution Scenario for Chips ........................................................................................................... 53
Table 8.13: Substitution Scenario for Butter .......................................................................................................... 54
Table 8.14: Substitution Scenario for Soup ............................................................................................................ 55
Table 8.15 Substitution Scenarios for Pre-Cooked Entrees..................................................................................... 55
Table 8.16: Substitution Scenario for Cold Cereal .................................................................................................. 56
Table 8.17: Substitution Scenario for Cereal Bars and Breakfast Items ................................................................... 57
Table 8.18: Substitution Scenario for Soda and Juices ........................................................................................... 57
Table 8.19 Substitution Scenario for Candy ........................................................................................................... 58
Table 8.20: Substitution Scenario for Processed Pork Products.............................................................................. 59
Table 8.21: Substitution Scenarios for Deli Meats ................................................................................................. 59
Table 8.22: Substitution Scenario for Intensive Feedlot Beef ................................................................................. 63
Table 8.23 Substitution Scenario for Intensive Feedlot Beef - Protein Supplement ................................................ 64
Table 8.24: Substitution Scenario for Intensive Feedlot Pork ................................................................................. 64
Table 8.25: Substitution Scenario for Intensive Feedlot Chicken ............................................................................ 65
Table 8.26: Substitution of Apples for Other Fresh Fruits (Literature Emissions) .................................................... 66
Kaiser Permanente Group Project
Final Report
Page | iv
Table 8.27 Substitution of Pineapple for Other Fresh Fruit .................................................................................... 67
Table 8.28: Substitution of Broccoli for Other Fresh Vegetables ............................................................................ 67
Table 9.1: Emissions Factors of Fuel Combustion by Transportation Mode ............................................................ 80
Table 9.2: Expected Emissions Reductions – Combination Truck, Diesel Powered .................................................. 81
Table 9.3: Expected Emissions Results – Combination Truck, Gasoline Powered .................................................... 81
Table 9.4: Expected Emissions Results – Single Unit Truck, Diesel Powered ........................................................... 81
Table 9.5: Expected Emissions Results – Single Unit Truck, Gasoline Powered ....................................................... 82
List of Figures Figure 6.1: Example of Supplier Tiers for Final Product of Blueberry Jam .............................................................. 21
Figure 6.2: Sample of IO Table ............................................................................................................................. 22
Figure 6.3: Sample of IO Table, Matrix Multiplication through First Tier Suppliers ................................................. 22
Figure 6.4: Sample of IO Table, Matrix Multiplication through Second Tier Suppliers ............................................. 23
Figure 6.5: NAICS ID Key in Access ........................................................................................................................ 31
Figure 6.6: CMU EIO-LCA Results Output............................................................................................................... 37
Figure 7-1: Food Description Hierarchy ................................................................................................................. 40
Figure 8.1: CEDA Emissions Estimates as a Percentage of Total Emissions ............................................................. 41
Figure 8.2: CEDA Emission Estimates for the IMDs for Meat and Seafood with the Largest Emissions Totals .......... 42
Figure 8.3: CEDA Emissions Factors Used for Different Product Categories ............................................................ 44
Figure 8.4: Fresh Vegetable Emissions by Product Type and Model Type. .............................................................. 61
Figure 8.5: Fresh Beef Emissions by Management Type ......................................................................................... 62
Figure 8.6: Distribution of aquatic ecotoxicity emissions (in Gg TEG) ..................................................................... 69
Figure 8.7: Distribution of terrestrial ecotoxicity emissions (in Gg TEG) ................................................................. 70
Figure 8.8: Distribution of aquatic acidification emissions (in kg SO2 equivalent) ................................................... 71
Figure 8.9: Distribution of terrestrial acidification emissions (in kg SO2 equivalent) ............................................... 71
Figure 8.10: Distribution of respiratory organic emissions (in kg C2H4 equivalent) .................................................. 72
Figure 8.11: Distribution of respiratory inorganic emissions (in kg PM2.5 equivalent) ............................................. 72
Figure 8.12 Distribution of carcinogenic emissions (in Mg C2H3Cl equivalent) ........................................................ 73
Figure 8.13: Distribution of emissions associated with eutrophication (in kg PO4) .................................................. 74

Kaiser Permanente Group Project
Final Report
Page | v
Signature Page
This document has been authored and compiled by the following Bren Students:
Scott Eaton Date
Erin Masuda Date
Ryan Moin Date
Goldamer Thach Date
Shivira Tomar Date
This group project is approved by the following Faculty Advisors:
Roland Geyer Date
Joe Bialowitz Date
Kathleen Reed Date
Kaiser Permanente Group Project
Final Report
Page | 6
1. Abstract Kaiser Permanente is a healthcare provider that aims to be a leader in the U.S. healthcare industry. As a major healthcare organization, Kaiser Permanente recognizes that climate change presents great risks to human health. The company also recognizes the importance of preventative measures, which can be critical in mitigating those risks. As a member of the Climate Registry, Kaiser Permanente has determined its carbon footprint utilizing the Registry’s General Reporting Protocol. However, this protocol does not require reporting of emissions associated with food. Kaiser Permanente has determined the need to develop a framework for estimating the climate footprint of the major food categories served throughout its operations as food systems. This report aims to take on this task in addition to identifying major food groups contributing to greenhouse gas emissions and providing recommendations to mitigate those emissions. In this report, an economic input-output life cycle assessment was used to calculate greenhouse gas emissions from procurement data. The results were verified using a process-based method to benchmark values. This document reports these results and recommends actions that will reduce the environmental impact of Kaiser Permanente’s food system in the future.
2. Executive Summary
2.1 Purpose As an ongoing participant in the Green Guide for Healthcare, Kaiser Permanente has taken the first steps toward sustainability in its food sector. In a November 2004 vision statement, Kaiser Permanente’s Environmental Stewardship Council vowed that they “will promote agricultural practices that are ecologically sound, economically viable and socially responsible by the way we purchase food”.1 To complement their vision statement, this report has conducted a comprehensive economic input-output life cycle assessment (EIO-LCA) and a process-based approach to quantify the greenhouse gas (GHG) emissions associated with food procurement through Kaiser Permanente’s operations. The results of this report are intended to provide Kaiser Permanente with guidance for the management of identifiable, high-emitting food products purchased. Data collection and analysis methods were given careful consideration to avoid generalizations and assumptions. The findings from our report have thus, allowed us to recommend potential food systems management actions that will effectively reduce Kaiser Permanente’s GHG emissions from food related purchases.
2.2 Background GHG emissions from the life cycle of food products are a significant contributor to anthropogenic environmental impacts. To enable Kaiser Permanente to reduce GHG emission via their food purchasing, we utilized an EIO-LCA model to generate GHG emissions from their purchase data and evaluated high-emitting products.
2.3 Methods After careful reorganization and categorization of received data we were able to successfully input our data into a Comprehensive Environmental Data Archive (CEDA) 4.0, a model for EIO-LCA analysis. The model interlinks input and output tables, environmental emissions, and resource use statistics to calculate the quantity of GHG emissions emitted by a given product’s purchase amount. The next step was to benchmark results with a process-based model. Unlike CEDA, this type of method is a bottom up approach-the traditional type of Life Cycle Assessment (LCA). This method covers a product’s lifecycle on a physical basis (mass) rather than on an economic basis. After
1 Garske, Lynn (2006). Kaiser Permanente’s Comprehensive Food Policy [PowerPoint slides]. Retrieved
May 16, 2010 from http://siri.uvm.edu/ppt/40hrenv/index.html
Kaiser Permanente Group Project
Final Report
Page | 7
GHG emissions were determined we used Carnegie Melon University’s Economic Input-Output Life Cycle Assessment method to determine toxic releases of each product we categorized. In doing so, we were able to determine the correlating health impacts of a particular food category.
2.4 Results The estimate of total emissions associated with food purchased by Kaiser Permanente in 2009 was approximately
23,400 tons CO2e. Meat accounts for over one quarter of these emissions, with beef contributing over 2,000 tons,
followed by poultry and then pork. Cooking and serving supplies were found to be the next largest group, with
emissions from beverages right behind, at 9% of the total. Prepared items, which consist primarily of premade
entrees, soups, and breakfast items, were also a major contributor, at around 8%, while vegetables and dairy were
each closer to 7%.
Our substitution analysis compared complementary items in these categories, as well as the categories which had
less emissions overall. The largest potential for emissions reductions were found, however, in substitutions
involving meat and involving beverages. Replacing beef with poultry and juice with tap water were found to have
reduction potentials of hundreds of tons, even when substituting small percentages of these items overall.
Additionally both of these substitutions were found to have large cost reductions. Emissions reductions were
found in substituting various vegetables and fruits between their frozen, fresh, and canned forms, but on a
significantly smaller scale than those for meat and beverages. Similarly, there are opportunities for reductions
between margarine and butter, soymilk and milk, and other processed and unprocessed foods.
The toxic emissions results showed quite a lot of variation between the different emissions types for the various
product groups. Particular groups of items were much more environmentally harmful than others in some
categories while being relatively benign in others. The supplies group, for example, was by far the largest
contributor to terrestrial and aquatic ecotoxicity, with more processed products contributing to greater
acidification in terrestrial and aquatic environments. Drinks, particularly soft drinks, also had substantial toxic
emissions factors for eutrophication and carcinogenic emissions. The toxicity factors for poultry emissions was
also generally higher than those for beef and pork products, leading to a greater contribution to the overall total.
2.5 Conclusion and Recommendations The substation analyses provide a guide for purchasing managers to reduce emissions by hundreds of tons while
making relatively small changes. Replacing beef with poultry is the most cost-effective and emissions-reducing
option for meat substitution, but due to the potential for environmental harm from increasing poultry
consumption, should be balanced with the other substitution options. Identifying environmentally-friendly
sourcing options for poultry is advisable, because not all farm management practices will be represented by the
toxicity factors used in this analysis. Perhaps the most straightforward way to reduce emissions and costs while
ensuring a smaller environmental footprint overall is through replacing juice and carbonated beverages with tap
water. Soft-drink manufacturing and sugar production were both large contributors to several toxicity categories,
and reduced sugar consumption has additional direct health benefits. Substitutions between the various types of
processed foods, fruits, and vegetables must be considered by purchasing managers in the context of appealing to
the tastes of consumers as well as the capacity of institutions to freeze, refrigerate, and prepared these foods.
There are sufficient opportunities for targeted emissions and cost reductions that directing increased funds
towards more sustainably produced, yet more carbon-intensive food options such as organic and grass-fed beef
may not lead to increased emissions overall. In the case that they do, there is the possibility of purchasing carbon
offsets, which should be considered regardless of purchasing decisions given the relatively low cost.
Kaiser Permanente Group Project
Final Report
Page | 8
3. Project Objectives This project aimed to estimate and reduce Kaiser Permanente’s food-related climate footprint by developing an approach for measuring the relative impact on climate of food served throughout the organization. Based on the results, this project compiled a list of potential GHG emission reduction activities. The listed activities were then prioritized based on the maximization of health-related co-benefits. The determination of health-related co-benefits could include, for example, weighing the health benefits of organic produce against non-organic produce, in relation to associated GHG emissions. If the production and transport of organic produce is found to have lower GHG emissions, in addition to significant health benefits from lowered pesticide exposures, the purchase and consumption of organic produce can be then be considered a “maximization of health-related co-benefits.”
Broadly speaking, the project objectives were to:
To develop an appropriate framework, such as a Life Cycle Assessment (several options included EIO-LCA, Process LCA, Gabi4 software, FoodCarbonScope), for calculating the climate footprint of foods served at Kaiser Permanente’s different locations and throughout its supply chain, while also standardizing the methods to best fit each location.
Based on the results obtained (from an initial EIO-LCA), identify the foods that can significantly affect the balance of the GHG emission reduction goals and go more in depth from there.
Propose a definition for “sustainable food” keeping in mind Kaiser Permanente’s goals of emission reduction and health-related co-benefits from sustainability.
Form a priority list of strategies -- to establish targets and assess progress – that can be followed by Kaiser Permanente’s supply chain partners, internal purchasers and members, for achieving reductions in the climate footprint of their food.
4. Project Significance Kaiser Permanente is an integrated healthcare firm, serving as both a health insurer and a health care provider. Unlike many other American private healthcare providers, Kaiser Permanente’s business model integrates fixed-price health insurance with treatment at its own hospitals and clinics. This integrated approach, along with an incentive structure that rewards quality of care over quantity, is considered innovative, for it encourages investment in the form of long-term care for patients.2 In Kaiser Permanente’s system, preventative medicine can save the company significant expenditures. For this reason, the company is interested in providing healthcare actions that are preventative, rather than adaptive, wherever possible. Kaiser Permanente’s emphasis on preventative healthcare is also reflected in its approach to addressing climate change. According to the British Medical Journal, climate change belongs at the “heart” of health services management, for the institutions of healthcare can have enormous power to do good or harm to the natural environment and to increase or diminish carbon emissions.
3 Kaiser Permanente has adopted this agenda as well.
While the company recognizes the significant role healthcare providers will play in protecting and treating those harmed by climate change into the future, it also realizes the benefits of implementing mitigation policies in the present time. Although Kaiser Permanente has already initiated several internal sustainability measures relating to, for example, green building components in its facilities, it is continually seeking to determine operational areas in which its contribution to climate change has not yet been defined. One such area is the impact of its food services sector.
2
The Economist (2010, April 29). Another American way. Retrieved May 13, 2010 from http://www.economist.com/business-finance/displaystory.cfm?story_id=16009167
3 Coote, A. (2006). What health services could do about climate change. British Medical Journal, 332, 1343-1344. Retrieved May 1, 2010 from http://www.bmj.com/cgi/context/extract/332/7554/1343.
Kaiser Permanente Group Project
Final Report
Page | 9
The goal of this project was to provide Kaiser Permanente with tactical tools, supported by the project’s data analysis and recommendations, which will allow the company to reach their immediate goal of reducing GHG emissions from its food services sector. These tools were aligned with sustainability business management practices that aimed to increase the environmental performance and quality of Kaiser Permanente’s “product,” healthcare services. Unlike most previous sustainable food- related research, we explicitly connected health co-benefits to environmentally sustainable food choices.
The significance of this project will be determined by our successfulness in demonstrating how Kaiser Permanente can improve upon its product quality performance through sustainability practices. In the existing body of literature, researchers have not been able to support whether sustainability practices contribute to greater quality performance of business products. This project implemented state of the art valuation studies to assess how quality performance can, in fact, be enhanced by sustainability measures. Additionally, this project aimed to be able to quantify and project Kaiser Permanente’s potential cost savings through the sustainability activities that are recommended and prioritized. Ultimately, the implications of this project extend beyond the group project itself. Through the outcomes of this project, Kaiser Permanente has been provided with a factual basis on which to better inform its food purchasing decisions. Kaiser Permanente’s pursuant actions can then have even further reaching effects. As Kaiser Permanente moves to address the environmental impact of this area of its operations, other healthcare providers – locally, nationally and internationally – may have incentive to follow. Kaiser Permanente will be able to maintain its role as an innovator within the industry, not just in terms of healthcare but now additionally in terms of environmental leadership.
5. Background
5.1 Climate Footprint According to the Intergovernmental Panel on Climate Change, human activities result in the emissions of four principal GHGs: carbon dioxide (CO2), methane (CH4), nitrous oxide (N20) and halocarbons (a group of gases that contains fluorine, chlorine and bromine).4 A climate footprint, therefore, is a measure of a product, service or entity’s contribution to global warming, in terms of amount of GHG emissions produced during the lifetime of that product, service or entity (whether it be an individual, household, company, community, city, state or nation). The footprint is typically measured in units of carbon dioxide equivalent, CO2e, which is a unit for comparing the radiative forcing of a GHG to carbon dioxide.5,6 It is typically the sum of two parts: the direct or primary footprint is a measure of direct emission of CO2 from the burning of fossil fuels, including domestic energy consumption and transportation; the indirect or secondary footprint is a measure of the indirect CO2e emissions from the whole lifecycle of products and services, from manufacture to disposal.7 A climate footprint can also be considered a smaller subset of analysis covered by a more complete Life Cycle Assessment (LCA). The European Platform on Life Cycle Assessment defines LCA as:
4 Intergovernmental Panel on Climate Change (2007). Changes in Atmospheric Constituents and Radiative Forcing. In IPCC Fourth Assessment Report: Climate Change 2007 (Chapter 2). Retrieved May 13, 2010 from: http://www.ipcc.ch/publications_and_data/ar4/wg1/en/ch2.html 5Kenny, T., & Gray, N. (2009). Comparative performance of six carbon footprint models for use in Ireland.
Environmental Impact Assessment Review, 29(1), 1-6. Retrieved May 13, 2010 from http://dx.doi.org/10.1016/j.eiar.2008.06.001 6 British Standards Institution (2008). Publicly Available Specification 2050 – 2008: Specification for the assessment of the life cycle GHG emissions of goods and services. Retrieved May 15, 2010 from http://shop.bsigroup.com/en/Browse-by-Sector/Energy--Utilities/PAS-2050 7 Kenny, T., & Gray, N. (2009). Comparative performance of six carbon footprint models for use in Ireland.
Environmental Impact Assessment Review, 29(1), 1-6. Retrieved May 13, 2010 from http://dx.doi.org/10.1016/j.eiar.2008.06.001
Kaiser Permanente Group Project
Final Report
Page | 10
“an internationally standardized method (ISO 14040, ISO 14044) for the evaluation of environmental burdens and resources consumed along the life cycle of products; from the extraction of raw materials, the manufacture of goods, their use by final consumers or for the provision of a service, recycling, energy recovery and ultimate disposal.”8
“Environmental burdens and resources consumed,” can refer to, for example, problems such as acidification, deforestation, and toxic releases. Since climate change is also one of the major impact categories within an LCA, essentially a climate footprint is an LCA with the analysis limited to emissions that have an effect on climate change.
Climate Footprint Models
Climate footprint models play an important role in educating the public and private sectors about management and reduction of CO2 emissions. The calculation of climate footprints at various levels is a powerful tool, enabling people to measure their own CO2 emissions and connect those emissions to their activities and behavior. That connection can then be strong motivation to enact changes. Additionally, unlike the vast amount of other types of scientific research, climate footprinting has a broad appeal to those outside the scientific community. The calculated value of a footprint can be readily understood and placed into the context of one’s daily life, which explains why the concept has continued to ease into the public mindset in many areas of the world.9 The idea of the climate footprint has significantly increased in popularity over the past few years, particularly in Western Europe.10 Socially and environmental conscious companies, have, in large part, been responsible for pushing the idea, followed by non-governmental organizations, companies and various private entities.11 These companies are drawn to GHG for several reasons. Many hope to provide their customers with more transparency regarding their operations, while other companies may intend to capitalize off the new markets created by climate footprinting. For example, some companies may offer airplane tickets for purchase alongside carbon offsets.12
Shortcomings and Strengths
The major strength of climate footprinting – relative simplicity - can also be seen as its primary weakness. Reliance on one environmental indicator can be misleading, and one should be aware of the dangers of oversimplification. For example, an examination of biofuels, which have a low carbon footprint, could give the impression that they are genuinely eco-friendly products. Yet biofuels are also associated with negative land use impacts, which ultimately increase the pressure on rainforests and other areas rich in biodiversity around the world. Climate
8 European Commission Joint Research Center, European Platform on Life Cycle Assessment (2006). Carbon
Footprint - what it is and how to measure it. Retrieved May 15, 2010 from http://lca.jrc.ec.europa.eu/Carbon_footprint.pdf 9 Weidema, B. P., Thrane, M., Christensen, P., Schmidt, J., & Løkke, S. (2008). Carbon Footprint: A Catalyst for Life
Cycle Assessment. Journal of Industrial Ecology, 12(1), 3 - 6. Retrieved May 13, 2010 from http://www.indiaenvironmentportal.org.in/files/Carbon footprint.pdf 10
Weidema, B. P., Thrane, M., Christensen, P., Schmidt, J., & Løkke, S. (2008). Carbon Footprint: A Catalyst for Life Cycle Assessment. Journal of Industrial Ecology, 12(1), 3 - 6. Retrieved May 13, 2010 from http://www.indiaenvironmentportal.org.in/files/Carbon footprint.pdf 11 Weidema, B. P., Thrane, M., Christensen, P., Schmidt, J., & Løkke, S. (2008). Carbon Footprint: A Catalyst for Life Cycle Assessment. Journal of Industrial Ecology, 12(1), 3 - 6. Retrieved May 13, 2010 from http://www.indiaenvironmentportal.org.in/files/Carbon footprint.pdf 12
Weidema, B. P., Thrane, M., Christensen, P., Schmidt, J., & Løkke, S. (2008). Carbon Footprint: A Catalyst for Life Cycle Assessment. Journal of Industrial Ecology, 12(1), 3 - 6. Retrieved May 13, 2010 from http://www.indiaenvironmentportal.org.in/files/Carbon footprint.pdf
Kaiser Permanente Group Project
Final Report
Page | 11
footprinting may not be able to account for those additional environmental impacts, which could be considered equally important to the overall health of the planet.13 Nonetheless, researchers in the LCA community have acknowledged that environmental impacts from energy-related emissions are an important factor that contributes to the overall impact potential for most products and services. While there will inevitably be instances in which climate footprinting is misleading or interpreted incorrectly, if decisions based on the indicator are headed in the right direction 80% of the time, they believe would still be better to use this method of indicator than no method at all.14
5.2 Life Cycle Assessment Any product or service has a life cycle which begins with the production and procurement of raw material for its manufacture, distribution, use and disposal including the transportation involved in moving the product or service. An LCA is the measure of the environmental impact of technology used in each of these life cycle stages and accounts for all the steps involved in the existence of the product or service from its cradle-to-its-grave. The LCA approach has been widely accepted in different industries to evaluate environmental impacts of the products/processes and to identify the resource and emission intensive processes (hotspots) within the product’s life cycle. Originally used to analyze industrial processes, it is only recently that LCAs have begun to be applied to assessing the environmental impacts of the food industry and agriculture. An LCA can help in comparing all major environmental impacts that may be caused and thus enable selection of a product or process with minimal environmental impact while also taking into consideration other factors such as cost and performance data.15 A typical LCA follows Environmental Management Standards set by the International Organization for Standardization (ISO) called the ISO 14040 series, which comes under a larger family of ISO 14000 standards. Additional details regarding guidelines for the steps of the LCA are provided by the ISO 14041, ISO 14042 and ISO 14043 standards which have also been mentioned below in each of the LCA stages. In 2006, ISO published an improved and updated ISO 14040 and a new ISO 14044 standard which were meant to replace previous standards. Also, since the publication of PAS 2050 standards in 2008, recent studies in assessing life cycle GHG emissions have begun using PAS 2050 due to its specific advantages over other standards.
According to ISO 14040, a general LCA process includes the following four phases: Phase I- Goal Definition and Scoping: Outlining and defining the goal and the scope of LCA and deciding upon functional units (form in which the product is consumed by the end user) to be used in analysis. This step also determines the time and resources needed in conducting the LCA and follows ISO 14041 standards outlined and described by ISO. Phase II- Inventory Analysis: This step entails compiling an inventory of relevant energy, water and material inputs and environmental releases (such as GHG emissions, solid waste generation etc.). According to the LCA Principles and Practice document published by the NRMRL, EPA “a life cycle inventory (LCI) is a process of quantifying energy and raw material requirements, atmospheric emissions, waterborne emissions, solid wastes, and other releases for
13
Weidema, B. P., Thrane, M., Christensen, P., Schmidt, J., & Løkke, S. (2008). Carbon Footprint: A Catalyst for Life Cycle Assessment. Journal of Industrial Ecology, 12(1), 3 - 6. Retrieved May 13, 2010 from http://www.indiaenvironmentportal.org.in/files/Carbon footprint.pdf 14 Weidema, B. P., Thrane, M., Christensen, P., Schmidt, J., & Løkke, S. (2008). Carbon Footprint: A Catalyst for Life Cycle Assessment. Journal of Industrial Ecology, 12(1), 3 - 6. Retrieved May 13, 2010 from http://www.indiaenvironmentportal.org.in/files/Carbon footprint.pdf 15
Environmental Protection Agency (2006). Life Cycle Assessment: Inventory Guidelines and Principles. Retrieved May 13, 2010 from: http://www.epa.gov/nrmrl/lcaccess/
Kaiser Permanente Group Project
Final Report
Page | 12
the entire life cycle of a product, process, or activity.”16 ISO 14041 is used as a standard for procedural guidelines for inventory methodology. Without an inventory, there is no basis for comparison of environmental impacts or improvements. The EPA document defines the following four steps of a life cycle inventory:
1. Develop a flow diagram of the processes being evaluated. 2. Develop a data collection plan. 3. Collect data. 4. Evaluate and report results.
The GHG Protocol Initiative, which has been a leader in other sectors, is currently “exploring the development” of agriculture and forestry specific GHG inventories. It offers cross-sector and sector-specific calculation tools, which might be useful for other parts of the supply chain, including electricity, transportation, refrigeration, production of ammonia, and incorporation of uncertainty into estimates.
17 A framework specific to agriculture is expected to
be complete in May of 2010. Phase III- Impact Assessment: This step entails evaluating the potential human health and environmental impacts (such as global warming, acidification, eutrophication, air/water pollution etc.) associated with identified inputs and releases that have been identified during the inventory analysis. The EPA document defines the following four steps of an impact assessment18,19:
1. Selection and definition of impact categories 2. Classification: assigning LCI results to impact categories 3. Characterization: modeling LCI impacts within impact categories using science-based conversion factors 4. Normalization: expressing potential impacts in ways that can be compared 5. Grouping: sorting or ranking the indicators 6. Weighting: emphasizing the most important potential impacts 7. Evaluating and Reporting LCIA results
ISO 14042 has been used as a standard guideline for conducting Impact Assessments. Phase IV- Interpretation: To help make informed decisions about the environmental impacts caused by alternative products, processes or services, they need to be interpreted. The EPA document defines Life Cycle Interpretation as a ‘systematic technique to identify, quantify, check and evaluate information from the results of the LCI and the LCIA and communicate them effectively’. For a Life Cycle Interpretation, ISO 14043 standards are used as a guideline. A sensitivity analysis is also usually carried out to improve the accuracy of the interpreted results, which determines how sensitive the model is to changes in the value of the parameter used in the model and the structure of the model. Although today LCAs are predominantly applied on industrial products or processes, recently LCA methodology has been applied to a broader range of goods and services, including food. When LCAs are applied to food, they have typically been used to assess a part (or combined parts) of an agricultural production system. Following are several examples of this type of LCA work:
16 Curran, M. A., (2006). Life Cycle Assessment: Principles and Practice (2006). Retrieved May 13, 2010 from http://www.epa.gov/nrmrl/lcaccess/pdfs/600r06060.pdf 17 GHG Protocol – Ag and Forestry. Sector-specific guidance for GHG inventories in agriculture and forestry sectors. (n.d.). Retrieved May 18, 2010, from http://www.ghgprotocol.org/agriculture-and-forestry 18
Environmental Protection Agency (2006). Life Cycle Assessment: Inventory Guidelines and Principles. Retrieved May 13, 2010 from: http://www.epa.gov/nrmrl/lcaccess/ 19 Curran, M. A., (2006). Life Cycle Assessment: Principles and Practice (2006). Retrieved May 13, 2010 from http://www.epa.gov/nrmrl/lcaccess/pdfs/600r06060.pdf
Kaiser Permanente Group Project
Final Report
Page | 13
Organic vs. Conventional Agriculture
Due to the lack of international standardization of the LCA method, LCAs stemming from different case studies regarding organic vs. conventional agriculture cannot be compared directly.20 Therefore conventional and organic production systems can generally only be compared within a single case study.21 For example, in a study from the Netherlands assessing the environmental impact of conventional and organic milk production, researchers found that acidification potential (AP) of milk production is due mainly to NH3 emissions, which is not necessarily reduced by organic production.22 Eutrophication potential (EP) per ton of milk per ha, on the other hand, was found to be lower for organic milk than for conventional.23 In terms of Global Warming Potential (GWP), organic milk was found to be able to reduce GWP only if emissions of CO2 and N2O could be reduced.24 Emissions of CH4 account for 48-65% of GWP in milk production, and the percentage actually increases when switching from conventional to organic.
25
Fertilizer Use
LCA can also be used to assess varying environmental impacts from fertilizer use. In a study completed in Germany, three different Nitrogen fertilizers (calcium ammonium nitrate (CAN), urea ammonium nitrate solution (UAN) and urea) were used at optimum N rates for sugar beet production.26 According to the LCA method employed, Eco-Indicator 95, the highest environmental impact was found for the system where urea was used as an N source, while the lowest impact was for the system using CAN.27 In all three systems, the effects of eutrophication and acidification contributed most to the total environmental impact value.28 The researchers concluded that the results demonstrated that LCA methodology is basically suitable to assess the environmental impact associated with agricultural production, despite the fact that some significant environmental issues such as land use were excluded.29
Livestock Feeding Period
In addition, the effects of feeding length have been analyzed according to LCA methodology. A study conducted in Japan evaluated the environmental impacts of Japan’s beef-fattening system. Japanese Black cattle are fed for a
20 de Vries, M., & de Boer, I. J. (2010). Comparing environmental impacts for livestock products: A review of life cycle assessments. Livestock Science, 128 (1-3), 1-11. 21 de Vries, M., & de Boer, I. J. (2010). Comparing environmental impacts for livestock products: A review of life cycle assessments. Livestock Science, 128 (1-3), 1-11. 22 de Vries, M., & de Boer, I. J. (2010). Comparing environmental impacts for livestock products: A review of life cycle assessments. Livestock Science, 128 (1-3), 1-11. 23 de Vries, M., & de Boer, I. J. (2010). Comparing environmental impacts for livestock products: A review of life cycle assessments. Livestock Science, 128 (1-3), 1-11. 24
de Vries, M., & de Boer, I. J. (2010). Comparing environmental impacts for livestock products: A review of life cycle assessments. Livestock Science, 128 (1-3), 1-11. 25
de Vries, M., & de Boer, I. J. (2010). Comparing environmental impacts for livestock products: A review of life cycle assessments. Livestock Science, 128 (1-3), 1-11. 26
Brentrup, F. (2001). Application of the Life Cycle Assessment methodology to agricultural production: an example of sugar beet production with different forms of nitrogen fertilisers. European Journal of Agronomy, 14(3), 221-233. doi: 10.1016/S1161-0301(00)00098-8 27
Brentrup, F. (2001). Application of the Life Cycle Assessment methodology to agricultural production: an example of sugar beet production with different forms of nitrogen fertilisers. European Journal of Agronomy, 14(3), 221-233. doi: 10.1016/S1161-0301(00)00098-8 28 Brentrup, F. (2001). Application of the Life Cycle Assessment methodology to agricultural production: an example of sugar beet production with different forms of nitrogen fertilisers. European Journal of Agronomy, 14(3), 221-233. doi: 10.1016/S1161-0301(00)00098-8 29
Brentrup, F. (2001). Application of the Life Cycle Assessment methodology to agricultural production: an example of sugar beet production with different forms of nitrogen fertilisers. European Journal of Agronomy, 14(3), 221-233. doi: 10.1016/S1161-0301(00)00098-8
Kaiser Permanente Group Project
Final Report
Page | 14
longer period than cattle in other countries, such as the US, in order to produce higher quality beef, and the researchers investigated how this longer feeding period could lead to inefficiencies and additional manure excretion.30 The activities in the beef-fattening life cycle that were evaluated included feed production, feed transport, animal management, and the treatment of cattle waste.31 The results showed that gut CH4 emissions from cattle were the major source in the impact category of global warming, while NH3 emissions from cattle waste were the major source in the impact categories of acidification and eutrophication.32 Feed production was also a significant contributor to all impact categories.33 The study concluded that a shorter feeding length would result in lower environmental impacts in all the environmental categories examined.
Production Systems
LCAs have been also conducted in more broad terms, comparing the major production systems of a food item.
Beef
Researchers in Australia employed LCA methodology to describe Australian red meat production in comparison with other overseas studies. The study investigated three supply chains in three different regions of the country over two years – a sheep meat supply chain in Western Australia, an organic beef supply chain in Victoria, and a premium export beef supply chain in New South Wales - in terms of primary energy consumption, GHG emissions, solid waste production and soil erosion potential.
34 When the GHG emissions and energy use data were compared
with other international studies on red meat production, the researchers concluded that the Australian results were average or below average.35 They also found that although lot-fed beef production systems require additional effort in terms of producing and transporting feed, this amount is offset by the increased efficiency of feedlots.36 As a result, the lot-fed beef production systems in the study generate lower total GHG emissions than grass-fed production.37
30 Ogino, A., Kaku, K., Osada, T., & Shimada, K. (2004). Environmental impacts of the Japanese beef- fattening system with different feeding lengths as evaluated by a life-cycle assessment method. Journal of Animal Science, 82, 2115-2122. Retrieved May 16, 2010 from http://www.animal-science.org/cgi/content/full/82/7/2115 31 Ogino, A., Kaku, K., Osada, T., & Shimada, K. (2004). Environmental impacts of the Japanese beef- fattening system with different feeding lengths as evaluated by a life-cycle assessment method. Journal of Animal Science, 82, 2115-2122. Retrieved May 16, 2010 from http://www.animal-science.org/cgi/content/full/82/7/2115 32 Ogino, A., Kaku, K., Osada, T., & Shimada, K. (2004). Environmental impacts of the Japanese beef- fattening system with different feeding lengths as evaluated by a life-cycle assessment method. Journal of Animal Science, 82, 2115-2122. Retrieved May 16, 2010 from http://www.animal-science.org/cgi/content/full/82/7/2115 33
Ogino, A., Kaku, K., Osada, T., & Shimada, K. (2004). Environmental impacts of the Japanese beef- fattening system with different feeding lengths as evaluated by a life-cycle assessment method. Journal of Animal Science, 82, 2115-2122. Retrieved May 16, 2010 from http://www.animal-science.org/cgi/content/full/82/7/2115 34
Peters, G.M., Rowley, H.V., Wiedemann, S., Tucker,R., Short, M.D. and Schulz, M (2010). Red Meat Production in
Australia and Comparison with Overseas Studies. Enviromental Science and Technology, 44 (4), pp 1327–1332. DOI: 10.1021/es901131e 35
Peters, G.M., Rowley, H.V., Wiedemann, S., Tucker,R., Short, M.D. and Schulz, M (2010). Red Meat Production in
Australia and Comparison with Overseas Studies. Enviromental Science and Technology, 44 (4), pp 1327–1332. DOI: 10.1021/es901131e 36 Peters, G.M., Rowley, H.V., Wiedemann, S., Tucker,R., Short, M.D. and Schulz, M (2010). Red Meat Production in Australia and Comparison with Overseas Studies. Enviromental Science and Technology, 44 (4), pp 1327–1332. DOI: 10.1021/es901131e 37
Peters, G.M., Rowley, H.V., Wiedemann, S., Tucker,R., Short, M.D. and Schulz, M (2010). Red Meat Production in
Australia and Comparison with Overseas Studies. Enviromental Science and Technology, 44 (4), pp 1327–1332. DOI: 10.1021/es901131e
Kaiser Permanente Group Project
Final Report
Page | 15
One of the most comprehensive studies investigating how LCAs can be applied to food production systems was completed by the UK’s Department of Environment, Food and Rural Affairs (DEFRA).38 DEFRA examined the GHG emissions of dozens of common food products in the UK:
Chicken
A comparison was conducted between three types of chicken production systems: intensive indoor chicken meat (defined as chickens that spend their lifetime indoors, fed on predominantly cereal based diet); extensive outdoor chicken meat (defined as chickens that have access to outdoors for 6% of life based on an initial housed period followed by limited access to the outdoors, fed on a predominantly cereal based diet); and organic outdoor chicken meat – (defined as chickens who have access to outdoors for 12% of life based on an initial housed period followed by some restriction to outdoors, at organic stocking densities and fed on an organic cereal based diet). The study found that the intensive system had the lowest GHG emissions and that raw materials had the great impact in all systems. Within raw materials, feed provided the largest contribution to GHG emissions. In terms of processes, animal and soil emissions (N2O and CH4) and waste (animal remains) were the major sources of GHG emissions.
Milk
A comparison was conducted between three types of milk production systems: intensive high yielding milk (defined as originating from a dairy herd with high inputs of feed, spending 48% of time grazing, and fed maize and grass silage and cereals); extensive low yielding milk (defined as originating from a dairy herd with low inputs of feed, spending 48% of time grazing, and fed maize and grass silage and cereals); and organic milk (defined as originating from a dairy herd raised to organic standards on organic feed, spending 53% of time grazing, and fed grass silage and cereals). The study found that the intensive system had the lowest emissions and that animal and soil emissions had the greatest impact in all systems. For all three systems, feed provided the largest contribution to GHG emissions of raw materials, while animal and soil emissions (N2O and CH4) and waste (animal remains) were major contributors to the GHG emissions of all three processes.
Cereal
A comparison was conducted between four types of cereal production systems: intensive winter feed wheat, extensive spring feed wheat, organic winter feed wheat and winter feed barley. The study found that the extensive spring wheat system had the lowest emissions and raw materials and soil emissions had the greatest impacts in all three systems. In the conventional systems, nitrogen was the major contributor to the GHG emissions of raw materials. In the organic systems, however, the emissions from the fertility building crop were responsible for the greatest raw material GHG emissions. In terms of processes, soil emissions (from N20 and N application) offered the great contribution to GHG emissions.
Tomatoes
A comparison was conducted between three types of tomato production systems: UK conventional oil heated tomatoes, which are produced intensively in UK glasshouses heated using oil or LPG; UK conventional waste heat tomatoes, which are produced intensively in UK glasshouses heated using waste heat from alternative supplies; and Spanish conventional tomatoes, which are produced intensively in Spanish glasshouses with low heat requirements and slightly reduced fertilizer inputs (they are shipped by refrigerated truck from Spain to the UK). The study found that The UK waste heat system had the lowest emissions. In UK waste heat system, raw materials were the greatest contributor to GHG emissions; in the conventional oil heating system, the energy used for heating was the most significant component. Transportation was a significant component of the Spanish system. Specifically in the raw materials analysis, nitrogen and Rockwool slabs were the main contributors to GHG
38
Department of Environment, Food and Rural Affairs. (2009). Scenario building to test and inform the development of a BSI method for assessing GHG emissions from food. Finance, 5(020).
Kaiser Permanente Group Project
Final Report
Page | 16
emissions. In terms of emissions from processes, soil emissions (N2O from N application) were the major contributors.
Foods from Overseas Commodities
The DEFRA research also covered foods from overseas commodities, such as imported coffee and sugar.
Instant coffee
The functional unit (FU) used in the study was a 100 g pack of freeze-dried instant coffee in a glass jar. The coffee was grown in Kenya, by small-scale production, and for the production stage, the assessment was based on 1 kg of cherries delivered to a processing factory. The study assessed how field work was conducted (by hand), pesticide and fertilizer usage, land use and whether the coffee was shade grown or intensive sun-grown. The life cycle state for processing included raw materials processing (including packaging), transportation of raw materials and of final products, resource use during manufacture and waste treatment and disposal. The study found that emissions of GHGs from the coffee were dominated by raw materials input (59%) and soil emissions (40%). In terms of the raw materials, 75% of the emissions were due to releases from nitrogen fertilizer. 99% of GHG emissions from processes used in production of coffee cherries were found to be from soil emissions of N2O.
Sugar
The FU used in this study was a 1 kg paper bag of granulated sugar. The sugar was grown on the largest sugar plantation in Zambia. For the production stage, the assessment was based on 1 kg of sugar cane, harvested and delivered to the local factory. The study assessed transport, fertilizers and pesticides, production and processes. The study found that the largest component of GHG emissions, 46%, came from soil emissions. In terms of raw materials, fertilizers were the major source of GHG emissions, while in terms of processing, soil emissions were the largest contributor of emissions (72%).
Industrial Food Products
Industrial food products are foods produced through an industrialized process line. Common industrial foods studied have included bread, beer and tomato ketchup. Studies on bread, one of the most important industrial food products throughout the world, have included parameters such as crop production methods, milling technologies, bread production processes, packaging and cleaning agents.39 According to these studies, the primary production and transportation stages were found to be highly significant for most impact categories, while the processing stage (baking) was significant in terms of photo-oxidant formation and energy use.40 Koroneos et al. found that the subsystem of bottle production, followed by packaging and beer production, accounted for most GHG emissions.41 In the case of tomato ketchup, packing and food processing were determined to be the “hotspots” for many impact categories.42,43
Complex Food Products
Complex food products are those which contain multiple separately identifiable food components and can be considered stand-alone “ready meals.” One must note that because of the presence of numerous different product lines being combined, a certain level of uncertainty arises when calculating GHG emissions for the final product. A
39 Roy, P., Nei, D., Orikasa, T., Xu, Q. Y., Okadome, H., Nakamura, N., et al. (2009). A review of life cycle assessment (LCA) on some food products. Journal of Food Engineering, 90(1), 1-10. 40
Roy, P., Nei, D., Orikasa, T., Xu, Q. Y., Okadome, H., Nakamura, N., et al. (2009). A review of life cycle assessment (LCA) on some food products. Journal of Food Engineering, 90(1), 1-10. 41 Koroneos, C. (2005). Life cycle assessment of beer production in Greece. Journal of Cleaner Production, 13(4), 433-439. doi: 10.1016/j.jclepro.2003.09.010 42
Andersson, K. (1998). Screening life cycle assessment (LCA) of tomato ketchup: a case study. Journal of Cleaner Production, 6(3-4), 277-288. doi: 10.1016/S0959-6526(98)00027-4. 43 Andersson K, Ohlsson T. Including Environmental Aspects in Production Development: A Case Study of Tomato Ketchup. Lebensmittel-Wissenschaft und-Technologie. 1999;32(3):134-141.
Kaiser Permanente Group Project
Final Report
Page | 17
factory typically only monitors energy and water use at the factory level, and currently differentiation of use by production lines or at a product level is not feasible.44
Duck in hoisin sauce
Duck in hoisin sauce is manufactured in a factory that produces a large number of different products, and there are differences in the way the range of products are manufactured.
45 For this study, however, the components of the
meal were generally received, stored, cleaned or washed, assembled by hand and packed.46
The study found that in terms of raw materials, shredded duck and noodles (i.e. largely animal-derived raw materials) were responsible for the largest amount of GHG emissions.47 In terms of packing, the PET tray containing the meal resulted in the highest GHG emissions.48 Transportation was found to have a minimal impact, roughly 0.03%, of the total GHG emissions. However, lack of information regarding the original sources and transportation logistics for many of the meal’s components lead to reliance on assumptions, so this number may imprecise.49 In terms of processing, again lack of information lead to imprecision. The study used production data for the target product and for the factory as a whole and from that calculated that the target product accounted for 0.42% of the total output for the factory.50 Waste was analyzed by whether the waste underwent effluent treatment or was disposed of in a landfill and was found to have minimal GHG emissions compared to the other sectors.
51
Packaging
Packaging is a fundamental element of almost every food product and can also be considered in LCA analyses of food products for this reason. LCAs of packaging have concluded that the production stage of the packaging system is the major source of environmental impacts.52 For example, Hospido et al. found that the production and transportation of packaging materials contribute to one-third of the total global environmental impact of the life cycle of beer in the case of glass beer bottles.53 In a comparative study on egg packaging, Zabaniotou and Kassidi concluded that polystyrene packages contribute more to acidification and smog and that recycled paper packages contribute more to heavy metal and heavy carcinogenic releases.54 Hyde et al. expanded the scope of LCA packaging by offering predictions of economic impacts to the industry.55 They argued that a 12% reduction of raw
44 Department of Environment, Food and Rural Affairs. (2009). Scenario building to test and inform the development of a BSI method for assessing GHG emissions from food. Finance, 5(020). 45 Department of Environment, Food and Rural Affairs. (2009). Scenario building to test and inform the development of a BSI method for assessing GHG emissions from food. Finance, 5(020). 46 Department of Environment, Food and Rural Affairs. (2009). Scenario building to test and inform the development of a BSI method for assessing GHG emissions from food. Finance, 5(020). 47 Department of Environment, Food and Rural Affairs. (2009). Scenario building to test and inform the development of a BSI method for assessing GHG emissions from food. Finance, 5(020). 48
Department of Environment, Food and Rural Affairs. (2009). Scenario building to test and inform the development of a BSI method for assessing GHG emissions from food. Finance, 5(020). 49
Department of Environment, Food and Rural Affairs. (2009). Scenario building to test and inform the development of a BSI method for assessing GHG emissions from food. Finance, 5(020). 50
Department of Environment, Food and Rural Affairs. (2009). Scenario building to test and inform the development of a BSI method for assessing GHG emissions from food. Finance, 5(020). 51 Department of Environment, Food and Rural Affairs. (2009). Scenario building to test and inform the development of a BSI method for assessing GHG emissions from food. Finance, 5(020). 52 Roy, P., Nei, D., Orikasa, T., Xu, Q. Y., Okadome, H., Nakamura, N., et al. (2009). A review of life cycle assessment (LCA) on some food products. Journal of Food Engineering, 90(1), 1-10. 53 Hospido, A.; Moreira, M.T.; & Feijoo, G (2005). Environmental analysis of beer production. International Journal of Agricultural Resources, Governance and Ecology, 4(2), 152-162. 54
Zabaniotou, A. & Kassidi, E. (2003). Life cycle assessment applied to egg packaging made from polystyrene and recycled paper. Journal of Cleaner Production, 11(5), 549-559. doi: 10.1016/S0959-6526(02)00076-8. 55 Hyde, K.; Smith, A.; Smith, M.; & Henningson, S. (2001). The challenge of waste minimisation in the food
Kaiser Permanente Group Project
Final Report
Page | 18
materials in the food and beverage industry can make a large contribution to company profitability by improving yields per unit output and by reducing costs associated with waste disposal.56
Food Miles
Food production and its long-distance transportation have been a source of debate regarding which of the two factors has more of an environmental impact in terms of GHG and other emissions. The Weber and Matthews’s paper sought to assess the impact of food miles and came up with interesting results using I/O LCA.
57Food miles
are a measure of how far the food has travelled from its production to its final consumption, and it has been believed that transportation involved in moving food over large distances results in greater GHG emissions than the production of food. The results in this paper, derived using I/O LCA, however showed that food production has a greater environmental impact and that to make more sustainable food choices, reducing consumption of energy intensive foods such as red meat is a better option rather than locally sourcing the entire household’s food.
Food Waste Management Systems
Food waste management systems can also be examined through LCA. For example, Ramjeawon concluded that wastewater in the sugar cane industry of Mauritius should be separated into two or three different streams.58 In this way, the most polluted waste water could be processed separately from relatively unpolluted water, thereby reducing the scale and expense of treatment required.
59 Another study by Hirai et al. assessed four food waste
treatment scenarios – incineration, incineration after bio-gasification, bio-gasification followed by composting and composting- and found that the contribution to GHG emissions and toxic chemical releases were lower in the scenarios with a bio-gasification process.60 In a similar LCA of food waste management systems, Nyland et al. found that material recycling followed by incineration is a more environmentally benign option than direct waste incineration.61 Overall, Roy et al. concludes that LCA studies on food waste management systems indicate that alternate waste systems are useful but that integrated waste management systems are much better at reducing overall the environmental burdens of food waste.62 As the above studies demonstrate, there have been a number of LCA studies conducted on certain aspects of specific food products, such as packaging or the entire life cycle of an item. Unlike these studies, however, this Group Project focuses on determining the environmental impacts of a complete system of food purchasing.
and drink industry: a demonstration project in East Anglia, UK. Journal of Cleaner Production, 9(1), 57-64. doi: 10.1016/S0959-6526(00)00050-0. 56
Hyde, K.; Smith, A.; Smith, M.; & Henningson, S. (2001). The challenge of waste minimisation in the food and drink industry: a demonstration project in East Anglia, UK. Journal of Cleaner Production, 9(1), 57-64. doi: 10.1016/S0959-6526(00)00050-0. 57
Weber, C.L., Matthews, S.H. (2008). Food-Miles and the Relative Climate Impacts of Food Choices in the United States. Environmental Science & Technology 42 (10), 3508-3513. 58 Ramjeawon, T. (2000). Cleaner production in Mauritian cane-sugar factories. World, 8, 503-510. 59
Ramjeawon, T. (2000). Cleaner production in Mauritian cane-sugar factories. World, 8, 503-510. 60 Hirai, Y.; Murata, M.; Sakai, S.; & Takatsuki, H. (2000). Life cycle assessment for food waste recycling and management. In: Proceedings of the Fourth International Conference on Ecobalance, Tsukuba, Japan. Retrieved May 16, 2010 from http://homepage1.nifty.com/eco/pdf/ecobalanceE.pdf 61 Nyland, C. A., Modahl, I. S., Raadal, H. L., & Hanssen, O. J. (2003). Application of LCA as a decision-making tool for waste management systems. The International Journal of Life Cycle Assessment, 8(6), 331-336. doi: 10.1007/BF02978506 62 Roy, P., Nei, D., Orikasa, T., Xu, Q. Y., Okadome, H., Nakamura, N., et al. (2009). A review of life cycle assessment (LCA) on some food products. Journal of Food Engineering, 90(1), 1-10.
Kaiser Permanente Group Project
Final Report
Page | 19
6. Methodology
6.1 Economic Input-Output Models
Background
One approach to life cycle assessment for a product or service is through economic input-output models. Economic input-output (EIO) LCA models are a top-down approach to LCA. They are based off of national economic input-output (IO) tables, which represent the monetary transactions between industry sectors in mathematical form and therefore indicate what goods or services are consumed by other industries. In the US, IO tables (benchmark accounts) are created by the Bureau of Economic Analysis (BEA) every five years and represent the transactions among some 400 industry sectors as determined by the North American Industry Classification System (NAICS).
63 They are constructed based on survey data from a sample of all operating facilities in the various
sectors64
. The surveys are conducted by the Bureau of the Census.65
The benchmark accounts are presented in a variety of different forms: standard make and use tables and several supplementary tables, which include modified standard make and use tables and four requirements tables.66 Make tables show the commodities that are produced by each industry and use tables show the inputs to industry production and the commodities that are consumed by final users.67 The requirements tables, which are derived from the supplementary make and use tables, are slightly more complex because unlike the standard tables they are constructed after redefinitions or reclassifications.68 Redefinitions refer to instances where the BEA moves the outputs or inputs of some secondary production activities between industries. This is done in one of two cases: when the BEA decides that a product that the Census Bureau has designated as a primary product should instead be a secondary product for IO purposes or when a product is primary to more than one industry.69 For example, according to the Census Bureau’s classification system, the primary product of the newspaper industry is newspaper sales and newspaper advertising. However the BEA sees the primary product of the newspaper as industry newspapers while advertising is treated as a secondary product of the industry. Advertising is then reclassified to the advertising commodity.70 Redefinitions are also done when different production processes are used to produce the same final product. An example of this would be the reclassification of sheets, which can be constructed by knitting or
63
Bureau of Economic Analysis (2011). Industry Economic Accounts Information Guide. Retrieved February 15, 2011 from http://www.bea.gov/industry/iedguide.htm 64 Bureau of Economic Analysis (2011). Industry Economic Accounts Information Guide. Retrieved February 15, 2011 from http://www.bea.gov/industry/iedguide.htm 65
Bureau of Economic Analysis (2011). Industry Economic Accounts Information Guide. Retrieved February 15, 2011 from http://www.bea.gov/industry/iedguide.htm 66
Bureau of Economic Analysis (2011). Industry Economic Accounts Information Guide. Retrieved February 15, 2011 from http://www.bea.gov/industry/iedguide.htm 67 Bureau of Economic Analysis (2011). Industry Economic Accounts Information Guide. Retrieved February 15, 2011 from http://www.bea.gov/industry/iedguide.htm 68 Bureau of Economic Analysis (2011). Industry Economic Accounts Information Guide. Retrieved February 15, 2011 from http://www.bea.gov/industry/iedguide.htm 69
Implan (n.d.). The controlled vocabulary of IMPLAN-specific terms. Retrieved March 13, 2011 from http://www.implan.com/V4/index.php?option=com_glossary&task=list&glossid=13&letter=R
70 Implan (n.d.). The controlled vocabulary of IMPLAN-specific terms. Retrieved March 13, 2011 from http://www.implan.com/V4/index.php?option=com_glossary&task=list&glossid=13&letter=R
Kaiser Permanente Group Project
Final Report
Page | 20
weaving mills or by purchasing fabric. The BEA will treat all sheets as a single commodity and regroup them as the product of curtain and linen mills.71 These Redefinitions are required for the derivation of the requirements tables. There are four types of requirements tables: commodity-by-industry direct requirements, commodity-by-commodity total requirements, industry-by-commodity total requirements and industry-by-industry total requirements.72 The direct requirements table shows the amount of a commodity that is required by an industry to produce a dollar of the industry’s output, while the total requirements tables show the production that is required, directly and indirectly, from each industry and each commodity to deliver a dollar of a commodity to final users.
73 EIO models will apply a calculation procedure to one of these requirements tables to derive another table
that fits the needs of the model.
Derivation of IO Tables
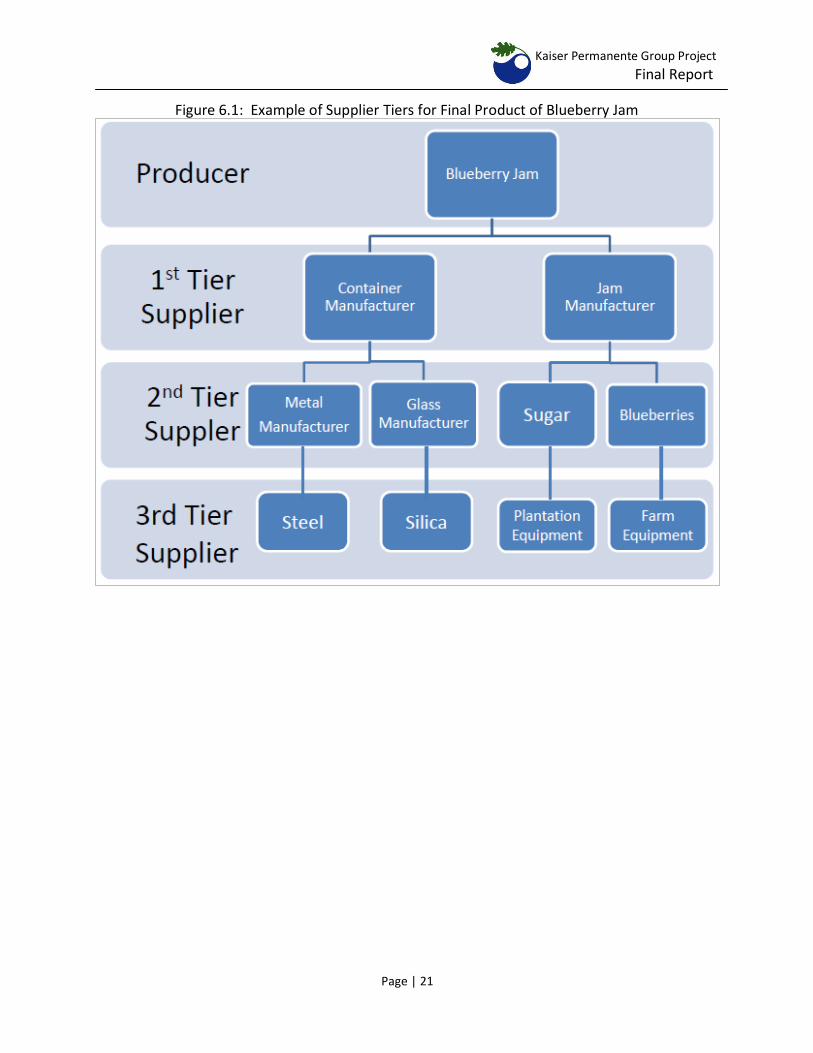
To visualize the interrelationships between different sectors in a given economy, suppliers are first categorized into different tiers. In this simplified example, the final product is blueberry jam. To produce blueberry jam, containers and jam itself are needed as inputs. These inputs to the final producer are the outputs of the first tier suppliers. Next, to produce containers, metal and glass are needed, and to produce jam, sugar and blueberries are needed. The outputs of the second tier suppliers - metal, glass, sugar and blueberry industries - are considered inputs to the first tier suppliers. Likewise the outputs of the third tier suppliers are considered inputs to the second tier suppliers and so on.
71 Implan (n.d.). The controlled vocabulary of IMPLAN-specific terms. Retrieved March 13, 2011 from http://www.implan.com/V4/index.php?option=com_glossary&task=list&glossid=13&letter=R 72
Bureau of Economic Analysis (2011). Industry Economic Accounts Information Guide. Retrieved February 15, 2011 from http://www.bea.gov/industry/iedguide.htm 73 Bureau of Economic Analysis (2011). Industry Economic Accounts Information Guide. Retrieved February 15, 2011 from http://www.bea.gov/industry/iedguide.htm
Kaiser Permanente Group Project
Final Report
Page | 21
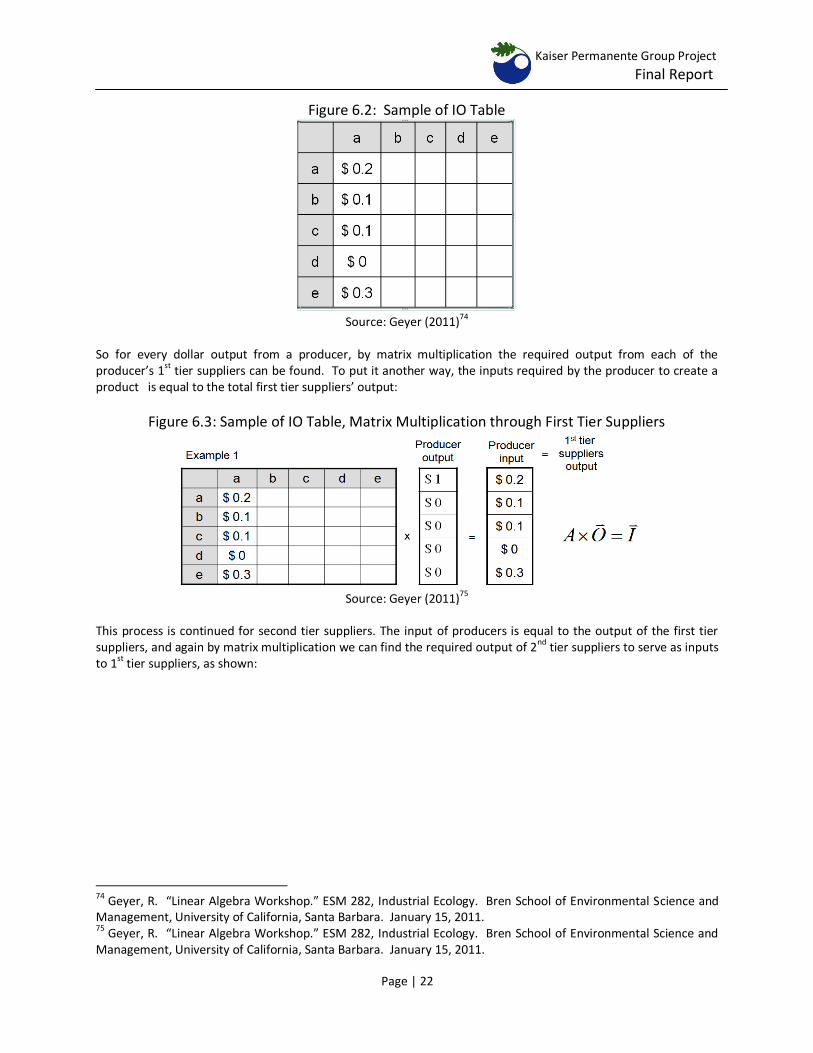
Figure 6.1: Example of Supplier Tiers for Final Product of Blueberry Jam EIO tables mathematically portray all of these inter-industry relationships that result from these transactions between industries. The tables are usually presented in matrix form where each row and each column represent a single industry sector, and the intersection of a row and column identifies the economic value of output from the row sector that is used as input to the column sector. In this example, 10 cents of input from sector C are required to produce $1 of output from sector A:
Kaiser Permanente Group Project
Final Report
Page | 22
Figure 6.2: Sample of IO Table
Source: Geyer (2011)74
So for every dollar output from a producer, by matrix multiplication the required output from each of the producer’s 1st tier suppliers can be found. To put it another way, the inputs required by the producer to create a product is equal to the total first tier suppliers’ output:
Figure 6.3: Sample of IO Table, Matrix Multiplication through First Tier Suppliers
Source: Geyer (2011)
75
This process is continued for second tier suppliers. The input of producers is equal to the output of the first tier suppliers, and again by matrix multiplication we can find the required output of 2nd tier suppliers to serve as inputs to 1st tier suppliers, as shown:
74
Geyer, R. “Linear Algebra Workshop.” ESM 282, Industrial Ecology. Bren School of Environmental Science and Management, University of California, Santa Barbara. January 15, 2011. 75 Geyer, R. “Linear Algebra Workshop.” ESM 282, Industrial Ecology. Bren School of Environmental Science and Management, University of California, Santa Barbara. January 15, 2011.
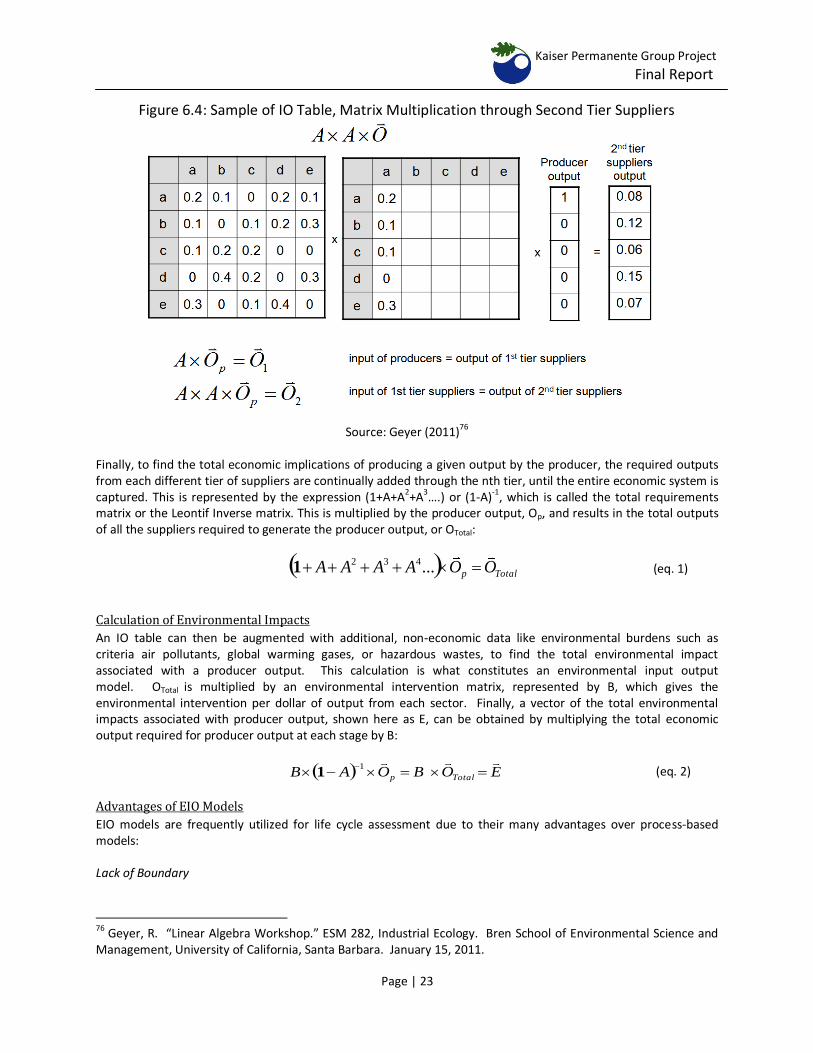
Kaiser Permanente Group Project
Final Report
Page | 23
Figure 6.4: Sample of IO Table, Matrix Multiplication through Second Tier Suppliers
Source: Geyer (2011)76
Finally, to find the total economic implications of producing a given output by the producer, the required outputs from each different tier of suppliers are continually added through the nth tier, until the entire economic system is captured. This is represented by the expression (1+A+A2+A3….) or (1-A)-1, which is called the total requirements matrix or the Leontif Inverse matrix. This is multiplied by the producer output, Op, and results in the total outputs of all the suppliers required to generate the producer output, or OTotal:
Totalp OOAAAA ...4321 (eq. 1)
Calculation of Environmental Impacts
An IO table can then be augmented with additional, non-economic data like environmental burdens such as criteria air pollutants, global warming gases, or hazardous wastes, to find the total environmental impact associated with a producer output. This calculation is what constitutes an environmental input output model. OTotal is multiplied by an environmental intervention matrix, represented by B, which gives the environmental intervention per dollar of output from each sector. Finally, a vector of the total environmental impacts associated with producer output, shown here as E, can be obtained by multiplying the total economic output required for producer output at each stage by B:
EOBOAB Totalp 1
1 (eq. 2)
Advantages of EIO Models
EIO models are frequently utilized for life cycle assessment due to their many advantages over process-based models: Lack of Boundary
76 Geyer, R. “Linear Algebra Workshop.” ESM 282, Industrial Ecology. Bren School of Environmental Science and Management, University of California, Santa Barbara. January 15, 2011.
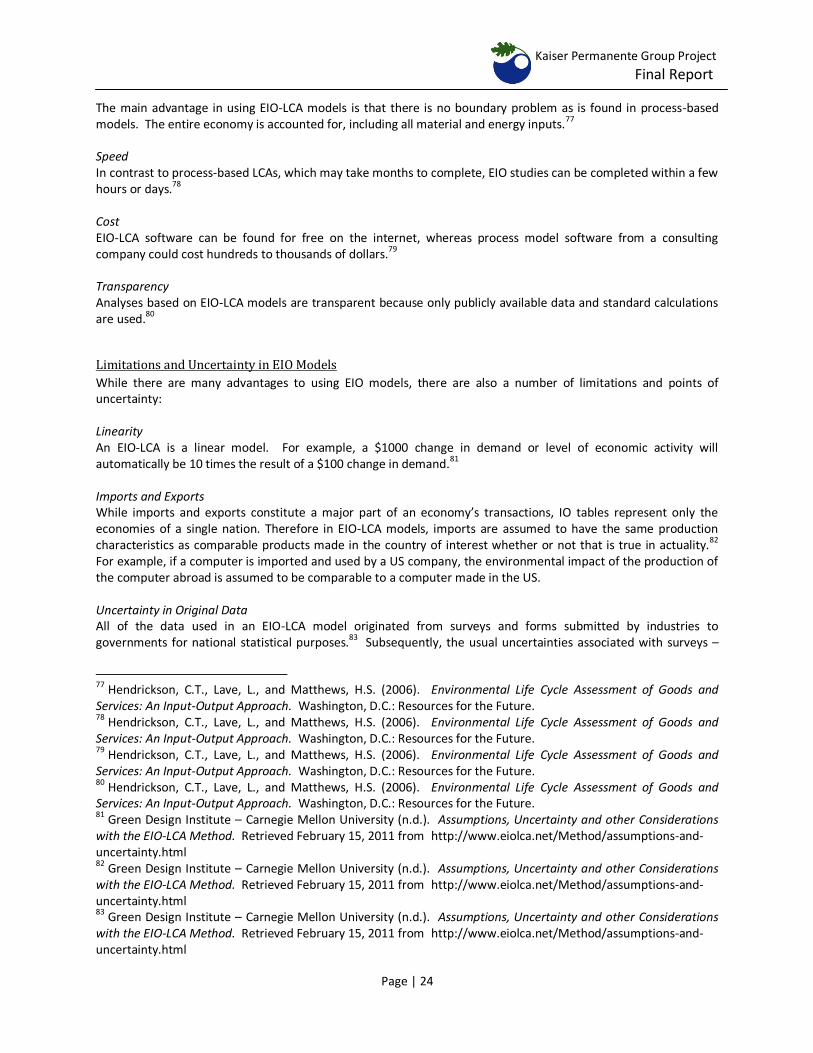
Kaiser Permanente Group Project
Final Report
Page | 24
The main advantage in using EIO-LCA models is that there is no boundary problem as is found in process-based models. The entire economy is accounted for, including all material and energy inputs.77 Speed In contrast to process-based LCAs, which may take months to complete, EIO studies can be completed within a few hours or days.78 Cost EIO-LCA software can be found for free on the internet, whereas process model software from a consulting company could cost hundreds to thousands of dollars.
79
Transparency Analyses based on EIO-LCA models are transparent because only publicly available data and standard calculations are used.80
Limitations and Uncertainty in EIO Models
While there are many advantages to using EIO models, there are also a number of limitations and points of uncertainty: Linearity An EIO-LCA is a linear model. For example, a $1000 change in demand or level of economic activity will automatically be 10 times the result of a $100 change in demand.81 Imports and Exports While imports and exports constitute a major part of an economy’s transactions, IO tables represent only the economies of a single nation. Therefore in EIO-LCA models, imports are assumed to have the same production characteristics as comparable products made in the country of interest whether or not that is true in actuality.82 For example, if a computer is imported and used by a US company, the environmental impact of the production of the computer abroad is assumed to be comparable to a computer made in the US. Uncertainty in Original Data All of the data used in an EIO-LCA model originated from surveys and forms submitted by industries to governments for national statistical purposes.83 Subsequently, the usual uncertainties associated with surveys –
77
Hendrickson, C.T., Lave, L., and Matthews, H.S. (2006). Environmental Life Cycle Assessment of Goods and Services: An Input-Output Approach. Washington, D.C.: Resources for the Future. 78
Hendrickson, C.T., Lave, L., and Matthews, H.S. (2006). Environmental Life Cycle Assessment of Goods and Services: An Input-Output Approach. Washington, D.C.: Resources for the Future. 79
Hendrickson, C.T., Lave, L., and Matthews, H.S. (2006). Environmental Life Cycle Assessment of Goods and Services: An Input-Output Approach. Washington, D.C.: Resources for the Future. 80 Hendrickson, C.T., Lave, L., and Matthews, H.S. (2006). Environmental Life Cycle Assessment of Goods and Services: An Input-Output Approach. Washington, D.C.: Resources for the Future. 81
Green Design Institute – Carnegie Mellon University (n.d.). Assumptions, Uncertainty and other Considerations with the EIO-LCA Method. Retrieved February 15, 2011 from http://www.eiolca.net/Method/assumptions-and-uncertainty.html 82 Green Design Institute – Carnegie Mellon University (n.d.). Assumptions, Uncertainty and other Considerations with the EIO-LCA Method. Retrieved February 15, 2011 from http://www.eiolca.net/Method/assumptions-and-uncertainty.html 83
Green Design Institute – Carnegie Mellon University (n.d.). Assumptions, Uncertainty and other Considerations with the EIO-LCA Method. Retrieved February 15, 2011 from http://www.eiolca.net/Method/assumptions-and-uncertainty.html
Kaiser Permanente Group Project
Final Report
Page | 25
such as sampling errors, response rate, missing/incomplete data, and so on – are also inherent in the EIO-LCA models.84 Old Data The data within an EIO-LCA model are representative of the year of the model, so consideration should be taken when applying the model to current conditions. While some industries may not exhibit dramatic change over years, others will, due to technological advances, consumer trends, etc. Likewise, environmental data can also change over time due to advances in process efficiency, government regulation and so on.85 Incomplete Original Data The original economic and environmental data compiled within the EIO-LCA may also be incomplete in that they underestimate true values. For example, only certain facilities – that reach a certain emissions threshold or are under certain industry classifications - are required to submit toxics release data. As a result, the real value of toxic emissions may be underestimated. The same issue may also arise for other environmental data sources.86 Aggregation of Original Data Sometimes data is categorized in a way that does not directly correspond to the economic input-output sectors specified in the IO matrix. For example, the USDA categories farms by crop type, not using NAICS. In these cases, values must be allocated to the appropriate using weighted averages, or information from other data sources or publications.87 Aggregation of Sectors The aggregation of sectors within an EIO model is the most significant disadvantage to this LCA approach. Since IO tables aggregate data based on sectors, not by detailed data for a process, EIO LCAs may not be able to accurately represent a given process.88 For example, an IO table cannot distinguish between a product created using old technology and a product created using newer technology (i.e. generating electricity from an old coal plant versus using a new combined-cycle gas turbine).89 An IO table may also aggregate the information for several different industry types into one industry sector, which again leads to uncertainty in how a particular industry is modeled.90 For instance, according to NAICS, all soft drink manufacturing falls into the same industry category. While processes and purchases may differ between beverage companies and products, an EIO LCA is unable to capture those differences.
84 Green Design Institute – Carnegie Mellon University (n.d.). Assumptions, Uncertainty and other Considerations with the EIO-LCA Method. Retrieved February 15, 2011 from http://www.eiolca.net/Method/assumptions-and-uncertainty.html 85
Green Design Institute – Carnegie Mellon University (n.d.). Assumptions, Uncertainty and other Considerations with the EIO-LCA Method. Retrieved February 15, 2011 from http://www.eiolca.net/Method/assumptions-and-uncertainty.html 86
Green Design Institute – Carnegie Mellon University (n.d.). Assumptions, Uncertainty and other Considerations with the EIO-LCA Method. Retrieved February 15, 2011 from http://www.eiolca.net/Method/assumptions-and-uncertainty.html 87 Green Design Institute – Carnegie Mellon University (n.d.). Assumptions, Uncertainty and other Considerations with the EIO-LCA Method. Retrieved February 15, 2011 from http://www.eiolca.net/Method/assumptions-and-uncertainty.html 88 Hendrickson, C.T., Lave, L., and Matthews, H.S. (2006). Environmental Life Cycle Assessment of Goods and Services: An Input-Output Approach. Washington, D.C.: Resources for the Future. 89 Hendrickson, C.T., Lave, L., and Matthews, H.S. (2006). Environmental Life Cycle Assessment of Goods and Services: An Input-Output Approach. Washington, D.C.: Resources for the Future. 90
Green Design Institute – Carnegie Mellon University (n.d.). Assumptions, Uncertainty and other Considerations with the EIO-LCA Method. Retrieved February 15, 2011 from http://www.eiolca.net/Method/assumptions-and-uncertainty.html
Kaiser Permanente Group Project
Final Report
Page | 26
Available EIO Models
There are currently only two EIO models available for the US. One is the Comprehensive Environmental Data Archive, and the other is Carnegie Mellon University’s EIO-LCA.
6.2 Comprehensive Environmental Data Archive 4.0 The Comprehensive Environmental Data Archive, or CEDA, was developed at the Institute of Environmental Sciences at Leiden University around the year 2000 and was built off of earlier databases known as Missing Inventory Estimation Tool (MIET). MIET 1.0 was first released in 2001, and a subsequent version in 2002 offered improved calculation algorithms and expanded coverage of environmental emissions.
91 The 2003 version of MIET
was re-named CEDA and used 1998 input output tables and environmental statistics, covering around 1,300 different environmental interventions.
92
The latest version of the program, CEDA 4.0, was released in 2009 and was even more comprehensive than its predecessors due to three major updates. First, utilizing input output tables and environmental statistics from 2002, CEDA 4.0 offered users the choice between two allocation methods – economic allocation and system expansion or only economic allocation - to assign environmental interventions to relevant economic category.93 Second, users were also now able to choose whether or not to exclude capital goods in the supply chain. According to the UK’s Publicly Available Specification (PAS) 2050 for carbon footprinting, capital goods (and thus their carbon emissions) should be excluded from the system, but CEDA 3.0 included them.94 In CEDA 4.0, only the standard version does. Third, the number of environmental interventions increased in CEDA 4.0 to over 2,500 and now included data on water use, total fossil energy consumption, and emission of 17 different dioxin types.95
Source of Economic Data
CEDA 4.0 utilizes the 2002 annual input-output tables produced by the BEA.96 Specifically, CEDA uses make and use tables before and after redefinition to create a technology matrix. Redefined flows are identified by comparing the matrices before and after redefinition, and these flows are then used for reproducing the mixed-unit technology approach employed by the BEA.97 This IO table is derived through a combination of economic allocation and system expansion (the mixed-technology approach). Another IO table that is only based on economic allocation is also produced. A CEDA user is given the choice to use either of the two allocation methods. This final matrix is called the Direct Requirement Matrix (Matrix A) and the choice of allocation method is denoted by an identifier a (economic value-based allocation) or b (mixed technology model).
91
Suh, S. (2009). Developing the Sectoral Environmental Database for Input-Output Analysis: Comprehensive Environmental Data Archive of the US. In S.Suh (Ed.), Handbook of Input-Output Economics in Industrial Ecology, Eco-Efficiency in Industry and Science, 23 (8), 689-712. New York: Springer Science+Business Media. 92
Suh, S. (2009). Developing the Sectoral Environmental Database for Input-Output Analysis: Comprehensive Environmental Data Archive of the US. In S.Suh (Ed.), Handbook of Input-Output Economics in Industrial Ecology, Eco-Efficiency in Industry and Science, 23 (8), 689-712. New York: Springer Science+Business Media. 93 Suh, S. (2010). CEDA 4.0 User’s Guide. Retrieved from personal contact with Dr. Sangwon Suh on November 11, 2010. 94 Publicly Available Specification 2050. Retrieved March 14, 2011 from http://www.bsigroup.com/Standards-and-Publications/How-we-can-help-you/Professional-Standards-Service/PAS-2050 95 Suh, S. (2010). CEDA 4.0 User’s Guide. Retrieved from personal contact with Dr. Sangwon Suh on November 11, 2010. 96
Suh, S. (2010). CEDA 4.0 User’s Guide. Retrieved from personal contact with Dr. Sangwon Suh on November 11, 2010. 97 Suh, S. (2010). CEDA 4.0 User’s Guide. Retrieved from personal contact with Dr. Sangwon Suh on November 11, 2010.
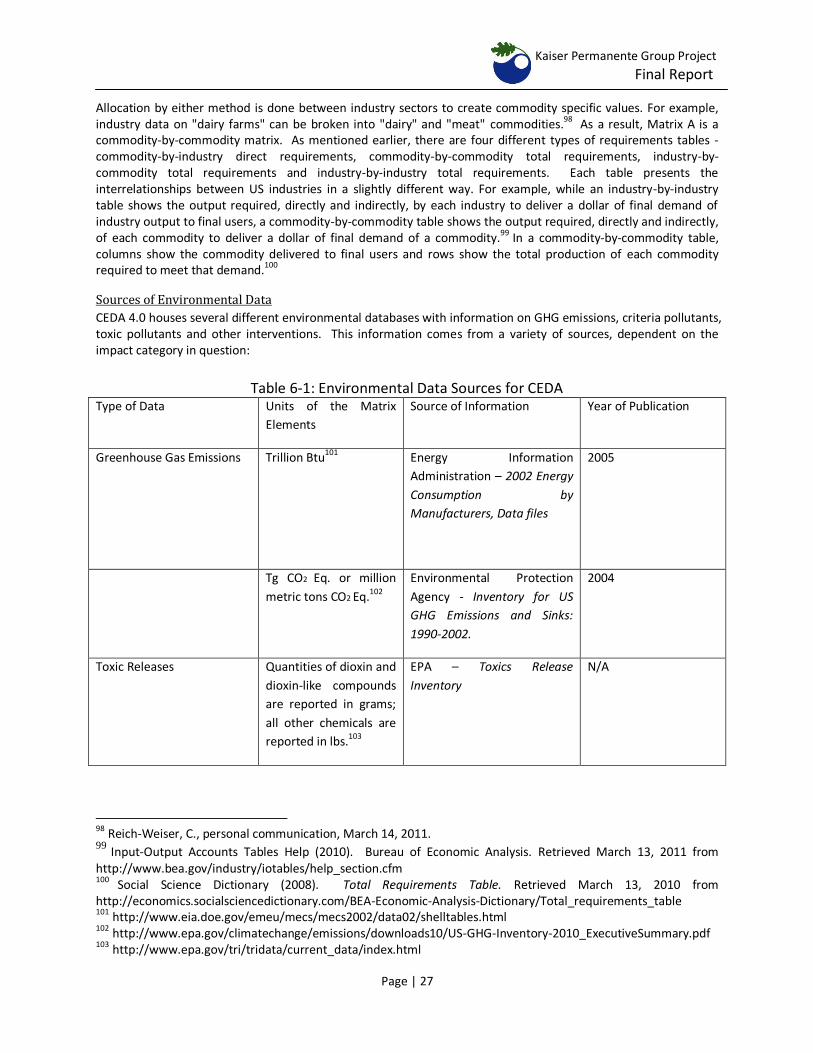
Kaiser Permanente Group Project
Final Report
Page | 27
Allocation by either method is done between industry sectors to create commodity specific values. For example, industry data on "dairy farms" can be broken into "dairy" and "meat" commodities.98 As a result, Matrix A is a commodity-by-commodity matrix. As mentioned earlier, there are four different types of requirements tables - commodity-by-industry direct requirements, commodity-by-commodity total requirements, industry-by-commodity total requirements and industry-by-industry total requirements. Each table presents the interrelationships between US industries in a slightly different way. For example, while an industry-by-industry table shows the output required, directly and indirectly, by each industry to deliver a dollar of final demand of industry output to final users, a commodity-by-commodity table shows the output required, directly and indirectly, of each commodity to deliver a dollar of final demand of a commodity.
99 In a commodity-by-commodity table,
columns show the commodity delivered to final users and rows show the total production of each commodity required to meet that demand.
100
Sources of Environmental Data
CEDA 4.0 houses several different environmental databases with information on GHG emissions, criteria pollutants, toxic pollutants and other interventions. This information comes from a variety of sources, dependent on the impact category in question:
Table 6-1: Environmental Data Sources for CEDA
Type of Data Units of the Matrix
Elements
Source of Information Year of Publication
Greenhouse Gas Emissions Trillion Btu101 Energy Information
Administration – 2002 Energy
Consumption by
Manufacturers, Data files
2005
Tg CO2 Eq. or million
metric tons CO2 Eq.102
Environmental Protection
Agency - Inventory for US
GHG Emissions and Sinks:
1990-2002.
2004
Toxic Releases Quantities of dioxin and
dioxin-like compounds
are reported in grams;
all other chemicals are
reported in lbs.103
EPA – Toxics Release
Inventory
N/A
98 Reich-Weiser, C., personal communication, March 14, 2011. 99
Input-Output Accounts Tables Help (2010). Bureau of Economic Analysis. Retrieved March 13, 2011 from http://www.bea.gov/industry/iotables/help_section.cfm 100 Social Science Dictionary (2008). Total Requirements Table. Retrieved March 13, 2010 from http://economics.socialsciencedictionary.com/BEA-Economic-Analysis-Dictionary/Total_requirements_table 101
http://www.eia.doe.gov/emeu/mecs/mecs2002/data02/shelltables.html 102 http://www.epa.gov/climatechange/emissions/downloads10/US-GHG-Inventory-2010_ExecutiveSummary.pdf 103 http://www.epa.gov/tri/tridata/current_data/index.html
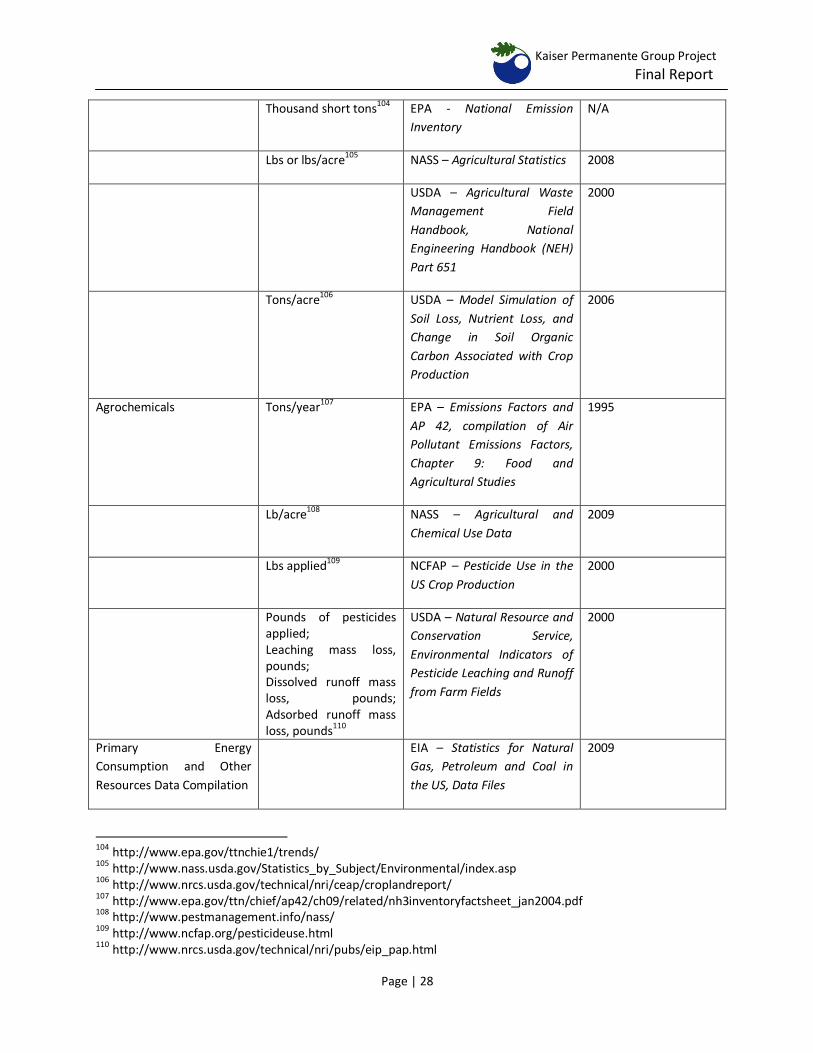
Kaiser Permanente Group Project
Final Report
Page | 28
Thousand short tons104 EPA - National Emission
Inventory
N/A
Lbs or lbs/acre105
NASS – Agricultural Statistics 2008
USDA – Agricultural Waste
Management Field
Handbook, National
Engineering Handbook (NEH)
Part 651
2000
Tons/acre106 USDA – Model Simulation of
Soil Loss, Nutrient Loss, and
Change in Soil Organic
Carbon Associated with Crop
Production
2006
Agrochemicals Tons/year107 EPA – Emissions Factors and
AP 42, compilation of Air
Pollutant Emissions Factors,
Chapter 9: Food and
Agricultural Studies
1995
Lb/acre108 NASS – Agricultural and
Chemical Use Data
2009
Lbs applied109 NCFAP – Pesticide Use in the
US Crop Production
2000
Pounds of pesticides applied; Leaching mass loss, pounds; Dissolved runoff mass loss, pounds; Adsorbed runoff mass loss, pounds
110
USDA – Natural Resource and
Conservation Service,
Environmental Indicators of
Pesticide Leaching and Runoff
from Farm Fields
2000
Primary Energy
Consumption and Other
Resources Data Compilation
EIA – Statistics for Natural
Gas, Petroleum and Coal in
the US, Data Files
2009
104 http://www.epa.gov/ttnchie1/trends/ 105 http://www.nass.usda.gov/Statistics_by_Subject/Environmental/index.asp 106 http://www.nrcs.usda.gov/technical/nri/ceap/croplandreport/ 107
http://www.epa.gov/ttn/chief/ap42/ch09/related/nh3inventoryfactsheet_jan2004.pdf 108
http://www.pestmanagement.info/nass/ 109 http://www.ncfap.org/pesticideuse.html 110 http://www.nrcs.usda.gov/technical/nri/pubs/eip_pap.html
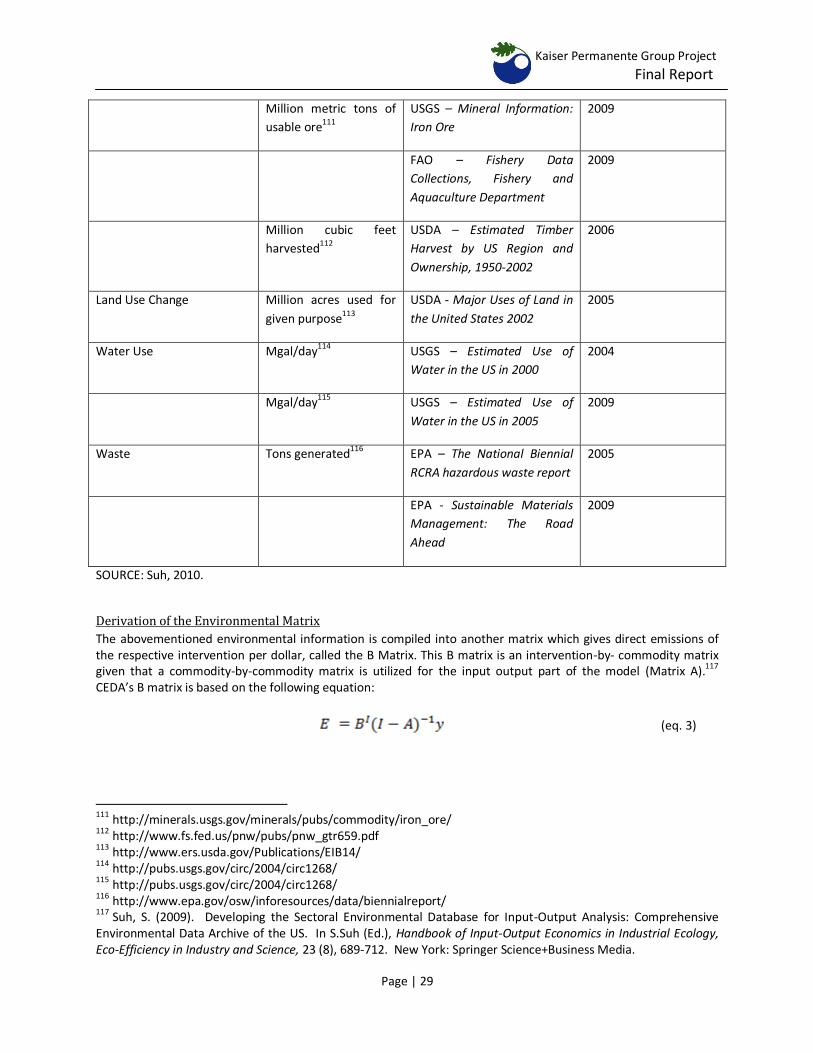
Kaiser Permanente Group Project
Final Report
Page | 29
Million metric tons of
usable ore111
USGS – Mineral Information:
Iron Ore
2009
FAO – Fishery Data
Collections, Fishery and
Aquaculture Department
2009
Million cubic feet
harvested112
USDA – Estimated Timber
Harvest by US Region and
Ownership, 1950-2002
2006
Land Use Change Million acres used for
given purpose113
USDA - Major Uses of Land in
the United States 2002
2005
Water Use Mgal/day114 USGS – Estimated Use of
Water in the US in 2000
2004
Mgal/day115 USGS – Estimated Use of
Water in the US in 2005
2009
Waste Tons generated116 EPA – The National Biennial
RCRA hazardous waste report
2005
EPA - Sustainable Materials
Management: The Road
Ahead
2009
SOURCE: Suh, 2010.
Derivation of the Environmental Matrix
The abovementioned environmental information is compiled into another matrix which gives direct emissions of the respective intervention per dollar, called the B Matrix. This B matrix is an intervention-by- commodity matrix given that a commodity-by-commodity matrix is utilized for the input output part of the model (Matrix A).117 CEDA’s B matrix is based on the following equation:
(eq. 3)
111
http://minerals.usgs.gov/minerals/pubs/commodity/iron_ore/ 112 http://www.fs.fed.us/pnw/pubs/pnw_gtr659.pdf 113 http://www.ers.usda.gov/Publications/EIB14/ 114 http://pubs.usgs.gov/circ/2004/circ1268/ 115 http://pubs.usgs.gov/circ/2004/circ1268/ 116
http://www.epa.gov/osw/inforesources/data/biennialreport/ 117
Suh, S. (2009). Developing the Sectoral Environmental Database for Input-Output Analysis: Comprehensive Environmental Data Archive of the US. In S.Suh (Ed.), Handbook of Input-Output Economics in Industrial Ecology, Eco-Efficiency in Industry and Science, 23 (8), 689-712. New York: Springer Science+Business Media.
Kaiser Permanente Group Project
Final Report
Page | 30
Where:
BI = an environmental intervention by industry matrix representing the environmental interventions caused by
the production of $1 worth of industry output
A = a commodity-by-commodity input-output technology coefficient matrix
y = a final demand vector
E = the total economy-wide environmental intervention calculated by this equation
Matrix elements are given in kgCO2e, kg or kg active ingredient Information on environmental interventions is compiled mainly on an industry rather than commodity basis. In order to assign environmental interventions to specific products, the aggregate environmental intervention of each industry must be assigned to its primary product, as well as its secondary products and scrap.118 CEDA assigns environmental interventions to products through two different methods, giving users the opportunity to choose which they prefer: economic allocation (also known as a type of partitioning method, or the industry technology approach) or a combination of economic allocation and system expansion (also known as the mixed technology method).119 In the industry technology approach, it is assumed that the sum total of environmental interventions by a given industry is assigned proportionally to its primary and secondary products based on their economic value.120 Thus the average environmental intervention due to a dollar’s worth of commodity is calculated on the basis of market share, demonstrated by the following:
(eq. 4)
Where:
BI = an environmental intervention-by-industry matrix representing the environmental interventions caused by the production of $1 worth of industry output
B = environmental intervention-by-commodity matrix
D = market share matrix derived from make and use matrices This method was used for deriving the B Matrix in CEDA. Alternatively CEDA also offers users the choice of utilizing a mixed technology approach, which combines the economic allocation and system expansion methods. Under the system expansion method, it is assumed that each commodity needs the same amount of input requirements and produces the same amount of environmental interventions, irrespective of the industry that produces it. The total environmental intervention of a primary product of a given industry is first calculated by subtracting the total environmental intervention due to secondary products. Next these interventions from secondary products are then assigned to industries producing these secondary products are primary products.121 CEDA combines this method, with the method outlined above for economic allocation, to produce another matrix based on both methods. Similar to the economic data, the choice of allocation method is denoted by an identifier a (economic value-based allocation) or b (mixed technology model).
118 Suh, S. (2009). Developing the Sectoral Environmental Database for Input-Output Analysis: Comprehensive Environmental Data Archive of the US. In S.Suh (Ed.), Handbook of Input-Output Economics in Industrial Ecology, Eco-Efficiency in Industry and Science, 23 (8), 689-712. New York: Springer Science+Business Media. 119 Reich-Weiser, C. personal communication, March 14, 2011. 120 Suh, S. (2009). Developing the Sectoral Environmental Database for Input-Output Analysis: Comprehensive Environmental Data Archive of the US. In S.Suh (Ed.), Handbook of Input-Output Economics in Industrial Ecology, Eco-Efficiency in Industry and Science, 23 (8), 689-712. New York: Springer Science+Business Media. 121
Suh, S. (2009). Developing the Sectoral Environmental Database for Input-Output Analysis: Comprehensive Environmental Data Archive of the US. In S.Suh (Ed.), Handbook of Input-Output Economics in Industrial Ecology, Eco-Efficiency in Industry and Science, 23 (8), 689-712. New York: Springer Science+Business Media.
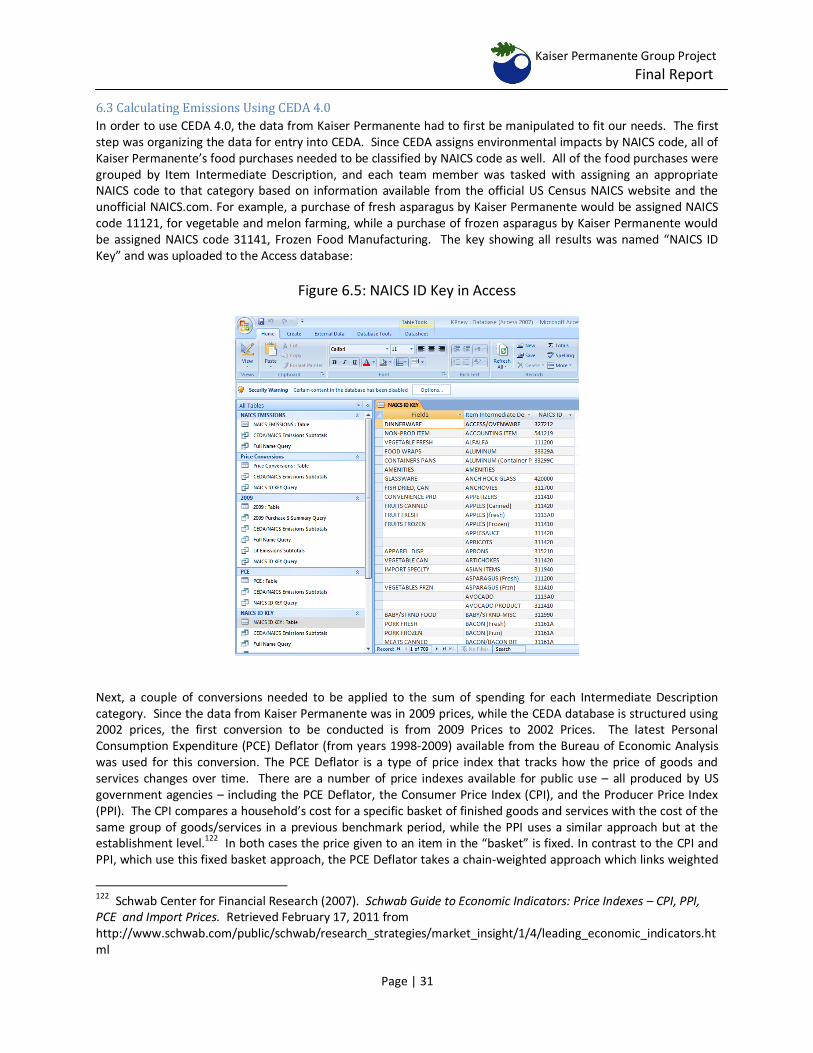
Kaiser Permanente Group Project
Final Report
Page | 31
6.3 Calculating Emissions Using CEDA 4.0
In order to use CEDA 4.0, the data from Kaiser Permanente had to first be manipulated to fit our needs. The first step was organizing the data for entry into CEDA. Since CEDA assigns environmental impacts by NAICS code, all of Kaiser Permanente’s food purchases needed to be classified by NAICS code as well. All of the food purchases were grouped by Item Intermediate Description, and each team member was tasked with assigning an appropriate NAICS code to that category based on information available from the official US Census NAICS website and the unofficial NAICS.com. For example, a purchase of fresh asparagus by Kaiser Permanente would be assigned NAICS code 11121, for vegetable and melon farming, while a purchase of frozen asparagus by Kaiser Permanente would be assigned NAICS code 31141, Frozen Food Manufacturing. The key showing all results was named “NAICS ID Key” and was uploaded to the Access database:
Figure 6.5: NAICS ID Key in Access
Next, a couple of conversions needed to be applied to the sum of spending for each Intermediate Description category. Since the data from Kaiser Permanente was in 2009 prices, while the CEDA database is structured using 2002 prices, the first conversion to be conducted is from 2009 Prices to 2002 Prices. The latest Personal Consumption Expenditure (PCE) Deflator (from years 1998-2009) available from the Bureau of Economic Analysis was used for this conversion. The PCE Deflator is a type of price index that tracks how the price of goods and services changes over time. There are a number of price indexes available for public use – all produced by US government agencies – including the PCE Deflator, the Consumer Price Index (CPI), and the Producer Price Index (PPI). The CPI compares a household’s cost for a specific basket of finished goods and services with the cost of the same group of goods/services in a previous benchmark period, while the PPI uses a similar approach but at the establishment level.
122 In both cases the price given to an item in the “basket” is fixed. In contrast to the CPI and
PPI, which use this fixed basket approach, the PCE Deflator takes a chain-weighted approach which links weighted
122
Schwab Center for Financial Research (2007). Schwab Guide to Economic Indicators: Price Indexes – CPI, PPI, PCE and Import Prices. Retrieved February 17, 2011 from http://www.schwab.com/public/schwab/research_strategies/market_insight/1/4/leading_economic_indicators.html
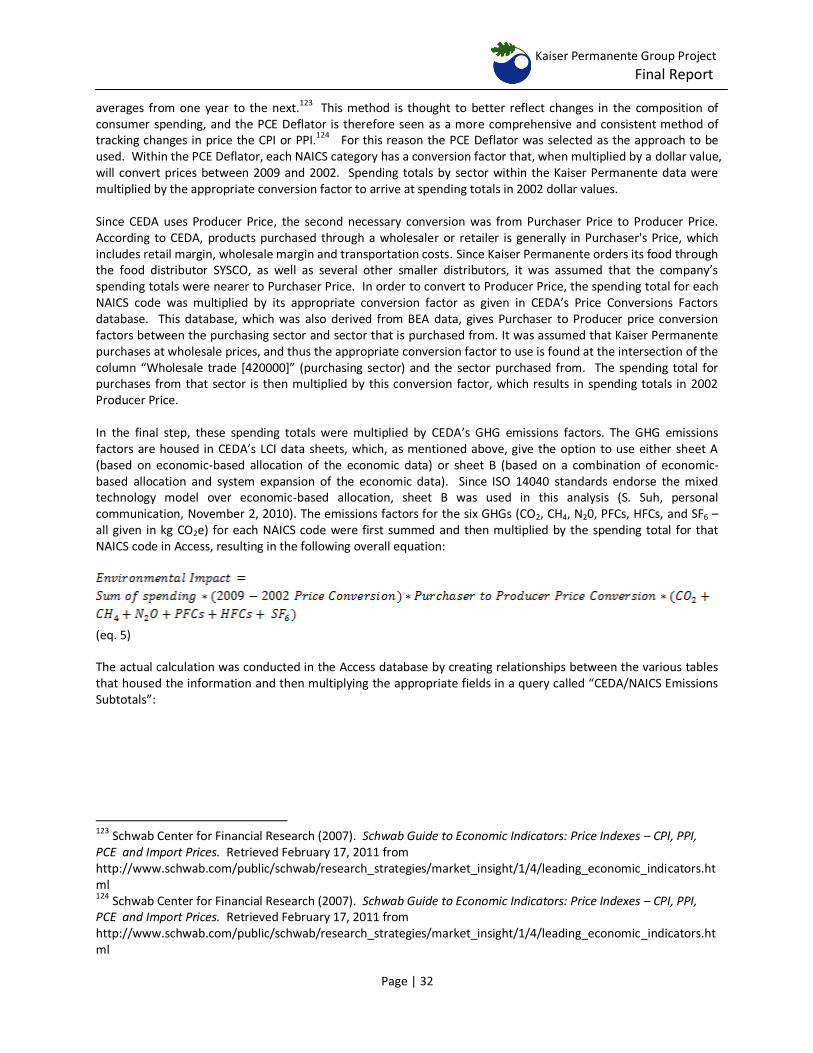
Kaiser Permanente Group Project
Final Report
Page | 32
averages from one year to the next.123 This method is thought to better reflect changes in the composition of consumer spending, and the PCE Deflator is therefore seen as a more comprehensive and consistent method of tracking changes in price the CPI or PPI.124 For this reason the PCE Deflator was selected as the approach to be used. Within the PCE Deflator, each NAICS category has a conversion factor that, when multiplied by a dollar value, will convert prices between 2009 and 2002. Spending totals by sector within the Kaiser Permanente data were multiplied by the appropriate conversion factor to arrive at spending totals in 2002 dollar values. Since CEDA uses Producer Price, the second necessary conversion was from Purchaser Price to Producer Price. According to CEDA, products purchased through a wholesaler or retailer is generally in Purchaser's Price, which includes retail margin, wholesale margin and transportation costs. Since Kaiser Permanente orders its food through the food distributor SYSCO, as well as several other smaller distributors, it was assumed that the company’s spending totals were nearer to Purchaser Price. In order to convert to Producer Price, the spending total for each NAICS code was multiplied by its appropriate conversion factor as given in CEDA’s Price Conversions Factors database. This database, which was also derived from BEA data, gives Purchaser to Producer price conversion factors between the purchasing sector and sector that is purchased from. It was assumed that Kaiser Permanente purchases at wholesale prices, and thus the appropriate conversion factor to use is found at the intersection of the column “Wholesale trade *420000+” (purchasing sector) and the sector purchased from. The spending total for purchases from that sector is then multiplied by this conversion factor, which results in spending totals in 2002 Producer Price. In the final step, these spending totals were multiplied by CEDA’s GHG emissions factors. The GHG emissions factors are housed in CEDA’s LCI data sheets, which, as mentioned above, give the option to use either sheet A (based on economic-based allocation of the economic data) or sheet B (based on a combination of economic-based allocation and system expansion of the economic data). Since ISO 14040 standards endorse the mixed technology model over economic-based allocation, sheet B was used in this analysis (S. Suh, personal communication, November 2, 2010). The emissions factors for the six GHGs (CO2, CH4, N20, PFCs, HFCs, and SF6 – all given in kg CO2e) for each NAICS code were first summed and then multiplied by the spending total for that NAICS code in Access, resulting in the following overall equation:
(eq. 5)
The actual calculation was conducted in the Access database by creating relationships between the various tables that housed the information and then multiplying the appropriate fields in a query called “CEDA/NAICS Emissions Subtotals”:
123 Schwab Center for Financial Research (2007). Schwab Guide to Economic Indicators: Price Indexes – CPI, PPI, PCE and Import Prices. Retrieved February 17, 2011 from http://www.schwab.com/public/schwab/research_strategies/market_insight/1/4/leading_economic_indicators.html 124
Schwab Center for Financial Research (2007). Schwab Guide to Economic Indicators: Price Indexes – CPI, PPI, PCE and Import Prices. Retrieved February 17, 2011 from http://www.schwab.com/public/schwab/research_strategies/market_insight/1/4/leading_economic_indicators.html
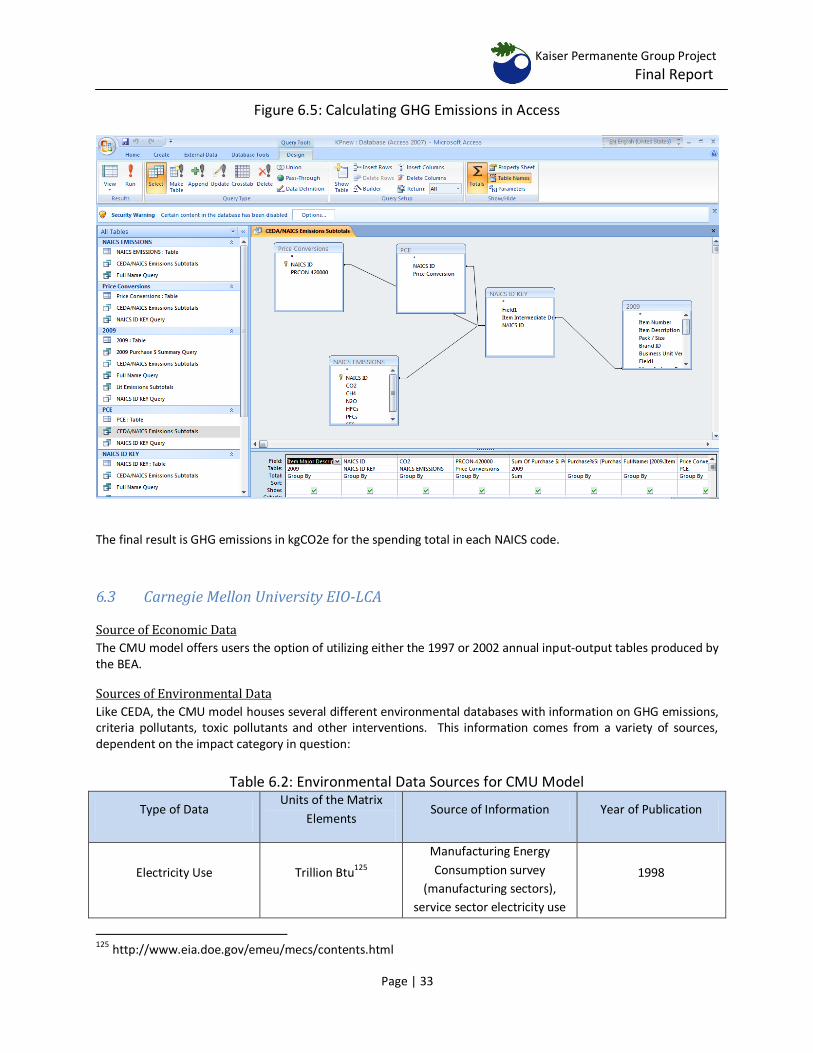
Kaiser Permanente Group Project
Final Report
Page | 33
Figure 6.5: Calculating GHG Emissions in Access
The final result is GHG emissions in kgCO2e for the spending total in each NAICS code.
6.3 Carnegie Mellon University EIO-LCA
Source of Economic Data
The CMU model offers users the option of utilizing either the 1997 or 2002 annual input-output tables produced by the BEA.
Sources of Environmental Data
Like CEDA, the CMU model houses several different environmental databases with information on GHG emissions, criteria pollutants, toxic pollutants and other interventions. This information comes from a variety of sources, dependent on the impact category in question:
Table 6.2: Environmental Data Sources for CMU Model
Type of Data Units of the Matrix
Elements Source of Information Year of Publication
Electricity Use Trillion Btu125
Manufacturing Energy
Consumption survey
(manufacturing sectors),
service sector electricity use
1998
125 http://www.eia.doe.gov/emeu/mecs/contents.html
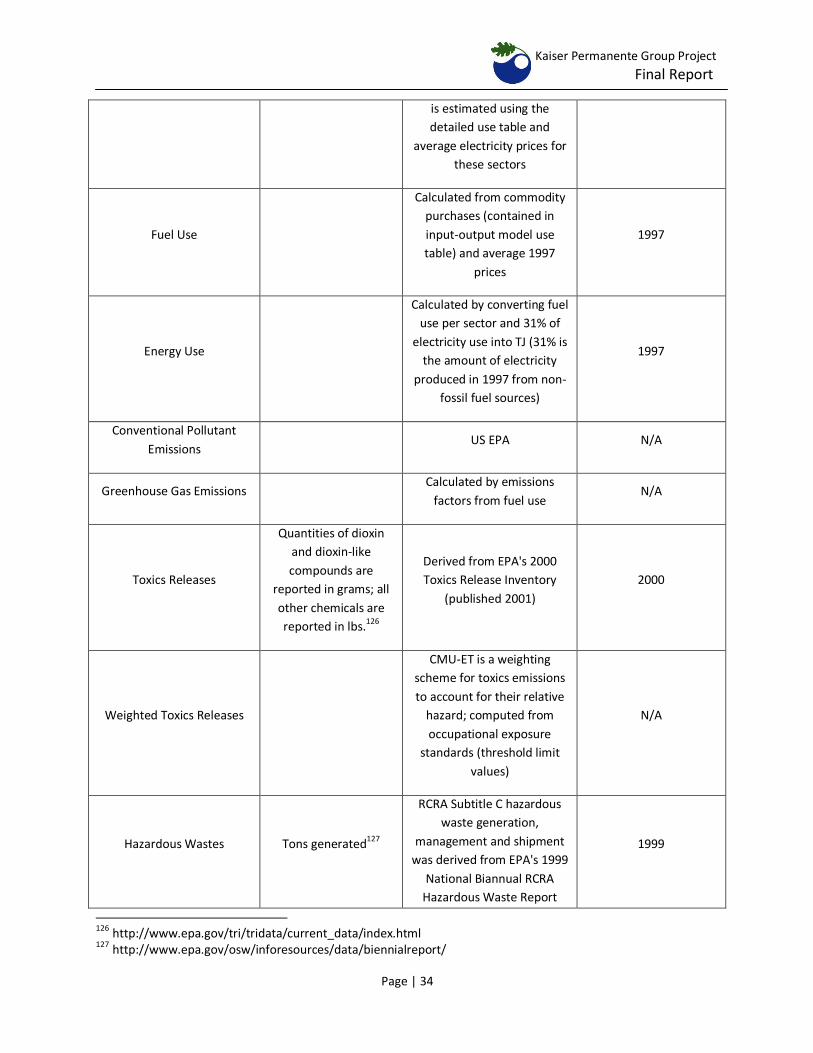
Kaiser Permanente Group Project
Final Report
Page | 34
is estimated using the
detailed use table and
average electricity prices for
these sectors
Fuel Use
Calculated from commodity
purchases (contained in
input-output model use
table) and average 1997
prices
1997
Energy Use
Calculated by converting fuel
use per sector and 31% of
electricity use into TJ (31% is
the amount of electricity
produced in 1997 from non-
fossil fuel sources)
1997
Conventional Pollutant
Emissions US EPA N/A
Greenhouse Gas Emissions Calculated by emissions
factors from fuel use N/A
Toxics Releases
Quantities of dioxin
and dioxin-like
compounds are
reported in grams; all
other chemicals are
reported in lbs.126
Derived from EPA's 2000
Toxics Release Inventory
(published 2001)
2000
Weighted Toxics Releases
CMU-ET is a weighting
scheme for toxics emissions
to account for their relative
hazard; computed from
occupational exposure
standards (threshold limit
values)
N/A
Hazardous Wastes Tons generated127
RCRA Subtitle C hazardous
waste generation,
management and shipment
was derived from EPA's 1999
National Biannual RCRA
Hazardous Waste Report
1999
126 http://www.epa.gov/tri/tridata/current_data/index.html 127 http://www.epa.gov/osw/inforesources/data/biennialreport/
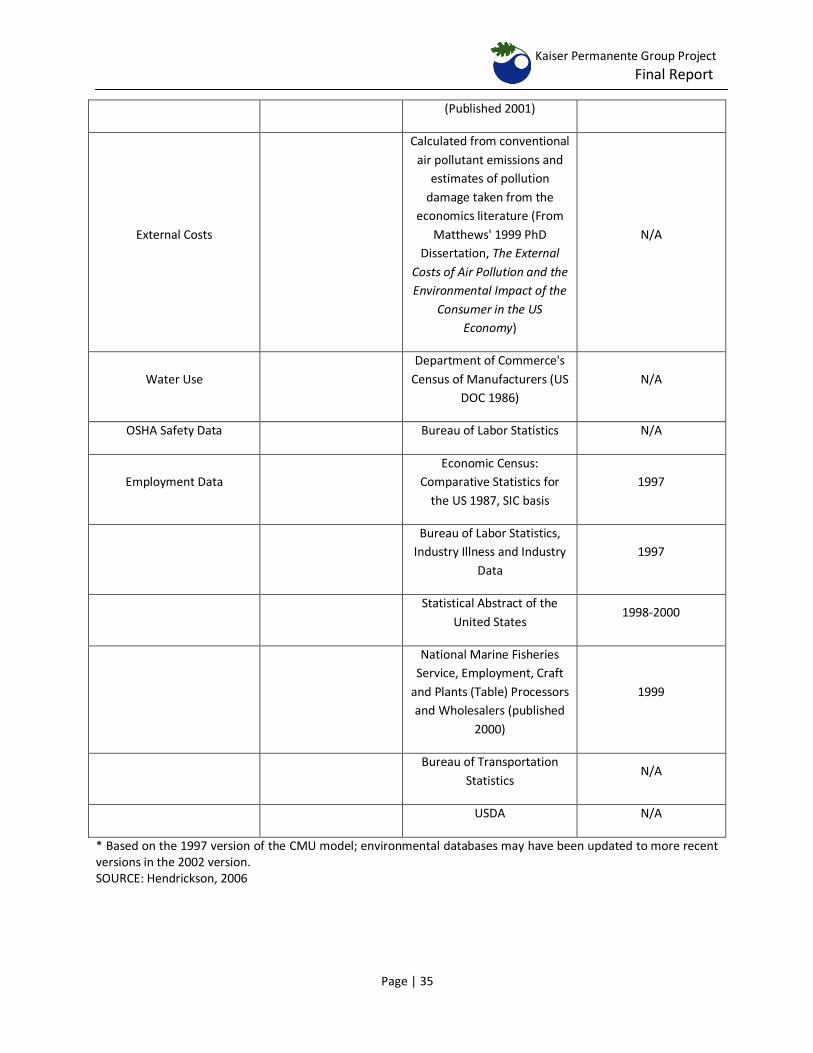
Kaiser Permanente Group Project
Final Report
Page | 35
(Published 2001)
External Costs
Calculated from conventional
air pollutant emissions and
estimates of pollution
damage taken from the
economics literature (From
Matthews' 1999 PhD
Dissertation, The External
Costs of Air Pollution and the
Environmental Impact of the
Consumer in the US
Economy)
N/A
Water Use
Department of Commerce's
Census of Manufacturers (US
DOC 1986)
N/A
OSHA Safety Data Bureau of Labor Statistics N/A
Employment Data
Economic Census:
Comparative Statistics for
the US 1987, SIC basis
1997
Bureau of Labor Statistics,
Industry Illness and Industry
Data
1997
Statistical Abstract of the
United States 1998-2000
National Marine Fisheries
Service, Employment, Craft
and Plants (Table) Processors
and Wholesalers (published
2000)
1999
Bureau of Transportation
Statistics N/A
USDA N/A
* Based on the 1997 version of the CMU model; environmental databases may have been updated to more recent versions in the 2002 version. SOURCE: Hendrickson, 2006
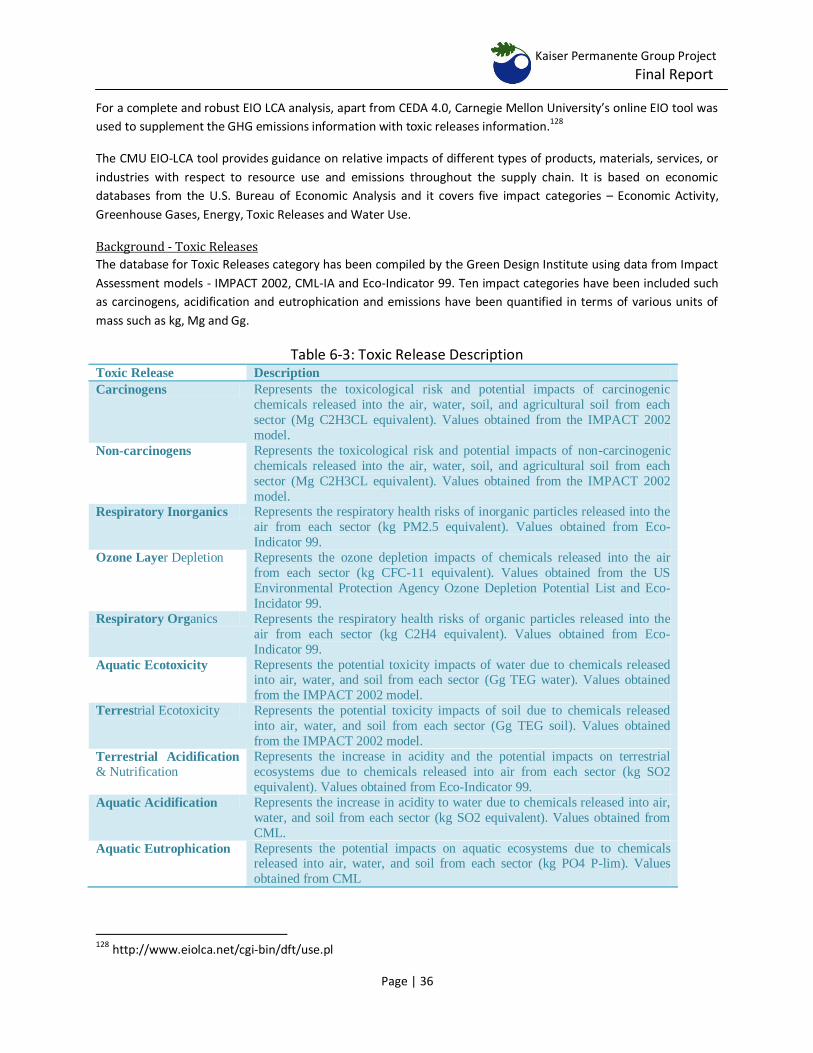
Kaiser Permanente Group Project
Final Report
Page | 36
For a complete and robust EIO LCA analysis, apart from CEDA 4.0, Carnegie Mellon University’s online EIO tool was
used to supplement the GHG emissions information with toxic releases information.128
The CMU EIO-LCA tool provides guidance on relative impacts of different types of products, materials, services, or
industries with respect to resource use and emissions throughout the supply chain. It is based on economic
databases from the U.S. Bureau of Economic Analysis and it covers five impact categories – Economic Activity,
Greenhouse Gases, Energy, Toxic Releases and Water Use.
Background - Toxic Releases
The database for Toxic Releases category has been compiled by the Green Design Institute using data from Impact
Assessment models - IMPACT 2002, CML-IA and Eco-Indicator 99. Ten impact categories have been included such
as carcinogens, acidification and eutrophication and emissions have been quantified in terms of various units of
mass such as kg, Mg and Gg.
Table 6-3: Toxic Release Description Toxic Release Description Carcinogens Represents the toxicological risk and potential impacts of carcinogenic
chemicals released into the air, water, soil, and agricultural soil from each
sector (Mg C2H3CL equivalent). Values obtained from the IMPACT 2002
model. Non-carcinogens Represents the toxicological risk and potential impacts of non-carcinogenic
chemicals released into the air, water, soil, and agricultural soil from each
sector (Mg C2H3CL equivalent). Values obtained from the IMPACT 2002
model. Respiratory Inorganics Represents the respiratory health risks of inorganic particles released into the
air from each sector (kg PM2.5 equivalent). Values obtained from Eco-
Indicator 99. Ozone Layer Depletion Represents the ozone depletion impacts of chemicals released into the air
from each sector (kg CFC-11 equivalent). Values obtained from the US
Environmental Protection Agency Ozone Depletion Potential List and Eco-
Incidator 99. Respiratory Organics Represents the respiratory health risks of organic particles released into the
air from each sector (kg C2H4 equivalent). Values obtained from Eco-
Indicator 99. Aquatic Ecotoxicity Represents the potential toxicity impacts of water due to chemicals released
into air, water, and soil from each sector (Gg TEG water). Values obtained
from the IMPACT 2002 model. Terrestrial Ecotoxicity Represents the potential toxicity impacts of soil due to chemicals released
into air, water, and soil from each sector (Gg TEG soil). Values obtained
from the IMPACT 2002 model. Terrestrial Acidification
& Nutrification Represents the increase in acidity and the potential impacts on terrestrial
ecosystems due to chemicals released into air from each sector (kg SO2
equivalent). Values obtained from Eco-Indicator 99. Aquatic Acidification Represents the increase in acidity to water due to chemicals released into air,
water, and soil from each sector (kg SO2 equivalent). Values obtained from
CML. Aquatic Eutrophication Represents the potential impacts on aquatic ecosystems due to chemicals
released into air, water, and soil from each sector (kg PO4 P-lim). Values
obtained from CML
128 http://www.eiolca.net/cgi-bin/dft/use.pl
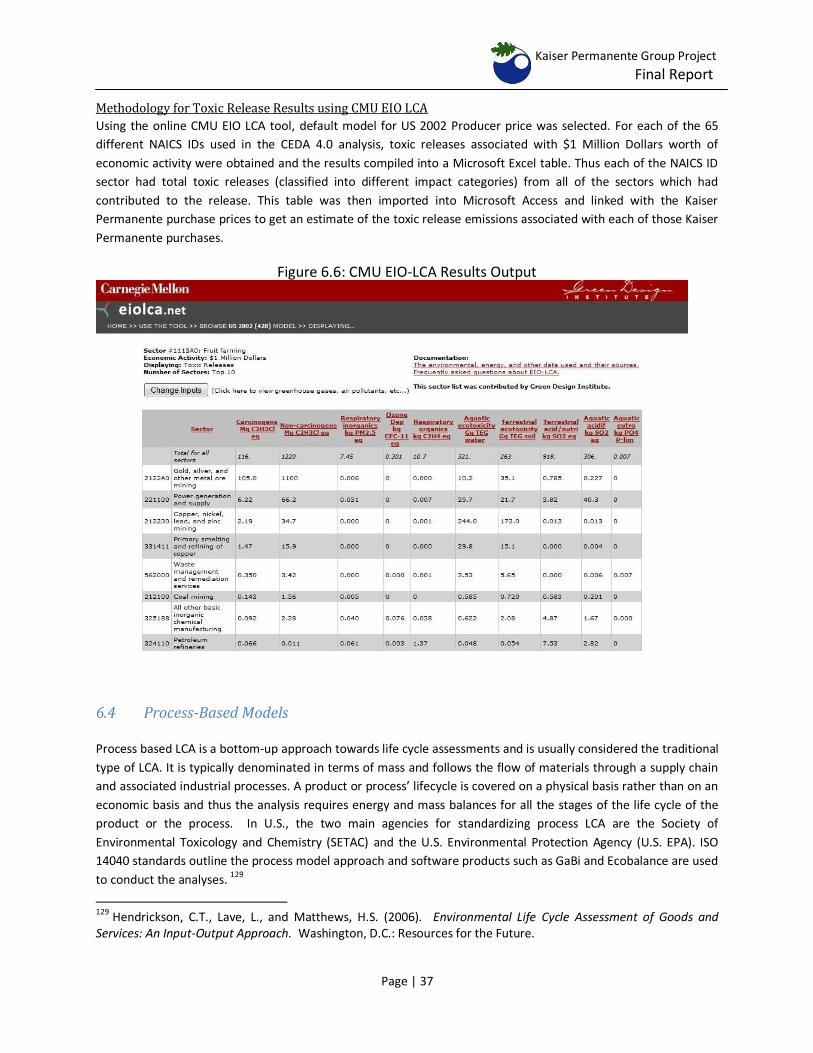
Kaiser Permanente Group Project
Final Report
Page | 37
Methodology for Toxic Release Results using CMU EIO LCA
Using the online CMU EIO LCA tool, default model for US 2002 Producer price was selected. For each of the 65
different NAICS IDs used in the CEDA 4.0 analysis, toxic releases associated with $1 Million Dollars worth of
economic activity were obtained and the results compiled into a Microsoft Excel table. Thus each of the NAICS ID
sector had total toxic releases (classified into different impact categories) from all of the sectors which had
contributed to the release. This table was then imported into Microsoft Access and linked with the Kaiser
Permanente purchase prices to get an estimate of the toxic release emissions associated with each of those Kaiser
Permanente purchases.
Figure 6.6: CMU EIO-LCA Results Output
6.4 Process-Based Models Process based LCA is a bottom-up approach towards life cycle assessments and is usually considered the traditional
type of LCA. It is typically denominated in terms of mass and follows the flow of materials through a supply chain
and associated industrial processes. A product or process’ lifecycle is covered on a physical basis rather than on an
economic basis and thus the analysis requires energy and mass balances for all the stages of the life cycle of the
product or the process. In U.S., the two main agencies for standardizing process LCA are the Society of
Environmental Toxicology and Chemistry (SETAC) and the U.S. Environmental Protection Agency (U.S. EPA). ISO
14040 standards outline the process model approach and software products such as GaBi and Ecobalance are used
to conduct the analyses. 129
129
Hendrickson, C.T., Lave, L., and Matthews, H.S. (2006). Environmental Life Cycle Assessment of Goods and Services: An Input-Output Approach. Washington, D.C.: Resources for the Future.
Kaiser Permanente Group Project
Final Report
Page | 38
A process based LCA approach offers some advantages over EIO approach such as the analysis being more detail
oriented than an EIO LCA. This is mainly because an EIO LCA covers the entire economy and all activities of a
particular sector while the Process based LCA is mainly focused on examining a single process in detail.
Also, with Process LCA, specific product comparisons can be made and the analysis allows scope for identification
and improvement of the process at weak points in the supply chain. This is not so easily done with an EIO LCA. The
disadvantage of a Process LCA however, is that it tends to be more time consuming and expensive and there is also
the issue of system boundary. Also, in many cases where confidential data is used, it is difficult to replicate the
process and thus verify accuracy.130
Given the data, scope of our project and the amount of time and resources available, it would have been
impossible to individually calculate emissions using Process based LCA. Therefore a method to include an analysis
similar to a Process LCA was devised using literature studies on food LCAs. Thus, apart from using EIO LCA (CEDA
and CMU) to calculate GHG and toxic release emissions numbers, a literature survey was also conducted to identify
process based LCA studies on food products and the emission numbers found in those studies were used to
calculate emissions for Kaiser Permanente’s food data.
In general, large emitter categories such as beef, fruits and vegetables were identified via EIO LCA, and then
emissions based on specific functional units were calculated using their corresponding literature emissions values.
Literature emissions study
Over a period of one month, our group searched for and selected global food LCA studies to get emissions
numbers (factors) associated with food production and procurement. These factors were compiled in spreadsheets
along with their associated functional units. For the main analysis, based upon the large emitter categories
identified via EIO LCA, studies such as a DEFRA report131, a WWF-UK report132 and other papers were selected.
The Department for Environment, Food and Rural Affairs (DEFRA) is a Government Department in the UK and they
have produced a report to explore the validity and suitability of methods described in PAS 2050 – a standard
developed by the British Standards Institute - for the specification of LCAs of goods (food) and services. It was
chosen as a basis for comparison of literature emissions values of beef, poultry and pork with studies by
Phetteplace et al.133 and Kanyama & Gonzalez134. Emissions for all meat products were reported in kgCO2eq. From
these studies, emissions were based on a functional unit of 1 kg hung carcass of meat. Beef emission numbers
included aspects of beef production process such as production of livestock parents and grandparents, rearing of
the commodity animals and the eventual disposal of the animal.
130
Hendrickson, C.T., Lave, L., and Matthews, H.S. (2006). Environmental Life Cycle Assessment of Goods and Services: An Input-Output Approach. Washington, D.C.: Resources for the Future. 131Wiltshire J., Wynn S., Clarke J., Chambers B., Cottrell B., Drakes D., Getting J., Nicholson C., Phillips K., Thorman R., Tiffin D., and Walker O. (2009). Scenario building to test and inform the development of a BSI method for assessing greenhouse gas emissions from food (Final Report). ADAS. 132 Audsley, E., Brander, M., Chatterton, J., Murphy-Bokern, D., Webster, C., and Williams, A. (2009). How low can we go? An assessment of greenhouse gas emissions from the UK food system and the scope to reduce them by 2050. FCRN-WWF-UK. 133Phetteplace, Hope W., Donald E. Johnson & Andrew F. Seidl (2001). Greenhouse gas emissions from simulated beef and dairy livestock systems in the United States. Nutrient Cycling in Agroecosystems, 60, 99–102 134
Carlsson-Kanyama A, González AD (2009). Potential contributions of food consumption patterns to climate change. American Journal of Clinical Nutrition, 89(5):1704S-1709S.
Kaiser Permanente Group Project
Final Report
Page | 39
The WWF-UK study was produced by WWF-UK along with FCRN (Food Climate Research Network, UK) in 2009.
Their analysis was based on an inventory of commodity consumption, production and trade data from DEFRA,
USDA (United States Department of Agriculture) and the UNFAO (United Nations Food and Agriculture
Organization). Emissions were reported in kgCO2eq. For vegetables, emissions were based on a functional unit of 1
kg of the product and included emissions from production up to distribution.
Since no information about Kaiser Permanente’s food product purchase by mass was available, the first step in
conducting the literature emissions based study was to calculate Kaiser Permanente purchase in mass (kg) from
the product prices provided by Sysco (Kaiser Permanente’s largest supplier). Two databases for product price
indices and price conversions were selected in order to calculate Kaiser Permanente Purchase by mass.
One of the databases was ‘USDA Food Plans-Cost of food database’ found on the USDA Center for Nutrition Policy
and Promotion website. This database (in excel sheet format) contains the corresponding price per 100g of all food
commodities purchased in the U.S. for year 2003-2004 which is the most recent database. 135
The other database used was the Consumer Price Index (CPI) database compiled by the Bureau of Labor Statistics,
U.S. Department of Labor. It is based off of prices paid by urban consumers for a representative basket of goods
and services. On the CPI website, there are several different CPIs and owing to its high specificity, CPI-U (All Urban
Consumers – Current Series) was selected136. The consumer price index was used to calculate the change in price
of a commodity from the purchase year (2009) to the year for which USDA price per 100g of food commodity
(2003) was available. This conversion accounted for any inflation of food process which might have occurred from
2003 to 2009 and aimed at conducting a more robust analysis.
Methodology for calculating emissions based on literature review studies
The product of interest (beef, vegetables, and fruits) was chosen and using item descriptions from the Kaiser
Permanente Purchase data, its Kaiser Permanente spending total found. Meanwhile, the CPI Conversion factor was
calculated using 2009 and 2003 year data and Kaiser Permanente spending in 2009 converted into Kaiser
Permanente spending in 2003. After obtaining the Kaiser Permanente Spending total in 2003 Dollars the next step
was to record the USDA price per 100g of that particular product in 2003. Kaiser Purchase by mass (in g) was then
calculated using the spending total in 2003 and USDA price of commodities per 100g.
Kaiser Permanente purchase by mass was obtained based on different functional units of the products for which
emissions numbers were recorded. For example, if the literature emissions study on fresh beef had emissions
numbers per functional unit of 1 kg fresh beef, the amount of fresh beef purchased by Kaiser Permanente was
estimated in kilograms.
After obtaining Kaiser Permanente purchases in mass, they were multiplied with the emissions factors (obtained
via literature reviews) to get total emissions associated with each product relative to its mass purchased by Kaiser
Permanente. The emissions were recorded in kgCO2eq meaning that they accounted for emissions from all GHGs.
7. Data Management Kaiser Permanente utilizes the services of Entegra – a food procurement service, to record and track all of its food
purchases from the various suppliers. Kaiser Permanente’s largest supplier, accounting for 80% of the total
135 http://www.cnpp.usda.gov/usdafoodplanscostoffood.htm 136 http://www.bls.gov/cpi/
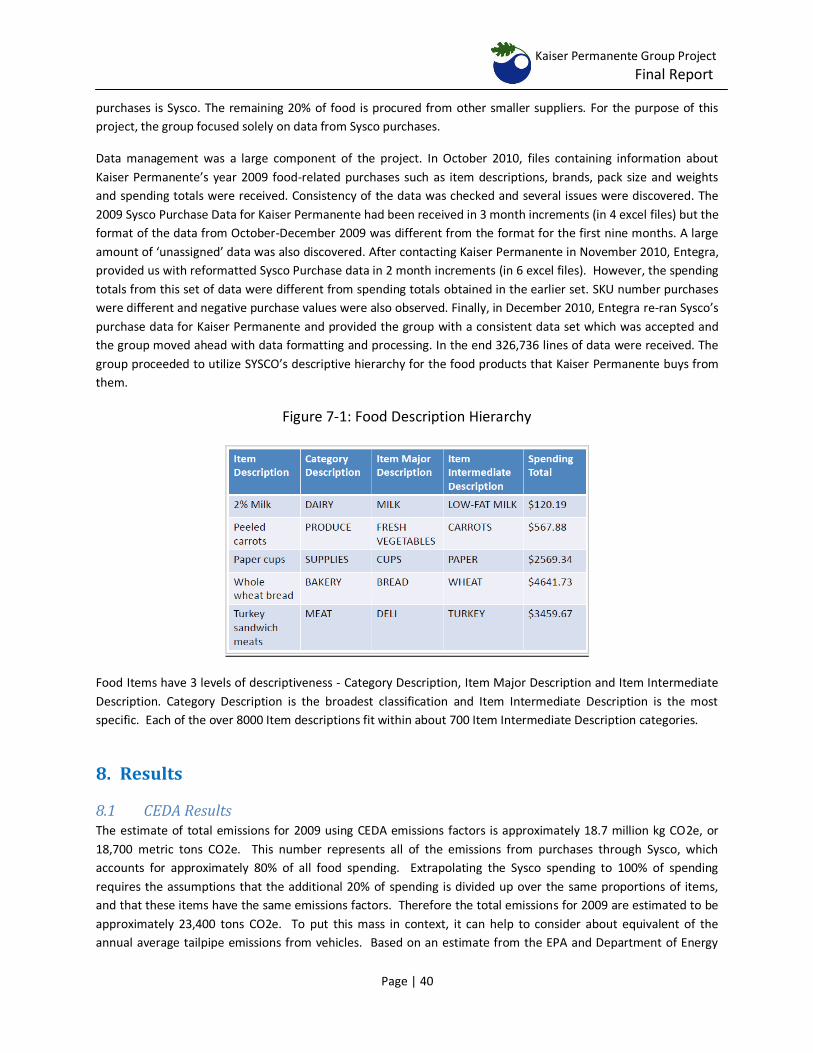
Kaiser Permanente Group Project
Final Report
Page | 40
purchases is Sysco. The remaining 20% of food is procured from other smaller suppliers. For the purpose of this
project, the group focused solely on data from Sysco purchases.
Data management was a large component of the project. In October 2010, files containing information about
Kaiser Permanente’s year 2009 food-related purchases such as item descriptions, brands, pack size and weights
and spending totals were received. Consistency of the data was checked and several issues were discovered. The
2009 Sysco Purchase Data for Kaiser Permanente had been received in 3 month increments (in 4 excel files) but the
format of the data from October-December 2009 was different from the format for the first nine months. A large
amount of ‘unassigned’ data was also discovered. After contacting Kaiser Permanente in November 2010, Entegra,
provided us with reformatted Sysco Purchase data in 2 month increments (in 6 excel files). However, the spending
totals from this set of data were different from spending totals obtained in the earlier set. SKU number purchases
were different and negative purchase values were also observed. Finally, in December 2010, Entegra re-ran Sysco’s
purchase data for Kaiser Permanente and provided the group with a consistent data set which was accepted and
the group moved ahead with data formatting and processing. In the end 326,736 lines of data were received. The
group proceeded to utilize SYSCO’s descriptive hierarchy for the food products that Kaiser Permanente buys from
them.
Figure 7-1: Food Description Hierarchy
Food Items have 3 levels of descriptiveness - Category Description, Item Major Description and Item Intermediate
Description. Category Description is the broadest classification and Item Intermediate Description is the most
specific. Each of the over 8000 Item descriptions fit within about 700 Item Intermediate Description categories.
8. Results
8.1 CEDA Results The estimate of total emissions for 2009 using CEDA emissions factors is approximately 18.7 million kg CO2e, or
18,700 metric tons CO2e. This number represents all of the emissions from purchases through Sysco, which
accounts for approximately 80% of all food spending. Extrapolating the Sysco spending to 100% of spending
requires the assumptions that the additional 20% of spending is divided up over the same proportions of items,
and that these items have the same emissions factors. Therefore the total emissions for 2009 are estimated to be
approximately 23,400 tons CO2e. To put this mass in context, it can help to consider about equivalent of the
annual average tailpipe emissions from vehicles. Based on an estimate from the EPA and Department of Energy
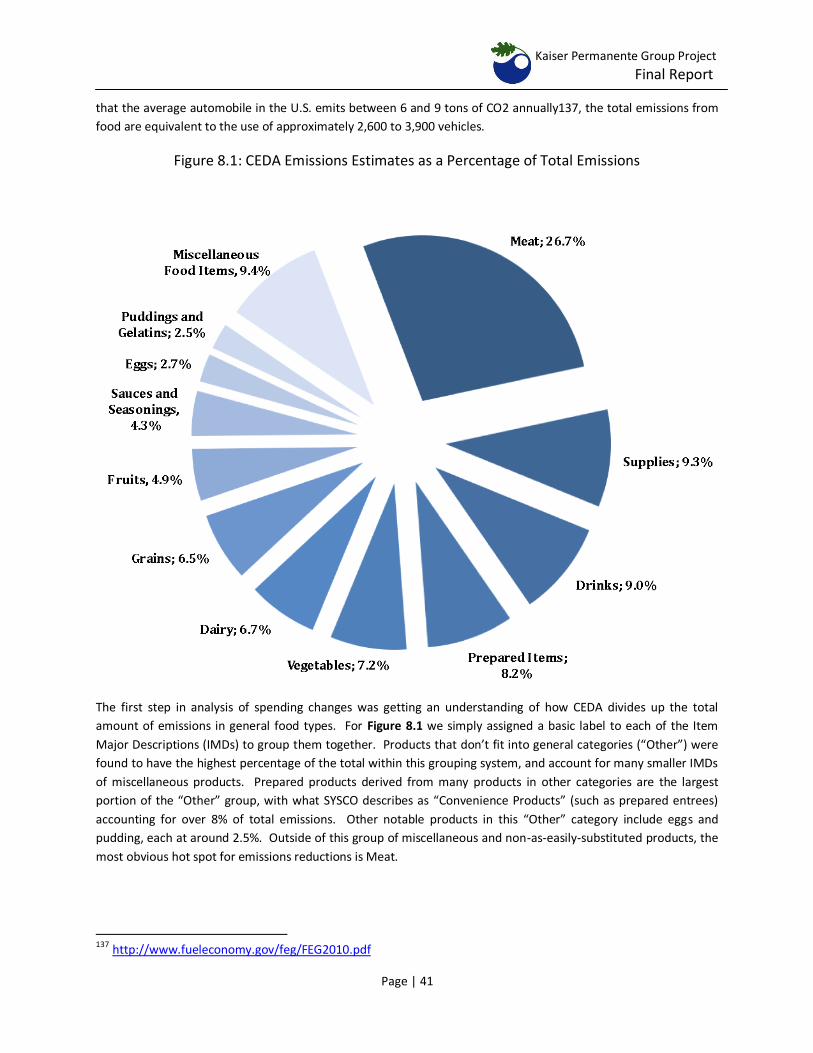
Kaiser Permanente Group Project
Final Report
Page | 41
that the average automobile in the U.S. emits between 6 and 9 tons of CO2 annually137, the total emissions from
food are equivalent to the use of approximately 2,600 to 3,900 vehicles.
Figure 8.1: CEDA Emissions Estimates as a Percentage of Total Emissions
The first step in analysis of spending changes was getting an understanding of how CEDA divides up the total
amount of emissions in general food types. For Figure 8.1 we simply assigned a basic label to each of the Item
Major Descriptions (IMDs) to group them together. Products that don’t fit into general categories (“Other”) were
found to have the highest percentage of the total within this grouping system, and account for many smaller IMDs
of miscellaneous products. Prepared products derived from many products in other categories are the largest
portion of the “Other” group, with what SYSCO describes as “Convenience Products” (such as prepared entrees)
accounting for over 8% of total emissions. Other notable products in this “Other” category include eggs and
pudding, each at around 2.5%. Outside of this group of miscellaneous and non-as-easily-substituted products, the
most obvious hot spot for emissions reductions is Meat.
137 http://www.fueleconomy.gov/feg/FEG2010.pdf
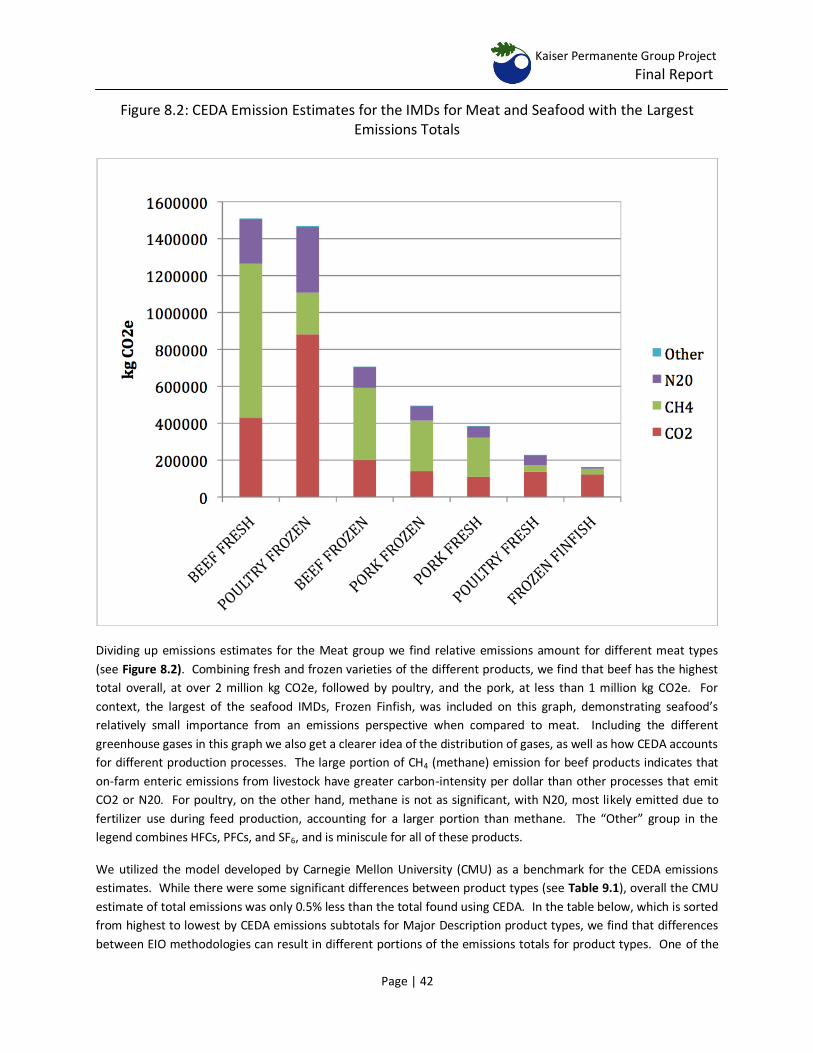
Kaiser Permanente Group Project
Final Report
Page | 42
Figure 8.2: CEDA Emission Estimates for the IMDs for Meat and Seafood with the Largest Emissions Totals
Dividing up emissions estimates for the Meat group we find relative emissions amount for different meat types
(see Figure 8.2). Combining fresh and frozen varieties of the different products, we find that beef has the highest
total overall, at over 2 million kg CO2e, followed by poultry, and the pork, at less than 1 million kg CO2e. For
context, the largest of the seafood IMDs, Frozen Finfish, was included on this graph, demonstrating seafood’s
relatively small importance from an emissions perspective when compared to meat. Including the different
greenhouse gases in this graph we also get a clearer idea of the distribution of gases, as well as how CEDA accounts
for different production processes. The large portion of CH4 (methane) emission for beef products indicates that
on-farm enteric emissions from livestock have greater carbon-intensity per dollar than other processes that emit
CO2 or N20. For poultry, on the other hand, methane is not as significant, with N20, most likely emitted due to
fertilizer use during feed production, accounting for a larger portion than methane. The “Other” group in the
legend combines HFCs, PFCs, and SF6, and is miniscule for all of these products.
We utilized the model developed by Carnegie Mellon University (CMU) as a benchmark for the CEDA emissions
estimates. While there were some significant differences between product types (see Table 9.1), overall the CMU
estimate of total emissions was only 0.5% less than the total found using CEDA. In the table below, which is sorted
from highest to lowest by CEDA emissions subtotals for Major Description product types, we find that differences
between EIO methodologies can result in different portions of the emissions totals for product types. One of the
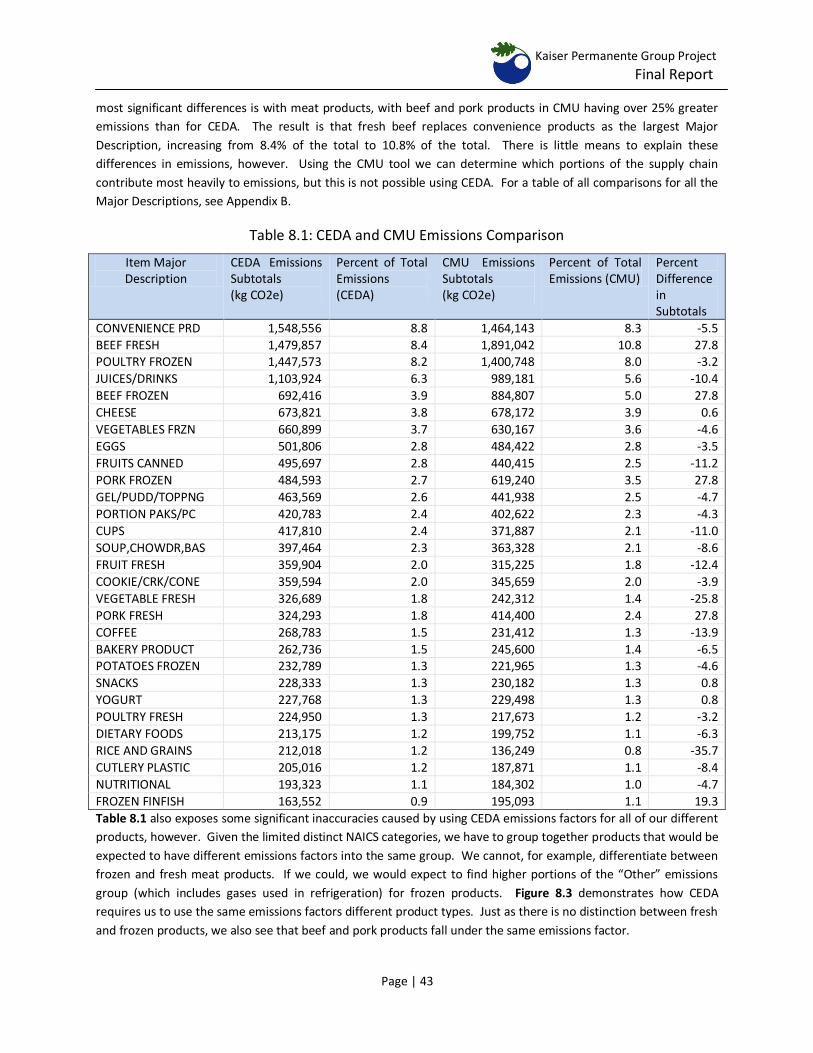
Kaiser Permanente Group Project
Final Report
Page | 43
most significant differences is with meat products, with beef and pork products in CMU having over 25% greater
emissions than for CEDA. The result is that fresh beef replaces convenience products as the largest Major
Description, increasing from 8.4% of the total to 10.8% of the total. There is little means to explain these
differences in emissions, however. Using the CMU tool we can determine which portions of the supply chain
contribute most heavily to emissions, but this is not possible using CEDA. For a table of all comparisons for all the
Major Descriptions, see Appendix B.
Table 8.1: CEDA and CMU Emissions Comparison
Table 8.1 also exposes some significant inaccuracies caused by using CEDA emissions factors for all of our different
products, however. Given the limited distinct NAICS categories, we have to group together products that would be
expected to have different emissions factors into the same group. We cannot, for example, differentiate between
frozen and fresh meat products. If we could, we would expect to find higher portions of the “Other” emissions
group (which includes gases used in refrigeration) for frozen products. Figure 8.3 demonstrates how CEDA
requires us to use the same emissions factors different product types. Just as there is no distinction between fresh
and frozen products, we also see that beef and pork products fall under the same emissions factor.
Item Major Description
CEDA Emissions Subtotals (kg CO2e)
Percent of Total Emissions (CEDA)
CMU Emissions Subtotals (kg CO2e)
Percent of Total Emissions (CMU)
Percent Difference in Subtotals
CONVENIENCE PRD 1,548,556 8.8 1,464,143 8.3 -5.5
BEEF FRESH 1,479,857 8.4 1,891,042 10.8 27.8 POULTRY FROZEN 1,447,573 8.2 1,400,748 8.0 -3.2
JUICES/DRINKS 1,103,924 6.3 989,181 5.6 -10.4
BEEF FROZEN 692,416 3.9 884,807 5.0 27.8
CHEESE 673,821 3.8 678,172 3.9 0.6
VEGETABLES FRZN 660,899 3.7 630,167 3.6 -4.6
EGGS 501,806 2.8 484,422 2.8 -3.5
FRUITS CANNED 495,697 2.8 440,415 2.5 -11.2
PORK FROZEN 484,593 2.7 619,240 3.5 27.8
GEL/PUDD/TOPPNG 463,569 2.6 441,938 2.5 -4.7
PORTION PAKS/PC 420,783 2.4 402,622 2.3 -4.3
CUPS 417,810 2.4 371,887 2.1 -11.0
SOUP,CHOWDR,BAS 397,464 2.3 363,328 2.1 -8.6
FRUIT FRESH 359,904 2.0 315,225 1.8 -12.4
COOKIE/CRK/CONE 359,594 2.0 345,659 2.0 -3.9
VEGETABLE FRESH 326,689 1.8 242,312 1.4 -25.8
PORK FRESH 324,293 1.8 414,400 2.4 27.8
COFFEE 268,783 1.5 231,412 1.3 -13.9
BAKERY PRODUCT 262,736 1.5 245,600 1.4 -6.5 POTATOES FROZEN 232,789 1.3 221,965 1.3 -4.6
SNACKS 228,333 1.3 230,182 1.3 0.8
YOGURT 227,768 1.3 229,498 1.3 0.8
POULTRY FRESH 224,950 1.3 217,673 1.2 -3.2
DIETARY FOODS 213,175 1.2 199,752 1.1 -6.3
RICE AND GRAINS 212,018 1.2 136,249 0.8 -35.7
CUTLERY PLASTIC 205,016 1.2 187,871 1.1 -8.4
NUTRITIONAL 193,323 1.1 184,302 1.0 -4.7
FROZEN FINFISH 163,552 0.9 195,093 1.1 19.3
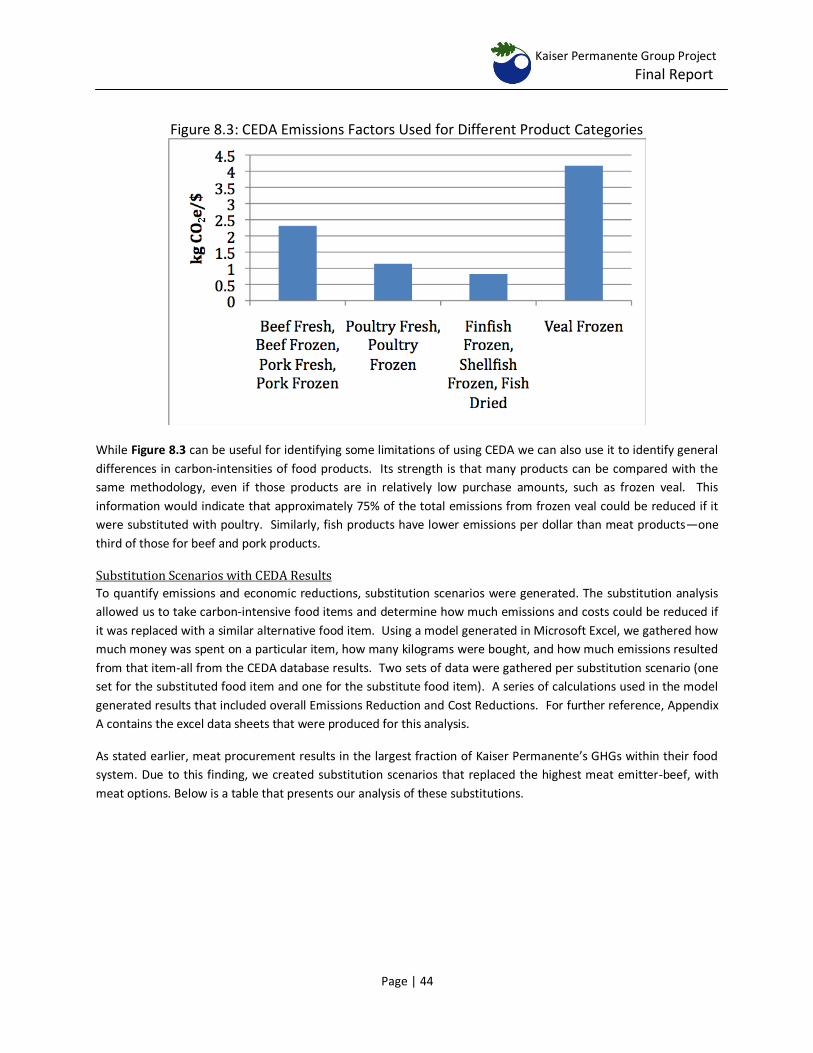
Kaiser Permanente Group Project
Final Report
Page | 44
Figure 8.3: CEDA Emissions Factors Used for Different Product Categories
While Figure 8.3 can be useful for identifying some limitations of using CEDA we can also use it to identify general
differences in carbon-intensities of food products. Its strength is that many products can be compared with the
same methodology, even if those products are in relatively low purchase amounts, such as frozen veal. This
information would indicate that approximately 75% of the total emissions from frozen veal could be reduced if it
were substituted with poultry. Similarly, fish products have lower emissions per dollar than meat products—one
third of those for beef and pork products.
Substitution Scenarios with CEDA Results
To quantify emissions and economic reductions, substitution scenarios were generated. The substitution analysis
allowed us to take carbon-intensive food items and determine how much emissions and costs could be reduced if
it was replaced with a similar alternative food item. Using a model generated in Microsoft Excel, we gathered how
much money was spent on a particular item, how many kilograms were bought, and how much emissions resulted
from that item-all from the CEDA database results. Two sets of data were gathered per substitution scenario (one
set for the substituted food item and one for the substitute food item). A series of calculations used in the model
generated results that included overall Emissions Reduction and Cost Reductions. For further reference, Appendix
A contains the excel data sheets that were produced for this analysis.
As stated earlier, meat procurement results in the largest fraction of Kaiser Permanente’s GHGs within their food
system. Due to this finding, we created substitution scenarios that replaced the highest meat emitter-beef, with
meat options. Below is a table that presents our analysis of these substitutions.
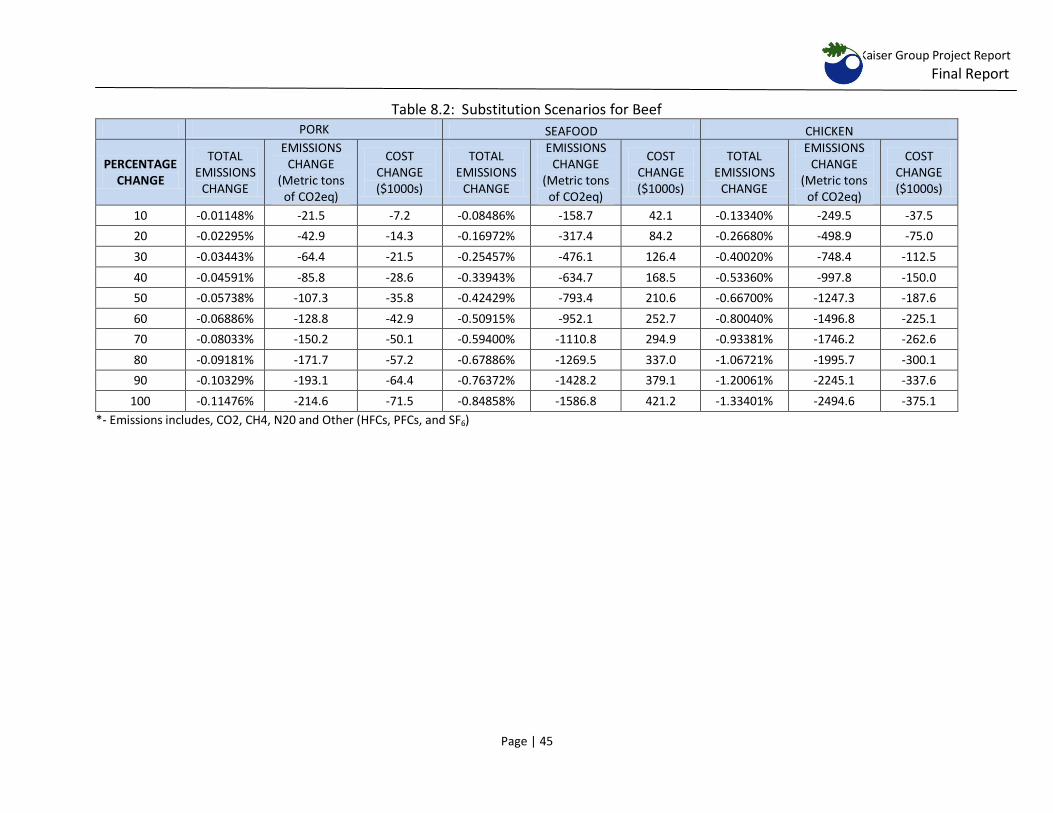
Kaiser Group Project Report
Final Report
Page | 45
Table 8.2: Substitution Scenarios for Beef
PORK SEAFOOD CHICKEN
PERCENTAGE CHANGE
TOTAL EMISSIONS
CHANGE
EMISSIONS CHANGE
(Metric tons of CO2eq)
COST CHANGE ($1000s)
TOTAL EMISSIONS
CHANGE
EMISSIONS CHANGE
(Metric tons of CO2eq)
COST CHANGE ($1000s)
TOTAL EMISSIONS
CHANGE
EMISSIONS CHANGE
(Metric tons of CO2eq)
COST CHANGE ($1000s)
10 -0.01148% -21.5 -7.2 -0.08486% -158.7 42.1 -0.13340% -249.5 -37.5
20 -0.02295% -42.9 -14.3 -0.16972% -317.4 84.2 -0.26680% -498.9 -75.0
30 -0.03443% -64.4 -21.5 -0.25457% -476.1 126.4 -0.40020% -748.4 -112.5
40 -0.04591% -85.8 -28.6 -0.33943% -634.7 168.5 -0.53360% -997.8 -150.0
50 -0.05738% -107.3 -35.8 -0.42429% -793.4 210.6 -0.66700% -1247.3 -187.6
60 -0.06886% -128.8 -42.9 -0.50915% -952.1 252.7 -0.80040% -1496.8 -225.1
70 -0.08033% -150.2 -50.1 -0.59400% -1110.8 294.9 -0.93381% -1746.2 -262.6
80 -0.09181% -171.7 -57.2 -0.67886% -1269.5 337.0 -1.06721% -1995.7 -300.1
90 -0.10329% -193.1 -64.4 -0.76372% -1428.2 379.1 -1.20061% -2245.1 -337.6
100 -0.11476% -214.6 -71.5 -0.84858% -1586.8 421.2 -1.33401% -2494.6 -375.1
*- Emissions includes, CO2, CH4, N20 and Other (HFCs, PFCs, and SF6)
Kaiser Permanente Group Project
Final Report
Page | 46
Table 8.2 allows us to identify what meat alternative reduces the most emissions and costs. The left most
column illustrates the percentage of beef that will be reduced. Moving horizontally across the grid we can
observe the degree at which GHGs are reduced by a given percentage reduction in beef for a particular
substitute (in this case: seafood, pork or chicken). Total emissions change indicates how much of Kaiser
Permanente’s total GHG (18.7 million kg CO2eq) will be reduced with the correlating percentage
reduction in beef.
There will be an emissions reduction with any beef substitution since beef is the highest emitting meat
purchased in large quantities. Pork provides the least reductions in the meat substitution table at an
emissions reduction rate of 10.7 tons per 5% reduction. Seafood and chicken is reduced at a rate of 79.3
and 124.7 tons of GHG for every 5% replaced, respectively. It is important to consider the cost of
reduction for each meat alternative. Seafood in this substitution scenario increases in cost because
seafood is typically more expensive than beef. From the Food Price Database, certified by the USDA,
seafood averaged about $14.80 for every kilogram while beef averaged $10.22 per kilogram. This
explains why replacing, cheaper beef items with seafood items will result in a cost increase of $21,100 for
every 5% of substitution. The optimal solution to reduce the greatest amount of greenhouse gasses while
saving the most costs will be to substitute beef with chicken because, chicken is the least expensive and
the least GHG intensive (according to our CEDA results).
It is not feasible however, for Kaiser Permanente to reduce all emissions in meat substitution because
beef provides a level of nourishment that other meats do not. In addition, there is a demand for beef
products from patients and workers. Due to this fact, we have simulated a variety of substitution
scenarios for other high emitting foods. In doing this, we hope to give Kaiser Permanente a summary of
their substitution options so that they can diversify their emission-reducing purchase choices without
greatly disturbing the nutritional value of their menu and catering options.
Below is a series of graphs similar to Table 8.2 for beef but for non-meat products. Beverages were found
to be the next highest food-product emitters for Kaiser Permanente after the Meat and Other category.
Juices and carbonated beverages were found at the top of our emissions list. Juice drinks accounted for
1,021,955 kg CO2e while carbonated beverages produced 444,605 kg CO2e. Juice drinks were thus
compared to carbonated beverages and we found that replacing juice drinks with carbonated beverages
would reduce GHG emissions by 39.1 tons of CO2e for a 10% drop in juice. Carbonated beverage
purchases over juice will also provide a significant cost decrease since carbonated beverages average
$0.30 less than juice drinks. However, there has been a strong correlation between the high fructose corn
syrup content in juices/carbonated beverages with elevated insulin levels. Significant increase in insulin
can overload the liver and contribute to stockpiling of calories as fat138.
Due to these harmful health affects, we created a second substitution scenario for juice drinks by
substituting juice with filtered tap water in Table 8.3 -a much healthier substitution choice. Due to a lack
of tap water data, we assumed that the purchase sum for juice was the same for tap water. The GHG
emissions factors were based off a comparative life-cycle assessment of bottle vs. tap water study
138 Taubes, Gary. Good Calories, Bad Calories. New York: Blackwell Publishing Ltd, 2008.
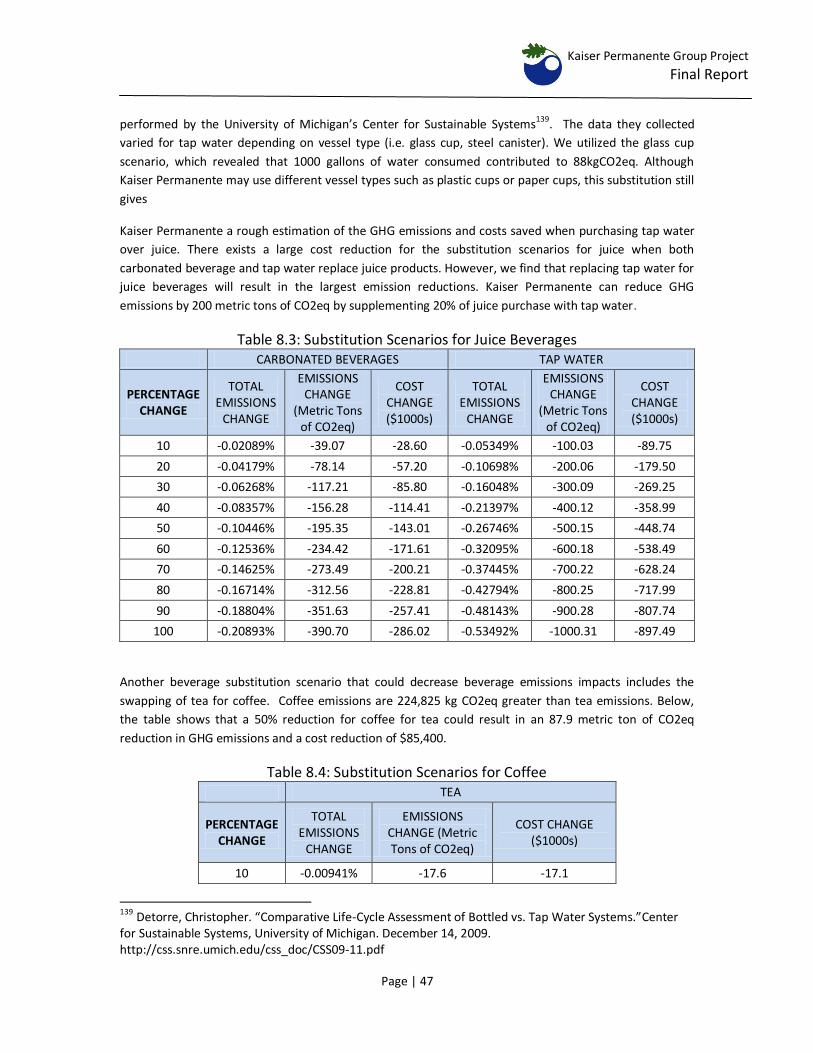
Kaiser Permanente Group Project
Final Report
Page | 47
performed by the University of Michigan’s Center for Sustainable Systems139. The data they collected
varied for tap water depending on vessel type (i.e. glass cup, steel canister). We utilized the glass cup
scenario, which revealed that 1000 gallons of water consumed contributed to 88kgCO2eq. Although
Kaiser Permanente may use different vessel types such as plastic cups or paper cups, this substitution still
gives
Kaiser Permanente a rough estimation of the GHG emissions and costs saved when purchasing tap water
over juice. There exists a large cost reduction for the substitution scenarios for juice when both
carbonated beverage and tap water replace juice products. However, we find that replacing tap water for
juice beverages will result in the largest emission reductions. Kaiser Permanente can reduce GHG
emissions by 200 metric tons of CO2eq by supplementing 20% of juice purchase with tap water.
Table 8.3: Substitution Scenarios for Juice Beverages CARBONATED BEVERAGES TAP WATER
PERCENTAGE CHANGE
TOTAL EMISSIONS
CHANGE
EMISSIONS CHANGE
(Metric Tons of CO2eq)
COST CHANGE ($1000s)
TOTAL EMISSIONS
CHANGE
EMISSIONS CHANGE
(Metric Tons of CO2eq)
COST CHANGE ($1000s)
10 -0.02089% -39.07 -28.60 -0.05349% -100.03 -89.75
20 -0.04179% -78.14 -57.20 -0.10698% -200.06 -179.50
30 -0.06268% -117.21 -85.80 -0.16048% -300.09 -269.25
40 -0.08357% -156.28 -114.41 -0.21397% -400.12 -358.99
50 -0.10446% -195.35 -143.01 -0.26746% -500.15 -448.74
60 -0.12536% -234.42 -171.61 -0.32095% -600.18 -538.49
70 -0.14625% -273.49 -200.21 -0.37445% -700.22 -628.24
80 -0.16714% -312.56 -228.81 -0.42794% -800.25 -717.99
90 -0.18804% -351.63 -257.41 -0.48143% -900.28 -807.74
100 -0.20893% -390.70 -286.02 -0.53492% -1000.31 -897.49
Another beverage substitution scenario that could decrease beverage emissions impacts includes the
swapping of tea for coffee. Coffee emissions are 224,825 kg CO2eq greater than tea emissions. Below,
the table shows that a 50% reduction for coffee for tea could result in an 87.9 metric ton of CO2eq
reduction in GHG emissions and a cost reduction of $85,400.
Table 8.4: Substitution Scenarios for Coffee
TEA
PERCENTAGE CHANGE
TOTAL EMISSIONS
CHANGE
EMISSIONS CHANGE (Metric Tons of CO2eq)
COST CHANGE ($1000s)
10 -0.00941% -17.6 -17.1
139
Detorre, Christopher. “Comparative Life-Cycle Assessment of Bottled vs. Tap Water Systems.”Center for Sustainable Systems, University of Michigan. December 14, 2009. http://css.snre.umich.edu/css_doc/CSS09-11.pdf
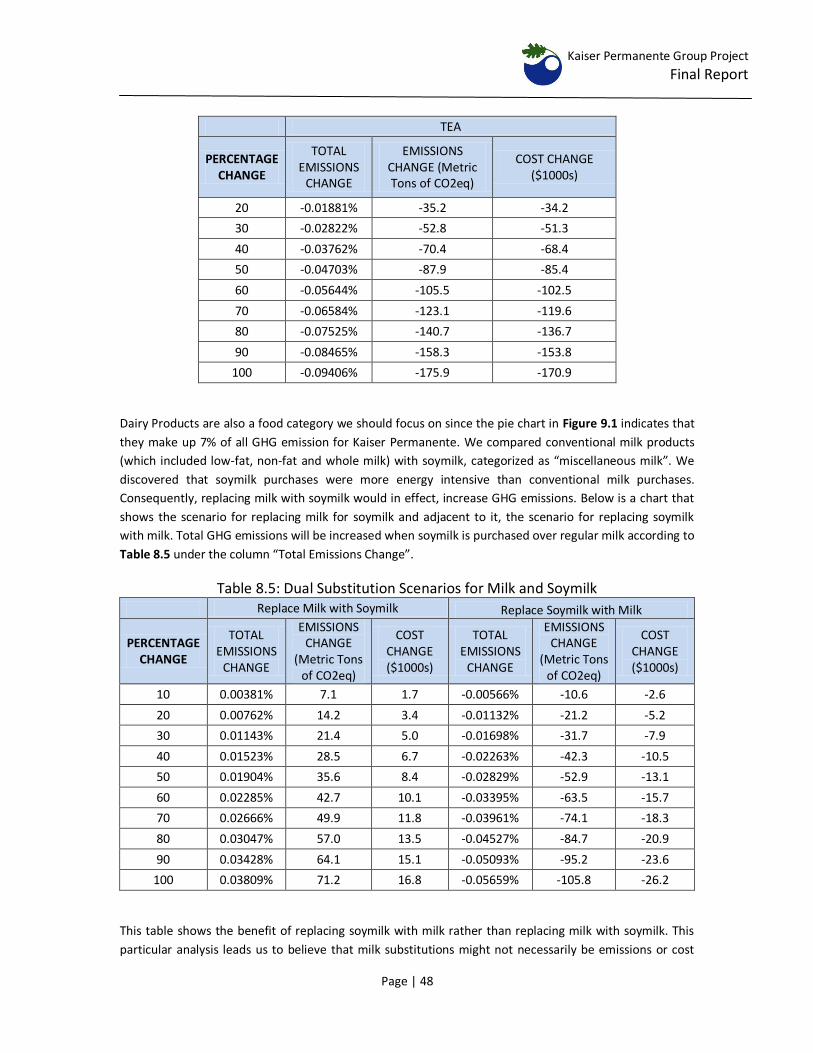
Kaiser Permanente Group Project
Final Report
Page | 48
TEA
PERCENTAGE CHANGE
TOTAL EMISSIONS
CHANGE
EMISSIONS CHANGE (Metric Tons of CO2eq)
COST CHANGE ($1000s)
20 -0.01881% -35.2 -34.2
30 -0.02822% -52.8 -51.3
40 -0.03762% -70.4 -68.4
50 -0.04703% -87.9 -85.4
60 -0.05644% -105.5 -102.5
70 -0.06584% -123.1 -119.6
80 -0.07525% -140.7 -136.7
90 -0.08465% -158.3 -153.8
100 -0.09406% -175.9 -170.9
Dairy Products are also a food category we should focus on since the pie chart in Figure 9.1 indicates that
they make up 7% of all GHG emission for Kaiser Permanente. We compared conventional milk products
(which included low-fat, non-fat and whole milk) with soymilk, categorized as “miscellaneous milk”. We
discovered that soymilk purchases were more energy intensive than conventional milk purchases.
Consequently, replacing milk with soymilk would in effect, increase GHG emissions. Below is a chart that
shows the scenario for replacing milk for soymilk and adjacent to it, the scenario for replacing soymilk
with milk. Total GHG emissions will be increased when soymilk is purchased over regular milk according to
Table 8.5 under the column “Total Emissions Change”.
Table 8.5: Dual Substitution Scenarios for Milk and Soymilk
Replace Milk with Soymilk Replace Soymilk with Milk
PERCENTAGE CHANGE
TOTAL EMISSIONS
CHANGE
EMISSIONS CHANGE
(Metric Tons of CO2eq)
COST CHANGE ($1000s)
TOTAL EMISSIONS
CHANGE
EMISSIONS CHANGE
(Metric Tons of CO2eq)
COST CHANGE ($1000s)
10 0.00381% 7.1 1.7 -0.00566% -10.6 -2.6
20 0.00762% 14.2 3.4 -0.01132% -21.2 -5.2
30 0.01143% 21.4 5.0 -0.01698% -31.7 -7.9
40 0.01523% 28.5 6.7 -0.02263% -42.3 -10.5
50 0.01904% 35.6 8.4 -0.02829% -52.9 -13.1
60 0.02285% 42.7 10.1 -0.03395% -63.5 -15.7
70 0.02666% 49.9 11.8 -0.03961% -74.1 -18.3
80 0.03047% 57.0 13.5 -0.04527% -84.7 -20.9
90 0.03428% 64.1 15.1 -0.05093% -95.2 -23.6
100 0.03809% 71.2 16.8 -0.05659% -105.8 -26.2
This table shows the benefit of replacing soymilk with milk rather than replacing milk with soymilk. This
particular analysis leads us to believe that milk substitutions might not necessarily be emissions or cost
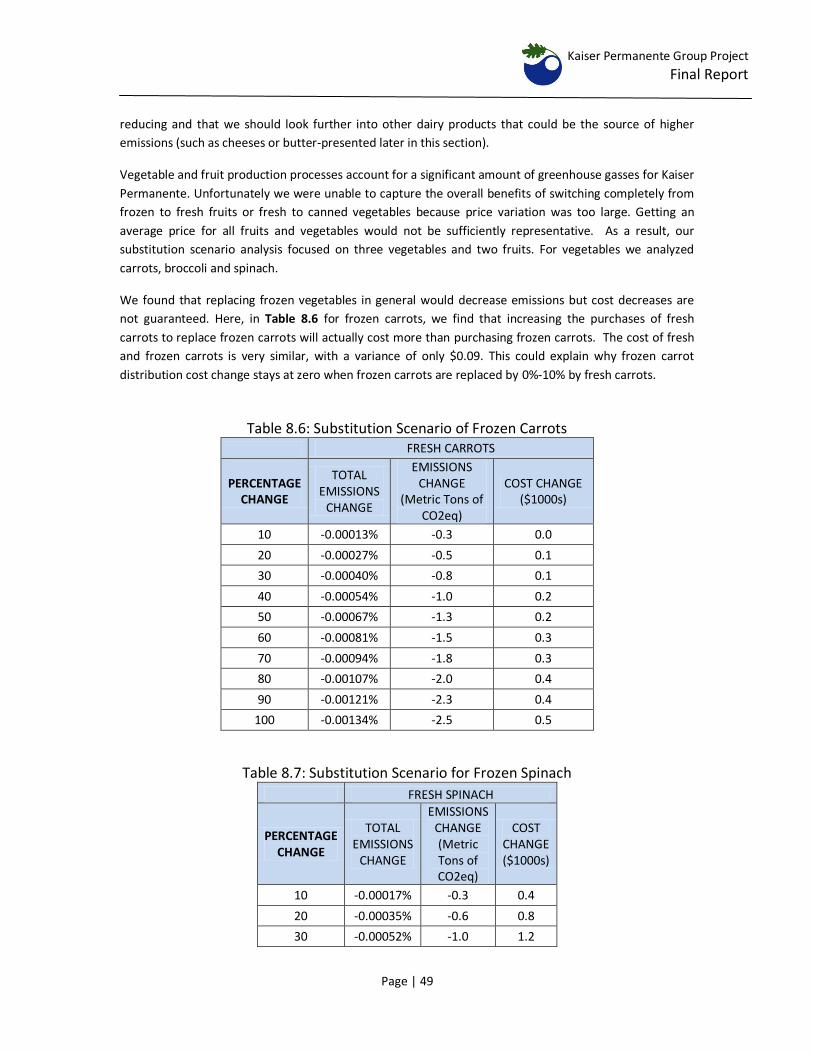
Kaiser Permanente Group Project
Final Report
Page | 49
reducing and that we should look further into other dairy products that could be the source of higher
emissions (such as cheeses or butter-presented later in this section).
Vegetable and fruit production processes account for a significant amount of greenhouse gasses for Kaiser
Permanente. Unfortunately we were unable to capture the overall benefits of switching completely from
frozen to fresh fruits or fresh to canned vegetables because price variation was too large. Getting an
average price for all fruits and vegetables would not be sufficiently representative. As a result, our
substitution scenario analysis focused on three vegetables and two fruits. For vegetables we analyzed
carrots, broccoli and spinach.
We found that replacing frozen vegetables in general would decrease emissions but cost decreases are
not guaranteed. Here, in Table 8.6 for frozen carrots, we find that increasing the purchases of fresh
carrots to replace frozen carrots will actually cost more than purchasing frozen carrots. The cost of fresh
and frozen carrots is very similar, with a variance of only $0.09. This could explain why frozen carrot
distribution cost change stays at zero when frozen carrots are replaced by 0%-10% by fresh carrots.
Table 8.6: Substitution Scenario of Frozen Carrots
FRESH CARROTS
PERCENTAGE CHANGE
TOTAL EMISSIONS
CHANGE
EMISSIONS CHANGE
(Metric Tons of CO2eq)
COST CHANGE ($1000s)
10 -0.00013% -0.3 0.0
20 -0.00027% -0.5 0.1
30 -0.00040% -0.8 0.1
40 -0.00054% -1.0 0.2
50 -0.00067% -1.3 0.2
60 -0.00081% -1.5 0.3
70 -0.00094% -1.8 0.3
80 -0.00107% -2.0 0.4
90 -0.00121% -2.3 0.4
100 -0.00134% -2.5 0.5
Table 8.7: Substitution Scenario for Frozen Spinach
FRESH SPINACH
PERCENTAGE CHANGE
TOTAL EMISSIONS
CHANGE
EMISSIONS CHANGE (Metric Tons of CO2eq)
COST CHANGE ($1000s)
10 -0.00017% -0.3 0.4
20 -0.00035% -0.6 0.8
30 -0.00052% -1.0 1.2
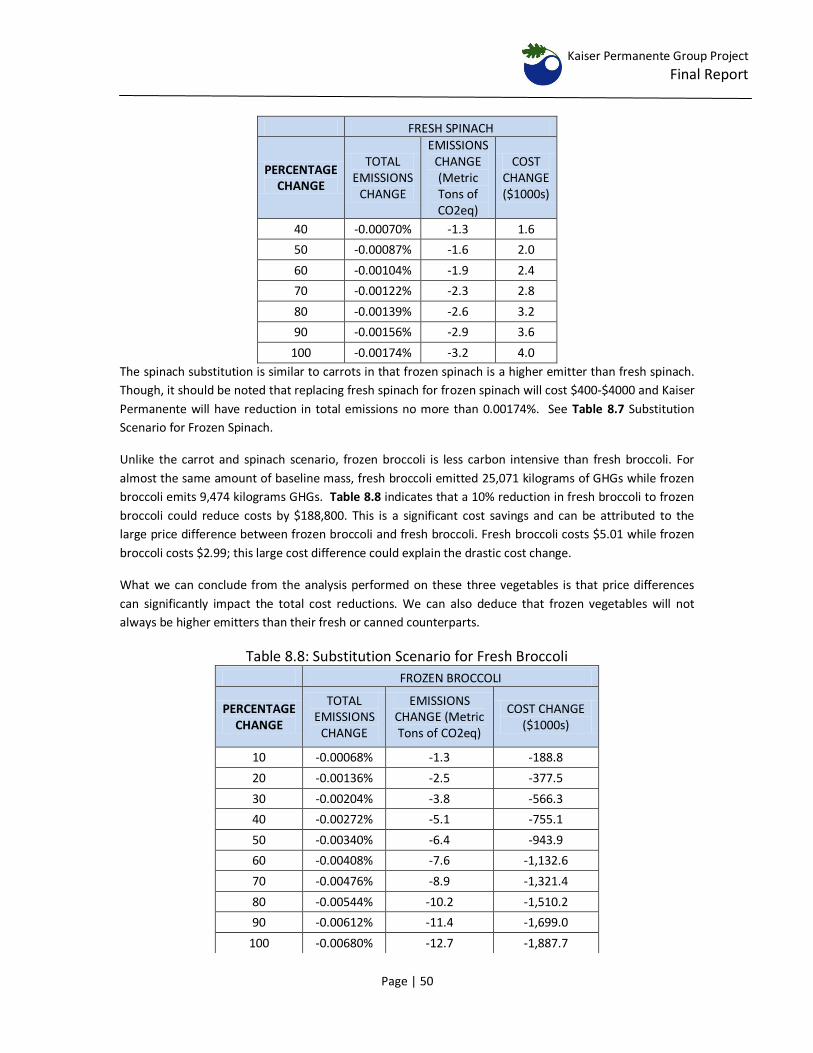
Kaiser Permanente Group Project
Final Report
Page | 50
FRESH SPINACH
PERCENTAGE CHANGE
TOTAL EMISSIONS
CHANGE
EMISSIONS CHANGE (Metric Tons of CO2eq)
COST CHANGE ($1000s)
40 -0.00070% -1.3 1.6
50 -0.00087% -1.6 2.0
60 -0.00104% -1.9 2.4
70 -0.00122% -2.3 2.8
80 -0.00139% -2.6 3.2
90 -0.00156% -2.9 3.6
100 -0.00174% -3.2 4.0
The spinach substitution is similar to carrots in that frozen spinach is a higher emitter than fresh spinach.
Though, it should be noted that replacing fresh spinach for frozen spinach will cost $400-$4000 and Kaiser
Permanente will have reduction in total emissions no more than 0.00174%. See Table 8.7 Substitution
Scenario for Frozen Spinach.
Unlike the carrot and spinach scenario, frozen broccoli is less carbon intensive than fresh broccoli. For
almost the same amount of baseline mass, fresh broccoli emitted 25,071 kilograms of GHGs while frozen
broccoli emits 9,474 kilograms GHGs. Table 8.8 indicates that a 10% reduction in fresh broccoli to frozen
broccoli could reduce costs by $188,800. This is a significant cost savings and can be attributed to the
large price difference between frozen broccoli and fresh broccoli. Fresh broccoli costs $5.01 while frozen
broccoli costs $2.99; this large cost difference could explain the drastic cost change.
What we can conclude from the analysis performed on these three vegetables is that price differences
can significantly impact the total cost reductions. We can also deduce that frozen vegetables will not
always be higher emitters than their fresh or canned counterparts.
Table 8.8: Substitution Scenario for Fresh Broccoli
FROZEN BROCCOLI
PERCENTAGE CHANGE
TOTAL EMISSIONS
CHANGE
EMISSIONS CHANGE (Metric Tons of CO2eq)
COST CHANGE ($1000s)
10 -0.00068% -1.3 -188.8
20 -0.00136% -2.5 -377.5
30 -0.00204% -3.8 -566.3
40 -0.00272% -5.1 -755.1
50 -0.00340% -6.4 -943.9
60 -0.00408% -7.6 -1,132.6
70 -0.00476% -8.9 -1,321.4
80 -0.00544% -10.2 -1,510.2
90 -0.00612% -11.4 -1,699.0
100 -0.00680% -12.7 -1,887.7
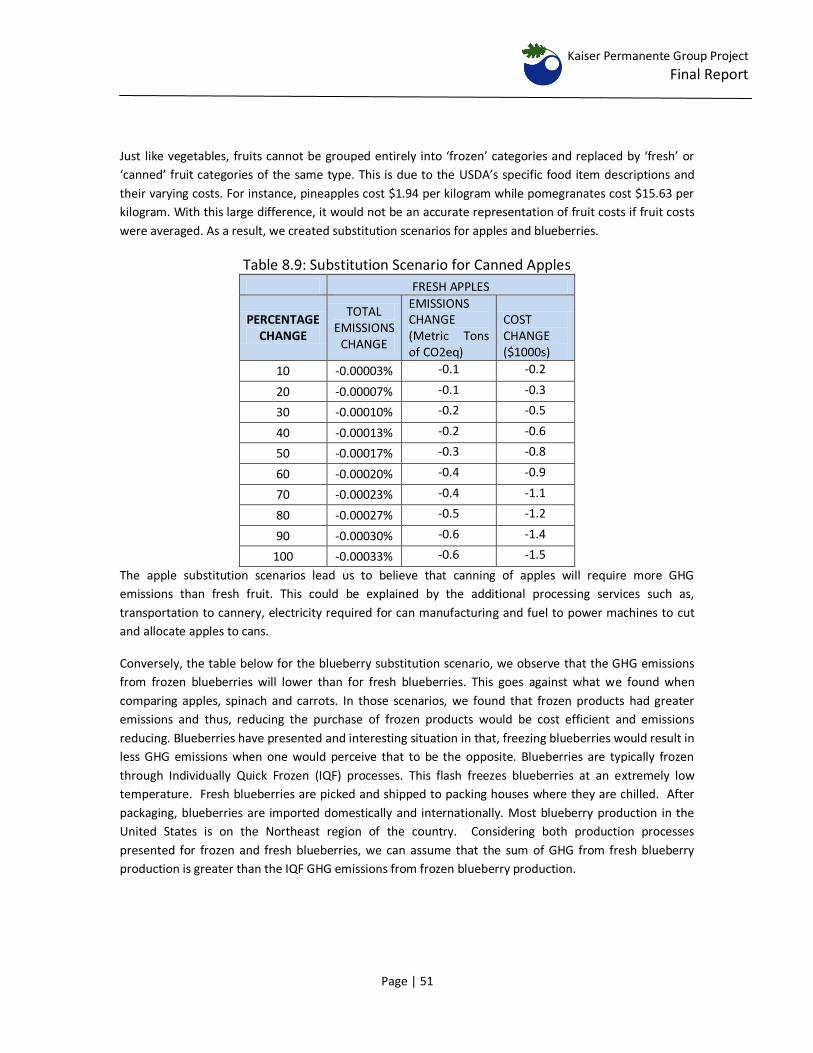
Kaiser Permanente Group Project
Final Report
Page | 51
Just like vegetables, fruits cannot be grouped entirely into ‘frozen’ categories and replaced by ‘fresh’ or
‘canned’ fruit categories of the same type. This is due to the USDA’s specific food item descriptions and
their varying costs. For instance, pineapples cost $1.94 per kilogram while pomegranates cost $15.63 per
kilogram. With this large difference, it would not be an accurate representation of fruit costs if fruit costs
were averaged. As a result, we created substitution scenarios for apples and blueberries.
Table 8.9: Substitution Scenario for Canned Apples
FRESH APPLES
PERCENTAGE CHANGE
TOTAL EMISSIONS
CHANGE
EMISSIONS CHANGE (Metric Tons of CO2eq)
COST CHANGE ($1000s)
10 -0.00003% -0.1 -0.2
20 -0.00007% -0.1 -0.3
30 -0.00010% -0.2 -0.5
40 -0.00013% -0.2 -0.6
50 -0.00017% -0.3 -0.8
60 -0.00020% -0.4 -0.9
70 -0.00023% -0.4 -1.1
80 -0.00027% -0.5 -1.2
90 -0.00030% -0.6 -1.4
100 -0.00033% -0.6 -1.5
The apple substitution scenarios lead us to believe that canning of apples will require more GHG
emissions than fresh fruit. This could be explained by the additional processing services such as,
transportation to cannery, electricity required for can manufacturing and fuel to power machines to cut
and allocate apples to cans.
Conversely, the table below for the blueberry substitution scenario, we observe that the GHG emissions
from frozen blueberries will lower than for fresh blueberries. This goes against what we found when
comparing apples, spinach and carrots. In those scenarios, we found that frozen products had greater
emissions and thus, reducing the purchase of frozen products would be cost efficient and emissions
reducing. Blueberries have presented and interesting situation in that, freezing blueberries would result in
less GHG emissions when one would perceive that to be the opposite. Blueberries are typically frozen
through Individually Quick Frozen (IQF) processes. This flash freezes blueberries at an extremely low
temperature. Fresh blueberries are picked and shipped to packing houses where they are chilled. After
packaging, blueberries are imported domestically and internationally. Most blueberry production in the
United States is on the Northeast region of the country. Considering both production processes
presented for frozen and fresh blueberries, we can assume that the sum of GHG from fresh blueberry
production is greater than the IQF GHG emissions from frozen blueberry production.
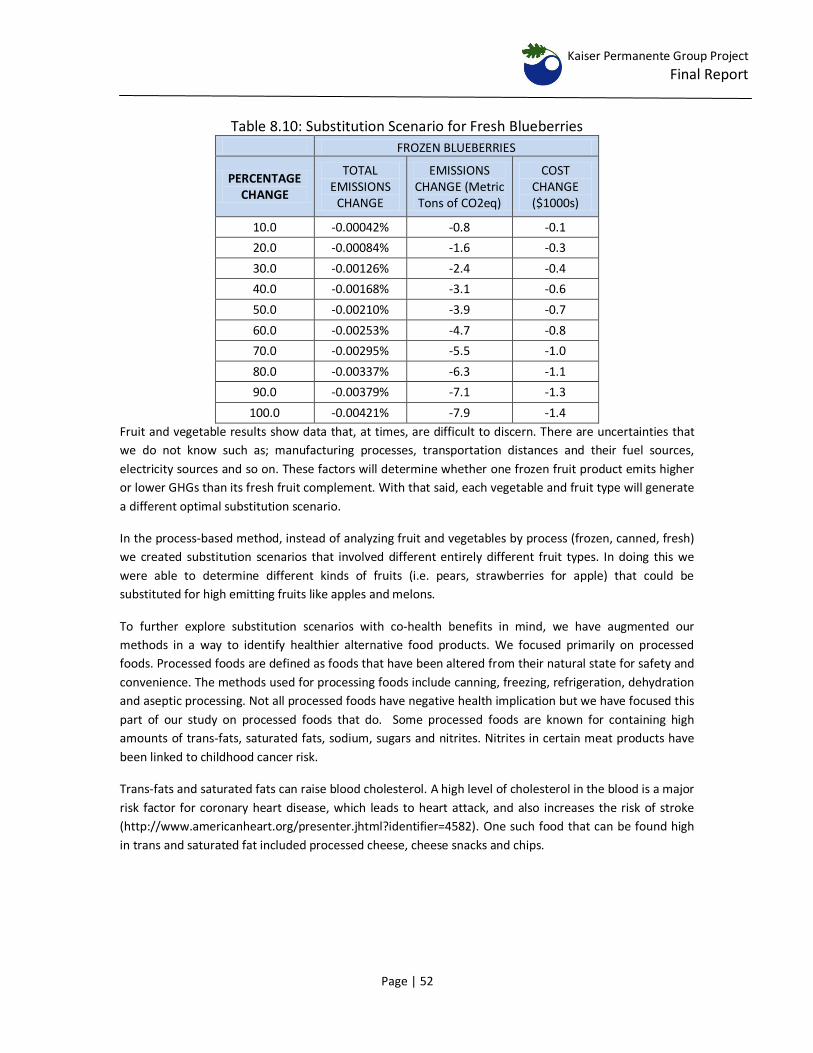
Kaiser Permanente Group Project
Final Report
Page | 52
Table 8.10: Substitution Scenario for Fresh Blueberries FROZEN BLUEBERRIES
PERCENTAGE CHANGE
TOTAL EMISSIONS
CHANGE
EMISSIONS CHANGE (Metric Tons of CO2eq)
COST CHANGE ($1000s)
10.0 -0.00042% -0.8 -0.1
20.0 -0.00084% -1.6 -0.3
30.0 -0.00126% -2.4 -0.4
40.0 -0.00168% -3.1 -0.6
50.0 -0.00210% -3.9 -0.7
60.0 -0.00253% -4.7 -0.8
70.0 -0.00295% -5.5 -1.0
80.0 -0.00337% -6.3 -1.1
90.0 -0.00379% -7.1 -1.3
100.0 -0.00421% -7.9 -1.4
Fruit and vegetable results show data that, at times, are difficult to discern. There are uncertainties that
we do not know such as; manufacturing processes, transportation distances and their fuel sources,
electricity sources and so on. These factors will determine whether one frozen fruit product emits higher
or lower GHGs than its fresh fruit complement. With that said, each vegetable and fruit type will generate
a different optimal substitution scenario.
In the process-based method, instead of analyzing fruit and vegetables by process (frozen, canned, fresh)
we created substitution scenarios that involved different entirely different fruit types. In doing this we
were able to determine different kinds of fruits (i.e. pears, strawberries for apple) that could be
substituted for high emitting fruits like apples and melons.
To further explore substitution scenarios with co-health benefits in mind, we have augmented our
methods in a way to identify healthier alternative food products. We focused primarily on processed
foods. Processed foods are defined as foods that have been altered from their natural state for safety and
convenience. The methods used for processing foods include canning, freezing, refrigeration, dehydration
and aseptic processing. Not all processed foods have negative health implication but we have focused this
part of our study on processed foods that do. Some processed foods are known for containing high
amounts of trans-fats, saturated fats, sodium, sugars and nitrites. Nitrites in certain meat products have
been linked to childhood cancer risk.
Trans-fats and saturated fats can raise blood cholesterol. A high level of cholesterol in the blood is a major
risk factor for coronary heart disease, which leads to heart attack, and also increases the risk of stroke
(http://www.americanheart.org/presenter.jhtml?identifier=4582). One such food that can be found high
in trans and saturated fat included processed cheese, cheese snacks and chips.
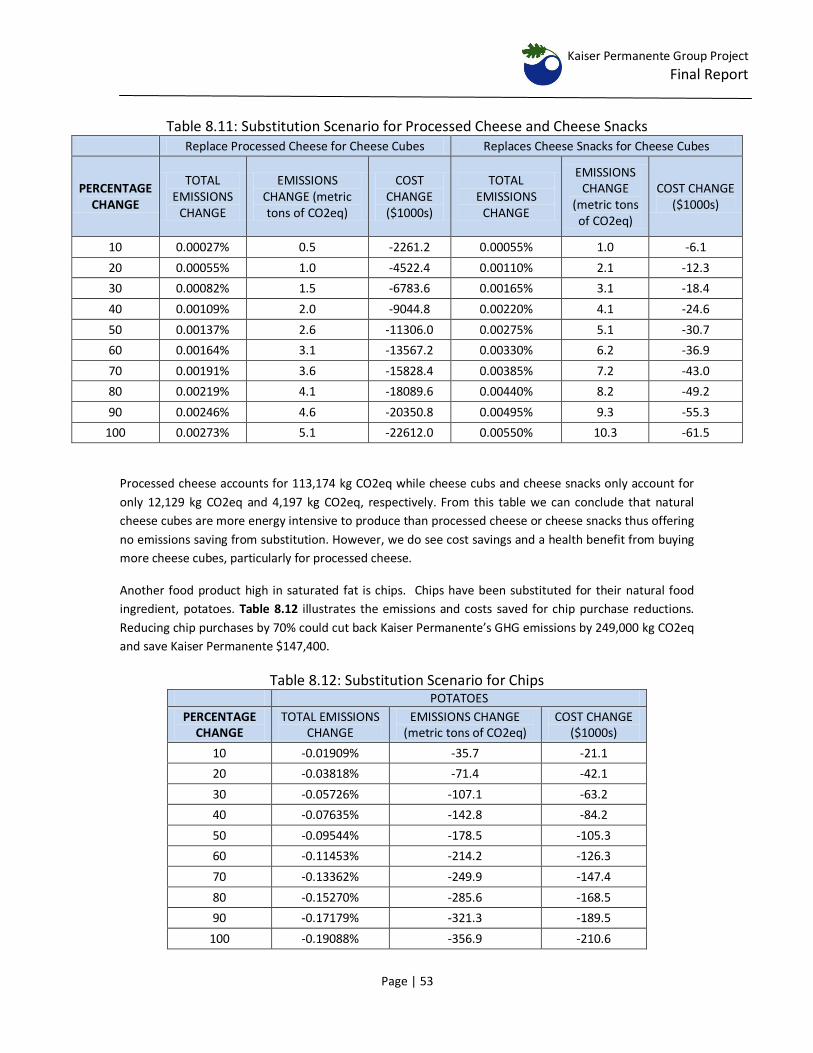
Kaiser Permanente Group Project
Final Report
Page | 53
Table 8.11: Substitution Scenario for Processed Cheese and Cheese Snacks Replace Processed Cheese for Cheese Cubes Replaces Cheese Snacks for Cheese Cubes
PERCENTAGE CHANGE
TOTAL EMISSIONS
CHANGE
EMISSIONS CHANGE (metric tons of CO2eq)
COST CHANGE ($1000s)
TOTAL EMISSIONS
CHANGE
EMISSIONS CHANGE
(metric tons of CO2eq)
COST CHANGE ($1000s)
10 0.00027% 0.5 -2261.2 0.00055% 1.0 -6.1
20 0.00055% 1.0 -4522.4 0.00110% 2.1 -12.3
30 0.00082% 1.5 -6783.6 0.00165% 3.1 -18.4
40 0.00109% 2.0 -9044.8 0.00220% 4.1 -24.6
50 0.00137% 2.6 -11306.0 0.00275% 5.1 -30.7
60 0.00164% 3.1 -13567.2 0.00330% 6.2 -36.9
70 0.00191% 3.6 -15828.4 0.00385% 7.2 -43.0
80 0.00219% 4.1 -18089.6 0.00440% 8.2 -49.2
90 0.00246% 4.6 -20350.8 0.00495% 9.3 -55.3
100 0.00273% 5.1 -22612.0 0.00550% 10.3 -61.5
Processed cheese accounts for 113,174 kg CO2eq while cheese cubs and cheese snacks only account for
only 12,129 kg CO2eq and 4,197 kg CO2eq, respectively. From this table we can conclude that natural
cheese cubes are more energy intensive to produce than processed cheese or cheese snacks thus offering
no emissions saving from substitution. However, we do see cost savings and a health benefit from buying
more cheese cubes, particularly for processed cheese.
Another food product high in saturated fat is chips. Chips have been substituted for their natural food
ingredient, potatoes. Table 8.12 illustrates the emissions and costs saved for chip purchase reductions.
Reducing chip purchases by 70% could cut back Kaiser Permanente’s GHG emissions by 249,000 kg CO2eq
and save Kaiser Permanente $147,400.
Table 8.12: Substitution Scenario for Chips POTATOES
PERCENTAGE CHANGE
TOTAL EMISSIONS CHANGE
EMISSIONS CHANGE (metric tons of CO2eq)
COST CHANGE ($1000s)
10 -0.01909% -35.7 -21.1
20 -0.03818% -71.4 -42.1
30 -0.05726% -107.1 -63.2
40 -0.07635% -142.8 -84.2
50 -0.09544% -178.5 -105.3
60 -0.11453% -214.2 -126.3
70 -0.13362% -249.9 -147.4
80 -0.15270% -285.6 -168.5
90 -0.17179% -321.3 -189.5
100 -0.19088% -356.9 -210.6
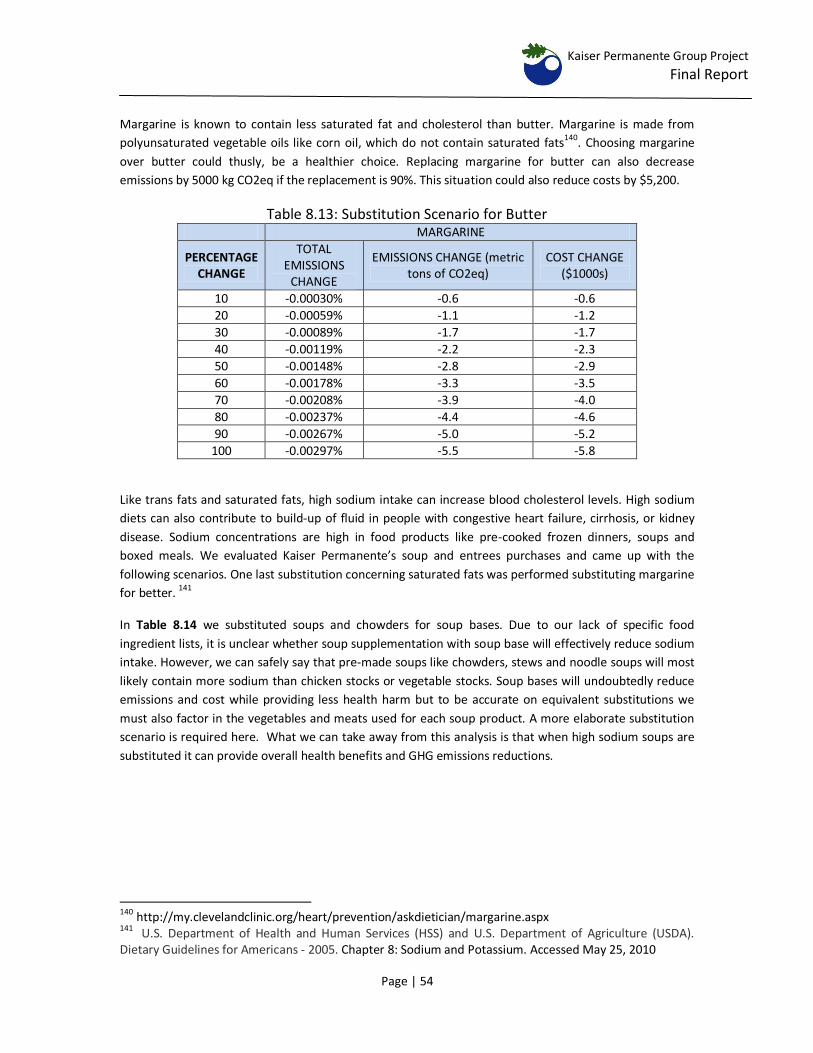
Kaiser Permanente Group Project
Final Report
Page | 54
Margarine is known to contain less saturated fat and cholesterol than butter. Margarine is made from
polyunsaturated vegetable oils like corn oil, which do not contain saturated fats140. Choosing margarine
over butter could thusly, be a healthier choice. Replacing margarine for butter can also decrease
emissions by 5000 kg CO2eq if the replacement is 90%. This situation could also reduce costs by $5,200.
Table 8.13: Substitution Scenario for Butter MARGARINE
PERCENTAGE CHANGE
TOTAL EMISSIONS
CHANGE
EMISSIONS CHANGE (metric tons of CO2eq)
COST CHANGE ($1000s)
10 -0.00030% -0.6 -0.6
20 -0.00059% -1.1 -1.2
30 -0.00089% -1.7 -1.7
40 -0.00119% -2.2 -2.3
50 -0.00148% -2.8 -2.9
60 -0.00178% -3.3 -3.5
70 -0.00208% -3.9 -4.0
80 -0.00237% -4.4 -4.6
90 -0.00267% -5.0 -5.2
100 -0.00297% -5.5 -5.8
Like trans fats and saturated fats, high sodium intake can increase blood cholesterol levels. High sodium
diets can also contribute to build-up of fluid in people with congestive heart failure, cirrhosis, or kidney
disease. Sodium concentrations are high in food products like pre-cooked frozen dinners, soups and
boxed meals. We evaluated Kaiser Permanente’s soup and entrees purchases and came up with the
following scenarios. One last substitution concerning saturated fats was performed substituting margarine
for better. 141
In Table 8.14 we substituted soups and chowders for soup bases. Due to our lack of specific food
ingredient lists, it is unclear whether soup supplementation with soup base will effectively reduce sodium
intake. However, we can safely say that pre-made soups like chowders, stews and noodle soups will most
likely contain more sodium than chicken stocks or vegetable stocks. Soup bases will undoubtedly reduce
emissions and cost while providing less health harm but to be accurate on equivalent substitutions we
must also factor in the vegetables and meats used for each soup product. A more elaborate substitution
scenario is required here. What we can take away from this analysis is that when high sodium soups are
substituted it can provide overall health benefits and GHG emissions reductions.
140
http://my.clevelandclinic.org/heart/prevention/askdietician/margarine.aspx 141 U.S. Department of Health and Human Services (HSS) and U.S. Department of Agriculture (USDA). Dietary Guidelines for Americans - 2005. Chapter 8: Sodium and Potassium. Accessed May 25, 2010
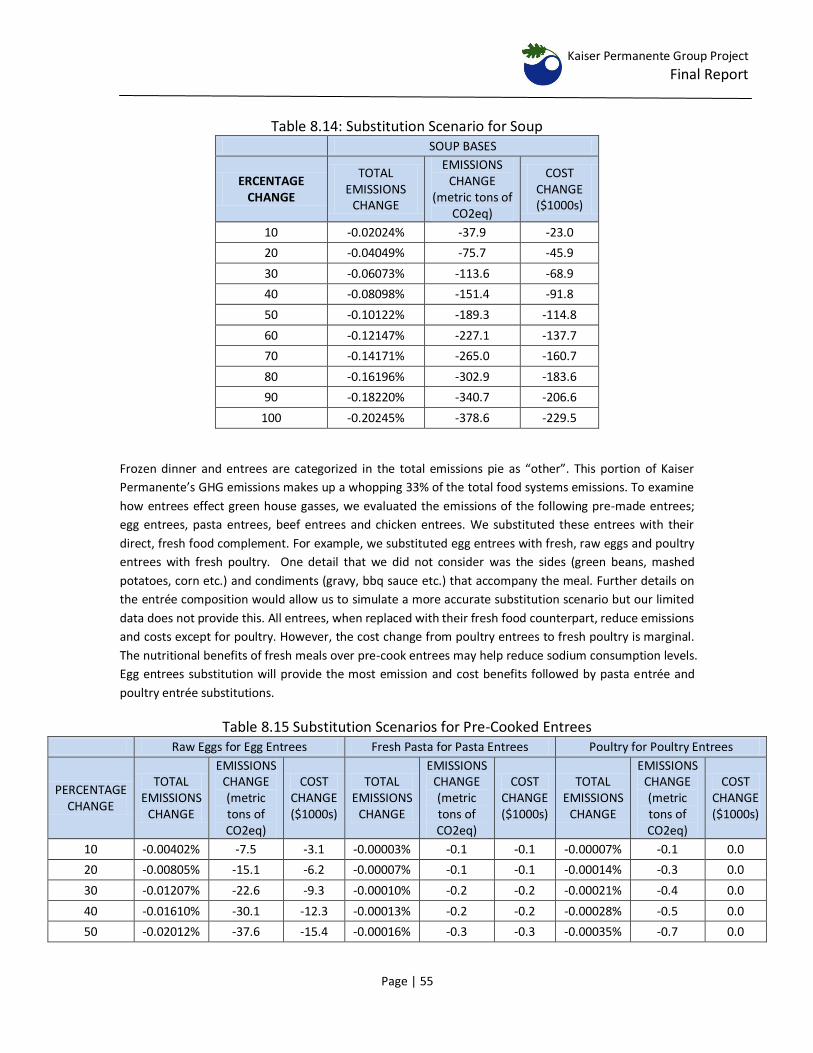
Kaiser Permanente Group Project
Final Report
Page | 55
Table 8.14: Substitution Scenario for Soup SOUP BASES
ERCENTAGE CHANGE
TOTAL EMISSIONS
CHANGE
EMISSIONS CHANGE
(metric tons of CO2eq)
COST CHANGE ($1000s)
10 -0.02024% -37.9 -23.0
20 -0.04049% -75.7 -45.9
30 -0.06073% -113.6 -68.9
40 -0.08098% -151.4 -91.8
50 -0.10122% -189.3 -114.8
60 -0.12147% -227.1 -137.7
70 -0.14171% -265.0 -160.7
80 -0.16196% -302.9 -183.6
90 -0.18220% -340.7 -206.6
100 -0.20245% -378.6 -229.5
Frozen dinner and entrees are categorized in the total emissions pie as “other”. This portion of Kaiser
Permanente’s GHG emissions makes up a whopping 33% of the total food systems emissions. To examine
how entrees effect green house gasses, we evaluated the emissions of the following pre-made entrees;
egg entrees, pasta entrees, beef entrees and chicken entrees. We substituted these entrees with their
direct, fresh food complement. For example, we substituted egg entrees with fresh, raw eggs and poultry
entrees with fresh poultry. One detail that we did not consider was the sides (green beans, mashed
potatoes, corn etc.) and condiments (gravy, bbq sauce etc.) that accompany the meal. Further details on
the entrée composition would allow us to simulate a more accurate substitution scenario but our limited
data does not provide this. All entrees, when replaced with their fresh food counterpart, reduce emissions
and costs except for poultry. However, the cost change from poultry entrees to fresh poultry is marginal.
The nutritional benefits of fresh meals over pre-cook entrees may help reduce sodium consumption levels.
Egg entrees substitution will provide the most emission and cost benefits followed by pasta entrée and
poultry entrée substitutions.
Table 8.15 Substitution Scenarios for Pre-Cooked Entrees Raw Eggs for Egg Entrees Fresh Pasta for Pasta Entrees Poultry for Poultry Entrees
PERCENTAGE CHANGE
TOTAL EMISSIONS
CHANGE
EMISSIONS CHANGE (metric tons of CO2eq)
COST CHANGE ($1000s)
TOTAL EMISSIONS
CHANGE
EMISSIONS CHANGE (metric tons of CO2eq)
COST CHANGE ($1000s)
TOTAL EMISSIONS
CHANGE
EMISSIONS CHANGE (metric tons of CO2eq)
COST CHANGE ($1000s)
10 -0.00402% -7.5 -3.1 -0.00003% -0.1 -0.1 -0.00007% -0.1 0.0
20 -0.00805% -15.1 -6.2 -0.00007% -0.1 -0.1 -0.00014% -0.3 0.0
30 -0.01207% -22.6 -9.3 -0.00010% -0.2 -0.2 -0.00021% -0.4 0.0
40 -0.01610% -30.1 -12.3 -0.00013% -0.2 -0.2 -0.00028% -0.5 0.0
50 -0.02012% -37.6 -15.4 -0.00016% -0.3 -0.3 -0.00035% -0.7 0.0
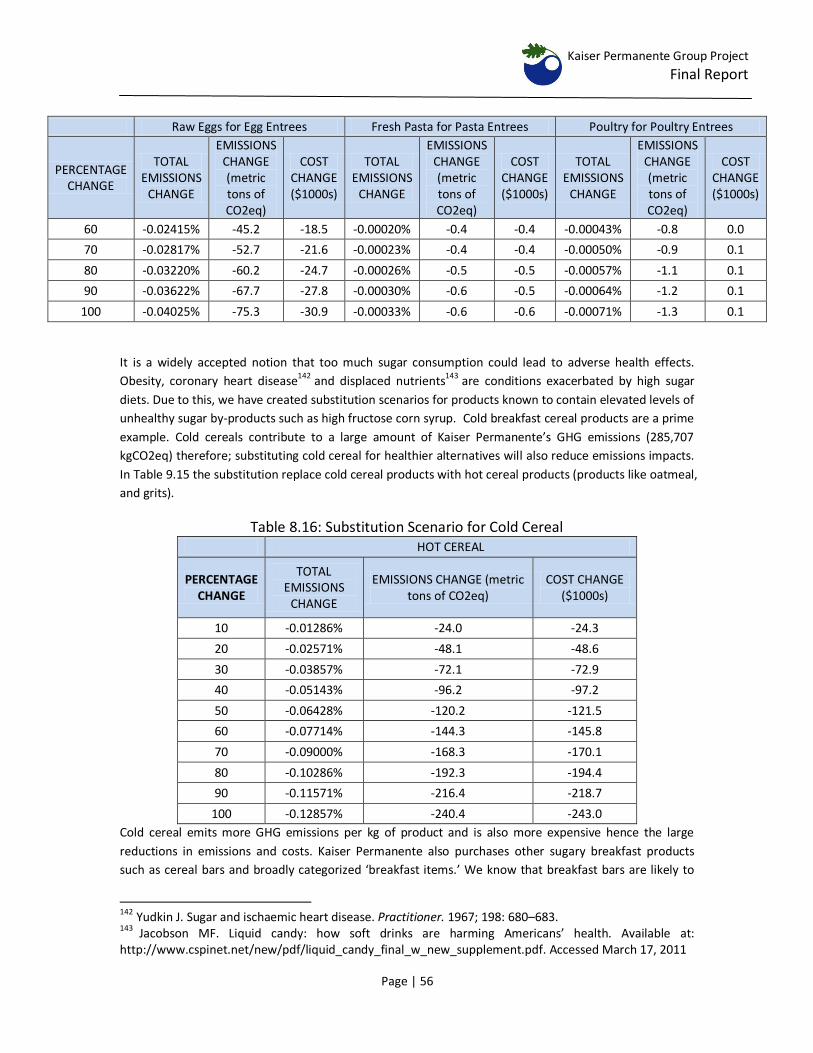
Kaiser Permanente Group Project
Final Report
Page | 56
Raw Eggs for Egg Entrees Fresh Pasta for Pasta Entrees Poultry for Poultry Entrees
PERCENTAGE CHANGE
TOTAL EMISSIONS
CHANGE
EMISSIONS CHANGE (metric tons of CO2eq)
COST CHANGE ($1000s)
TOTAL EMISSIONS
CHANGE
EMISSIONS CHANGE (metric tons of CO2eq)
COST CHANGE ($1000s)
TOTAL EMISSIONS
CHANGE
EMISSIONS CHANGE (metric tons of CO2eq)
COST CHANGE ($1000s)
60 -0.02415% -45.2 -18.5 -0.00020% -0.4 -0.4 -0.00043% -0.8 0.0
70 -0.02817% -52.7 -21.6 -0.00023% -0.4 -0.4 -0.00050% -0.9 0.1
80 -0.03220% -60.2 -24.7 -0.00026% -0.5 -0.5 -0.00057% -1.1 0.1
90 -0.03622% -67.7 -27.8 -0.00030% -0.6 -0.5 -0.00064% -1.2 0.1
100 -0.04025% -75.3 -30.9 -0.00033% -0.6 -0.6 -0.00071% -1.3 0.1
It is a widely accepted notion that too much sugar consumption could lead to adverse health effects.
Obesity, coronary heart disease142
and displaced nutrients143
are conditions exacerbated by high sugar
diets. Due to this, we have created substitution scenarios for products known to contain elevated levels of
unhealthy sugar by-products such as high fructose corn syrup. Cold breakfast cereal products are a prime
example. Cold cereals contribute to a large amount of Kaiser Permanente’s GHG emissions (285,707
kgCO2eq) therefore; substituting cold cereal for healthier alternatives will also reduce emissions impacts.
In Table 9.15 the substitution replace cold cereal products with hot cereal products (products like oatmeal,
and grits).
Table 8.16: Substitution Scenario for Cold Cereal HOT CEREAL
PERCENTAGE CHANGE
TOTAL EMISSIONS
CHANGE
EMISSIONS CHANGE (metric tons of CO2eq)
COST CHANGE ($1000s)
10 -0.01286% -24.0 -24.3
20 -0.02571% -48.1 -48.6
30 -0.03857% -72.1 -72.9
40 -0.05143% -96.2 -97.2
50 -0.06428% -120.2 -121.5
60 -0.07714% -144.3 -145.8
70 -0.09000% -168.3 -170.1
80 -0.10286% -192.3 -194.4
90 -0.11571% -216.4 -218.7
100 -0.12857% -240.4 -243.0
Cold cereal emits more GHG emissions per kg of product and is also more expensive hence the large
reductions in emissions and costs. Kaiser Permanente also purchases other sugary breakfast products
such as cereal bars and broadly categorized ‘breakfast items.’ We know that breakfast bars are likely to
142
Yudkin J. Sugar and ischaemic heart disease. Practitioner. 1967; 198: 680–683. 143 Jacobson MF. Liquid candy: how soft drinks are harming Americans’ health. Available at: http://www.cspinet.net/new/pdf/liquid_candy_final_w_new_supplement.pdf. Accessed March 17, 2011
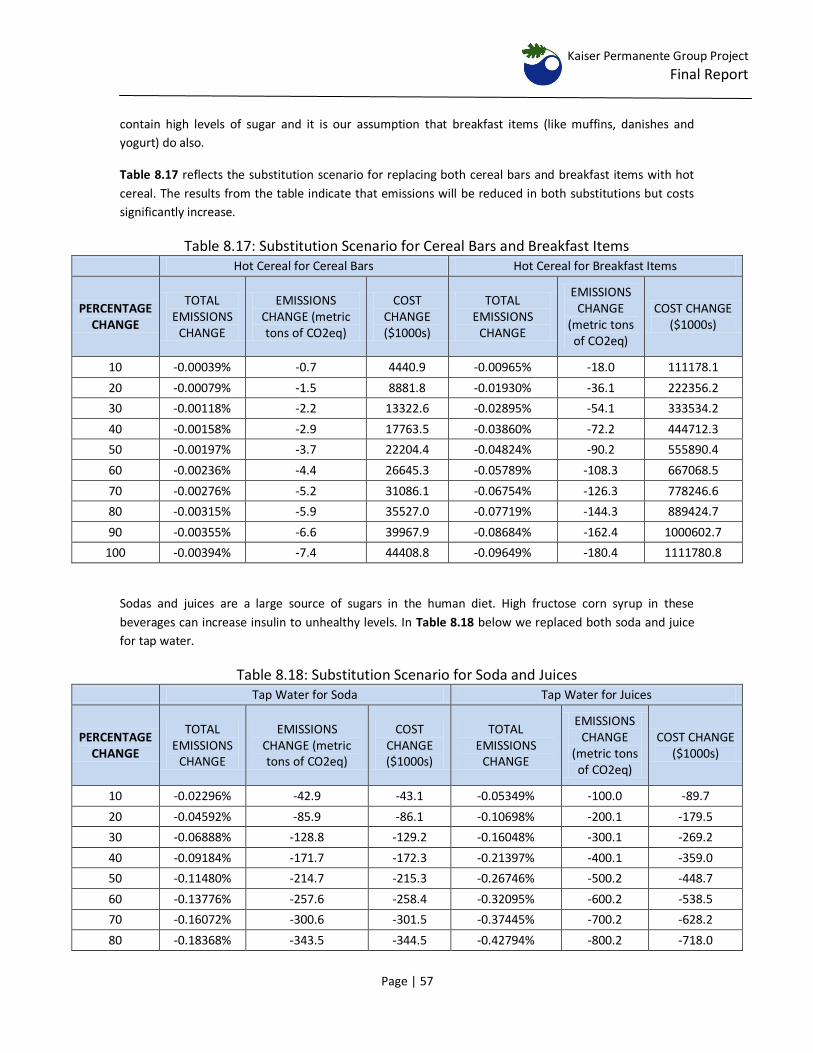
Kaiser Permanente Group Project
Final Report
Page | 57
contain high levels of sugar and it is our assumption that breakfast items (like muffins, danishes and
yogurt) do also.
Table 8.17 reflects the substitution scenario for replacing both cereal bars and breakfast items with hot
cereal. The results from the table indicate that emissions will be reduced in both substitutions but costs
significantly increase.
Table 8.17: Substitution Scenario for Cereal Bars and Breakfast Items Hot Cereal for Cereal Bars Hot Cereal for Breakfast Items
PERCENTAGE CHANGE
TOTAL EMISSIONS
CHANGE
EMISSIONS CHANGE (metric tons of CO2eq)
COST CHANGE ($1000s)
TOTAL EMISSIONS
CHANGE
EMISSIONS CHANGE
(metric tons of CO2eq)
COST CHANGE ($1000s)
10 -0.00039% -0.7 4440.9 -0.00965% -18.0 111178.1
20 -0.00079% -1.5 8881.8 -0.01930% -36.1 222356.2
30 -0.00118% -2.2 13322.6 -0.02895% -54.1 333534.2
40 -0.00158% -2.9 17763.5 -0.03860% -72.2 444712.3
50 -0.00197% -3.7 22204.4 -0.04824% -90.2 555890.4
60 -0.00236% -4.4 26645.3 -0.05789% -108.3 667068.5
70 -0.00276% -5.2 31086.1 -0.06754% -126.3 778246.6
80 -0.00315% -5.9 35527.0 -0.07719% -144.3 889424.7
90 -0.00355% -6.6 39967.9 -0.08684% -162.4 1000602.7
100 -0.00394% -7.4 44408.8 -0.09649% -180.4 1111780.8
Sodas and juices are a large source of sugars in the human diet. High fructose corn syrup in these
beverages can increase insulin to unhealthy levels. In Table 8.18 below we replaced both soda and juice
for tap water.
Table 8.18: Substitution Scenario for Soda and Juices Tap Water for Soda Tap Water for Juices
PERCENTAGE CHANGE
TOTAL EMISSIONS
CHANGE
EMISSIONS CHANGE (metric tons of CO2eq)
COST CHANGE ($1000s)
TOTAL EMISSIONS
CHANGE
EMISSIONS CHANGE
(metric tons of CO2eq)
COST CHANGE ($1000s)
10 -0.02296% -42.9 -43.1 -0.05349% -100.0 -89.7
20 -0.04592% -85.9 -86.1 -0.10698% -200.1 -179.5
30 -0.06888% -128.8 -129.2 -0.16048% -300.1 -269.2
40 -0.09184% -171.7 -172.3 -0.21397% -400.1 -359.0
50 -0.11480% -214.7 -215.3 -0.26746% -500.2 -448.7
60 -0.13776% -257.6 -258.4 -0.32095% -600.2 -538.5
70 -0.16072% -300.6 -301.5 -0.37445% -700.2 -628.2
80 -0.18368% -343.5 -344.5 -0.42794% -800.2 -718.0
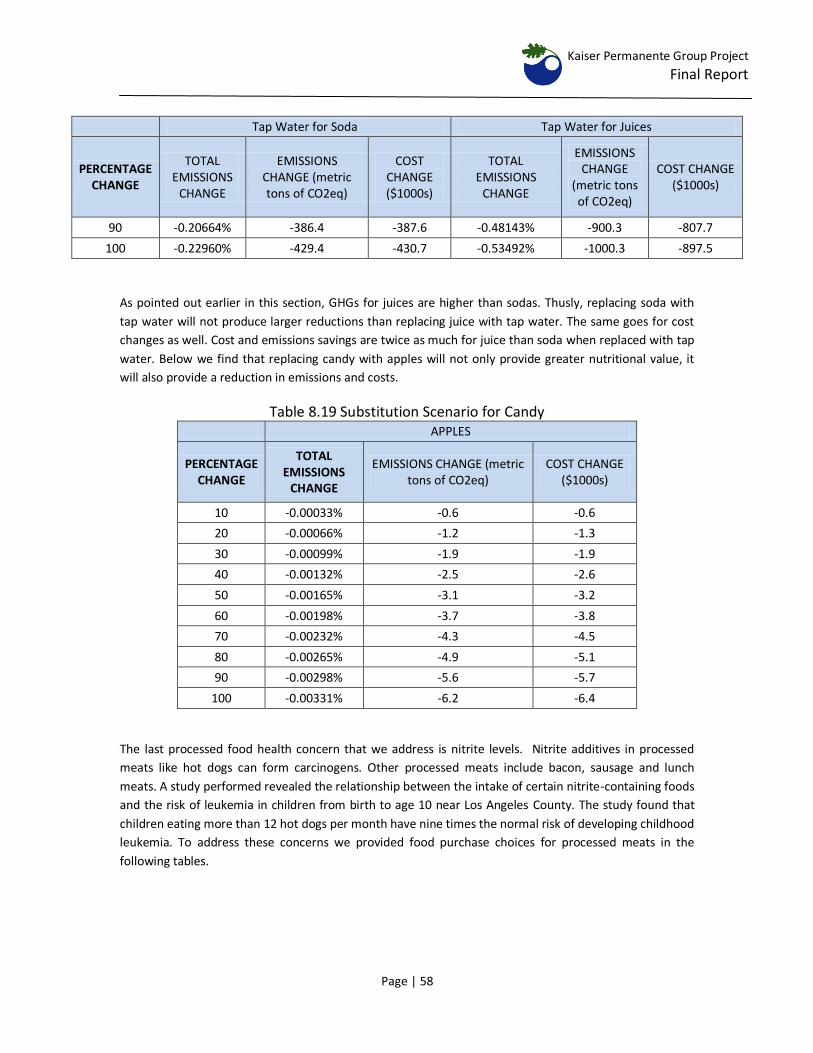
Kaiser Permanente Group Project
Final Report
Page | 58
Tap Water for Soda Tap Water for Juices
PERCENTAGE CHANGE
TOTAL EMISSIONS
CHANGE
EMISSIONS CHANGE (metric tons of CO2eq)
COST CHANGE ($1000s)
TOTAL EMISSIONS
CHANGE
EMISSIONS CHANGE
(metric tons of CO2eq)
COST CHANGE ($1000s)
90 -0.20664% -386.4 -387.6 -0.48143% -900.3 -807.7
100 -0.22960% -429.4 -430.7 -0.53492% -1000.3 -897.5
As pointed out earlier in this section, GHGs for juices are higher than sodas. Thusly, replacing soda with
tap water will not produce larger reductions than replacing juice with tap water. The same goes for cost
changes as well. Cost and emissions savings are twice as much for juice than soda when replaced with tap
water. Below we find that replacing candy with apples will not only provide greater nutritional value, it
will also provide a reduction in emissions and costs.
Table 8.19 Substitution Scenario for Candy APPLES
PERCENTAGE CHANGE
TOTAL EMISSIONS
CHANGE
EMISSIONS CHANGE (metric tons of CO2eq)
COST CHANGE ($1000s)
10 -0.00033% -0.6 -0.6
20 -0.00066% -1.2 -1.3
30 -0.00099% -1.9 -1.9
40 -0.00132% -2.5 -2.6
50 -0.00165% -3.1 -3.2
60 -0.00198% -3.7 -3.8
70 -0.00232% -4.3 -4.5
80 -0.00265% -4.9 -5.1
90 -0.00298% -5.6 -5.7
100 -0.00331% -6.2 -6.4
The last processed food health concern that we address is nitrite levels. Nitrite additives in processed
meats like hot dogs can form carcinogens. Other processed meats include bacon, sausage and lunch
meats. A study performed revealed the relationship between the intake of certain nitrite-containing foods
and the risk of leukemia in children from birth to age 10 near Los Angeles County. The study found that
children eating more than 12 hot dogs per month have nine times the normal risk of developing childhood
leukemia. To address these concerns we provided food purchase choices for processed meats in the
following tables.
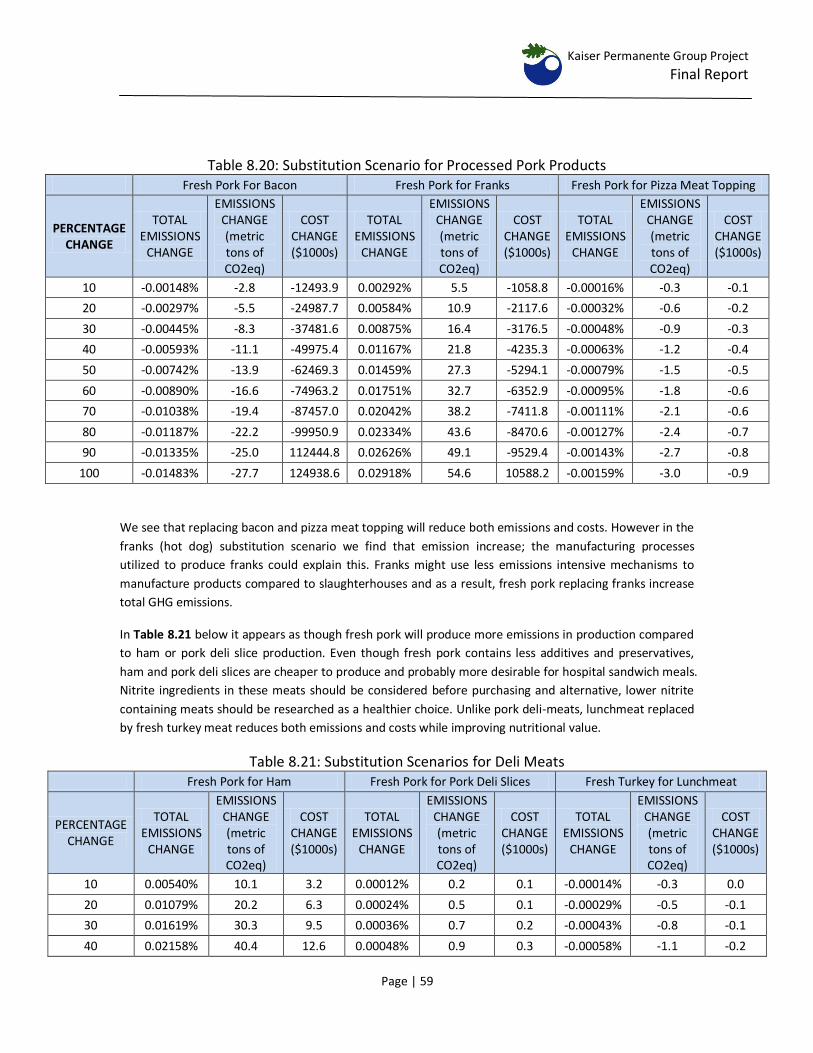
Kaiser Permanente Group Project
Final Report
Page | 59
Table 8.20: Substitution Scenario for Processed Pork Products Fresh Pork For Bacon Fresh Pork for Franks Fresh Pork for Pizza Meat Topping
PERCENTAGE CHANGE
TOTAL EMISSIONS
CHANGE
EMISSIONS CHANGE (metric tons of CO2eq)
COST CHANGE ($1000s)
TOTAL EMISSIONS
CHANGE
EMISSIONS CHANGE (metric tons of CO2eq)
COST CHANGE ($1000s)
TOTAL EMISSIONS
CHANGE
EMISSIONS CHANGE (metric tons of CO2eq)
COST CHANGE ($1000s)
10 -0.00148% -2.8 -12493.9 0.00292% 5.5 -1058.8 -0.00016% -0.3 -0.1
20 -0.00297% -5.5 -24987.7 0.00584% 10.9 -2117.6 -0.00032% -0.6 -0.2
30 -0.00445% -8.3 -37481.6 0.00875% 16.4 -3176.5 -0.00048% -0.9 -0.3
40 -0.00593% -11.1 -49975.4 0.01167% 21.8 -4235.3 -0.00063% -1.2 -0.4
50 -0.00742% -13.9 -62469.3 0.01459% 27.3 -5294.1 -0.00079% -1.5 -0.5
60 -0.00890% -16.6 -74963.2 0.01751% 32.7 -6352.9 -0.00095% -1.8 -0.6
70 -0.01038% -19.4 -87457.0 0.02042% 38.2 -7411.8 -0.00111% -2.1 -0.6
80 -0.01187% -22.2 -99950.9 0.02334% 43.6 -8470.6 -0.00127% -2.4 -0.7
90 -0.01335% -25.0 112444.8 0.02626% 49.1 -9529.4 -0.00143% -2.7 -0.8
100 -0.01483% -27.7 124938.6 0.02918% 54.6 10588.2 -0.00159% -3.0 -0.9
We see that replacing bacon and pizza meat topping will reduce both emissions and costs. However in the
franks (hot dog) substitution scenario we find that emission increase; the manufacturing processes
utilized to produce franks could explain this. Franks might use less emissions intensive mechanisms to
manufacture products compared to slaughterhouses and as a result, fresh pork replacing franks increase
total GHG emissions.
In Table 8.21 below it appears as though fresh pork will produce more emissions in production compared
to ham or pork deli slice production. Even though fresh pork contains less additives and preservatives,
ham and pork deli slices are cheaper to produce and probably more desirable for hospital sandwich meals.
Nitrite ingredients in these meats should be considered before purchasing and alternative, lower nitrite
containing meats should be researched as a healthier choice. Unlike pork deli-meats, lunchmeat replaced
by fresh turkey meat reduces both emissions and costs while improving nutritional value.
Table 8.21: Substitution Scenarios for Deli Meats Fresh Pork for Ham Fresh Pork for Pork Deli Slices Fresh Turkey for Lunchmeat
PERCENTAGE CHANGE
TOTAL EMISSIONS
CHANGE
EMISSIONS CHANGE (metric tons of CO2eq)
COST CHANGE ($1000s)
TOTAL EMISSIONS
CHANGE
EMISSIONS CHANGE (metric tons of CO2eq)
COST CHANGE ($1000s)
TOTAL EMISSIONS
CHANGE
EMISSIONS CHANGE (metric tons of CO2eq)
COST CHANGE ($1000s)
10 0.00540% 10.1 3.2 0.00012% 0.2 0.1 -0.00014% -0.3 0.0
20 0.01079% 20.2 6.3 0.00024% 0.5 0.1 -0.00029% -0.5 -0.1
30 0.01619% 30.3 9.5 0.00036% 0.7 0.2 -0.00043% -0.8 -0.1
40 0.02158% 40.4 12.6 0.00048% 0.9 0.3 -0.00058% -1.1 -0.2
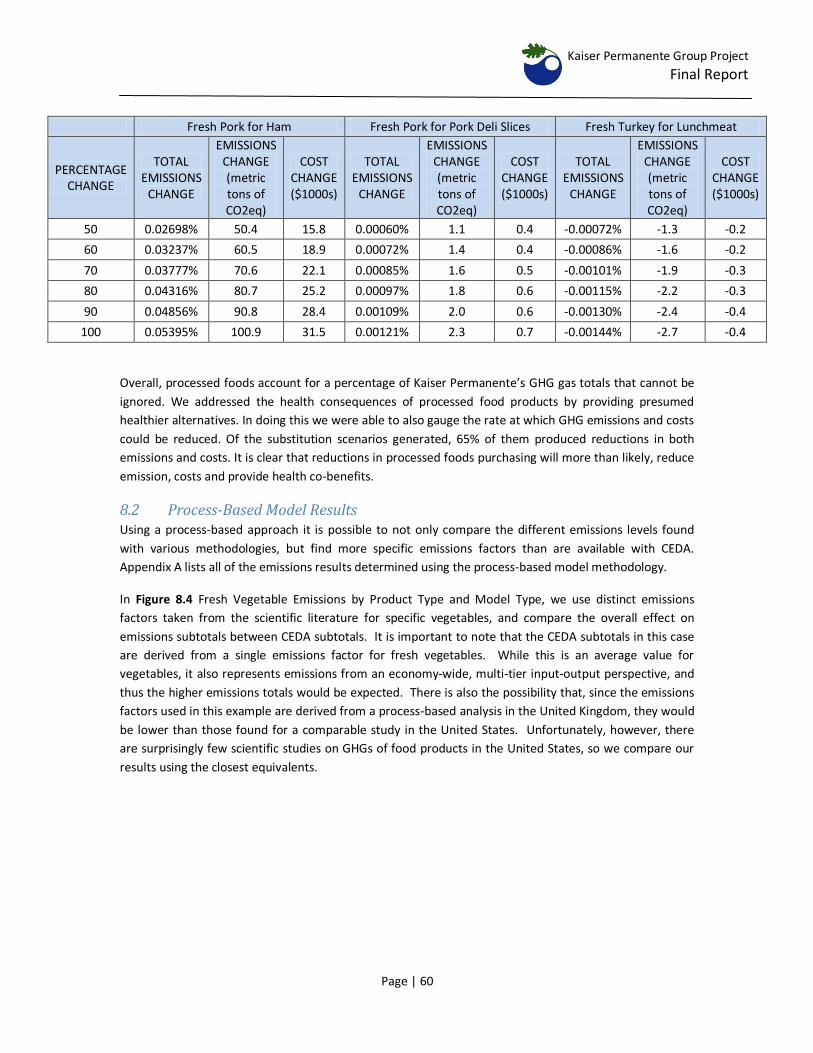
Kaiser Permanente Group Project
Final Report
Page | 60
Fresh Pork for Ham Fresh Pork for Pork Deli Slices Fresh Turkey for Lunchmeat
PERCENTAGE CHANGE
TOTAL EMISSIONS
CHANGE
EMISSIONS CHANGE (metric tons of CO2eq)
COST CHANGE ($1000s)
TOTAL EMISSIONS
CHANGE
EMISSIONS CHANGE (metric tons of CO2eq)
COST CHANGE ($1000s)
TOTAL EMISSIONS
CHANGE
EMISSIONS CHANGE (metric tons of CO2eq)
COST CHANGE ($1000s)
50 0.02698% 50.4 15.8 0.00060% 1.1 0.4 -0.00072% -1.3 -0.2
60 0.03237% 60.5 18.9 0.00072% 1.4 0.4 -0.00086% -1.6 -0.2
70 0.03777% 70.6 22.1 0.00085% 1.6 0.5 -0.00101% -1.9 -0.3
80 0.04316% 80.7 25.2 0.00097% 1.8 0.6 -0.00115% -2.2 -0.3
90 0.04856% 90.8 28.4 0.00109% 2.0 0.6 -0.00130% -2.4 -0.4
100 0.05395% 100.9 31.5 0.00121% 2.3 0.7 -0.00144% -2.7 -0.4
Overall, processed foods account for a percentage of Kaiser Permanente’s GHG gas totals that cannot be
ignored. We addressed the health consequences of processed food products by providing presumed
healthier alternatives. In doing this we were able to also gauge the rate at which GHG emissions and costs
could be reduced. Of the substitution scenarios generated, 65% of them produced reductions in both
emissions and costs. It is clear that reductions in processed foods purchasing will more than likely, reduce
emission, costs and provide health co-benefits.
8.2 Process-Based Model Results Using a process-based approach it is possible to not only compare the different emissions levels found
with various methodologies, but find more specific emissions factors than are available with CEDA.
Appendix A lists all of the emissions results determined using the process-based model methodology.
In Figure 8.4 Fresh Vegetable Emissions by Product Type and Model Type, we use distinct emissions
factors taken from the scientific literature for specific vegetables, and compare the overall effect on
emissions subtotals between CEDA subtotals. It is important to note that the CEDA subtotals in this case
are derived from a single emissions factor for fresh vegetables. While this is an average value for
vegetables, it also represents emissions from an economy-wide, multi-tier input-output perspective, and
thus the higher emissions totals would be expected. There is also the possibility that, since the emissions
factors used in this example are derived from a process-based analysis in the United Kingdom, they would
be lower than those found for a comparable study in the United States. Unfortunately, however, there
are surprisingly few scientific studies on GHGs of food products in the United States, so we compare our
results using the closest equivalents.
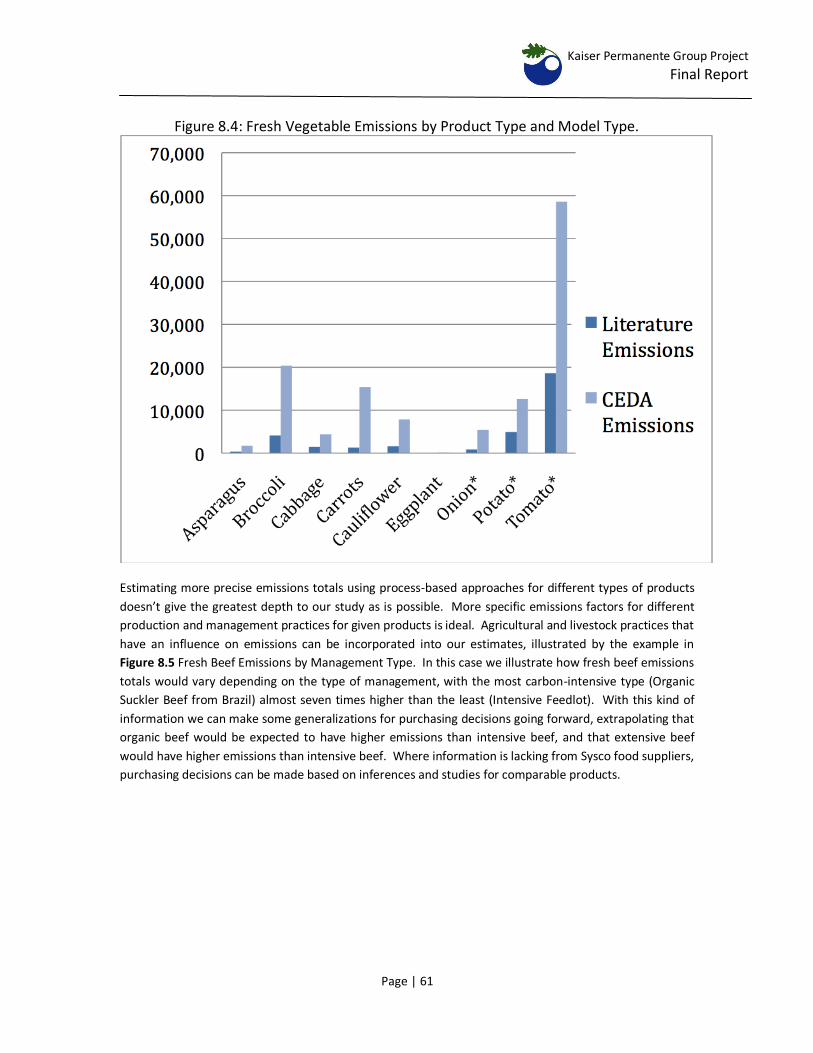
Kaiser Permanente Group Project
Final Report
Page | 61
Figure 8.4: Fresh Vegetable Emissions by Product Type and Model Type.
Estimating more precise emissions totals using process-based approaches for different types of products
doesn’t give the greatest depth to our study as is possible. More specific emissions factors for different
production and management practices for given products is ideal. Agricultural and livestock practices that
have an influence on emissions can be incorporated into our estimates, illustrated by the example in
Figure 8.5 Fresh Beef Emissions by Management Type. In this case we illustrate how fresh beef emissions
totals would vary depending on the type of management, with the most carbon-intensive type (Organic
Suckler Beef from Brazil) almost seven times higher than the least (Intensive Feedlot). With this kind of
information we can make some generalizations for purchasing decisions going forward, extrapolating that
organic beef would be expected to have higher emissions than intensive beef, and that extensive beef
would have higher emissions than intensive beef. Where information is lacking from Sysco food suppliers,
purchasing decisions can be made based on inferences and studies for comparable products.
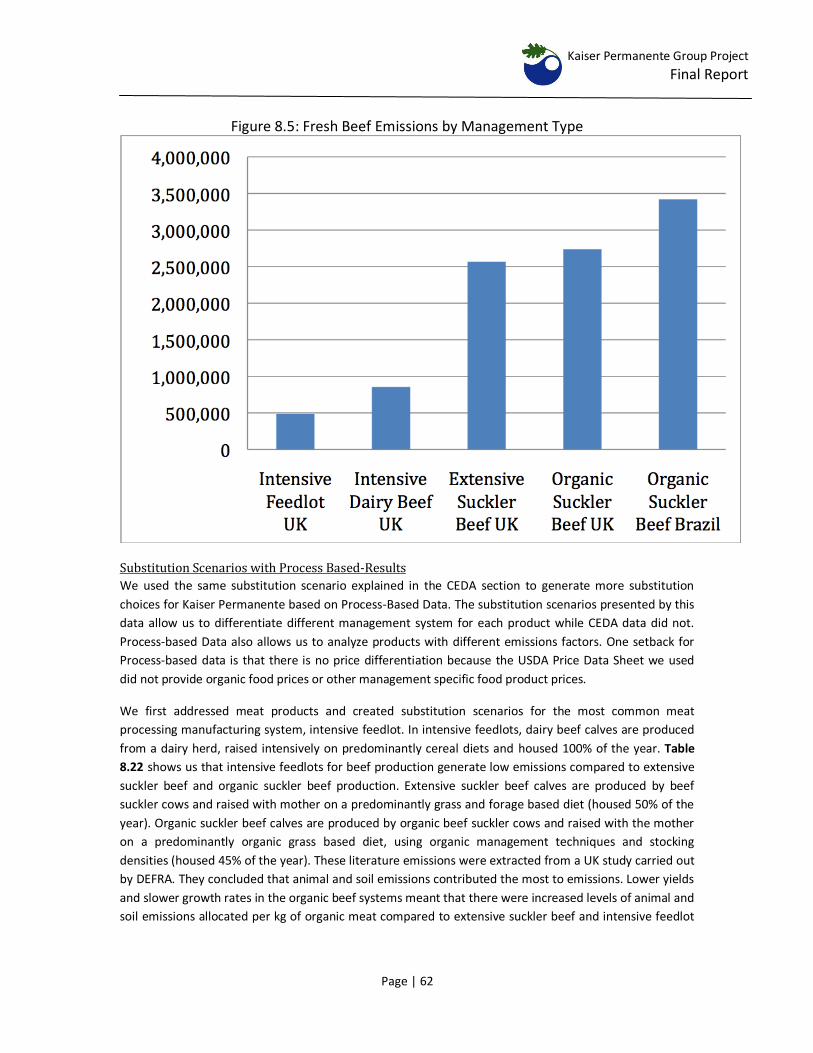
Kaiser Permanente Group Project
Final Report
Page | 62
Figure 8.5: Fresh Beef Emissions by Management Type
Substitution Scenarios with Process Based-Results
We used the same substitution scenario explained in the CEDA section to generate more substitution
choices for Kaiser Permanente based on Process-Based Data. The substitution scenarios presented by this
data allow us to differentiate different management system for each product while CEDA data did not.
Process-based Data also allows us to analyze products with different emissions factors. One setback for
Process-based data is that there is no price differentiation because the USDA Price Data Sheet we used
did not provide organic food prices or other management specific food product prices.
We first addressed meat products and created substitution scenarios for the most common meat
processing manufacturing system, intensive feedlot. In intensive feedlots, dairy beef calves are produced
from a dairy herd, raised intensively on predominantly cereal diets and housed 100% of the year. Table
8.22 shows us that intensive feedlots for beef production generate low emissions compared to extensive
suckler beef and organic suckler beef production. Extensive suckler beef calves are produced by beef
suckler cows and raised with mother on a predominantly grass and forage based diet (housed 50% of the
year). Organic suckler beef calves are produced by organic beef suckler cows and raised with the mother
on a predominantly organic grass based diet, using organic management techniques and stocking
densities (housed 45% of the year). These literature emissions were extracted from a UK study carried out
by DEFRA. They concluded that animal and soil emissions contributed the most to emissions. Lower yields
and slower growth rates in the organic beef systems meant that there were increased levels of animal and
soil emissions allocated per kg of organic meat compared to extensive suckler beef and intensive feedlot
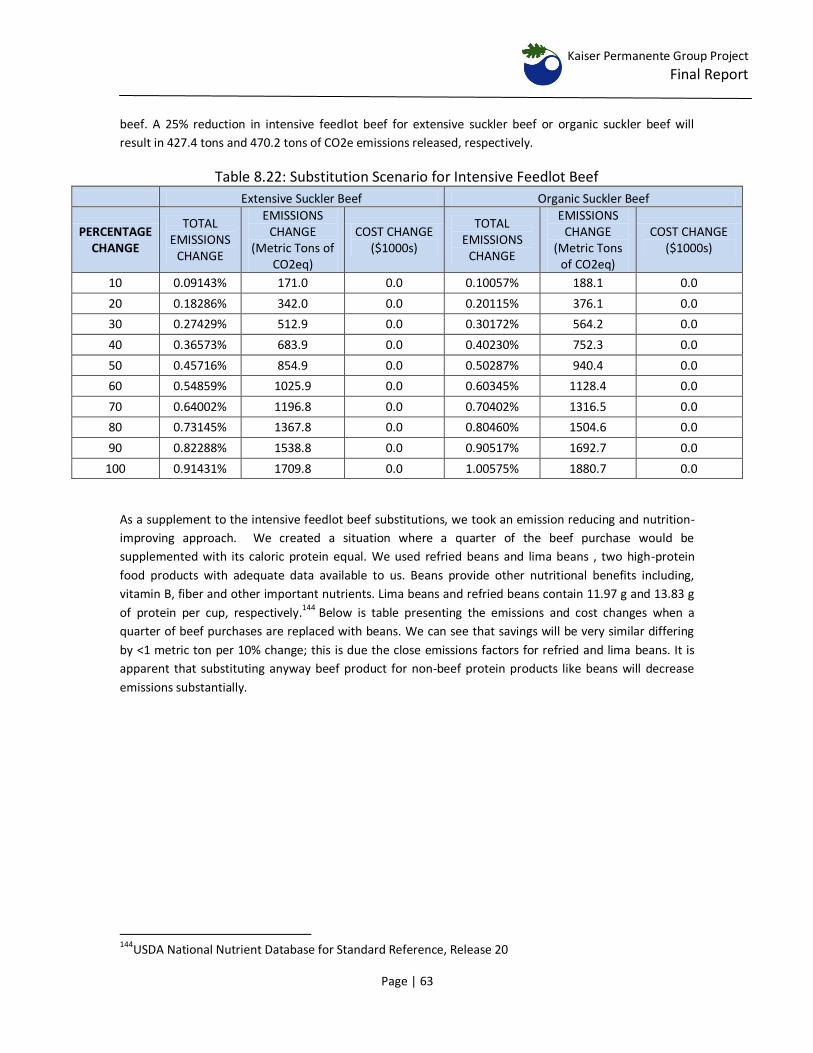
Kaiser Permanente Group Project
Final Report
Page | 63
beef. A 25% reduction in intensive feedlot beef for extensive suckler beef or organic suckler beef will
result in 427.4 tons and 470.2 tons of CO2e emissions released, respectively.
Table 8.22: Substitution Scenario for Intensive Feedlot Beef
Extensive Suckler Beef Organic Suckler Beef
PERCENTAGE CHANGE
TOTAL EMISSIONS
CHANGE
EMISSIONS CHANGE
(Metric Tons of CO2eq)
COST CHANGE ($1000s)
TOTAL EMISSIONS
CHANGE
EMISSIONS CHANGE
(Metric Tons of CO2eq)
COST CHANGE ($1000s)
10 0.09143% 171.0 0.0 0.10057% 188.1 0.0
20 0.18286% 342.0 0.0 0.20115% 376.1 0.0
30 0.27429% 512.9 0.0 0.30172% 564.2 0.0
40 0.36573% 683.9 0.0 0.40230% 752.3 0.0
50 0.45716% 854.9 0.0 0.50287% 940.4 0.0
60 0.54859% 1025.9 0.0 0.60345% 1128.4 0.0
70 0.64002% 1196.8 0.0 0.70402% 1316.5 0.0
80 0.73145% 1367.8 0.0 0.80460% 1504.6 0.0
90 0.82288% 1538.8 0.0 0.90517% 1692.7 0.0
100 0.91431% 1709.8 0.0 1.00575% 1880.7 0.0
As a supplement to the intensive feedlot beef substitutions, we took an emission reducing and nutrition-
improving approach. We created a situation where a quarter of the beef purchase would be
supplemented with its caloric protein equal. We used refried beans and lima beans , two high-protein
food products with adequate data available to us. Beans provide other nutritional benefits including,
vitamin B, fiber and other important nutrients. Lima beans and refried beans contain 11.97 g and 13.83 g
of protein per cup, respectively.144 Below is table presenting the emissions and cost changes when a
quarter of beef purchases are replaced with beans. We can see that savings will be very similar differing
by <1 metric ton per 10% change; this is due the close emissions factors for refried and lima beans. It is
apparent that substituting anyway beef product for non-beef protein products like beans will decrease
emissions substantially.
144USDA National Nutrient Database for Standard Reference, Release 20
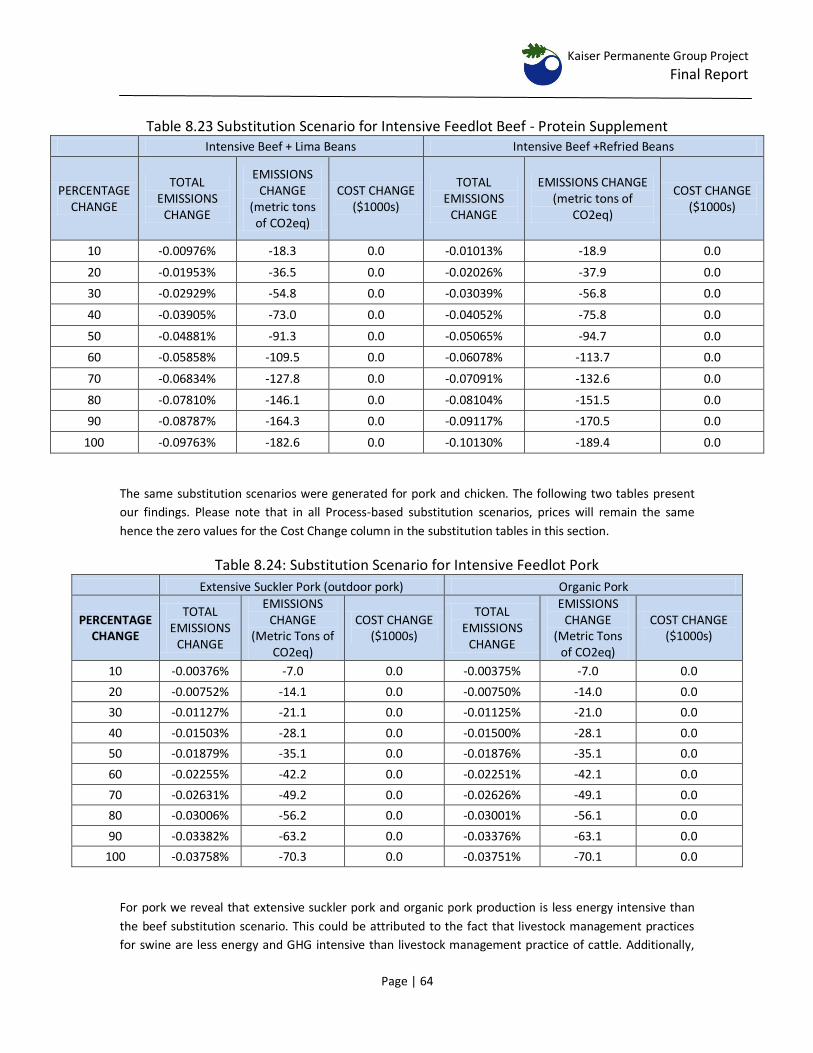
Kaiser Permanente Group Project
Final Report
Page | 64
Table 8.23 Substitution Scenario for Intensive Feedlot Beef - Protein Supplement Intensive Beef + Lima Beans Intensive Beef +Refried Beans
PERCENTAGE CHANGE
TOTAL EMISSIONS
CHANGE
EMISSIONS CHANGE
(metric tons of CO2eq)
COST CHANGE ($1000s)
TOTAL EMISSIONS
CHANGE
EMISSIONS CHANGE (metric tons of
CO2eq)
COST CHANGE ($1000s)
10 -0.00976% -18.3 0.0 -0.01013% -18.9 0.0
20 -0.01953% -36.5 0.0 -0.02026% -37.9 0.0
30 -0.02929% -54.8 0.0 -0.03039% -56.8 0.0
40 -0.03905% -73.0 0.0 -0.04052% -75.8 0.0
50 -0.04881% -91.3 0.0 -0.05065% -94.7 0.0
60 -0.05858% -109.5 0.0 -0.06078% -113.7 0.0
70 -0.06834% -127.8 0.0 -0.07091% -132.6 0.0
80 -0.07810% -146.1 0.0 -0.08104% -151.5 0.0
90 -0.08787% -164.3 0.0 -0.09117% -170.5 0.0
100 -0.09763% -182.6 0.0 -0.10130% -189.4 0.0
The same substitution scenarios were generated for pork and chicken. The following two tables present
our findings. Please note that in all Process-based substitution scenarios, prices will remain the same
hence the zero values for the Cost Change column in the substitution tables in this section.
Table 8.24: Substitution Scenario for Intensive Feedlot Pork
Extensive Suckler Pork (outdoor pork) Organic Pork
PERCENTAGE CHANGE
TOTAL EMISSIONS
CHANGE
EMISSIONS CHANGE
(Metric Tons of CO2eq)
COST CHANGE ($1000s)
TOTAL EMISSIONS
CHANGE
EMISSIONS CHANGE
(Metric Tons of CO2eq)
COST CHANGE ($1000s)
10 -0.00376% -7.0 0.0 -0.00375% -7.0 0.0
20 -0.00752% -14.1 0.0 -0.00750% -14.0 0.0
30 -0.01127% -21.1 0.0 -0.01125% -21.0 0.0
40 -0.01503% -28.1 0.0 -0.01500% -28.1 0.0
50 -0.01879% -35.1 0.0 -0.01876% -35.1 0.0
60 -0.02255% -42.2 0.0 -0.02251% -42.1 0.0
70 -0.02631% -49.2 0.0 -0.02626% -49.1 0.0
80 -0.03006% -56.2 0.0 -0.03001% -56.1 0.0
90 -0.03382% -63.2 0.0 -0.03376% -63.1 0.0
100 -0.03758% -70.3 0.0 -0.03751% -70.1 0.0
For pork we reveal that extensive suckler pork and organic pork production is less energy intensive than
the beef substitution scenario. This could be attributed to the fact that livestock management practices
for swine are less energy and GHG intensive than livestock management practice of cattle. Additionally,
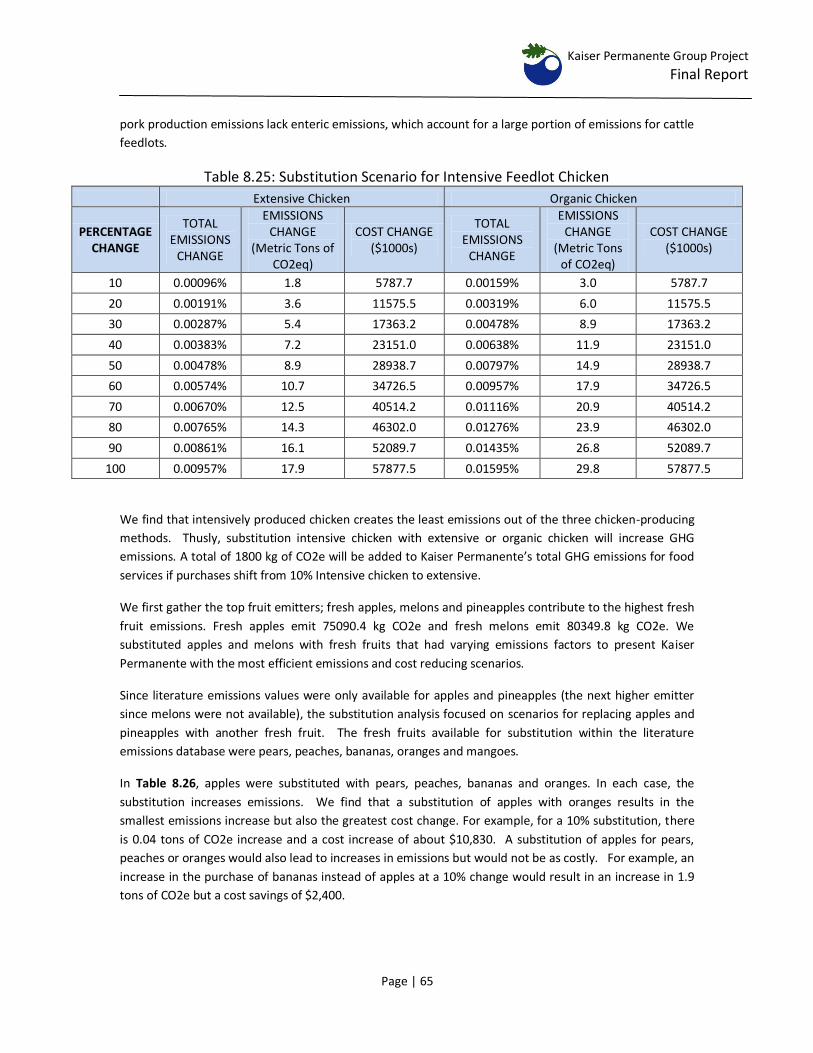
Kaiser Permanente Group Project
Final Report
Page | 65
pork production emissions lack enteric emissions, which account for a large portion of emissions for cattle
feedlots.
Table 8.25: Substitution Scenario for Intensive Feedlot Chicken
Extensive Chicken Organic Chicken
PERCENTAGE CHANGE
TOTAL EMISSIONS
CHANGE
EMISSIONS CHANGE
(Metric Tons of CO2eq)
COST CHANGE ($1000s)
TOTAL EMISSIONS
CHANGE
EMISSIONS CHANGE
(Metric Tons of CO2eq)
COST CHANGE ($1000s)
10 0.00096% 1.8 5787.7 0.00159% 3.0 5787.7
20 0.00191% 3.6 11575.5 0.00319% 6.0 11575.5
30 0.00287% 5.4 17363.2 0.00478% 8.9 17363.2
40 0.00383% 7.2 23151.0 0.00638% 11.9 23151.0
50 0.00478% 8.9 28938.7 0.00797% 14.9 28938.7
60 0.00574% 10.7 34726.5 0.00957% 17.9 34726.5
70 0.00670% 12.5 40514.2 0.01116% 20.9 40514.2
80 0.00765% 14.3 46302.0 0.01276% 23.9 46302.0
90 0.00861% 16.1 52089.7 0.01435% 26.8 52089.7
100 0.00957% 17.9 57877.5 0.01595% 29.8 57877.5
We find that intensively produced chicken creates the least emissions out of the three chicken-producing
methods. Thusly, substitution intensive chicken with extensive or organic chicken will increase GHG
emissions. A total of 1800 kg of CO2e will be added to Kaiser Permanente’s total GHG emissions for food
services if purchases shift from 10% Intensive chicken to extensive.
We first gather the top fruit emitters; fresh apples, melons and pineapples contribute to the highest fresh
fruit emissions. Fresh apples emit 75090.4 kg CO2e and fresh melons emit 80349.8 kg CO2e. We
substituted apples and melons with fresh fruits that had varying emissions factors to present Kaiser
Permanente with the most efficient emissions and cost reducing scenarios.
Since literature emissions values were only available for apples and pineapples (the next higher emitter
since melons were not available), the substitution analysis focused on scenarios for replacing apples and
pineapples with another fresh fruit. The fresh fruits available for substitution within the literature
emissions database were pears, peaches, bananas, oranges and mangoes.
In Table 8.26, apples were substituted with pears, peaches, bananas and oranges. In each case, the
substitution increases emissions. We find that a substitution of apples with oranges results in the
smallest emissions increase but also the greatest cost change. For example, for a 10% substitution, there
is 0.04 tons of CO2e increase and a cost increase of about $10,830. A substitution of apples for pears,
peaches or oranges would also lead to increases in emissions but would not be as costly. For example, an
increase in the purchase of bananas instead of apples at a 10% change would result in an increase in 1.9
tons of CO2e but a cost savings of $2,400.
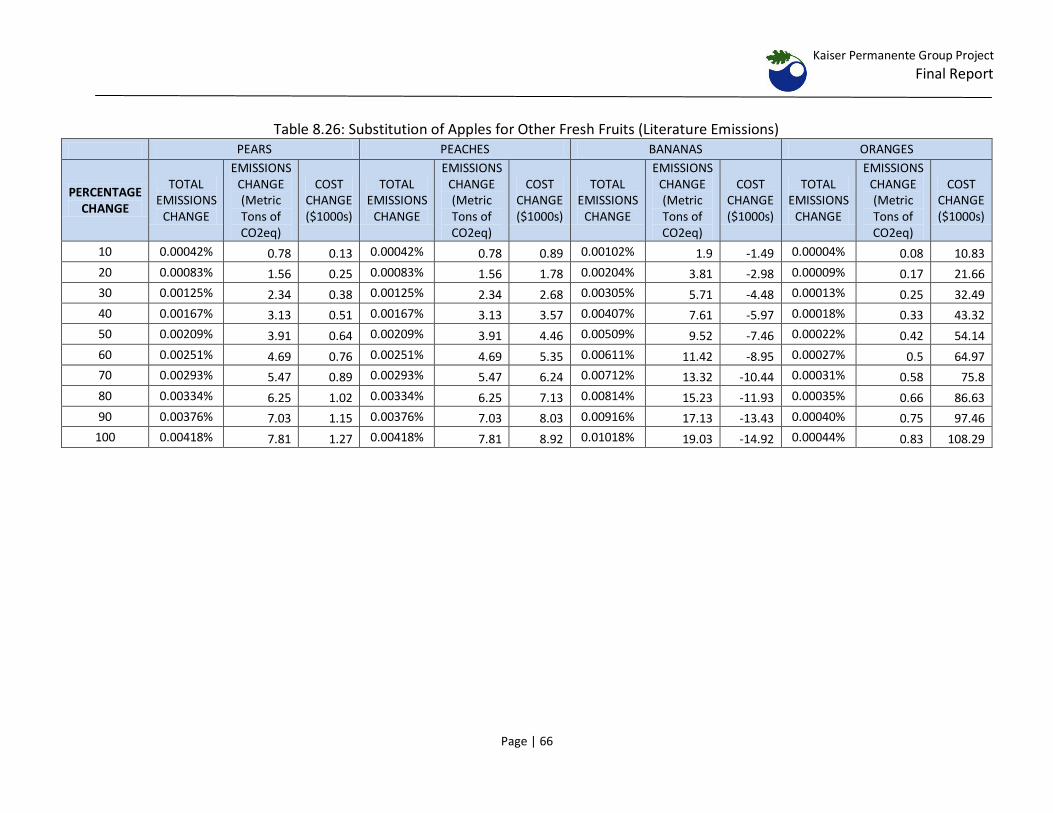
Kaiser Permanente Group Project
Final Report
Page | 66
Table 8.26: Substitution of Apples for Other Fresh Fruits (Literature Emissions)
PEARS PEACHES BANANAS ORANGES
PERCENTAGE CHANGE
TOTAL EMISSIONS
CHANGE
EMISSIONS CHANGE (Metric Tons of CO2eq)
COST CHANGE ($1000s)
TOTAL EMISSIONS
CHANGE
EMISSIONS CHANGE (Metric Tons of CO2eq)
COST CHANGE ($1000s)
TOTAL EMISSIONS
CHANGE
EMISSIONS CHANGE (Metric Tons of CO2eq)
COST CHANGE ($1000s)
TOTAL EMISSIONS
CHANGE
EMISSIONS CHANGE (Metric Tons of CO2eq)
COST CHANGE ($1000s)
10 0.00042% 0.78 0.13 0.00042% 0.78 0.89 0.00102% 1.9 -1.49 0.00004% 0.08 10.83
20 0.00083% 1.56 0.25 0.00083% 1.56 1.78 0.00204% 3.81 -2.98 0.00009% 0.17 21.66
30 0.00125% 2.34 0.38 0.00125% 2.34 2.68 0.00305% 5.71 -4.48 0.00013% 0.25 32.49
40 0.00167% 3.13 0.51 0.00167% 3.13 3.57 0.00407% 7.61 -5.97 0.00018% 0.33 43.32
50 0.00209% 3.91 0.64 0.00209% 3.91 4.46 0.00509% 9.52 -7.46 0.00022% 0.42 54.14
60 0.00251% 4.69 0.76 0.00251% 4.69 5.35 0.00611% 11.42 -8.95 0.00027% 0.5 64.97
70 0.00293% 5.47 0.89 0.00293% 5.47 6.24 0.00712% 13.32 -10.44 0.00031% 0.58 75.8
80 0.00334% 6.25 1.02 0.00334% 6.25 7.13 0.00814% 15.23 -11.93 0.00035% 0.66 86.63
90 0.00376% 7.03 1.15 0.00376% 7.03 8.03 0.00916% 17.13 -13.43 0.00040% 0.75 97.46
100 0.00418% 7.81 1.27 0.00418% 7.81 8.92 0.01018% 19.03 -14.92 0.00044% 0.83 108.29
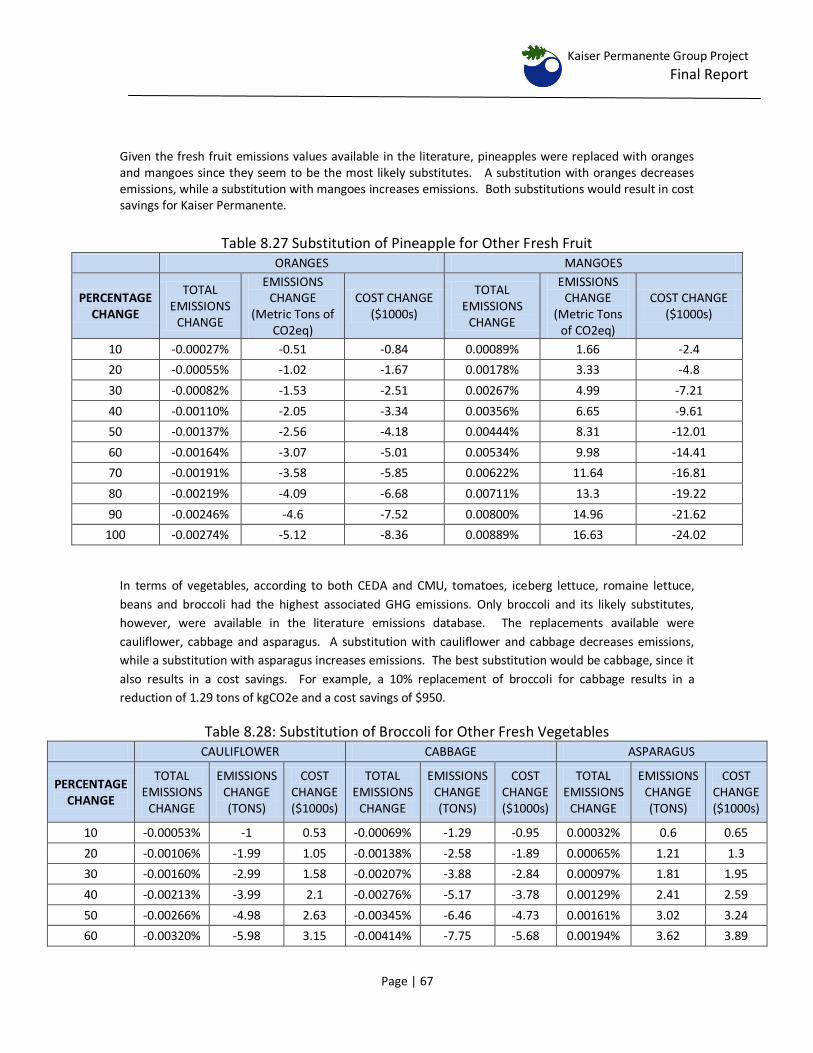
Kaiser Permanente Group Project
Final Report
Page | 67
Given the fresh fruit emissions values available in the literature, pineapples were replaced with oranges and mangoes since they seem to be the most likely substitutes. A substitution with oranges decreases emissions, while a substitution with mangoes increases emissions. Both substitutions would result in cost savings for Kaiser Permanente.
Table 8.27 Substitution of Pineapple for Other Fresh Fruit
ORANGES MANGOES
PERCENTAGE CHANGE
TOTAL EMISSIONS
CHANGE
EMISSIONS CHANGE
(Metric Tons of CO2eq)
COST CHANGE ($1000s)
TOTAL EMISSIONS
CHANGE
EMISSIONS CHANGE
(Metric Tons of CO2eq)
COST CHANGE ($1000s)
10 -0.00027% -0.51 -0.84 0.00089% 1.66 -2.4
20 -0.00055% -1.02 -1.67 0.00178% 3.33 -4.8
30 -0.00082% -1.53 -2.51 0.00267% 4.99 -7.21
40 -0.00110% -2.05 -3.34 0.00356% 6.65 -9.61
50 -0.00137% -2.56 -4.18 0.00444% 8.31 -12.01
60 -0.00164% -3.07 -5.01 0.00534% 9.98 -14.41
70 -0.00191% -3.58 -5.85 0.00622% 11.64 -16.81
80 -0.00219% -4.09 -6.68 0.00711% 13.3 -19.22
90 -0.00246% -4.6 -7.52 0.00800% 14.96 -21.62
100 -0.00274% -5.12 -8.36 0.00889% 16.63 -24.02
In terms of vegetables, according to both CEDA and CMU, tomatoes, iceberg lettuce, romaine lettuce,
beans and broccoli had the highest associated GHG emissions. Only broccoli and its likely substitutes,
however, were available in the literature emissions database. The replacements available were
cauliflower, cabbage and asparagus. A substitution with cauliflower and cabbage decreases emissions,
while a substitution with asparagus increases emissions. The best substitution would be cabbage, since it
also results in a cost savings. For example, a 10% replacement of broccoli for cabbage results in a
reduction of 1.29 tons of kgCO2e and a cost savings of $950.
Table 8.28: Substitution of Broccoli for Other Fresh Vegetables CAULIFLOWER CABBAGE ASPARAGUS
PERCENTAGE CHANGE
TOTAL EMISSIONS
CHANGE
EMISSIONS CHANGE (TONS)
COST CHANGE ($1000s)
TOTAL EMISSIONS
CHANGE
EMISSIONS CHANGE (TONS)
COST CHANGE ($1000s)
TOTAL EMISSIONS
CHANGE
EMISSIONS CHANGE (TONS)
COST CHANGE ($1000s)
10 -0.00053% -1 0.53 -0.00069% -1.29 -0.95 0.00032% 0.6 0.65
20 -0.00106% -1.99 1.05 -0.00138% -2.58 -1.89 0.00065% 1.21 1.3
30 -0.00160% -2.99 1.58 -0.00207% -3.88 -2.84 0.00097% 1.81 1.95
40 -0.00213% -3.99 2.1 -0.00276% -5.17 -3.78 0.00129% 2.41 2.59
50 -0.00266% -4.98 2.63 -0.00345% -6.46 -4.73 0.00161% 3.02 3.24
60 -0.00320% -5.98 3.15 -0.00414% -7.75 -5.68 0.00194% 3.62 3.89
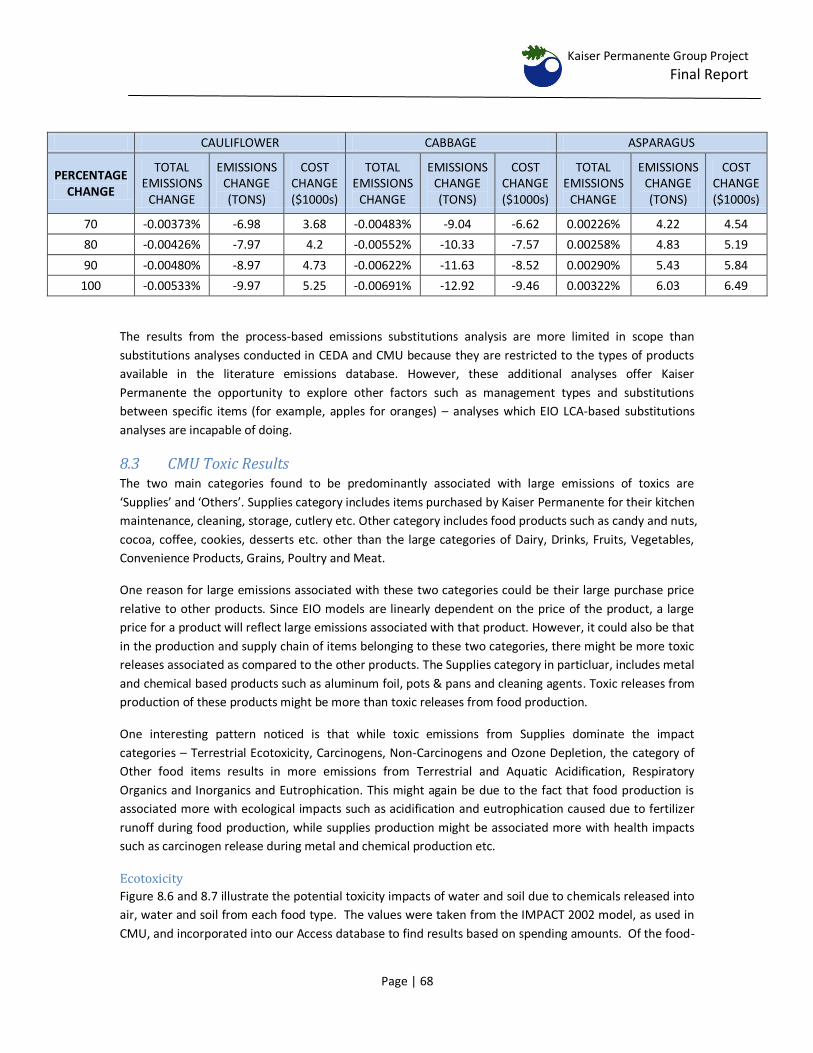
Kaiser Permanente Group Project
Final Report
Page | 68
CAULIFLOWER CABBAGE ASPARAGUS
PERCENTAGE CHANGE
TOTAL EMISSIONS
CHANGE
EMISSIONS CHANGE (TONS)
COST CHANGE ($1000s)
TOTAL EMISSIONS
CHANGE
EMISSIONS CHANGE (TONS)
COST CHANGE ($1000s)
TOTAL EMISSIONS
CHANGE
EMISSIONS CHANGE (TONS)
COST CHANGE ($1000s)
70 -0.00373% -6.98 3.68 -0.00483% -9.04 -6.62 0.00226% 4.22 4.54
80 -0.00426% -7.97 4.2 -0.00552% -10.33 -7.57 0.00258% 4.83 5.19
90 -0.00480% -8.97 4.73 -0.00622% -11.63 -8.52 0.00290% 5.43 5.84
100 -0.00533% -9.97 5.25 -0.00691% -12.92 -9.46 0.00322% 6.03 6.49
The results from the process-based emissions substitutions analysis are more limited in scope than
substitutions analyses conducted in CEDA and CMU because they are restricted to the types of products
available in the literature emissions database. However, these additional analyses offer Kaiser
Permanente the opportunity to explore other factors such as management types and substitutions
between specific items (for example, apples for oranges) – analyses which EIO LCA-based substitutions
analyses are incapable of doing.
8.3 CMU Toxic Results The two main categories found to be predominantly associated with large emissions of toxics are
‘Supplies’ and ‘Others’. Supplies category includes items purchased by Kaiser Permanente for their kitchen
maintenance, cleaning, storage, cutlery etc. Other category includes food products such as candy and nuts,
cocoa, coffee, cookies, desserts etc. other than the large categories of Dairy, Drinks, Fruits, Vegetables,
Convenience Products, Grains, Poultry and Meat.
One reason for large emissions associated with these two categories could be their large purchase price
relative to other products. Since EIO models are linearly dependent on the price of the product, a large
price for a product will reflect large emissions associated with that product. However, it could also be that
in the production and supply chain of items belonging to these two categories, there might be more toxic
releases associated as compared to the other products. The Supplies category in particluar, includes metal
and chemical based products such as aluminum foil, pots & pans and cleaning agents. Toxic releases from
production of these products might be more than toxic releases from food production.
One interesting pattern noticed is that while toxic emissions from Supplies dominate the impact
categories – Terrestrial Ecotoxicity, Carcinogens, Non-Carcinogens and Ozone Depletion, the category of
Other food items results in more emissions from Terrestrial and Aquatic Acidification, Respiratory
Organics and Inorganics and Eutrophication. This might again be due to the fact that food production is
associated more with ecological impacts such as acidification and eutrophication caused due to fertilizer
runoff during food production, while supplies production might be associated more with health impacts
such as carcinogen release during metal and chemical production etc.
Ecotoxicity
Figure 8.6 and 8.7 illustrate the potential toxicity impacts of water and soil due to chemicals released into
air, water and soil from each food type. The values were taken from the IMPACT 2002 model, as used in
CMU, and incorporated into our Access database to find results based on spending amounts. Of the food-
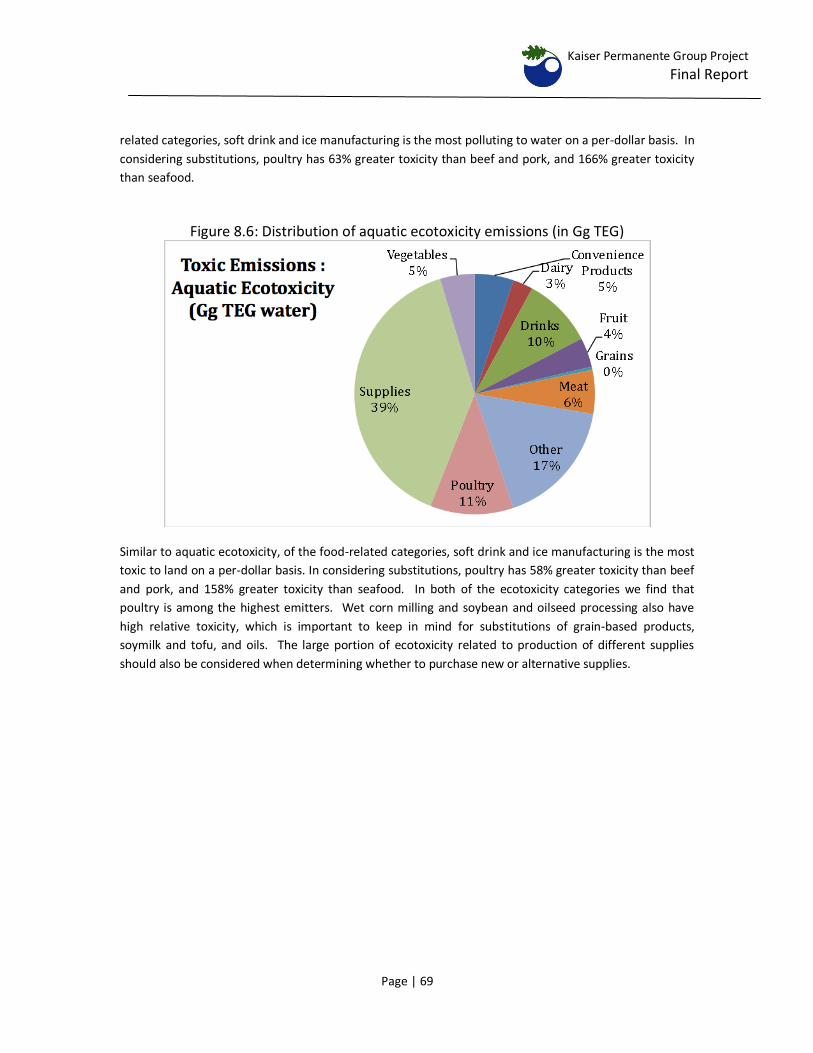
Kaiser Permanente Group Project
Final Report
Page | 69
related categories, soft drink and ice manufacturing is the most polluting to water on a per-dollar basis. In
considering substitutions, poultry has 63% greater toxicity than beef and pork, and 166% greater toxicity
than seafood.
Figure 8.6: Distribution of aquatic ecotoxicity emissions (in Gg TEG)
Similar to aquatic ecotoxicity, of the food-related categories, soft drink and ice manufacturing is the most
toxic to land on a per-dollar basis. In considering substitutions, poultry has 58% greater toxicity than beef
and pork, and 158% greater toxicity than seafood. In both of the ecotoxicity categories we find that
poultry is among the highest emitters. Wet corn milling and soybean and oilseed processing also have
high relative toxicity, which is important to keep in mind for substitutions of grain-based products,
soymilk and tofu, and oils. The large portion of ecotoxicity related to production of different supplies
should also be considered when determining whether to purchase new or alternative supplies.
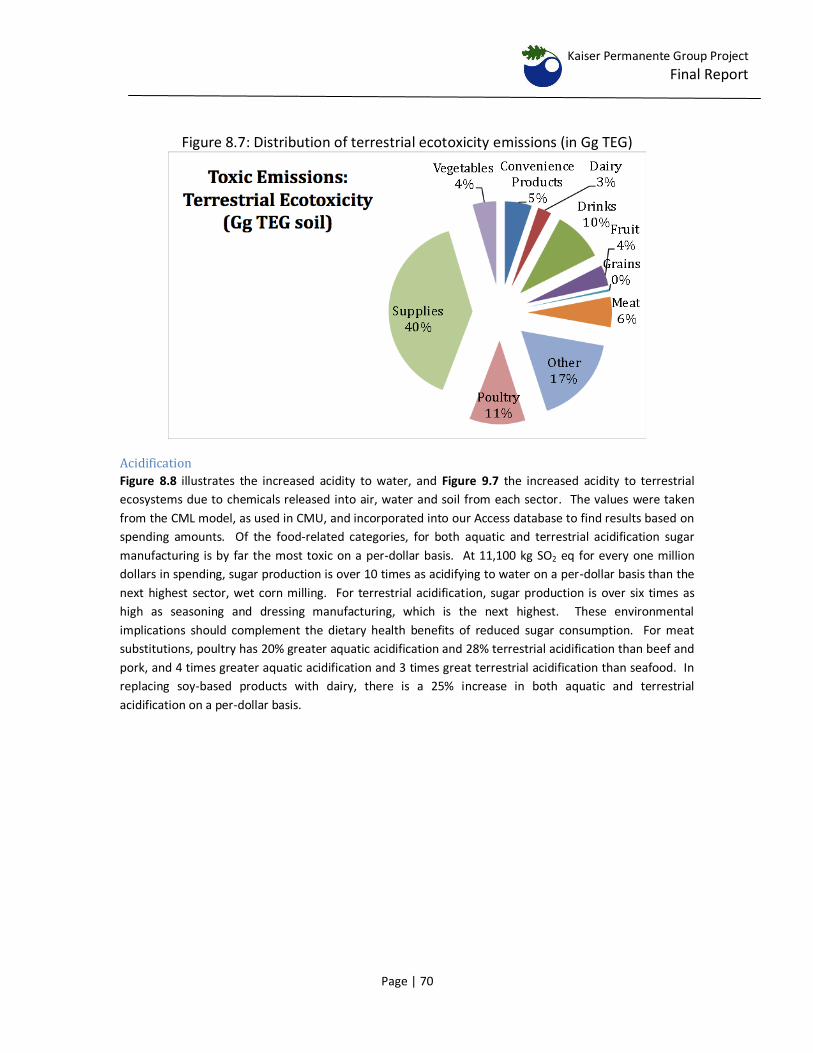
Kaiser Permanente Group Project
Final Report
Page | 70
Figure 8.7: Distribution of terrestrial ecotoxicity emissions (in Gg TEG)
Acidification
Figure 8.8 illustrates the increased acidity to water, and Figure 9.7 the increased acidity to terrestrial
ecosystems due to chemicals released into air, water and soil from each sector. The values were taken
from the CML model, as used in CMU, and incorporated into our Access database to find results based on
spending amounts. Of the food-related categories, for both aquatic and terrestrial acidification sugar
manufacturing is by far the most toxic on a per-dollar basis. At 11,100 kg SO2 eq for every one million
dollars in spending, sugar production is over 10 times as acidifying to water on a per-dollar basis than the
next highest sector, wet corn milling. For terrestrial acidification, sugar production is over six times as
high as seasoning and dressing manufacturing, which is the next highest. These environmental
implications should complement the dietary health benefits of reduced sugar consumption. For meat
substitutions, poultry has 20% greater aquatic acidification and 28% terrestrial acidification than beef and
pork, and 4 times greater aquatic acidification and 3 times great terrestrial acidification than seafood. In
replacing soy-based products with dairy, there is a 25% increase in both aquatic and terrestrial
acidification on a per-dollar basis.
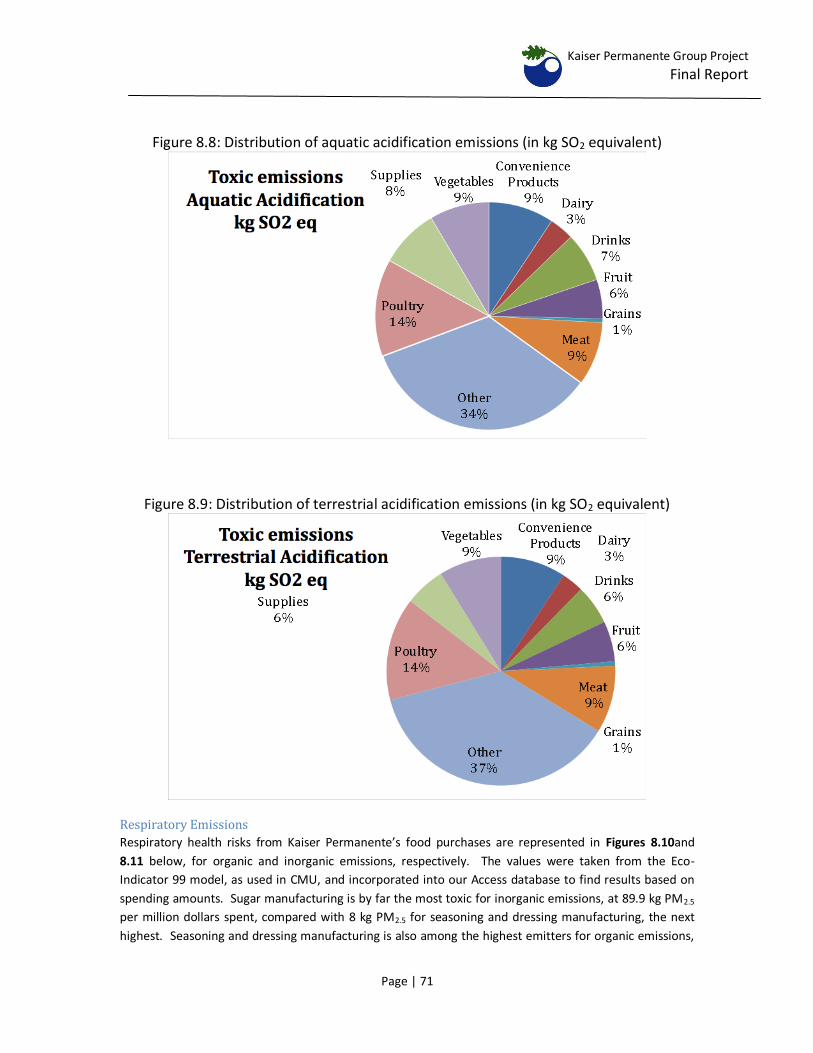
Kaiser Permanente Group Project
Final Report
Page | 71
Figure 8.8: Distribution of aquatic acidification emissions (in kg SO2 equivalent)
Figure 8.9: Distribution of terrestrial acidification emissions (in kg SO2 equivalent)
Respiratory Emissions
Respiratory health risks from Kaiser Permanente’s food purchases are represented in Figures 8.10and
8.11 below, for organic and inorganic emissions, respectively. The values were taken from the Eco-
Indicator 99 model, as used in CMU, and incorporated into our Access database to find results based on
spending amounts. Sugar manufacturing is by far the most toxic for inorganic emissions, at 89.9 kg PM2.5
per million dollars spent, compared with 8 kg PM2.5 for seasoning and dressing manufacturing, the next
highest. Seasoning and dressing manufacturing is also among the highest emitters for organic emissions,
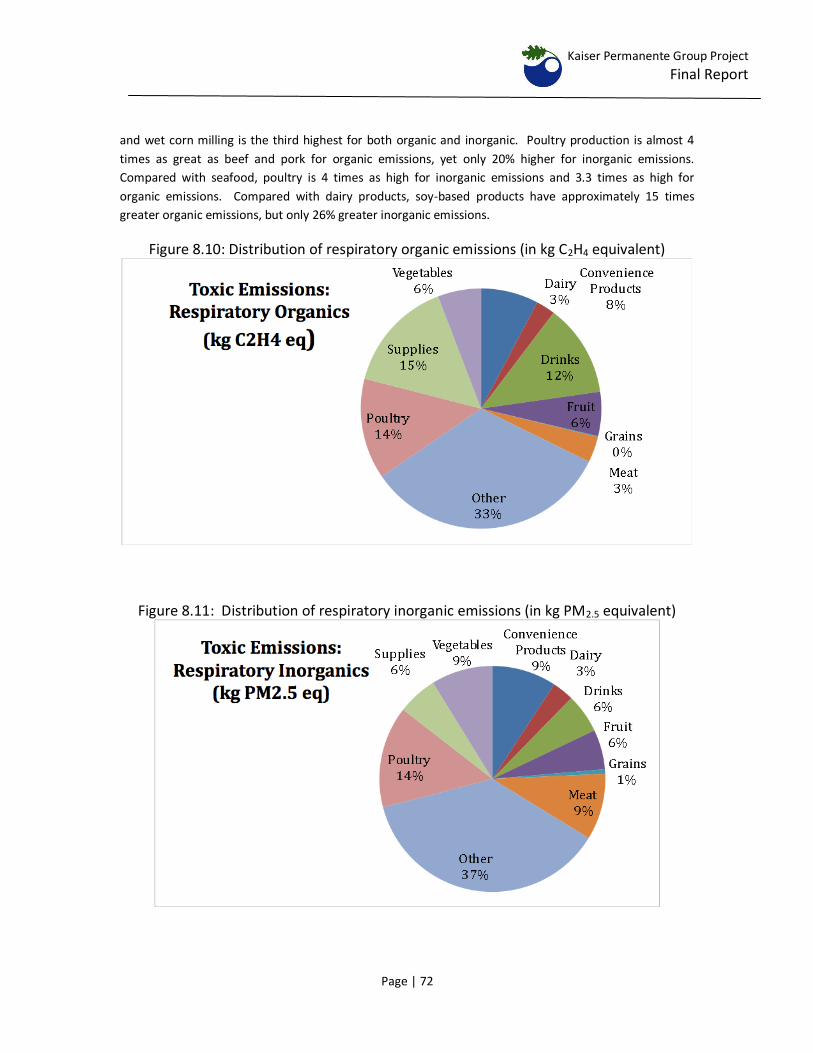
Kaiser Permanente Group Project
Final Report
Page | 72
and wet corn milling is the third highest for both organic and inorganic. Poultry production is almost 4
times as great as beef and pork for organic emissions, yet only 20% higher for inorganic emissions.
Compared with seafood, poultry is 4 times as high for inorganic emissions and 3.3 times as high for
organic emissions. Compared with dairy products, soy-based products have approximately 15 times
greater organic emissions, but only 26% greater inorganic emissions.
Figure 8.10: Distribution of respiratory organic emissions (in kg C2H4 equivalent)
Figure 8.11: Distribution of respiratory inorganic emissions (in kg PM2.5 equivalent)
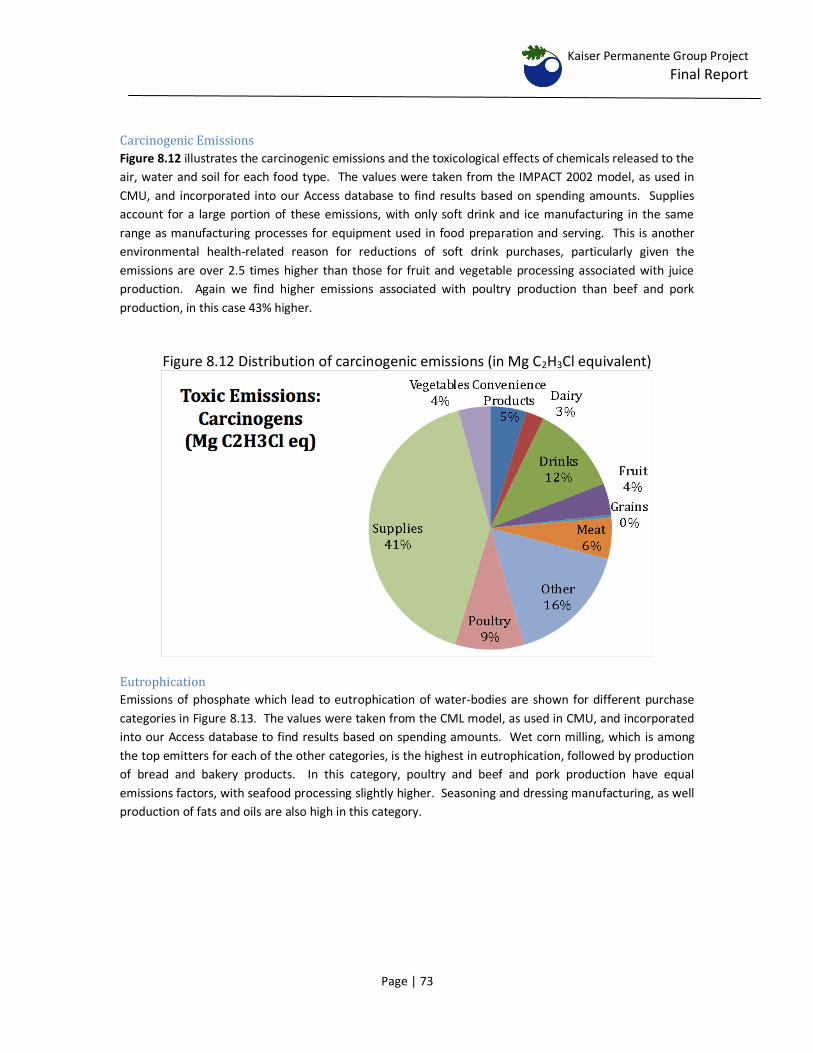
Kaiser Permanente Group Project
Final Report
Page | 73
Carcinogenic Emissions
Figure 8.12 illustrates the carcinogenic emissions and the toxicological effects of chemicals released to the
air, water and soil for each food type. The values were taken from the IMPACT 2002 model, as used in
CMU, and incorporated into our Access database to find results based on spending amounts. Supplies
account for a large portion of these emissions, with only soft drink and ice manufacturing in the same
range as manufacturing processes for equipment used in food preparation and serving. This is another
environmental health-related reason for reductions of soft drink purchases, particularly given the
emissions are over 2.5 times higher than those for fruit and vegetable processing associated with juice
production. Again we find higher emissions associated with poultry production than beef and pork
production, in this case 43% higher.
Figure 8.12 Distribution of carcinogenic emissions (in Mg C2H3Cl equivalent)
Eutrophication
Emissions of phosphate which lead to eutrophication of water-bodies are shown for different purchase
categories in Figure 8.13. The values were taken from the CML model, as used in CMU, and incorporated
into our Access database to find results based on spending amounts. Wet corn milling, which is among
the top emitters for each of the other categories, is the highest in eutrophication, followed by production
of bread and bakery products. In this category, poultry and beef and pork production have equal
emissions factors, with seafood processing slightly higher. Seasoning and dressing manufacturing, as well
production of fats and oils are also high in this category.
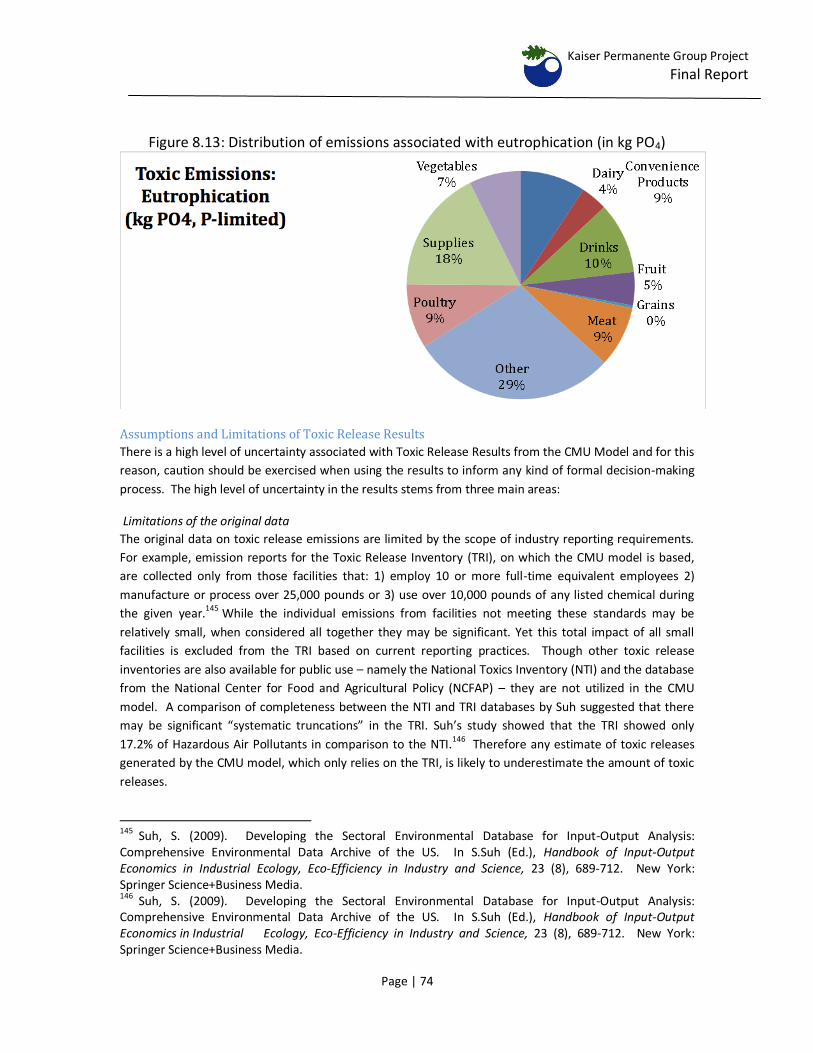
Kaiser Permanente Group Project
Final Report
Page | 74
Figure 8.13: Distribution of emissions associated with eutrophication (in kg PO4)
Assumptions and Limitations of Toxic Release Results
There is a high level of uncertainty associated with Toxic Release Results from the CMU Model and for this
reason, caution should be exercised when using the results to inform any kind of formal decision-making
process. The high level of uncertainty in the results stems from three main areas:
Limitations of the original data
The original data on toxic release emissions are limited by the scope of industry reporting requirements.
For example, emission reports for the Toxic Release Inventory (TRI), on which the CMU model is based,
are collected only from those facilities that: 1) employ 10 or more full-time equivalent employees 2)
manufacture or process over 25,000 pounds or 3) use over 10,000 pounds of any listed chemical during
the given year.145 While the individual emissions from facilities not meeting these standards may be
relatively small, when considered all together they may be significant. Yet this total impact of all small
facilities is excluded from the TRI based on current reporting practices. Though other toxic release
inventories are also available for public use – namely the National Toxics Inventory (NTI) and the database
from the National Center for Food and Agricultural Policy (NCFAP) – they are not utilized in the CMU
model. A comparison of completeness between the NTI and TRI databases by Suh suggested that there
may be significant “systematic truncations” in the TRI. Suh’s study showed that the TRI showed only
17.2% of Hazardous Air Pollutants in comparison to the NTI.146 Therefore any estimate of toxic releases
generated by the CMU model, which only relies on the TRI, is likely to underestimate the amount of toxic
releases.
145 Suh, S. (2009). Developing the Sectoral Environmental Database for Input-Output Analysis: Comprehensive Environmental Data Archive of the US. In S.Suh (Ed.), Handbook of Input-Output Economics in Industrial Ecology, Eco-Efficiency in Industry and Science, 23 (8), 689-712. New York: Springer Science+Business Media. 146
Suh, S. (2009). Developing the Sectoral Environmental Database for Input-Output Analysis: Comprehensive Environmental Data Archive of the US. In S.Suh (Ed.), Handbook of Input-Output Economics in Industrial Ecology, Eco-Efficiency in Industry and Science, 23 (8), 689-712. New York: Springer Science+Business Media.
Kaiser Permanente Group Project
Final Report
Page | 75
Lack of transparency in the CMU Model The CMU model gives toxic release results by classifying emissions into one of five major environmental
impact categories: ecotoxicity (aquatic and terrestrial), acidification (aquatic and terrestrial), respiratory
organics/inorganics, carcinogens and eutrophication(aquatic). Within each impact category,
characterization factors are applied to given emissions to produce indicator results in a common
equivalency.147 This equivalency is what allows different chemicals to be compared to each other in
regards to a certain environmental impact. For example, eutrophication results are given in kg PO4e,
meaning that they include other chemicals besides PO4 which have been characterized with PO4e used as
the common base (a more familiar comparison may be the use of CO2e to compare GHG emissions such
as methane, nitrous oxide and CFCs). Impact models, such as the one available from Leiden University’s
CML-IA database, typically provide these characterization factors.
Unfortunately, the impact models are used for the CMU Model are not readily specified in the public
version of the model or the Green Design Institute website. A thorough literature review on the
formulation of the EIO LCA model also did not result in any information on this topic. Without this
information, the full scope of the CMU toxicity results remains unknown. The user is essentially unable to
decipher which chemical compounds are accounted for and which are not, and this reduces the overall
strength and accountability of the results.
Limitations in Regard to Human Toxicity Another major limitation of the CMU model is its treatment of human toxicity. The model, which focuses
on toxic emissions to environmental media only, virtually neglects the effect of toxics on human welfare.
Direct exposure to agriculturally derived chemicals and pathogens has been shown to pose a significant
health risk to human life.148 Those who work on farms are at the highest risk, with studies showing that
exposure to pesticides is linked with Parkinson’s disease, and organophosphates result in biochemical
effects, as well as increased risk of leukemia and lymphoma .149 ,150 While acute pesticide intoxications in
workers are at “epidemic levels worldwide,” knowledge of these risks is relatively unknown because
incidence rates are difficult to determine and long-term effects have gone unmonitored.151 This is true
because the diversity of pesticides used make it difficult to attribute symptoms or diseases to particular
chemical exposures. Another occupational hazard that cannot be ignored is the mental health of
farmers: studies have shown high levels of stress, depression and anxiety, and that farmers have one of
147
Geyer, R. (2011). “Life Cycle Impact Assessment.” ESM 282, Industrial Ecology. Bren School of Environmental Science and Management, University of California, Santa Barbara. January 22, 2011. 148 Environmental Protection Agency (2011). Human Health Issues. Retrieved March 14, 2011 from http://www.epa.gov/pesticides/health/human.htm 149
Ascherio, A., Chen, H., Weisskopf, M.G., O’Reilly, E., McCullough, M.L., Calle, E.E., Schwarzchild, M.A., Thun, M.J. (2006). Pesticide Exposure and Risk for Parkinson’s Disease. Annals of Neurology: 60(2), 197-203. DOI: 10.1002/ana.20904 150 Lopez, O., Hernandez, A.F., Rodrigo, L., Gil, F., Pena, G., Serrano, J.L., Parron, T., Villanueva, E., and Pla, A. (2007). Changes in antioxidant enzymes in humans with long-term exposure to pesticides. Toxicology Letters: 171(3), 146-153. 151
Fenske, R.A., Lu C, Curl CL, Shirai JH, Kissel JC. (2005). Biologic monitoring to characterize organophosphorus pesticide exposure among children and workers: an analysis of recent studies in Washington State. Environmental Health Perspectives: 113(11), 1651-7.
Kaiser Permanente Group Project
Final Report
Page | 76
the highest rates of suicide of any industry.152,153,154 These factors all affect the health of the community
directly, and the sustainability of food production systems more generally.
The effect of toxics in food consumption, which are also impactful to human health, is likewise neglected
in the CMU model. For example, the nitrogen fertilizer used in production of many foods is not only a
primary source of N2O, it also is a cause of acute nitrate and nitrite toxicity. While the most commonly
known side effect of acute nitrate toxicity is methemoglobinemia in babies (“blue baby syndrome”), a
review by Rao & Puttanna found the following additional health problems:
Oral cancer, cancer of the colon, rectum or other gastrointestinal cancers, Alzheimer’s disease,
vascular dementia of Biswanger type or multiple small infarct type, absorptive and secretive
functional disorders of the intestinal mucosa and changes in maturation, differentiation and
apoptosis in intestinal crypts, reduced casein digestion, multiple sclerosis, neural tube defects,
cytogenetic effect in children, non-Hodkins’s lymphoma and hypertrophy of thyroid.155
High concentrations of nitrates lead to the formation of carcinogenic nitrosamines, which are capable of
both initiating and promoting the cancer process.156,157 In 1996, Havender and Coulombe tested roughly
300 nitrosamines for carcinogenicity in high-dose animal cancer tests, and found approximately 90% of
them to be carcinogenic.158 Nitrates are useful, however, in countering cardiovascular disease, reducing
platelet aggregation and preventing angina attacks.
While the effects of toxics on human welfare are clearly significant, in terms of occupational health
hazards and direct food consumption, the CMU model does not account for either of them, instead
focusing only on toxic emissions to soil, air and water. Therefore these toxic results cannot be used to
judge the impact of changing consumption or purchasing patterns on human health.
Due to these factors, the robustness of the CMU Toxic Release Results is not clear. They are intended to
serve as a supplement to the results generated for GHG emissions, not as a main point of research.
Ultimately the use of these results is not recommended for decision-making purposes. Rather, they
should be utilized to identify issues and as a means to distinguish potential future areas of research.
152
Booth, N.J, and Lloyd, K.L. (2000). Stress in Farmers. International Journal of Social Psychiatry: 46(1), 67-73. doi: 10.1177/002076400004600108 153
Eisner, C.S., Neal, R.D. and Scaife, B. Depression and anxiety in farmers. Primary Care Psychiatry: 4, 101–105. 154 Fraser, C.E. (2005). Farming and Mental Health Problems and Mental Illness. International Journal Social Psychiatry: 51(4), 340-349. Doi: 10.1177/0020764005060844 155 Rao, P. and Puttanna, K. (2000). Nitrates, Agriculture and Environment. Current Science: 79 (9), 1163-1168. 156 Bruning-Fann, C.S. and Kaneene, J.B. (1993). The effect of nitrite, nitrate, N-nitroso compounds on human health. Veterinary Human Toxicology: 35(3):237-53. 157
Vermeer, I.T., and vanMaanen, J.M. (2001). Nitrate exposure and the endogenous formation of carcinogenic nitrosamines in humans. Review of Environmental Health: 16(2), 105-16. 158 Havender, W. R. and Coulombe, R. (1996) Does Nature Know Best? Natural Carcinogens and Anticarcinogens in America's Food. New York, New York: American Council on Science and Health.
Kaiser Permanente Group Project
Final Report
Page | 77
9. Conclusions and Recommendations
9.1 Recommendations from Substitutions and Toxic Analysis Based on our substitutions analysis, possibly the greatest potential for emissions reductions comes from
cutting beef consumption. As an example scenario, if a 30% reduction in beef purchases were divided
evenly between substitutions with pork, poultry, and seafood (10% for each), the estimated reduction
would be approximately 430 tons. Out of these three substitutions, the switch to chicken would have the
greatest effect on both emissions and cost reduction, and it is therefore worthwhile to consider an even
larger substitution percentage. A 20% switch from beef to poultry would reduce emissions by almost 500
tons, and save $75,000. Based on the toxic emissions results, however, such a switch would be expected
to result in a larger overall impact on ecotoxicity and acidification in both terrestrial and aquatic
environments, as well as create larger respiratory health risks. Given these risks the source of poultry
products should be taken into account, utilizing sustainability metrics from SYSCO to buy from suppliers
known to encourage environmentally-friendly practices.
In the case of substitutions for juice beverages their seem to be clear emissions reductions possibilities in
switching to either carbonated beverages or tap water, and in this case the toxic emissions results help to
strengthen the case for a switch to tap water. Soft drink manufacturing has the largest toxicity factors for
carcinogenic emissions, as well as for ecotoxicity, whereas tap water is relatively neutral. Given that the
carbon footprint of the beverages group is so large, a shift to tap water can have large emissions
reductions overall—approximately 500 tons if half of all the juice is replaced. This would also have a
substantial cost-cutting benefit, estimated at nearly $450,000.
Also of interest in the beverage category is the possibility of replacing coffee with tea, which, although
they are derived from the same emissions factor, due to the lower cost of tea, could result in significant
emissions reductions and cost savings. With this lower cost, and given that these products both fall under
the same category for the toxicity data, we would find that there would also be toxicity reductions with
this substitution. Replacing soymilk with milk, on the other hand, we can separate out toxicity data, and
find that consistently soybean processing has a higher toxicity factor than milk manufacturing. In this case
the appropriateness of applying soymilk into the soybean processing category is somewhat of an issue,
and again the environmental health effects of this switch may come down to individual suppliers.
For most of the fruit and vegetable substitutions, whether based on our CEDA emissions factors or
process-based emissions factors, the emissions reductions were relatively low. Replacing frozen carrots
with canned carrots did show potential for reductions in the tens of tons at moderate substitution
percentages, but this is also an example of the difficulty in comparing qualitative aspects of these
products—the tastes of those who will be consuming these products must be taken into account. There
may be significant savings in both emissions and cost, but whether the change is realistic in a more
aesthetic sense is debatable. The analysis provided here serves as a guide for food purchasers, who have
years of experience in meeting the demands of these consumers.
In comparing fresh versus frozen versus canned items the capacity of the institutions that serve these
foods are also crucial. With supplies, which take into account the items required to get food to the
consumer, accounting up such a considerable portion of emissions, it would be expected that there may
be substantial costs associated with making shifts between items of the same type. Depending upon the
Kaiser Permanente Group Project
Final Report
Page | 78
electricity usage of refrigerators and freezers, a shift between products that utilize either of these will
cause a higher footprint, particularly when compared with canned foods, which would not. Going
forward there should be greater focus on how to incorporate the potential for kitchens to reduce the
emissions required to maintain food, as well as how substitutions of items may necessitate increased
carbon footprint from energy use.
Even after considering all the potential emissions reductions and resulting costs changes of the
substitution scenarios described above, there is the possibility that the overall effect of substitutions
would lead to increased emissions. Given this possibility it is worth mentioning the potential for Kaiser
Permanente to purchase carbon emissions offsets. Many companies already voluntarily purchase these
offsets as part of social corporate responsibility efforts, and this would potentially be an appropriate
course of action should food substitutions lead to higher emissions. This is also a relatively low-cost
option. In the market for offsets in the U.S., the Chicago Climate Exchange has, since its launch in 2003,
traded offsets at an average price of $3.26 per metric ton.159 At that price, the cost of offsetting all of the
emissions associated with purchases from Sysco would be approximately $61,000, or less than 1.3% of the
total purchase amount. It is worth considering whether this cost for emissions offsets would be a good
annual investment from Kaiser Permanente’s perspective, even with the great potential for emissions
reductions through food substitutions.
9.2 Limitations of the Models In recent years Kaiser Permanente has made a conscious effort to purchase more and more of its food
from local producers.160 The benefits of sourcing locally are environmental and social. They include a
higher level of freshness, particularly for produce; financial support of the local economy; and lowered
fossil fuel use due to reduced transportation, processing and packaging.161 While the study by Weber and
Matthews showed that GHG emissions from “food miles” are relatively small when considered in the
context of the entire food production system162
, purchasing more food locally is one way Kaiser
159 http://www.chicagoclimatex.com/about/pdf/10-21-10_CCX_Fact_Sheet.pdf 160 Kaiser Permanente (2008). Farmer’s Fill Kaiser Permanente’s Patient’s Plates. Retrieved March 14, 2011 from http://xnet.kp.org/newscenter/healthandfitness/2008/012908farmers.html 161
Pretty, Jules. Some Benefits and Drawbacks of Local Food Systems. Briefing Note for TVU/Sustain AgriFood Network, November 2, 2001. Retrieved March 15, 2011 from http://www.sustainweb.org/pdf/afn_m1_p2.pdf 162
Weber and Matthews found that “although food is transported long distances in general (1640 km delivery and 6760 km life-cycle supply chain on average)the GHG emissions associated with food are dominated by the production phase, contributing 83% of the average U.S.household’s 8.1 t CO2e/yr footprint for food consumption. Transportation as a whole represents only 11% of life-cycleGHG emissions, and final
delivery from producer to retail contributes only 4%.” They suggested that shifts in diet “can be a more effective
means of lowering an average household’s food-related climate footprint than ‘buying local.’ Shifting less than
one day per week’s worth of calories from red meat and dairy products to chicken, fish, eggs, or a vegetable-based
diet achieves more GHG reduction than buying all locally sourced food.”
Kaiser Permanente Group Project
Final Report
Page | 79
Permanente acts upon its desire to achieve greater sustainability in its food sector. The organization has
also expressed interest in examining the impacts of sourcing the organic versions of products, likewise
due to the positive aspects of organic production.163,164
Unfortunately, neither the process-based studies nor the EIO-LCA models utilized for this project are
capable of determining the impact purchasing locally or organically (or both) has on GHG emissions or
toxic releases. The majority of process-based studies used to determine GHG emissions for this project
were conducted outside of the US, mainly in Europe and Australia. The field of food LCAs in the US is not
as developed as elsewhere and thus LCA studies specific to US-specific production practices are simply not
available. For this reason, the literature emissions method outlined above cannot be used to indicate the
changes in GHG emissions from switching to purchasing local or organic food.
The ability of EIO-LCA models to gauge the effect of local and/or organic purchasing is also limited by
several factors inherent to the models. First, these types of models are based off of the division of
industry sectors as determined by the US Census Bureau, and some sectors may not be treated as
separate from other sectors of the same general type. Certain production practices, which may differ in
their level of sustainability, cannot be distinguished through an EIO-LCA model. For example, organic
agriculture –whether for fruit, vegetables, dairy or meat - is grouped into the same category as
conventional agriculture. In addition, EIO-LCA models, as mentioned previously, are based off of national
statistics and cannot account for regional, local or purchaser-specific location information. For example, in
California, 2,887 commercial farm operations maintain 708,330 acres of certified organic pasture and
cropland, which accounts for 14% of all organic cropland in the US.165 Since the majority of Kaiser
Permanente hospitals are located in California, the organization could potentially purchase more from
these local, organic operations instead of conventional ones (and in fact has already begun to do so).166
However, the EIO-LCA model would still be unable to recognize the changes, both because organic
agriculture is unrecognized as a unique sector and because the model has no way to discern the location
of the purchasing entity or the respective area’s economic statistics.
Source: Weber, C.L., Matthews, S.H. (2008).Food-Miles and the Relative Climate Impacts of Food Choices in the United States. Environmental Science & Technology 42 (10), 3508-3513. 163
Reed, K., Kaiser Permanente Sustainable Food Program Manager, personal communication, March 19, 2010. 164
The benefits of organic production include reduced exposure to toxics for humans; reduced fossil fuel energy use for the production of fertilizers, herbicides, pesticides and insecticides; reduced toxic runoff into environmental media; reduced GHG emission from volatilization in soils; and improved overall soil health. Source: Organic Trade Association (2010). Benefits of Organic. Retrieved March 15, 2011 from http://www.ota.com/organic/benefits.html 165 USDA Economic Research Service (2010). Organic Production. Table 3. Certified organic and total U.S. acreage, selected crops and livestock, 1995-2008. Retrieved March 14, 2011 from http://www.ers.usda.gov/Data/Organic/ 166
Kaiser Permanente purchased more than 60 tons of fresh, locally sourced produce in California for patient meals in 2007 alone. Source: Kaiser Permanente (2008). Farmer’s Fill Kaiser Permanente’s Patient’s Plates. Retrieved March 14, 2011 from http://xnet.kp.org/newscenter/healthandfitness/2008/012908farmers.html
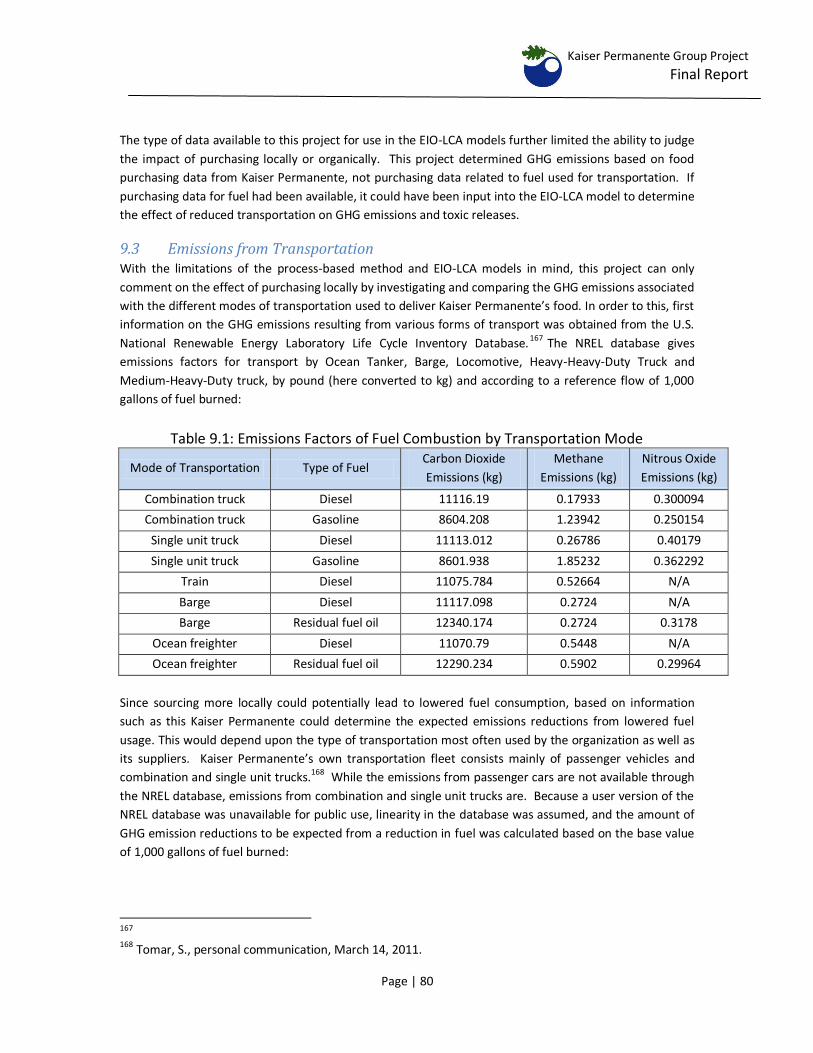
Kaiser Permanente Group Project
Final Report
Page | 80
The type of data available to this project for use in the EIO-LCA models further limited the ability to judge
the impact of purchasing locally or organically. This project determined GHG emissions based on food
purchasing data from Kaiser Permanente, not purchasing data related to fuel used for transportation. If
purchasing data for fuel had been available, it could have been input into the EIO-LCA model to determine
the effect of reduced transportation on GHG emissions and toxic releases.
9.3 Emissions from Transportation With the limitations of the process-based method and EIO-LCA models in mind, this project can only
comment on the effect of purchasing locally by investigating and comparing the GHG emissions associated
with the different modes of transportation used to deliver Kaiser Permanente’s food. In order to this, first
information on the GHG emissions resulting from various forms of transport was obtained from the U.S.
National Renewable Energy Laboratory Life Cycle Inventory Database.167 The NREL database gives
emissions factors for transport by Ocean Tanker, Barge, Locomotive, Heavy-Heavy-Duty Truck and
Medium-Heavy-Duty truck, by pound (here converted to kg) and according to a reference flow of 1,000
gallons of fuel burned:
Table 9.1: Emissions Factors of Fuel Combustion by Transportation Mode
Mode of Transportation Type of Fuel Carbon Dioxide
Emissions (kg)
Methane
Emissions (kg)
Nitrous Oxide
Emissions (kg)
Combination truck Diesel 11116.19 0.17933 0.300094
Combination truck Gasoline 8604.208 1.23942 0.250154
Single unit truck Diesel 11113.012 0.26786 0.40179
Single unit truck Gasoline 8601.938 1.85232 0.362292
Train Diesel 11075.784 0.52664 N/A
Barge Diesel 11117.098 0.2724 N/A
Barge Residual fuel oil 12340.174 0.2724 0.3178
Ocean freighter Diesel 11070.79 0.5448 N/A
Ocean freighter Residual fuel oil 12290.234 0.5902 0.29964
Since sourcing more locally could potentially lead to lowered fuel consumption, based on information
such as this Kaiser Permanente could determine the expected emissions reductions from lowered fuel
usage. This would depend upon the type of transportation most often used by the organization as well as
its suppliers. Kaiser Permanente’s own transportation fleet consists mainly of passenger vehicles and
combination and single unit trucks.168 While the emissions from passenger cars are not available through
the NREL database, emissions from combination and single unit trucks are. Because a user version of the
NREL database was unavailable for public use, linearity in the database was assumed, and the amount of
GHG emission reductions to be expected from a reduction in fuel was calculated based on the base value
of 1,000 gallons of fuel burned:
167 168 Tomar, S., personal communication, March 14, 2011.
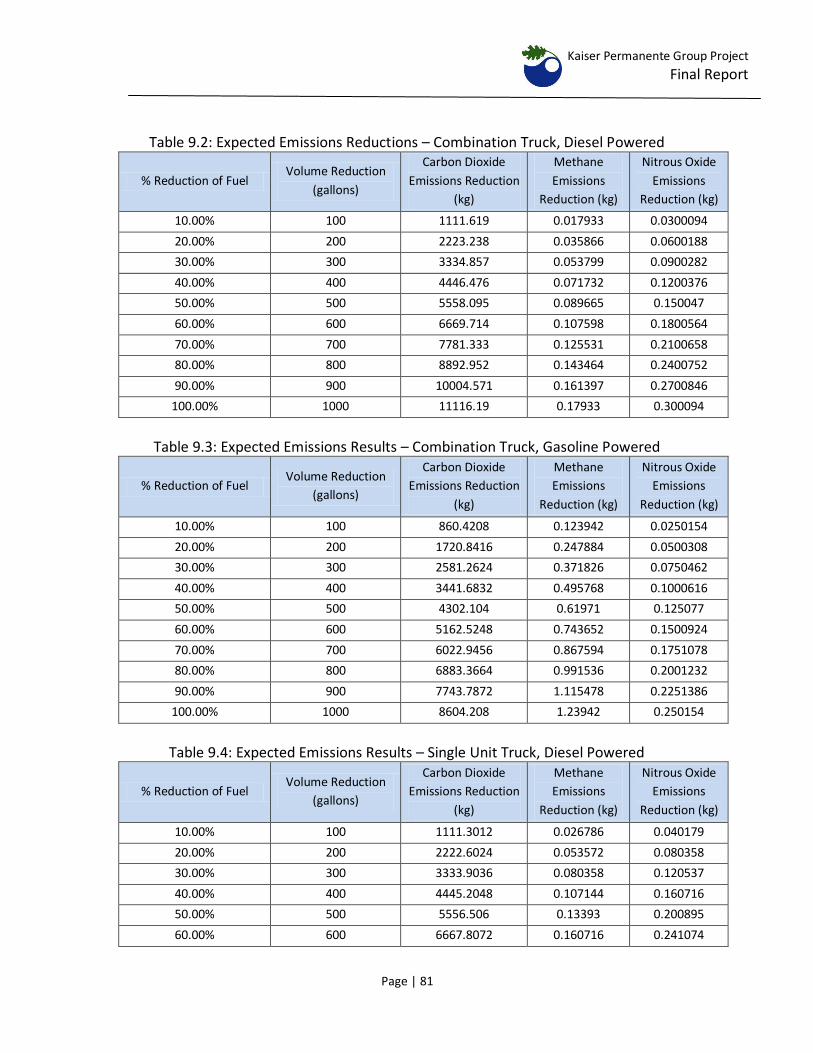
Kaiser Permanente Group Project
Final Report
Page | 81
Table 9.2: Expected Emissions Reductions – Combination Truck, Diesel Powered
% Reduction of Fuel Volume Reduction
(gallons)
Carbon Dioxide
Emissions Reduction
(kg)
Methane
Emissions
Reduction (kg)
Nitrous Oxide
Emissions
Reduction (kg)
10.00% 100 1111.619 0.017933 0.0300094
20.00% 200 2223.238 0.035866 0.0600188
30.00% 300 3334.857 0.053799 0.0900282
40.00% 400 4446.476 0.071732 0.1200376
50.00% 500 5558.095 0.089665 0.150047
60.00% 600 6669.714 0.107598 0.1800564
70.00% 700 7781.333 0.125531 0.2100658
80.00% 800 8892.952 0.143464 0.2400752
90.00% 900 10004.571 0.161397 0.2700846
100.00% 1000 11116.19 0.17933 0.300094
Table 9.3: Expected Emissions Results – Combination Truck, Gasoline Powered
% Reduction of Fuel Volume Reduction
(gallons)
Carbon Dioxide
Emissions Reduction
(kg)
Methane
Emissions
Reduction (kg)
Nitrous Oxide
Emissions
Reduction (kg)
10.00% 100 860.4208 0.123942 0.0250154
20.00% 200 1720.8416 0.247884 0.0500308
30.00% 300 2581.2624 0.371826 0.0750462
40.00% 400 3441.6832 0.495768 0.1000616
50.00% 500 4302.104 0.61971 0.125077
60.00% 600 5162.5248 0.743652 0.1500924
70.00% 700 6022.9456 0.867594 0.1751078
80.00% 800 6883.3664 0.991536 0.2001232
90.00% 900 7743.7872 1.115478 0.2251386
100.00% 1000 8604.208 1.23942 0.250154
Table 9.4: Expected Emissions Results – Single Unit Truck, Diesel Powered
% Reduction of Fuel Volume Reduction
(gallons)
Carbon Dioxide
Emissions Reduction
(kg)
Methane
Emissions
Reduction (kg)
Nitrous Oxide
Emissions
Reduction (kg)
10.00% 100 1111.3012 0.026786 0.040179
20.00% 200 2222.6024 0.053572 0.080358
30.00% 300 3333.9036 0.080358 0.120537
40.00% 400 4445.2048 0.107144 0.160716
50.00% 500 5556.506 0.13393 0.200895
60.00% 600 6667.8072 0.160716 0.241074
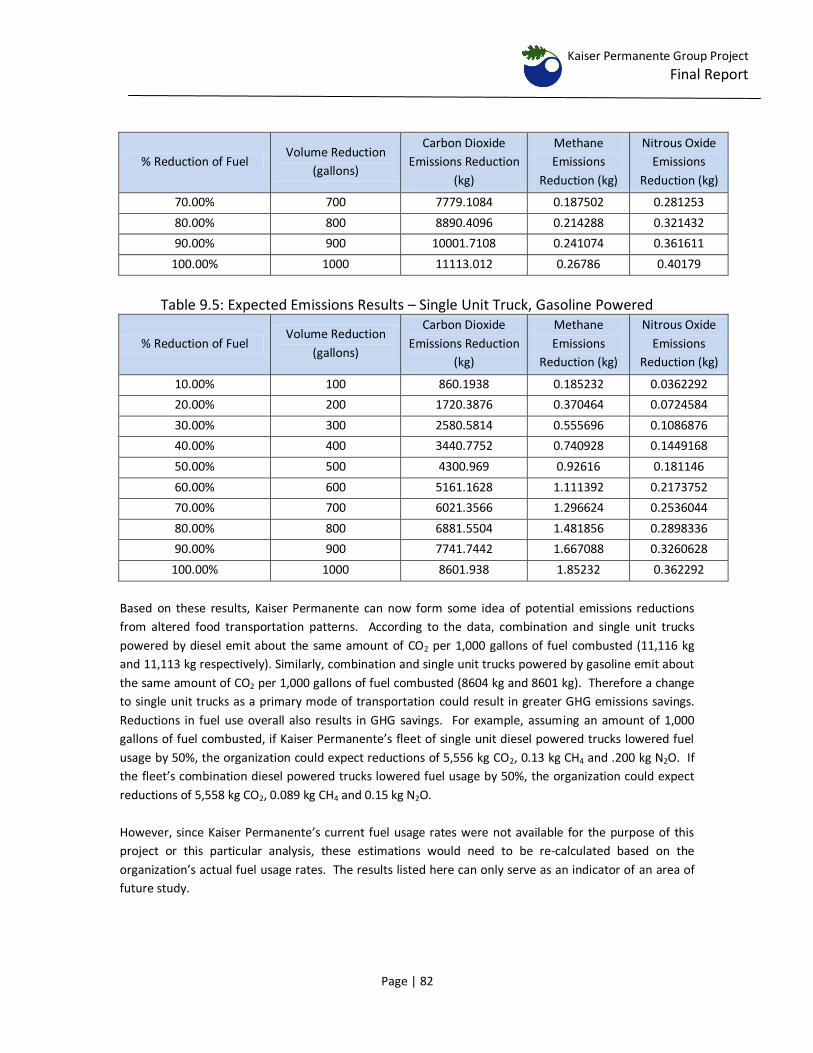
Kaiser Permanente Group Project
Final Report
Page | 82
% Reduction of Fuel Volume Reduction
(gallons)
Carbon Dioxide
Emissions Reduction
(kg)
Methane
Emissions
Reduction (kg)
Nitrous Oxide
Emissions
Reduction (kg)
70.00% 700 7779.1084 0.187502 0.281253
80.00% 800 8890.4096 0.214288 0.321432
90.00% 900 10001.7108 0.241074 0.361611
100.00% 1000 11113.012 0.26786 0.40179
Table 9.5: Expected Emissions Results – Single Unit Truck, Gasoline Powered
% Reduction of Fuel Volume Reduction
(gallons)
Carbon Dioxide
Emissions Reduction
(kg)
Methane
Emissions
Reduction (kg)
Nitrous Oxide
Emissions
Reduction (kg)
10.00% 100 860.1938 0.185232 0.0362292
20.00% 200 1720.3876 0.370464 0.0724584
30.00% 300 2580.5814 0.555696 0.1086876
40.00% 400 3440.7752 0.740928 0.1449168
50.00% 500 4300.969 0.92616 0.181146
60.00% 600 5161.1628 1.111392 0.2173752
70.00% 700 6021.3566 1.296624 0.2536044
80.00% 800 6881.5504 1.481856 0.2898336
90.00% 900 7741.7442 1.667088 0.3260628
100.00% 1000 8601.938 1.85232 0.362292
Based on these results, Kaiser Permanente can now form some idea of potential emissions reductions
from altered food transportation patterns. According to the data, combination and single unit trucks
powered by diesel emit about the same amount of CO2 per 1,000 gallons of fuel combusted (11,116 kg
and 11,113 kg respectively). Similarly, combination and single unit trucks powered by gasoline emit about
the same amount of CO2 per 1,000 gallons of fuel combusted (8604 kg and 8601 kg). Therefore a change
to single unit trucks as a primary mode of transportation could result in greater GHG emissions savings.
Reductions in fuel use overall also results in GHG savings. For example, assuming an amount of 1,000
gallons of fuel combusted, if Kaiser Permanente’s fleet of single unit diesel powered trucks lowered fuel
usage by 50%, the organization could expect reductions of 5,556 kg CO2, 0.13 kg CH4 and .200 kg N2O. If
the fleet’s combination diesel powered trucks lowered fuel usage by 50%, the organization could expect
reductions of 5,558 kg CO2, 0.089 kg CH4 and 0.15 kg N2O.
However, since Kaiser Permanente’s current fuel usage rates were not available for the purpose of this
project or this particular analysis, these estimations would need to be re-calculated based on the
organization’s actual fuel usage rates. The results listed here can only serve as an indicator of an area of
future study.

Kaiser Permanente Group Project
Final Report
Appendix A
Substitution Scenarios
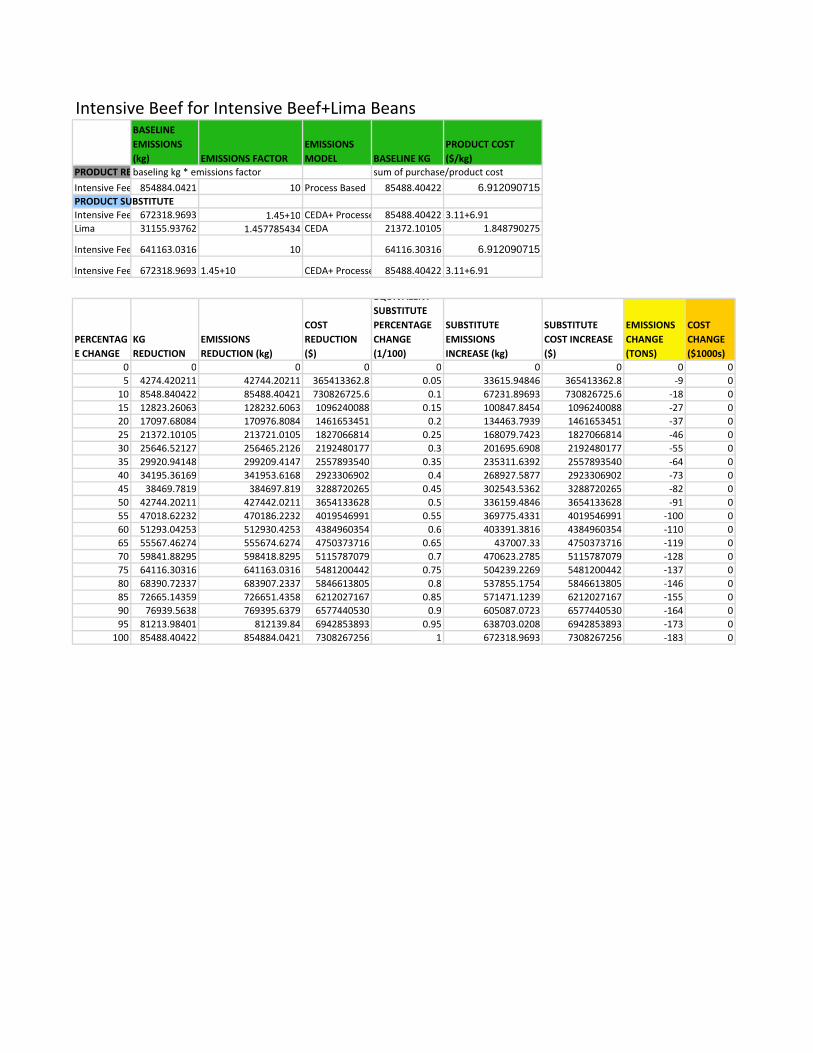
BASELINE EMISSIONS (kg) EMISSIONS FACTOR
EMISSIONS MODEL BASELINE KG
PRODUCT COST ($/kg)
PRODUCT REbaseling kg * emissions factor sum of purchase/product cost
Intensive Fee 854884.0421 10 Process Based 85488.40422 6.912090715PRODUCT SUBSTITUTEIntensive Fee 672318.9693 1.45+10 CEDA+ Processe 85488.40422 3.11+6.91Lima 31155.93762 1.457785434 CEDA 21372.10105 1.848790275
Intensive Fee 641163.0316 10 64116.30316 6.912090715
Intensive Fee 672318.9693 1.45+10 CEDA+ Processe 85488.40422 3.11+6.91
PERCENTAGE CHANGE
KG REDUCTION
EMISSIONS REDUCTION (kg)
COST REDUCTION ($)
EQUIVALENT SUBSTITUTE PERCENTAGE CHANGE (1/100)
SUBSTITUTE EMISSIONS INCREASE (kg)
SUBSTITUTE COST INCREASE ($)
EMISSIONS CHANGE (TONS)
COST CHANGE ($1000s)
0 0 0 0 0 0 0 0 05 4274.420211 42744.20211 365413362.8 0.05 33615.94846 365413362.8 ‐9 010 8548.840422 85488.40421 730826725.6 0.1 67231.89693 730826725.6 ‐18 015 12823.26063 128232.6063 1096240088 0.15 100847.8454 1096240088 ‐27 020 17097.68084 170976.8084 1461653451 0.2 134463.7939 1461653451 ‐37 025 21372.10105 213721.0105 1827066814 0.25 168079.7423 1827066814 ‐46 030 25646.52127 256465.2126 2192480177 0.3 201695.6908 2192480177 ‐55 035 29920.94148 299209.4147 2557893540 0.35 235311.6392 2557893540 ‐64 040 34195.36169 341953.6168 2923306902 0.4 268927.5877 2923306902 ‐73 045 38469.7819 384697.819 3288720265 0.45 302543.5362 3288720265 ‐82 050 42744.20211 427442.0211 3654133628 0.5 336159.4846 3654133628 ‐91 055 47018.62232 470186.2232 4019546991 0.55 369775.4331 4019546991 ‐100 060 51293.04253 512930.4253 4384960354 0.6 403391.3816 4384960354 ‐110 065 55567.46274 555674.6274 4750373716 0.65 437007.33 4750373716 ‐119 070 59841.88295 598418.8295 5115787079 0.7 470623.2785 5115787079 ‐128 075 64116.30316 641163.0316 5481200442 0.75 504239.2269 5481200442 ‐137 080 68390.72337 683907.2337 5846613805 0.8 537855.1754 5846613805 ‐146 085 72665.14359 726651.4358 6212027167 0.85 571471.1239 6212027167 ‐155 090 76939.5638 769395.6379 6577440530 0.9 605087.0723 6577440530 ‐164 095 81213.98401 812139.84 6942853893 0.95 638703.0208 6942853893 ‐173 0100 85488.40422 854884.0421 7308267256 1 672318.9693 7308267256 ‐183 0
Intensive Beef for Intensive Beef+Lima Beans
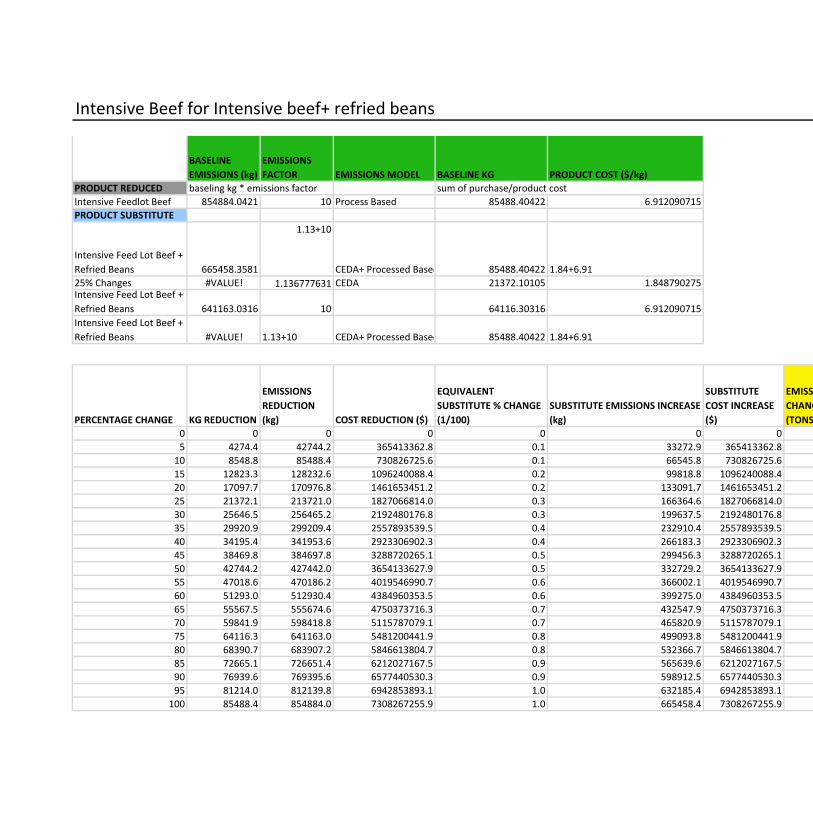
BASELINE EMISSIONS (kg)
EMISSIONS FACTOR EMISSIONS MODEL BASELINE KG PRODUCT COST ($/kg)
PRODUCT REDUCED baseling kg * emissions factor sum of purchase/product costIntensive Feedlot Beef 854884.0421 10 Process Based 85488.40422 6.912090715PRODUCT SUBSTITUTE
Intensive Feed Lot Beef + Refried Beans 665458.3581
1.13+10
CEDA+ Processed Based 85488.40422 1.84+6.9125% Changes #VALUE! 1.136777631 CEDA 21372.10105 1.848790275Intensive Feed Lot Beef + Refried Beans 641163.0316 10 64116.30316 6.912090715Intensive Feed Lot Beef + Refried Beans #VALUE! 1.13+10 CEDA+ Processed Based 85488.40422 1.84+6.91
PERCENTAGE CHANGE KG REDUCTION
EMISSIONS REDUCTION (kg) COST REDUCTION ($)
EQUIVALENT SUBSTITUTE % CHANGE (1/100)
SUBSTITUTE EMISSIONS INCREASE (kg)
SUBSTITUTE COST INCREASE ($)
EMISSIONS CHANGE (TONS)
COST CHANGE ($1000s)
0 0 0 0 0 0 0 0 05 4274.4 42744.2 365413362.8 0.1 33272.9 365413362.8 ‐9 010 8548.8 85488.4 730826725.6 0.1 66545.8 730826725.6 ‐19 015 12823.3 128232.6 1096240088.4 0.2 99818.8 1096240088.4 ‐28 020 17097.7 170976.8 1461653451.2 0.2 133091.7 1461653451.2 ‐38 025 21372.1 213721.0 1827066814.0 0.3 166364.6 1827066814.0 ‐47 030 25646.5 256465.2 2192480176.8 0.3 199637.5 2192480176.8 ‐57 035 29920.9 299209.4 2557893539.5 0.4 232910.4 2557893539.5 ‐66 040 34195.4 341953.6 2923306902.3 0.4 266183.3 2923306902.3 ‐76 045 38469.8 384697.8 3288720265.1 0.5 299456.3 3288720265.1 ‐85 050 42744.2 427442.0 3654133627.9 0.5 332729.2 3654133627.9 ‐95 055 47018.6 470186.2 4019546990.7 0.6 366002.1 4019546990.7 ‐104 060 51293.0 512930.4 4384960353.5 0.6 399275.0 4384960353.5 ‐114 065 55567.5 555674.6 4750373716.3 0.7 432547.9 4750373716.3 ‐123 070 59841.9 598418.8 5115787079.1 0.7 465820.9 5115787079.1 ‐133 075 64116.3 641163.0 5481200441.9 0.8 499093.8 5481200441.9 ‐142 080 68390.7 683907.2 5846613804.7 0.8 532366.7 5846613804.7 ‐152 085 72665.1 726651.4 6212027167.5 0.9 565639.6 6212027167.5 ‐161 090 76939.6 769395.6 6577440530.3 0.9 598912.5 6577440530.3 ‐170 095 81214.0 812139.8 6942853893.1 1.0 632185.4 6942853893.1 ‐180 0100 85488.4 854884.0 7308267255.9 1.0 665458.4 7308267255.9 ‐189 0
Intensive Beef for Intensive beef+ refried beans

0
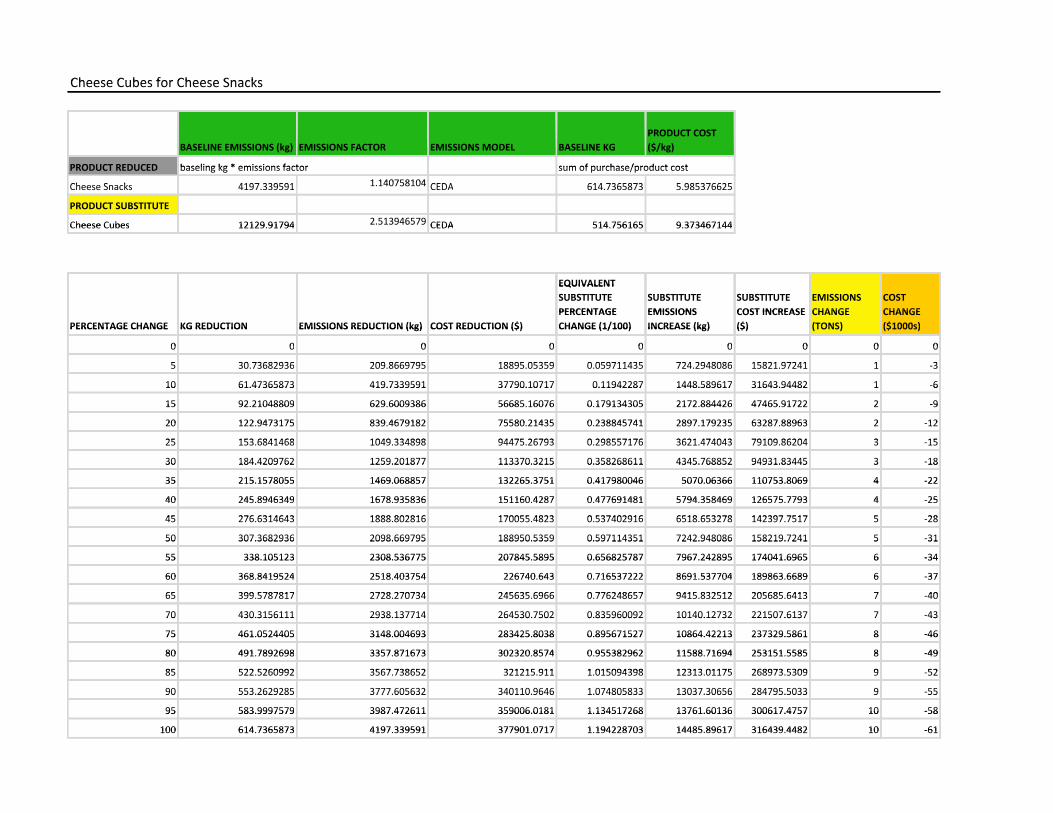
Cheese Cubes for Cheese SnacksCheese Cubes for Cheese Snacks
PRODUCT COSTPRODUCT COST BASELINE EMISSIONS (kg) EMISSIONS FACTOR EMISSIONS MODEL BASELINE KG ($/kg)BASELINE EMISSIONS (kg) EMISSIONS FACTOR EMISSIONS MODEL BASELINE KG ($/kg)
PRODUCT REDUCED baseling kg * emissions factor sum of purchase/product costPRODUCT REDUCED baseling kg * emissions factor sum of purchase/product cost
Ch S k 4197 339591 1 140758104 CEDA 614 7365873 5 985376625Cheese Snacks 4197.339591 1.140758104 CEDA 614.7365873 5.985376625
PRODUCT SUBSTITUTEPRODUCT SUBSTITUTE
2 513946579Cheese Cubes 12129 91794 2.513946579 CEDA 514 756165 9 373467144Cheese Cubes 12129.91794 2.513946579 CEDA 514.756165 9.373467144
EQUIVALENT EQUIVALENT SUBSTITUTE SUBSTITUTE SUBSTITUTE EMISSIONS COSTSUBSTITUTE SUBSTITUTE SUBSTITUTE EMISSIONS COST PERCENTAGE EMISSIONS COST INCREASE CHANGE CHANGEPERCENTAGE EMISSIONS COST INCREASE CHANGE CHANGE
PERCENTAGE CHANGE KG REDUCTION EMISSIONS REDUCTION (kg) COST REDUCTION ($) CHANGE (1/100) INCREASE (kg) ($) (TONS) ($1000s)PERCENTAGE CHANGE KG REDUCTION EMISSIONS REDUCTION (kg) COST REDUCTION ($) CHANGE (1/100) INCREASE (kg) ($) (TONS) ($1000s)
0 0 0 0 0 0 0 0 00 0 0 0 0 0 0 0 0
5 30 73682936 209 8669795 18895 05359 0 059711435 724 2948086 15821 97241 1 35 30.73682936 209.8669795 18895.05359 0.059711435 724.2948086 15821.97241 1 ‐3
10 61.47365873 419.7339591 37790.10717 0.11942287 1448.589617 31643.94482 1 ‐610 61.47365873 419.7339591 37790.10717 0.11942287 1448.589617 31643.94482 1 6
15 92.21048809 629.6009386 56685.16076 0.179134305 2172.884426 47465.91722 2 ‐915 92.21048809 629.6009386 56685.16076 0.179134305 2172.884426 47465.91722 2 ‐9
20 122 9473175 839 4679182 75580 21435 0 238845741 2897 179235 63287 88963 2 ‐1220 122.9473175 839.4679182 75580.21435 0.238845741 2897.179235 63287.88963 2 ‐12
25 153 6841468 1049 334898 94475 26793 0 298557176 3621 474043 79109 86204 3 1525 153.6841468 1049.334898 94475.26793 0.298557176 3621.474043 79109.86204 3 ‐15
30 184.4209762 1259.201877 113370.3215 0.358268611 4345.768852 94931.83445 3 ‐1830 184.4209762 1259.201877 113370.3215 0.358268611 4345.768852 94931.83445 3 18
35 215.1578055 1469.068857 132265.3751 0.417980046 5070.06366 110753.8069 4 ‐2235 215.1578055 1469.068857 132265.3751 0.417980046 5070.06366 110753.8069 4 ‐22
40 245 8946349 1678 935836 151160 4287 0 477691481 5794 358469 126575 7793 4 ‐2540 245.8946349 1678.935836 151160.4287 0.477691481 5794.358469 126575.7793 4 ‐25
45 276 6314643 1888 802816 170055 4823 0 537402916 6518 653278 142397 7517 5 2845 276.6314643 1888.802816 170055.4823 0.537402916 6518.653278 142397.7517 5 ‐28
50 307 3682936 2098 669795 188950 5359 0 597114351 7242 948086 158219 7241 5 3150 307.3682936 2098.669795 188950.5359 0.597114351 7242.948086 158219.7241 5 ‐3150 307.3682936 2098.669795 188950.5359 0.597114351 7242.948086 158219.7241 5 31
55 338.105123 2308.536775 207845.5895 0.656825787 7967.242895 174041.6965 6 ‐3455 338.105123 2308.536775 207845.5895 0.656825787 7967.242895 174041.6965 6 ‐34
60 368 8419524 2518 403754 226740 643 0 716537222 8691 537704 189863 6689 6 ‐3760 368.8419524 2518.403754 226740.643 0.716537222 8691.537704 189863.6689 6 ‐37
65 399 5787817 2728 270734 245635 6966 0 776248657 9415 832512 205685 6413 7 4065 399.5787817 2728.270734 245635.6966 0.776248657 9415.832512 205685.6413 7 ‐40
70 430 3156111 2938 137714 264530 7502 0 835960092 10140 12732 221507 6137 7 4370 430.3156111 2938.137714 264530.7502 0.835960092 10140.12732 221507.6137 7 ‐4370 430.3156111 2938.137714 264530.7502 0.835960092 10140.12732 221507.6137 7 43
75 461.0524405 3148.004693 283425.8038 0.895671527 10864.42213 237329.5861 8 ‐4675 461.0524405 3148.004693 283425.8038 0.895671527 10864.42213 237329.5861 8 ‐46
80 491 7892698 3357 871673 302320 8574 0 955382962 11588 71694 253151 5585 8 ‐4980 491.7892698 3357.871673 302320.8574 0.955382962 11588.71694 253151.5585 8 ‐49
85 522 5260992 3567 738652 321215 911 1 015094398 12313 01175 268973 5309 9 5285 522.5260992 3567.738652 321215.911 1.015094398 12313.01175 268973.5309 9 ‐52
90 553 2629285 3777 605632 340110 9646 1 074805833 13037 30656 284795 5033 9 5590 553.2629285 3777.605632 340110.9646 1.074805833 13037.30656 284795.5033 9 ‐5590 553.2629285 3777.605632 340110.9646 1.074805833 13037.30656 284795.5033 9 55
95 583.9997579 3987.472611 359006.0181 1.134517268 13761.60136 300617.4757 10 ‐5895 583.9997579 3987.472611 359006.0181 1.134517268 13761.60136 300617.4757 10 ‐58
100 614 7365873 4197 339591 377901 0717 1 194228703 14485 89617 316439 4482 10 ‐61100 614.7365873 4197.339591 377901.0717 1.194228703 14485.89617 316439.4482 10 ‐61
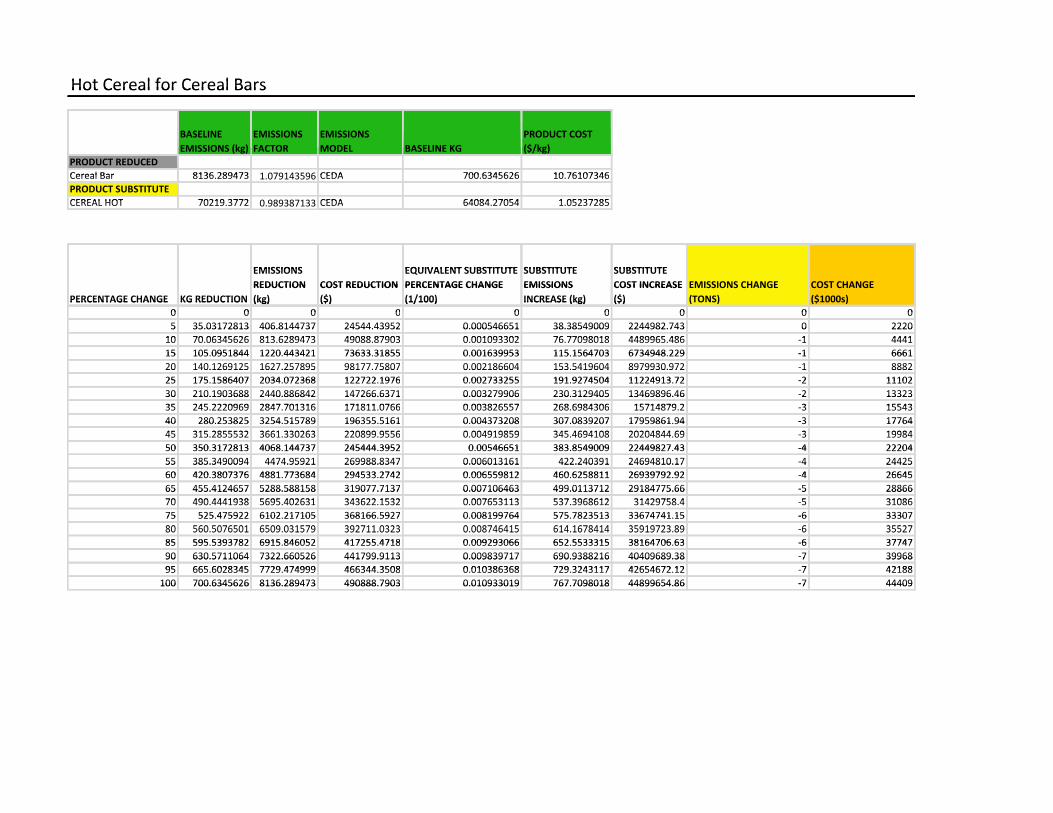
Hot Cereal for Cereal BarsHot Cereal for Cereal BarsHot Cereal for Cereal Bars
BASELINE EMISSIONS EMISSIONS PRODUCT COSTBASELINE EMISSIONS EMISSIONS PRODUCT COST EMISSIONS (kg) FACTOR MODEL BASELINE KG ($/kg)EMISSIONS (kg) FACTOR MODEL BASELINE KG ($/kg)
PRODUCT REDUCEDPRODUCT REDUCEDPRODUCT REDUCEDCereal Bar 8136 289473 1 079143596 CEDA 700 6345626 10 76107346Cereal Bar 8136.289473 1.079143596 CEDA 700.6345626 10.76107346PRODUCT SUBSTITUTEPRODUCT SUBSTITUTECEREAL HOT 70219 3772 0 989387133 CEDA 64084 27054 1 05237285CEREAL HOT 70219.3772 0.989387133 CEDA 64084.27054 1.05237285
EMISSIONS EQUIVALENT SUBSTITUTE SUBSTITUTE SUBSTITUTEEMISSIONS EQUIVALENT SUBSTITUTE SUBSTITUTE SUBSTITUTE REDUCTION COST REDUCTION PERCENTAGE CHANGE EMISSIONS COST INCREASE EMISSIONS CHANGE COST CHANGEREDUCTION (k )
COST REDUCTION ($)
PERCENTAGE CHANGE ( / )
EMISSIONS (k )
COST INCREASE ($)
EMISSIONS CHANGE ( )
COST CHANGE ($ )PERCENTAGE CHANGE KG REDUCTION (kg) ($) (1/100) INCREASE (kg) ($) (TONS) ($1000s)PERCENTAGE CHANGE KG REDUCTION (kg) ($) (1/100) INCREASE (kg) ($) (TONS) ($1000s)
0 0 0 0 0 0 0 0 00 0 0 0 0 0 0 0 05 35.03172813 406.8144737 24544.43952 0.000546651 38.38549009 2244982.743 0 22205 35.03172813 406.8144737 24544.43952 0.000546651 38.38549009 2244982.743 0 222010 70 06345626 813 6289473 49088 87903 0 001093302 76 77098018 4489965 486 1 444110 70.06345626 813.6289473 49088.87903 0.001093302 76.77098018 4489965.486 ‐1 444115 105 0951844 1220 443421 73633 31855 0 001639953 115 1564703 6734948 229 ‐1 666115 105.0951844 1220.443421 73633.31855 0.001639953 115.1564703 6734948.229 ‐1 666120 140 1269125 1627 257895 98177 75807 0 002186604 153 5419604 8979930 972 1 888220 140.1269125 1627.257895 98177.75807 0.002186604 153.5419604 8979930.972 ‐1 888220 140.1269125 1627.257895 98177.75807 0.002186604 153.5419604 8979930.972 1 888225 175 1586407 2034 072368 122722 1976 0 002733255 191 9274504 11224913 72 ‐2 1110225 175.1586407 2034.072368 122722.1976 0.002733255 191.9274504 11224913.72 ‐2 1110230 210.1903688 2440.886842 147266.6371 0.003279906 230.3129405 13469896.46 ‐2 1332330 210.1903688 2440.886842 147266.6371 0.003279906 230.3129405 13469896.46 2 1332335 245 2220969 2847 701316 171811 0766 0 003826557 268 6984306 15714879 2 3 1554335 245.2220969 2847.701316 171811.0766 0.003826557 268.6984306 15714879.2 ‐3 1554340 280.253825 3254.515789 196355.5161 0.004373208 307.0839207 17959861.94 ‐3 1776440 280.253825 3254.515789 196355.5161 0.004373208 307.0839207 17959861.94 ‐3 1776445 315 2855532 3661 330263 220899 9556 0 004919859 345 4694108 20204844 69 3 1998445 315.2855532 3661.330263 220899.9556 0.004919859 345.4694108 20204844.69 ‐3 1998450 350 3172813 4068 144737 245444 3952 0 00546651 383 8549009 22449827 43 ‐4 2220450 350.3172813 4068.144737 245444.3952 0.00546651 383.8549009 22449827.43 ‐4 2220455 385.3490094 4474.95921 269988.8347 0.006013161 422.240391 24694810.17 ‐4 2442555 385.3490094 4474.95921 269988.8347 0.006013161 422.240391 24694810.17 4 2442560 420 3807376 4881 773684 294533 2742 0 006559812 460 6258811 26939792 92 4 2664560 420.3807376 4881.773684 294533.2742 0.006559812 460.6258811 26939792.92 ‐4 2664565 455.4124657 5288.588158 319077.7137 0.007106463 499.0113712 29184775.66 ‐5 2886665 455.4124657 5288.588158 319077.7137 0.007106463 499.0113712 29184775.66 ‐5 2886670 490 4441938 5695 402631 343622 1532 0 007653113 537 3968612 31429758 4 5 3108670 490.4441938 5695.402631 343622.1532 0.007653113 537.3968612 31429758.4 ‐5 3108675 525.475922 6102.217105 368166.5927 0.008199764 575.7823513 33674741.15 ‐6 3330775 525.475922 6102.217105 368166.5927 0.008199764 575.7823513 33674741.15 ‐6 3330780 560 5076501 6509 031579 392711 0323 0 008746415 614 1678414 35919723 89 6 3552780 560.5076501 6509.031579 392711.0323 0.008746415 614.1678414 35919723.89 ‐6 3552780 560.5076501 6509.031579 392711.0323 0.008746415 614.1678414 35919723.89 6 3552785 595 5393782 6915 846052 417255 4718 0 009293066 652 5533315 38164706 63 ‐6 3774785 595.5393782 6915.846052 417255.4718 0.009293066 652.5533315 38164706.63 ‐6 3774790 630.5711064 7322.660526 441799.9113 0.009839717 690.9388216 40409689.38 ‐7 3996890 630.5711064 7322.660526 441799.9113 0.009839717 690.9388216 40409689.38 7 3996895 665 6028345 7729 474999 466344 3508 0 010386368 729 3243117 42654672 12 7 4218895 665.6028345 7729.474999 466344.3508 0.010386368 729.3243117 42654672.12 ‐7 42188100 700.6345626 8136.289473 490888.7903 0.010933019 767.7098018 44899654.86 ‐7 44409100 700.6345626 8136.289473 490888.7903 0.010933019 767.7098018 44899654.86 ‐7 44409
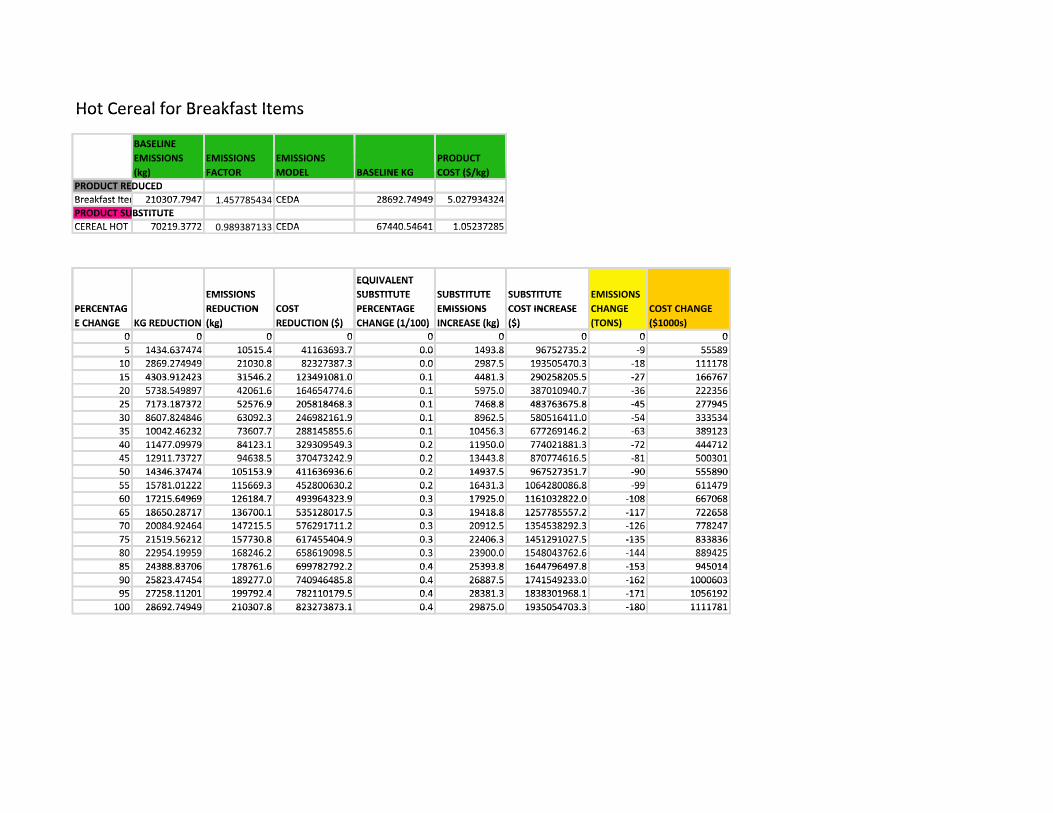
Hot Cereal for Breakfast ItemsHot Cereal for Breakfast ItemsHot Cereal for Breakfast Items
BASELINE BASELINE EMISSIONS EMISSIONS EMISSIONS PRODUCTEMISSIONS EMISSIONS EMISSIONS PRODUCT (kg) FACTOR MODEL BASELINE KG COST ($/kg)(kg) FACTOR MODEL BASELINE KG COST ($/kg)
PRODUCT REDUCEDPRODUCT REDUCEDPRODUCT REDUCEDBreakfast Item 210307 7947 1 457785434 CEDA 28692 74949 5 027934324Breakfast Item 210307.7947 1.457785434 CEDA 28692.74949 5.027934324PRODUCT SUBSTITUTEPRODUCT SUBSTITUTECEREAL HOT 70219 3772 0 989387133 CEDA 67440 54641 1 05237285CEREAL HOT 70219.3772 0.989387133 CEDA 67440.54641 1.05237285
QEQUIVALENT EMISSIONS
EQUIVALENT SUBSTITUTE SUBSTITUTE SUBSTITUTE EMISSIONSEMISSIONS SUBSTITUTE SUBSTITUTE SUBSTITUTE EMISSIONS
PERCENTAG REDUCTION COST PERCENTAGE EMISSIONS COST INCREASE CHANGE COST CHANGEPERCENTAG REDUCTION (k )
COST ($)
PERCENTAGE ( / )
EMISSIONS (k )
COST INCREASE ($)
CHANGE ( )
COST CHANGE ($ )E CHANGE KG REDUCTION (kg) REDUCTION ($) CHANGE (1/100) INCREASE (kg) ($) (TONS) ($1000s)E CHANGE KG REDUCTION (kg) REDUCTION ($) CHANGE (1/100) INCREASE (kg) ($) (TONS) ($1000s)
0 0 0 0 0 0 0 0 00 0 0 0 0 0 0 0 05 1434.637474 10515.4 41163693.7 0.0 1493.8 96752735.2 ‐9 555895 1434.637474 10515.4 41163693.7 0.0 1493.8 96752735.2 ‐9 5558910 2869 274949 21030 8 82327387 3 0 0 2987 5 193505470 3 18 11117810 2869.274949 21030.8 82327387.3 0.0 2987.5 193505470.3 ‐18 11117815 4303 912423 31546 2 123491081 0 0 1 4481 3 290258205 5 ‐27 16676715 4303.912423 31546.2 123491081.0 0.1 4481.3 290258205.5 ‐27 16676720 5738 549897 42061 6 164654774 6 0 1 5975 0 387010940 7 36 22235620 5738.549897 42061.6 164654774.6 0.1 5975.0 387010940.7 ‐36 22235620 5738.549897 42061.6 164654774.6 0.1 5975.0 387010940.7 36 22235625 7173 187372 52576 9 205818468 3 0 1 7468 8 483763675 8 ‐45 27794525 7173.187372 52576.9 205818468.3 0.1 7468.8 483763675.8 ‐45 27794530 8607.824846 63092.3 246982161.9 0.1 8962.5 580516411.0 ‐54 33353430 8607.824846 63092.3 246982161.9 0.1 8962.5 580516411.0 54 33353435 10042 46232 73607 7 288145855 6 0 1 10456 3 677269146 2 63 38912335 10042.46232 73607.7 288145855.6 0.1 10456.3 677269146.2 ‐63 38912340 11477.09979 84123.1 329309549.3 0.2 11950.0 774021881.3 ‐72 44471240 11477.09979 84123.1 329309549.3 0.2 11950.0 774021881.3 ‐72 44471245 12911 73727 94638 5 370473242 9 0 2 13443 8 870774616 5 81 50030145 12911.73727 94638.5 370473242.9 0.2 13443.8 870774616.5 ‐81 50030150 14346 37474 105153 9 411636936 6 0 2 14937 5 967527351 7 ‐90 55589050 14346.37474 105153.9 411636936.6 0.2 14937.5 967527351.7 ‐90 55589055 15781.01222 115669.3 452800630.2 0.2 16431.3 1064280086.8 ‐99 61147955 15781.01222 115669.3 452800630.2 0.2 16431.3 1064280086.8 99 61147960 17215 64969 126184 7 493964323 9 0 3 17925 0 1161032822 0 108 66706860 17215.64969 126184.7 493964323.9 0.3 17925.0 1161032822.0 ‐108 66706865 18650.28717 136700.1 535128017.5 0.3 19418.8 1257785557.2 ‐117 72265865 18650.28717 136700.1 535128017.5 0.3 19418.8 1257785557.2 ‐117 72265870 20084 92464 147215 5 576291711 2 0 3 20912 5 1354538292 3 126 77824770 20084.92464 147215.5 576291711.2 0.3 20912.5 1354538292.3 ‐126 77824775 21519.56212 157730.8 617455404.9 0.3 22406.3 1451291027.5 ‐135 83383675 21519.56212 157730.8 617455404.9 0.3 22406.3 1451291027.5 ‐135 83383680 22954 19959 168246 2 658619098 5 0 3 23900 0 1548043762 6 144 88942580 22954.19959 168246.2 658619098.5 0.3 23900.0 1548043762.6 ‐144 88942580 22954.19959 168246.2 658619098.5 0.3 23900.0 1548043762.6 144 88942585 24388 83706 178761 6 699782792 2 0 4 25393 8 1644796497 8 ‐153 94501485 24388.83706 178761.6 699782792.2 0.4 25393.8 1644796497.8 ‐153 94501490 25823.47454 189277.0 740946485.8 0.4 26887.5 1741549233.0 ‐162 100060390 25823.47454 189277.0 740946485.8 0.4 26887.5 1741549233.0 162 100060395 27258 11201 199792 4 782110179 5 0 4 28381 3 1838301968 1 171 105619295 27258.11201 199792.4 782110179.5 0.4 28381.3 1838301968.1 ‐171 1056192100 28692.74949 210307.8 823273873.1 0.4 29875.0 1935054703.3 ‐180 1111781100 28692.74949 210307.8 823273873.1 0.4 29875.0 1935054703.3 ‐180 1111781
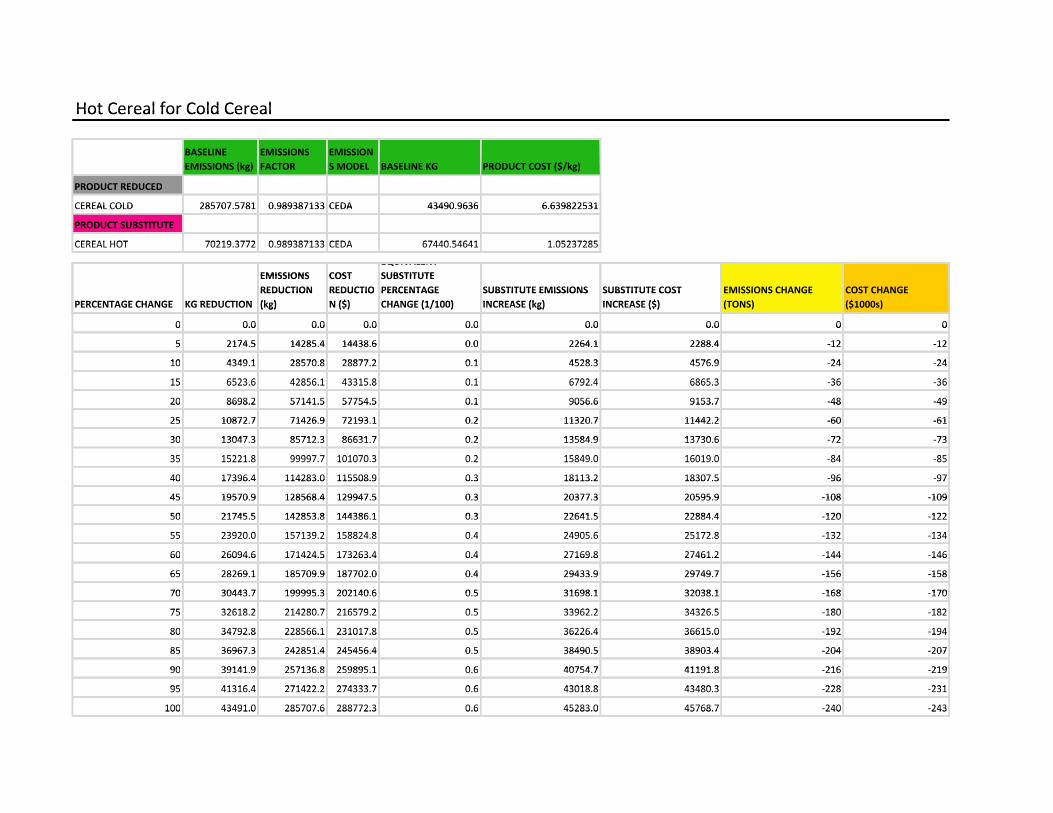
Hot Cereal for Cold CerealHot Cereal for Cold CerealHot Cereal for Cold Cereal
BASELINE EMISSIONS EMISSIONBASELINE EMISSIONS (kg)
EMISSIONS FACTOR
EMISSIONS MODEL BASELINE KG PRODUCT COST ($/kg)EMISSIONS (kg) FACTOR S MODEL BASELINE KG PRODUCT COST ($/kg)( g) ( g)
PRODUCT REDUCEDPRODUCT REDUCED
CEREAL COLD 285707.5781 0.989387133 CEDA 43490.9636 6.639822531CEREAL COLD 285707.5781 0.989387133 CEDA 43490.9636 6.639822531
PRODUCT SUBSTITUTEPRODUCT SUBSTITUTE
CEREAL HOT 70219 3772 0 989387133 CEDA 67440 54641 1 05237285CEREAL HOT 70219.3772 0.989387133 CEDA 67440.54641 1.05237285
EQUIVALENT EMISSIONS COST
QSUBSTITUTEEMISSIONS COST SUBSTITUTE
REDUCTION REDUCTIO PERCENTAGE SUBSTITUTE EMISSIONS SUBSTITUTE COST EMISSIONS CHANGE COST CHANGE PERCENTAGE CHANGE KG REDUCTION
REDUCTION (k )
REDUCTION ($)
PERCENTAGE CHANGE (1/100)
SUBSTITUTE EMISSIONS INCREASE (k )
SUBSTITUTE COST INCREASE ($)
EMISSIONS CHANGE (TONS)
COST CHANGE ($1000 )PERCENTAGE CHANGE KG REDUCTION (kg) N ($) CHANGE (1/100) INCREASE (kg) INCREASE ($) (TONS) ($1000s)( g) ($) ( / ) ( g) ($) ( ) ($ )
0 0.0 0.0 0.0 0.0 0.0 0.0 0 00 0.0 0.0 0.0 0.0 0.0 0.0 0 0
5 2174 5 14285 4 14438 6 0 0 2264 1 2288 4 ‐12 ‐125 2174.5 14285.4 14438.6 0.0 2264.1 2288.4 ‐12 ‐12
10 4349 1 28570 8 28877 2 0 1 4528 3 4576 9 24 2410 4349.1 28570.8 28877.2 0.1 4528.3 4576.9 ‐24 ‐24
15 6523 6 42856 1 43315 8 0 1 6792 4 6865 3 36 3615 6523.6 42856.1 43315.8 0.1 6792.4 6865.3 ‐36 ‐3615 6523.6 42856.1 43315.8 0.1 6792.4 6865.3 36 36
20 8698.2 57141.5 57754.5 0.1 9056.6 9153.7 ‐48 ‐4920 8698.2 57141.5 57754.5 0.1 9056.6 9153.7 ‐48 ‐49
25 10872 7 71426 9 72193 1 0 2 11320 7 11442 2 ‐60 ‐6125 10872.7 71426.9 72193.1 0.2 11320.7 11442.2 ‐60 ‐61
30 13047 3 85712 3 86631 7 0 2 13584 9 13730 6 72 7330 13047.3 85712.3 86631.7 0.2 13584.9 13730.6 ‐72 ‐73
35 15221 8 99997 7 101070 3 0 2 15849 0 16019 0 84 8535 15221.8 99997.7 101070.3 0.2 15849.0 16019.0 ‐84 ‐8535 15221.8 99997.7 101070.3 0.2 15849.0 16019.0 84 85
40 17396.4 114283.0 115508.9 0.3 18113.2 18307.5 ‐96 ‐9740 17396.4 114283.0 115508.9 0.3 18113.2 18307.5 96 97
45 19570 9 128568 4 129947 5 0 3 20377 3 20595 9 ‐108 ‐10945 19570.9 128568.4 129947.5 0.3 20377.3 20595.9 ‐108 ‐109
50 21745 5 142853 8 144386 1 0 3 22641 5 22884 4 120 12250 21745.5 142853.8 144386.1 0.3 22641.5 22884.4 ‐120 ‐122
55 23920 0 157139 2 158824 8 0 4 24905 6 25172 8 132 13455 23920.0 157139.2 158824.8 0.4 24905.6 25172.8 ‐132 ‐13455 39 0 0 5 39 588 8 0 905 6 5 8 3 3
60 26094.6 171424.5 173263.4 0.4 27169.8 27461.2 ‐144 ‐14660 26094.6 171424.5 173263.4 0.4 27169.8 27461.2 144 146
65 28269 1 185709 9 187702 0 0 4 29433 9 29749 7 ‐156 ‐15865 28269.1 185709.9 187702.0 0.4 29433.9 29749.7 ‐156 ‐158
70 30443 7 199995 3 202140 6 0 5 31698 1 32038 1 168 17070 30443.7 199995.3 202140.6 0.5 31698.1 32038.1 ‐168 ‐170
75 32618 2 214280 7 216579 2 0 5 33962 2 34326 5 180 18275 32618.2 214280.7 216579.2 0.5 33962.2 34326.5 ‐180 ‐182
80 34792.8 228566.1 231017.8 0.5 36226.4 36615.0 ‐192 ‐19480 34792.8 228566.1 231017.8 0.5 36226.4 36615.0 192 194
85 36967 3 242851 4 245456 4 0 5 38490 5 38903 4 ‐204 ‐20785 36967.3 242851.4 245456.4 0.5 38490.5 38903.4 ‐204 ‐207
90 39141 9 257136 8 259895 1 0 6 40754 7 41191 8 216 21990 39141.9 257136.8 259895.1 0.6 40754.7 41191.8 ‐216 ‐219
95 41316 4 271422 2 274333 7 0 6 43018 8 43480 3 228 23195 41316.4 271422.2 274333.7 0.6 43018.8 43480.3 ‐228 ‐231
100 43491.0 285707.6 288772.3 0.6 45283.0 45768.7 ‐240 ‐243100 43491.0 285707.6 288772.3 0.6 45283.0 45768.7 240 243
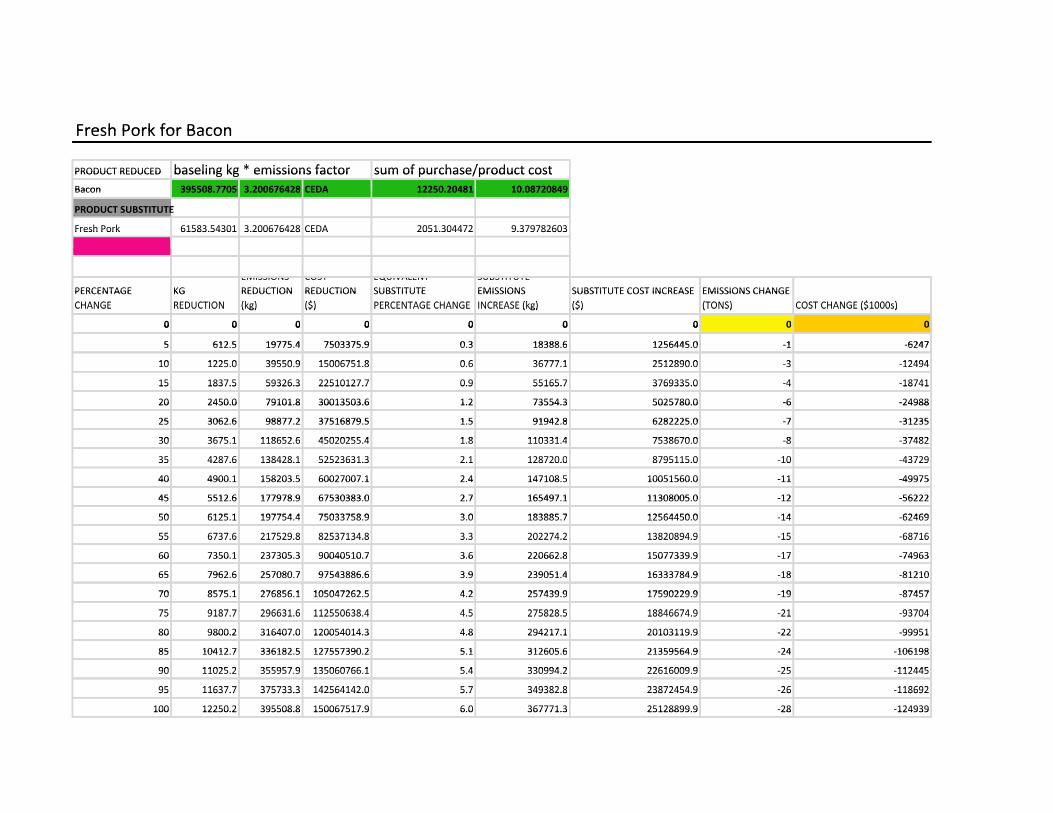
Fresh Pork for BaconFresh Pork for Bacon
b li k * i i f f h / dPRODUCT REDUCED baseling kg * emissions factor sum of purchase/product costPRODUCT REDUCED baseling kg emissions factor sum of purchase/product costBacon 395508.7705 3.200676428 CEDA 12250.20481 10.08720849Bacon 395508.7705 3.200676428 CEDA 12250.20481 10.08720849
PRODUCT SUBSTITUTEPRODUCT SUBSTITUTE
F h P k 61583 54301 3 200676428 CEDA 2051 304472 9 379782603Fresh Pork 61583.54301 3.200676428 CEDA 2051.304472 9.379782603Fresh Pork 61583.54301 3.200676428 CEDA 2051.304472 9.379782603
EMISSIONS COST EQUIVALENT SUBSTITUTE PERCENTAGE KG REDUCTION REDUCTION SUBSTITUTE EMISSIONS SUBSTITUTE COST INCREASE EMISSIONS CHANGEPERCENTAGE CHANGE
KG REDUCTION
REDUCTION (k )
REDUCTION ($)
SUBSTITUTE PERCENTAGE CHANGE
EMISSIONS INCREASE (k )
SUBSTITUTE COST INCREASE ($)
EMISSIONS CHANGE (TONS) COST CHANGE ($1000 )CHANGE REDUCTION (kg) ($) PERCENTAGE CHANGE INCREASE (kg) ($) (TONS) COST CHANGE ($1000s)CHANGE REDUCTION (kg) ($) PERCENTAGE CHANGE INCREASE (kg) ($) (TONS) COST CHANGE ($1000s)
0 0 0 0 0 0 0 0 00 0 0 0 0 0 0 0 0
5 612 5 19775 4 7503375 9 0 3 18388 6 1256445 0 ‐1 ‐62475 612.5 19775.4 7503375.9 0.3 18388.6 1256445.0 ‐1 ‐6247
10 1225 0 39550 9 15006751 8 0 6 36777 1 2512890 0 3 1249410 1225.0 39550.9 15006751.8 0.6 36777.1 2512890.0 ‐3 ‐12494
15 1837.5 59326.3 22510127.7 0.9 55165.7 3769335.0 ‐4 ‐1874115 1837.5 59326.3 22510127.7 0.9 55165.7 3769335.0 4 18741
20 2450.0 79101.8 30013503.6 1.2 73554.3 5025780.0 ‐6 ‐2498820 2450.0 79101.8 30013503.6 1.2 73554.3 5025780.0 ‐6 ‐24988
25 3062 6 98877 2 37516879 5 1 5 91942 8 6282225 0 ‐7 ‐3123525 3062.6 98877.2 37516879.5 1.5 91942.8 6282225.0 ‐7 ‐31235
30 3675 1 118652 6 45020255 4 1 8 110331 4 7538670 0 8 3748230 3675.1 118652.6 45020255.4 1.8 110331.4 7538670.0 ‐8 ‐37482
35 4287.6 138428.1 52523631.3 2.1 128720.0 8795115.0 ‐10 ‐4372935 4287.6 138428.1 52523631.3 2.1 128720.0 8795115.0 10 43729
40 4900.1 158203.5 60027007.1 2.4 147108.5 10051560.0 ‐11 ‐4997540 4900.1 158203.5 60027007.1 2.4 147108.5 10051560.0 ‐11 ‐49975
45 5512 6 177978 9 67530383 0 2 7 165497 1 11308005 0 ‐12 ‐5622245 5512.6 177978.9 67530383.0 2.7 165497.1 11308005.0 ‐12 ‐56222
50 6125 1 197754 4 75033758 9 3 0 183885 7 12564450 0 14 6246950 6125.1 197754.4 75033758.9 3.0 183885.7 12564450.0 ‐14 ‐62469
55 6737 6 217529 8 82537134 8 3 3 202274 2 13820894 9 15 6871655 6737.6 217529.8 82537134.8 3.3 202274.2 13820894.9 ‐15 ‐6871655 6737.6 217529.8 82537134.8 3.3 202274.2 13820894.9 15 68716
60 7350.1 237305.3 90040510.7 3.6 220662.8 15077339.9 ‐17 ‐7496360 7350.1 237305.3 90040510.7 3.6 220662.8 15077339.9 ‐17 ‐74963
65 7962 6 257080 7 97543886 6 3 9 239051 4 16333784 9 ‐18 ‐8121065 7962.6 257080.7 97543886.6 3.9 239051.4 16333784.9 ‐18 ‐81210
70 8575 1 276856 1 105047262 5 4 2 257439 9 17590229 9 19 8745770 8575.1 276856.1 105047262.5 4.2 257439.9 17590229.9 ‐19 ‐87457
75 9187 7 296631 6 112550638 4 4 5 275828 5 18846674 9 21 9370475 9187.7 296631.6 112550638.4 4.5 275828.5 18846674.9 ‐21 ‐9370475 9187.7 296631.6 112550638.4 4.5 275828.5 18846674.9 21 93704
80 9800.2 316407.0 120054014.3 4.8 294217.1 20103119.9 ‐22 ‐9995180 9800.2 316407.0 120054014.3 4.8 294217.1 20103119.9 ‐22 ‐99951
85 10412 7 336182 5 127557390 2 5 1 312605 6 21359564 9 ‐24 ‐10619885 10412.7 336182.5 127557390.2 5.1 312605.6 21359564.9 ‐24 ‐106198
90 11025 2 355957 9 135060766 1 5 4 330994 2 22616009 9 25 11244590 11025.2 355957.9 135060766.1 5.4 330994.2 22616009.9 ‐25 ‐112445
95 11637 7 375733 3 142564142 0 5 7 349382 8 23872454 9 26 11869295 11637.7 375733.3 142564142.0 5.7 349382.8 23872454.9 ‐26 ‐11869295 11637.7 375733.3 142564142.0 5.7 349382.8 23872454.9 26 118692
100 12250.2 395508.8 150067517.9 6.0 367771.3 25128899.9 ‐28 ‐124939100 12250.2 395508.8 150067517.9 6.0 367771.3 25128899.9 ‐28 ‐124939
PERCENTAGE CHKG REDUCTEMISSIONSCOST REDUEQUIVALENT SUBSUBSTITUTE EMSUBSTITUTE COST INCEMISSIONS CHACOST CHANGE ($1000sPERCENTAGE CHKG REDUCTEMISSIONSCOST REDUEQUIVALENT SUBSUBSTITUTE EMSUBSTITUTE COST INCEMISSIONS CHACOST CHANGE ($1000s($0 #VALUE! #REF! #VALUE! #VALUE! #REF! #VALUE! #REF! #VALUE!0 #VALUE! #REF! #VALUE! #VALUE! #REF! #VALUE! #REF! #VALUE!0 #VALUE! #REF! #VALUE! #VALUE! #REF! #VALUE! #REF! #VALUE!


)))
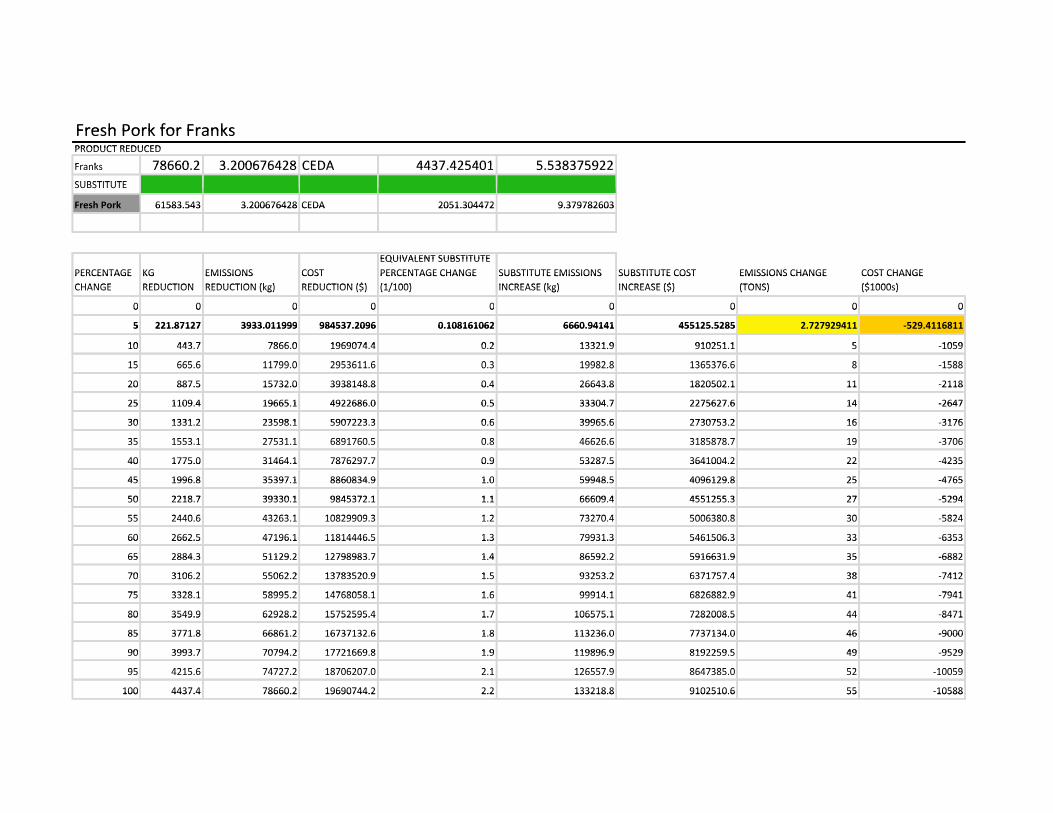
Fresh Pork for FranksFresh Pork for FranksPRODUCT REDUCEDPRODUCT REDUCED
Franks 78660 2 3 200676428 CEDA 4437 425401 5 538375922Franks 78660.2 3.200676428 CEDA 4437.425401 5.538375922SUBSTITUTESUBSTITUTE
Fresh Pork 61583.543 3.200676428 CEDA 2051.304472 9.379782603Fresh Pork 61583.543 3.200676428 CEDA 2051.304472 9.379782603
EQUIVALENT SUBSTITUTEEQUIVALENT SUBSTITUTE PERCENTAGE KG EMISSIONS COST PERCENTAGE CHANGE SUBSTITUTE EMISSIONS SUBSTITUTE COST EMISSIONS CHANGE COST CHANGE PERCENTAGE CHANGE
KG REDUCTION
EMISSIONS REDUCTION (k )
COST REDUCTION ($)
PERCENTAGE CHANGE (1/100)
SUBSTITUTE EMISSIONS INCREASE (k )
SUBSTITUTE COST INCREASE ($)
EMISSIONS CHANGE (TONS)
COST CHANGE ($1000 )CHANGE REDUCTION REDUCTION (kg) REDUCTION ($) (1/100) INCREASE (kg) INCREASE ($) (TONS) ($1000s)( g) ($) ( / ) ( g) ($) ( ) ($ )
0 0 0 0 0 0 0 0 00 0 0 0 0 0 0 0 0
5 221.87127 3933.011999 984537.2096 0.108161062 6660.94141 455125.5285 2.727929411 ‐529.41168115 221.87127 3933.011999 984537.2096 0.108161062 6660.94141 455125.5285 2.727929411 ‐529.4116811
10 443 7 7866 0 1969074 4 0 2 13321 9 910251 1 5 105910 443.7 7866.0 1969074.4 0.2 13321.9 910251.1 5 ‐1059
15 665 6 11799 0 2953611 6 0 3 19982 8 1365376 6 8 158815 665.6 11799.0 2953611.6 0.3 19982.8 1365376.6 8 ‐158815 665.6 11799.0 2953611.6 0.3 19982.8 1365376.6 8 1588
20 887.5 15732.0 3938148.8 0.4 26643.8 1820502.1 11 ‐211820 887.5 15732.0 3938148.8 0.4 26643.8 1820502.1 11 ‐2118
25 1109 4 19665 1 4922686 0 0 5 33304 7 2275627 6 14 ‐264725 1109.4 19665.1 4922686.0 0.5 33304.7 2275627.6 14 ‐2647
30 1331 2 23598 1 5907223 3 0 6 39965 6 2730753 2 16 317630 1331.2 23598.1 5907223.3 0.6 39965.6 2730753.2 16 ‐3176
35 1553 1 27531 1 6891760 5 0 8 46626 6 3185878 7 19 370635 1553.1 27531.1 6891760.5 0.8 46626.6 3185878.7 19 ‐370635 1553.1 27531.1 6891760.5 0.8 46626.6 3185878.7 19 3706
40 1775.0 31464.1 7876297.7 0.9 53287.5 3641004.2 22 ‐423540 1775.0 31464.1 7876297.7 0.9 53287.5 3641004.2 22 4235
45 1996 8 35397 1 8860834 9 1 0 59948 5 4096129 8 25 ‐476545 1996.8 35397.1 8860834.9 1.0 59948.5 4096129.8 25 ‐4765
50 2218 7 39330 1 9845372 1 1 1 66609 4 4551255 3 27 529450 2218.7 39330.1 9845372.1 1.1 66609.4 4551255.3 27 ‐5294
55 2440 6 43263 1 10829909 3 1 2 73270 4 5006380 8 30 582455 2440.6 43263.1 10829909.3 1.2 73270.4 5006380.8 30 ‐5824
60 2662.5 47196.1 11814446.5 1.3 79931.3 5461506.3 33 ‐635360 2662.5 47196.1 11814446.5 1.3 79931.3 5461506.3 33 6353
65 2884 3 51129 2 12798983 7 1 4 86592 2 5916631 9 35 ‐688265 2884.3 51129.2 12798983.7 1.4 86592.2 5916631.9 35 ‐6882
70 3106 2 55062 2 13783520 9 1 5 93253 2 6371757 4 38 741270 3106.2 55062.2 13783520.9 1.5 93253.2 6371757.4 38 ‐7412
75 3328 1 58995 2 14768058 1 1 6 99914 1 6826882 9 41 794175 3328.1 58995.2 14768058.1 1.6 99914.1 6826882.9 41 ‐7941
80 3549.9 62928.2 15752595.4 1.7 106575.1 7282008.5 44 ‐847180 3549.9 62928.2 15752595.4 1.7 106575.1 7282008.5 44 8471
85 3771.8 66861.2 16737132.6 1.8 113236.0 7737134.0 46 ‐900085 3771.8 66861.2 16737132.6 1.8 113236.0 7737134.0 46 ‐9000
90 3993 7 70794 2 17721669 8 1 9 119896 9 8192259 5 49 952990 3993.7 70794.2 17721669.8 1.9 119896.9 8192259.5 49 ‐9529
95 4215 6 74727 2 18706207 0 2 1 126557 9 8647385 0 52 1005995 4215.6 74727.2 18706207.0 2.1 126557.9 8647385.0 52 ‐10059
100 4437.4 78660.2 19690744.2 2.2 133218.8 9102510.6 55 ‐10588100 4437.4 78660.2 19690744.2 2.2 133218.8 9102510.6 55 10588
PERCENTAGKG REDUCEMISSIONS RED COST REDUC EQUIVALENT SUBSTSUBSTITUTE EMISSI SUBSTITUTE COST INEMISSIONS CHANGECOST CHANGE ($1PERCENTAGKG REDUCEMISSIONS RED COST REDUC EQUIVALENT SUBSTSUBSTITUTE EMISSI SUBSTITUTE COST INEMISSIONS CHANGECOST CHANGE ($1($0 #VALUE! #REF! #VALUE! #VALUE! #REF! #VALUE! #REF! #VALUE!0 #VALUE! #REF! #VALUE! #VALUE! #REF! #VALUE! #REF! #VALUE!0 #VALUE! #REF! #VALUE! #VALUE! #REF! #VALUE! #REF! #VALUE!


1000s)1000s))
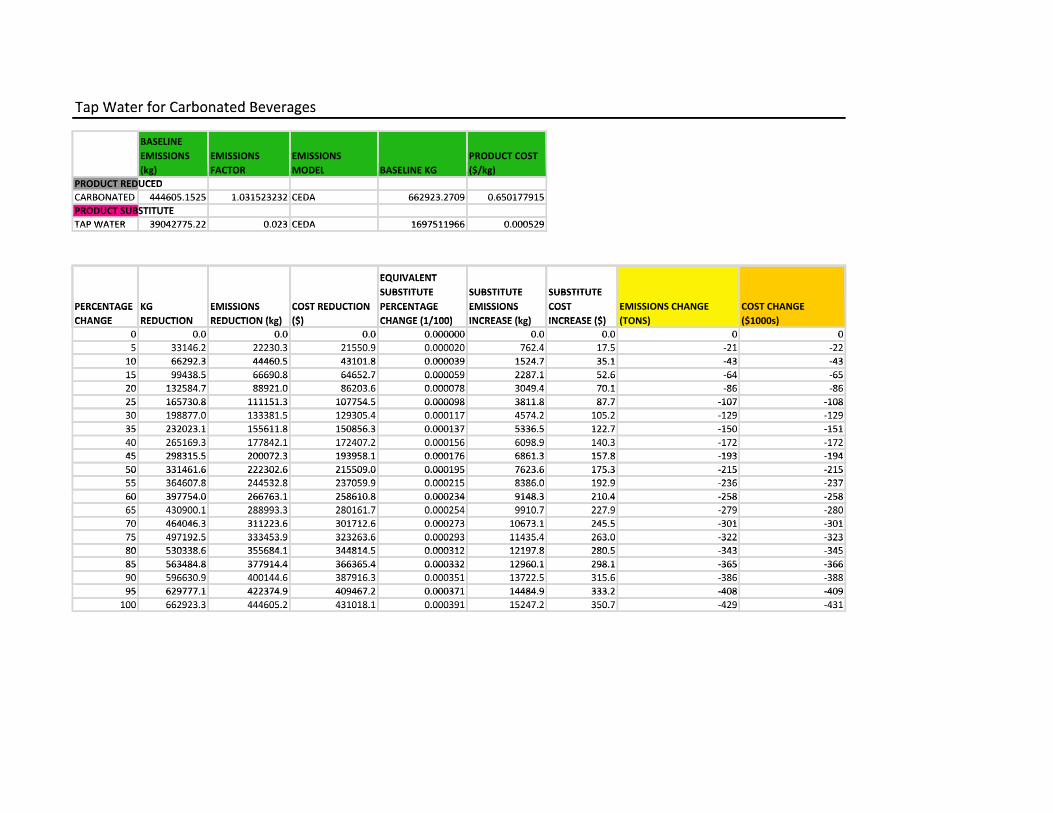
Tap Water for Carbonated BeveragesTap Water for Carbonated BeveragesTap Water for Carbonated Beverages
BASELINEBASELINE EMISSIONS EMISSIONS EMISSIONS PRODUCT COSTEMISSIONS EMISSIONS EMISSIONS PRODUCT COST (kg) FACTOR MODEL BASELINE KG ($/kg)(kg) FACTOR MODEL BASELINE KG ($/kg)
PRODUCT REDUCEDPRODUCT REDUCEDCARBONATED 444605.1525 1.031523232 CEDA 662923.2709 0.650177915CARBONATED 444605.1525 1.031523232 CEDA 662923.2709 0.650177915PRODUCT SUBSTITUTEPRODUCT SUBSTITUTEO UC SU S UTAP WATER 39042775 22 0 023 CEDA 1697511966 0 000529TAP WATER 39042775.22 0.023 CEDA 1697511966 0.000529
EQUIVALENTEQUIVALENT SUBSTITUTE SUBSTITUTE SUBSTITUTESUBSTITUTE SUBSTITUTE SUBSTITUTE
PERCENTAGE KG EMISSIONS COST REDUCTION PERCENTAGE EMISSIONS COST EMISSIONS CHANGE COST CHANGE PERCENTAGE CHANGE
KG REDUCTION
EMISSIONS REDUCTION (kg)
COST REDUCTION ($)
PERCENTAGE CHANGE (1/100)
EMISSIONS INCREASE (kg)
COST INCREASE ($)
EMISSIONS CHANGE (TONS)
COST CHANGE ($1000s)CHANGE REDUCTION REDUCTION (kg) ($) CHANGE (1/100) INCREASE (kg) INCREASE ($) (TONS) ($1000s)( g) ($) ( / ) ( g) ($) ( ) ($ )
0 0.0 0.0 0.0 0.000000 0.0 0.0 0 00 0.0 0.0 0.0 0.000000 0.0 0.0 0 05 33146 2 22230 3 21550 9 0 000020 762 4 17 5 21 225 33146.2 22230.3 21550.9 0.000020 762.4 17.5 ‐21 ‐225 33146.2 22230.3 21550.9 0.000020 762.4 17.5 21 2210 66292 3 44460 5 43101 8 0 000039 1524 7 35 1 ‐43 ‐4310 66292.3 44460.5 43101.8 0.000039 1524.7 35.1 ‐43 ‐4315 99438.5 66690.8 64652.7 0.000059 2287.1 52.6 ‐64 ‐6515 99438.5 66690.8 64652.7 0.000059 2287.1 52.6 64 6520 132584 7 88921 0 86203 6 0 000078 3049 4 70 1 86 8620 132584.7 88921.0 86203.6 0.000078 3049.4 70.1 ‐86 ‐8625 165730.8 111151.3 107754.5 0.000098 3811.8 87.7 ‐107 ‐10825 165730.8 111151.3 107754.5 0.000098 3811.8 87.7 ‐107 ‐10830 198877 0 133381 5 129305 4 0 000117 4574 2 105 2 129 12930 198877.0 133381.5 129305.4 0.000117 4574.2 105.2 ‐129 ‐12935 232023 1 155611 8 150856 3 0 000137 5336 5 122 7 ‐150 ‐15135 232023.1 155611.8 150856.3 0.000137 5336.5 122.7 ‐150 ‐1510 26 69 3 8 2 2 0 2 0 000 6 6098 9 0 3 2 240 265169.3 177842.1 172407.2 0.000156 6098.9 140.3 ‐172 ‐17240 265169.3 177842.1 172407.2 0.000156 6098.9 140.3 172 172
45 298315 5 200072 3 193958 1 0 000176 6861 3 157 8 193 19445 298315.5 200072.3 193958.1 0.000176 6861.3 157.8 ‐193 ‐19450 331461.6 222302.6 215509.0 0.000195 7623.6 175.3 ‐215 ‐21550 331461.6 222302.6 215509.0 0.000195 7623.6 175.3 ‐215 ‐21555 364607 8 244532 8 237059 9 0 000215 8386 0 192 9 236 23755 364607.8 244532.8 237059.9 0.000215 8386.0 192.9 ‐236 ‐23760 397754.0 266763.1 258610.8 0.000234 9148.3 210.4 ‐258 ‐25860 397754.0 266763.1 258610.8 0.000234 9148.3 210.4 ‐258 ‐25865 430900 1 288993 3 280161 7 0 000254 9910 7 227 9 279 28065 430900.1 288993.3 280161.7 0.000254 9910.7 227.9 ‐279 ‐28065 430900.1 288993.3 280161.7 0.000254 9910.7 227.9 279 28070 464046 3 311223 6 301712 6 0 000273 10673 1 245 5 ‐301 ‐30170 464046.3 311223.6 301712.6 0.000273 10673.1 245.5 ‐301 ‐30175 497192.5 333453.9 323263.6 0.000293 11435.4 263.0 ‐322 ‐32375 497192.5 333453.9 323263.6 0.000293 11435.4 263.0 322 32380 530338 6 355684 1 344814 5 0 000312 12197 8 280 5 343 34580 530338.6 355684.1 344814.5 0.000312 12197.8 280.5 ‐343 ‐34585 563484.8 377914.4 366365.4 0.000332 12960.1 298.1 ‐365 ‐36685 563484.8 377914.4 366365.4 0.000332 12960.1 298.1 ‐365 ‐36690 596630 9 400144 6 387916 3 0 000351 13722 5 315 6 386 38890 596630.9 400144.6 387916.3 0.000351 13722.5 315.6 ‐386 ‐38895 629777 1 422374 9 409467 2 0 000371 14484 9 333 2 ‐408 ‐40995 629777.1 422374.9 409467.2 0.000371 14484.9 333.2 ‐408 ‐409100 662923 3 444605 2 431018 1 0 000391 15247 2 350 7 429 431100 662923.3 444605.2 431018.1 0.000391 15247.2 350.7 ‐429 ‐431100 662923.3 444605.2 431018.1 0.000391 15247.2 350.7 429 431
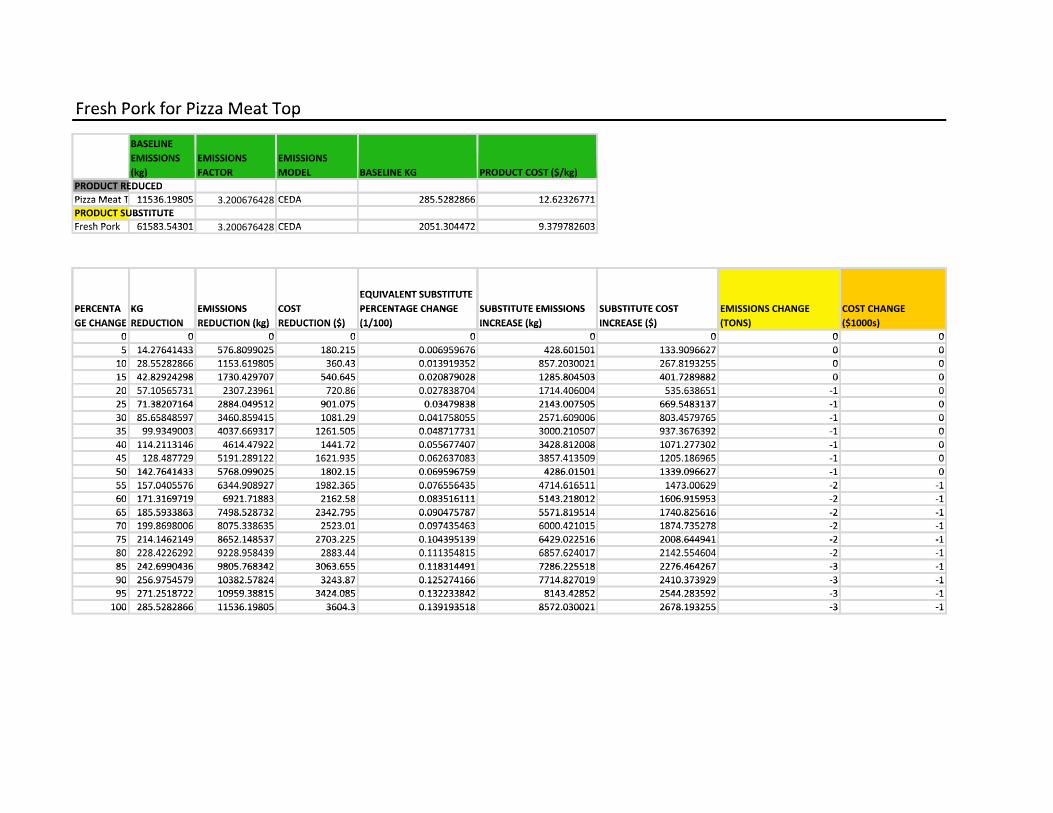
Fresh Pork for Pizza Meat TopFresh Pork for Pizza Meat TopFresh Pork for Pizza Meat Top
BASELINE BASELINE EMISSIONS EMISSIONS EMISSIONSEMISSIONS EMISSIONS EMISSIONS (kg) FACTOR MODEL BASELINE KG PRODUCT COST ($/kg)(kg) FACTOR MODEL BASELINE KG PRODUCT COST ($/kg)
PRODUCT REDUCEDPRODUCT REDUCEDPRODUCT REDUCEDPizza Meat T 11536 19805 3 200676428 CEDA 285 5282866 12 62326771Pizza Meat T 11536.19805 3.200676428 CEDA 285.5282866 12.62326771PRODUCT SUBSTITUTEPRODUCT SUBSTITUTEFresh Pork 61583 54301 3 200676428 CEDA 2051 304472 9 379782603Fresh Pork 61583.54301 3.200676428 CEDA 2051.304472 9.379782603
EQUIVALENT SUBSTITUTEEQUIVALENT SUBSTITUTE PERCENTA KG EMISSIONS COST PERCENTAGE CHANGE SUBSTITUTE EMISSIONS SUBSTITUTE COST EMISSIONS CHANGE COST CHANGEPERCENTA KG EMISSIONS
(k )COST
($)PERCENTAGE CHANGE ( / )
SUBSTITUTE EMISSIONS (k )
SUBSTITUTE COST ($)
EMISSIONS CHANGE ( )
COST CHANGE ($ )GE CHANGE REDUCTION REDUCTION (kg) REDUCTION ($) (1/100) INCREASE (kg) INCREASE ($) (TONS) ($1000s)GE CHANGE REDUCTION REDUCTION (kg) REDUCTION ($) (1/100) INCREASE (kg) INCREASE ($) (TONS) ($1000s)
0 0 0 0 0 0 0 0 00 0 0 0 0 0 0 0 05 14.27641433 576.8099025 180.215 0.006959676 428.601501 133.9096627 0 05 14.27641433 576.8099025 180.215 0.006959676 428.601501 133.9096627 0 010 28 55282866 1153 619805 360 43 0 013919352 857 2030021 267 8193255 0 010 28.55282866 1153.619805 360.43 0.013919352 857.2030021 267.8193255 0 015 42 82924298 1730 429707 540 645 0 020879028 1285 804503 401 7289882 0 015 42.82924298 1730.429707 540.645 0.020879028 1285.804503 401.7289882 0 020 57 10565731 2307 23961 720 86 0 027838704 1714 406004 535 638651 1 020 57.10565731 2307.23961 720.86 0.027838704 1714.406004 535.638651 ‐1 020 57.10565731 2307.23961 720.86 0.027838704 1714.406004 535.638651 1 025 71 38207164 2884 049512 901 075 0 03479838 2143 007505 669 5483137 ‐1 025 71.38207164 2884.049512 901.075 0.03479838 2143.007505 669.5483137 ‐1 030 85.65848597 3460.859415 1081.29 0.041758055 2571.609006 803.4579765 ‐1 030 85.65848597 3460.859415 1081.29 0.041758055 2571.609006 803.4579765 1 035 99 9349003 4037 669317 1261 505 0 048717731 3000 210507 937 3676392 1 035 99.9349003 4037.669317 1261.505 0.048717731 3000.210507 937.3676392 ‐1 040 114.2113146 4614.47922 1441.72 0.055677407 3428.812008 1071.277302 ‐1 040 114.2113146 4614.47922 1441.72 0.055677407 3428.812008 1071.277302 ‐1 045 128 487729 5191 289122 1621 935 0 062637083 3857 413509 1205 186965 1 045 128.487729 5191.289122 1621.935 0.062637083 3857.413509 1205.186965 ‐1 050 142 7641433 5768 099025 1802 15 0 069596759 4286 01501 1339 096627 ‐1 050 142.7641433 5768.099025 1802.15 0.069596759 4286.01501 1339.096627 ‐1 055 157.0405576 6344.908927 1982.365 0.076556435 4714.616511 1473.00629 ‐2 ‐155 157.0405576 6344.908927 1982.365 0.076556435 4714.616511 1473.00629 2 160 171 3169719 6921 71883 2162 58 0 083516111 5143 218012 1606 915953 2 160 171.3169719 6921.71883 2162.58 0.083516111 5143.218012 1606.915953 ‐2 ‐165 185.5933863 7498.528732 2342.795 0.090475787 5571.819514 1740.825616 ‐2 ‐165 185.5933863 7498.528732 2342.795 0.090475787 5571.819514 1740.825616 ‐2 ‐170 199 8698006 8075 338635 2523 01 0 097435463 6000 421015 1874 735278 2 170 199.8698006 8075.338635 2523.01 0.097435463 6000.421015 1874.735278 ‐2 ‐175 214.1462149 8652.148537 2703.225 0.104395139 6429.022516 2008.644941 ‐2 ‐175 214.1462149 8652.148537 2703.225 0.104395139 6429.022516 2008.644941 ‐2 ‐180 228 4226292 9228 958439 2883 44 0 111354815 6857 624017 2142 554604 2 180 228.4226292 9228.958439 2883.44 0.111354815 6857.624017 2142.554604 ‐2 ‐180 228.4226292 9228.958439 2883.44 0.111354815 6857.624017 2142.554604 2 185 242 6990436 9805 768342 3063 655 0 118314491 7286 225518 2276 464267 ‐3 ‐185 242.6990436 9805.768342 3063.655 0.118314491 7286.225518 2276.464267 ‐3 ‐190 256.9754579 10382.57824 3243.87 0.125274166 7714.827019 2410.373929 ‐3 ‐190 256.9754579 10382.57824 3243.87 0.125274166 7714.827019 2410.373929 3 195 271 2518722 10959 38815 3424 085 0 132233842 8143 42852 2544 283592 3 195 271.2518722 10959.38815 3424.085 0.132233842 8143.42852 2544.283592 ‐3 ‐1100 285.5282866 11536.19805 3604.3 0.139193518 8572.030021 2678.193255 ‐3 ‐1100 285.5282866 11536.19805 3604.3 0.139193518 8572.030021 2678.193255 ‐3 ‐1
PERCENTAGEKG REDUCTIONEMISSIONS REDUCCOST REDUCTION EQUIVALENT SUBSTITUTE PSUBSTITUTE EMISSIONS INCSUBSTITUTE COST INCREAS EMISSIONS CHANGE (TONS)COST CHANGE ($1000 )PERCENTAGEKG REDUCTIONEMISSIONS REDUCCOST REDUCTION EQUIVALENT SUBSTITUTE PSUBSTITUTE EMISSIONS INCSUBSTITUTE COST INCREAS EMISSIONS CHANGE (TONS)COST CHANGE ($1000s)PERCENTAGEKG REDUCTIONEMISSIONS REDUCCOST REDUCTION EQUIVALENT SUBSTITUTE PSUBSTITUTE EMISSIONS INCSUBSTITUTE COST INCREAS EMISSIONS CHANGE (TONS)COST CHANGE ($1000s)0 0 0 0 0 0 0 0 00 0 0 0 0 0 0 0 0
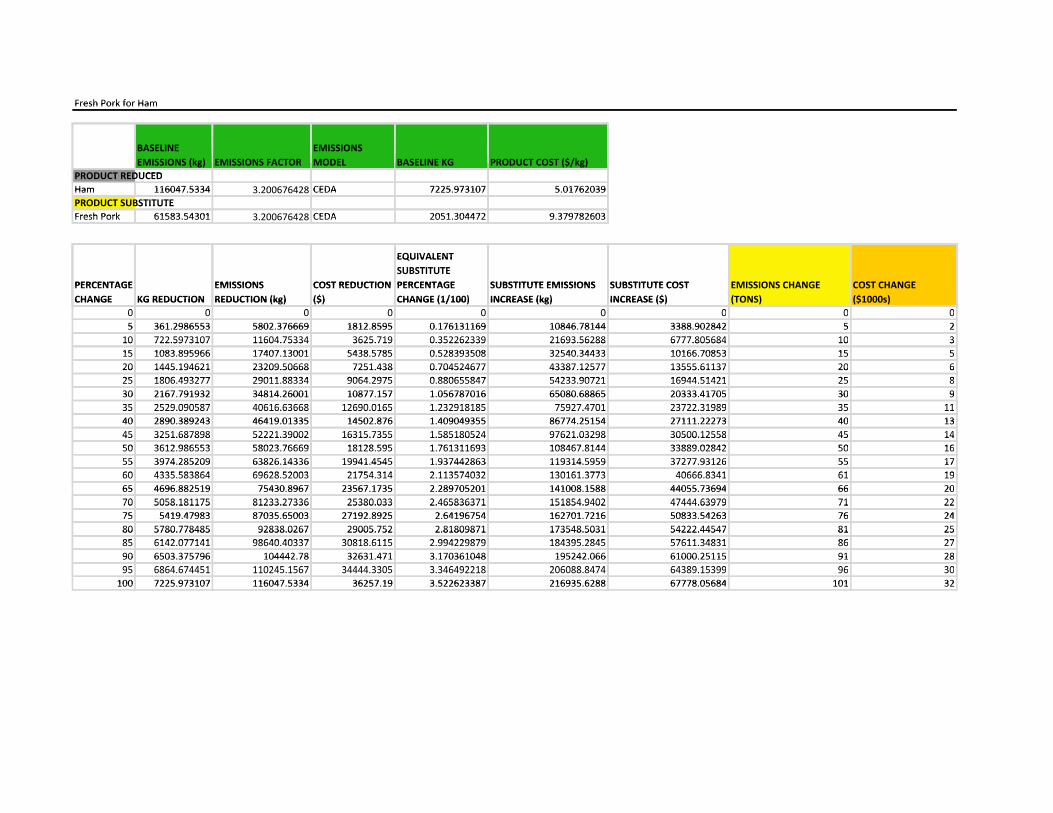
Fresh Pork for HamFresh Pork for Ham
BASELINE EMISSIONSBASELINE EMISSIONS EMISSIONS (kg) EMISSIONS FACTOR MODEL BASELINE KG PRODUCT COST ($/kg)EMISSIONS (kg) EMISSIONS FACTOR MODEL BASELINE KG PRODUCT COST ($/kg)
PRODUCT REDUCEDPRODUCT REDUCEDHam 116047 5334 3 200676428 CEDA 7225 973107 5 01762039Ham 116047.5334 3.200676428 CEDA 7225.973107 5.01762039PRODUCT SUBSTITUTEPRODUCT SUBSTITUTEPRODUCT SUBSTITUTEFresh Pork 61583 54301 3 200676428 CEDA 2051 304472 9 379782603Fresh Pork 61583.54301 3.200676428 CEDA 2051.304472 9.379782603
EQUIVALENTEQUIVALENT SUBSTITUTESUBSTITUTE
PERCENTAGE EMISSIONS COST REDUCTIONSUBSTITUTE PERCENTAGE SUBSTITUTE EMISSIONS SUBSTITUTE COST EMISSIONS CHANGE COST CHANGEPERCENTAGE EMISSIONS COST REDUCTION PERCENTAGE SUBSTITUTE EMISSIONS SUBSTITUTE COST EMISSIONS CHANGE COST CHANGE
CHANGE KG REDUCTION REDUCTION (kg) ($) CHANGE (1/100) INCREASE (kg) INCREASE ($) (TONS) ($1000s)CHANGE KG REDUCTION REDUCTION (kg) ($) CHANGE (1/100) INCREASE (kg) INCREASE ($) (TONS) ($1000s)0 0 0 0 0 0 0 0 00 0 0 0 0 0 0 0 05 361 2986553 5802 376669 1812 8595 0 176131169 10846 78144 3388 902842 5 25 361.2986553 5802.376669 1812.8595 0.176131169 10846.78144 3388.902842 5 210 22 9 310 1160 33 362 19 0 3 2262339 21693 6288 6 80 68 10 310 722.5973107 11604.75334 3625.719 0.352262339 21693.56288 6777.805684 10 310 722.5973107 11604.75334 3625.719 0.352262339 21693.56288 6777.805684 10 315 1083 895966 17407 13001 5438 5785 0 528393508 32540 34433 10166 70853 15 515 1083.895966 17407.13001 5438.5785 0.528393508 32540.34433 10166.70853 15 520 1445.194621 23209.50668 7251.438 0.704524677 43387.12577 13555.61137 20 620 1445.194621 23209.50668 7251.438 0.704524677 43387.12577 13555.61137 20 625 1806 493277 29011 88334 9064 2975 0 880655847 54233 90721 16944 51421 25 825 1806.493277 29011.88334 9064.2975 0.880655847 54233.90721 16944.51421 25 830 2167.791932 34814.26001 10877.157 1.056787016 65080.68865 20333.41705 30 930 2167.791932 34814.26001 10877.157 1.056787016 65080.68865 20333.41705 30 935 2529 090587 40616 63668 12690 0165 1 232918185 75927 4701 23722 31989 35 1135 2529.090587 40616.63668 12690.0165 1.232918185 75927.4701 23722.31989 35 1135 2529.090587 40616.63668 12690.0165 1.232918185 75927.4701 23722.31989 35 1140 2890 389243 46419 01335 14502 876 1 409049355 86774 25154 27111 22273 40 1340 2890.389243 46419.01335 14502.876 1.409049355 86774.25154 27111.22273 40 1345 3251.687898 52221.39002 16315.7355 1.585180524 97621.03298 30500.12558 45 1445 3251.687898 52221.39002 16315.7355 1.585180524 97621.03298 30500.12558 45 1450 3612 986553 58023 76669 18128 595 1 761311693 108467 8144 33889 02842 50 1650 3612.986553 58023.76669 18128.595 1.761311693 108467.8144 33889.02842 50 1655 3974.285209 63826.14336 19941.4545 1.937442863 119314.5959 37277.93126 55 1755 3974.285209 63826.14336 19941.4545 1.937442863 119314.5959 37277.93126 55 1760 4335 583864 69628 52003 21754 314 2 113574032 130161 3773 40666 8341 61 1960 4335.583864 69628.52003 21754.314 2.113574032 130161.3773 40666.8341 61 1965 4696 882519 75430 8967 23567 1735 2 289705201 141008 1588 44055 73694 66 2065 4696.882519 75430.8967 23567.1735 2.289705201 141008.1588 44055.73694 66 2070 5058 181175 81233 27336 25380 033 2 465836371 151854 9402 47444 63979 71 2270 5058.181175 81233.27336 25380.033 2.465836371 151854.9402 47444.63979 71 2270 5058.181175 81233.27336 25380.033 2.465836371 151854.9402 47444.63979 71 2275 5419 47983 87035 65003 27192 8925 2 64196754 162701 7216 50833 54263 76 2475 5419.47983 87035.65003 27192.8925 2.64196754 162701.7216 50833.54263 76 2480 5780.778485 92838.0267 29005.752 2.81809871 173548.5031 54222.44547 81 2580 5780.778485 92838.0267 29005.752 2.81809871 173548.5031 54222.44547 81 2585 6142 077141 98640 40337 30818 6115 2 994229879 184395 2845 57611 34831 86 2785 6142.077141 98640.40337 30818.6115 2.994229879 184395.2845 57611.34831 86 2790 6503.375796 104442.78 32631.471 3.170361048 195242.066 61000.25115 91 2890 6503.375796 104442.78 32631.471 3.170361048 195242.066 61000.25115 91 2895 6864 674451 110245 1567 34444 3305 3 346492218 206088 8474 64389 15399 96 3095 6864.674451 110245.1567 34444.3305 3.346492218 206088.8474 64389.15399 96 3095 6864.674451 110245.1567 34444.3305 3.346492218 206088.8474 64389.15399 96 30100 7225 973107 116047 5334 36257 19 3 522623387 216935 6288 67778 05684 101 32100 7225.973107 116047.5334 36257.19 3.522623387 216935.6288 67778.05684 101 32
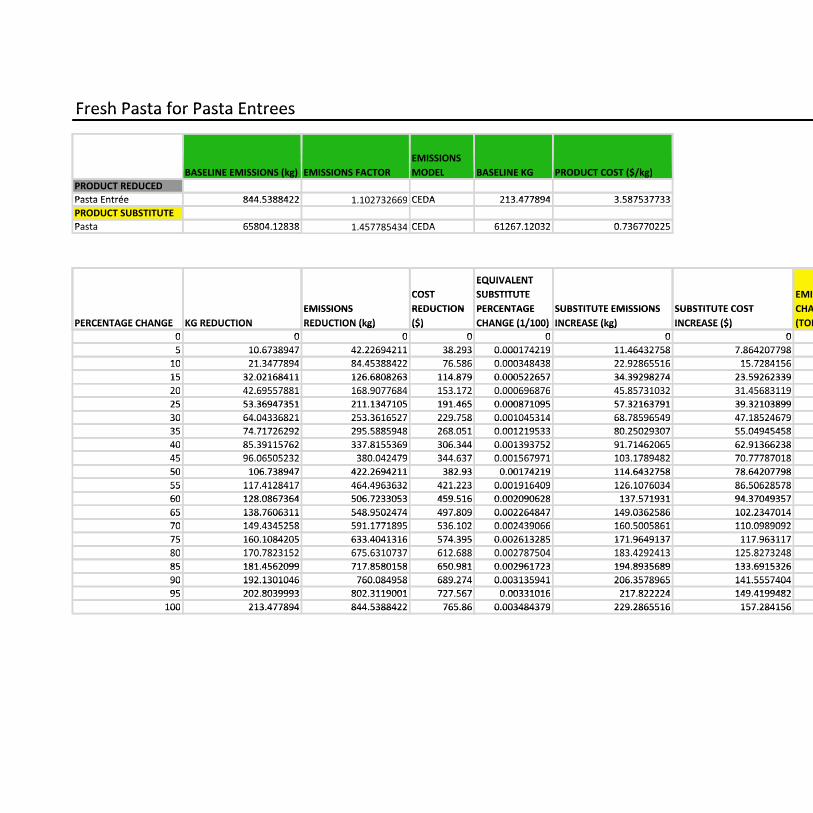
Fresh Pasta for Pasta EntreesFresh Pasta for Pasta EntreesFresh Pasta for Pasta Entrees
EMISSIONSEMISSIONS BASELINE EMISSIONS (kg) EMISSIONS FACTOR MODEL BASELINE KG PRODUCT COST ($/kg)BASELINE EMISSIONS (kg) EMISSIONS FACTOR MODEL BASELINE KG PRODUCT COST ($/kg)
PRODUCT REDUCEDPRODUCT REDUCEDPRODUCT REDUCEDPasta Entrée 844 5388422 1 102732669 CEDA 213 477894 3 587537733Pasta Entrée 844.5388422 1.102732669 CEDA 213.477894 3.587537733PRODUCT SUBSTITUTEPRODUCT SUBSTITUTEPasta 65804 12838 1 457785434 CEDA 61267 12032 0 736770225Pasta 65804.12838 1.457785434 CEDA 61267.12032 0.736770225
QEQUIVALENT COST
EQUIVALENT SUBSTITUTE EMISSIONSCOST SUBSTITUTE EMISSIONS
EMISSIONS REDUCTION PERCENTAGE SUBSTITUTE EMISSIONS SUBSTITUTE COST CHANGE COST CHANGEEMISSIONS (k )
REDUCTION ($)
PERCENTAGE ( / )
SUBSTITUTE EMISSIONS (k )
SUBSTITUTE COST ($)
CHANGE ( )
COST CHANGE ($ )PERCENTAGE CHANGE KG REDUCTION REDUCTION (kg) ($) CHANGE (1/100) INCREASE (kg) INCREASE ($) (TONS) ($1000s)PERCENTAGE CHANGE KG REDUCTION REDUCTION (kg) ($) CHANGE (1/100) INCREASE (kg) INCREASE ($) (TONS) ($1000s)
0 0 0 0 0 0 0 0 00 0 0 0 0 0 0 0 05 10.6738947 42.22694211 38.293 0.000174219 11.46432758 7.864207798 0 05 10.6738947 42.22694211 38.293 0.000174219 11.46432758 7.864207798 0 010 21 3477894 84 45388422 76 586 0 000348438 22 92865516 15 7284156 0 010 21.3477894 84.45388422 76.586 0.000348438 22.92865516 15.7284156 0 015 32 02168411 126 6808263 114 879 0 000522657 34 39298274 23 59262339 0 015 32.02168411 126.6808263 114.879 0.000522657 34.39298274 23.59262339 0 020 42 69557881 168 9077684 153 172 0 000696876 45 85731032 31 45683119 0 020 42.69557881 168.9077684 153.172 0.000696876 45.85731032 31.45683119 0 020 42.69557881 168.9077684 153.172 0.000696876 45.85731032 31.45683119 0 025 53 36947351 211 1347105 191 465 0 000871095 57 32163791 39 32103899 0 025 53.36947351 211.1347105 191.465 0.000871095 57.32163791 39.32103899 0 030 64.04336821 253.3616527 229.758 0.001045314 68.78596549 47.18524679 0 030 64.04336821 253.3616527 229.758 0.001045314 68.78596549 47.18524679 0 035 74 71726292 295 5885948 268 051 0 001219533 80 25029307 55 04945458 0 035 74.71726292 295.5885948 268.051 0.001219533 80.25029307 55.04945458 0 040 85.39115762 337.8155369 306.344 0.001393752 91.71462065 62.91366238 0 040 85.39115762 337.8155369 306.344 0.001393752 91.71462065 62.91366238 0 045 96 06505232 380 042479 344 637 0 001567971 103 1789482 70 77787018 0 045 96.06505232 380.042479 344.637 0.001567971 103.1789482 70.77787018 0 050 106 738947 422 2694211 382 93 0 00174219 114 6432758 78 64207798 0 050 106.738947 422.2694211 382.93 0.00174219 114.6432758 78.64207798 0 055 117.4128417 464.4963632 421.223 0.001916409 126.1076034 86.50628578 0 055 117.4128417 464.4963632 421.223 0.001916409 126.1076034 86.50628578 0 060 128 0867364 506 7233053 459 516 0 002090628 137 571931 94 37049357 0 060 128.0867364 506.7233053 459.516 0.002090628 137.571931 94.37049357 0 065 138.7606311 548.9502474 497.809 0.002264847 149.0362586 102.2347014 0 065 138.7606311 548.9502474 497.809 0.002264847 149.0362586 102.2347014 0 070 149 4345258 591 1771895 536 102 0 002439066 160 5005861 110 0989092 0 070 149.4345258 591.1771895 536.102 0.002439066 160.5005861 110.0989092 0 075 160.1084205 633.4041316 574.395 0.002613285 171.9649137 117.963117 0 075 160.1084205 633.4041316 574.395 0.002613285 171.9649137 117.963117 0 080 170 7823152 675 6310737 612 688 0 002787504 183 4292413 125 8273248 0 080 170.7823152 675.6310737 612.688 0.002787504 183.4292413 125.8273248 0 080 170.7823152 675.6310737 612.688 0.002787504 183.4292413 125.8273248 0 085 181 4562099 717 8580158 650 981 0 002961723 194 8935689 133 6915326 ‐1 ‐185 181.4562099 717.8580158 650.981 0.002961723 194.8935689 133.6915326 ‐1 ‐190 192.1301046 760.084958 689.274 0.003135941 206.3578965 141.5557404 ‐1 ‐190 192.1301046 760.084958 689.274 0.003135941 206.3578965 141.5557404 1 195 202 8039993 802 3119001 727 567 0 00331016 217 822224 149 4199482 1 195 202.8039993 802.3119001 727.567 0.00331016 217.822224 149.4199482 ‐1 ‐1100 213.477894 844.5388422 765.86 0.003484379 229.2865516 157.284156 ‐1 ‐1100 213.477894 844.5388422 765.86 0.003484379 229.2865516 157.284156 ‐1 ‐1
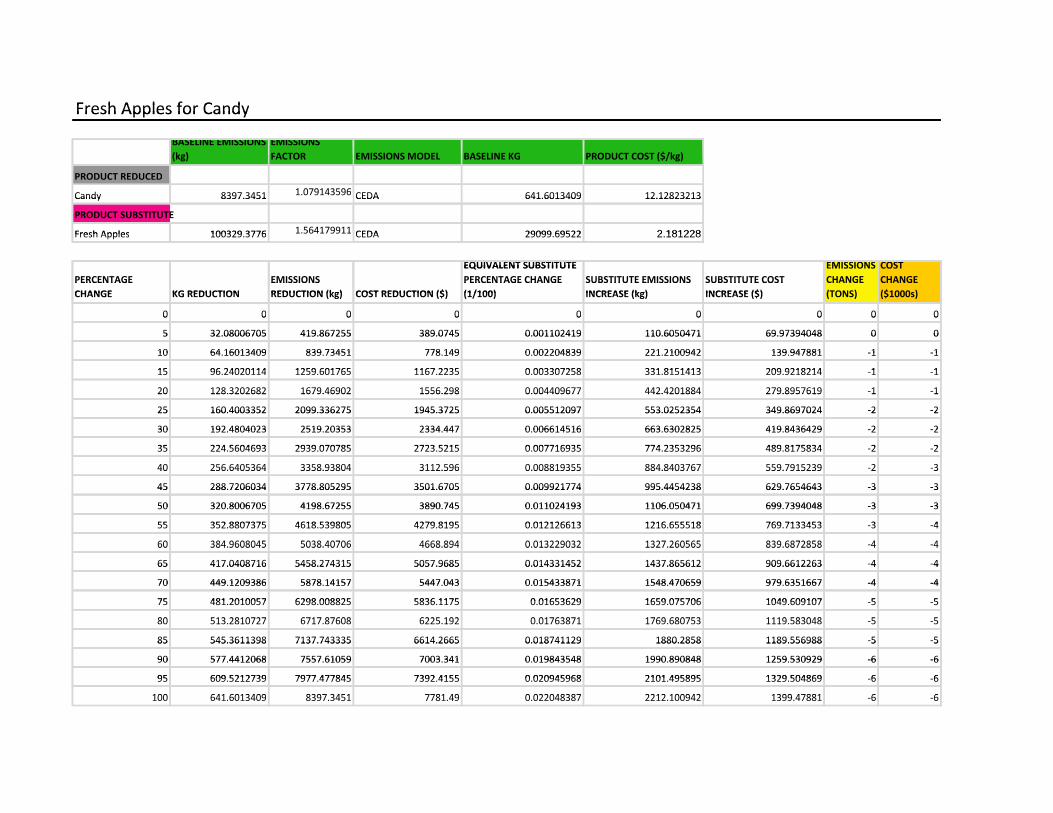
Fresh Apples for CandyFresh Apples for CandyFresh Apples for Candy
BASELINE EMISSIONS EMISSIONS (kg) FACTOR EMISSIONS MODEL BASELINE KG PRODUCT COST ($/kg)(kg) FACTOR EMISSIONS MODEL BASELINE KG PRODUCT COST ($/kg)
PRODUCT REDUCEDPRODUCT REDUCED
1 079143596Candy 8397.3451 1.079143596 CEDA 641.6013409 12.12823213Candy 8397.3451 CEDA 641.6013409 12.12823213
PRODUCT SUBSTITUTEPRODUCT SUBSTITUTE
Fresh Apples 100329 3776 1.564179911 CEDA 29099 69522 2 181228Fresh Apples 100329.3776 1.564179911 CEDA 29099.69522 2.181228
EQUIVALENT SUBSTITUTE EMISSIONS COSTPERCENTAGE EMISSIONS
EQUIVALENT SUBSTITUTE PERCENTAGE CHANGE SUBSTITUTE EMISSIONS SUBSTITUTE COST
EMISSIONS CHANGE
COST CHANGEPERCENTAGE EMISSIONS PERCENTAGE CHANGE SUBSTITUTE EMISSIONS SUBSTITUTE COST CHANGE CHANGE PERCENTAGE
CHANGE KG REDUCTIONEMISSIONS REDUCTION (kg) COST REDUCTION ($)
PERCENTAGE CHANGE (1/100)
SUBSTITUTE EMISSIONS INCREASE (kg)
SUBSTITUTE COST INCREASE ($)
CHANGE (TONS)
CHANGE ($1000s)CHANGE KG REDUCTION REDUCTION (kg) COST REDUCTION ($) (1/100) INCREASE (kg) INCREASE ($) (TONS) ($1000s)
0 0 0 0 0 0 0 0 00 0 0 0 0 0 0 0 00 0 0 0 0 0 0 0 0
5 32.08006705 419.867255 389.0745 0.001102419 110.6050471 69.97394048 0 05 32.08006705 419.867255 389.0745 0.001102419 110.6050471 69.97394048 0 0
10 64 16013409 839 73451 778 149 0 002204839 221 2100942 139 947881 ‐1 ‐110 64.16013409 839.73451 778.149 0.002204839 221.2100942 139.947881 ‐1 ‐1
15 96 24020114 1259 601765 1167 2235 0 003307258 331 8151413 209 9218214 1 115 96.24020114 1259.601765 1167.2235 0.003307258 331.8151413 209.9218214 ‐1 ‐1
20 128 3202682 1679 46902 1556 298 0 004409677 442 4201884 279 8957619 1 120 128.3202682 1679.46902 1556.298 0.004409677 442.4201884 279.8957619 ‐1 ‐120 128.3202682 1679.46902 1556.298 0.004409677 442.4201884 279.8957619 1 1
25 160.4003352 2099.336275 1945.3725 0.005512097 553.0252354 349.8697024 ‐2 ‐225 160.4003352 2099.336275 1945.3725 0.005512097 553.0252354 349.8697024 ‐2 ‐2
30 192 4804023 2519 20353 2334 447 0 006614516 663 6302825 419 8436429 ‐2 ‐230 192.4804023 2519.20353 2334.447 0.006614516 663.6302825 419.8436429 ‐2 ‐2
35 224 5604693 2939 070785 2723 5215 0 007716935 774 2353296 489 8175834 2 235 224.5604693 2939.070785 2723.5215 0.007716935 774.2353296 489.8175834 ‐2 ‐2
40 256 6405364 3358 93804 3112 596 0 008819355 884 8403767 559 7915239 2 340 256.6405364 3358.93804 3112.596 0.008819355 884.8403767 559.7915239 ‐2 ‐340 256.6405364 3358.93804 3112.596 0.008819355 884.8403767 559.7915239 2 3
45 288.7206034 3778.805295 3501.6705 0.009921774 995.4454238 629.7654643 ‐3 ‐345 288.7206034 3778.805295 3501.6705 0.009921774 995.4454238 629.7654643 ‐3 ‐3
50 320 8006705 4198 67255 3890 745 0 011024193 1106 050471 699 7394048 ‐3 ‐350 320.8006705 4198.67255 3890.745 0.011024193 1106.050471 699.7394048 ‐3 ‐3
55 352 8807375 4618 539805 4279 8195 0 012126613 1216 655518 769 7133453 3 455 352.8807375 4618.539805 4279.8195 0.012126613 1216.655518 769.7133453 ‐3 ‐4
60 384 9608045 5038 40706 4668 894 0 013229032 1327 260565 839 6872858 4 460 384.9608045 5038.40706 4668.894 0.013229032 1327.260565 839.6872858 ‐4 ‐460 384.9608045 5038.40706 4668.894 0.013229032 1327.260565 839.6872858 4 4
65 417.0408716 5458.274315 5057.9685 0.014331452 1437.865612 909.6612263 ‐4 ‐465 417.0408716 5458.274315 5057.9685 0.014331452 1437.865612 909.6612263 4 4
70 449 1209386 5878 14157 5447 043 0 015433871 1548 470659 979 6351667 ‐4 ‐470 449.1209386 5878.14157 5447.043 0.015433871 1548.470659 979.6351667 ‐4 ‐4
75 481 2010057 6298 008825 5836 1175 0 01653629 1659 075706 1049 609107 5 575 481.2010057 6298.008825 5836.1175 0.01653629 1659.075706 1049.609107 ‐5 ‐5
80 513 2810727 6717 87608 6225 192 0 01763871 1769 680753 1119 583048 5 580 513.2810727 6717.87608 6225.192 0.01763871 1769.680753 1119.583048 ‐5 ‐5
85 545.3611398 7137.743335 6614.2665 0.018741129 1880.2858 1189.556988 ‐5 ‐585 545.3611398 7137.743335 6614.2665 0.018741129 1880.2858 1189.556988 5 5
90 577 4412068 7557 61059 7003 341 0 019843548 1990 890848 1259 530929 ‐6 ‐690 577.4412068 7557.61059 7003.341 0.019843548 1990.890848 1259.530929 ‐6 ‐6
95 609 5212739 7977 477845 7392 4155 0 020945968 2101 495895 1329 504869 6 695 609.5212739 7977.477845 7392.4155 0.020945968 2101.495895 1329.504869 ‐6 ‐6
100 641 6013409 8397 3451 7781 49 0 022048387 2212 100942 1399 47881 6 6100 641.6013409 8397.3451 7781.49 0.022048387 2212.100942 1399.47881 ‐6 ‐6
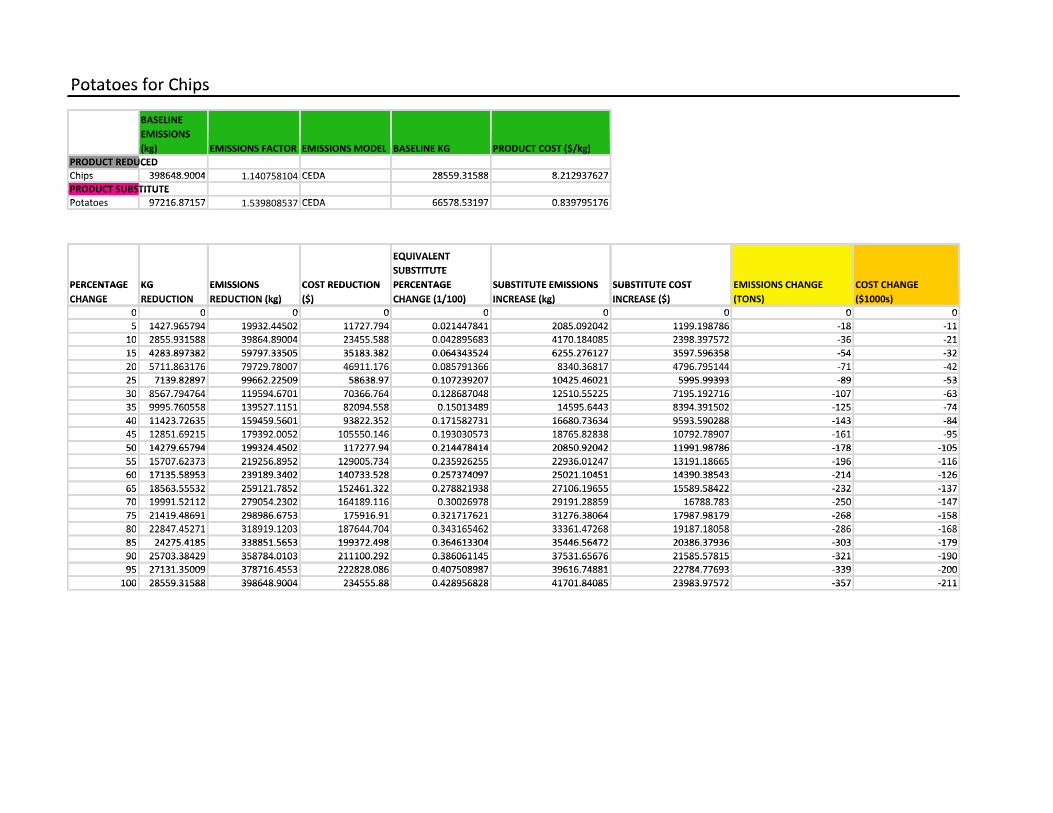
Potatoes for ChipsPotatoes for ChipsPotatoes for Chips
BASELINE BASELINE EMISSIONSEMISSIONS (kg) EMISSIONS FACTOR EMISSIONS MODEL BASELINE KG PRODUCT COST ($/kg)(kg) EMISSIONS FACTOR EMISSIONS MODEL BASELINE KG PRODUCT COST ($/kg)
PRODUCT REDUCEDPRODUCT REDUCEDPRODUCT REDUCEDChips 398648 9004 1 140758104 CEDA 28559 31588 8 212937627Chips 398648.9004 1.140758104 CEDA 28559.31588 8.212937627PRODUCT SUBSTITUTEPRODUCT SUBSTITUTEPotatoes 97216 87157 1 539808537 CEDA 66578 53197 0 839795176Potatoes 97216.87157 1.539808537 CEDA 66578.53197 0.839795176
QEQUIVALENT EQUIVALENT SUBSTITUTESUBSTITUTE
PERCENTAGE KG EMISSIONS COST REDUCTION PERCENTAGE SUBSTITUTE EMISSIONS SUBSTITUTE COST EMISSIONS CHANGE COST CHANGEPERCENTAGE KG EMISSIONS (k )
COST REDUCTION ($)
PERCENTAGE ( / )
SUBSTITUTE EMISSIONS (k )
SUBSTITUTE COST ($)
EMISSIONS CHANGE ( )
COST CHANGE ($ )CHANGE REDUCTION REDUCTION (kg) ($) CHANGE (1/100) INCREASE (kg) INCREASE ($) (TONS) ($1000s)CHANGE REDUCTION REDUCTION (kg) ($) CHANGE (1/100) INCREASE (kg) INCREASE ($) (TONS) ($1000s)
0 0 0 0 0 0 0 0 00 0 0 0 0 0 0 0 05 1427.965794 19932.44502 11727.794 0.021447841 2085.092042 1199.198786 ‐18 ‐115 1427.965794 19932.44502 11727.794 0.021447841 2085.092042 1199.198786 ‐18 ‐1110 2855 931588 39864 89004 23455 588 0 042895683 4170 184085 2398 397572 36 2110 2855.931588 39864.89004 23455.588 0.042895683 4170.184085 2398.397572 ‐36 ‐2115 4283 897382 59797 33505 35183 382 0 064343524 6255 276127 3597 596358 ‐54 ‐3215 4283.897382 59797.33505 35183.382 0.064343524 6255.276127 3597.596358 ‐54 ‐3220 5711 863176 79729 78007 46911 176 0 085791366 8340 36817 4796 795144 71 4220 5711.863176 79729.78007 46911.176 0.085791366 8340.36817 4796.795144 ‐71 ‐4220 5711.863176 79729.78007 46911.176 0.085791366 8340.36817 4796.795144 71 4225 7139 82897 99662 22509 58638 97 0 107239207 10425 46021 5995 99393 ‐89 ‐5325 7139.82897 99662.22509 58638.97 0.107239207 10425.46021 5995.99393 ‐89 ‐5330 8567.794764 119594.6701 70366.764 0.128687048 12510.55225 7195.192716 ‐107 ‐6330 8567.794764 119594.6701 70366.764 0.128687048 12510.55225 7195.192716 107 6335 9995 760558 139527 1151 82094 558 0 15013489 14595 6443 8394 391502 125 7435 9995.760558 139527.1151 82094.558 0.15013489 14595.6443 8394.391502 ‐125 ‐7440 11423.72635 159459.5601 93822.352 0.171582731 16680.73634 9593.590288 ‐143 ‐8440 11423.72635 159459.5601 93822.352 0.171582731 16680.73634 9593.590288 ‐143 ‐8445 12851 69215 179392 0052 105550 146 0 193030573 18765 82838 10792 78907 161 9545 12851.69215 179392.0052 105550.146 0.193030573 18765.82838 10792.78907 ‐161 ‐9550 14279 65794 199324 4502 117277 94 0 214478414 20850 92042 11991 98786 ‐178 ‐10550 14279.65794 199324.4502 117277.94 0.214478414 20850.92042 11991.98786 ‐178 ‐10555 15707.62373 219256.8952 129005.734 0.235926255 22936.01247 13191.18665 ‐196 ‐11655 15707.62373 219256.8952 129005.734 0.235926255 22936.01247 13191.18665 196 11660 17135 58953 239189 3402 140733 528 0 257374097 25021 10451 14390 38543 214 12660 17135.58953 239189.3402 140733.528 0.257374097 25021.10451 14390.38543 ‐214 ‐12665 18563.55532 259121.7852 152461.322 0.278821938 27106.19655 15589.58422 ‐232 ‐13765 18563.55532 259121.7852 152461.322 0.278821938 27106.19655 15589.58422 ‐232 ‐13770 19991 52112 279054 2302 164189 116 0 30026978 29191 28859 16788 783 250 14770 19991.52112 279054.2302 164189.116 0.30026978 29191.28859 16788.783 ‐250 ‐14775 21419.48691 298986.6753 175916.91 0.321717621 31276.38064 17987.98179 ‐268 ‐15875 21419.48691 298986.6753 175916.91 0.321717621 31276.38064 17987.98179 ‐268 ‐15880 22847 45271 318919 1203 187644 704 0 343165462 33361 47268 19187 18058 286 16880 22847.45271 318919.1203 187644.704 0.343165462 33361.47268 19187.18058 ‐286 ‐16880 22847.45271 318919.1203 187644.704 0.343165462 33361.47268 19187.18058 286 16885 24275 4185 338851 5653 199372 498 0 364613304 35446 56472 20386 37936 ‐303 ‐17985 24275.4185 338851.5653 199372.498 0.364613304 35446.56472 20386.37936 ‐303 ‐17990 25703.38429 358784.0103 211100.292 0.386061145 37531.65676 21585.57815 ‐321 ‐19090 25703.38429 358784.0103 211100.292 0.386061145 37531.65676 21585.57815 321 19095 27131 35009 378716 4553 222828 086 0 407508987 39616 74881 22784 77693 339 20095 27131.35009 378716.4553 222828.086 0.407508987 39616.74881 22784.77693 ‐339 ‐200100 28559.31588 398648.9004 234555.88 0.428956828 41701.84085 23983.97572 ‐357 ‐211100 28559.31588 398648.9004 234555.88 0.428956828 41701.84085 23983.97572 ‐357 ‐211
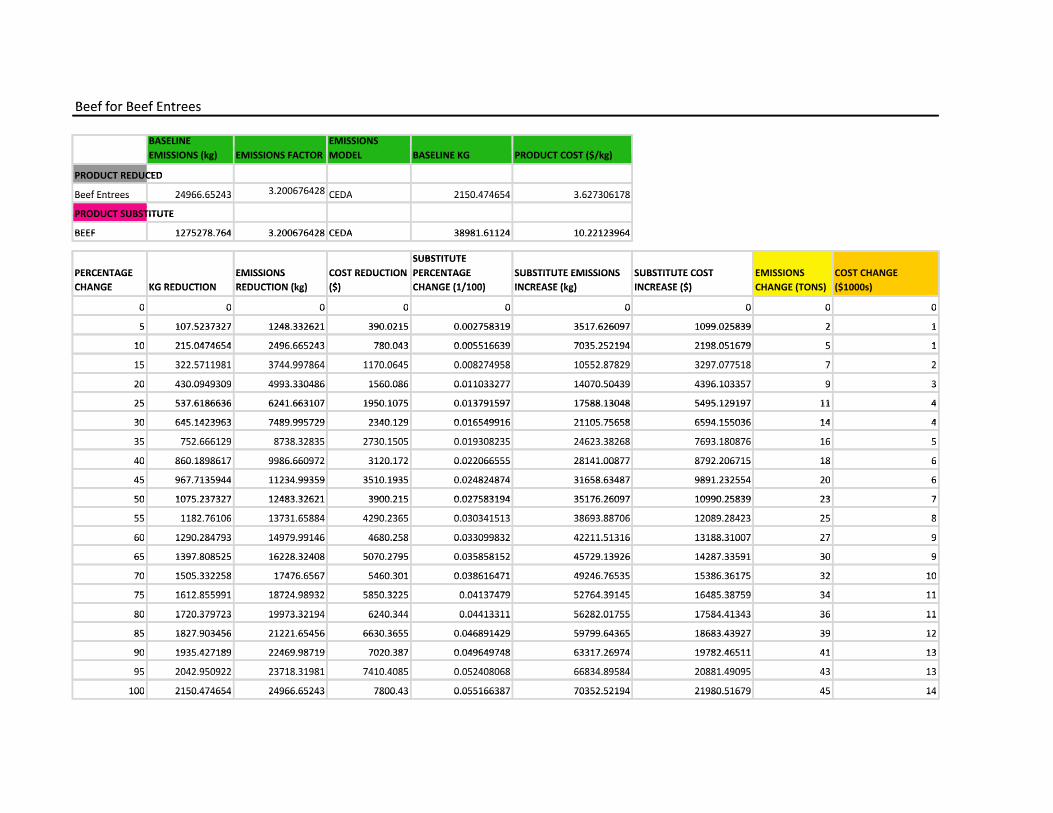
Beef for Beef EntreesBeef for Beef Entrees
BASELINE EMISSIONSBASELINE EMISSIONS EMISSIONS (kg) EMISSIONS FACTOR MODEL BASELINE KG PRODUCT COST ($/kg)EMISSIONS (kg) EMISSIONS FACTOR MODEL BASELINE KG PRODUCT COST ($/kg)
PRODUCT REDUCEDPRODUCT REDUCED
f 2 966 6 2 3 3 200676428 C 2 0 6 3 62 306 8Beef Entrees 24966.65243 3.200676428 CEDA 2150.474654 3.627306178Beef Entrees 24966.65243 CEDA 2150.474654 3.627306178
PRODUCT SUBSTITUTEPRODUCT SUBSTITUTE
BEEF 1275278 764 3 200676428 CEDA 38981 61124 10 22123964BEEF 1275278.764 3.200676428 CEDA 38981.61124 10.22123964
SUBSTITUTESUBSTITUTE PERCENTAGE EMISSIONS COST REDUCTION PERCENTAGE SUBSTITUTE EMISSIONS SUBSTITUTE COST EMISSIONS COST CHANGE PERCENTAGE CHANGE KG REDUCTION
EMISSIONS REDUCTION (k )
COST REDUCTION ($)
PERCENTAGE CHANGE (1/100)
SUBSTITUTE EMISSIONS INCREASE (k )
SUBSTITUTE COST INCREASE ($)
EMISSIONS CHANGE (TONS)
COST CHANGE ($1000 )CHANGE KG REDUCTION REDUCTION (kg) ($) CHANGE (1/100) INCREASE (kg) INCREASE ($) CHANGE (TONS) ($1000s)( g) ($) ( / ) ( g) ($) ( ) ($ )
0 0 0 0 0 0 0 0 00 0 0 0 0 0 0 0 0
5 107 5237327 1248 332621 390 0215 0 002758319 3517 626097 1099 025839 2 15 107.5237327 1248.332621 390.0215 0.002758319 3517.626097 1099.025839 2 1
10 215 0474654 2496 665243 780 043 0 005516639 7035 252194 2198 051679 5 110 215.0474654 2496.665243 780.043 0.005516639 7035.252194 2198.051679 5 1
15 322 5711981 3744 997864 1170 0645 0 008274958 10552 87829 3297 077518 7 215 322.5711981 3744.997864 1170.0645 0.008274958 10552.87829 3297.077518 7 215 322.5711981 3744.997864 1170.0645 0.008274958 10552.87829 3297.077518 7 2
20 430.0949309 4993.330486 1560.086 0.011033277 14070.50439 4396.103357 9 320 430.0949309 4993.330486 1560.086 0.011033277 14070.50439 4396.103357 9 3
25 537 6186636 6241 663107 1950 1075 0 013791597 17588 13048 5495 129197 11 425 537.6186636 6241.663107 1950.1075 0.013791597 17588.13048 5495.129197 11 4
30 645 1423963 7489 995729 2340 129 0 016549916 21105 75658 6594 155036 14 430 645.1423963 7489.995729 2340.129 0.016549916 21105.75658 6594.155036 14 4
35 752 666129 8738 32835 2730 1505 0 019308235 24623 38268 7693 180876 16 535 752.666129 8738.32835 2730.1505 0.019308235 24623.38268 7693.180876 16 535 752.666129 8738.32835 2730.1505 0.019308235 24623.38268 7693.180876 16 5
40 860.1898617 9986.660972 3120.172 0.022066555 28141.00877 8792.206715 18 640 860.1898617 9986.660972 3120.172 0.022066555 28141.00877 8792.206715 18 6
45 967 7135944 11234 99359 3510 1935 0 024824874 31658 63487 9891 232554 20 645 967.7135944 11234.99359 3510.1935 0.024824874 31658.63487 9891.232554 20 6
50 1075 237327 12483 32621 3900 215 0 027583194 35176 26097 10990 25839 23 750 1075.237327 12483.32621 3900.215 0.027583194 35176.26097 10990.25839 23 7
55 1182 76106 13731 65884 4290 2365 0 030341513 38693 88706 12089 28423 25 855 1182.76106 13731.65884 4290.2365 0.030341513 38693.88706 12089.28423 25 8
60 1290.284793 14979.99146 4680.258 0.033099832 42211.51316 13188.31007 27 960 1290.284793 14979.99146 4680.258 0.033099832 42211.51316 13188.31007 27 9
65 1397 808525 16228 32408 5070 2795 0 035858152 45729 13926 14287 33591 30 965 1397.808525 16228.32408 5070.2795 0.035858152 45729.13926 14287.33591 30 9
70 1505 332258 17476 6567 5460 301 0 038616471 49246 76535 15386 36175 32 1070 1505.332258 17476.6567 5460.301 0.038616471 49246.76535 15386.36175 32 10
75 1612 855991 18724 98932 5850 3225 0 04137479 52764 39145 16485 38759 34 1175 1612.855991 18724.98932 5850.3225 0.04137479 52764.39145 16485.38759 34 11
80 1720.379723 19973.32194 6240.344 0.04413311 56282.01755 17584.41343 36 1180 1720.379723 19973.32194 6240.344 0.04413311 56282.01755 17584.41343 36 11
85 1827.903456 21221.65456 6630.3655 0.046891429 59799.64365 18683.43927 39 1285 1827.903456 21221.65456 6630.3655 0.046891429 59799.64365 18683.43927 39 12
90 1935 427189 22469 98719 7020 387 0 049649748 63317 26974 19782 46511 41 1390 1935.427189 22469.98719 7020.387 0.049649748 63317.26974 19782.46511 41 13
95 2042 950922 23718 31981 7410 4085 0 052408068 66834 89584 20881 49095 43 1395 2042.950922 23718.31981 7410.4085 0.052408068 66834.89584 20881.49095 43 13
100 2150.474654 24966.65243 7800.43 0.055166387 70352.52194 21980.51679 45 14100 2150.474654 24966.65243 7800.43 0.055166387 70352.52194 21980.51679 45 14

Fresh Apples for CakeFresh Apples for CakeFresh Apples for Cake
BASELINE BASELINE EMISSIONS EMISSIONS EMISSIONSEMISSIONS EMISSIONS EMISSIONS (kg) FACTOR MODEL BASELINE KG PRODUCT COST ($/kg)(kg) FACTOR MODEL BASELINE KG PRODUCT COST ($/kg)
PRODUCT REDUCEDPRODUCT REDUCEDPRODUCT REDUCEDCakes 69850 33192 0 954289177 CEDA 20784 82389 3 521617041Cakes 69850.33192 0.954289177 CEDA 20784.82389 3.521617041PRODUCT SUBSTITUTEPRODUCT SUBSTITUTE
h l 00329 3 6 1 564179911 C 29099 69 22 2 181228Fresh Apples 100329.3776 1.564179911 CEDA 29099.69522 2.181228Fresh Apples 100329.3776 CEDA 29099.69522 2.181228
EQUIVALENTEQUIVALENT QSUBSTITUTESUBSTITUTE
PERCENTAGE KG EMISSIONS COST PERCENTAGE CHANGE SUBSTITUTE EMISSIONS SUBSTITUTE COST EMISSIONS CHANGE COST CHANGE PERCENTAGE CHANGE
KG REDUCTION
EMISSIONS REDUCTION (k )
COST REDUCTION ($)
PERCENTAGE CHANGE (1/100)
SUBSTITUTE EMISSIONS INCREASE (k )
SUBSTITUTE COST INCREASE ($)
EMISSIONS CHANGE (TONS)
COST CHANGE ($1000 )CHANGE REDUCTION REDUCTION (kg) REDUCTION ($) (1/100) INCREASE (kg) INCREASE ($) (TONS) ($1000s)( g) ($) ( / ) ( g) ($) ( ) ($ )
0 0 0 0 0 0 0 0 00 0 0 0 0 0 0 0 05 1039 241194 3492 516596 3659 8095 0 03571313 3583 076092 2266 821992 0 15 1039.241194 3492.516596 3659.8095 0.03571313 3583.076092 2266.821992 0 ‐15 1039.241194 3492.516596 3659.8095 0.03571313 3583.076092 2266.821992 0 110 2078 482389 6985 033192 7319 619 0 07142626 7166 152183 4533 643984 0 310 2078.482389 6985.033192 7319.619 0.07142626 7166.152183 4533.643984 0 ‐315 3117.723583 10477.54979 10979.4285 0.10713939 10749.22828 6800.465977 0 ‐415 3117.723583 10477.54979 10979.4285 0.10713939 10749.22828 6800.465977 0 420 4156 964778 13970 06638 14639 238 0 142852519 14332 30437 9067 287969 0 620 4156.964778 13970.06638 14639.238 0.142852519 14332.30437 9067.287969 0 ‐625 5196.205972 17462.58298 18299.0475 0.178565649 17915.38046 11334.10996 0 ‐725 5196.205972 17462.58298 18299.0475 0.178565649 17915.38046 11334.10996 0 ‐730 6235 447167 20955 09957 21958 857 0 214278779 21498 45655 13600 93195 1 830 6235.447167 20955.09957 21958.857 0.214278779 21498.45655 13600.93195 1 ‐830 6 35 6 0955 0995 958 85 0 8 9 98 5655 3600 93 95 835 7274 688361 24447 61617 25618 6665 0 249991909 25081 53264 15867 75395 1 ‐1035 7274.688361 24447.61617 25618.6665 0.249991909 25081.53264 15867.75395 1 ‐1040 8313.929556 27940.13277 29278.476 0.285705039 28664.60873 18134.57594 1 ‐1140 8313.929556 27940.13277 29278.476 0.285705039 28664.60873 18134.57594 1 1145 9353 17075 31432 64936 32938 2855 0 321418169 32247 68483 20401 39793 1 1345 9353.17075 31432.64936 32938.2855 0.321418169 32247.68483 20401.39793 1 ‐1350 10392.41194 34925.16596 36598.095 0.357131299 35830.76092 22668.21992 1 ‐1450 10392.41194 34925.16596 36598.095 0.357131299 35830.76092 22668.21992 1 ‐1455 11431 65314 38417 68255 40257 9045 0 392844429 39413 83701 24935 04191 1 1555 11431.65314 38417.68255 40257.9045 0.392844429 39413.83701 24935.04191 1 ‐1560 12470 89433 41910 19915 43917 714 0 428557558 42996 9131 27201 86391 1 ‐1760 12470.89433 41910.19915 43917.714 0.428557558 42996.9131 27201.86391 1 ‐1765 13510 13553 45402 71575 47577 5235 0 464270688 46579 98919 29468 6859 1 1865 13510.13553 45402.71575 47577.5235 0.464270688 46579.98919 29468.6859 1 ‐1865 13510.13553 45402.71575 47577.5235 0.464270688 46579.98919 29468.6859 1 1870 14549 37672 48895 23234 51237 333 0 499983818 50163 06528 31735 50789 1 ‐2070 14549.37672 48895.23234 51237.333 0.499983818 50163.06528 31735.50789 1 ‐2075 15588.61792 52387.74894 54897.1425 0.535696948 53746.14138 34002.32988 1 ‐2175 15588.61792 52387.74894 54897.1425 0.535696948 53746.14138 34002.32988 1 2180 16627 85911 55880 26553 58556 952 0 571410078 57329 21747 36269 15187 1 2280 16627.85911 55880.26553 58556.952 0.571410078 57329.21747 36269.15187 1 ‐2285 17667.10031 59372.78213 62216.7615 0.607123208 60912.29356 38535.97387 2 ‐2485 17667.10031 59372.78213 62216.7615 0.607123208 60912.29356 38535.97387 2 ‐2490 18706 3415 62865 29872 65876 571 0 642836338 64495 36965 40802 79586 2 2590 18706.3415 62865.29872 65876.571 0.642836338 64495.36965 40802.79586 2 ‐2595 19745 5827 66357 81532 69536 3805 0 678549467 68078 44574 43069 61785 2 ‐2695 19745.5827 66357.81532 69536.3805 0.678549467 68078.44574 43069.61785 2 ‐26100 20784.82389 69850.33192 73196.19 0.714262597 71661.52183 45336.43984 2 ‐28100 20784.82389 69850.33192 73196.19 0.714262597 71661.52183 45336.43984 2 28
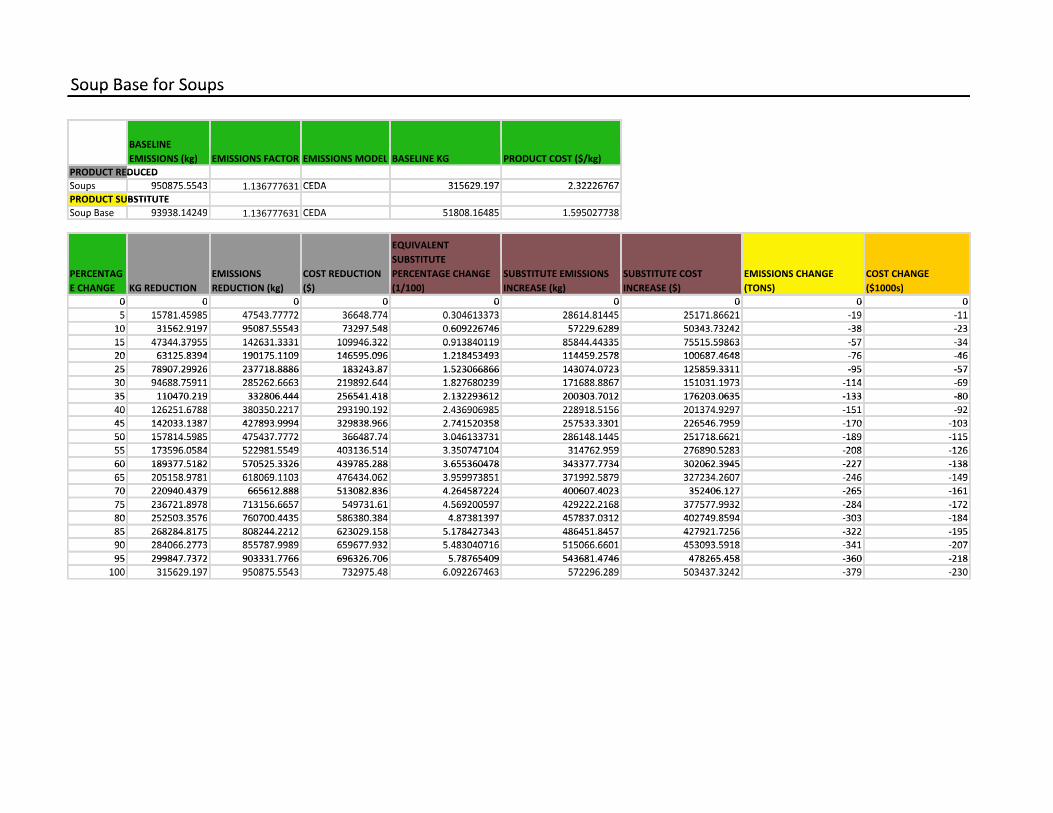
Soup Base for SoupsSoup Base for SoupsSoup Base for Soups
BASELINEBASELINE BASELINE EMISSIONS (kg) EMISSIONS FACTOR EMISSIONS MODEL BASELINE KG PRODUCT COST ($/kg)EMISSIONS (kg) EMISSIONS FACTOR EMISSIONS MODEL BASELINE KG PRODUCT COST ($/kg)
PRODUCT REDUCEDPRODUCT REDUCEDSoups 950875 5543 1 136777631 CEDA 315629 197 2 32226767Soups 950875.5543 1.136777631 CEDA 315629.197 2.32226767pPRODUCT SUBSTITUTEPRODUCT SUBSTITUTES B 93938 14249 1 136777631 CEDA 51808 16485 1 595027738Soup Base 93938.14249 1.136777631 CEDA 51808.16485 1.595027738Soup Base 93938.14249 1.136777631 CEDA 51808.16485 1.595027738
EQUIVALENTEQUIVALENT SUBSTITUTESUBSTITUTE
PERCENTAG EMISSIONS COST REDUCTION PERCENTAGE CHANGE SUBSTITUTE EMISSIONS SUBSTITUTE COST EMISSIONS CHANGE COST CHANGE PERCENTAGE CHANGE KG REDUCTION
EMISSIONS REDUCTION (kg)
COST REDUCTION ($)
PERCENTAGE CHANGE (1/100)
SUBSTITUTE EMISSIONS INCREASE (kg)
SUBSTITUTE COST INCREASE ($)
EMISSIONS CHANGE (TONS)
COST CHANGE ($1000s)E CHANGE KG REDUCTION REDUCTION (kg) ($) (1/100) INCREASE (kg) INCREASE ($) (TONS) ($1000s)( g) ( ) ( / ) ( g) ( ) ( ) ( )
0 0 0 0 0 0 0 0 00 0 0 0 0 0 0 0 05 15781 45985 47543 77772 36648 774 0 304613373 28614 81445 25171 86621 19 115 15781.45985 47543.77772 36648.774 0.304613373 28614.81445 25171.86621 ‐19 ‐115 15781.45985 47543.77772 36648.774 0.304613373 28614.81445 25171.86621 19 1110 31562 9197 95087 55543 73297 548 0 609226746 57229 6289 50343 73242 ‐38 ‐2310 31562.9197 95087.55543 73297.548 0.609226746 57229.6289 50343.73242 ‐38 ‐2315 47344.37955 142631.3331 109946.322 0.913840119 85844.44335 75515.59863 ‐57 ‐3415 47344.37955 142631.3331 109946.322 0.913840119 85844.44335 75515.59863 57 3420 63125 8394 190175 1109 146595 096 1 218453493 114459 2578 100687 4648 76 4620 63125.8394 190175.1109 146595.096 1.218453493 114459.2578 100687.4648 ‐76 ‐4625 78907.29926 237718.8886 183243.87 1.523066866 143074.0723 125859.3311 ‐95 ‐5725 78907.29926 237718.8886 183243.87 1.523066866 143074.0723 125859.3311 ‐95 ‐5730 94688 75911 285262 6663 219892 644 1 827680239 171688 8867 151031 1973 114 6930 94688.75911 285262.6663 219892.644 1.827680239 171688.8867 151031.1973 ‐114 ‐6935 110470 219 332806 444 256541 418 2 132293612 200303 7012 176203 0635 ‐133 ‐8035 110470.219 332806.444 256541.418 2.132293612 200303.7012 176203.0635 ‐133 ‐8040 126251 6788 380350 2217 293190 192 2 436906985 228918 5156 201374 9297 151 9240 126251.6788 380350.2217 293190.192 2.436906985 228918.5156 201374.9297 ‐151 ‐9240 126251.6788 380350.2217 293190.192 2.436906985 228918.5156 201374.9297 151 9245 142033 1387 427893 9994 329838 966 2 741520358 257533 3301 226546 7959 170 10345 142033.1387 427893.9994 329838.966 2.741520358 257533.3301 226546.7959 ‐170 ‐10350 157814.5985 475437.7772 366487.74 3.046133731 286148.1445 251718.6621 ‐189 ‐11550 157814.5985 475437.7772 366487.74 3.046133731 286148.1445 251718.6621 189 11555 173596 0584 522981 5549 403136 514 3 350747104 314762 959 276890 5283 208 12655 173596.0584 522981.5549 403136.514 3.350747104 314762.959 276890.5283 ‐208 ‐12660 189377.5182 570525.3326 439785.288 3.655360478 343377.7734 302062.3945 ‐227 ‐13860 189377.5182 570525.3326 439785.288 3.655360478 343377.7734 302062.3945 ‐227 ‐13865 205158 9781 618069 1103 476434 062 3 959973851 371992 5879 327234 2607 246 14965 205158.9781 618069.1103 476434.062 3.959973851 371992.5879 327234.2607 ‐246 ‐14965 05 58 9 8 6 8069 03 6 3 06 3 9599 385 3 99 58 9 3 3 60 6 970 220940 4379 665612 888 513082 836 4 264587224 400607 4023 352406 127 ‐265 ‐16170 220940.4379 665612.888 513082.836 4.264587224 400607.4023 352406.127 ‐265 ‐16175 236721.8978 713156.6657 549731.61 4.569200597 429222.2168 377577.9932 ‐284 ‐17275 236721.8978 713156.6657 549731.61 4.569200597 429222.2168 377577.9932 284 17280 252503 3576 760700 4435 586380 384 4 87381397 457837 0312 402749 8594 303 18480 252503.3576 760700.4435 586380.384 4.87381397 457837.0312 402749.8594 ‐303 ‐18485 268284.8175 808244.2212 623029.158 5.178427343 486451.8457 427921.7256 ‐322 ‐19585 268284.8175 808244.2212 623029.158 5.178427343 486451.8457 427921.7256 ‐322 ‐19590 284066 2773 855787 9989 659677 932 5 483040716 515066 6601 453093 5918 341 20790 284066.2773 855787.9989 659677.932 5.483040716 515066.6601 453093.5918 ‐341 ‐20795 299847 7372 903331 7766 696326 706 5 78765409 543681 4746 478265 458 ‐360 ‐21895 299847.7372 903331.7766 696326.706 5.78765409 543681.4746 478265.458 ‐360 ‐218100 315629 197 950875 5543 732975 48 6 092267463 572296 289 503437 3242 379 230100 315629.197 950875.5543 732975.48 6.092267463 572296.289 503437.3242 ‐379 ‐230100 315629.197 950875.5543 732975.48 6.092267463 572296.289 503437.3242 379 230
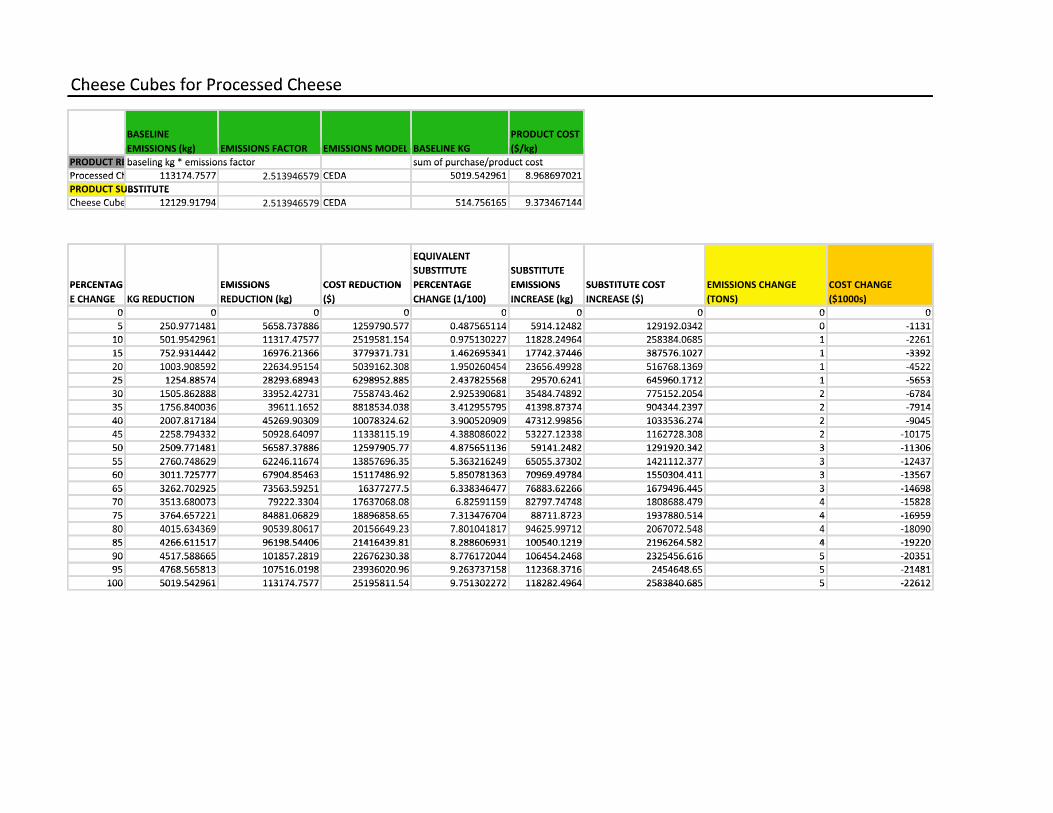
Cheese Cubes for Processed CheeseCheese Cubes for Processed CheeseCheese Cubes for Processed Cheese
BASELINE PRODUCT COSTBASELINE PRODUCT COST EMISSIONS (kg) EMISSIONS FACTOR EMISSIONS MODEL BASELINE KG ($/kg)EMISSIONS (kg) EMISSIONS FACTOR EMISSIONS MODEL BASELINE KG ($/kg)
PRODUCT REb li k * i i f f h / dPRODUCT REbaseling kg * emissions factor sum of purchase/product costPRODUCT REbaseling kg emissions factor sum of purchase/product costProcessed Ch 113174 7577 2 513946579 CEDA 5019 542961 8 968697021Processed Ch 113174.7577 2.513946579 CEDA 5019.542961 8.968697021PRODUCT SUBSTITUTEPRODUCT SUBSTITUTECheese Cube 12129 91794 2 513946579 CEDA 514 756165 9 373467144Cheese Cube 12129.91794 2.513946579 CEDA 514.756165 9.373467144
QEQUIVALENT EQUIVALENT SUBSTITUTE SUBSTITUTESUBSTITUTE SUBSTITUTE
PERCENTAG EMISSIONS COST REDUCTION PERCENTAGE EMISSIONS SUBSTITUTE COST EMISSIONS CHANGE COST CHANGEPERCENTAG EMISSIONS (k )
COST REDUCTION ($)
PERCENTAGE ( / )
EMISSIONS (k )
SUBSTITUTE COST ($)
EMISSIONS CHANGE ( )
COST CHANGE ($ )E CHANGE KG REDUCTION REDUCTION (kg) ($) CHANGE (1/100) INCREASE (kg) INCREASE ($) (TONS) ($1000s)E CHANGE KG REDUCTION REDUCTION (kg) ($) CHANGE (1/100) INCREASE (kg) INCREASE ($) (TONS) ($1000s)
0 0 0 0 0 0 0 0 00 0 0 0 0 0 0 0 05 250.9771481 5658.737886 1259790.577 0.487565114 5914.12482 129192.0342 0 ‐11315 250.9771481 5658.737886 1259790.577 0.487565114 5914.12482 129192.0342 0 ‐113110 501 9542961 11317 47577 2519581 154 0 975130227 11828 24964 258384 0685 1 226110 501.9542961 11317.47577 2519581.154 0.975130227 11828.24964 258384.0685 1 ‐226115 752 9314442 16976 21366 3779371 731 1 462695341 17742 37446 387576 1027 1 ‐339215 752.9314442 16976.21366 3779371.731 1.462695341 17742.37446 387576.1027 1 ‐339220 1003 908592 22634 95154 5039162 308 1 950260454 23656 49928 516768 1369 1 452220 1003.908592 22634.95154 5039162.308 1.950260454 23656.49928 516768.1369 1 ‐452220 1003.908592 22634.95154 5039162.308 1.950260454 23656.49928 516768.1369 1 452225 1254 88574 28293 68943 6298952 885 2 437825568 29570 6241 645960 1712 1 ‐565325 1254.88574 28293.68943 6298952.885 2.437825568 29570.6241 645960.1712 1 ‐565330 1505.862888 33952.42731 7558743.462 2.925390681 35484.74892 775152.2054 2 ‐678430 1505.862888 33952.42731 7558743.462 2.925390681 35484.74892 775152.2054 2 678435 1756 840036 39611 1652 8818534 038 3 412955795 41398 87374 904344 2397 2 791435 1756.840036 39611.1652 8818534.038 3.412955795 41398.87374 904344.2397 2 ‐791440 2007.817184 45269.90309 10078324.62 3.900520909 47312.99856 1033536.274 2 ‐904540 2007.817184 45269.90309 10078324.62 3.900520909 47312.99856 1033536.274 2 ‐904545 2258 794332 50928 64097 11338115 19 4 388086022 53227 12338 1162728 308 2 1017545 2258.794332 50928.64097 11338115.19 4.388086022 53227.12338 1162728.308 2 ‐1017550 2509 771481 56587 37886 12597905 77 4 875651136 59141 2482 1291920 342 3 ‐1130650 2509.771481 56587.37886 12597905.77 4.875651136 59141.2482 1291920.342 3 ‐1130655 2760.748629 62246.11674 13857696.35 5.363216249 65055.37302 1421112.377 3 ‐1243755 2760.748629 62246.11674 13857696.35 5.363216249 65055.37302 1421112.377 3 1243760 3011 725777 67904 85463 15117486 92 5 850781363 70969 49784 1550304 411 3 1356760 3011.725777 67904.85463 15117486.92 5.850781363 70969.49784 1550304.411 3 ‐1356765 3262.702925 73563.59251 16377277.5 6.338346477 76883.62266 1679496.445 3 ‐1469865 3262.702925 73563.59251 16377277.5 6.338346477 76883.62266 1679496.445 3 ‐1469870 3513 680073 79222 3304 17637068 08 6 82591159 82797 74748 1808688 479 4 1582870 3513.680073 79222.3304 17637068.08 6.82591159 82797.74748 1808688.479 4 ‐1582875 3764.657221 84881.06829 18896858.65 7.313476704 88711.8723 1937880.514 4 ‐1695975 3764.657221 84881.06829 18896858.65 7.313476704 88711.8723 1937880.514 4 ‐1695980 4015 634369 90539 80617 20156649 23 7 801041817 94625 99712 2067072 548 4 1809080 4015.634369 90539.80617 20156649.23 7.801041817 94625.99712 2067072.548 4 ‐1809080 4015.634369 90539.80617 20156649.23 7.801041817 94625.99712 2067072.548 4 1809085 4266 611517 96198 54406 21416439 81 8 288606931 100540 1219 2196264 582 4 ‐1922085 4266.611517 96198.54406 21416439.81 8.288606931 100540.1219 2196264.582 4 ‐1922090 4517.588665 101857.2819 22676230.38 8.776172044 106454.2468 2325456.616 5 ‐2035190 4517.588665 101857.2819 22676230.38 8.776172044 106454.2468 2325456.616 5 2035195 4768 565813 107516 0198 23936020 96 9 263737158 112368 3716 2454648 65 5 2148195 4768.565813 107516.0198 23936020.96 9.263737158 112368.3716 2454648.65 5 ‐21481100 5019.542961 113174.7577 25195811.54 9.751302272 118282.4964 2583840.685 5 ‐22612100 5019.542961 113174.7577 25195811.54 9.751302272 118282.4964 2583840.685 5 ‐22612
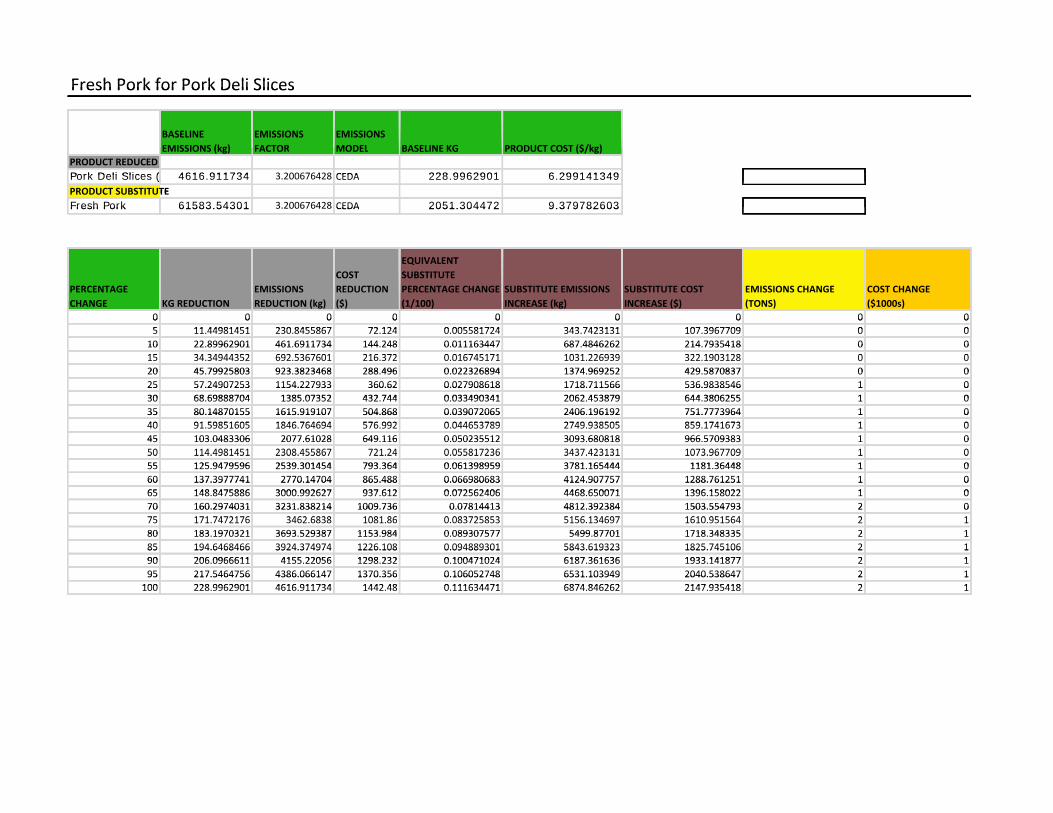
Fresh Pork for Pork Deli SlicesFresh Pork for Pork Deli SlicesFresh Pork for Pork Deli Slices
BASELINE EMISSIONS EMISSIONSBASELINE EMISSIONS EMISSIONS EMISSIONS (kg) FACTOR MODEL BASELINE KG PRODUCT COST ($/kg)EMISSIONS (kg) FACTOR MODEL BASELINE KG PRODUCT COST ($/kg)
PRODUCT REDUCEDPRODUCT REDUCEDPRODUCT REDUCEDPork Deli Slices ( 4616 911734 3 200676428 CEDA 228 9962901 6 299141349Pork Deli Slices ( 4616.911734 3.200676428 CEDA 228.9962901 6.299141349(PRODUCT SUBSTITUTEPRODUCT SUBSTITUTE
h k 6 83 30 20 30 2 9 3 9 82603Fresh Pork 61583.54301 3.200676428 CEDA 2051.304472 9.379782603Fresh Pork 61583.54301 3.200676428 CEDA 2051.304472 9.379782603
EQUIVALENTEQUIVALENT COST SUBSTITUTE
PERCENTAGE EMISSIONSCOST REDUCTION
SUBSTITUTE PERCENTAGE CHANGE SUBSTITUTE EMISSIONS SUBSTITUTE COST EMISSIONS CHANGE COST CHANGEPERCENTAGE EMISSIONS REDUCTION PERCENTAGE CHANGE SUBSTITUTE EMISSIONS SUBSTITUTE COST EMISSIONS CHANGE COST CHANGE
CHANGE KG REDUCTION REDUCTION (kg) ($) (1/100) INCREASE (kg) INCREASE ($) (TONS) ($1000s)CHANGE KG REDUCTION REDUCTION (kg) ($) (1/100) INCREASE (kg) INCREASE ($) (TONS) ($1000s)0 0 0 0 0 0 0 0 00 0 0 0 0 0 0 0 05 11 44981451 230 8455867 72 124 0 005581724 343 7423131 107 3967709 0 05 11.44981451 230.8455867 72.124 0.005581724 343.7423131 107.3967709 0 010 22.89962901 461.6911734 144.248 0.011163447 687.4846262 214.7935418 0 010 22.89962901 461.6911734 144.248 0.011163447 687.4846262 214.7935418 0 015 34 34944352 692 5367601 216 372 0 016745171 1031 226939 322 1903128 0 015 34.34944352 692.5367601 216.372 0.016745171 1031.226939 322.1903128 0 020 45 79925803 923 3823468 288 496 0 022326894 1374 969252 429 5870837 0 020 45.79925803 923.3823468 288.496 0.022326894 1374.969252 429.5870837 0 025 57.24907253 1154.227933 360.62 0.027908618 1718.711566 536.9838546 1 025 57.24907253 1154.227933 360.62 0.027908618 1718.711566 536.9838546 1 030 68 69888704 1385 07352 432 744 0 033490341 2062 453879 644 3806255 1 030 68.69888704 1385.07352 432.744 0.033490341 2062.453879 644.3806255 1 035 80.14870155 1615.919107 504.868 0.039072065 2406.196192 751.7773964 1 035 80.14870155 1615.919107 504.868 0.039072065 2406.196192 751.7773964 1 040 91 59851605 1846 764694 576 992 0 044653789 2749 938505 859 1741673 1 040 91.59851605 1846.764694 576.992 0.044653789 2749.938505 859.1741673 1 045 103 0483306 2077 61028 649 116 0 050235512 3093 680818 966 5709383 1 045 103.0483306 2077.61028 649.116 0.050235512 3093.680818 966.5709383 1 050 114 4981451 2308 455867 721 24 0 055817236 3437 423131 1073 967709 1 050 114.4981451 2308.455867 721.24 0.055817236 3437.423131 1073.967709 1 050 114.4981451 2308.455867 721.24 0.055817236 3437.423131 1073.967709 1 055 125 9479596 2539 301454 793 364 0 061398959 3781 165444 1181 36448 1 055 125.9479596 2539.301454 793.364 0.061398959 3781.165444 1181.36448 1 060 137.3977741 2770.14704 865.488 0.066980683 4124.907757 1288.761251 1 060 137.3977741 2770.14704 865.488 0.066980683 4124.907757 1288.761251 1 065 148 8475886 3000 992627 937 612 0 072562406 4468 650071 1396 158022 1 065 148.8475886 3000.992627 937.612 0.072562406 4468.650071 1396.158022 1 070 160.2974031 3231.838214 1009.736 0.07814413 4812.392384 1503.554793 2 070 160.2974031 3231.838214 1009.736 0.07814413 4812.392384 1503.554793 2 075 171 7472176 3462 6838 1081 86 0 083725853 5156 134697 1610 951564 2 175 171.7472176 3462.6838 1081.86 0.083725853 5156.134697 1610.951564 2 180 183 1970321 3693 529387 1153 984 0 089307577 5499 87701 1718 348335 2 180 183.1970321 3693.529387 1153.984 0.089307577 5499.87701 1718.348335 2 185 194.6468466 3924.374974 1226.108 0.094889301 5843.619323 1825.745106 2 185 194.6468466 3924.374974 1226.108 0.094889301 5843.619323 1825.745106 2 190 206 0966611 4155 22056 1298 232 0 100471024 6187 361636 1933 141877 2 190 206.0966611 4155.22056 1298.232 0.100471024 6187.361636 1933.141877 2 195 217.5464756 4386.066147 1370.356 0.106052748 6531.103949 2040.538647 2 195 217.5464756 4386.066147 1370.356 0.106052748 6531.103949 2040.538647 2 1100 228 9962901 4616 911734 1442 48 0 111634471 6874 846262 2147 935418 2 1100 228.9962901 4616.911734 1442.48 0.111634471 6874.846262 2147.935418 2 1
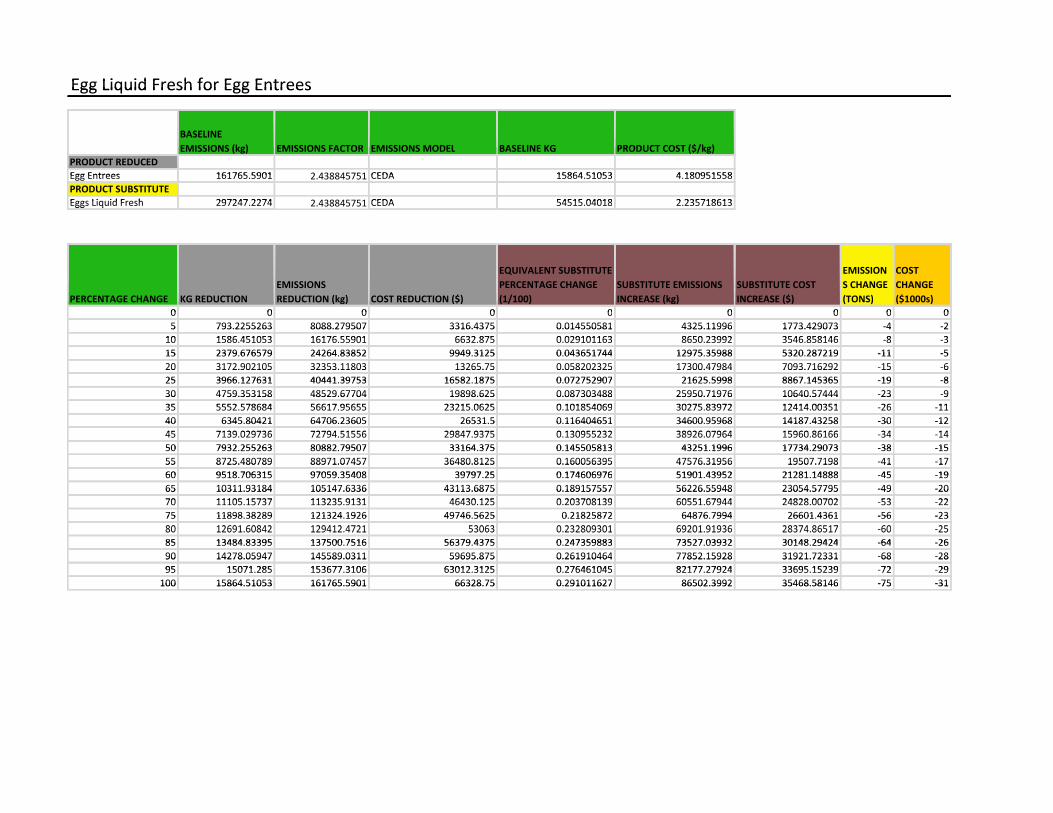
Egg Liquid Fresh for Egg EntreesEgg Liquid Fresh for Egg EntreesEgg Liquid Fresh for Egg Entrees
BASELINEBASELINE EMISSIONS (kg) EMISSIONS FACTOR EMISSIONS MODEL BASELINE KG PRODUCT COST ($/kg)EMISSIONS (kg) EMISSIONS FACTOR EMISSIONS MODEL BASELINE KG PRODUCT COST ($/kg)
PRODUCT REDUCEDPRODUCT REDUCEDPRODUCT REDUCEDEgg Entrees 161765 5901 2 438845751 CEDA 15864 51053 4 180951558Egg Entrees 161765.5901 2.438845751 CEDA 15864.51053 4.180951558PRODUCT SUBSTITUTEPRODUCT SUBSTITUTEEggs Liquid Fresh 297247 2274 2 438845751 CEDA 54515 04018 2 235718613Eggs Liquid Fresh 297247.2274 2.438845751 CEDA 54515.04018 2.235718613gg q
EQUIVALENT SUBSTITUTE EMISSION COSTEQUIVALENT SUBSTITUTE EMISSION COST EMISSIONS PERCENTAGE CHANGE SUBSTITUTE EMISSIONS SUBSTITUTE COST S CHANGE CHANGEEMISSIONS
(k ) ($)PERCENTAGE CHANGE ( / )
SUBSTITUTE EMISSIONS (k )
SUBSTITUTE COST ($)
S CHANGE ( )
CHANGE ($ )PERCENTAGE CHANGE KG REDUCTION REDUCTION (kg) COST REDUCTION ($) (1/100) INCREASE (kg) INCREASE ($) (TONS) ($1000s)PERCENTAGE CHANGE KG REDUCTION REDUCTION (kg) COST REDUCTION ($) (1/100) INCREASE (kg) INCREASE ($) (TONS) ($1000s)
0 0 0 0 0 0 0 0 00 0 0 0 0 0 0 0 05 793.2255263 8088.279507 3316.4375 0.014550581 4325.11996 1773.429073 ‐4 ‐25 793.2255263 8088.279507 3316.4375 0.014550581 4325.11996 1773.429073 ‐4 ‐210 1586 451053 16176 55901 6632 875 0 029101163 8650 23992 3546 858146 8 310 1586.451053 16176.55901 6632.875 0.029101163 8650.23992 3546.858146 ‐8 ‐315 2379 676579 24264 83852 9949 3125 0 043651744 12975 35988 5320 287219 ‐11 ‐515 2379.676579 24264.83852 9949.3125 0.043651744 12975.35988 5320.287219 ‐11 ‐520 3172 902105 32353 11803 13265 75 0 058202325 17300 47984 7093 716292 15 620 3172.902105 32353.11803 13265.75 0.058202325 17300.47984 7093.716292 ‐15 ‐620 3172.902105 32353.11803 13265.75 0.058202325 17300.47984 7093.716292 15 625 3966 127631 40441 39753 16582 1875 0 072752907 21625 5998 8867 145365 ‐19 ‐825 3966.127631 40441.39753 16582.1875 0.072752907 21625.5998 8867.145365 ‐19 ‐830 4759.353158 48529.67704 19898.625 0.087303488 25950.71976 10640.57444 ‐23 ‐930 4759.353158 48529.67704 19898.625 0.087303488 25950.71976 10640.57444 23 935 5552 578684 56617 95655 23215 0625 0 101854069 30275 83972 12414 00351 26 1135 5552.578684 56617.95655 23215.0625 0.101854069 30275.83972 12414.00351 ‐26 ‐1140 6345.80421 64706.23605 26531.5 0.116404651 34600.95968 14187.43258 ‐30 ‐1240 6345.80421 64706.23605 26531.5 0.116404651 34600.95968 14187.43258 ‐30 ‐1245 7139 029736 72794 51556 29847 9375 0 130955232 38926 07964 15960 86166 34 1445 7139.029736 72794.51556 29847.9375 0.130955232 38926.07964 15960.86166 ‐34 ‐1450 7932 255263 80882 79507 33164 375 0 145505813 43251 1996 17734 29073 ‐38 ‐1550 7932.255263 80882.79507 33164.375 0.145505813 43251.1996 17734.29073 ‐38 ‐1555 8725.480789 88971.07457 36480.8125 0.160056395 47576.31956 19507.7198 ‐41 ‐1755 8725.480789 88971.07457 36480.8125 0.160056395 47576.31956 19507.7198 41 1760 9518 706315 97059 35408 39797 25 0 174606976 51901 43952 21281 14888 45 1960 9518.706315 97059.35408 39797.25 0.174606976 51901.43952 21281.14888 ‐45 ‐1965 10311.93184 105147.6336 43113.6875 0.189157557 56226.55948 23054.57795 ‐49 ‐2065 10311.93184 105147.6336 43113.6875 0.189157557 56226.55948 23054.57795 ‐49 ‐2070 11105 15737 113235 9131 46430 125 0 203708139 60551 67944 24828 00702 53 2270 11105.15737 113235.9131 46430.125 0.203708139 60551.67944 24828.00702 ‐53 ‐2275 11898.38289 121324.1926 49746.5625 0.21825872 64876.7994 26601.4361 ‐56 ‐2375 11898.38289 121324.1926 49746.5625 0.21825872 64876.7994 26601.4361 ‐56 ‐2380 12691 60842 129412 4721 53063 0 232809301 69201 91936 28374 86517 60 2580 12691.60842 129412.4721 53063 0.232809301 69201.91936 28374.86517 ‐60 ‐2580 12691.60842 129412.4721 53063 0.232809301 69201.91936 28374.86517 60 2585 13484 83395 137500 7516 56379 4375 0 247359883 73527 03932 30148 29424 ‐64 ‐2685 13484.83395 137500.7516 56379.4375 0.247359883 73527.03932 30148.29424 ‐64 ‐2690 14278.05947 145589.0311 59695.875 0.261910464 77852.15928 31921.72331 ‐68 ‐2890 14278.05947 145589.0311 59695.875 0.261910464 77852.15928 31921.72331 68 2895 15071 285 153677 3106 63012 3125 0 276461045 82177 27924 33695 15239 72 2995 15071.285 153677.3106 63012.3125 0.276461045 82177.27924 33695.15239 ‐72 ‐29100 15864.51053 161765.5901 66328.75 0.291011627 86502.3992 35468.58146 ‐75 ‐31100 15864.51053 161765.5901 66328.75 0.291011627 86502.3992 35468.58146 ‐75 ‐31
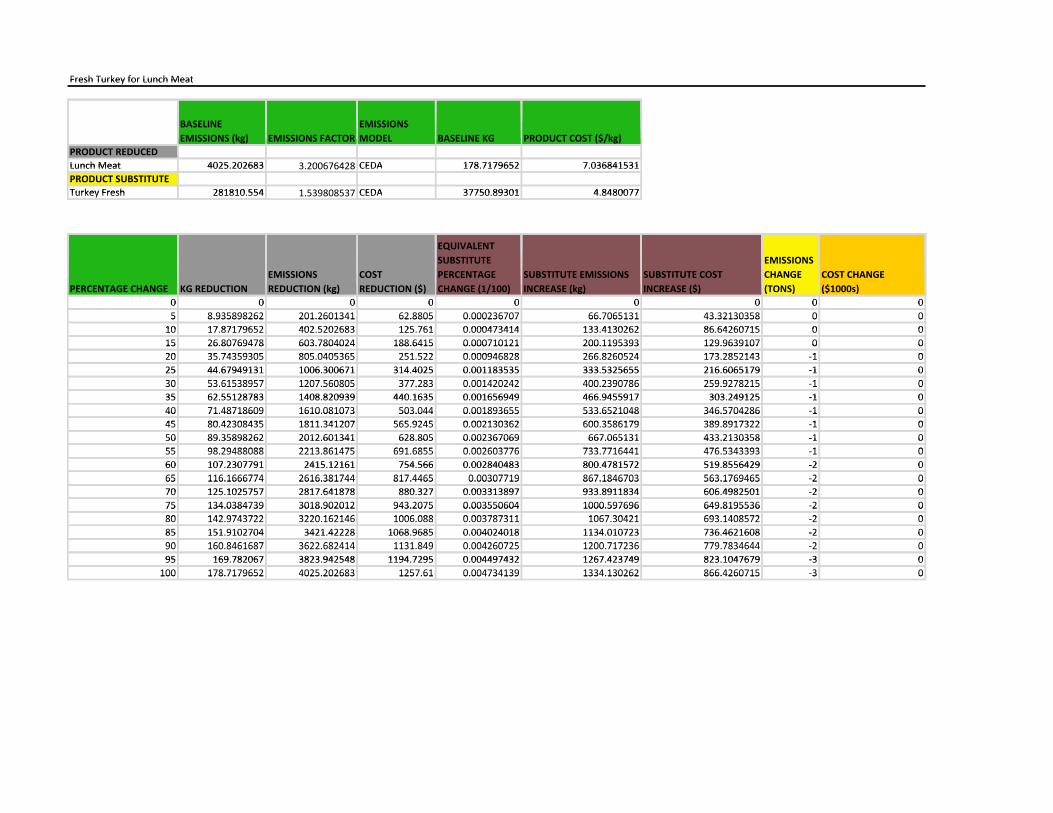
Fresh Turkey for Lunch MeatFresh Turkey for Lunch Meat
BASELINE EMISSIONSBASELINE EMISSIONS EMISSIONS (kg) EMISSIONS FACTOR MODEL BASELINE KG PRODUCT COST ($/kg)EMISSIONS (kg) EMISSIONS FACTOR MODEL BASELINE KG PRODUCT COST ($/kg)
PRODUCT REDUCEDPRODUCT REDUCEDLunch Meat 4025 202683 3 200676428 CEDA 178 7179652 7 036841531Lunch Meat 4025.202683 3.200676428 CEDA 178.7179652 7.036841531PRODUCT SUBSTITUTEPRODUCT SUBSTITUTEPRODUCT SUBSTITUTETurkey Fresh 281810 554 1 539808537 CEDA 37750 89301 4 8480077Turkey Fresh 281810.554 1.539808537 CEDA 37750.89301 4.8480077
EQUIVALENTEQUIVALENT QSUBSTITUTE EMISSIONSSUBSTITUTE EMISSIONS
EMISSIONS COST PERCENTAGE SUBSTITUTE EMISSIONS SUBSTITUTE COST CHANGE COST CHANGE PERCENTAGE CHANGE KG REDUCTION
EMISSIONS REDUCTION (k )
COST REDUCTION ($)
PERCENTAGE CHANGE (1/100)
SUBSTITUTE EMISSIONS INCREASE (k )
SUBSTITUTE COST INCREASE ($)
CHANGE (TONS)
COST CHANGE ($1000 )PERCENTAGE CHANGE KG REDUCTION REDUCTION (kg) REDUCTION ($) CHANGE (1/100) INCREASE (kg) INCREASE ($) (TONS) ($1000s)( g) ($) ( / ) ( g) ($) ( ) ($ )
0 0 0 0 0 0 0 0 00 0 0 0 0 0 0 0 08 93 898262 201 26013 1 62 880 0 000236 0 66 06 131 3 321303 8 0 05 8.935898262 201.2601341 62.8805 0.000236707 66.7065131 43.32130358 0 05 8.935898262 201.2601341 62.8805 0.000236707 66.7065131 43.32130358 0 0
10 17 87179652 402 5202683 125 761 0 000473414 133 4130262 86 64260715 0 010 17.87179652 402.5202683 125.761 0.000473414 133.4130262 86.64260715 0 015 26.80769478 603.7804024 188.6415 0.000710121 200.1195393 129.9639107 0 015 26.80769478 603.7804024 188.6415 0.000710121 200.1195393 129.9639107 0 020 35 74359305 805 0405365 251 522 0 000946828 266 8260524 173 2852143 1 020 35.74359305 805.0405365 251.522 0.000946828 266.8260524 173.2852143 ‐1 025 44.67949131 1006.300671 314.4025 0.001183535 333.5325655 216.6065179 ‐1 025 44.67949131 1006.300671 314.4025 0.001183535 333.5325655 216.6065179 ‐1 030 53 61538957 1207 560805 377 283 0 001420242 400 2390786 259 9278215 1 030 53.61538957 1207.560805 377.283 0.001420242 400.2390786 259.9278215 ‐1 030 53.61538957 1207.560805 377.283 0.001420242 400.2390786 259.9278215 1 035 62 55128783 1408 820939 440 1635 0 001656949 466 9455917 303 249125 ‐1 035 62.55128783 1408.820939 440.1635 0.001656949 466.9455917 303.249125 ‐1 040 71.48718609 1610.081073 503.044 0.001893655 533.6521048 346.5704286 ‐1 040 71.48718609 1610.081073 503.044 0.001893655 533.6521048 346.5704286 1 045 80 42308435 1811 341207 565 9245 0 002130362 600 3586179 389 8917322 1 045 80.42308435 1811.341207 565.9245 0.002130362 600.3586179 389.8917322 ‐1 050 89.35898262 2012.601341 628.805 0.002367069 667.065131 433.2130358 ‐1 050 89.35898262 2012.601341 628.805 0.002367069 667.065131 433.2130358 ‐1 055 98 29488088 2213 861475 691 6855 0 002603776 733 7716441 476 5343393 1 055 98.29488088 2213.861475 691.6855 0.002603776 733.7716441 476.5343393 ‐1 060 107 2307791 2415 12161 754 566 0 002840483 800 4781572 519 8556429 ‐2 060 107.2307791 2415.12161 754.566 0.002840483 800.4781572 519.8556429 ‐2 065 116 1666774 2616 381744 817 4465 0 00307719 867 1846703 563 1769465 2 065 116.1666774 2616.381744 817.4465 0.00307719 867.1846703 563.1769465 ‐2 065 116.1666774 2616.381744 817.4465 0.00307719 867.1846703 563.1769465 2 070 125 1025757 2817 641878 880 327 0 003313897 933 8911834 606 4982501 2 070 125.1025757 2817.641878 880.327 0.003313897 933.8911834 606.4982501 ‐2 075 134.0384739 3018.902012 943.2075 0.003550604 1000.597696 649.8195536 ‐2 075 134.0384739 3018.902012 943.2075 0.003550604 1000.597696 649.8195536 2 080 142 9743722 3220 162146 1006 088 0 003787311 1067 30421 693 1408572 2 080 142.9743722 3220.162146 1006.088 0.003787311 1067.30421 693.1408572 ‐2 085 151.9102704 3421.42228 1068.9685 0.004024018 1134.010723 736.4621608 ‐2 085 151.9102704 3421.42228 1068.9685 0.004024018 1134.010723 736.4621608 ‐2 090 160 8461687 3622 682414 1131 849 0 004260725 1200 717236 779 7834644 2 090 160.8461687 3622.682414 1131.849 0.004260725 1200.717236 779.7834644 ‐2 090 160.8461687 3622.682414 1131.849 0.004260725 1200.717236 779.7834644 2 095 169 782067 3823 942548 1194 7295 0 004497432 1267 423749 823 1047679 ‐3 095 169.782067 3823.942548 1194.7295 0.004497432 1267.423749 823.1047679 ‐3 0100 178.7179652 4025.202683 1257.61 0.004734139 1334.130262 866.4260715 ‐3 0100 178.7179652 4025.202683 1257.61 0.004734139 1334.130262 866.4260715 3 0
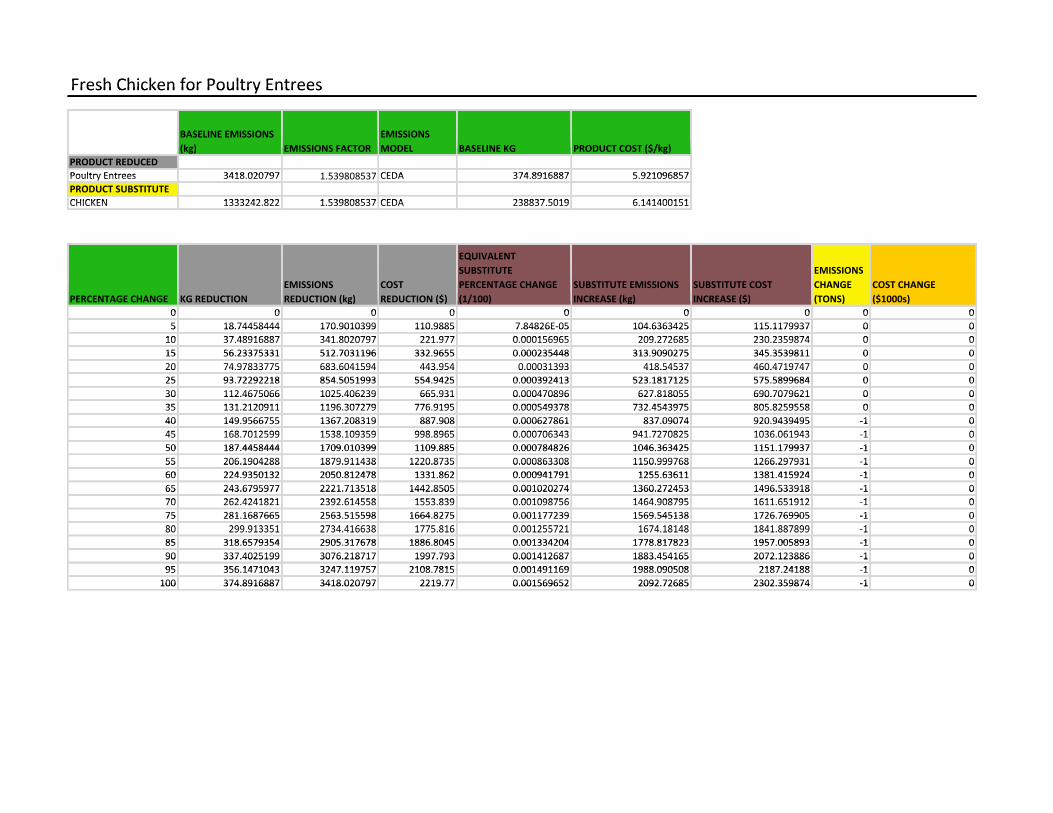
Fresh Chicken for Poultry EntreesFresh Chicken for Poultry EntreesFresh Chicken for Poultry Entrees
BASELINE EMISSIONS EMISSIONSBASELINE EMISSIONS EMISSIONS (kg) EMISSIONS FACTOR MODEL BASELINE KG PRODUCT COST ($/kg)(kg) EMISSIONS FACTOR MODEL BASELINE KG PRODUCT COST ($/kg)
PRODUCT REDUCEDPRODUCT REDUCEDPRODUCT REDUCEDPoultry Entrees 3418 020797 1 539808537 CEDA 374 8916887 5 921096857Poultry Entrees 3418.020797 1.539808537 CEDA 374.8916887 5.921096857PRODUCT SUBSTITUTEPRODUCT SUBSTITUTECHICKEN 1333242 822 1 539808537 CEDA 238837 5019 6 141400151CHICKEN 1333242.822 1.539808537 CEDA 238837.5019 6.141400151
QEQUIVALENT EQUIVALENT SUBSTITUTE EMISSIONSSUBSTITUTE EMISSIONS
EMISSIONS COST PERCENTAGE CHANGE SUBSTITUTE EMISSIONS SUBSTITUTE COST CHANGE COST CHANGEEMISSIONS (k )
COST ($)
PERCENTAGE CHANGE ( / )
SUBSTITUTE EMISSIONS (k )
SUBSTITUTE COST ($)
CHANGE ( )
COST CHANGE ($ )PERCENTAGE CHANGE KG REDUCTION REDUCTION (kg) REDUCTION ($) (1/100) INCREASE (kg) INCREASE ($) (TONS) ($1000s)PERCENTAGE CHANGE KG REDUCTION REDUCTION (kg) REDUCTION ($) (1/100) INCREASE (kg) INCREASE ($) (TONS) ($1000s)
0 0 0 0 0 0 0 0 00 0 0 0 0 0 0 0 05 18.74458444 170.9010399 110.9885 7.84826E‐05 104.6363425 115.1179937 0 05 18.74458444 170.9010399 110.9885 7.84826E‐05 104.6363425 115.1179937 0 010 37 48916887 341 8020797 221 977 0 000156965 209 272685 230 2359874 0 010 37.48916887 341.8020797 221.977 0.000156965 209.272685 230.2359874 0 015 56 23375331 512 7031196 332 9655 0 000235448 313 9090275 345 3539811 0 015 56.23375331 512.7031196 332.9655 0.000235448 313.9090275 345.3539811 0 020 74 97833775 683 6041594 443 954 0 00031393 418 54537 460 4719747 0 020 74.97833775 683.6041594 443.954 0.00031393 418.54537 460.4719747 0 020 74.97833775 683.6041594 443.954 0.00031393 418.54537 460.4719747 0 025 93 72292218 854 5051993 554 9425 0 000392413 523 1817125 575 5899684 0 025 93.72292218 854.5051993 554.9425 0.000392413 523.1817125 575.5899684 0 030 112.4675066 1025.406239 665.931 0.000470896 627.818055 690.7079621 0 030 112.4675066 1025.406239 665.931 0.000470896 627.818055 690.7079621 0 035 131 2120911 1196 307279 776 9195 0 000549378 732 4543975 805 8259558 0 035 131.2120911 1196.307279 776.9195 0.000549378 732.4543975 805.8259558 0 040 149.9566755 1367.208319 887.908 0.000627861 837.09074 920.9439495 ‐1 040 149.9566755 1367.208319 887.908 0.000627861 837.09074 920.9439495 ‐1 045 168 7012599 1538 109359 998 8965 0 000706343 941 7270825 1036 061943 1 045 168.7012599 1538.109359 998.8965 0.000706343 941.7270825 1036.061943 ‐1 050 187 4458444 1709 010399 1109 885 0 000784826 1046 363425 1151 179937 ‐1 050 187.4458444 1709.010399 1109.885 0.000784826 1046.363425 1151.179937 ‐1 055 206.1904288 1879.911438 1220.8735 0.000863308 1150.999768 1266.297931 ‐1 055 206.1904288 1879.911438 1220.8735 0.000863308 1150.999768 1266.297931 1 060 224 9350132 2050 812478 1331 862 0 000941791 1255 63611 1381 415924 1 060 224.9350132 2050.812478 1331.862 0.000941791 1255.63611 1381.415924 ‐1 065 243.6795977 2221.713518 1442.8505 0.001020274 1360.272453 1496.533918 ‐1 065 243.6795977 2221.713518 1442.8505 0.001020274 1360.272453 1496.533918 ‐1 070 262 4241821 2392 614558 1553 839 0 001098756 1464 908795 1611 651912 1 070 262.4241821 2392.614558 1553.839 0.001098756 1464.908795 1611.651912 ‐1 075 281.1687665 2563.515598 1664.8275 0.001177239 1569.545138 1726.769905 ‐1 075 281.1687665 2563.515598 1664.8275 0.001177239 1569.545138 1726.769905 ‐1 080 299 913351 2734 416638 1775 816 0 001255721 1674 18148 1841 887899 1 080 299.913351 2734.416638 1775.816 0.001255721 1674.18148 1841.887899 ‐1 080 299.913351 2734.416638 1775.816 0.001255721 1674.18148 1841.887899 1 085 318 6579354 2905 317678 1886 8045 0 001334204 1778 817823 1957 005893 ‐1 085 318.6579354 2905.317678 1886.8045 0.001334204 1778.817823 1957.005893 ‐1 090 337.4025199 3076.218717 1997.793 0.001412687 1883.454165 2072.123886 ‐1 090 337.4025199 3076.218717 1997.793 0.001412687 1883.454165 2072.123886 1 095 356 1471043 3247 119757 2108 7815 0 001491169 1988 090508 2187 24188 1 095 356.1471043 3247.119757 2108.7815 0.001491169 1988.090508 2187.24188 ‐1 0100 374.8916887 3418.020797 2219.77 0.001569652 2092.72685 2302.359874 ‐1 0100 374.8916887 3418.020797 2219.77 0.001569652 2092.72685 2302.359874 ‐1 0
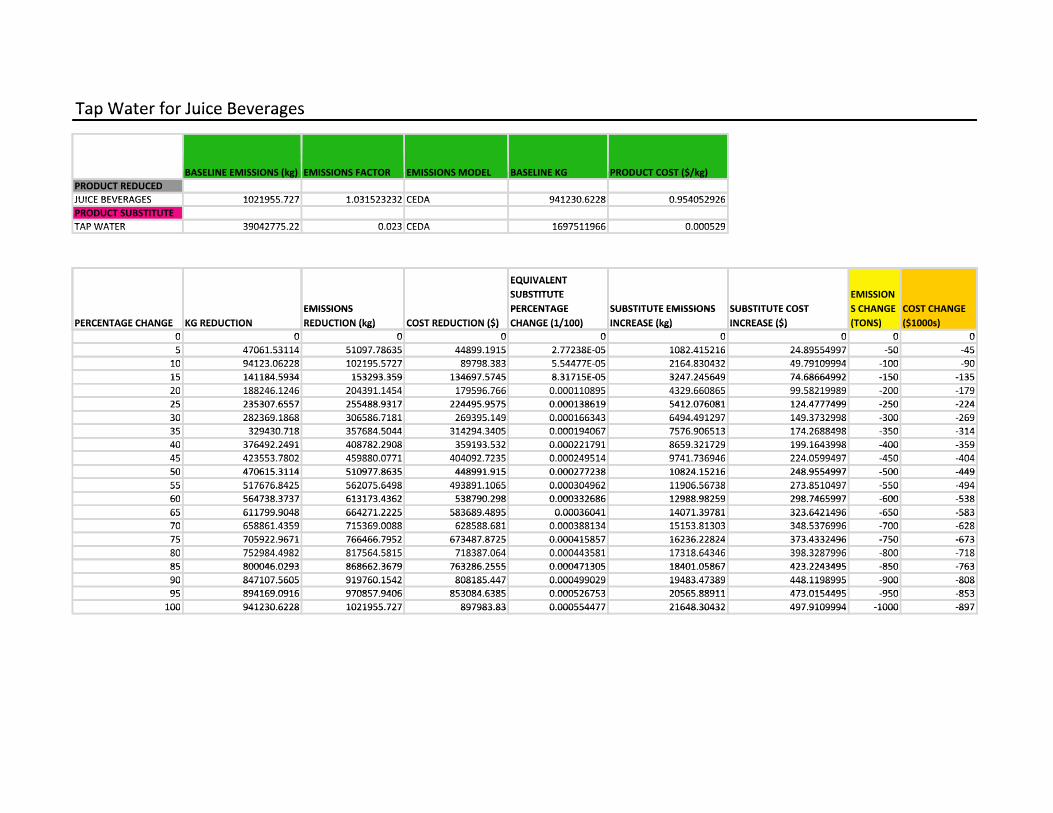
Tap Water for Juice BeveragesTap Water for Juice BeveragesTap Water for Juice Beverages
BASELINE EMISSIONS (kg) EMISSIONS FACTOR EMISSIONS MODEL BASELINE KG PRODUCT COST ($/kg)BASELINE EMISSIONS (kg) EMISSIONS FACTOR EMISSIONS MODEL BASELINE KG PRODUCT COST ($/kg)PRODUCT REDUCEDPRODUCT REDUCEDPRODUCT REDUCEDJUICE BEVERAGES 1021955 727 1 031523232 CEDA 941230 6228 0 954052926JUICE BEVERAGES 1021955.727 1.031523232 CEDA 941230.6228 0.954052926PRODUCT SUBSTITUTEPRODUCT SUBSTITUTETAP WATER 39042775 22 0 023 CEDA 1697511966 0 000529TAP WATER 39042775.22 0.023 CEDA 1697511966 0.000529
QEQUIVALENT EQUIVALENT SUBSTITUTE EMISSIONSUBSTITUTE EMISSION
EMISSIONS PERCENTAGE SUBSTITUTE EMISSIONS SUBSTITUTE COST S CHANGE COST CHANGEEMISSIONS (k ) ($)
PERCENTAGE ( / )
SUBSTITUTE EMISSIONS (k )
SUBSTITUTE COST ($)
S CHANGE ( )
COST CHANGE ($ )PERCENTAGE CHANGE KG REDUCTION REDUCTION (kg) COST REDUCTION ($) CHANGE (1/100) INCREASE (kg) INCREASE ($) (TONS) ($1000s)PERCENTAGE CHANGE KG REDUCTION REDUCTION (kg) COST REDUCTION ($) CHANGE (1/100) INCREASE (kg) INCREASE ($) (TONS) ($1000s)
0 0 0 0 0 0 0 0 00 0 0 0 0 0 0 0 05 47061.53114 51097.78635 44899.1915 2.77238E‐05 1082.415216 24.89554997 ‐50 ‐455 47061.53114 51097.78635 44899.1915 2.77238E‐05 1082.415216 24.89554997 ‐50 ‐4510 94123 06228 102195 5727 89798 383 5 54477E 05 2164 830432 49 79109994 100 9010 94123.06228 102195.5727 89798.383 5.54477E‐05 2164.830432 49.79109994 ‐100 ‐9015 141184 5934 153293 359 134697 5745 8 31715E‐05 3247 245649 74 68664992 ‐150 ‐13515 141184.5934 153293.359 134697.5745 8.31715E‐05 3247.245649 74.68664992 ‐150 ‐13520 188246 1246 204391 1454 179596 766 0 000110895 4329 660865 99 58219989 200 17920 188246.1246 204391.1454 179596.766 0.000110895 4329.660865 99.58219989 ‐200 ‐17920 188246.1246 204391.1454 179596.766 0.000110895 4329.660865 99.58219989 200 17925 235307 6557 255488 9317 224495 9575 0 000138619 5412 076081 124 4777499 ‐250 ‐22425 235307.6557 255488.9317 224495.9575 0.000138619 5412.076081 124.4777499 ‐250 ‐22430 282369.1868 306586.7181 269395.149 0.000166343 6494.491297 149.3732998 ‐300 ‐26930 282369.1868 306586.7181 269395.149 0.000166343 6494.491297 149.3732998 300 26935 329430 718 357684 5044 314294 3405 0 000194067 7576 906513 174 2688498 350 31435 329430.718 357684.5044 314294.3405 0.000194067 7576.906513 174.2688498 ‐350 ‐31440 376492.2491 408782.2908 359193.532 0.000221791 8659.321729 199.1643998 ‐400 ‐35940 376492.2491 408782.2908 359193.532 0.000221791 8659.321729 199.1643998 ‐400 ‐35945 423553 7802 459880 0771 404092 7235 0 000249514 9741 736946 224 0599497 450 40445 423553.7802 459880.0771 404092.7235 0.000249514 9741.736946 224.0599497 ‐450 ‐40450 470615 3114 510977 8635 448991 915 0 000277238 10824 15216 248 9554997 ‐500 ‐44950 470615.3114 510977.8635 448991.915 0.000277238 10824.15216 248.9554997 ‐500 ‐44955 517676.8425 562075.6498 493891.1065 0.000304962 11906.56738 273.8510497 ‐550 ‐49455 517676.8425 562075.6498 493891.1065 0.000304962 11906.56738 273.8510497 550 49460 564738 3737 613173 4362 538790 298 0 000332686 12988 98259 298 7465997 600 53860 564738.3737 613173.4362 538790.298 0.000332686 12988.98259 298.7465997 ‐600 ‐53865 611799.9048 664271.2225 583689.4895 0.00036041 14071.39781 323.6421496 ‐650 ‐58365 611799.9048 664271.2225 583689.4895 0.00036041 14071.39781 323.6421496 ‐650 ‐58370 658861 4359 715369 0088 628588 681 0 000388134 15153 81303 348 5376996 700 62870 658861.4359 715369.0088 628588.681 0.000388134 15153.81303 348.5376996 ‐700 ‐62875 705922.9671 766466.7952 673487.8725 0.000415857 16236.22824 373.4332496 ‐750 ‐67375 705922.9671 766466.7952 673487.8725 0.000415857 16236.22824 373.4332496 ‐750 ‐67380 752984 4982 817564 5815 718387 064 0 000443581 17318 64346 398 3287996 800 71880 752984.4982 817564.5815 718387.064 0.000443581 17318.64346 398.3287996 ‐800 ‐71880 752984.4982 817564.5815 718387.064 0.000443581 17318.64346 398.3287996 800 71885 800046 0293 868662 3679 763286 2555 0 000471305 18401 05867 423 2243495 ‐850 ‐76385 800046.0293 868662.3679 763286.2555 0.000471305 18401.05867 423.2243495 ‐850 ‐76390 847107.5605 919760.1542 808185.447 0.000499029 19483.47389 448.1198995 ‐900 ‐80890 847107.5605 919760.1542 808185.447 0.000499029 19483.47389 448.1198995 900 80895 894169 0916 970857 9406 853084 6385 0 000526753 20565 88911 473 0154495 950 85395 894169.0916 970857.9406 853084.6385 0.000526753 20565.88911 473.0154495 ‐950 ‐853100 941230.6228 1021955.727 897983.83 0.000554477 21648.30432 497.9109994 ‐1000 ‐897100 941230.6228 1021955.727 897983.83 0.000554477 21648.30432 497.9109994 ‐1000 ‐897
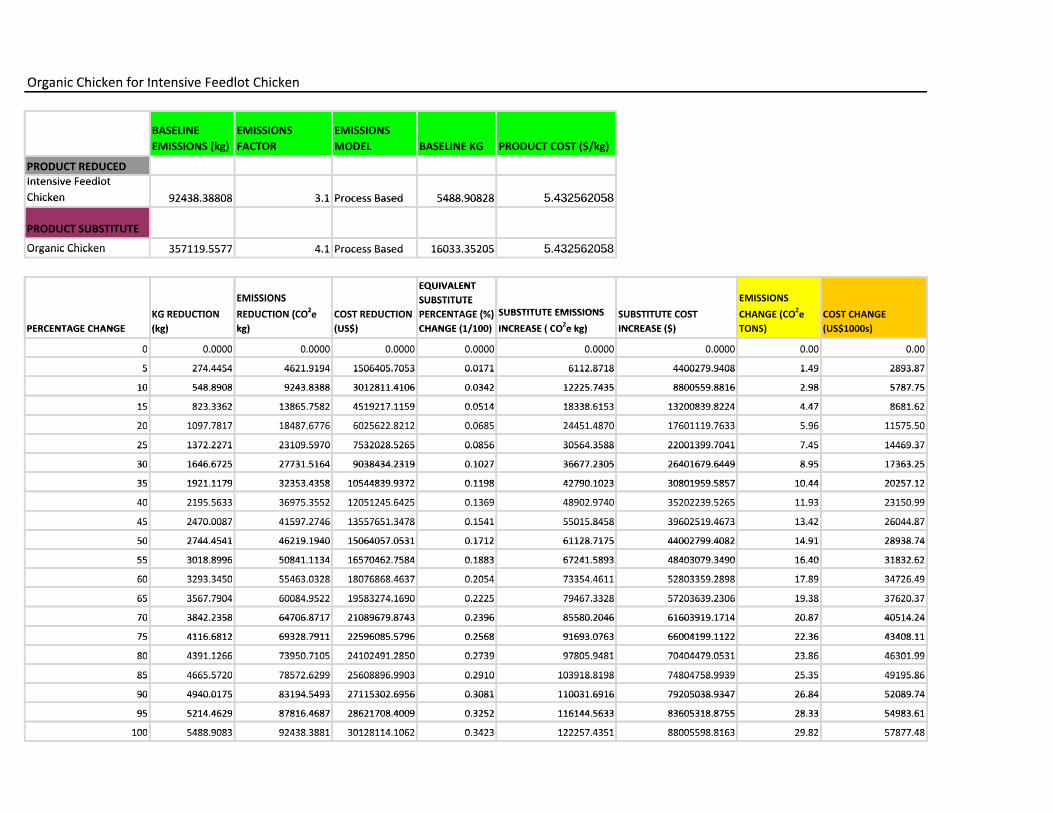
Organic Chicken for Intensive Feedlot ChickenOrganic Chicken for Intensive Feedlot ChickenOrganic Chicken for Intensive Feedlot Chicken
BASELINE EMISSIONS EMISSIONS BASELINE EMISSIONS EMISSIONS BASELINE
EMISSIONS (kg)
EMISSIONS
FACTOR
EMISSIONS
MODEL BASELINE KG PRODUCT COST ($/kg)EMISSIONS (kg) FACTOR MODEL BASELINE KG PRODUCT COST ($/kg)EMISSIONS (kg) FACTOR MODEL BASELINE KG PRODUCT COST ($/kg)
PRODUCT REDUCEDPRODUCT REDUCED
Intensive Feedlot Intensive Feedlot
Chicken 92438.38808 3.1 Process Based 5488.90828 5.432562058Chicken 92438.38808 3.1 Process Based 5488.90828 5.432562058Chicken 92438.38808 3.1 Process Based 5488.90828 5.432562058
PRODUCT SUBSTITUTEPRODUCT SUBSTITUTEPRODUCT SUBSTITUTE
Organic Chicken 357119.5577 4.1 Process Based 16033.35205 5.432562058Organic Chicken 357119.5577 4.1 Process Based 16033.35205 5.432562058Organic Chicken 357119.5577 4.1 Process Based 16033.35205 5.432562058
EQUIVALENT
EMISSIONS
EQUIVALENT
SUBSTITUTE EMISSIONS EMISSIONS SUBSTITUTE EMISSIONS
KG REDUCTION
EMISSIONS
REDUCTION (CO2e COST REDUCTION
SUBSTITUTE
PERCENTAGE (%) SUBSTITUTE EMISSIONS SUBSTITUTE COST
EMISSIONS
CHANGE (CO2e COST CHANGE KG REDUCTION REDUCTION (CO
2e COST REDUCTION PERCENTAGE (%) SUBSTITUTE EMISSIONS
2
SUBSTITUTE COST CHANGE (CO2e COST CHANGE
PERCENTAGE CHANGE
KG REDUCTION
(kg)
REDUCTION (CO e
kg)
COST REDUCTION
(US$)
PERCENTAGE (%)
CHANGE (1/100) INCREASE ( CO2e kg)
SUBSTITUTE COST
INCREASE ($)
CHANGE (CO e
TONS)
COST CHANGE
(US$1000s)PERCENTAGE CHANGE (kg) kg) (US$) CHANGE (1/100) INCREASE ( CO2e kg) INCREASE ($) TONS) (US$1000s)
0 0.0000 0.0000 0.0000 0.0000 0.0000 0.0000 0.00 0.000 0.0000 0.0000 0.0000 0.0000 0.0000 0.0000 0.00 0.000 0.0000 0.0000 0.0000 0.0000 0.0000 0.0000 0.00 0.00
5 274.4454 4621.9194 1506405.7053 0.0171 6112.8718 4400279.9408 1.49 2893.875 274.4454 4621.9194 1506405.7053 0.0171 6112.8718 4400279.9408 1.49 2893.875 274.4454 4621.9194 1506405.7053 0.0171 6112.8718 4400279.9408 1.49 2893.87
10 548.8908 9243.8388 3012811.4106 0.0342 12225.7435 8800559.8816 2.98 5787.7510 548.8908 9243.8388 3012811.4106 0.0342 12225.7435 8800559.8816 2.98 5787.7510 548.8908 9243.8388 3012811.4106 0.0342 12225.7435 8800559.8816 2.98 5787.75
15 823.3362 13865.7582 4519217.1159 0.0514 18338.6153 13200839.8224 4.47 8681.6215 823.3362 13865.7582 4519217.1159 0.0514 18338.6153 13200839.8224 4.47 8681.62
20 1097.7817 18487.6776 6025622.8212 0.0685 24451.4870 17601119.7633 5.96 11575.5020 1097.7817 18487.6776 6025622.8212 0.0685 24451.4870 17601119.7633 5.96 11575.5020 1097.7817 18487.6776 6025622.8212 0.0685 24451.4870 17601119.7633 5.96 11575.50
25 1372.2271 23109.5970 7532028.5265 0.0856 30564.3588 22001399.7041 7.45 14469.3725 1372.2271 23109.5970 7532028.5265 0.0856 30564.3588 22001399.7041 7.45 14469.3725 1372.2271 23109.5970 7532028.5265 0.0856 30564.3588 22001399.7041 7.45 14469.37
30 1646.6725 27731.5164 9038434.2319 0.1027 36677.2305 26401679.6449 8.95 17363.2530 1646.6725 27731.5164 9038434.2319 0.1027 36677.2305 26401679.6449 8.95 17363.2530 1646.6725 27731.5164 9038434.2319 0.1027 36677.2305 26401679.6449 8.95 17363.25
35 1921.1179 32353.4358 10544839.9372 0.1198 42790.1023 30801959.5857 10.44 20257.1235 1921.1179 32353.4358 10544839.9372 0.1198 42790.1023 30801959.5857 10.44 20257.12
40 2195.5633 36975.3552 12051245.6425 0.1369 48902.9740 35202239.5265 11.93 23150.9940 2195.5633 36975.3552 12051245.6425 0.1369 48902.9740 35202239.5265 11.93 23150.9940 2195.5633 36975.3552 12051245.6425 0.1369 48902.9740 35202239.5265 11.93 23150.99
45 2470.0087 41597.2746 13557651.3478 0.1541 55015.8458 39602519.4673 13.42 26044.8745 2470.0087 41597.2746 13557651.3478 0.1541 55015.8458 39602519.4673 13.42 26044.8745 2470.0087 41597.2746 13557651.3478 0.1541 55015.8458 39602519.4673 13.42 26044.87
50 2744.4541 46219.1940 15064057.0531 0.1712 61128.7175 44002799.4082 14.91 28938.7450 2744.4541 46219.1940 15064057.0531 0.1712 61128.7175 44002799.4082 14.91 28938.7450 2744.4541 46219.1940 15064057.0531 0.1712 61128.7175 44002799.4082 14.91 28938.74
55 3018.8996 50841.1134 16570462.7584 0.1883 67241.5893 48403079.3490 16.40 31832.6255 3018.8996 50841.1134 16570462.7584 0.1883 67241.5893 48403079.3490 16.40 31832.62
60 3293.3450 55463.0328 18076868.4637 0.2054 73354.4611 52803359.2898 17.89 34726.4960 3293.3450 55463.0328 18076868.4637 0.2054 73354.4611 52803359.2898 17.89 34726.4960 3293.3450 55463.0328 18076868.4637 0.2054 73354.4611 52803359.2898 17.89 34726.49
65 3567.7904 60084.9522 19583274.1690 0.2225 79467.3328 57203639.2306 19.38 37620.3765 3567.7904 60084.9522 19583274.1690 0.2225 79467.3328 57203639.2306 19.38 37620.3765 3567.7904 60084.9522 19583274.1690 0.2225 79467.3328 57203639.2306 19.38 37620.37
70 3842.2358 64706.8717 21089679.8743 0.2396 85580.2046 61603919.1714 20.87 40514.2470 3842.2358 64706.8717 21089679.8743 0.2396 85580.2046 61603919.1714 20.87 40514.2470 3842.2358 64706.8717 21089679.8743 0.2396 85580.2046 61603919.1714 20.87 40514.24
75 4116.6812 69328.7911 22596085.5796 0.2568 91693.0763 66004199.1122 22.36 43408.1175 4116.6812 69328.7911 22596085.5796 0.2568 91693.0763 66004199.1122 22.36 43408.11
80 4391.1266 73950.7105 24102491.2850 0.2739 97805.9481 70404479.0531 23.86 46301.9980 4391.1266 73950.7105 24102491.2850 0.2739 97805.9481 70404479.0531 23.86 46301.9980 4391.1266 73950.7105 24102491.2850 0.2739 97805.9481 70404479.0531 23.86 46301.99
85 4665.5720 78572.6299 25608896.9903 0.2910 103918.8198 74804758.9939 25.35 49195.8685 4665.5720 78572.6299 25608896.9903 0.2910 103918.8198 74804758.9939 25.35 49195.8685 4665.5720 78572.6299 25608896.9903 0.2910 103918.8198 74804758.9939 25.35 49195.86
90 4940.0175 83194.5493 27115302.6956 0.3081 110031.6916 79205038.9347 26.84 52089.7490 4940.0175 83194.5493 27115302.6956 0.3081 110031.6916 79205038.9347 26.84 52089.7490 4940.0175 83194.5493 27115302.6956 0.3081 110031.6916 79205038.9347 26.84 52089.74
95 5214.4629 87816.4687 28621708.4009 0.3252 116144.5633 83605318.8755 28.33 54983.6195 5214.4629 87816.4687 28621708.4009 0.3252 116144.5633 83605318.8755 28.33 54983.61
100 5488.9083 92438.3881 30128114.1062 0.3423 122257.4351 88005598.8163 29.82 57877.48100 5488.9083 92438.3881 30128114.1062 0.3423 122257.4351 88005598.8163 29.82 57877.48100 5488.9083 92438.3881 30128114.1062 0.3423 122257.4351 88005598.8163 29.82 57877.48
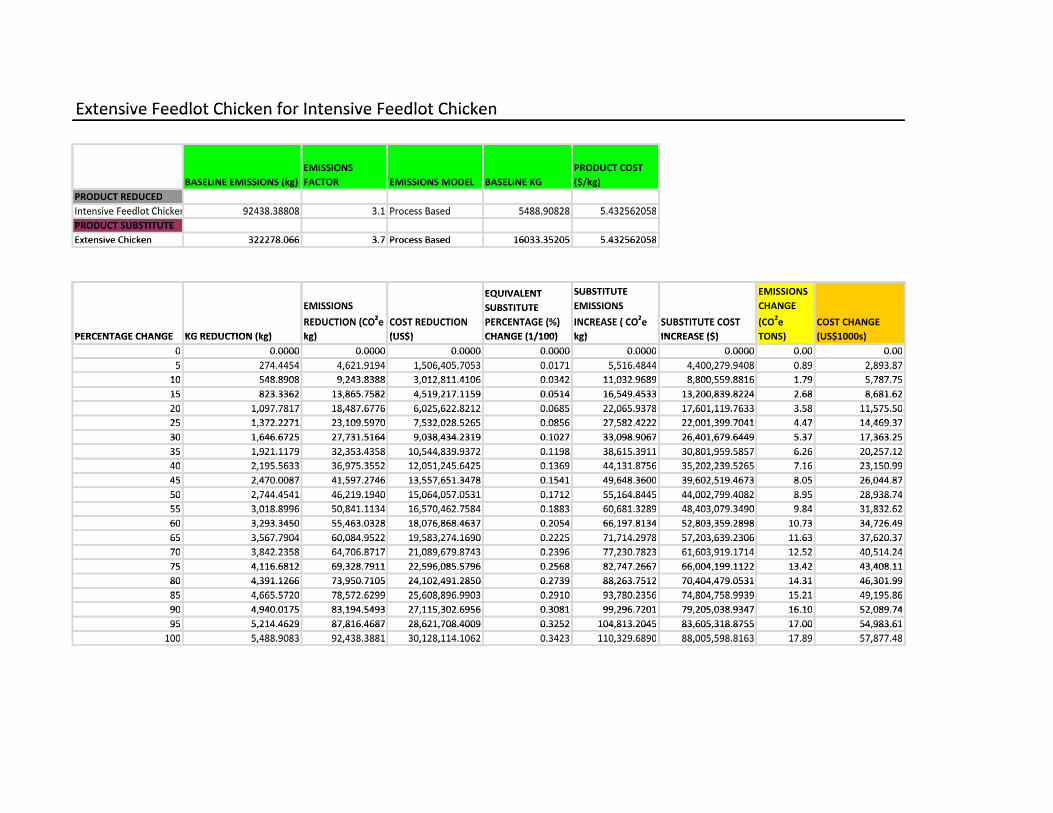
Extensive Feedlot Chicken for Intensive Feedlot ChickenExtensive Feedlot Chicken for Intensive Feedlot ChickenExtensive Feedlot Chicken for Intensive Feedlot Chicken
EMISSIONS PRODUCT COST EMISSIONS PRODUCT COST
BASELINE EMISSIONS (kg)
EMISSIONS
FACTOR EMISSIONS MODEL BASELINE KG
PRODUCT COST
($/kg)BASELINE EMISSIONS (kg) FACTOR EMISSIONS MODEL BASELINE KG ($/kg)
PRODUCT REDUCEDPRODUCT REDUCEDPRODUCT REDUCED
Intensive Feedlot Chicken 92438.38808 3.1 Process Based 5488.90828 5.432562058Intensive Feedlot Chicken 92438.38808 3.1 Process Based 5488.90828 5.432562058Intensive Feedlot Chicken 92438.38808 3.1 Process Based 5488.90828 5.432562058
PRODUCT SUBSTITUTEPRODUCT SUBSTITUTE
Extensive Chicken 322278.066 3.7 Process Based 16033.35205 5.432562058Extensive Chicken 322278.066 3.7 Process Based 16033.35205 5.432562058Extensive Chicken 322278.066 3.7 Process Based 16033.35205 5.432562058
SUBSTITUTE EMISSIONS EQUIVALENT SUBSTITUTE EMISSIONS
EMISSIONS
EQUIVALENT
SUBSTITUTE
SUBSTITUTE
EMISSIONS
EMISSIONS
CHANGE EMISSIONS SUBSTITUTE EMISSIONS CHANGE EMISSIONS
REDUCTION (CO2e COST REDUCTION
SUBSTITUTE
PERCENTAGE (%)
EMISSIONS
INCREASE ( CO2e SUBSTITUTE COST
CHANGE
(CO2e COST CHANGE REDUCTION (CO
2e COST REDUCTION PERCENTAGE (%) INCREASE ( CO
2e SUBSTITUTE COST (CO
2e COST CHANGE
PERCENTAGE CHANGE KG REDUCTION (kg)
REDUCTION (CO e
kg)
COST REDUCTION
(US$)
PERCENTAGE (%)
CHANGE (1/100)
INCREASE ( CO e
kg)
SUBSTITUTE COST
INCREASE ($)
(CO e
TONS)
COST CHANGE
(US$1000s)PERCENTAGE CHANGE KG REDUCTION (kg) kg) (US$) CHANGE (1/100) kg) INCREASE ($) TONS) (US$1000s)
0 0.0000 0.0000 0.0000 0.0000 0.0000 0.0000 0.00 0.000 0.0000 0.0000 0.0000 0.0000 0.0000 0.0000 0.00 0.000 0.0000 0.0000 0.0000 0.0000 0.0000 0.0000 0.00 0.00
5 274.4454 4,621.9194 1,506,405.7053 0.0171 5,516.4844 4,400,279.9408 0.89 2,893.875 274.4454 4,621.9194 1,506,405.7053 0.0171 5,516.4844 4,400,279.9408 0.89 2,893.875 274.4454 4,621.9194 1,506,405.7053 0.0171 5,516.4844 4,400,279.9408 0.89 2,893.87
10 548.8908 9,243.8388 3,012,811.4106 0.0342 11,032.9689 8,800,559.8816 1.79 5,787.7510 548.8908 9,243.8388 3,012,811.4106 0.0342 11,032.9689 8,800,559.8816 1.79 5,787.75
15 823.3362 13,865.7582 4,519,217.1159 0.0514 16,549.4533 13,200,839.8224 2.68 8,681.62
10 548.8908 9,243.8388 3,012,811.4106 0.0342 11,032.9689 8,800,559.8816 1.79 5,787.75
15 823.3362 13,865.7582 4,519,217.1159 0.0514 16,549.4533 13,200,839.8224 2.68 8,681.6215 823.3362 13,865.7582 4,519,217.1159 0.0514 16,549.4533 13,200,839.8224 2.68 8,681.62
20 1,097.7817 18,487.6776 6,025,622.8212 0.0685 22,065.9378 17,601,119.7633 3.58 11,575.5020 1,097.7817 18,487.6776 6,025,622.8212 0.0685 22,065.9378 17,601,119.7633 3.58 11,575.5020 1,097.7817 18,487.6776 6,025,622.8212 0.0685 22,065.9378 17,601,119.7633 3.58 11,575.50
25 1,372.2271 23,109.5970 7,532,028.5265 0.0856 27,582.4222 22,001,399.7041 4.47 14,469.3725 1,372.2271 23,109.5970 7,532,028.5265 0.0856 27,582.4222 22,001,399.7041 4.47 14,469.3725 1,372.2271 23,109.5970 7,532,028.5265 0.0856 27,582.4222 22,001,399.7041 4.47 14,469.37
30 1,646.6725 27,731.5164 9,038,434.2319 0.1027 33,098.9067 26,401,679.6449 5.37 17,363.2530 1,646.6725 27,731.5164 9,038,434.2319 0.1027 33,098.9067 26,401,679.6449 5.37 17,363.25
35 1,921.1179 32,353.4358 10,544,839.9372 0.1198 38,615.3911 30,801,959.5857 6.26 20,257.1235 1,921.1179 32,353.4358 10,544,839.9372 0.1198 38,615.3911 30,801,959.5857 6.26 20,257.1235 1,921.1179 32,353.4358 10,544,839.9372 0.1198 38,615.3911 30,801,959.5857 6.26 20,257.12
40 2,195.5633 36,975.3552 12,051,245.6425 0.1369 44,131.8756 35,202,239.5265 7.16 23,150.9940 2,195.5633 36,975.3552 12,051,245.6425 0.1369 44,131.8756 35,202,239.5265 7.16 23,150.9940 2,195.5633 36,975.3552 12,051,245.6425 0.1369 44,131.8756 35,202,239.5265 7.16 23,150.99
45 2,470.0087 41,597.2746 13,557,651.3478 0.1541 49,648.3600 39,602,519.4673 8.05 26,044.8745 2,470.0087 41,597.2746 13,557,651.3478 0.1541 49,648.3600 39,602,519.4673 8.05 26,044.87
50 2,744.4541 46,219.1940 15,064,057.0531 0.1712 55,164.8445 44,002,799.4082 8.95 28,938.7450 2,744.4541 46,219.1940 15,064,057.0531 0.1712 55,164.8445 44,002,799.4082 8.95 28,938.7450 2,744.4541 46,219.1940 15,064,057.0531 0.1712 55,164.8445 44,002,799.4082 8.95 28,938.74
55 3,018.8996 50,841.1134 16,570,462.7584 0.1883 60,681.3289 48,403,079.3490 9.84 31,832.6255 3,018.8996 50,841.1134 16,570,462.7584 0.1883 60,681.3289 48,403,079.3490 9.84 31,832.6255 3,018.8996 50,841.1134 16,570,462.7584 0.1883 60,681.3289 48,403,079.3490 9.84 31,832.62
60 3,293.3450 55,463.0328 18,076,868.4637 0.2054 66,197.8134 52,803,359.2898 10.73 34,726.4960 3,293.3450 55,463.0328 18,076,868.4637 0.2054 66,197.8134 52,803,359.2898 10.73 34,726.49
65 3,567.7904 60,084.9522 19,583,274.1690 0.2225 71,714.2978 57,203,639.2306 11.63 37,620.3765 3,567.7904 60,084.9522 19,583,274.1690 0.2225 71,714.2978 57,203,639.2306 11.63 37,620.3765 3,567.7904 60,084.9522 19,583,274.1690 0.2225 71,714.2978 57,203,639.2306 11.63 37,620.37
70 3,842.2358 64,706.8717 21,089,679.8743 0.2396 77,230.7823 61,603,919.1714 12.52 40,514.2470 3,842.2358 64,706.8717 21,089,679.8743 0.2396 77,230.7823 61,603,919.1714 12.52 40,514.2470 3,842.2358 64,706.8717 21,089,679.8743 0.2396 77,230.7823 61,603,919.1714 12.52 40,514.24
75 4,116.6812 69,328.7911 22,596,085.5796 0.2568 82,747.2667 66,004,199.1122 13.42 43,408.1175 4,116.6812 69,328.7911 22,596,085.5796 0.2568 82,747.2667 66,004,199.1122 13.42 43,408.11
80 4,391.1266 73,950.7105 24,102,491.2850 0.2739 88,263.7512 70,404,479.0531 14.31 46,301.9980 4,391.1266 73,950.7105 24,102,491.2850 0.2739 88,263.7512 70,404,479.0531 14.31 46,301.9980 4,391.1266 73,950.7105 24,102,491.2850 0.2739 88,263.7512 70,404,479.0531 14.31 46,301.99
85 4,665.5720 78,572.6299 25,608,896.9903 0.2910 93,780.2356 74,804,758.9939 15.21 49,195.8685 4,665.5720 78,572.6299 25,608,896.9903 0.2910 93,780.2356 74,804,758.9939 15.21 49,195.8685 4,665.5720 78,572.6299 25,608,896.9903 0.2910 93,780.2356 74,804,758.9939 15.21 49,195.86
90 4,940.0175 83,194.5493 27,115,302.6956 0.3081 99,296.7201 79,205,038.9347 16.10 52,089.7490 4,940.0175 83,194.5493 27,115,302.6956 0.3081 99,296.7201 79,205,038.9347 16.10 52,089.74
95 5,214.4629 87,816.4687 28,621,708.4009 0.3252 104,813.2045 83,605,318.8755 17.00 54,983.6195 5,214.4629 87,816.4687 28,621,708.4009 0.3252 104,813.2045 83,605,318.8755 17.00 54,983.6195 5,214.4629 87,816.4687 28,621,708.4009 0.3252 104,813.2045 83,605,318.8755 17.00 54,983.61
100 5,488.9083 92,438.3881 30,128,114.1062 0.3423 110,329.6890 88,005,598.8163 17.89 57,877.48100 5,488.9083 92,438.3881 30,128,114.1062 0.3423 110,329.6890 88,005,598.8163 17.89 57,877.48100 5,488.9083 92,438.3881 30,128,114.1062 0.3423 110,329.6890 88,005,598.8163 17.89 57,877.48

Organic Suckler Beef for Intensive Feedlot BeefOrganic Suckler Beef for Intensive Feedlot BeefOrganic Suckler Beef for Intensive Feedlot Beef
BASELINE EMISSIONS PRODUCT COST BASELINE
EMISSIONS (kg)
EMISSIONS
FACTOR EMISSIONS MODEL BASELINE KG
PRODUCT COST
($/kg)EMISSIONS (kg) FACTOR EMISSIONS MODEL BASELINE KG ($/kg)EMISSIONS (kg) FACTOR EMISSIONS MODEL BASELINE KG ($/kg)
PRODUCT REDUCEDPRODUCT REDUCEDPRODUCT REDUCED
Intensive Feedlot Intensive Feedlot
Beef 854884.0421 10 Process Based 85488.40422 6.912090715
Intensive Feedlot
Beef 854884.0421 10 Process Based 85488.40422 6.912090715Beef 854884.0421 10 Process Based 85488.40422 6.912090715
PRODUCT PRODUCT PRODUCT
SUBSTITUTESUBSTITUTESUBSTITUTE
Organic Suckler Organic Suckler
Beef 2735628.93 32 Process Based 85488.40422 6.912090715Beef 2735628.93 32 Process Based 85488.40422 6.912090715Beef 2735628.93 32 Process Based 85488.40422 6.912090715
EQUIVALENT EQUIVALENT
COST
EQUIVALENT
SUBSTITUTE SUBSTITUTE SUBSTITUTE COST COST SUBSTITUTE SUBSTITUTE SUBSTITUTE COST
PERCENTAGE PERCENTAGE KG REDUCTION EMISSIONS REDUCTION
COST
REDUCTION
SUBSTITUTE
PERCENTAGE (%)
SUBSTITUTE
EMISSIONS INCREASE (
SUBSTITUTE
COST EMISSIONS CHANGE
COST
CHANGE PERCENTAGE PERCENTAGE KG REDUCTION EMISSIONS REDUCTION 2
REDUCTION PERCENTAGE (%) EMISSIONS INCREASE ( 2
COST EMISSIONS CHANGE 2
CHANGE PERCENTAGE
CHANGE
PERCENTAGE
CHANGE
KG REDUCTION
(kg) (CO2e kg)
REDUCTION
(US$)
PERCENTAGE (%)
CHANGE (1/100) CO2e kg)
COST
INCREASE ($) (CO2e TONS)
CHANGE
(US$1000s)CHANGE CHANGE (kg) (CO2e kg) (US$) CHANGE (1/100) CO
2e kg) INCREASE ($) (CO
2e TONS) (US$1000s)
0 0.0000 0.0000 0.0000 0.0000 0.0000 0.0000 0.0000 0.00 0.000 0.0000 0.0000 0.0000 0.0000 0.0000 0.0000 0.0000 0.00 0.000 0.0000 0.0000 0.0000 0.0000 0.0000 0.0000 0.0000 0.00 0.00
5 4274.4202 42744.2021 365413362.7926 0.0500 136781.4467 365413362.7926 94.0372 94.04 0.005 4274.4202 42744.2021 365413362.7926 0.0500 136781.4467 365413362.7926 94.0372 94.04 0.005 4274.4202 42744.2021 365413362.7926 0.0500 136781.4467 365413362.7926 94.0372 94.04 0.00
10 8548.8404 85488.4042 730826725.5852 0.1000 273562.8935 730826725.5852 188.0745 188.07 0.0010 8548.8404 85488.4042 730826725.5852 0.1000 273562.8935 730826725.5852 188.0745 188.07 0.00
15 12823.2606 128232.6063 1096240088.3778 0.1500 410344.3402 1096240088.3778 282.1117 282.11 0.0015 12823.2606 128232.6063 1096240088.3778 0.1500 410344.3402 1096240088.3778 282.1117 282.11 0.0015 12823.2606 128232.6063 1096240088.3778 0.1500 410344.3402 1096240088.3778 282.1117 282.11 0.00
20 17097.6808 170976.8084 1461653451.1704 0.2000 547125.7870 1461653451.1704 376.1490 376.15 0.0020 17097.6808 170976.8084 1461653451.1704 0.2000 547125.7870 1461653451.1704 376.1490 376.15 0.0020 17097.6808 170976.8084 1461653451.1704 0.2000 547125.7870 1461653451.1704 376.1490 376.15 0.00
25 21372.1011 213721.0105 1827066813.9630 0.2500 683907.2337 1827066813.9630 470.1862 470.19 0.0025 21372.1011 213721.0105 1827066813.9630 0.2500 683907.2337 1827066813.9630 470.1862 470.19 0.00
30 25646.5213 256465.2126 2192480176.7556 0.3000 820688.6804 2192480176.7556 564.2235 564.22 0.0030 25646.5213 256465.2126 2192480176.7556 0.3000 820688.6804 2192480176.7556 564.2235 564.22 0.0030 25646.5213 256465.2126 2192480176.7556 0.3000 820688.6804 2192480176.7556 564.2235 564.22 0.00
35 29920.9415 299209.4147 2557893539.5482 0.3500 957470.1272 2557893539.5482 658.2607 658.26 0.0035 29920.9415 299209.4147 2557893539.5482 0.3500 957470.1272 2557893539.5482 658.2607 658.26 0.0035 29920.9415 299209.4147 2557893539.5482 0.3500 957470.1272 2557893539.5482 658.2607 658.26 0.00
40 34195.3617 341953.6168 2923306902.3408 0.4000 1094251.5739 2923306902.3408 752.2980 752.30 0.0040 34195.3617 341953.6168 2923306902.3408 0.4000 1094251.5739 2923306902.3408 752.2980 752.30 0.00
45 38469.7819 384697.8190 3288720265.1334 0.4500 1231033.0206 3288720265.1334 846.3352 846.34 0.0045 38469.7819 384697.8190 3288720265.1334 0.4500 1231033.0206 3288720265.1334 846.3352 846.34 0.0045 38469.7819 384697.8190 3288720265.1334 0.4500 1231033.0206 3288720265.1334 846.3352 846.34 0.00
50 42744.2021 427442.0211 3654133627.9261 0.5000 1367814.4674 3654133627.9261 940.3724 940.37 0.0050 42744.2021 427442.0211 3654133627.9261 0.5000 1367814.4674 3654133627.9261 940.3724 940.37 0.0050 42744.2021 427442.0211 3654133627.9261 0.5000 1367814.4674 3654133627.9261 940.3724 940.37 0.00
55 47018.6223 470186.2232 4019546990.7187 0.5500 1504595.9141 4019546990.7187 1034.4097 1034.41 0.0055 47018.6223 470186.2232 4019546990.7187 0.5500 1504595.9141 4019546990.7187 1034.4097 1034.41 0.00
60 51293.0425 512930.4253 4384960353.5113 0.6000 1641377.3609 4384960353.5113 1128.4469 1128.45 0.0060 51293.0425 512930.4253 4384960353.5113 0.6000 1641377.3609 4384960353.5113 1128.4469 1128.45 0.0060 51293.0425 512930.4253 4384960353.5113 0.6000 1641377.3609 4384960353.5113 1128.4469 1128.45 0.00
65 55567.4627 555674.6274 4750373716.3039 0.6500 1778158.8076 4750373716.3039 1222.4842 1222.48 0.0065 55567.4627 555674.6274 4750373716.3039 0.6500 1778158.8076 4750373716.3039 1222.4842 1222.48 0.0065 55567.4627 555674.6274 4750373716.3039 0.6500 1778158.8076 4750373716.3039 1222.4842 1222.48 0.00
70 59841.8830 598418.8295 5115787079.0965 0.7000 1914940.2543 5115787079.0965 1316.5214 1316.52 0.0070 59841.8830 598418.8295 5115787079.0965 0.7000 1914940.2543 5115787079.0965 1316.5214 1316.52 0.00
75 64116.3032 641163.0316 5481200441.8891 0.7500 2051721.7011 5481200441.8891 1410.5587 1410.56 0.0075 64116.3032 641163.0316 5481200441.8891 0.7500 2051721.7011 5481200441.8891 1410.5587 1410.56 0.0075 64116.3032 641163.0316 5481200441.8891 0.7500 2051721.7011 5481200441.8891 1410.5587 1410.56 0.00
80 68390.7234 683907.2337 5846613804.6817 0.8000 2188503.1478 5846613804.6817 1504.5959 1504.60 0.0080 68390.7234 683907.2337 5846613804.6817 0.8000 2188503.1478 5846613804.6817 1504.5959 1504.60 0.0080 68390.7234 683907.2337 5846613804.6817 0.8000 2188503.1478 5846613804.6817 1504.5959 1504.60 0.00
85 72665.1436 726651.4358 6212027167.4743 0.8500 2325284.5946 6212027167.4743 1598.6332 1598.63 0.0085 72665.1436 726651.4358 6212027167.4743 0.8500 2325284.5946 6212027167.4743 1598.6332 1598.63 0.00
90 76939.5638 769395.6379 6577440530.2669 0.9000 2462066.0413 6577440530.2669 1692.6704 1692.67 0.00
85 72665.1436 726651.4358 6212027167.4743 0.8500 2325284.5946 6212027167.4743 1598.6332 1598.63 0.00
90 76939.5638 769395.6379 6577440530.2669 0.9000 2462066.0413 6577440530.2669 1692.6704 1692.67 0.0090 76939.5638 769395.6379 6577440530.2669 0.9000 2462066.0413 6577440530.2669 1692.6704 1692.67 0.00
95 81213.9840 812139.8400 6942853893.0595 0.9500 2598847.4880 6942853893.0595 1786.7076 1786.71 0.0095 81213.9840 812139.8400 6942853893.0595 0.9500 2598847.4880 6942853893.0595 1786.7076 1786.71 0.0095 81213.9840 812139.8400 6942853893.0595 0.9500 2598847.4880 6942853893.0595 1786.7076 1786.71 0.00
100 85488.4042 854884.0421 7308267255.8521 1.0000 2735628.9348 7308267255.8521 1880.7449 1880.74 0.00100 85488.4042 854884.0421 7308267255.8521 1.0000 2735628.9348 7308267255.8521 1880.7449 1880.74 0.00100 85488.4042 854884.0421 7308267255.8521 1.0000 2735628.9348 7308267255.8521 1880.7449 1880.74 0.00
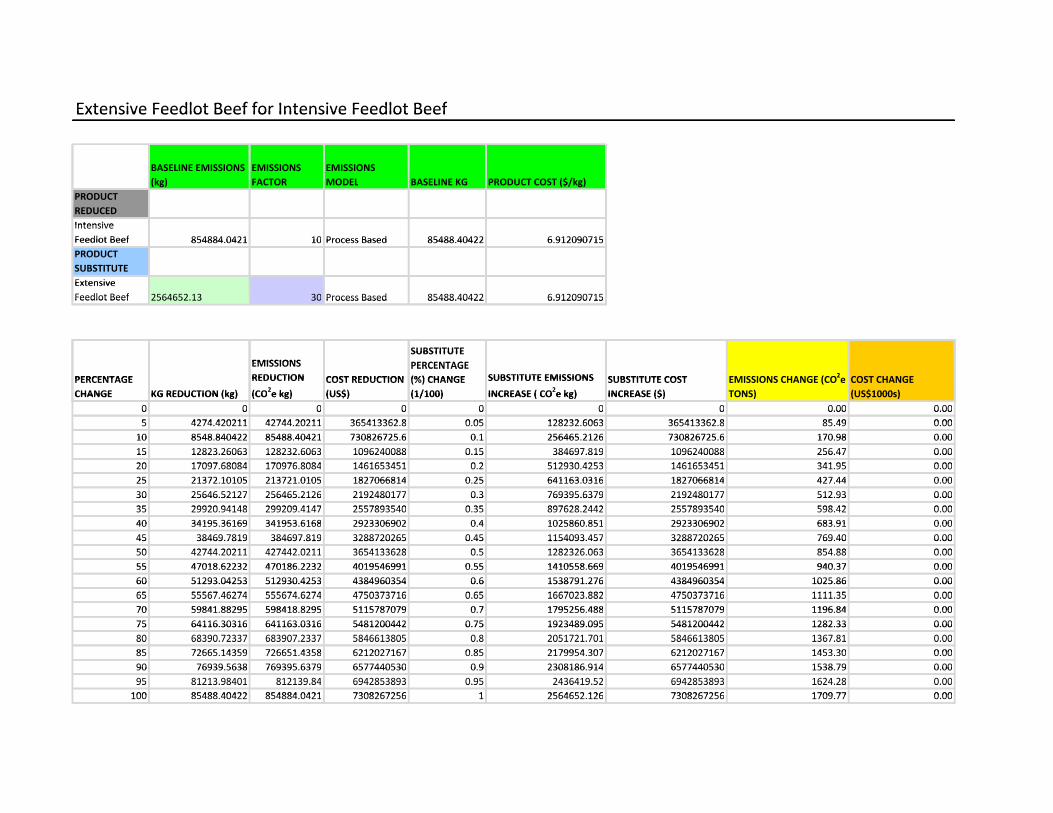
Extensive Feedlot Beef for Intensive Feedlot BeefExtensive Feedlot Beef for Intensive Feedlot BeefExtensive Feedlot Beef for Intensive Feedlot Beef
BASELINE EMISSIONS EMISSIONS EMISSIONS BASELINE EMISSIONS EMISSIONS EMISSIONS BASELINE EMISSIONS
(kg)
EMISSIONS
FACTOR
EMISSIONS
MODEL BASELINE KG PRODUCT COST ($/kg)(kg) FACTOR MODEL BASELINE KG PRODUCT COST ($/kg)
PRODUCT PRODUCT PRODUCT
REDUCEDREDUCEDREDUCED
Intensive Intensive
Feedlot Beef 854884.0421 10 Process Based 85488.40422 6.912090715Feedlot Beef 854884.0421 10 Process Based 85488.40422 6.912090715Feedlot Beef 854884.0421 10 Process Based 85488.40422 6.912090715
PRODUCT PRODUCT PRODUCT
SUBSTITUTESUBSTITUTE
Extensive Extensive Extensive
Feedlot Beef 2564652.13 30 Process Based 85488.40422 6.912090715Feedlot Beef 2564652.13 30 Process Based 85488.40422 6.912090715Feedlot Beef 2564652.13 30 Process Based 85488.40422 6.912090715
EQUIVALENT
SUBSTITUTE SUBSTITUTE
EMISSIONS
SUBSTITUTE
PERCENTAGE EMISSIONS PERCENTAGE
PERCENTAGE
EMISSIONS
REDUCTION COST REDUCTION
PERCENTAGE
(%) CHANGE SUBSTITUTE EMISSIONS SUBSTITUTE COST EMISSIONS CHANGE (CO2e COST CHANGE PERCENTAGE
CHANGE KG REDUCTION (kg)
REDUCTION
(CO2e kg)
COST REDUCTION
(US$)
(%) CHANGE
(1/100)
SUBSTITUTE EMISSIONS
INCREASE ( CO2e kg)
SUBSTITUTE COST
INCREASE ($)
EMISSIONS CHANGE (CO2e
TONS)
COST CHANGE
(US$1000s)CHANGE KG REDUCTION (kg) (CO2e kg) (US$) (1/100) INCREASE ( CO
2e kg) INCREASE ($) TONS) (US$1000s)CHANGE KG REDUCTION (kg) (CO e kg) (US$) (1/100) INCREASE ( CO e kg) INCREASE ($) TONS) (US$1000s)
0 0 0 0 0 0 0 0.00 0.000 0 0 0 0 0 0 0.00 0.000 0 0 0 0 0 0 0.00 0.00
5 4274.420211 42744.20211 365413362.8 0.05 128232.6063 365413362.8 85.49 0.005 4274.420211 42744.20211 365413362.8 0.05 128232.6063 365413362.8 85.49 0.005 4274.420211 42744.20211 365413362.8 0.05 128232.6063 365413362.8 85.49 0.00
10 8548.840422 85488.40421 730826725.6 0.1 256465.2126 730826725.6 170.98 0.0010 8548.840422 85488.40421 730826725.6 0.1 256465.2126 730826725.6 170.98 0.00
15 12823.26063 128232.6063 1096240088 0.15 384697.819 1096240088 256.47 0.0015 12823.26063 128232.6063 1096240088 0.15 384697.819 1096240088 256.47 0.0015 12823.26063 128232.6063 1096240088 0.15 384697.819 1096240088 256.47 0.00
20 17097.68084 170976.8084 1461653451 0.2 512930.4253 1461653451 341.95 0.0020 17097.68084 170976.8084 1461653451 0.2 512930.4253 1461653451 341.95 0.0020 17097.68084 170976.8084 1461653451 0.2 512930.4253 1461653451 341.95 0.00
25 21372.10105 213721.0105 1827066814 0.25 641163.0316 1827066814 427.44 0.0025 21372.10105 213721.0105 1827066814 0.25 641163.0316 1827066814 427.44 0.00
30 25646.52127 256465.2126 2192480177 0.3 769395.6379 2192480177 512.93 0.0030 25646.52127 256465.2126 2192480177 0.3 769395.6379 2192480177 512.93 0.0030 25646.52127 256465.2126 2192480177 0.3 769395.6379 2192480177 512.93 0.00
35 29920.94148 299209.4147 2557893540 0.35 897628.2442 2557893540 598.42 0.0035 29920.94148 299209.4147 2557893540 0.35 897628.2442 2557893540 598.42 0.0035 29920.94148 299209.4147 2557893540 0.35 897628.2442 2557893540 598.42 0.00
40 34195.36169 341953.6168 2923306902 0.4 1025860.851 2923306902 683.91 0.0040 34195.36169 341953.6168 2923306902 0.4 1025860.851 2923306902 683.91 0.00
45 38469.7819 384697.819 3288720265 0.45 1154093.457 3288720265 769.40 0.0045 38469.7819 384697.819 3288720265 0.45 1154093.457 3288720265 769.40 0.0045 38469.7819 384697.819 3288720265 0.45 1154093.457 3288720265 769.40 0.00
50 42744.20211 427442.0211 3654133628 0.5 1282326.063 3654133628 854.88 0.0050 42744.20211 427442.0211 3654133628 0.5 1282326.063 3654133628 854.88 0.0050 42744.20211 427442.0211 3654133628 0.5 1282326.063 3654133628 854.88 0.00
55 47018.62232 470186.2232 4019546991 0.55 1410558.669 4019546991 940.37 0.0055 47018.62232 470186.2232 4019546991 0.55 1410558.669 4019546991 940.37 0.00
60 51293.04253 512930.4253 4384960354 0.6 1538791.276 4384960354 1025.86 0.0060 51293.04253 512930.4253 4384960354 0.6 1538791.276 4384960354 1025.86 0.0060 51293.04253 512930.4253 4384960354 0.6 1538791.276 4384960354 1025.86 0.00
65 55567.46274 555674.6274 4750373716 0.65 1667023.882 4750373716 1111.35 0.0065 55567.46274 555674.6274 4750373716 0.65 1667023.882 4750373716 1111.35 0.0065 55567.46274 555674.6274 4750373716 0.65 1667023.882 4750373716 1111.35 0.00
70 59841.88295 598418.8295 5115787079 0.7 1795256.488 5115787079 1196.84 0.0070 59841.88295 598418.8295 5115787079 0.7 1795256.488 5115787079 1196.84 0.00
75 64116.30316 641163.0316 5481200442 0.75 1923489.095 5481200442 1282.33 0.0075 64116.30316 641163.0316 5481200442 0.75 1923489.095 5481200442 1282.33 0.0075 64116.30316 641163.0316 5481200442 0.75 1923489.095 5481200442 1282.33 0.00
80 68390.72337 683907.2337 5846613805 0.8 2051721.701 5846613805 1367.81 0.0080 68390.72337 683907.2337 5846613805 0.8 2051721.701 5846613805 1367.81 0.0080 68390.72337 683907.2337 5846613805 0.8 2051721.701 5846613805 1367.81 0.00
85 72665.14359 726651.4358 6212027167 0.85 2179954.307 6212027167 1453.30 0.0085 72665.14359 726651.4358 6212027167 0.85 2179954.307 6212027167 1453.30 0.00
90 76939.5638 769395.6379 6577440530 0.9 2308186.914 6577440530 1538.79 0.0090 76939.5638 769395.6379 6577440530 0.9 2308186.914 6577440530 1538.79 0.0090 76939.5638 769395.6379 6577440530 0.9 2308186.914 6577440530 1538.79 0.00
95 81213.98401 812139.84 6942853893 0.95 2436419.52 6942853893 1624.28 0.0095 81213.98401 812139.84 6942853893 0.95 2436419.52 6942853893 1624.28 0.0095 81213.98401 812139.84 6942853893 0.95 2436419.52 6942853893 1624.28 0.00
100 85488.40422 854884.0421 7308267256 1 2564652.126 7308267256 1709.77 0.00100 85488.40422 854884.0421 7308267256 1 2564652.126 7308267256 1709.77 0.00
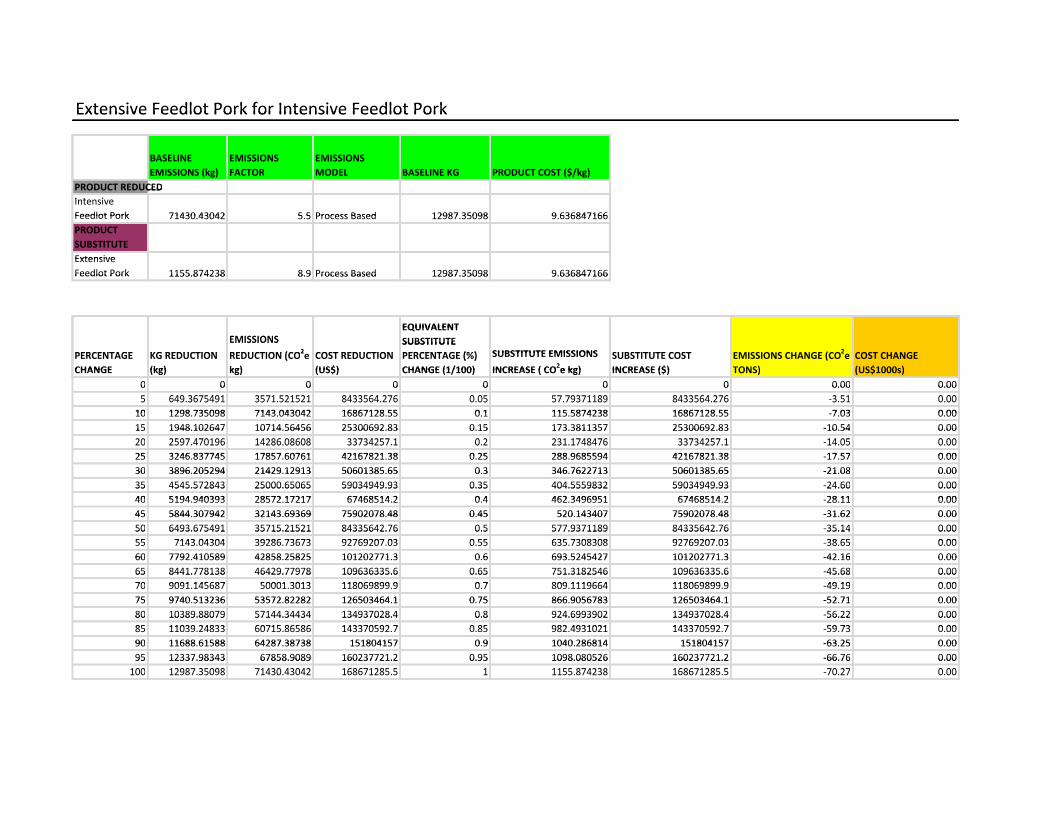
Extensive Feedlot Pork for Intensive Feedlot PorkExtensive Feedlot Pork for Intensive Feedlot PorkExtensive Feedlot Pork for Intensive Feedlot Pork
BASELINE EMISSIONS EMISSIONS BASELINE EMISSIONS EMISSIONS BASELINE
EMISSIONS (kg)
EMISSIONS
FACTOR
EMISSIONS
MODEL BASELINE KG PRODUCT COST ($/kg)EMISSIONS (kg) FACTOR MODEL BASELINE KG PRODUCT COST ($/kg)
PRODUCT REDUCEDPRODUCT REDUCEDPRODUCT REDUCED
Intensive Intensive Intensive
Feedlot Pork 71430.43042 5.5 Process Based 12987.35098 9.636847166Feedlot Pork 71430.43042 5.5 Process Based 12987.35098 9.636847166
PRODUCT PRODUCT PRODUCT
SUBSTITUTESUBSTITUTESUBSTITUTE
Extensive Extensive
Feedlot Pork 1155.874238 8.9 Process Based 12987.35098 9.636847166Feedlot Pork 1155.874238 8.9 Process Based 12987.35098 9.636847166Feedlot Pork 1155.874238 8.9 Process Based 12987.35098 9.636847166
EQUIVALENT
EMISSIONS
EQUIVALENT
SUBSTITUTE EMISSIONS SUBSTITUTE
PERCENTAGE KG REDUCTION
EMISSIONS
REDUCTION (CO2e COST REDUCTION
SUBSTITUTE
PERCENTAGE (%) SUBSTITUTE EMISSIONS SUBSTITUTE COST EMISSIONS CHANGE (CO2e COST CHANGE PERCENTAGE KG REDUCTION REDUCTION (CO
2e COST REDUCTION PERCENTAGE (%) SUBSTITUTE EMISSIONS
2
SUBSTITUTE COST EMISSIONS CHANGE (CO2e COST CHANGE PERCENTAGE
CHANGE
KG REDUCTION
(kg)
REDUCTION (CO e
kg)
COST REDUCTION
(US$)
PERCENTAGE (%)
CHANGE (1/100) INCREASE ( CO2e kg)
SUBSTITUTE COST
INCREASE ($)
EMISSIONS CHANGE (CO e
TONS)
COST CHANGE
(US$1000s)CHANGE (kg) kg) (US$) CHANGE (1/100) INCREASE ( CO2e kg) INCREASE ($) TONS) (US$1000s)
0 0 0 0 0 0 0 0.00 0.000 0 0 0 0 0 0 0.00 0.000 0 0 0 0 0 0 0.00 0.00
5 649.3675491 3571.521521 8433564.276 0.05 57.79371189 8433564.276 -3.51 0.005 649.3675491 3571.521521 8433564.276 0.05 57.79371189 8433564.276 -3.51 0.005 649.3675491 3571.521521 8433564.276 0.05 57.79371189 8433564.276 -3.51 0.00
10 1298.735098 7143.043042 16867128.55 0.1 115.5874238 16867128.55 -7.03 0.0010 1298.735098 7143.043042 16867128.55 0.1 115.5874238 16867128.55 -7.03 0.00
15 1948.102647 10714.56456 25300692.83 0.15 173.3811357 25300692.83 -10.54 0.0015 1948.102647 10714.56456 25300692.83 0.15 173.3811357 25300692.83 -10.54 0.0015 1948.102647 10714.56456 25300692.83 0.15 173.3811357 25300692.83 -10.54 0.00
20 2597.470196 14286.08608 33734257.1 0.2 231.1748476 33734257.1 -14.05 0.0020 2597.470196 14286.08608 33734257.1 0.2 231.1748476 33734257.1 -14.05 0.0020 2597.470196 14286.08608 33734257.1 0.2 231.1748476 33734257.1 -14.05 0.00
25 3246.837745 17857.60761 42167821.38 0.25 288.9685594 42167821.38 -17.57 0.0025 3246.837745 17857.60761 42167821.38 0.25 288.9685594 42167821.38 -17.57 0.00
30 3896.205294 21429.12913 50601385.65 0.3 346.7622713 50601385.65 -21.08 0.0030 3896.205294 21429.12913 50601385.65 0.3 346.7622713 50601385.65 -21.08 0.0030 3896.205294 21429.12913 50601385.65 0.3 346.7622713 50601385.65 -21.08 0.00
35 4545.572843 25000.65065 59034949.93 0.35 404.5559832 59034949.93 -24.60 0.0035 4545.572843 25000.65065 59034949.93 0.35 404.5559832 59034949.93 -24.60 0.0035 4545.572843 25000.65065 59034949.93 0.35 404.5559832 59034949.93 -24.60 0.00
40 5194.940393 28572.17217 67468514.2 0.4 462.3496951 67468514.2 -28.11 0.0040 5194.940393 28572.17217 67468514.2 0.4 462.3496951 67468514.2 -28.11 0.00
45 5844.307942 32143.69369 75902078.48 0.45 520.143407 75902078.48 -31.62 0.00
40 5194.940393 28572.17217 67468514.2 0.4 462.3496951 67468514.2 -28.11 0.00
45 5844.307942 32143.69369 75902078.48 0.45 520.143407 75902078.48 -31.62 0.0045 5844.307942 32143.69369 75902078.48 0.45 520.143407 75902078.48 -31.62 0.00
50 6493.675491 35715.21521 84335642.76 0.5 577.9371189 84335642.76 -35.14 0.0050 6493.675491 35715.21521 84335642.76 0.5 577.9371189 84335642.76 -35.14 0.0050 6493.675491 35715.21521 84335642.76 0.5 577.9371189 84335642.76 -35.14 0.00
55 7143.04304 39286.73673 92769207.03 0.55 635.7308308 92769207.03 -38.65 0.0055 7143.04304 39286.73673 92769207.03 0.55 635.7308308 92769207.03 -38.65 0.0055 7143.04304 39286.73673 92769207.03 0.55 635.7308308 92769207.03 -38.65 0.00
60 7792.410589 42858.25825 101202771.3 0.6 693.5245427 101202771.3 -42.16 0.0060 7792.410589 42858.25825 101202771.3 0.6 693.5245427 101202771.3 -42.16 0.00
65 8441.778138 46429.77978 109636335.6 0.65 751.3182546 109636335.6 -45.68 0.0065 8441.778138 46429.77978 109636335.6 0.65 751.3182546 109636335.6 -45.68 0.0065 8441.778138 46429.77978 109636335.6 0.65 751.3182546 109636335.6 -45.68 0.00
70 9091.145687 50001.3013 118069899.9 0.7 809.1119664 118069899.9 -49.19 0.0070 9091.145687 50001.3013 118069899.9 0.7 809.1119664 118069899.9 -49.19 0.0070 9091.145687 50001.3013 118069899.9 0.7 809.1119664 118069899.9 -49.19 0.00
75 9740.513236 53572.82282 126503464.1 0.75 866.9056783 126503464.1 -52.71 0.0075 9740.513236 53572.82282 126503464.1 0.75 866.9056783 126503464.1 -52.71 0.00
80 10389.88079 57144.34434 134937028.4 0.8 924.6993902 134937028.4 -56.22 0.0080 10389.88079 57144.34434 134937028.4 0.8 924.6993902 134937028.4 -56.22 0.0080 10389.88079 57144.34434 134937028.4 0.8 924.6993902 134937028.4 -56.22 0.00
85 11039.24833 60715.86586 143370592.7 0.85 982.4931021 143370592.7 -59.73 0.0085 11039.24833 60715.86586 143370592.7 0.85 982.4931021 143370592.7 -59.73 0.0085 11039.24833 60715.86586 143370592.7 0.85 982.4931021 143370592.7 -59.73 0.00
90 11688.61588 64287.38738 151804157 0.9 1040.286814 151804157 -63.25 0.0090 11688.61588 64287.38738 151804157 0.9 1040.286814 151804157 -63.25 0.00
95 12337.98343 67858.9089 160237721.2 0.95 1098.080526 160237721.2 -66.76 0.0095 12337.98343 67858.9089 160237721.2 0.95 1098.080526 160237721.2 -66.76 0.0095 12337.98343 67858.9089 160237721.2 0.95 1098.080526 160237721.2 -66.76 0.00
100 12987.35098 71430.43042 168671285.5 1 1155.874238 168671285.5 -70.27 0.00100 12987.35098 71430.43042 168671285.5 1 1155.874238 168671285.5 -70.27 0.00100 12987.35098 71430.43042 168671285.5 1 1155.874238 168671285.5 -70.27 0.00
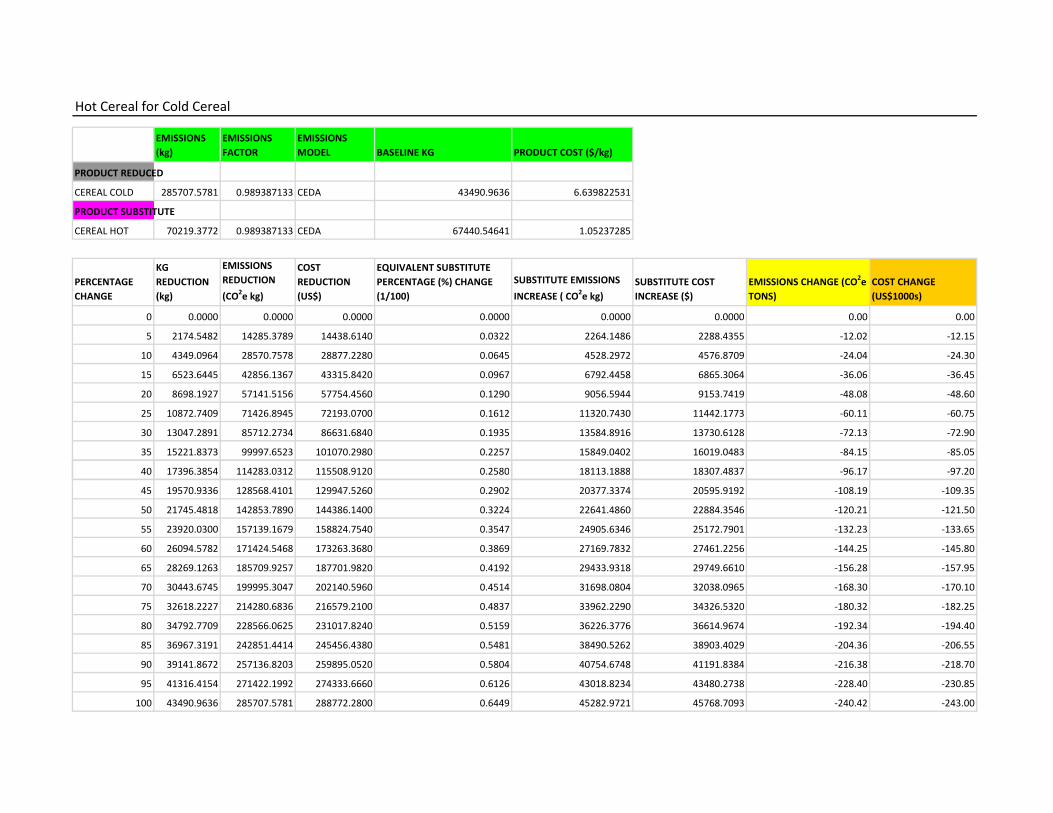
Hot Cereal for Cold Cereal
BASELINE
EMISSIONS
(kg)
EMISSIONS
FACTOR
EMISSIONS
MODEL BASELINE KG PRODUCT COST ($/kg)
PRODUCT REDUCED
CEREAL COLD 285707.5781 0.989387133 CEDA 43490.9636 6.639822531
PRODUCT SUBSTITUTE
CEREAL HOT 70219.3772 0.989387133 CEDA 67440.54641 1.05237285
PERCENTAGE
CHANGE
KG
REDUCTION
(kg)
EMISSIONS
REDUCTION
(CO2e kg)
COST
REDUCTION
(US$)
EQUIVALENT SUBSTITUTE
PERCENTAGE (%) CHANGE
(1/100)
SUBSTITUTE EMISSIONS
INCREASE ( CO2e kg)
SUBSTITUTE COST
INCREASE ($)
EMISSIONS CHANGE (CO2e
TONS)
COST CHANGE
(US$1000s)
0 0.0000 0.0000 0.0000 0.0000 0.0000 0.0000 0.00 0.00
5 2174.5482 14285.3789 14438.6140 0.0322 2264.1486 2288.4355 -12.02 -12.15
10 4349.0964 28570.7578 28877.2280 0.0645 4528.2972 4576.8709 -24.04 -24.30
15 6523.6445 42856.1367 43315.8420 0.0967 6792.4458 6865.3064 -36.06 -36.45
20 8698.1927 57141.5156 57754.4560 0.1290 9056.5944 9153.7419 -48.08 -48.60
25 10872.7409 71426.8945 72193.0700 0.1612 11320.7430 11442.1773 -60.11 -60.75
30 13047.2891 85712.2734 86631.6840 0.1935 13584.8916 13730.6128 -72.13 -72.90
35 15221.8373 99997.6523 101070.2980 0.2257 15849.0402 16019.0483 -84.15 -85.05
40 17396.3854 114283.0312 115508.9120 0.2580 18113.1888 18307.4837 -96.17 -97.2040 17396.3854 114283.0312 115508.9120 0.2580 18113.1888 18307.4837 -96.17 -97.20
45 19570.9336 128568.4101 129947.5260 0.2902 20377.3374 20595.9192 -108.19 -109.35
50 21745.4818 142853.7890 144386.1400 0.3224 22641.4860 22884.3546 -120.21 -121.50
55 23920.0300 157139.1679 158824.7540 0.3547 24905.6346 25172.7901 -132.23 -133.65
60 26094.5782 171424.5468 173263.3680 0.3869 27169.7832 27461.2256 -144.25 -145.80
65 28269.1263 185709.9257 187701.9820 0.4192 29433.9318 29749.6610 -156.28 -157.95
70 30443.6745 199995.3047 202140.5960 0.4514 31698.0804 32038.0965 -168.30 -170.10
75 32618.2227 214280.6836 216579.2100 0.4837 33962.2290 34326.5320 -180.32 -182.25
80 34792.7709 228566.0625 231017.8240 0.5159 36226.3776 36614.9674 -192.34 -194.40
85 36967.3191 242851.4414 245456.4380 0.5481 38490.5262 38903.4029 -204.36 -206.55
90 39141.8672 257136.8203 259895.0520 0.5804 40754.6748 41191.8384 -216.38 -218.70
95 41316.4154 271422.1992 274333.6660 0.6126 43018.8234 43480.2738 -228.40 -230.85
100 43490.9636 285707.5781 288772.2800 0.6449 45282.9721 45768.7093 -240.42 -243.00
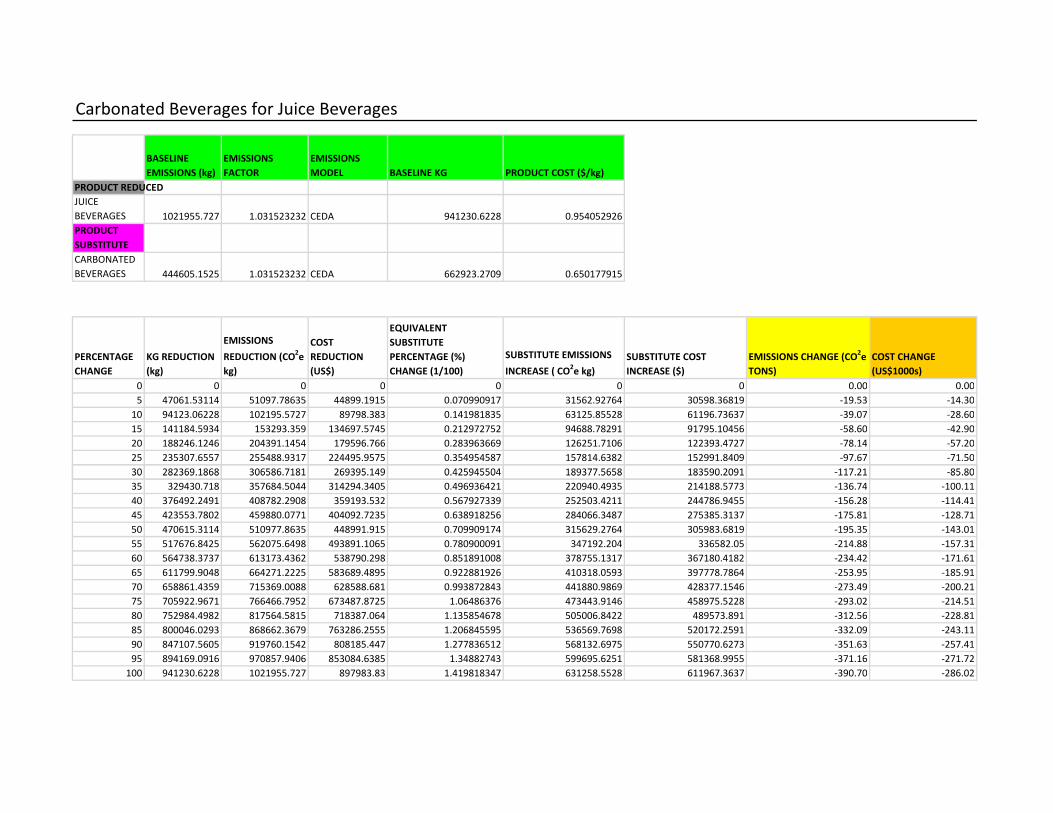
Carbonated Beverages for Juice Beverages
BASELINE
EMISSIONS (kg)
EMISSIONS
FACTOR
EMISSIONS
MODEL BASELINE KG PRODUCT COST ($/kg)
PRODUCT REDUCED
JUICE
BEVERAGES 1021955.727 1.031523232 CEDA 941230.6228 0.954052926
PRODUCT
SUBSTITUTE
CARBONATED
BEVERAGES 444605.1525 1.031523232 CEDA 662923.2709 0.650177915
PERCENTAGE
CHANGE
KG REDUCTION
(kg)
EMISSIONS
REDUCTION (CO2e
kg)
COST
REDUCTION
(US$)
EQUIVALENT
SUBSTITUTE
PERCENTAGE (%)
CHANGE (1/100)
SUBSTITUTE EMISSIONS
INCREASE ( CO2e kg)
SUBSTITUTE COST
INCREASE ($)
EMISSIONS CHANGE (CO2e
TONS)
COST CHANGE
(US$1000s)
0 0 0 0 0 0 0 0.00 0.00
5 47061.53114 51097.78635 44899.1915 0.070990917 31562.92764 30598.36819 -19.53 -14.30
10 94123.06228 102195.5727 89798.383 0.141981835 63125.85528 61196.73637 -39.07 -28.60
15 141184.5934 153293.359 134697.5745 0.212972752 94688.78291 91795.10456 -58.60 -42.90
20 188246.1246 204391.1454 179596.766 0.283963669 126251.7106 122393.4727 -78.14 -57.20
25 235307.6557 255488.9317 224495.9575 0.354954587 157814.6382 152991.8409 -97.67 -71.50
30 282369.1868 306586.7181 269395.149 0.425945504 189377.5658 183590.2091 -117.21 -85.8030 282369.1868 306586.7181 269395.149 0.425945504 189377.5658 183590.2091 -117.21 -85.80
35 329430.718 357684.5044 314294.3405 0.496936421 220940.4935 214188.5773 -136.74 -100.11
40 376492.2491 408782.2908 359193.532 0.567927339 252503.4211 244786.9455 -156.28 -114.41
45 423553.7802 459880.0771 404092.7235 0.638918256 284066.3487 275385.3137 -175.81 -128.71
50 470615.3114 510977.8635 448991.915 0.709909174 315629.2764 305983.6819 -195.35 -143.01
55 517676.8425 562075.6498 493891.1065 0.780900091 347192.204 336582.05 -214.88 -157.31
60 564738.3737 613173.4362 538790.298 0.851891008 378755.1317 367180.4182 -234.42 -171.61
65 611799.9048 664271.2225 583689.4895 0.922881926 410318.0593 397778.7864 -253.95 -185.91
70 658861.4359 715369.0088 628588.681 0.993872843 441880.9869 428377.1546 -273.49 -200.21
75 705922.9671 766466.7952 673487.8725 1.06486376 473443.9146 458975.5228 -293.02 -214.51
80 752984.4982 817564.5815 718387.064 1.135854678 505006.8422 489573.891 -312.56 -228.81
85 800046.0293 868662.3679 763286.2555 1.206845595 536569.7698 520172.2591 -332.09 -243.11
90 847107.5605 919760.1542 808185.447 1.277836512 568132.6975 550770.6273 -351.63 -257.41
95 894169.0916 970857.9406 853084.6385 1.34882743 599695.6251 581368.9955 -371.16 -271.72
100 941230.6228 1021955.727 897983.83 1.419818347 631258.5528 611967.3637 -390.70 -286.02
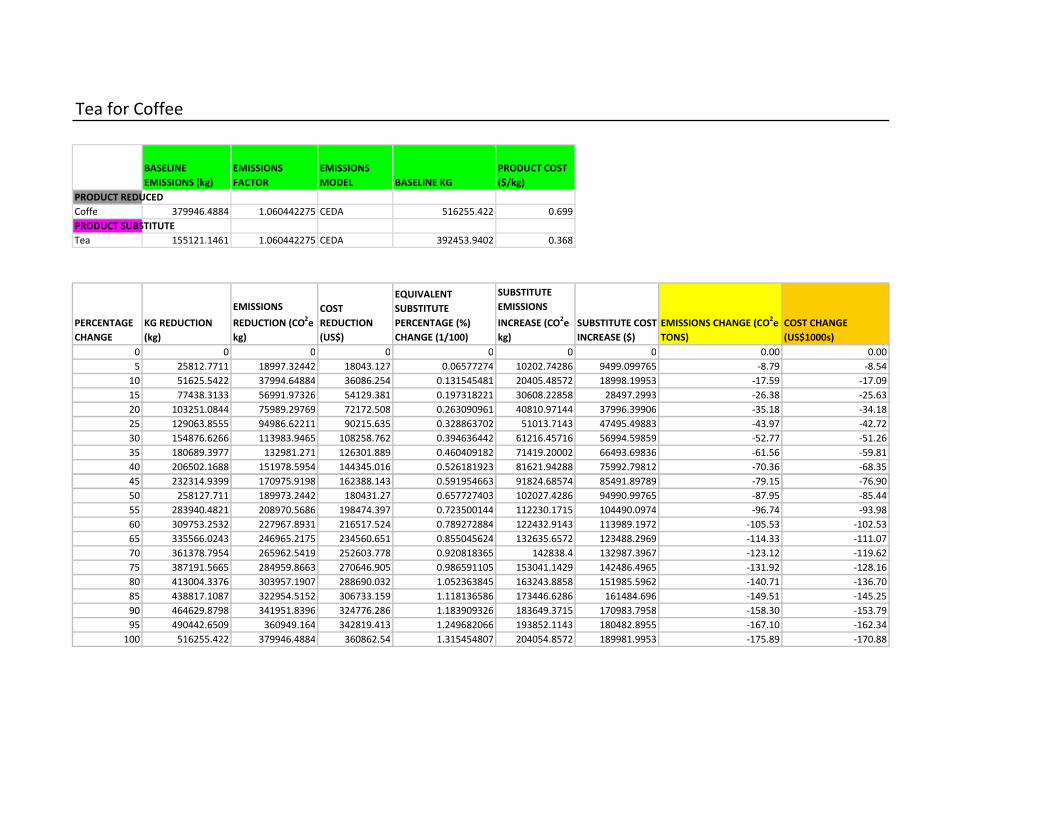
Tea for Coffee
BASELINE
EMISSIONS (kg)
EMISSIONS
FACTOR
EMISSIONS
MODEL BASELINE KG
PRODUCT COST
($/kg)
PRODUCT REDUCED
Coffe 379946.4884 1.060442275 CEDA 516255.422 0.699
PRODUCT SUBSTITUTE
Tea 155121.1461 1.060442275 CEDA 392453.9402 0.368
PERCENTAGE
CHANGE
KG REDUCTION
(kg)
EMISSIONS
REDUCTION (CO2e
kg)
COST
REDUCTION
(US$)
EQUIVALENT
SUBSTITUTE
PERCENTAGE (%)
CHANGE (1/100)
SUBSTITUTE
EMISSIONS
INCREASE (CO2e
kg)
SUBSTITUTE COST
INCREASE ($)
EMISSIONS CHANGE (CO2e
TONS)
COST CHANGE
(US$1000s)
0 0 0 0 0 0 0 0.00 0.00
5 25812.7711 18997.32442 18043.127 0.06577274 10202.74286 9499.099765 -8.79 -8.54
10 51625.5422 37994.64884 36086.254 0.131545481 20405.48572 18998.19953 -17.59 -17.09
15 77438.3133 56991.97326 54129.381 0.197318221 30608.22858 28497.2993 -26.38 -25.63
20 103251.0844 75989.29769 72172.508 0.263090961 40810.97144 37996.39906 -35.18 -34.18
25 129063.8555 94986.62211 90215.635 0.328863702 51013.7143 47495.49883 -43.97 -42.72
30 154876.6266 113983.9465 108258.762 0.394636442 61216.45716 56994.59859 -52.77 -51.26
35 180689.3977 132981.271 126301.889 0.460409182 71419.20002 66493.69836 -61.56 -59.81
40 206502.1688 151978.5954 144345.016 0.526181923 81621.94288 75992.79812 -70.36 -68.35
45 232314.9399 170975.9198 162388.143 0.591954663 91824.68574 85491.89789 -79.15 -76.9045 232314.9399 170975.9198 162388.143 0.591954663 91824.68574 85491.89789 -79.15 -76.90
50 258127.711 189973.2442 180431.27 0.657727403 102027.4286 94990.99765 -87.95 -85.44
55 283940.4821 208970.5686 198474.397 0.723500144 112230.1715 104490.0974 -96.74 -93.98
60 309753.2532 227967.8931 216517.524 0.789272884 122432.9143 113989.1972 -105.53 -102.53
65 335566.0243 246965.2175 234560.651 0.855045624 132635.6572 123488.2969 -114.33 -111.07
70 361378.7954 265962.5419 252603.778 0.920818365 142838.4 132987.3967 -123.12 -119.62
75 387191.5665 284959.8663 270646.905 0.986591105 153041.1429 142486.4965 -131.92 -128.16
80 413004.3376 303957.1907 288690.032 1.052363845 163243.8858 151985.5962 -140.71 -136.70
85 438817.1087 322954.5152 306733.159 1.118136586 173446.6286 161484.696 -149.51 -145.25
90 464629.8798 341951.8396 324776.286 1.183909326 183649.3715 170983.7958 -158.30 -153.79
95 490442.6509 360949.164 342819.413 1.249682066 193852.1143 180482.8955 -167.10 -162.34
100 516255.422 379946.4884 360862.54 1.315454807 204054.8572 189981.9953 -175.89 -170.88
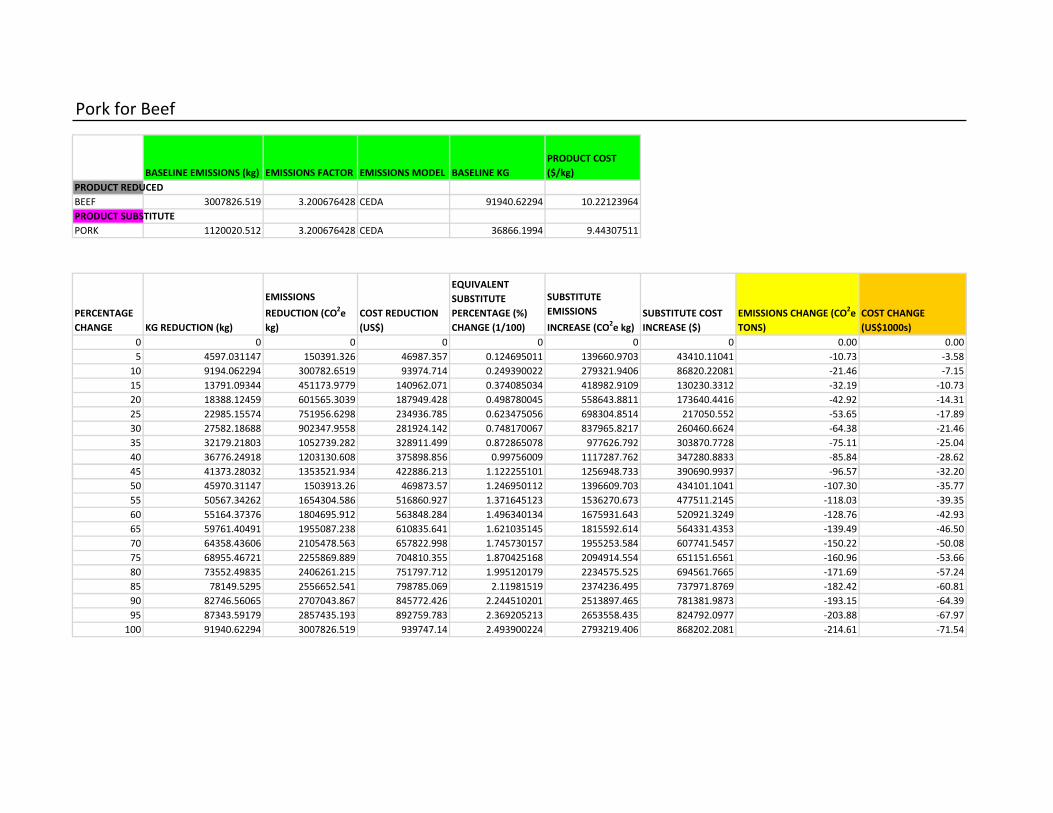
Pork for Beef
BASELINE EMISSIONS (kg) EMISSIONS FACTOR EMISSIONS MODEL BASELINE KG
PRODUCT COST
($/kg)
PRODUCT REDUCED
BEEF 3007826.519 3.200676428 CEDA 91940.62294 10.22123964
PRODUCT SUBSTITUTE
PORK 1120020.512 3.200676428 CEDA 36866.1994 9.44307511
PERCENTAGE
CHANGE KG REDUCTION (kg)
EMISSIONS
REDUCTION (CO2e
kg)
COST REDUCTION
(US$)
EQUIVALENT
SUBSTITUTE
PERCENTAGE (%)
CHANGE (1/100)
SUBSTITUTE
EMISSIONS
INCREASE (CO2e kg)
SUBSTITUTE COST
INCREASE ($)
EMISSIONS CHANGE (CO2e
TONS)
COST CHANGE
(US$1000s)
0 0 0 0 0 0 0 0.00 0.00
5 4597.031147 150391.326 46987.357 0.124695011 139660.9703 43410.11041 -10.73 -3.58
10 9194.062294 300782.6519 93974.714 0.249390022 279321.9406 86820.22081 -21.46 -7.15
15 13791.09344 451173.9779 140962.071 0.374085034 418982.9109 130230.3312 -32.19 -10.73
20 18388.12459 601565.3039 187949.428 0.498780045 558643.8811 173640.4416 -42.92 -14.31
25 22985.15574 751956.6298 234936.785 0.623475056 698304.8514 217050.552 -53.65 -17.89
30 27582.18688 902347.9558 281924.142 0.748170067 837965.8217 260460.6624 -64.38 -21.46
35 32179.21803 1052739.282 328911.499 0.872865078 977626.792 303870.7728 -75.11 -25.04
40 36776.24918 1203130.608 375898.856 0.99756009 1117287.762 347280.8833 -85.84 -28.62
45 41373.28032 1353521.934 422886.213 1.122255101 1256948.733 390690.9937 -96.57 -32.2045 41373.28032 1353521.934 422886.213 1.122255101 1256948.733 390690.9937 -96.57 -32.20
50 45970.31147 1503913.26 469873.57 1.246950112 1396609.703 434101.1041 -107.30 -35.77
55 50567.34262 1654304.586 516860.927 1.371645123 1536270.673 477511.2145 -118.03 -39.35
60 55164.37376 1804695.912 563848.284 1.496340134 1675931.643 520921.3249 -128.76 -42.93
65 59761.40491 1955087.238 610835.641 1.621035145 1815592.614 564331.4353 -139.49 -46.50
70 64358.43606 2105478.563 657822.998 1.745730157 1955253.584 607741.5457 -150.22 -50.08
75 68955.46721 2255869.889 704810.355 1.870425168 2094914.554 651151.6561 -160.96 -53.66
80 73552.49835 2406261.215 751797.712 1.995120179 2234575.525 694561.7665 -171.69 -57.24
85 78149.5295 2556652.541 798785.069 2.11981519 2374236.495 737971.8769 -182.42 -60.81
90 82746.56065 2707043.867 845772.426 2.244510201 2513897.465 781381.9873 -193.15 -64.39
95 87343.59179 2857435.193 892759.783 2.369205213 2653558.435 824792.0977 -203.88 -67.97
100 91940.62294 3007826.519 939747.14 2.493900224 2793219.406 868202.2081 -214.61 -71.54
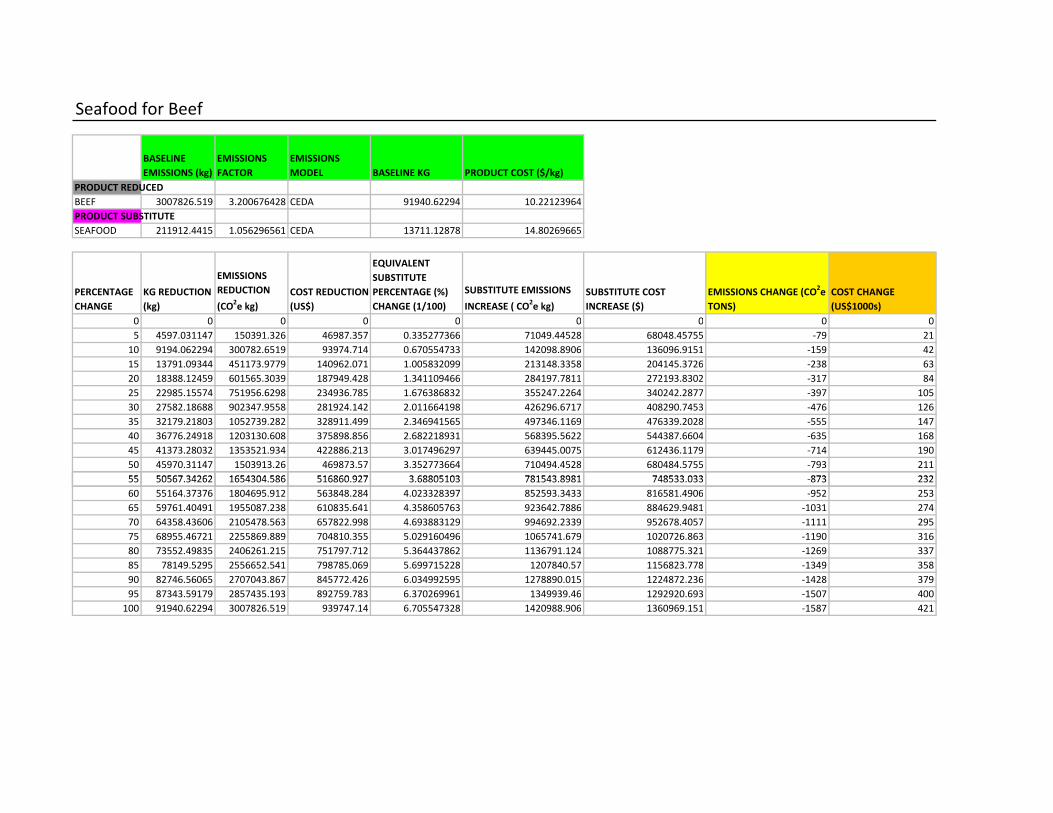
Seafood for Beef
BASELINE
EMISSIONS (kg)
EMISSIONS
FACTOR
EMISSIONS
MODEL BASELINE KG PRODUCT COST ($/kg)
PRODUCT REDUCED
BEEF 3007826.519 3.200676428 CEDA 91940.62294 10.22123964
PRODUCT SUBSTITUTE
SEAFOOD 211912.4415 1.056296561 CEDA 13711.12878 14.80269665
PERCENTAGE
CHANGE
KG REDUCTION
(kg)
EMISSIONS
REDUCTION
(CO2e kg)
COST REDUCTION
(US$)
EQUIVALENT
SUBSTITUTE
PERCENTAGE (%)
CHANGE (1/100)
SUBSTITUTE EMISSIONS
INCREASE ( CO2e kg)
SUBSTITUTE COST
INCREASE ($)
EMISSIONS CHANGE (CO2e
TONS)
COST CHANGE
(US$1000s)
0 0 0 0 0 0 0 0 0
5 4597.031147 150391.326 46987.357 0.335277366 71049.44528 68048.45755 -79 21
10 9194.062294 300782.6519 93974.714 0.670554733 142098.8906 136096.9151 -159 42
15 13791.09344 451173.9779 140962.071 1.005832099 213148.3358 204145.3726 -238 63
20 18388.12459 601565.3039 187949.428 1.341109466 284197.7811 272193.8302 -317 84
25 22985.15574 751956.6298 234936.785 1.676386832 355247.2264 340242.2877 -397 105
30 27582.18688 902347.9558 281924.142 2.011664198 426296.6717 408290.7453 -476 126
35 32179.21803 1052739.282 328911.499 2.346941565 497346.1169 476339.2028 -555 147
40 36776.24918 1203130.608 375898.856 2.682218931 568395.5622 544387.6604 -635 168
45 41373.28032 1353521.934 422886.213 3.017496297 639445.0075 612436.1179 -714 190
50 45970.31147 1503913.26 469873.57 3.352773664 710494.4528 680484.5755 -793 211
55 50567.34262 1654304.586 516860.927 3.68805103 781543.8981 748533.033 -873 23255 50567.34262 1654304.586 516860.927 3.68805103 781543.8981 748533.033 -873 232
60 55164.37376 1804695.912 563848.284 4.023328397 852593.3433 816581.4906 -952 253
65 59761.40491 1955087.238 610835.641 4.358605763 923642.7886 884629.9481 -1031 274
70 64358.43606 2105478.563 657822.998 4.693883129 994692.2339 952678.4057 -1111 295
75 68955.46721 2255869.889 704810.355 5.029160496 1065741.679 1020726.863 -1190 316
80 73552.49835 2406261.215 751797.712 5.364437862 1136791.124 1088775.321 -1269 337
85 78149.5295 2556652.541 798785.069 5.699715228 1207840.57 1156823.778 -1349 358
90 82746.56065 2707043.867 845772.426 6.034992595 1278890.015 1224872.236 -1428 379
95 87343.59179 2857435.193 892759.783 6.370269961 1349939.46 1292920.693 -1507 400
100 91940.62294 3007826.519 939747.14 6.705547328 1420988.906 1360969.151 -1587 421
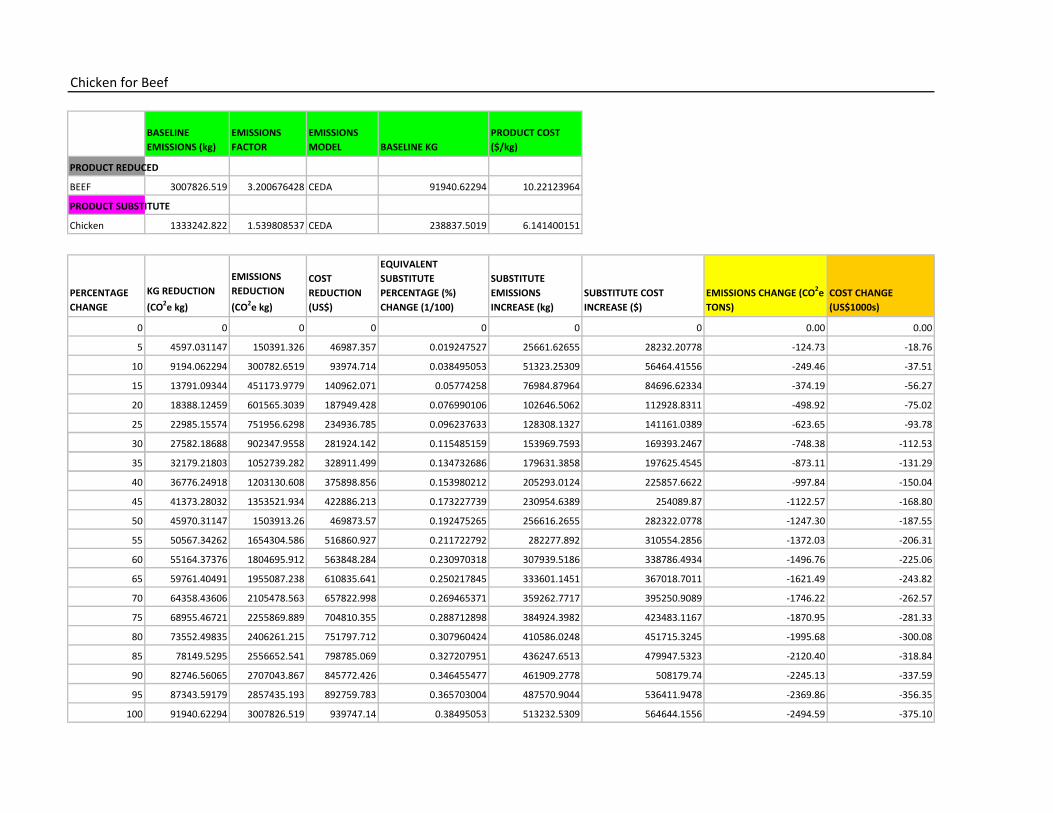
Chicken for Beef
BASELINE
EMISSIONS (kg)
EMISSIONS
FACTOR
EMISSIONS
MODEL BASELINE KG
PRODUCT COST
($/kg)
PRODUCT REDUCED
BEEF 3007826.519 3.200676428 CEDA 91940.62294 10.22123964
PRODUCT SUBSTITUTE
Chicken 1333242.822 1.539808537 CEDA 238837.5019 6.141400151
PERCENTAGE
CHANGE
KG REDUCTION
(CO2e kg)
EMISSIONS
REDUCTION
(CO2e kg)
COST
REDUCTION
(US$)
EQUIVALENT
SUBSTITUTE
PERCENTAGE (%)
CHANGE (1/100)
SUBSTITUTE
EMISSIONS
INCREASE (kg)
SUBSTITUTE COST
INCREASE ($)
EMISSIONS CHANGE (CO2e
TONS)
COST CHANGE
(US$1000s)
0 0 0 0 0 0 0 0.00 0.00
5 4597.031147 150391.326 46987.357 0.019247527 25661.62655 28232.20778 -124.73 -18.76
10 9194.062294 300782.6519 93974.714 0.038495053 51323.25309 56464.41556 -249.46 -37.51
15 13791.09344 451173.9779 140962.071 0.05774258 76984.87964 84696.62334 -374.19 -56.27
20 18388.12459 601565.3039 187949.428 0.076990106 102646.5062 112928.8311 -498.92 -75.02
25 22985.15574 751956.6298 234936.785 0.096237633 128308.1327 141161.0389 -623.65 -93.78
30 27582.18688 902347.9558 281924.142 0.115485159 153969.7593 169393.2467 -748.38 -112.53
35 32179.21803 1052739.282 328911.499 0.134732686 179631.3858 197625.4545 -873.11 -131.29
40 36776.24918 1203130.608 375898.856 0.153980212 205293.0124 225857.6622 -997.84 -150.04
45 41373.28032 1353521.934 422886.213 0.173227739 230954.6389 254089.87 -1122.57 -168.80
50 45970.31147 1503913.26 469873.57 0.192475265 256616.2655 282322.0778 -1247.30 -187.55
55 50567.34262 1654304.586 516860.927 0.211722792 282277.892 310554.2856 -1372.03 -206.31
60 55164.37376 1804695.912 563848.284 0.230970318 307939.5186 338786.4934 -1496.76 -225.06
65 59761.40491 1955087.238 610835.641 0.250217845 333601.1451 367018.7011 -1621.49 -243.82
70 64358.43606 2105478.563 657822.998 0.269465371 359262.7717 395250.9089 -1746.22 -262.57
75 68955.46721 2255869.889 704810.355 0.288712898 384924.3982 423483.1167 -1870.95 -281.33
80 73552.49835 2406261.215 751797.712 0.307960424 410586.0248 451715.3245 -1995.68 -300.08
85 78149.5295 2556652.541 798785.069 0.327207951 436247.6513 479947.5323 -2120.40 -318.84
90 82746.56065 2707043.867 845772.426 0.346455477 461909.2778 508179.74 -2245.13 -337.59
95 87343.59179 2857435.193 892759.783 0.365703004 487570.9044 536411.9478 -2369.86 -356.35
100 91940.62294 3007826.519 939747.14 0.38495053 513232.5309 564644.1556 -2494.59 -375.10
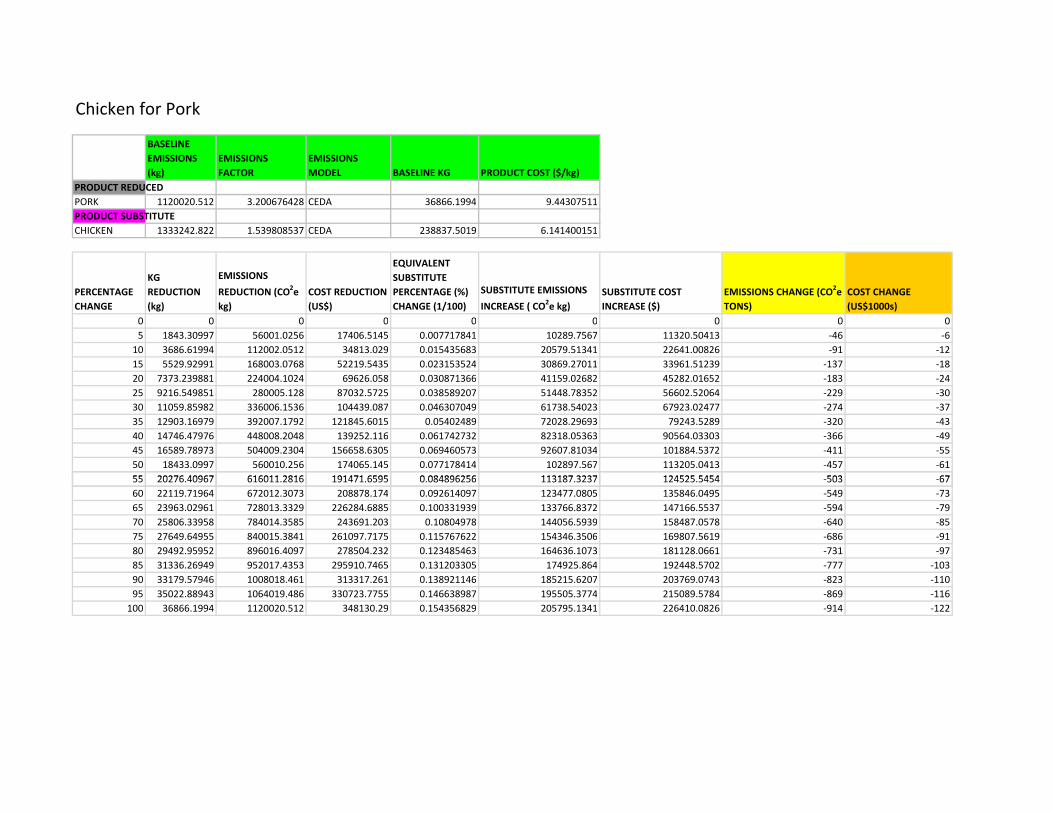
Chicken for Pork
BASELINE
EMISSIONS
(kg)
EMISSIONS
FACTOR
EMISSIONS
MODEL BASELINE KG PRODUCT COST ($/kg)
PRODUCT REDUCED
PORK 1120020.512 3.200676428 CEDA 36866.1994 9.44307511
PRODUCT SUBSTITUTE
CHICKEN 1333242.822 1.539808537 CEDA 238837.5019 6.141400151
PERCENTAGE
CHANGE
KG
REDUCTION
(kg)
EMISSIONS
REDUCTION (CO2e
kg)
COST REDUCTION
(US$)
EQUIVALENT
SUBSTITUTE
PERCENTAGE (%)
CHANGE (1/100)
SUBSTITUTE EMISSIONS
INCREASE ( CO2e kg)
SUBSTITUTE COST
INCREASE ($)
EMISSIONS CHANGE (CO2e
TONS)
COST CHANGE
(US$1000s)
0 0 0 0 0 0 0 0 0
5 1843.30997 56001.0256 17406.5145 0.007717841 10289.7567 11320.50413 -46 -6
10 3686.61994 112002.0512 34813.029 0.015435683 20579.51341 22641.00826 -91 -12
15 5529.92991 168003.0768 52219.5435 0.023153524 30869.27011 33961.51239 -137 -18
20 7373.239881 224004.1024 69626.058 0.030871366 41159.02682 45282.01652 -183 -24
25 9216.549851 280005.128 87032.5725 0.038589207 51448.78352 56602.52064 -229 -30
30 11059.85982 336006.1536 104439.087 0.046307049 61738.54023 67923.02477 -274 -37
35 12903.16979 392007.1792 121845.6015 0.05402489 72028.29693 79243.5289 -320 -43
40 14746.47976 448008.2048 139252.116 0.061742732 82318.05363 90564.03303 -366 -49
45 16589.78973 504009.2304 156658.6305 0.069460573 92607.81034 101884.5372 -411 -55
50 18433.0997 560010.256 174065.145 0.077178414 102897.567 113205.0413 -457 -61
55 20276.40967 616011.2816 191471.6595 0.084896256 113187.3237 124525.5454 -503 -6755 20276.40967 616011.2816 191471.6595 0.084896256 113187.3237 124525.5454 -503 -67
60 22119.71964 672012.3073 208878.174 0.092614097 123477.0805 135846.0495 -549 -73
65 23963.02961 728013.3329 226284.6885 0.100331939 133766.8372 147166.5537 -594 -79
70 25806.33958 784014.3585 243691.203 0.10804978 144056.5939 158487.0578 -640 -85
75 27649.64955 840015.3841 261097.7175 0.115767622 154346.3506 169807.5619 -686 -91
80 29492.95952 896016.4097 278504.232 0.123485463 164636.1073 181128.0661 -731 -97
85 31336.26949 952017.4353 295910.7465 0.131203305 174925.864 192448.5702 -777 -103
90 33179.57946 1008018.461 313317.261 0.138921146 185215.6207 203769.0743 -823 -110
95 35022.88943 1064019.486 330723.7755 0.146638987 195505.3774 215089.5784 -869 -116
100 36866.1994 1120020.512 348130.29 0.154356829 205795.1341 226410.0826 -914 -122
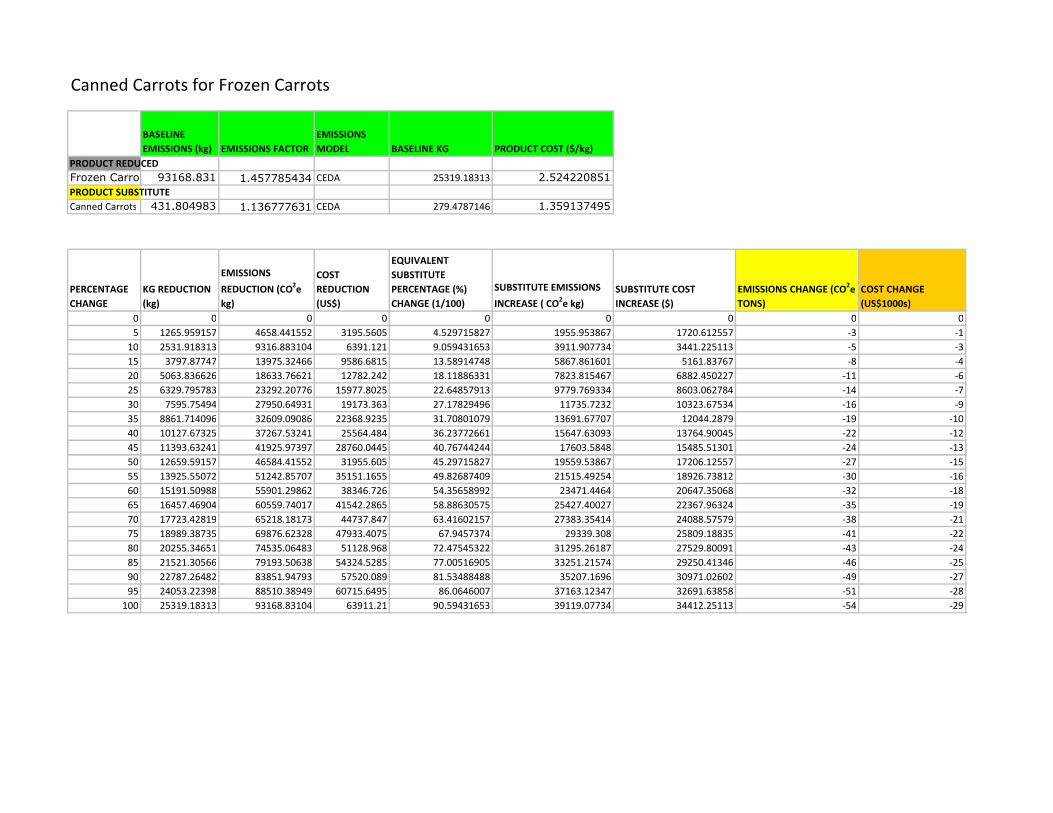
Canned Carrots for Frozen Carrots
BASELINE
EMISSIONS (kg) EMISSIONS FACTOR
EMISSIONS
MODEL BASELINE KG PRODUCT COST ($/kg)
PRODUCT REDUCED
Frozen Carrots 93168.831 1.457785434 CEDA 25319.18313 2.524220851
PRODUCT SUBSTITUTE
Canned Carrots 431.804983 1.136777631 CEDA 279.4787146 1.359137495
PERCENTAGE
CHANGE
KG REDUCTION
(kg)
EMISSIONS
REDUCTION (CO2e
kg)
COST
REDUCTION
(US$)
EQUIVALENT
SUBSTITUTE
PERCENTAGE (%)
CHANGE (1/100)
SUBSTITUTE EMISSIONS
INCREASE ( CO2e kg)
SUBSTITUTE COST
INCREASE ($)
EMISSIONS CHANGE (CO2e
TONS)
COST CHANGE
(US$1000s)
0 0 0 0 0 0 0 0 0
5 1265.959157 4658.441552 3195.5605 4.529715827 1955.953867 1720.612557 -3 -1
10 2531.918313 9316.883104 6391.121 9.059431653 3911.907734 3441.225113 -5 -3
15 3797.87747 13975.32466 9586.6815 13.58914748 5867.861601 5161.83767 -8 -4
20 5063.836626 18633.76621 12782.242 18.11886331 7823.815467 6882.450227 -11 -6
25 6329.795783 23292.20776 15977.8025 22.64857913 9779.769334 8603.062784 -14 -7
30 7595.75494 27950.64931 19173.363 27.17829496 11735.7232 10323.67534 -16 -9
35 8861.714096 32609.09086 22368.9235 31.70801079 13691.67707 12044.2879 -19 -10
40 10127.67325 37267.53241 25564.484 36.23772661 15647.63093 13764.90045 -22 -12
45 11393.63241 41925.97397 28760.0445 40.76744244 17603.5848 15485.51301 -24 -1345 11393.63241 41925.97397 28760.0445 40.76744244 17603.5848 15485.51301 -24 -13
50 12659.59157 46584.41552 31955.605 45.29715827 19559.53867 17206.12557 -27 -15
55 13925.55072 51242.85707 35151.1655 49.82687409 21515.49254 18926.73812 -30 -16
60 15191.50988 55901.29862 38346.726 54.35658992 23471.4464 20647.35068 -32 -18
65 16457.46904 60559.74017 41542.2865 58.88630575 25427.40027 22367.96324 -35 -19
70 17723.42819 65218.18173 44737.847 63.41602157 27383.35414 24088.57579 -38 -21
75 18989.38735 69876.62328 47933.4075 67.9457374 29339.308 25809.18835 -41 -22
80 20255.34651 74535.06483 51128.968 72.47545322 31295.26187 27529.80091 -43 -24
85 21521.30566 79193.50638 54324.5285 77.00516905 33251.21574 29250.41346 -46 -25
90 22787.26482 83851.94793 57520.089 81.53488488 35207.1696 30971.02602 -49 -27
95 24053.22398 88510.38949 60715.6495 86.0646007 37163.12347 32691.63858 -51 -28
100 25319.18313 93168.83104 63911.21 90.59431653 39119.07734 34412.25113 -54 -29
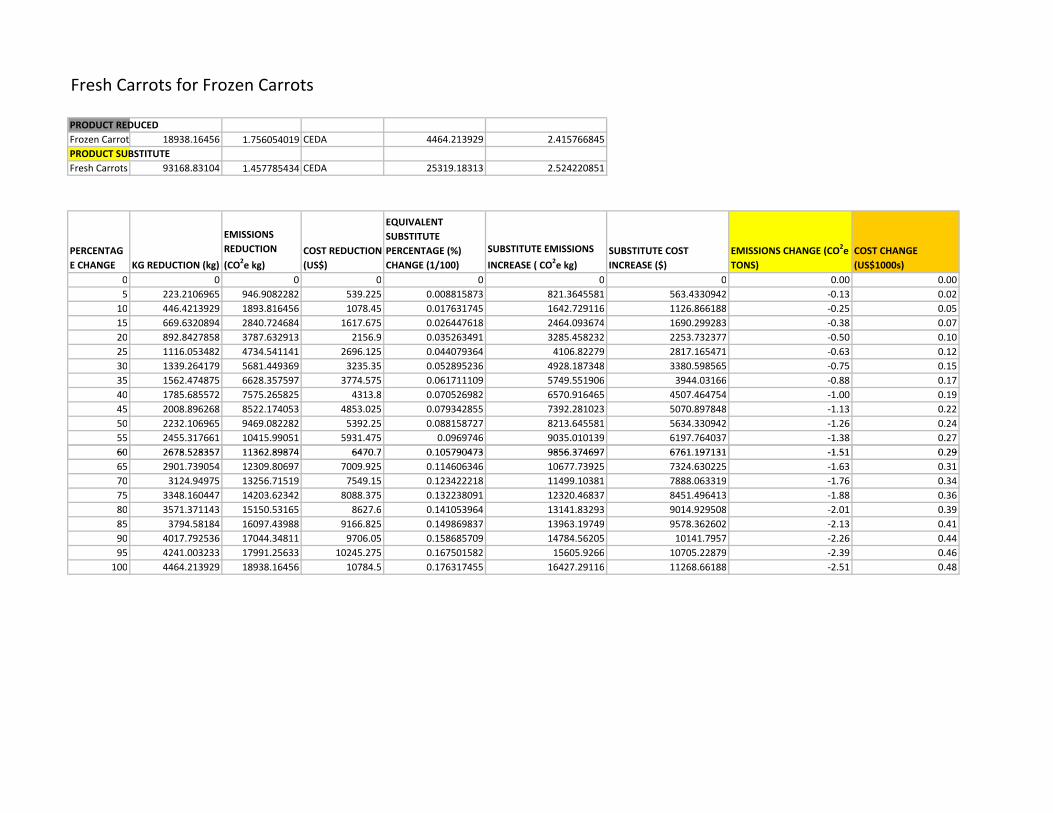
Fresh Carrots for Frozen Carrots
PRODUCT REDUCED
Frozen Carrots 18938.16456 1.756054019 CEDA 4464.213929 2.415766845
PRODUCT SUBSTITUTE
Fresh Carrots 93168.83104 1.457785434 CEDA 25319.18313 2.524220851
PERCENTAG
E CHANGE KG REDUCTION (kg)
EMISSIONS
REDUCTION
(CO2e kg)
COST REDUCTION
(US$)
EQUIVALENT
SUBSTITUTE
PERCENTAGE (%)
CHANGE (1/100)
SUBSTITUTE EMISSIONS
INCREASE ( CO2e kg)
SUBSTITUTE COST
INCREASE ($)
EMISSIONS CHANGE (CO2e
TONS)
COST CHANGE
(US$1000s)
0 0 0 0 0 0 0 0.00 0.00
5 223.2106965 946.9082282 539.225 0.008815873 821.3645581 563.4330942 -0.13 0.02
10 446.4213929 1893.816456 1078.45 0.017631745 1642.729116 1126.866188 -0.25 0.05
15 669.6320894 2840.724684 1617.675 0.026447618 2464.093674 1690.299283 -0.38 0.07
20 892.8427858 3787.632913 2156.9 0.035263491 3285.458232 2253.732377 -0.50 0.10
25 1116.053482 4734.541141 2696.125 0.044079364 4106.82279 2817.165471 -0.63 0.12
30 1339.264179 5681.449369 3235.35 0.052895236 4928.187348 3380.598565 -0.75 0.15
35 1562.474875 6628.357597 3774.575 0.061711109 5749.551906 3944.03166 -0.88 0.17
40 1785.685572 7575.265825 4313.8 0.070526982 6570.916465 4507.464754 -1.00 0.19
45 2008.896268 8522.174053 4853.025 0.079342855 7392.281023 5070.897848 -1.13 0.22
50 2232.106965 9469.082282 5392.25 0.088158727 8213.645581 5634.330942 -1.26 0.24
55 2455.317661 10415.99051 5931.475 0.0969746 9035.010139 6197.764037 -1.38 0.27
60 2678.528357 11362.89874 6470.7 0.105790473 9856.374697 6761.197131 -1.51 0.2960 2678.528357 11362.89874 6470.7 0.105790473 9856.374697 6761.197131 -1.51 0.29
65 2901.739054 12309.80697 7009.925 0.114606346 10677.73925 7324.630225 -1.63 0.31
70 3124.94975 13256.71519 7549.15 0.123422218 11499.10381 7888.063319 -1.76 0.34
75 3348.160447 14203.62342 8088.375 0.132238091 12320.46837 8451.496413 -1.88 0.36
80 3571.371143 15150.53165 8627.6 0.141053964 13141.83293 9014.929508 -2.01 0.39
85 3794.58184 16097.43988 9166.825 0.149869837 13963.19749 9578.362602 -2.13 0.41
90 4017.792536 17044.34811 9706.05 0.158685709 14784.56205 10141.7957 -2.26 0.44
95 4241.003233 17991.25633 10245.275 0.167501582 15605.9266 10705.22879 -2.39 0.46
100 4464.213929 18938.16456 10784.5 0.176317455 16427.29116 11268.66188 -2.51 0.48
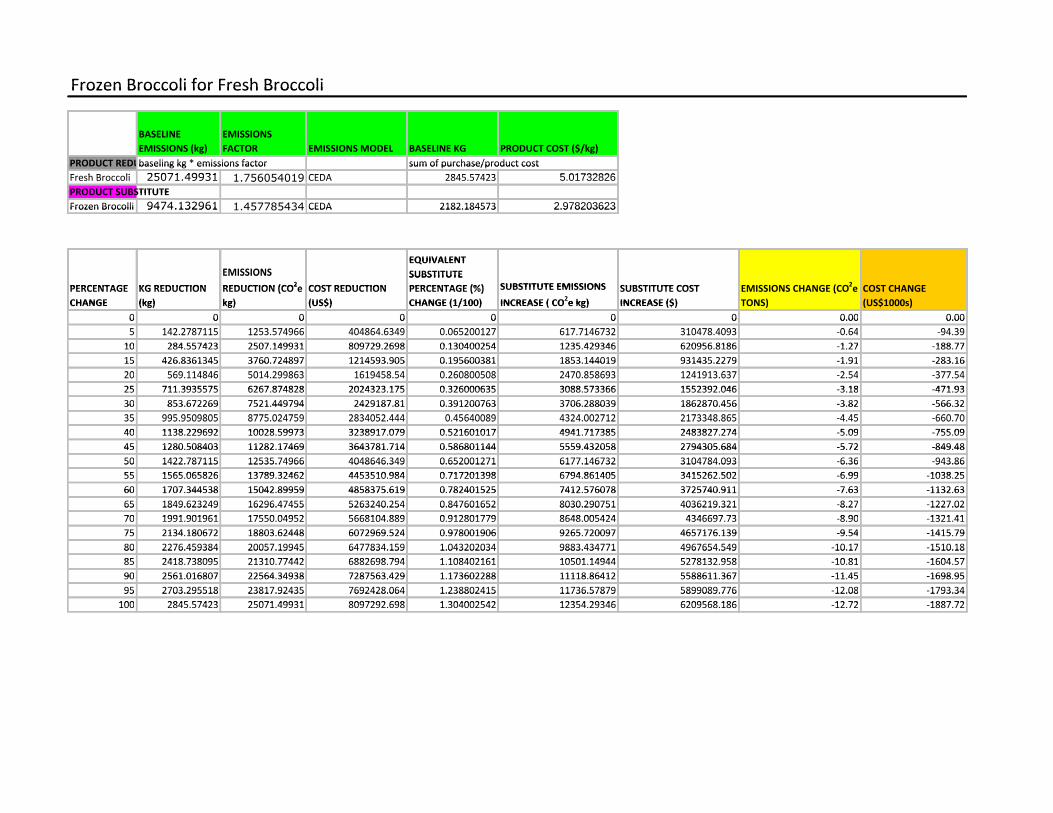
Frozen Broccoli for Fresh BroccoliFrozen Broccoli for Fresh BroccoliFrozen Broccoli for Fresh Broccoli
BASELINE EMISSIONS BASELINE EMISSIONS BASELINE
EMISSIONS (kg)
EMISSIONS
FACTOR EMISSIONS MODEL BASELINE KG PRODUCT COST ($/kg)EMISSIONS (kg) FACTOR EMISSIONS MODEL BASELINE KG PRODUCT COST ($/kg)
PRODUCT REDUCEDbaseling kg * emissions factor sum of purchase/product costPRODUCT REDUCEDbaseling kg * emissions factor sum of purchase/product costPRODUCT REDUCEDbaseling kg * emissions factor sum of purchase/product cost
Fresh Broccoli 25071.49931 1.756054019 CEDA 2845.57423 5.01732826Fresh Broccoli 25071.49931 1.756054019 CEDA 2845.57423 5.01732826Fresh Broccoli 25071.49931 1.756054019 CEDA 2845.57423 5.01732826PRODUCT SUBSTITUTEPRODUCT SUBSTITUTE
Frozen Brocolli 9474.132961 1.457785434 CEDA 2182.184573 2.978203623Frozen Brocolli 9474.132961 1.457785434 CEDA 2182.184573 2.978203623Frozen Brocolli 9474.132961 1.457785434 CEDA 2182.184573 2.978203623
EQUIVALENT
EMISSIONS
EQUIVALENT
SUBSTITUTE EMISSIONS SUBSTITUTE
PERCENTAGE KG REDUCTION
EMISSIONS
REDUCTION (CO2e COST REDUCTION
SUBSTITUTE
PERCENTAGE (%) SUBSTITUTE EMISSIONS SUBSTITUTE COST EMISSIONS CHANGE (CO2e COST CHANGE PERCENTAGE KG REDUCTION REDUCTION (CO
2e COST REDUCTION PERCENTAGE (%) SUBSTITUTE EMISSIONS
2
SUBSTITUTE COST EMISSIONS CHANGE (CO2e COST CHANGE PERCENTAGE
CHANGE
KG REDUCTION
(kg)
REDUCTION (CO e
kg)
COST REDUCTION
(US$)
PERCENTAGE (%)
CHANGE (1/100) INCREASE ( CO2e kg)
SUBSTITUTE COST
INCREASE ($)
EMISSIONS CHANGE (CO e
TONS)
COST CHANGE
(US$1000s)CHANGE (kg) kg) (US$) CHANGE (1/100) INCREASE ( CO2e kg) INCREASE ($) TONS) (US$1000s)
0 0 0 0 0 0 0 0.00 0.000 0 0 0 0 0 0 0.00 0.000 0 0 0 0 0 0 0.00 0.00
5 142.2787115 1253.574966 404864.6349 0.065200127 617.7146732 310478.4093 -0.64 -94.395 142.2787115 1253.574966 404864.6349 0.065200127 617.7146732 310478.4093 -0.64 -94.395 142.2787115 1253.574966 404864.6349 0.065200127 617.7146732 310478.4093 -0.64 -94.39
10 284.557423 2507.149931 809729.2698 0.130400254 1235.429346 620956.8186 -1.27 -188.7710 284.557423 2507.149931 809729.2698 0.130400254 1235.429346 620956.8186 -1.27 -188.77
15 426.8361345 3760.724897 1214593.905 0.195600381 1853.144019 931435.2279 -1.91 -283.1615 426.8361345 3760.724897 1214593.905 0.195600381 1853.144019 931435.2279 -1.91 -283.1615 426.8361345 3760.724897 1214593.905 0.195600381 1853.144019 931435.2279 -1.91 -283.16
20 569.114846 5014.299863 1619458.54 0.260800508 2470.858693 1241913.637 -2.54 -377.5420 569.114846 5014.299863 1619458.54 0.260800508 2470.858693 1241913.637 -2.54 -377.5420 569.114846 5014.299863 1619458.54 0.260800508 2470.858693 1241913.637 -2.54 -377.54
25 711.3935575 6267.874828 2024323.175 0.326000635 3088.573366 1552392.046 -3.18 -471.9325 711.3935575 6267.874828 2024323.175 0.326000635 3088.573366 1552392.046 -3.18 -471.93
30 853.672269 7521.449794 2429187.81 0.391200763 3706.288039 1862870.456 -3.82 -566.3230 853.672269 7521.449794 2429187.81 0.391200763 3706.288039 1862870.456 -3.82 -566.3230 853.672269 7521.449794 2429187.81 0.391200763 3706.288039 1862870.456 -3.82 -566.32
35 995.9509805 8775.024759 2834052.444 0.45640089 4324.002712 2173348.865 -4.45 -660.7035 995.9509805 8775.024759 2834052.444 0.45640089 4324.002712 2173348.865 -4.45 -660.7035 995.9509805 8775.024759 2834052.444 0.45640089 4324.002712 2173348.865 -4.45 -660.70
40 1138.229692 10028.59973 3238917.079 0.521601017 4941.717385 2483827.274 -5.09 -755.0940 1138.229692 10028.59973 3238917.079 0.521601017 4941.717385 2483827.274 -5.09 -755.09
45 1280.508403 11282.17469 3643781.714 0.586801144 5559.432058 2794305.684 -5.72 -849.4845 1280.508403 11282.17469 3643781.714 0.586801144 5559.432058 2794305.684 -5.72 -849.4845 1280.508403 11282.17469 3643781.714 0.586801144 5559.432058 2794305.684 -5.72 -849.48
50 1422.787115 12535.74966 4048646.349 0.652001271 6177.146732 3104784.093 -6.36 -943.8650 1422.787115 12535.74966 4048646.349 0.652001271 6177.146732 3104784.093 -6.36 -943.8650 1422.787115 12535.74966 4048646.349 0.652001271 6177.146732 3104784.093 -6.36 -943.86
55 1565.065826 13789.32462 4453510.984 0.717201398 6794.861405 3415262.502 -6.99 -1038.2555 1565.065826 13789.32462 4453510.984 0.717201398 6794.861405 3415262.502 -6.99 -1038.25
60 1707.344538 15042.89959 4858375.619 0.782401525 7412.576078 3725740.911 -7.63 -1132.63
55 1565.065826 13789.32462 4453510.984 0.717201398 6794.861405 3415262.502 -6.99 -1038.25
60 1707.344538 15042.89959 4858375.619 0.782401525 7412.576078 3725740.911 -7.63 -1132.6360 1707.344538 15042.89959 4858375.619 0.782401525 7412.576078 3725740.911 -7.63 -1132.63
65 1849.623249 16296.47455 5263240.254 0.847601652 8030.290751 4036219.321 -8.27 -1227.0265 1849.623249 16296.47455 5263240.254 0.847601652 8030.290751 4036219.321 -8.27 -1227.0265 1849.623249 16296.47455 5263240.254 0.847601652 8030.290751 4036219.321 -8.27 -1227.02
70 1991.901961 17550.04952 5668104.889 0.912801779 8648.005424 4346697.73 -8.90 -1321.4170 1991.901961 17550.04952 5668104.889 0.912801779 8648.005424 4346697.73 -8.90 -1321.4170 1991.901961 17550.04952 5668104.889 0.912801779 8648.005424 4346697.73 -8.90 -1321.41
75 2134.180672 18803.62448 6072969.524 0.978001906 9265.720097 4657176.139 -9.54 -1415.7975 2134.180672 18803.62448 6072969.524 0.978001906 9265.720097 4657176.139 -9.54 -1415.79
80 2276.459384 20057.19945 6477834.159 1.043202034 9883.434771 4967654.549 -10.17 -1510.1880 2276.459384 20057.19945 6477834.159 1.043202034 9883.434771 4967654.549 -10.17 -1510.1880 2276.459384 20057.19945 6477834.159 1.043202034 9883.434771 4967654.549 -10.17 -1510.18
85 2418.738095 21310.77442 6882698.794 1.108402161 10501.14944 5278132.958 -10.81 -1604.5785 2418.738095 21310.77442 6882698.794 1.108402161 10501.14944 5278132.958 -10.81 -1604.5785 2418.738095 21310.77442 6882698.794 1.108402161 10501.14944 5278132.958 -10.81 -1604.57
90 2561.016807 22564.34938 7287563.429 1.173602288 11118.86412 5588611.367 -11.45 -1698.9590 2561.016807 22564.34938 7287563.429 1.173602288 11118.86412 5588611.367 -11.45 -1698.95
95 2703.295518 23817.92435 7692428.064 1.238802415 11736.57879 5899089.776 -12.08 -1793.3495 2703.295518 23817.92435 7692428.064 1.238802415 11736.57879 5899089.776 -12.08 -1793.3495 2703.295518 23817.92435 7692428.064 1.238802415 11736.57879 5899089.776 -12.08 -1793.34
100 2845.57423 25071.49931 8097292.698 1.304002542 12354.29346 6209568.186 -12.72 -1887.72100 2845.57423 25071.49931 8097292.698 1.304002542 12354.29346 6209568.186 -12.72 -1887.72100 2845.57423 25071.49931 8097292.698 1.304002542 12354.29346 6209568.186 -12.72 -1887.72

Margarine for Butter
BASELINE
EMISSIONS
(kg)
EMISSIONS
FACTOR
EMISSIONS
MODEL BASELINE KG PRODUCT COST ($/kg)
PRODUCT REDUCED
Butter 18504.3884 1.649858894 CEDA 1834.410723 6.114083317
PRODUCT SUBSTITUTE
Margarine 180161.537 2.380323403 CEDA 25504.76285 2.967596305
PERCENTAGE
CHANGE
KG
REDUCTION
(kg)
EMISSIONS
REDUCTION (CO2e
kg)
COST REDUCTION
(US$)
EQUIVALENT
SUBSTITUTE
PERCENTAGE (%)
CHANGE (1/100)
SUBSTITUTE EMISSIONS
INCREASE ( CO2e kg)
SUBSTITUTE COST
INCREASE ($)
EMISSIONS CHANGE (CO2e
TONS)
COST CHANGE
(US$1000s)
0 0 0 0 0 0 0 0.00 0.00
5 91.7205362 925.2194194 560.787 0.003596212 647.8990945 272.1895242 -0.28 -0.29
10 183.441072 1850.438839 1121.574 0.007192424 1295.798189 544.3790484 -0.55 -0.58
15 275.161608 2775.658258 1682.361 0.010788636 1943.697283 816.5685726 -0.83 -0.87
20 366.882145 3700.877678 2243.148 0.014384848 2591.596378 1088.758097 -1.11 -1.15
25 458.602681 4626.097097 2803.935 0.01798106 3239.495472 1360.947621 -1.39 -1.44
30 550.323217 5551.316516 3364.722 0.021577272 3887.394567 1633.137145 -1.66 -1.73
35 642.043753 6476.535936 3925.509 0.025173485 4535.293661 1905.326669 -1.94 -2.02
40 733.764289 7401.755355 4486.296 0.028769697 5183.192756 2177.516194 -2.22 -2.31
45 825.484825 8326.974775 5047.083 0.032365909 5831.09185 2449.705718 -2.50 -2.6045 825.484825 8326.974775 5047.083 0.032365909 5831.09185 2449.705718 -2.50 -2.60
50 917.205362 9252.194194 5607.87 0.035962121 6478.990945 2721.895242 -2.77 -2.89
55 1008.9259 10177.41361 6168.657 0.039558333 7126.890039 2994.084766 -3.05 -3.17
60 1100.64643 11102.63303 6729.444 0.043154545 7774.789134 3266.27429 -3.33 -3.46
65 1192.36697 12027.85245 7290.231 0.046750757 8422.688228 3538.463815 -3.61 -3.75
70 1284.08751 12953.07187 7851.018 0.050346969 9070.587323 3810.653339 -3.88 -4.04
75 1375.80804 13878.29129 8411.805 0.053943181 9718.486417 4082.842863 -4.16 -4.33
80 1467.52858 14803.51071 8972.592 0.057539393 10366.38551 4355.032387 -4.44 -4.62
85 1559.24911 15728.73013 9533.379 0.061135605 11014.28461 4627.221911 -4.71 -4.91
90 1650.96965 16653.94955 10094.166 0.064731817 11662.1837 4899.411436 -4.99 -5.19
95 1742.69019 17579.16897 10654.953 0.068328029 12310.0828 5171.60096 -5.27 -5.48
100 1834.41072 18504.38839 11215.74 0.071924242 12957.98189 5443.790484 -5.55 -5.77
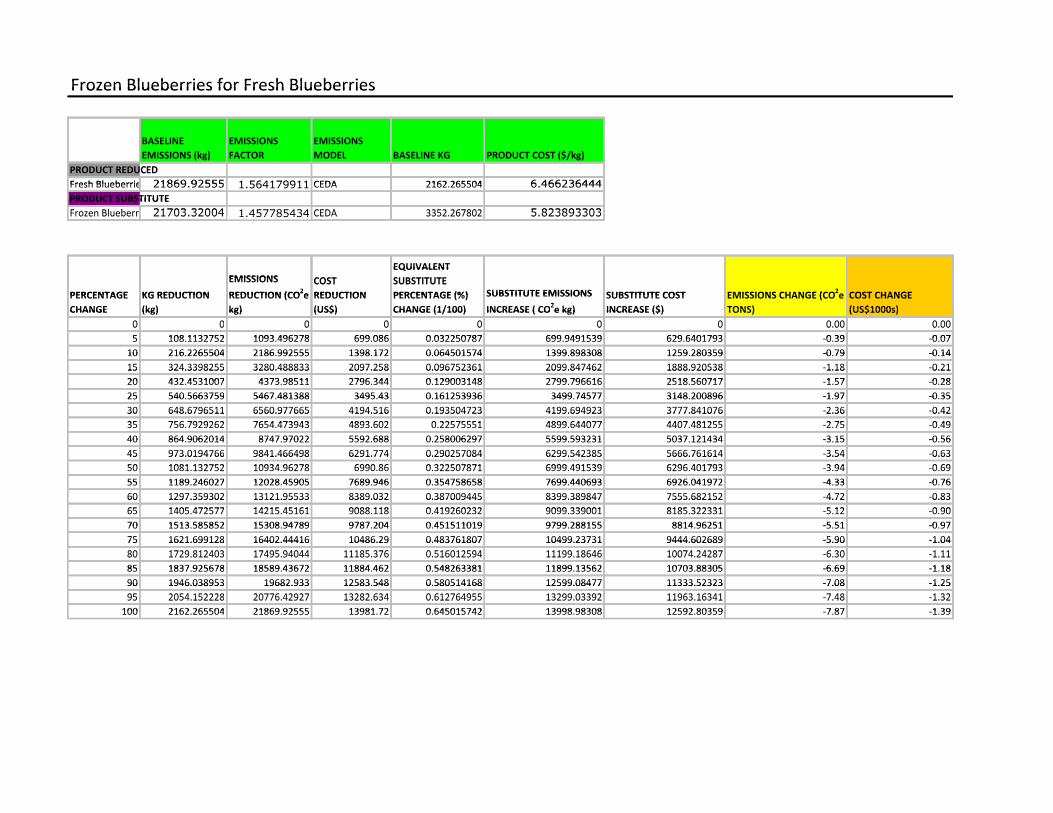
Frozen Blueberries for Fresh BlueberriesFrozen Blueberries for Fresh BlueberriesFrozen Blueberries for Fresh Blueberries
BASELINE EMISSIONS EMISSIONS BASELINE
EMISSIONS (kg)
EMISSIONS
FACTOR
EMISSIONS
MODEL BASELINE KG PRODUCT COST ($/kg)EMISSIONS (kg) FACTOR MODEL BASELINE KG PRODUCT COST ($/kg)EMISSIONS (kg) FACTOR MODEL BASELINE KG PRODUCT COST ($/kg)
PRODUCT REDUCEDPRODUCT REDUCEDPRODUCT REDUCED
Fresh Blueberries 21869.92555 1.564179911 CEDA 2162.265504 6.466236444Fresh Blueberries 21869.92555 1.564179911 CEDA 2162.265504 6.466236444
PRODUCT SUBSTITUTE
1.564179911
PRODUCT SUBSTITUTEPRODUCT SUBSTITUTE
Frozen Blueberries 21703.32004 1.457785434 CEDA 3352.267802 5.823893303Frozen Blueberries 21703.32004 1.457785434 CEDA 3352.267802 5.823893303Frozen Blueberries 21703.32004 1.457785434 CEDA 3352.267802 5.823893303
EQUIVALENT EQUIVALENT
EMISSIONS COST
EQUIVALENT
SUBSTITUTE EMISSIONS 2
COST SUBSTITUTE
SUBSTITUTE EMISSIONS 2PERCENTAGE KG REDUCTION
EMISSIONS
REDUCTION (CO2e
COST
REDUCTION
SUBSTITUTE
PERCENTAGE (%) SUBSTITUTE EMISSIONS SUBSTITUTE COST EMISSIONS CHANGE (CO2e COST CHANGE PERCENTAGE
CHANGE
KG REDUCTION
(kg)
REDUCTION (CO2e
kg)
REDUCTION
(US$)
PERCENTAGE (%)
CHANGE (1/100)
SUBSTITUTE EMISSIONS
INCREASE ( CO2e kg)
SUBSTITUTE COST
INCREASE ($)
EMISSIONS CHANGE (CO2e
TONS)
COST CHANGE
(US$1000s)CHANGE (kg) kg) (US$) CHANGE (1/100) INCREASE ( CO2e kg) INCREASE ($) TONS) (US$1000s)CHANGE (kg) kg) (US$) CHANGE (1/100) INCREASE ( CO e kg) INCREASE ($) TONS) (US$1000s)
0 0 0 0 0 0 0 0.00 0.000 0 0 0 0 0 0 0.00 0.000 0 0 0 0 0 0 0.00 0.00
5 108.1132752 1093.496278 699.086 0.032250787 699.9491539 629.6401793 -0.39 -0.075 108.1132752 1093.496278 699.086 0.032250787 699.9491539 629.6401793 -0.39 -0.07
10 216.2265504 2186.992555 1398.172 0.064501574 1399.898308 1259.280359 -0.79 -0.1410 216.2265504 2186.992555 1398.172 0.064501574 1399.898308 1259.280359 -0.79 -0.1410 216.2265504 2186.992555 1398.172 0.064501574 1399.898308 1259.280359 -0.79 -0.14
15 324.3398255 3280.488833 2097.258 0.096752361 2099.847462 1888.920538 -1.18 -0.2115 324.3398255 3280.488833 2097.258 0.096752361 2099.847462 1888.920538 -1.18 -0.2115 324.3398255 3280.488833 2097.258 0.096752361 2099.847462 1888.920538 -1.18 -0.21
20 432.4531007 4373.98511 2796.344 0.129003148 2799.796616 2518.560717 -1.57 -0.2820 432.4531007 4373.98511 2796.344 0.129003148 2799.796616 2518.560717 -1.57 -0.28
25 540.5663759 5467.481388 3495.43 0.161253936 3499.74577 3148.200896 -1.97 -0.35
20 432.4531007 4373.98511 2796.344 0.129003148 2799.796616 2518.560717 -1.57 -0.28
25 540.5663759 5467.481388 3495.43 0.161253936 3499.74577 3148.200896 -1.97 -0.3525 540.5663759 5467.481388 3495.43 0.161253936 3499.74577 3148.200896 -1.97 -0.35
30 648.6796511 6560.977665 4194.516 0.193504723 4199.694923 3777.841076 -2.36 -0.4230 648.6796511 6560.977665 4194.516 0.193504723 4199.694923 3777.841076 -2.36 -0.4230 648.6796511 6560.977665 4194.516 0.193504723 4199.694923 3777.841076 -2.36 -0.42
35 756.7929262 7654.473943 4893.602 0.22575551 4899.644077 4407.481255 -2.75 -0.4935 756.7929262 7654.473943 4893.602 0.22575551 4899.644077 4407.481255 -2.75 -0.4935 756.7929262 7654.473943 4893.602 0.22575551 4899.644077 4407.481255 -2.75 -0.49
40 864.9062014 8747.97022 5592.688 0.258006297 5599.593231 5037.121434 -3.15 -0.5640 864.9062014 8747.97022 5592.688 0.258006297 5599.593231 5037.121434 -3.15 -0.56
45 973.0194766 9841.466498 6291.774 0.290257084 6299.542385 5666.761614 -3.54 -0.6345 973.0194766 9841.466498 6291.774 0.290257084 6299.542385 5666.761614 -3.54 -0.6345 973.0194766 9841.466498 6291.774 0.290257084 6299.542385 5666.761614 -3.54 -0.63
50 1081.132752 10934.96278 6990.86 0.322507871 6999.491539 6296.401793 -3.94 -0.6950 1081.132752 10934.96278 6990.86 0.322507871 6999.491539 6296.401793 -3.94 -0.6950 1081.132752 10934.96278 6990.86 0.322507871 6999.491539 6296.401793 -3.94 -0.69
55 1189.246027 12028.45905 7689.946 0.354758658 7699.440693 6926.041972 -4.33 -0.7655 1189.246027 12028.45905 7689.946 0.354758658 7699.440693 6926.041972 -4.33 -0.76
60 1297.359302 13121.95533 8389.032 0.387009445 8399.389847 7555.682152 -4.72 -0.8360 1297.359302 13121.95533 8389.032 0.387009445 8399.389847 7555.682152 -4.72 -0.8360 1297.359302 13121.95533 8389.032 0.387009445 8399.389847 7555.682152 -4.72 -0.83
65 1405.472577 14215.45161 9088.118 0.419260232 9099.339001 8185.322331 -5.12 -0.9065 1405.472577 14215.45161 9088.118 0.419260232 9099.339001 8185.322331 -5.12 -0.9065 1405.472577 14215.45161 9088.118 0.419260232 9099.339001 8185.322331 -5.12 -0.90
70 1513.585852 15308.94789 9787.204 0.451511019 9799.288155 8814.96251 -5.51 -0.9770 1513.585852 15308.94789 9787.204 0.451511019 9799.288155 8814.96251 -5.51 -0.97
75 1621.699128 16402.44416 10486.29 0.483761807 10499.23731 9444.602689 -5.90 -1.0475 1621.699128 16402.44416 10486.29 0.483761807 10499.23731 9444.602689 -5.90 -1.0475 1621.699128 16402.44416 10486.29 0.483761807 10499.23731 9444.602689 -5.90 -1.04
80 1729.812403 17495.94044 11185.376 0.516012594 11199.18646 10074.24287 -6.30 -1.1180 1729.812403 17495.94044 11185.376 0.516012594 11199.18646 10074.24287 -6.30 -1.1180 1729.812403 17495.94044 11185.376 0.516012594 11199.18646 10074.24287 -6.30 -1.11
85 1837.925678 18589.43672 11884.462 0.548263381 11899.13562 10703.88305 -6.69 -1.1885 1837.925678 18589.43672 11884.462 0.548263381 11899.13562 10703.88305 -6.69 -1.18
90 1946.038953 19682.933 12583.548 0.580514168 12599.08477 11333.52323 -7.08 -1.2590 1946.038953 19682.933 12583.548 0.580514168 12599.08477 11333.52323 -7.08 -1.2590 1946.038953 19682.933 12583.548 0.580514168 12599.08477 11333.52323 -7.08 -1.25
95 2054.152228 20776.42927 13282.634 0.612764955 13299.03392 11963.16341 -7.48 -1.3295 2054.152228 20776.42927 13282.634 0.612764955 13299.03392 11963.16341 -7.48 -1.3295 2054.152228 20776.42927 13282.634 0.612764955 13299.03392 11963.16341 -7.48 -1.32
100 2162.265504 21869.92555 13981.72 0.645015742 13998.98308 12592.80359 -7.87 -1.39100 2162.265504 21869.92555 13981.72 0.645015742 13998.98308 12592.80359 -7.87 -1.39

Fresh Spinach for Frozen SpinachFresh Spinach for Frozen SpinachFresh Spinach for Frozen Spinach
BASELINE BASELINE BASELINE
EMISSIONS EMISSIONS EMISSIONS
(kg)
EMISSIONS
FACTOR EMISSIONS MODEL BASELINE KG PRODUCT COST ($/kg)(kg) FACTOR EMISSIONS MODEL BASELINE KG PRODUCT COST ($/kg)(kg) FACTOR EMISSIONS MODEL BASELINE KG PRODUCT COST ($/kg)
PRODUCT REDUCEDPRODUCT REDUCEDPRODUCT REDUCED
Frozen Spinach 11345.128 1.457785434 CEDA 1350.539266 3.196641601Frozen Spinach 11345.128 1.457785434 CEDA 1350.539266 3.196641601
PRODUCT SUBSTITUTE
1.457785434
PRODUCT SUBSTITUTEPRODUCT SUBSTITUTE
Fresh Spinach 7581.2188 1.756054019 CEDA 1264.776876 6.153211802Fresh Spinach 7581.2188 1.756054019 CEDA 1264.776876 6.153211802Fresh Spinach 7581.2188 1.756054019 CEDA 1264.776876 6.153211802
EQUIVALENT EQUIVALENT
KG EMISSIONS
EQUIVALENT
SUBSTITUTE KG EMISSIONS 2
SUBSTITUTE
SUBSTITUTE EMISSIONS 2PERCENTAGE
KG
REDUCTION
EMISSIONS
REDUCTION (CO2e COST REDUCTION
SUBSTITUTE
PERCENTAGE (%) SUBSTITUTE EMISSIONS SUBSTITUTE COST EMISSIONS CHANGE (CO2e COST CHANGE PERCENTAGE
CHANGE
REDUCTION
(kg)
REDUCTION (CO2e
kg)
COST REDUCTION
(US$)
PERCENTAGE (%)
CHANGE (1/100)
SUBSTITUTE EMISSIONS
INCREASE ( CO2e kg)
SUBSTITUTE COST
INCREASE ($)
EMISSIONS CHANGE (CO2e
TONS)
COST CHANGE
(US$1000s)CHANGE (kg) kg) (US$) CHANGE (1/100) INCREASE ( CO2e kg) INCREASE ($) TONS) (US$1000s)CHANGE (kg) kg) (US$) CHANGE (1/100) INCREASE ( CO e kg) INCREASE ($) TONS) (US$1000s)
0 0 0 0 0 0 0 0.00 0.000 0 0 0 0 0 0 0.00 0.000 0 0 0 0 0 0 0.00 0.00
5 67.52696328 567.2563838 215.8595 0.053390416 404.7644265 415.5077074 -0.16 0.205 67.52696328 567.2563838 215.8595 0.053390416 404.7644265 415.5077074 -0.16 0.20
10 135.0539266 1134.512768 431.719 0.106780832 809.5288529 831.0154148 -0.32 0.4010 135.0539266 1134.512768 431.719 0.106780832 809.5288529 831.0154148 -0.32 0.4010 135.0539266 1134.512768 431.719 0.106780832 809.5288529 831.0154148 -0.32 0.40
15 202.5808898 1701.769151 647.5785 0.160171247 1214.293279 1246.523122 -0.49 0.6015 202.5808898 1701.769151 647.5785 0.160171247 1214.293279 1246.523122 -0.49 0.6015 202.5808898 1701.769151 647.5785 0.160171247 1214.293279 1246.523122 -0.49 0.60
20 270.1078531 2269.025535 863.438 0.213561663 1619.057706 1662.03083 -0.65 0.8020 270.1078531 2269.025535 863.438 0.213561663 1619.057706 1662.03083 -0.65 0.80
25 337.6348164 2836.281919 1079.2975 0.266952079 2023.822132 2077.538537 -0.81 1.00
20 270.1078531 2269.025535 863.438 0.213561663 1619.057706 1662.03083 -0.65 0.80
25 337.6348164 2836.281919 1079.2975 0.266952079 2023.822132 2077.538537 -0.81 1.0025 337.6348164 2836.281919 1079.2975 0.266952079 2023.822132 2077.538537 -0.81 1.00
30 405.1617797 3403.538303 1295.157 0.320342495 2428.586559 2493.046244 -0.97 1.2030 405.1617797 3403.538303 1295.157 0.320342495 2428.586559 2493.046244 -0.97 1.2030 405.1617797 3403.538303 1295.157 0.320342495 2428.586559 2493.046244 -0.97 1.20
35 472.6887429 3970.794687 1511.0165 0.37373291 2833.350985 2908.553952 -1.14 1.4035 472.6887429 3970.794687 1511.0165 0.37373291 2833.350985 2908.553952 -1.14 1.4035 472.6887429 3970.794687 1511.0165 0.37373291 2833.350985 2908.553952 -1.14 1.40
40 540.2157062 4538.051071 1726.876 0.427123326 3238.115412 3324.061659 -1.30 1.6040 540.2157062 4538.051071 1726.876 0.427123326 3238.115412 3324.061659 -1.30 1.60
45 607.7426695 5105.307454 1942.7355 0.480513742 3642.879838 3739.569367 -1.46 1.8045 607.7426695 5105.307454 1942.7355 0.480513742 3642.879838 3739.569367 -1.46 1.8045 607.7426695 5105.307454 1942.7355 0.480513742 3642.879838 3739.569367 -1.46 1.80
50 675.2696328 5672.563838 2158.595 0.533904158 4047.644265 4155.077074 -1.62 2.0050 675.2696328 5672.563838 2158.595 0.533904158 4047.644265 4155.077074 -1.62 2.0050 675.2696328 5672.563838 2158.595 0.533904158 4047.644265 4155.077074 -1.62 2.00
55 742.796596 6239.820222 2374.4545 0.587294574 4452.408691 4570.584781 -1.79 2.2055 742.796596 6239.820222 2374.4545 0.587294574 4452.408691 4570.584781 -1.79 2.20
60 810.3235593 6807.076606 2590.314 0.640684989 4857.173117 4986.092489 -1.95 2.4060 810.3235593 6807.076606 2590.314 0.640684989 4857.173117 4986.092489 -1.95 2.4060 810.3235593 6807.076606 2590.314 0.640684989 4857.173117 4986.092489 -1.95 2.40
65 877.8505226 7374.33299 2806.1735 0.694075405 5261.937544 5401.600196 -2.11 2.6065 877.8505226 7374.33299 2806.1735 0.694075405 5261.937544 5401.600196 -2.11 2.6065 877.8505226 7374.33299 2806.1735 0.694075405 5261.937544 5401.600196 -2.11 2.60
70 945.3774859 7941.589374 3022.033 0.747465821 5666.70197 5817.107904 -2.27 2.8070 945.3774859 7941.589374 3022.033 0.747465821 5666.70197 5817.107904 -2.27 2.80
75 1012.904449 8508.845757 3237.8925 0.800856237 6071.466397 6232.615611 -2.44 2.9975 1012.904449 8508.845757 3237.8925 0.800856237 6071.466397 6232.615611 -2.44 2.9975 1012.904449 8508.845757 3237.8925 0.800856237 6071.466397 6232.615611 -2.44 2.99
80 1080.431412 9076.102141 3453.752 0.854246653 6476.230823 6648.123318 -2.60 3.1980 1080.431412 9076.102141 3453.752 0.854246653 6476.230823 6648.123318 -2.60 3.1980 1080.431412 9076.102141 3453.752 0.854246653 6476.230823 6648.123318 -2.60 3.19
85 1147.958376 9643.358525 3669.6115 0.907637068 6880.99525 7063.631026 -2.76 3.3985 1147.958376 9643.358525 3669.6115 0.907637068 6880.99525 7063.631026 -2.76 3.39
90 1215.485339 10210.61491 3885.471 0.961027484 7285.759676 7479.138733 -2.92 3.5990 1215.485339 10210.61491 3885.471 0.961027484 7285.759676 7479.138733 -2.92 3.5990 1215.485339 10210.61491 3885.471 0.961027484 7285.759676 7479.138733 -2.92 3.59
95 1283.012302 10777.87129 4101.3305 1.0144179 7690.524103 7894.646441 -3.09 3.7995 1283.012302 10777.87129 4101.3305 1.0144179 7690.524103 7894.646441 -3.09 3.7995 1283.012302 10777.87129 4101.3305 1.0144179 7690.524103 7894.646441 -3.09 3.79
100 1350.539266 11345.12768 4317.19 1.067808316 8095.288529 8310.154148 -3.25 3.99100 1350.539266 11345.12768 4317.19 1.067808316 8095.288529 8310.154148 -3.25 3.99
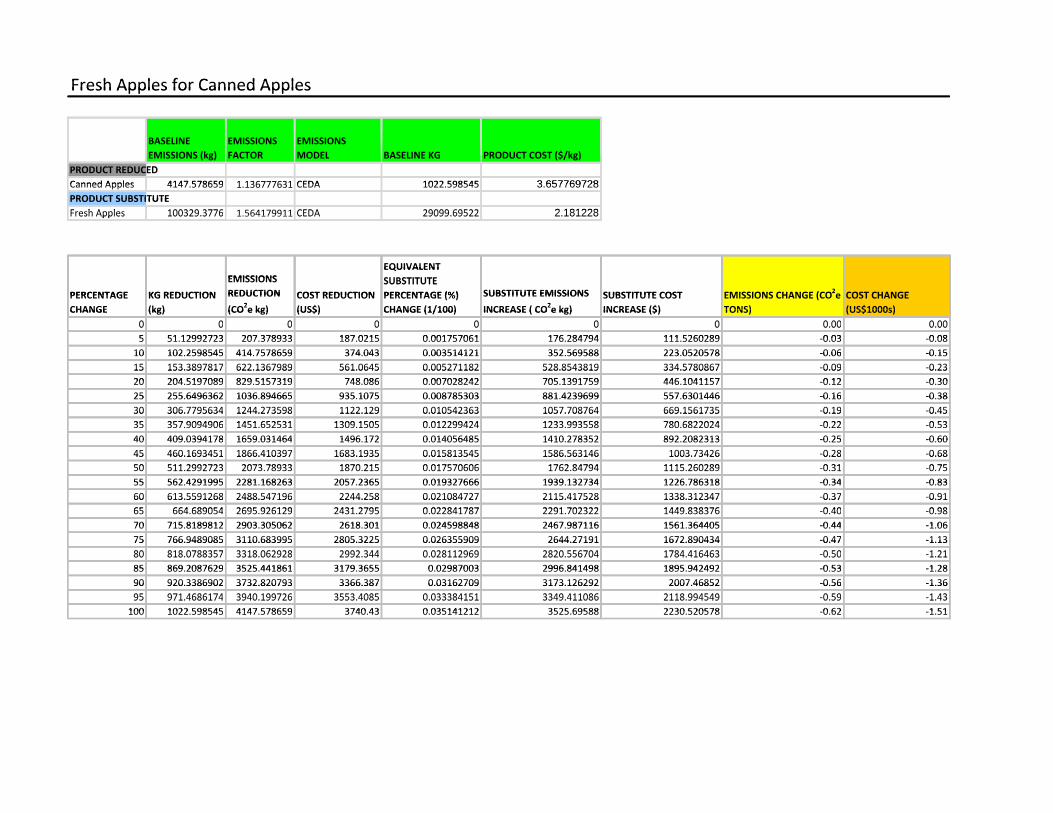
Fresh Apples for Canned ApplesFresh Apples for Canned ApplesFresh Apples for Canned Apples
BASELINE EMISSIONS EMISSIONS BASELINE
EMISSIONS (kg)
EMISSIONS
FACTOR
EMISSIONS
MODEL BASELINE KG PRODUCT COST ($/kg)EMISSIONS (kg) FACTOR MODEL BASELINE KG PRODUCT COST ($/kg)EMISSIONS (kg) FACTOR MODEL BASELINE KG PRODUCT COST ($/kg)
PRODUCT REDUCEDPRODUCT REDUCEDPRODUCT REDUCED
Canned Apples 4147.578659 1.136777631 CEDA 1022.598545 3.657769728Canned Apples 4147.578659 1.136777631 CEDA 1022.598545 3.657769728PRODUCT SUBSTITUTEPRODUCT SUBSTITUTEPRODUCT SUBSTITUTE
Fresh Apples 100329.3776 1.564179911 CEDA 29099.69522 2.181228Fresh Apples 100329.3776 1.564179911 CEDA 29099.69522 2.181228Fresh Apples 100329.3776 1.564179911 CEDA 29099.69522 2.181228
EQUIVALENT EQUIVALENT
EMISSIONS
EQUIVALENT
SUBSTITUTE EMISSIONS
REDUCTION
SUBSTITUTE
SUBSTITUTE EMISSIONS 2PERCENTAGE KG REDUCTION
EMISSIONS
REDUCTION COST REDUCTION
SUBSTITUTE
PERCENTAGE (%) SUBSTITUTE EMISSIONS SUBSTITUTE COST EMISSIONS CHANGE (CO2e COST CHANGE PERCENTAGE
CHANGE
KG REDUCTION
(kg)
REDUCTION
(CO2e kg)
COST REDUCTION
(US$)
PERCENTAGE (%)
CHANGE (1/100)
SUBSTITUTE EMISSIONS
INCREASE ( CO2e kg)
SUBSTITUTE COST
INCREASE ($)
EMISSIONS CHANGE (CO2e
TONS)
COST CHANGE
(US$1000s)CHANGE (kg) (CO2e kg) (US$) CHANGE (1/100) INCREASE ( CO
2e kg) INCREASE ($) TONS) (US$1000s)CHANGE (kg) (CO e kg) (US$) CHANGE (1/100) INCREASE ( CO e kg) INCREASE ($) TONS) (US$1000s)
0 0 0 0 0 0 0 0.00 0.000 0 0 0 0 0 0 0.00 0.000 0 0 0 0 0 0 0.00 0.00
5 51.12992723 207.378933 187.0215 0.001757061 176.284794 111.5260289 -0.03 -0.085 51.12992723 207.378933 187.0215 0.001757061 176.284794 111.5260289 -0.03 -0.08
10 102.2598545 414.7578659 374.043 0.003514121 352.569588 223.0520578 -0.06 -0.1510 102.2598545 414.7578659 374.043 0.003514121 352.569588 223.0520578 -0.06 -0.1510 102.2598545 414.7578659 374.043 0.003514121 352.569588 223.0520578 -0.06 -0.15
15 153.3897817 622.1367989 561.0645 0.005271182 528.8543819 334.5780867 -0.09 -0.2315 153.3897817 622.1367989 561.0645 0.005271182 528.8543819 334.5780867 -0.09 -0.2315 153.3897817 622.1367989 561.0645 0.005271182 528.8543819 334.5780867 -0.09 -0.23
20 204.5197089 829.5157319 748.086 0.007028242 705.1391759 446.1041157 -0.12 -0.3020 204.5197089 829.5157319 748.086 0.007028242 705.1391759 446.1041157 -0.12 -0.30
25 255.6496362 1036.894665 935.1075 0.008785303 881.4239699 557.6301446 -0.16 -0.38
20 204.5197089 829.5157319 748.086 0.007028242 705.1391759 446.1041157 -0.12 -0.30
25 255.6496362 1036.894665 935.1075 0.008785303 881.4239699 557.6301446 -0.16 -0.3825 255.6496362 1036.894665 935.1075 0.008785303 881.4239699 557.6301446 -0.16 -0.38
30 306.7795634 1244.273598 1122.129 0.010542363 1057.708764 669.1561735 -0.19 -0.4530 306.7795634 1244.273598 1122.129 0.010542363 1057.708764 669.1561735 -0.19 -0.4530 306.7795634 1244.273598 1122.129 0.010542363 1057.708764 669.1561735 -0.19 -0.45
35 357.9094906 1451.652531 1309.1505 0.012299424 1233.993558 780.6822024 -0.22 -0.5335 357.9094906 1451.652531 1309.1505 0.012299424 1233.993558 780.6822024 -0.22 -0.5335 357.9094906 1451.652531 1309.1505 0.012299424 1233.993558 780.6822024 -0.22 -0.53
40 409.0394178 1659.031464 1496.172 0.014056485 1410.278352 892.2082313 -0.25 -0.6040 409.0394178 1659.031464 1496.172 0.014056485 1410.278352 892.2082313 -0.25 -0.60
45 460.1693451 1866.410397 1683.1935 0.015813545 1586.563146 1003.73426 -0.28 -0.6845 460.1693451 1866.410397 1683.1935 0.015813545 1586.563146 1003.73426 -0.28 -0.6845 460.1693451 1866.410397 1683.1935 0.015813545 1586.563146 1003.73426 -0.28 -0.68
50 511.2992723 2073.78933 1870.215 0.017570606 1762.84794 1115.260289 -0.31 -0.7550 511.2992723 2073.78933 1870.215 0.017570606 1762.84794 1115.260289 -0.31 -0.7550 511.2992723 2073.78933 1870.215 0.017570606 1762.84794 1115.260289 -0.31 -0.75
55 562.4291995 2281.168263 2057.2365 0.019327666 1939.132734 1226.786318 -0.34 -0.8355 562.4291995 2281.168263 2057.2365 0.019327666 1939.132734 1226.786318 -0.34 -0.83
60 613.5591268 2488.547196 2244.258 0.021084727 2115.417528 1338.312347 -0.37 -0.9160 613.5591268 2488.547196 2244.258 0.021084727 2115.417528 1338.312347 -0.37 -0.9160 613.5591268 2488.547196 2244.258 0.021084727 2115.417528 1338.312347 -0.37 -0.91
65 664.689054 2695.926129 2431.2795 0.022841787 2291.702322 1449.838376 -0.40 -0.9865 664.689054 2695.926129 2431.2795 0.022841787 2291.702322 1449.838376 -0.40 -0.9865 664.689054 2695.926129 2431.2795 0.022841787 2291.702322 1449.838376 -0.40 -0.98
70 715.8189812 2903.305062 2618.301 0.024598848 2467.987116 1561.364405 -0.44 -1.0670 715.8189812 2903.305062 2618.301 0.024598848 2467.987116 1561.364405 -0.44 -1.06
75 766.9489085 3110.683995 2805.3225 0.026355909 2644.27191 1672.890434 -0.47 -1.1375 766.9489085 3110.683995 2805.3225 0.026355909 2644.27191 1672.890434 -0.47 -1.1375 766.9489085 3110.683995 2805.3225 0.026355909 2644.27191 1672.890434 -0.47 -1.13
80 818.0788357 3318.062928 2992.344 0.028112969 2820.556704 1784.416463 -0.50 -1.2180 818.0788357 3318.062928 2992.344 0.028112969 2820.556704 1784.416463 -0.50 -1.2180 818.0788357 3318.062928 2992.344 0.028112969 2820.556704 1784.416463 -0.50 -1.21
85 869.2087629 3525.441861 3179.3655 0.02987003 2996.841498 1895.942492 -0.53 -1.2885 869.2087629 3525.441861 3179.3655 0.02987003 2996.841498 1895.942492 -0.53 -1.28
90 920.3386902 3732.820793 3366.387 0.03162709 3173.126292 2007.46852 -0.56 -1.3690 920.3386902 3732.820793 3366.387 0.03162709 3173.126292 2007.46852 -0.56 -1.3690 920.3386902 3732.820793 3366.387 0.03162709 3173.126292 2007.46852 -0.56 -1.36
95 971.4686174 3940.199726 3553.4085 0.033384151 3349.411086 2118.994549 -0.59 -1.4395 971.4686174 3940.199726 3553.4085 0.033384151 3349.411086 2118.994549 -0.59 -1.4395 971.4686174 3940.199726 3553.4085 0.033384151 3349.411086 2118.994549 -0.59 -1.43
100 1022.598545 4147.578659 3740.43 0.035141212 3525.69588 2230.520578 -0.62 -1.51100 1022.598545 4147.578659 3740.43 0.035141212 3525.69588 2230.520578 -0.62 -1.51
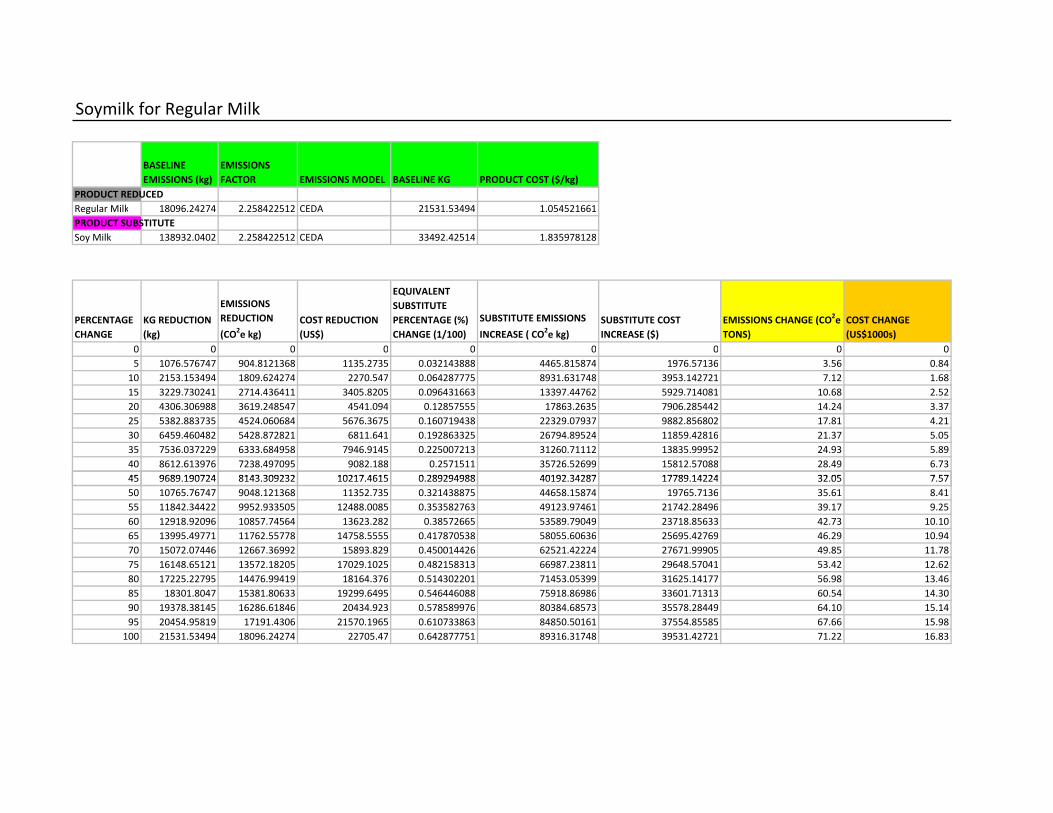
Soymilk for Regular Milk
BASELINE
EMISSIONS (kg)
EMISSIONS
FACTOR EMISSIONS MODEL BASELINE KG PRODUCT COST ($/kg)
PRODUCT REDUCED
Regular Milk 18096.24274 2.258422512 CEDA 21531.53494 1.054521661
PRODUCT SUBSTITUTE
Soy Milk 138932.0402 2.258422512 CEDA 33492.42514 1.835978128
PERCENTAGE
CHANGE
KG REDUCTION
(kg)
EMISSIONS
REDUCTION
(CO2e kg)
COST REDUCTION
(US$)
EQUIVALENT
SUBSTITUTE
PERCENTAGE (%)
CHANGE (1/100)
SUBSTITUTE EMISSIONS
INCREASE ( CO2e kg)
SUBSTITUTE COST
INCREASE ($)
EMISSIONS CHANGE (CO2e
TONS)
COST CHANGE
(US$1000s)
0 0 0 0 0 0 0 0 0
5 1076.576747 904.8121368 1135.2735 0.032143888 4465.815874 1976.57136 3.56 0.84
10 2153.153494 1809.624274 2270.547 0.064287775 8931.631748 3953.142721 7.12 1.68
15 3229.730241 2714.436411 3405.8205 0.096431663 13397.44762 5929.714081 10.68 2.52
20 4306.306988 3619.248547 4541.094 0.12857555 17863.2635 7906.285442 14.24 3.37
25 5382.883735 4524.060684 5676.3675 0.160719438 22329.07937 9882.856802 17.81 4.21
30 6459.460482 5428.872821 6811.641 0.192863325 26794.89524 11859.42816 21.37 5.05
35 7536.037229 6333.684958 7946.9145 0.225007213 31260.71112 13835.99952 24.93 5.89
40 8612.613976 7238.497095 9082.188 0.2571511 35726.52699 15812.57088 28.49 6.73
45 9689.190724 8143.309232 10217.4615 0.289294988 40192.34287 17789.14224 32.05 7.5745 9689.190724 8143.309232 10217.4615 0.289294988 40192.34287 17789.14224 32.05 7.57
50 10765.76747 9048.121368 11352.735 0.321438875 44658.15874 19765.7136 35.61 8.41
55 11842.34422 9952.933505 12488.0085 0.353582763 49123.97461 21742.28496 39.17 9.25
60 12918.92096 10857.74564 13623.282 0.38572665 53589.79049 23718.85633 42.73 10.10
65 13995.49771 11762.55778 14758.5555 0.417870538 58055.60636 25695.42769 46.29 10.94
70 15072.07446 12667.36992 15893.829 0.450014426 62521.42224 27671.99905 49.85 11.78
75 16148.65121 13572.18205 17029.1025 0.482158313 66987.23811 29648.57041 53.42 12.62
80 17225.22795 14476.99419 18164.376 0.514302201 71453.05399 31625.14177 56.98 13.46
85 18301.8047 15381.80633 19299.6495 0.546446088 75918.86986 33601.71313 60.54 14.30
90 19378.38145 16286.61846 20434.923 0.578589976 80384.68573 35578.28449 64.10 15.14
95 20454.95819 17191.4306 21570.1965 0.610733863 84850.50161 37554.85585 67.66 15.98
100 21531.53494 18096.24274 22705.47 0.642877751 89316.31748 39531.42721 71.22 16.83
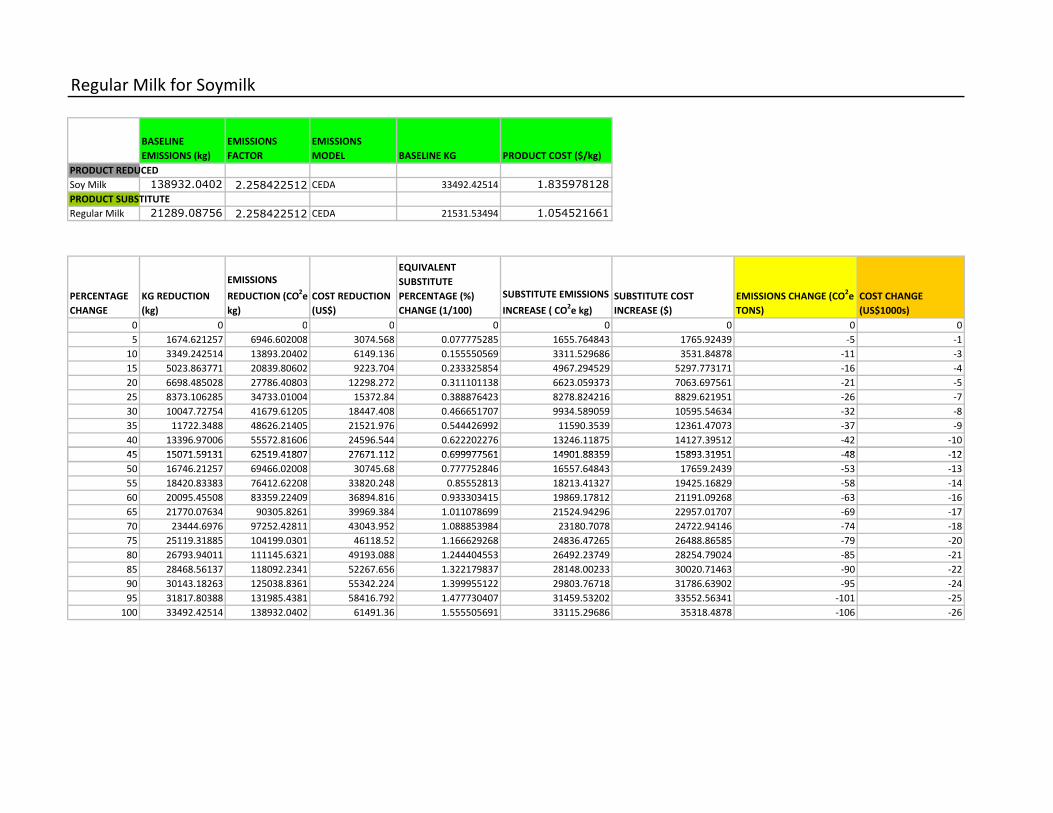
Regular Milk for Soymilk
BASELINE
EMISSIONS (kg)
EMISSIONS
FACTOR
EMISSIONS
MODEL BASELINE KG PRODUCT COST ($/kg)
PRODUCT REDUCED
Soy Milk 138932.0402 2.258422512 CEDA 33492.42514 1.835978128
PRODUCT SUBSTITUTE
Regular Milk 21289.08756 2.258422512 CEDA 21531.53494 1.054521661
PERCENTAGE
CHANGE
KG REDUCTION
(kg)
EMISSIONS
REDUCTION (CO2e
kg)
COST REDUCTION
(US$)
EQUIVALENT
SUBSTITUTE
PERCENTAGE (%)
CHANGE (1/100)
SUBSTITUTE EMISSIONS
INCREASE ( CO2e kg)
SUBSTITUTE COST
INCREASE ($)
EMISSIONS CHANGE (CO2e
TONS)
COST CHANGE
(US$1000s)
0 0 0 0 0 0 0 0 0
5 1674.621257 6946.602008 3074.568 0.077775285 1655.764843 1765.92439 -5 -1
10 3349.242514 13893.20402 6149.136 0.155550569 3311.529686 3531.84878 -11 -3
15 5023.863771 20839.80602 9223.704 0.233325854 4967.294529 5297.773171 -16 -4
20 6698.485028 27786.40803 12298.272 0.311101138 6623.059373 7063.697561 -21 -5
25 8373.106285 34733.01004 15372.84 0.388876423 8278.824216 8829.621951 -26 -7
30 10047.72754 41679.61205 18447.408 0.466651707 9934.589059 10595.54634 -32 -8
35 11722.3488 48626.21405 21521.976 0.544426992 11590.3539 12361.47073 -37 -9
40 13396.97006 55572.81606 24596.544 0.622202276 13246.11875 14127.39512 -42 -10
45 15071.59131 62519.41807 27671.112 0.699977561 14901.88359 15893.31951 -48 -1245 15071.59131 62519.41807 27671.112 0.699977561 14901.88359 15893.31951 -48 -12
50 16746.21257 69466.02008 30745.68 0.777752846 16557.64843 17659.2439 -53 -13
55 18420.83383 76412.62208 33820.248 0.85552813 18213.41327 19425.16829 -58 -14
60 20095.45508 83359.22409 36894.816 0.933303415 19869.17812 21191.09268 -63 -16
65 21770.07634 90305.8261 39969.384 1.011078699 21524.94296 22957.01707 -69 -17
70 23444.6976 97252.42811 43043.952 1.088853984 23180.7078 24722.94146 -74 -18
75 25119.31885 104199.0301 46118.52 1.166629268 24836.47265 26488.86585 -79 -20
80 26793.94011 111145.6321 49193.088 1.244404553 26492.23749 28254.79024 -85 -21
85 28468.56137 118092.2341 52267.656 1.322179837 28148.00233 30020.71463 -90 -22
90 30143.18263 125038.8361 55342.224 1.399955122 29803.76718 31786.63902 -95 -24
95 31817.80388 131985.4381 58416.792 1.477730407 31459.53202 33552.56341 -101 -25
100 33492.42514 138932.0402 61491.36 1.555505691 33115.29686 35318.4878 -106 -26
Kaiser Permanente Group Project
Final Report
Appendix B
CMU Toxic Data
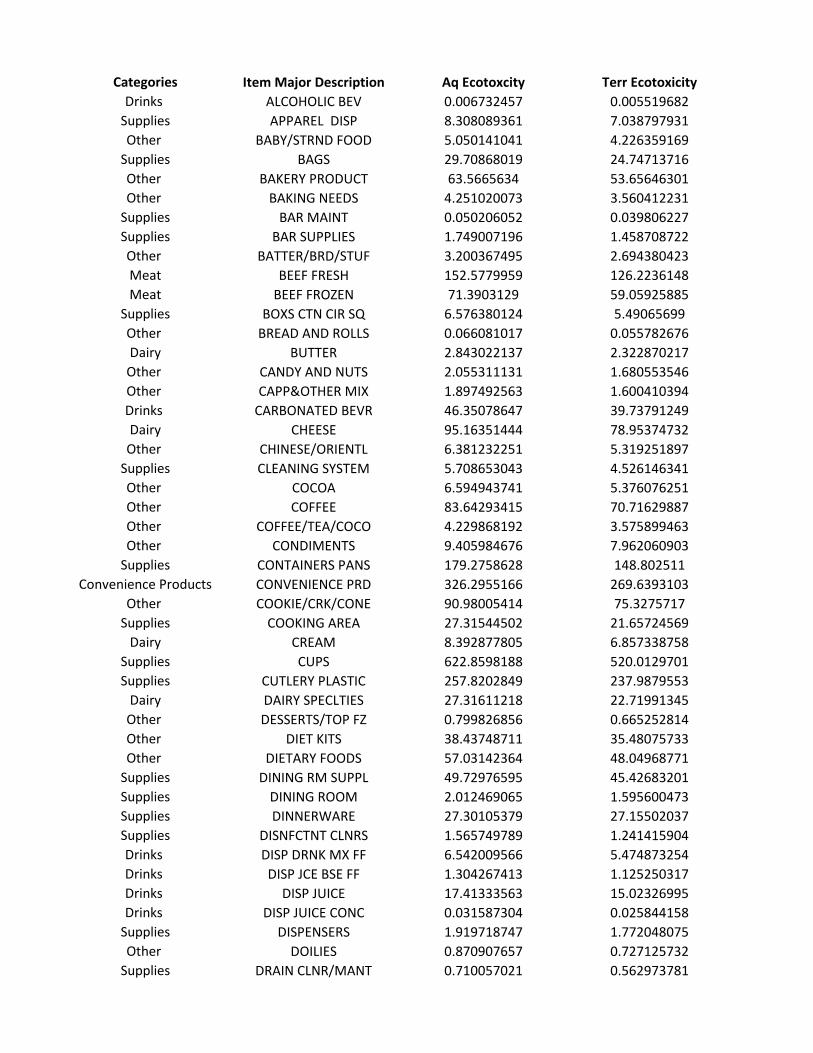
Categories Item Major Description Aq Ecotoxcity Terr Ecotoxicity
Drinks ALCOHOLIC BEV 0.006732457 0.005519682
Supplies APPAREL DISP 8.308089361 7.038797931
Other BABY/STRND FOOD 5.050141041 4.226359169
Supplies BAGS 29.70868019 24.74713716
Other BAKERY PRODUCT 63.5665634 53.65646301
Other BAKING NEEDS 4.251020073 3.560412231
Supplies BAR MAINT 0.050206052 0.039806227
Supplies BAR SUPPLIES 1.749007196 1.458708722
Other BATTER/BRD/STUF 3.200367495 2.694380423
Meat BEEF FRESH 152.5779959 126.2236148
Meat BEEF FROZEN 71.3903129 59.05925885
Supplies BOXS CTN CIR SQ 6.576380124 5.49065699
Other BREAD AND ROLLS 0.066081017 0.055782676
Dairy BUTTER 2.843022137 2.322870217
Other CANDY AND NUTS 2.055311131 1.680553546
Other CAPP&OTHER MIX 1.897492563 1.600410394
Drinks CARBONATED BEVR 46.35078647 39.73791249
Dairy CHEESE 95.16351444 78.95374732
Other CHINESE/ORIENTL 6.381232251 5.319251897
Supplies CLEANING SYSTEM 5.708653043 4.526146341
Other COCOA 6.594943741 5.376076251
Other COFFEE 83.64293415 70.71629887
Other COFFEE/TEA/COCO 4.229868192 3.575899463
Other CONDIMENTS 9.405984676 7.962060903
Supplies CONTAINERS PANS 179.2758628 148.802511
Convenience Products CONVENIENCE PRD 326.2955166 269.6393103
Other COOKIE/CRK/CONE 90.98005414 75.3275717
Supplies COOKING AREA 27.31544502 21.65724569
Dairy CREAM 8.392877805 6.857338758
Supplies CUPS 622.8598188 520.0129701
Supplies CUTLERY PLASTIC 257.8202849 237.9879553
Dairy DAIRY SPECLTIES 27.31611218 22.71991345
Other DESSERTS/TOP FZ 0.799826856 0.665252814
Other DIET KITS 38.43748711 35.48075733
Other DIETARY FOODS 57.03142364 48.04968771
Supplies DINING RM SUPPL 49.72976595 45.42683201
Supplies DINING ROOM 2.012469065 1.595600473
Supplies DINNERWARE 27.30105379 27.15502037
Supplies DISNFCTNT CLNRS 1.565749789 1.241415904
Drinks DISP DRNK MX FF 6.542009566 5.474873254
Drinks DISP JCE BSE FF 1.304267413 1.125250317
Drinks DISP JUICE 17.41333563 15.02326995
Drinks DISP JUICE CONC 0.031587304 0.025844158
Supplies DISPENSERS 1.919718747 1.772048075
Other DOILIES 0.870907657 0.727125732
Supplies DRAIN CLNR/MANT 0.710057021 0.562973781
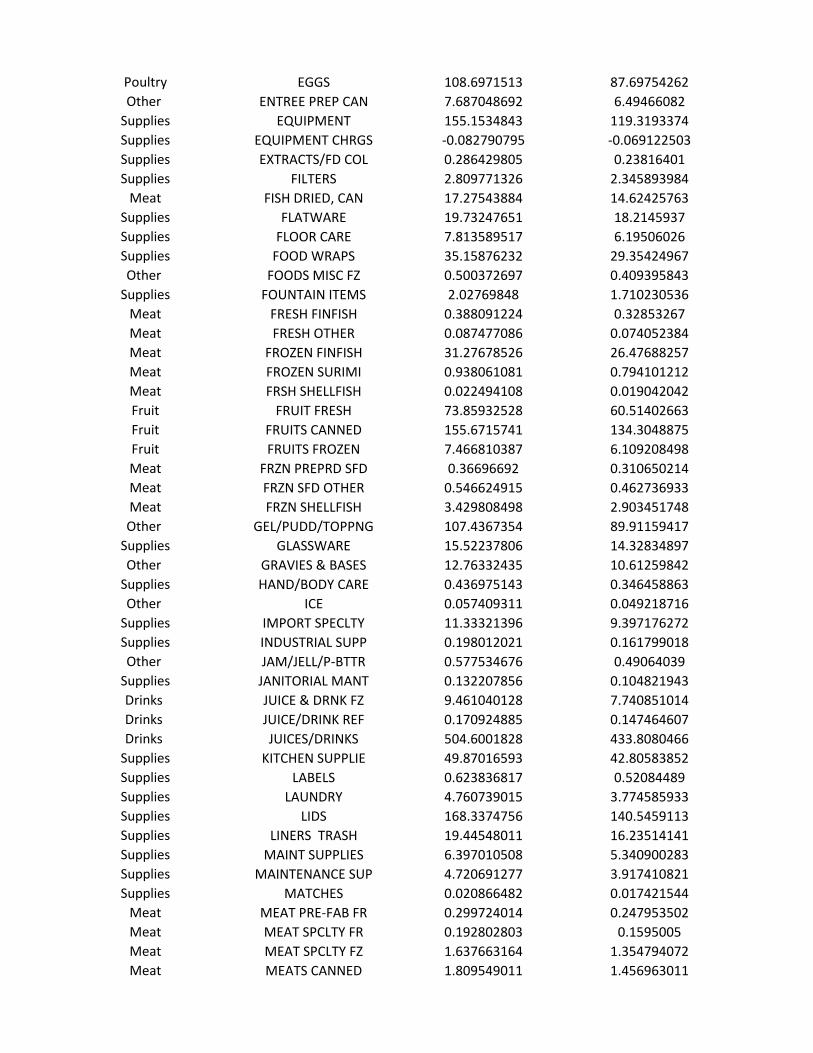
Poultry EGGS 108.6971513 87.69754262
Other ENTREE PREP CAN 7.687048692 6.49466082
Supplies EQUIPMENT 155.1534843 119.3193374
Supplies EQUIPMENT CHRGS -0.082790795 -0.069122503
Supplies EXTRACTS/FD COL 0.286429805 0.23816401
Supplies FILTERS 2.809771326 2.345893984
Meat FISH DRIED, CAN 17.27543884 14.62425763
Supplies FLATWARE 19.73247651 18.2145937
Supplies FLOOR CARE 7.813589517 6.19506026
Supplies FOOD WRAPS 35.15876232 29.35424967
Other FOODS MISC FZ 0.500372697 0.409395843
Supplies FOUNTAIN ITEMS 2.02769848 1.710230536
Meat FRESH FINFISH 0.388091224 0.32853267
Meat FRESH OTHER 0.087477086 0.074052384
Meat FROZEN FINFISH 31.27678526 26.47688257
Meat FROZEN SURIMI 0.938061081 0.794101212
Meat FRSH SHELLFISH 0.022494108 0.019042042
Fruit FRUIT FRESH 73.85932528 60.51402663
Fruit FRUITS CANNED 155.6715741 134.3048875
Fruit FRUITS FROZEN 7.466810387 6.109208498
Meat FRZN PREPRD SFD 0.36696692 0.310650214
Meat FRZN SFD OTHER 0.546624915 0.462736933
Meat FRZN SHELLFISH 3.429808498 2.903451748
Other GEL/PUDD/TOPPNG 107.4367354 89.91159417
Supplies GLASSWARE 15.52237806 14.32834897
Other GRAVIES & BASES 12.76332435 10.61259842
Supplies HAND/BODY CARE 0.436975143 0.346458863
Other ICE 0.057409311 0.049218716
Supplies IMPORT SPECLTY 11.33321396 9.397176272
Supplies INDUSTRIAL SUPP 0.198012021 0.161799018
Other JAM/JELL/P-BTTR 0.577534676 0.49064039
Supplies JANITORIAL MANT 0.132207856 0.104821943
Drinks JUICE & DRNK FZ 9.461040128 7.740851014
Drinks JUICE/DRINK REF 0.170924885 0.147464607
Drinks JUICES/DRINKS 504.6001828 433.8080466
Supplies KITCHEN SUPPLIE 49.87016593 42.80583852
Supplies LABELS 0.623836817 0.52084489
Supplies LAUNDRY 4.760739015 3.774585933
Supplies LIDS 168.3374756 140.5459113
Supplies LINERS TRASH 19.44548011 16.23514141
Supplies MAINT SUPPLIES 6.397010508 5.340900283
Supplies MAINTENANCE SUP 4.720691277 3.917410821
Supplies MATCHES 0.020866482 0.017421544
Meat MEAT PRE-FAB FR 0.299724014 0.247953502
Meat MEAT SPCLTY FR 0.192802803 0.1595005
Meat MEAT SPCLTY FZ 1.637663164 1.354794072
Meat MEATS CANNED 1.809549011 1.456963011

Supplies MEDICAL 1.656963648 1.331712806
Other MEXICAN FOODS 21.33954919 18.23196182
Dairy MILK 23.33517945 19.06583584
Dairy MILK & NONDAIRY 8.027887635 6.625047359
Other MISC -1.108401762 -0.878771851
Drinks MISC BEVERAGES 0.158136688 0.133697381
Supplies NAPKINS 76.34323837 63.74533958
Other NUTRITIONAL 44.80440413 37.49588431
Supplies OFFICE SUPPLIES 2.055835682 1.716428848
Fruit OLIVES 7.671191881 6.618283191
Other PASTA PRODUCTS 10.80072753 8.953466967
Other PICKLE,REL,PROD 7.927711197 6.839593973
Supplies PICKS-STIRRERS 3.815329736 3.185440393
Supplies PLACEMAT COVERS 10.12609722 8.454335889
Supplies PLANTS/FLOWERS 0.074679914 0.061459068
Supplies PLATES BOWLS 228.9251296 191.1308865
Meat PORK FRESH 33.43566623 27.66041479
Meat PORK FROZEN 49.9631263 41.33313176
Other PORTION PAKS/PC 104.4751936 87.5582318
Supplies POT AND PAN 59.65424532 47.29729451
Vegetables POTATO-CAN/DEHY 15.6727533 13.52159108
Vegetables POTATOES FROZEN 45.67041228 37.36670096
Poultry POULTRY FRESH 78.59606032 63.25668052
Poultry POULTRY FROZEN 505.7733866 407.0629673
Other PROD PREP FRESH 6.726613846 5.511213214
Other REFRG/MANUFACTR 31.89307011 26.20962306
Supplies RESTROOM 0.38211771 0.302964756
Grains RICE AND GRAINS 26.12558918 21.13429762
Other SALAD DRES/MAYO 20.80301799 17.29753706
Other SALT/SEASN/SPCE 32.7201473 27.07950717
Supplies SANITIZER 7.623188476 6.044099435
Other SAUCES/SAUC MIX 25.73233692 21.56071856
Other SHORTENING, OIL 20.24172826 16.52052165
Other SNACKS 41.23590264 33.69270758
Other SOUP,CHOWDR,BAS 106.3526473 90.38515918
Supplies STRAWS 22.0449997 18.40549503
Other SUGAR 6.180213063 5.074439647
Other SYRUPS 0.772079055 0.64565342
Supplies TBL COVER SKIRT 10.97286714 9.161308882
Other TEA 29.92776794 25.30256744
Supplies TISSUES 0.02234203 0.018653488
Supplies TOWELS 6.42720357 5.366108641
Supplies TRAYS CARRIERS 174.6027447 145.7768199
Vegetables VEG/FRUIT DRIED 9.01710711 7.779464958
Vegetables VEGETABLE CAN 21.34261441 18.41323596
Vegetables VEGETABLE FRESH 66.13338233 54.00143202
Vegetables VEGETABLES FRZN 129.6603631 106.0857517

Supplies WAREWASH 82.65936285 65.53706626
Supplies WASHANTIMICROBL 0.653493516 0.518127002
Other WINE/LIQ COOKNG 0.831681899 0.681863913
Supplies WIPERS 23.8886209 19.94474481
Other YOGURT 41.69312449 34.14009851
Grand Total 6194.481179 5180.02581
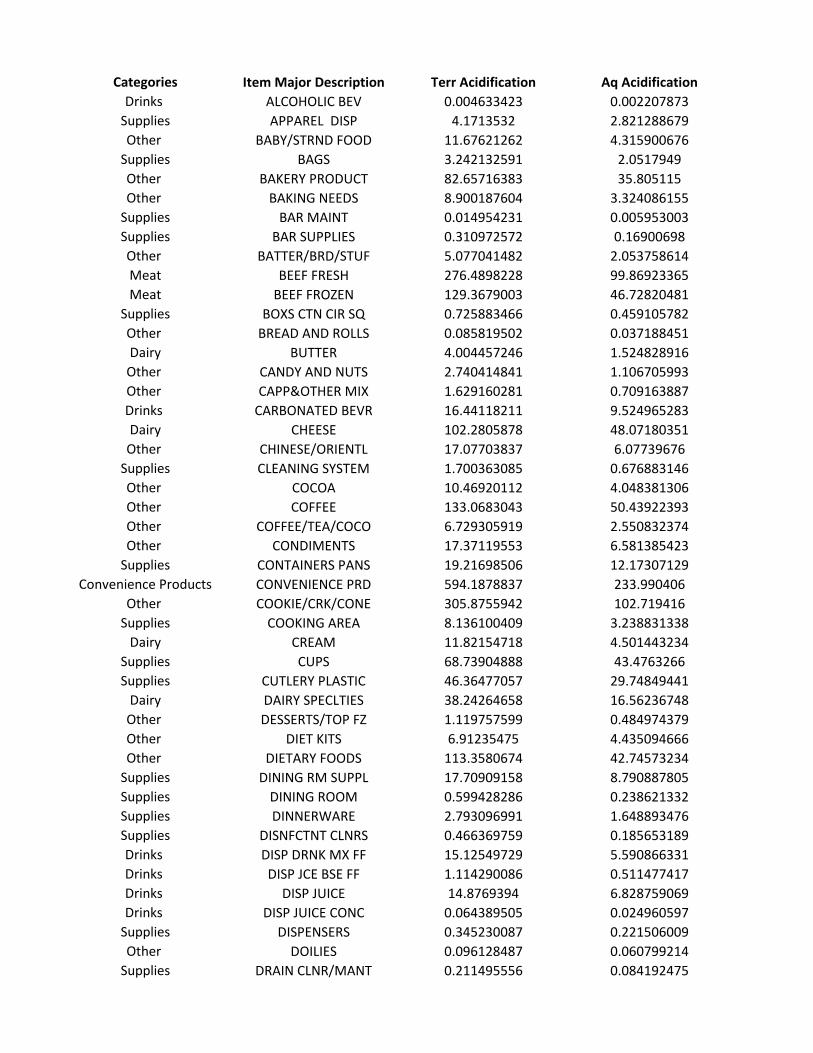
Categories Item Major Description Terr Acidification Aq Acidification
Drinks ALCOHOLIC BEV 0.004633423 0.002207873
Supplies APPAREL DISP 4.1713532 2.821288679
Other BABY/STRND FOOD 11.67621262 4.315900676
Supplies BAGS 3.242132591 2.0517949
Other BAKERY PRODUCT 82.65716383 35.805115
Other BAKING NEEDS 8.900187604 3.324086155
Supplies BAR MAINT 0.014954231 0.005953003
Supplies BAR SUPPLIES 0.310972572 0.16900698
Other BATTER/BRD/STUF 5.077041482 2.053758614
Meat BEEF FRESH 276.4898228 99.86923365
Meat BEEF FROZEN 129.3679003 46.72820481
Supplies BOXS CTN CIR SQ 0.725883466 0.459105782
Other BREAD AND ROLLS 0.085819502 0.037188451
Dairy BUTTER 4.004457246 1.524828916
Other CANDY AND NUTS 2.740414841 1.106705993
Other CAPP&OTHER MIX 1.629160281 0.709163887
Drinks CARBONATED BEVR 16.44118211 9.524965283
Dairy CHEESE 102.2805878 48.07180351
Other CHINESE/ORIENTL 17.07703837 6.07739676
Supplies CLEANING SYSTEM 1.700363085 0.676883146
Other COCOA 10.46920112 4.048381306
Other COFFEE 133.0683043 50.43922393
Other COFFEE/TEA/COCO 6.729305919 2.550832374
Other CONDIMENTS 17.37119553 6.581385423
Supplies CONTAINERS PANS 19.21698506 12.17307129
Convenience Products CONVENIENCE PRD 594.1878837 233.990406
Other COOKIE/CRK/CONE 305.8755942 102.719416
Supplies COOKING AREA 8.136100409 3.238831338
Dairy CREAM 11.82154718 4.501443234
Supplies CUPS 68.73904888 43.4763266
Supplies CUTLERY PLASTIC 46.36477057 29.74849441
Dairy DAIRY SPECLTIES 38.24264658 16.56236748
Other DESSERTS/TOP FZ 1.119757599 0.484974379
Other DIET KITS 6.91235475 4.435094666
Other DIETARY FOODS 113.3580674 42.74573234
Supplies DINING RM SUPPL 17.70909158 8.790887805
Supplies DINING ROOM 0.599428286 0.238621332
Supplies DINNERWARE 2.793096991 1.648893476
Supplies DISNFCTNT CLNRS 0.466369759 0.185653189
Drinks DISP DRNK MX FF 15.12549729 5.590866331
Drinks DISP JCE BSE FF 1.114290086 0.511477417
Drinks DISP JUICE 14.8769394 6.828759069
Drinks DISP JUICE CONC 0.064389505 0.024960597
Supplies DISPENSERS 0.345230087 0.221506009
Other DOILIES 0.096128487 0.060799214
Supplies DRAIN CLNR/MANT 0.211495556 0.084192475
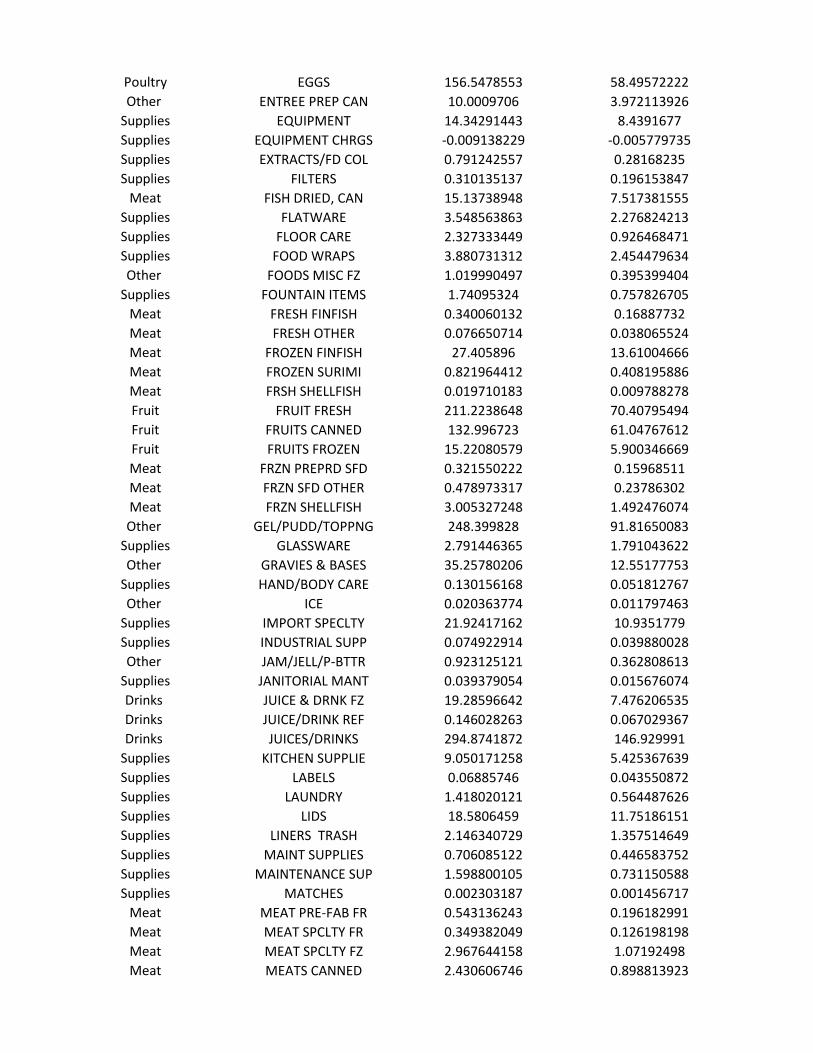
Poultry EGGS 156.5478553 58.49572222
Other ENTREE PREP CAN 10.0009706 3.972113926
Supplies EQUIPMENT 14.34291443 8.4391677
Supplies EQUIPMENT CHRGS -0.009138229 -0.005779735
Supplies EXTRACTS/FD COL 0.791242557 0.28168235
Supplies FILTERS 0.310135137 0.196153847
Meat FISH DRIED, CAN 15.13738948 7.517381555
Supplies FLATWARE 3.548563863 2.276824213
Supplies FLOOR CARE 2.327333449 0.926468471
Supplies FOOD WRAPS 3.880731312 2.454479634
Other FOODS MISC FZ 1.019990497 0.395399404
Supplies FOUNTAIN ITEMS 1.74095324 0.757826705
Meat FRESH FINFISH 0.340060132 0.16887732
Meat FRESH OTHER 0.076650714 0.038065524
Meat FROZEN FINFISH 27.405896 13.61004666
Meat FROZEN SURIMI 0.821964412 0.408195886
Meat FRSH SHELLFISH 0.019710183 0.009788278
Fruit FRUIT FRESH 211.2238648 70.40795494
Fruit FRUITS CANNED 132.996723 61.04767612
Fruit FRUITS FROZEN 15.22080579 5.900346669
Meat FRZN PREPRD SFD 0.321550222 0.15968511
Meat FRZN SFD OTHER 0.478973317 0.23786302
Meat FRZN SHELLFISH 3.005327248 1.492476074
Other GEL/PUDD/TOPPNG 248.399828 91.81650083
Supplies GLASSWARE 2.791446365 1.791043622
Other GRAVIES & BASES 35.25780206 12.55177753
Supplies HAND/BODY CARE 0.130156168 0.051812767
Other ICE 0.020363774 0.011797463
Supplies IMPORT SPECLTY 21.92417162 10.9351779
Supplies INDUSTRIAL SUPP 0.074922914 0.039880028
Other JAM/JELL/P-BTTR 0.923125121 0.362808613
Supplies JANITORIAL MANT 0.039379054 0.015676074
Drinks JUICE & DRNK FZ 19.28596642 7.476206535
Drinks JUICE/DRINK REF 0.146028263 0.067029367
Drinks JUICES/DRINKS 294.8741872 146.929991
Supplies KITCHEN SUPPLIE 9.050171258 5.425367639
Supplies LABELS 0.06885746 0.043550872
Supplies LAUNDRY 1.418020121 0.564487626
Supplies LIDS 18.5806459 11.75186151
Supplies LINERS TRASH 2.146340729 1.357514649
Supplies MAINT SUPPLIES 0.706085122 0.446583752
Supplies MAINTENANCE SUP 1.598800105 0.731150588
Supplies MATCHES 0.002303187 0.001456717
Meat MEAT PRE-FAB FR 0.543136243 0.196182991
Meat MEAT SPCLTY FR 0.349382049 0.126198198
Meat MEAT SPCLTY FZ 2.967644158 1.07192498
Meat MEATS CANNED 2.430606746 0.898813923
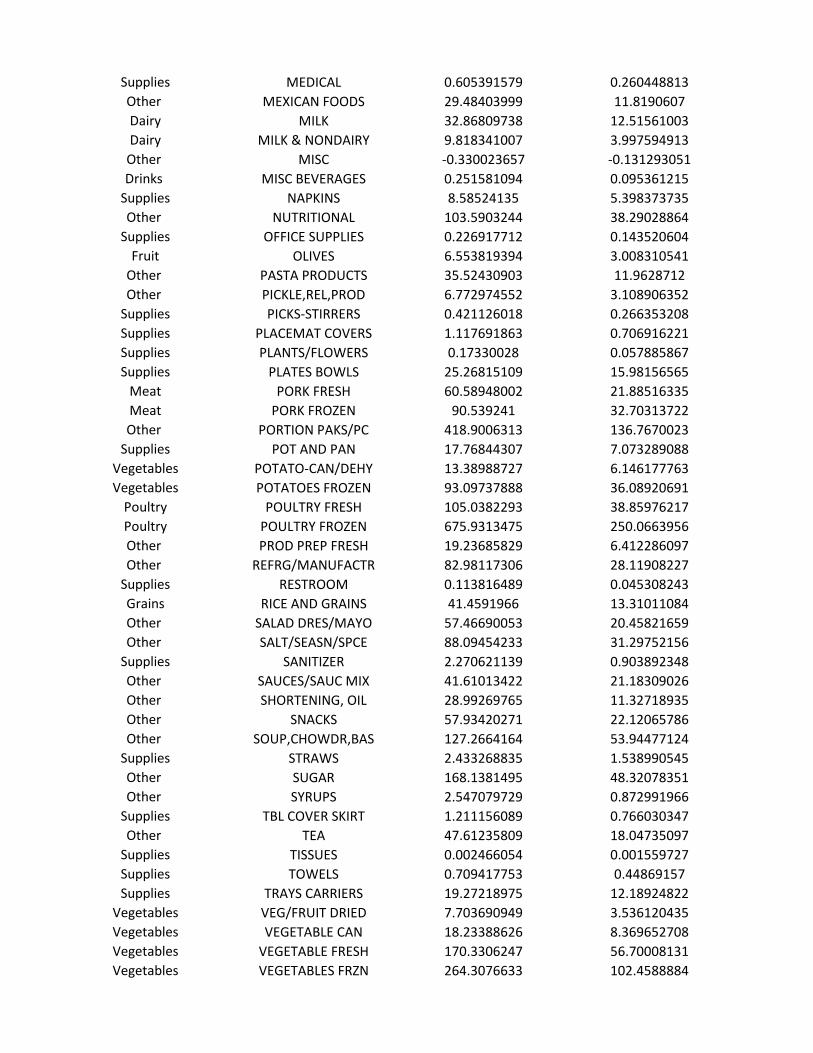
Supplies MEDICAL 0.605391579 0.260448813
Other MEXICAN FOODS 29.48403999 11.8190607
Dairy MILK 32.86809738 12.51561003
Dairy MILK & NONDAIRY 9.818341007 3.997594913
Other MISC -0.330023657 -0.131293051
Drinks MISC BEVERAGES 0.251581094 0.095361215
Supplies NAPKINS 8.58524135 5.398373735
Other NUTRITIONAL 103.5903244 38.29028864
Supplies OFFICE SUPPLIES 0.226917712 0.143520604
Fruit OLIVES 6.553819394 3.008310541
Other PASTA PRODUCTS 35.52430903 11.9628712
Other PICKLE,REL,PROD 6.772974552 3.108906352
Supplies PICKS-STIRRERS 0.421126018 0.266353208
Supplies PLACEMAT COVERS 1.117691863 0.706916221
Supplies PLANTS/FLOWERS 0.17330028 0.057885867
Supplies PLATES BOWLS 25.26815109 15.98156565
Meat PORK FRESH 60.58948002 21.88516335
Meat PORK FROZEN 90.539241 32.70313722
Other PORTION PAKS/PC 418.9006313 136.7670023
Supplies POT AND PAN 17.76844307 7.073289088
Vegetables POTATO-CAN/DEHY 13.38988727 6.146177763
Vegetables POTATOES FROZEN 93.09737888 36.08920691
Poultry POULTRY FRESH 105.0382293 38.85976217
Poultry POULTRY FROZEN 675.9313475 250.0663956
Other PROD PREP FRESH 19.23685829 6.412286097
Other REFRG/MANUFACTR 82.98117306 28.11908227
Supplies RESTROOM 0.113816489 0.045308243
Grains RICE AND GRAINS 41.4591966 13.31011084
Other SALAD DRES/MAYO 57.46690053 20.45821659
Other SALT/SEASN/SPCE 88.09454233 31.29752156
Supplies SANITIZER 2.270621139 0.903892348
Other SAUCES/SAUC MIX 41.61013422 21.18309026
Other SHORTENING, OIL 28.99269765 11.32718935
Other SNACKS 57.93420271 22.12065786
Other SOUP,CHOWDR,BAS 127.2664164 53.94477124
Supplies STRAWS 2.433268835 1.538990545
Other SUGAR 168.1381495 48.32078351
Other SYRUPS 2.547079729 0.872991966
Supplies TBL COVER SKIRT 1.211156089 0.766030347
Other TEA 47.61235809 18.04735097
Supplies TISSUES 0.002466054 0.001559727
Supplies TOWELS 0.709417753 0.44869157
Supplies TRAYS CARRIERS 19.27218975 12.18924822
Vegetables VEG/FRUIT DRIED 7.703690949 3.536120435
Vegetables VEGETABLE CAN 18.23388626 8.369652708
Vegetables VEGETABLE FRESH 170.3306247 56.70008131
Vegetables VEGETABLES FRZN 264.3076633 102.4588884

Supplies WAREWASH 24.62068165 9.801038738
Supplies WASHANTIMICROBL 0.194647712 0.07748566
Other WINE/LIQ COOKNG 0.572381538 0.272745565
Supplies WIPERS 2.636762873 1.667696176
Other YOGURT 58.6821653 22.7190158
Grand Total 6441.71291 2515.052808
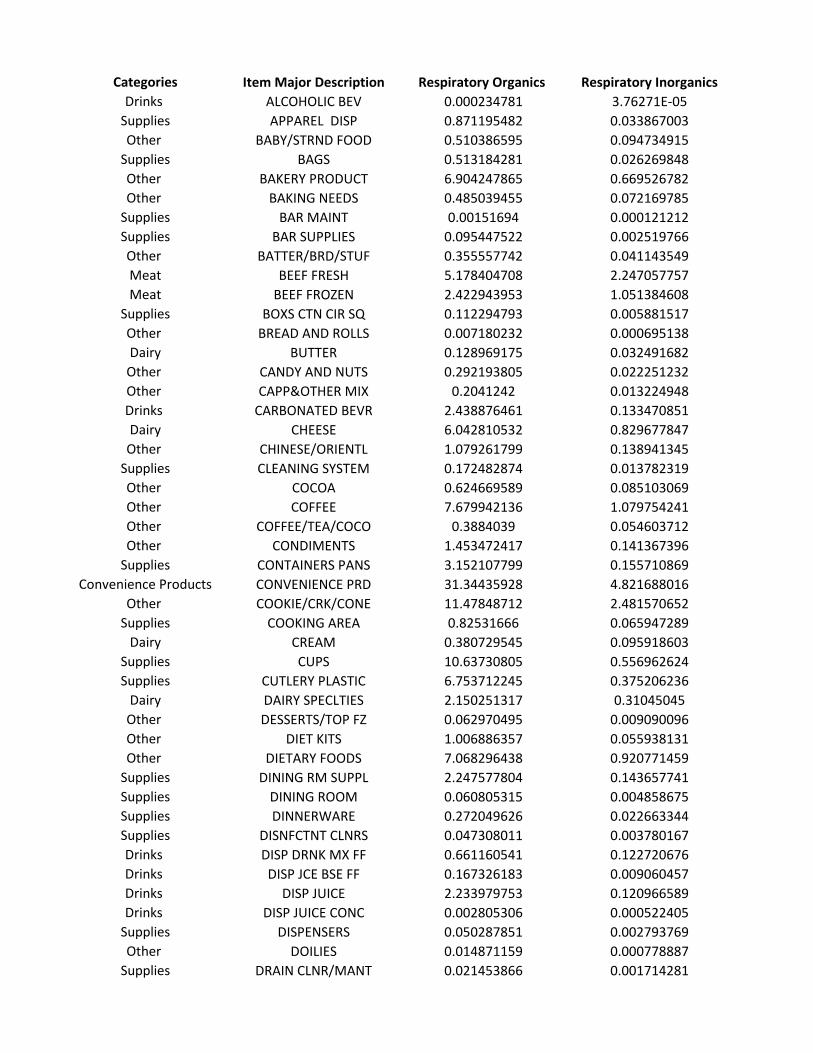
Categories Item Major Description Respiratory Organics Respiratory Inorganics
Drinks ALCOHOLIC BEV 0.000234781 3.76271E-05
Supplies APPAREL DISP 0.871195482 0.033867003
Other BABY/STRND FOOD 0.510386595 0.094734915
Supplies BAGS 0.513184281 0.026269848
Other BAKERY PRODUCT 6.904247865 0.669526782
Other BAKING NEEDS 0.485039455 0.072169785
Supplies BAR MAINT 0.00151694 0.000121212
Supplies BAR SUPPLIES 0.095447522 0.002519766
Other BATTER/BRD/STUF 0.355557742 0.041143549
Meat BEEF FRESH 5.178404708 2.247057757
Meat BEEF FROZEN 2.422943953 1.051384608
Supplies BOXS CTN CIR SQ 0.112294793 0.005881517
Other BREAD AND ROLLS 0.007180232 0.000695138
Dairy BUTTER 0.128969175 0.032491682
Other CANDY AND NUTS 0.292193805 0.022251232
Other CAPP&OTHER MIX 0.2041242 0.013224948
Drinks CARBONATED BEVR 2.438876461 0.133470851
Dairy CHEESE 6.042810532 0.829677847
Other CHINESE/ORIENTL 1.079261799 0.138941345
Supplies CLEANING SYSTEM 0.172482874 0.013782319
Other COCOA 0.624669589 0.085103069
Other COFFEE 7.679942136 1.079754241
Other COFFEE/TEA/COCO 0.3884039 0.054603712
Other CONDIMENTS 1.453472417 0.141367396
Supplies CONTAINERS PANS 3.152107799 0.155710869
Convenience Products CONVENIENCE PRD 31.34435928 4.821688016
Other COOKIE/CRK/CONE 11.47848712 2.481570652
Supplies COOKING AREA 0.82531666 0.065947289
Dairy CREAM 0.380729545 0.095918603
Supplies CUPS 10.63730805 0.556962624
Supplies CUTLERY PLASTIC 6.753712245 0.375206236
Dairy DAIRY SPECLTIES 2.150251317 0.31045045
Other DESSERTS/TOP FZ 0.062970495 0.009090096
Other DIET KITS 1.006886357 0.055938131
Other DIETARY FOODS 7.068296438 0.920771459
Supplies DINING RM SUPPL 2.247577804 0.143657741
Supplies DINING ROOM 0.060805315 0.004858675
Supplies DINNERWARE 0.272049626 0.022663344
Supplies DISNFCTNT CLNRS 0.047308011 0.003780167
Drinks DISP DRNK MX FF 0.661160541 0.122720676
Drinks DISP JCE BSE FF 0.167326183 0.009060457
Drinks DISP JUICE 2.233979753 0.120966589
Drinks DISP JUICE CONC 0.002805306 0.000522405
Supplies DISPENSERS 0.050287851 0.002793769
Other DOILIES 0.014871159 0.000778887
Supplies DRAIN CLNR/MANT 0.021453866 0.001714281
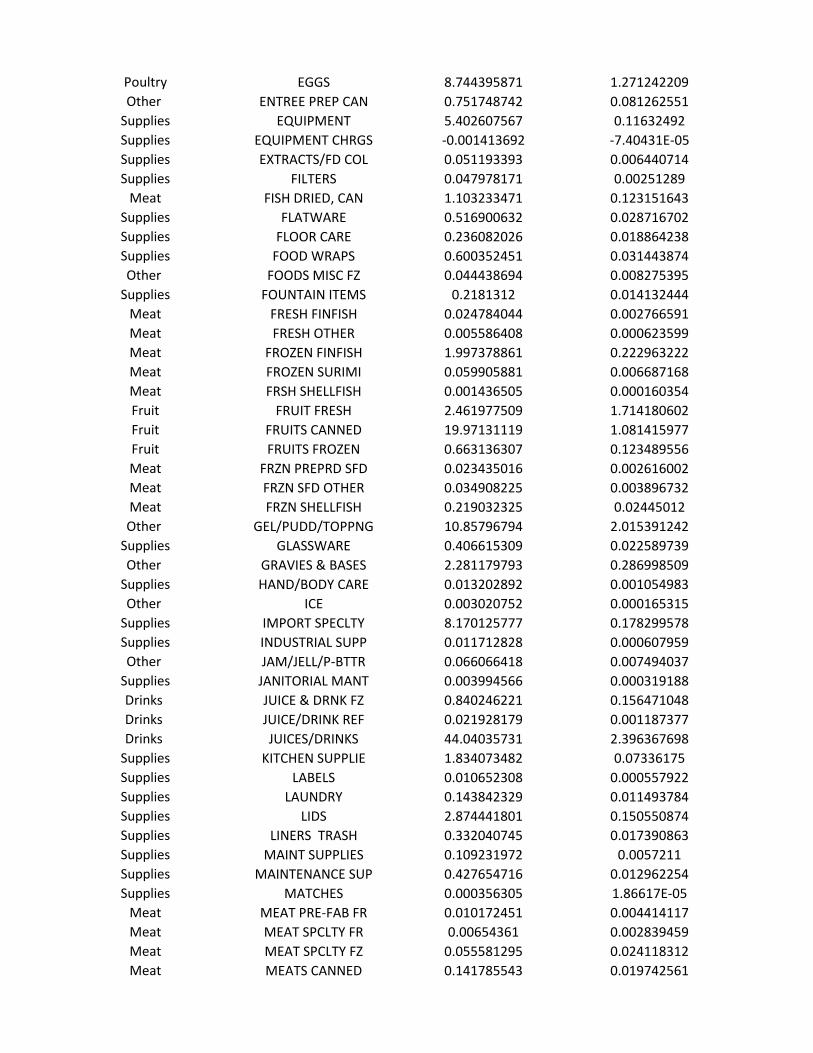
Poultry EGGS 8.744395871 1.271242209
Other ENTREE PREP CAN 0.751748742 0.081262551
Supplies EQUIPMENT 5.402607567 0.11632492
Supplies EQUIPMENT CHRGS -0.001413692 -7.40431E-05
Supplies EXTRACTS/FD COL 0.051193393 0.006440714
Supplies FILTERS 0.047978171 0.00251289
Meat FISH DRIED, CAN 1.103233471 0.123151643
Supplies FLATWARE 0.516900632 0.028716702
Supplies FLOOR CARE 0.236082026 0.018864238
Supplies FOOD WRAPS 0.600352451 0.031443874
Other FOODS MISC FZ 0.044438694 0.008275395
Supplies FOUNTAIN ITEMS 0.2181312 0.014132444
Meat FRESH FINFISH 0.024784044 0.002766591
Meat FRESH OTHER 0.005586408 0.000623599
Meat FROZEN FINFISH 1.997378861 0.222963222
Meat FROZEN SURIMI 0.059905881 0.006687168
Meat FRSH SHELLFISH 0.001436505 0.000160354
Fruit FRUIT FRESH 2.461977509 1.714180602
Fruit FRUITS CANNED 19.97131119 1.081415977
Fruit FRUITS FROZEN 0.663136307 0.123489556
Meat FRZN PREPRD SFD 0.023435016 0.002616002
Meat FRZN SFD OTHER 0.034908225 0.003896732
Meat FRZN SHELLFISH 0.219032325 0.02445012
Other GEL/PUDD/TOPPNG 10.85796794 2.015391242
Supplies GLASSWARE 0.406615309 0.022589739
Other GRAVIES & BASES 2.281179793 0.286998509
Supplies HAND/BODY CARE 0.013202892 0.001054983
Other ICE 0.003020752 0.000165315
Supplies IMPORT SPECLTY 8.170125777 0.178299578
Supplies INDUSTRIAL SUPP 0.011712828 0.000607959
Other JAM/JELL/P-BTTR 0.066066418 0.007494037
Supplies JANITORIAL MANT 0.003994566 0.000319188
Drinks JUICE & DRNK FZ 0.840246221 0.156471048
Drinks JUICE/DRINK REF 0.021928179 0.001187377
Drinks JUICES/DRINKS 44.04035731 2.396367698
Supplies KITCHEN SUPPLIE 1.834073482 0.07336175
Supplies LABELS 0.010652308 0.000557922
Supplies LAUNDRY 0.143842329 0.011493784
Supplies LIDS 2.874441801 0.150550874
Supplies LINERS TRASH 0.332040745 0.017390863
Supplies MAINT SUPPLIES 0.109231972 0.0057211
Supplies MAINTENANCE SUP 0.427654716 0.012962254
Supplies MATCHES 0.000356305 1.86617E-05
Meat MEAT PRE-FAB FR 0.010172451 0.004414117
Meat MEAT SPCLTY FR 0.00654361 0.002839459
Meat MEAT SPCLTY FZ 0.055581295 0.024118312
Meat MEATS CANNED 0.141785543 0.019742561

Supplies MEDICAL 0.070572507 0.004911179
Other MEXICAN FOODS 2.973268073 0.239799083
Dairy MILK 1.058563278 0.266687765
Dairy MILK & NONDAIRY 0.577062188 0.079702423
Other MISC -0.033445076 -0.002675008
Drinks MISC BEVERAGES 0.014519823 0.002041401
Supplies NAPKINS 1.327317465 0.069567677
Other NUTRITIONAL 4.528104673 0.84047978
Supplies OFFICE SUPPLIES 0.035104364 0.001838615
Fruit OLIVES 0.984147306 0.053290072
Other PASTA PRODUCTS 1.363340482 0.288213815
Other PICKLE,REL,PROD 1.017056506 0.055072055
Supplies PICKS-STIRRERS 0.065148555 0.003412201
Supplies PLACEMAT COVERS 0.172907887 0.00905617
Supplies PLANTS/FLOWERS 0.002422631 0.001407841
Supplies PLATES BOWLS 3.909004571 0.204736814
Meat PORK FRESH 1.134786248 0.492416175
Meat PORK FROZEN 1.695718226 0.735820587
Other PORTION PAKS/PC 13.81100371 3.398792095
Supplies POT AND PAN 1.802410412 0.144022392
Vegetables POTATO-CAN/DEHY 2.010678154 0.108875149
Vegetables POTATOES FROZEN 4.056043608 0.755318357
Poultry POULTRY FRESH 6.208796587 0.853161696
Poultry POULTRY FROZEN 39.95421734 5.490179513
Other PROD PREP FRESH 0.224220462 0.156116116
Other REFRG/MANUFACTR 1.593183262 0.673236016
Supplies RESTROOM 0.011545414 0.000922541
Grains RICE AND GRAINS 0.446518245 0.336799764
Other SALAD DRES/MAYO 3.718108464 0.46778057
Other SALT/SEASN/SPCE 5.537660092 0.71651001
Supplies SANITIZER 0.230329195 0.018404555
Other SAUCES/SAUC MIX 15.76520133 0.338025887
Other SHORTENING, OIL 10.42755698 0.235131187
Other SNACKS 2.060430789 0.470086222
Other SOUP,CHOWDR,BAS 12.43033303 1.03369769
Supplies STRAWS 0.376428768 0.019715717
Other SUGAR 0.243876055 1.361767535
Other SYRUPS 0.076143624 0.020653734
Supplies TBL COVER SKIRT 0.187366882 0.00981347
Other TEA 2.747913239 0.386340277
Supplies TISSUES 0.000381501 1.99814E-05
Supplies TOWELS 0.109747533 0.005748103
Supplies TRAYS CARRIERS 2.981424226 0.156154153
Vegetables VEG/FRUIT DRIED 1.156816542 0.062639848
Vegetables VEGETABLE CAN 2.7380721 0.148262419
Vegetables VEGETABLE FRESH 2.108891344 1.381773381
Vegetables VEGETABLES FRZN 11.51529099 2.144382929

Supplies WAREWASH 2.497493606 0.199563319
Supplies WASHANTIMICROBL 0.01974484 0.00157772
Other WINE/LIQ COOKNG 0.029003226 0.004648199
Supplies WIPERS 0.40790947 0.02136454
Other YOGURT 2.061630522 0.476168818
Grand Total 404.8861986 52.29194391
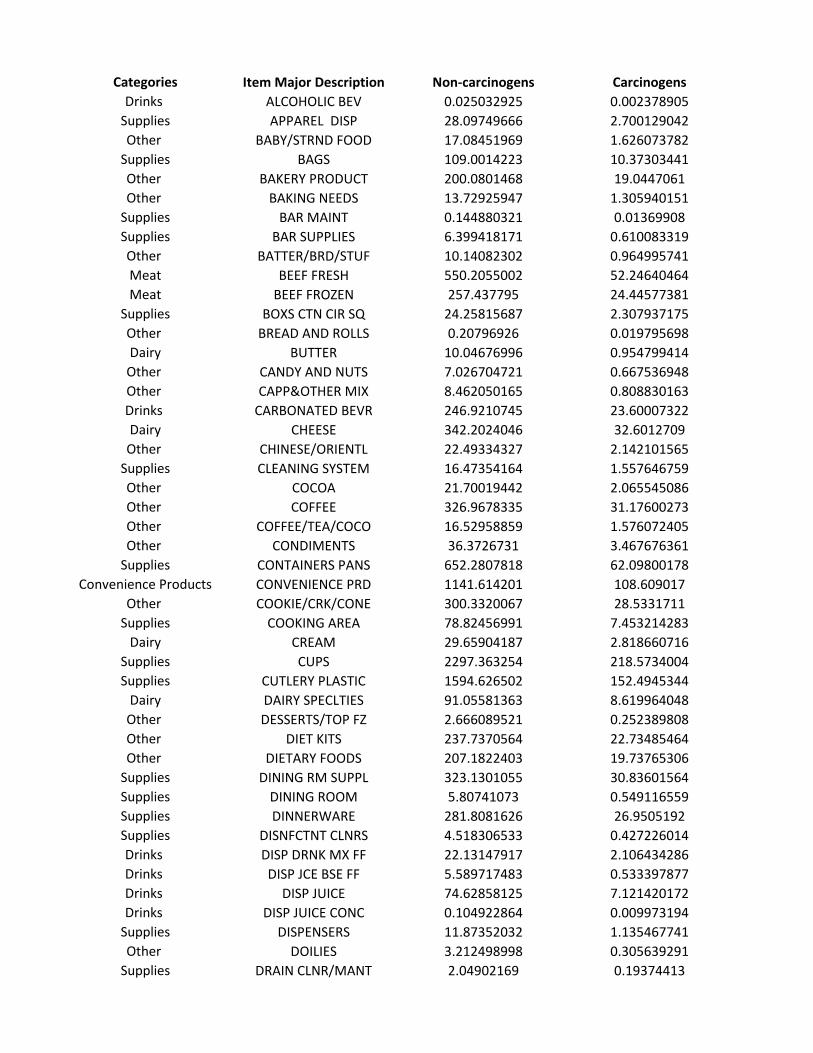
Categories Item Major Description Non-carcinogens Carcinogens
Drinks ALCOHOLIC BEV 0.025032925 0.002378905
Supplies APPAREL DISP 28.09749666 2.700129042
Other BABY/STRND FOOD 17.08451969 1.626073782
Supplies BAGS 109.0014223 10.37303441
Other BAKERY PRODUCT 200.0801468 19.0447061
Other BAKING NEEDS 13.72925947 1.305940151
Supplies BAR MAINT 0.144880321 0.01369908
Supplies BAR SUPPLIES 6.399418171 0.610083319
Other BATTER/BRD/STUF 10.14082302 0.964995741
Meat BEEF FRESH 550.2055002 52.24640464
Meat BEEF FROZEN 257.437795 24.44577381
Supplies BOXS CTN CIR SQ 24.25815687 2.307937175
Other BREAD AND ROLLS 0.20796926 0.019795698
Dairy BUTTER 10.04676996 0.954799414
Other CANDY AND NUTS 7.026704721 0.667536948
Other CAPP&OTHER MIX 8.462050165 0.808830163
Drinks CARBONATED BEVR 246.9210745 23.60007322
Dairy CHEESE 342.2024046 32.6012709
Other CHINESE/ORIENTL 22.49334327 2.142101565
Supplies CLEANING SYSTEM 16.47354164 1.557646759
Other COCOA 21.70019442 2.065545086
Other COFFEE 326.9678335 31.17600273
Other COFFEE/TEA/COCO 16.52958859 1.576072405
Other CONDIMENTS 36.3726731 3.467676361
Supplies CONTAINERS PANS 652.2807818 62.09800178
Convenience Products CONVENIENCE PRD 1141.614201 108.609017
Other COOKIE/CRK/CONE 300.3320067 28.5331711
Supplies COOKING AREA 78.82456991 7.453214283
Dairy CREAM 29.65904187 2.818660716
Supplies CUPS 2297.363254 218.5734004
Supplies CUTLERY PLASTIC 1594.626502 152.4945344
Dairy DAIRY SPECLTIES 91.05581363 8.619964048
Other DESSERTS/TOP FZ 2.666089521 0.252389808
Other DIET KITS 237.7370564 22.73485464
Other DIETARY FOODS 207.1822403 19.73765306
Supplies DINING RM SUPPL 323.1301055 30.83601564
Supplies DINING ROOM 5.80741073 0.549116559
Supplies DINNERWARE 281.8081626 26.9505192
Supplies DISNFCTNT CLNRS 4.518306533 0.427226014
Drinks DISP DRNK MX FF 22.13147917 2.106434286
Drinks DISP JCE BSE FF 5.589717483 0.533397877
Drinks DISP JUICE 74.62858125 7.121420172
Drinks DISP JUICE CONC 0.104922864 0.009973194
Supplies DISPENSERS 11.87352032 1.135467741
Other DOILIES 3.212498998 0.305639291
Supplies DRAIN CLNR/MANT 2.04902169 0.19374413
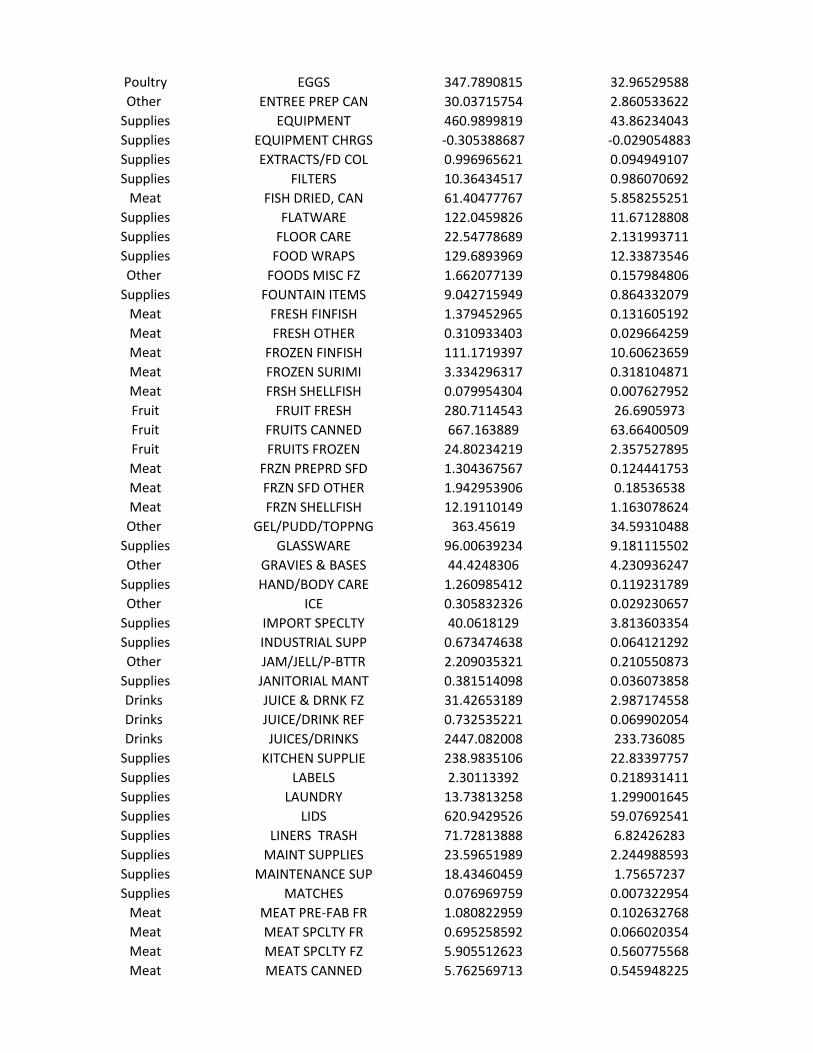
Poultry EGGS 347.7890815 32.96529588
Other ENTREE PREP CAN 30.03715754 2.860533622
Supplies EQUIPMENT 460.9899819 43.86234043
Supplies EQUIPMENT CHRGS -0.305388687 -0.029054883
Supplies EXTRACTS/FD COL 0.996965621 0.094949107
Supplies FILTERS 10.36434517 0.986070692
Meat FISH DRIED, CAN 61.40477767 5.858255251
Supplies FLATWARE 122.0459826 11.67128808
Supplies FLOOR CARE 22.54778689 2.131993711
Supplies FOOD WRAPS 129.6893969 12.33873546
Other FOODS MISC FZ 1.662077139 0.157984806
Supplies FOUNTAIN ITEMS 9.042715949 0.864332079
Meat FRESH FINFISH 1.379452965 0.131605192
Meat FRESH OTHER 0.310933403 0.029664259
Meat FROZEN FINFISH 111.1719397 10.60623659
Meat FROZEN SURIMI 3.334296317 0.318104871
Meat FRSH SHELLFISH 0.079954304 0.007627952
Fruit FRUIT FRESH 280.7114543 26.6905973
Fruit FRUITS CANNED 667.163889 63.66400509
Fruit FRUITS FROZEN 24.80234219 2.357527895
Meat FRZN PREPRD SFD 1.304367567 0.124441753
Meat FRZN SFD OTHER 1.942953906 0.18536538
Meat FRZN SHELLFISH 12.19110149 1.163078624
Other GEL/PUDD/TOPPNG 363.45619 34.59310488
Supplies GLASSWARE 96.00639234 9.181115502
Other GRAVIES & BASES 44.4248306 4.230936247
Supplies HAND/BODY CARE 1.260985412 0.119231789
Other ICE 0.305832326 0.029230657
Supplies IMPORT SPECLTY 40.0618129 3.813603354
Supplies INDUSTRIAL SUPP 0.673474638 0.064121292
Other JAM/JELL/P-BTTR 2.209035321 0.210550873
Supplies JANITORIAL MANT 0.381514098 0.036073858
Drinks JUICE & DRNK FZ 31.42653189 2.987174558
Drinks JUICE/DRINK REF 0.732535221 0.069902054
Drinks JUICES/DRINKS 2447.082008 233.736085
Supplies KITCHEN SUPPLIE 238.9835106 22.83397757
Supplies LABELS 2.30113392 0.218931411
Supplies LAUNDRY 13.73813258 1.299001645
Supplies LIDS 620.9429526 59.07692541
Supplies LINERS TRASH 71.72813888 6.82426283
Supplies MAINT SUPPLIES 23.59651989 2.244988593
Supplies MAINTENANCE SUP 18.43460459 1.75657237
Supplies MATCHES 0.076969759 0.007322954
Meat MEAT PRE-FAB FR 1.080822959 0.102632768
Meat MEAT SPCLTY FR 0.695258592 0.066020354
Meat MEAT SPCLTY FZ 5.905512623 0.560775568
Meat MEATS CANNED 5.762569713 0.545948225
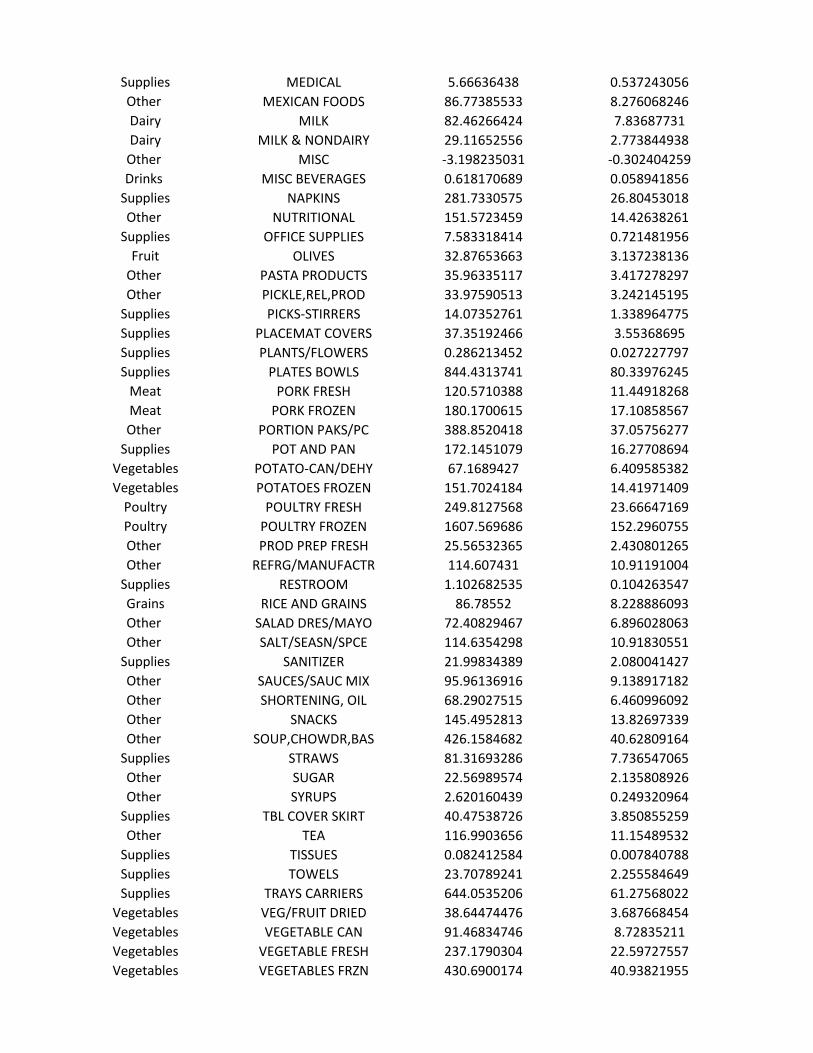
Supplies MEDICAL 5.66636438 0.537243056
Other MEXICAN FOODS 86.77385533 8.276068246
Dairy MILK 82.46266424 7.83687731
Dairy MILK & NONDAIRY 29.11652556 2.773844938
Other MISC -3.198235031 -0.302404259
Drinks MISC BEVERAGES 0.618170689 0.058941856
Supplies NAPKINS 281.7330575 26.80453018
Other NUTRITIONAL 151.5723459 14.42638261
Supplies OFFICE SUPPLIES 7.583318414 0.721481956
Fruit OLIVES 32.87653663 3.137238136
Other PASTA PRODUCTS 35.96335117 3.417278297
Other PICKLE,REL,PROD 33.97590513 3.242145195
Supplies PICKS-STIRRERS 14.07352761 1.338964775
Supplies PLACEMAT COVERS 37.35192466 3.55368695
Supplies PLANTS/FLOWERS 0.286213452 0.027227797
Supplies PLATES BOWLS 844.4313741 80.33976245
Meat PORK FRESH 120.5710388 11.44918268
Meat PORK FROZEN 180.1700615 17.10858567
Other PORTION PAKS/PC 388.8520418 37.05756277
Supplies POT AND PAN 172.1451079 16.27708694
Vegetables POTATO-CAN/DEHY 67.1689427 6.409585382
Vegetables POTATOES FROZEN 151.7024184 14.41971409
Poultry POULTRY FRESH 249.8127568 23.66647169
Poultry POULTRY FROZEN 1607.569686 152.2960755
Other PROD PREP FRESH 25.56532365 2.430801265
Other REFRG/MANUFACTR 114.607431 10.91191004
Supplies RESTROOM 1.102682535 0.104263547
Grains RICE AND GRAINS 86.78552 8.228886093
Other SALAD DRES/MAYO 72.40829467 6.896028063
Other SALT/SEASN/SPCE 114.6354298 10.91830551
Supplies SANITIZER 21.99834389 2.080041427
Other SAUCES/SAUC MIX 95.96136916 9.138917182
Other SHORTENING, OIL 68.29027515 6.460996092
Other SNACKS 145.4952813 13.82697339
Other SOUP,CHOWDR,BAS 426.1584682 40.62809164
Supplies STRAWS 81.31693286 7.736547065
Other SUGAR 22.56989574 2.135808926
Other SYRUPS 2.620160439 0.249320964
Supplies TBL COVER SKIRT 40.47538726 3.850855259
Other TEA 116.9903656 11.15489532
Supplies TISSUES 0.082412584 0.007840788
Supplies TOWELS 23.70789241 2.255584649
Supplies TRAYS CARRIERS 644.0535206 61.27568022
Vegetables VEG/FRUIT DRIED 38.64474476 3.687668454
Vegetables VEGETABLE CAN 91.46834746 8.72835211
Vegetables VEGETABLE FRESH 237.1790304 22.59727557
Vegetables VEGETABLES FRZN 430.6900174 40.93821955

Supplies WAREWASH 238.5313042 22.55419758
Supplies WASHANTIMICROBL 1.885795576 0.178310374
Other WINE/LIQ COOKNG 3.0923969 0.293873743
Supplies WIPERS 88.1174601 8.383553749
Other YOGURT 146.3133407 13.89868194
Grand Total 23932.1551 2278.447206
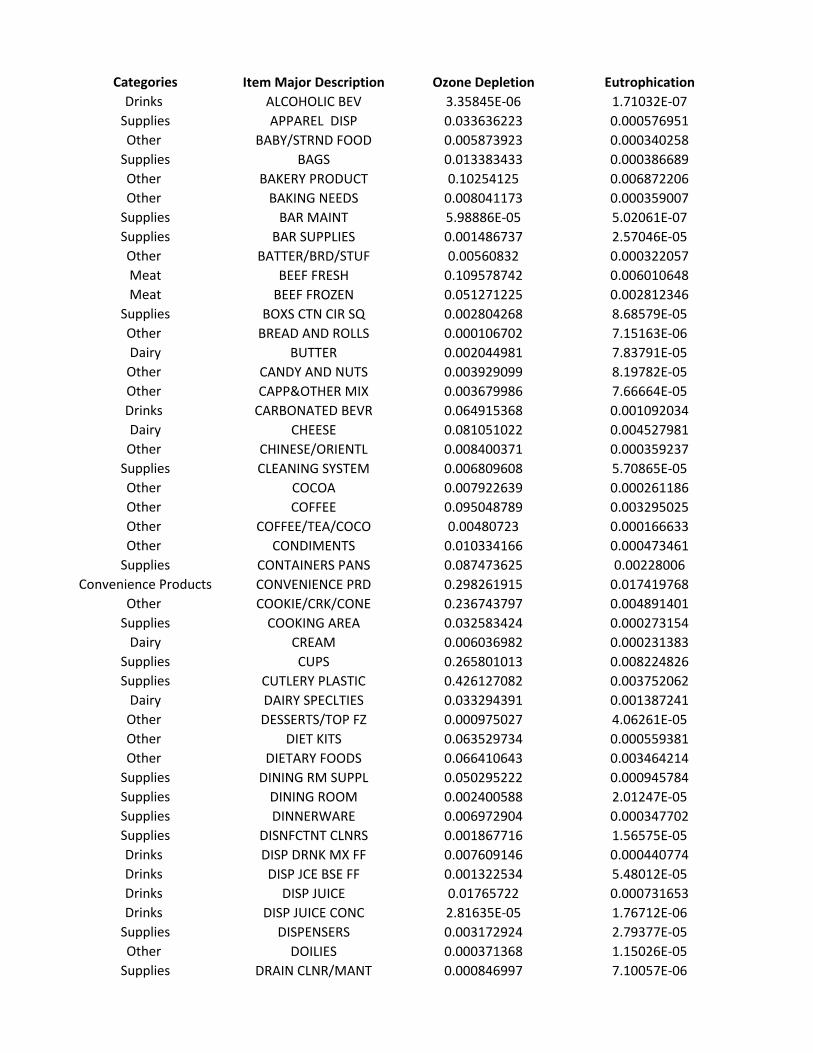
Categories Item Major Description Ozone Depletion Eutrophication
Drinks ALCOHOLIC BEV 3.35845E-06 1.71032E-07
Supplies APPAREL DISP 0.033636223 0.000576951
Other BABY/STRND FOOD 0.005873923 0.000340258
Supplies BAGS 0.013383433 0.000386689
Other BAKERY PRODUCT 0.10254125 0.006872206
Other BAKING NEEDS 0.008041173 0.000359007
Supplies BAR MAINT 5.98886E-05 5.02061E-07
Supplies BAR SUPPLIES 0.001486737 2.57046E-05
Other BATTER/BRD/STUF 0.00560832 0.000322057
Meat BEEF FRESH 0.109578742 0.006010648
Meat BEEF FROZEN 0.051271225 0.002812346
Supplies BOXS CTN CIR SQ 0.002804268 8.68579E-05
Other BREAD AND ROLLS 0.000106702 7.15163E-06
Dairy BUTTER 0.002044981 7.83791E-05
Other CANDY AND NUTS 0.003929099 8.19782E-05
Other CAPP&OTHER MIX 0.003679986 7.66664E-05
Drinks CARBONATED BEVR 0.064915368 0.001092034
Dairy CHEESE 0.081051022 0.004527981
Other CHINESE/ORIENTL 0.008400371 0.000359237
Supplies CLEANING SYSTEM 0.006809608 5.70865E-05
Other COCOA 0.007922639 0.000261186
Other COFFEE 0.095048789 0.003295025
Other COFFEE/TEA/COCO 0.00480723 0.000166633
Other CONDIMENTS 0.010334166 0.000473461
Supplies CONTAINERS PANS 0.087473625 0.00228006
Convenience Products CONVENIENCE PRD 0.298261915 0.017419768
Other COOKIE/CRK/CONE 0.236743797 0.004891401
Supplies COOKING AREA 0.032583424 0.000273154
Dairy CREAM 0.006036982 0.000231383
Supplies CUPS 0.265801013 0.008224826
Supplies CUTLERY PLASTIC 0.426127082 0.003752062
Dairy DAIRY SPECLTIES 0.033294391 0.001387241
Other DESSERTS/TOP FZ 0.000975027 4.06261E-05
Other DIET KITS 0.063529734 0.000559381
Other DIETARY FOODS 0.066410643 0.003464214
Supplies DINING RM SUPPL 0.050295222 0.000945784
Supplies DINING ROOM 0.002400588 2.01247E-05
Supplies DINNERWARE 0.006972904 0.000347702
Supplies DISNFCTNT CLNRS 0.001867716 1.56575E-05
Drinks DISP DRNK MX FF 0.007609146 0.000440774
Drinks DISP JCE BSE FF 0.001322534 5.48012E-05
Drinks DISP JUICE 0.01765722 0.000731653
Drinks DISP JUICE CONC 2.81635E-05 1.76712E-06
Supplies DISPENSERS 0.003172924 2.79377E-05
Other DOILIES 0.000371368 1.15026E-05
Supplies DRAIN CLNR/MANT 0.000846997 7.10057E-06
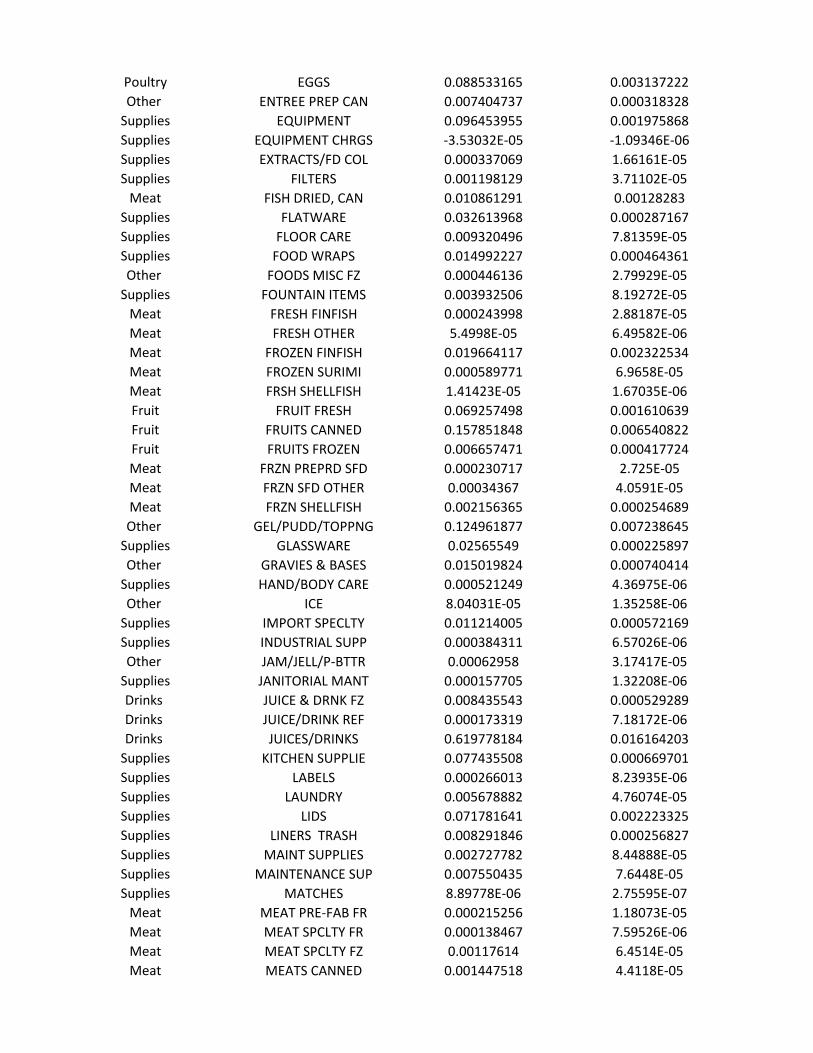
Poultry EGGS 0.088533165 0.003137222
Other ENTREE PREP CAN 0.007404737 0.000318328
Supplies EQUIPMENT 0.096453955 0.001975868
Supplies EQUIPMENT CHRGS -3.53032E-05 -1.09346E-06
Supplies EXTRACTS/FD COL 0.000337069 1.66161E-05
Supplies FILTERS 0.001198129 3.71102E-05
Meat FISH DRIED, CAN 0.010861291 0.00128283
Supplies FLATWARE 0.032613968 0.000287167
Supplies FLOOR CARE 0.009320496 7.81359E-05
Supplies FOOD WRAPS 0.014992227 0.000464361
Other FOODS MISC FZ 0.000446136 2.79929E-05
Supplies FOUNTAIN ITEMS 0.003932506 8.19272E-05
Meat FRESH FINFISH 0.000243998 2.88187E-05
Meat FRESH OTHER 5.4998E-05 6.49582E-06
Meat FROZEN FINFISH 0.019664117 0.002322534
Meat FROZEN SURIMI 0.000589771 6.9658E-05
Meat FRSH SHELLFISH 1.41423E-05 1.67035E-06
Fruit FRUIT FRESH 0.069257498 0.001610639
Fruit FRUITS CANNED 0.157851848 0.006540822
Fruit FRUITS FROZEN 0.006657471 0.000417724
Meat FRZN PREPRD SFD 0.000230717 2.725E-05
Meat FRZN SFD OTHER 0.00034367 4.0591E-05
Meat FRZN SHELLFISH 0.002156365 0.000254689
Other GEL/PUDD/TOPPNG 0.124961877 0.007238645
Supplies GLASSWARE 0.02565549 0.000225897
Other GRAVIES & BASES 0.015019824 0.000740414
Supplies HAND/BODY CARE 0.000521249 4.36975E-06
Other ICE 8.04031E-05 1.35258E-06
Supplies IMPORT SPECLTY 0.011214005 0.000572169
Supplies INDUSTRIAL SUPP 0.000384311 6.57026E-06
Other JAM/JELL/P-BTTR 0.00062958 3.17417E-05
Supplies JANITORIAL MANT 0.000157705 1.32208E-06
Drinks JUICE & DRNK FZ 0.008435543 0.000529289
Drinks JUICE/DRINK REF 0.000173319 7.18172E-06
Drinks JUICES/DRINKS 0.619778184 0.016164203
Supplies KITCHEN SUPPLIE 0.077435508 0.000669701
Supplies LABELS 0.000266013 8.23935E-06
Supplies LAUNDRY 0.005678882 4.76074E-05
Supplies LIDS 0.071781641 0.002223325
Supplies LINERS TRASH 0.008291846 0.000256827
Supplies MAINT SUPPLIES 0.002727782 8.44888E-05
Supplies MAINTENANCE SUP 0.007550435 7.6448E-05
Supplies MATCHES 8.89778E-06 2.75595E-07
Meat MEAT PRE-FAB FR 0.000215256 1.18073E-05
Meat MEAT SPCLTY FR 0.000138467 7.59526E-06
Meat MEAT SPCLTY FZ 0.00117614 6.4514E-05
Meat MEATS CANNED 0.001447518 4.4118E-05
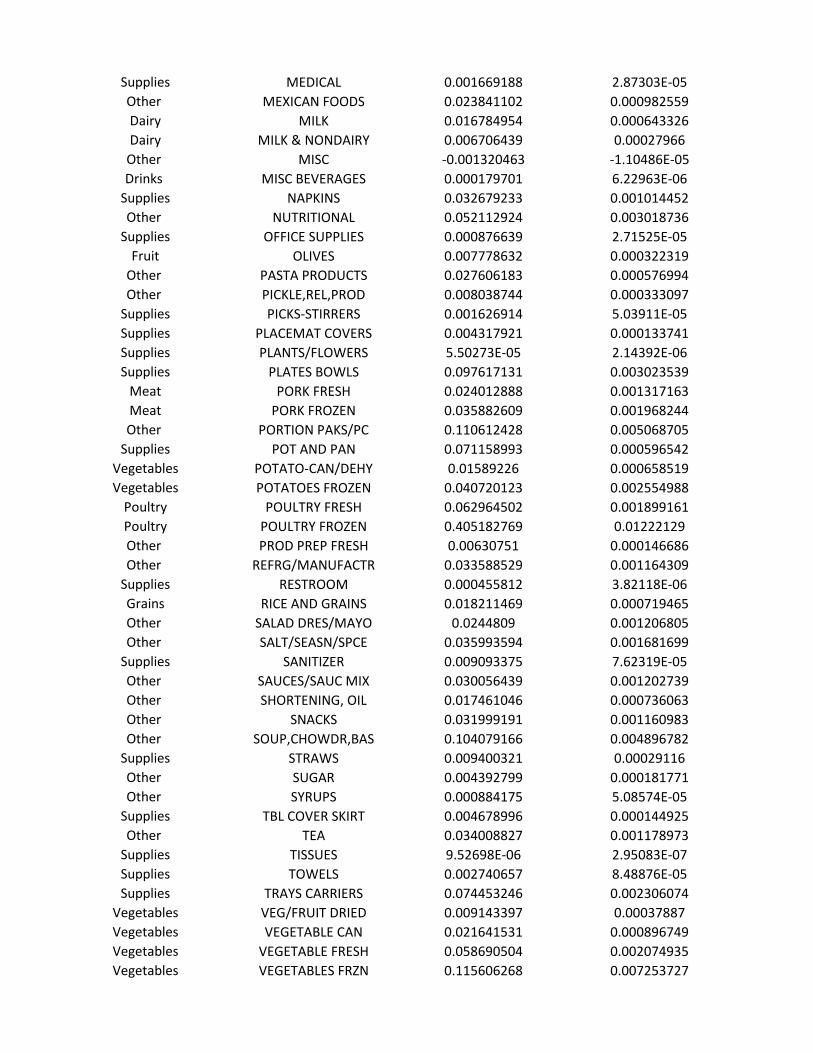
Supplies MEDICAL 0.001669188 2.87303E-05
Other MEXICAN FOODS 0.023841102 0.000982559
Dairy MILK 0.016784954 0.000643326
Dairy MILK & NONDAIRY 0.006706439 0.00027966
Other MISC -0.001320463 -1.10486E-05
Drinks MISC BEVERAGES 0.000179701 6.22963E-06
Supplies NAPKINS 0.032679233 0.001014452
Other NUTRITIONAL 0.052112924 0.003018736
Supplies OFFICE SUPPLIES 0.000876639 2.71525E-05
Fruit OLIVES 0.007778632 0.000322319
Other PASTA PRODUCTS 0.027606183 0.000576994
Other PICKLE,REL,PROD 0.008038744 0.000333097
Supplies PICKS-STIRRERS 0.001626914 5.03911E-05
Supplies PLACEMAT COVERS 0.004317921 0.000133741
Supplies PLANTS/FLOWERS 5.50273E-05 2.14392E-06
Supplies PLATES BOWLS 0.097617131 0.003023539
Meat PORK FRESH 0.024012888 0.001317163
Meat PORK FROZEN 0.035882609 0.001968244
Other PORTION PAKS/PC 0.110612428 0.005068705
Supplies POT AND PAN 0.071158993 0.000596542
Vegetables POTATO-CAN/DEHY 0.01589226 0.000658519
Vegetables POTATOES FROZEN 0.040720123 0.002554988
Poultry POULTRY FRESH 0.062964502 0.001899161
Poultry POULTRY FROZEN 0.405182769 0.01222129
Other PROD PREP FRESH 0.00630751 0.000146686
Other REFRG/MANUFACTR 0.033588529 0.001164309
Supplies RESTROOM 0.000455812 3.82118E-06
Grains RICE AND GRAINS 0.018211469 0.000719465
Other SALAD DRES/MAYO 0.0244809 0.001206805
Other SALT/SEASN/SPCE 0.035993594 0.001681699
Supplies SANITIZER 0.009093375 7.62319E-05
Other SAUCES/SAUC MIX 0.030056439 0.001202739
Other SHORTENING, OIL 0.017461046 0.000736063
Other SNACKS 0.031999191 0.001160983
Other SOUP,CHOWDR,BAS 0.104079166 0.004896782
Supplies STRAWS 0.009400321 0.00029116
Other SUGAR 0.004392799 0.000181771
Other SYRUPS 0.000884175 5.08574E-05
Supplies TBL COVER SKIRT 0.004678996 0.000144925
Other TEA 0.034008827 0.001178973
Supplies TISSUES 9.52698E-06 2.95083E-07
Supplies TOWELS 0.002740657 8.48876E-05
Supplies TRAYS CARRIERS 0.074453246 0.002306074
Vegetables VEG/FRUIT DRIED 0.009143397 0.00037887
Vegetables VEGETABLE CAN 0.021641531 0.000896749
Vegetables VEGETABLE FRESH 0.058690504 0.002074935
Vegetables VEGETABLES FRZN 0.115606268 0.007253727

Supplies WAREWASH 0.098600811 0.000826594
Supplies WASHANTIMICROBL 0.000779524 6.53494E-06
Other WINE/LIQ COOKNG 0.000414881 2.11282E-05
Supplies WIPERS 0.010186469 0.00031551
Other YOGURT 0.032540278 0.001267963
Grand Total 5.576869846 0.188437767
Kaiser Permanente Group Project
Final Report
Appendix C
CEDA CMU Comparison
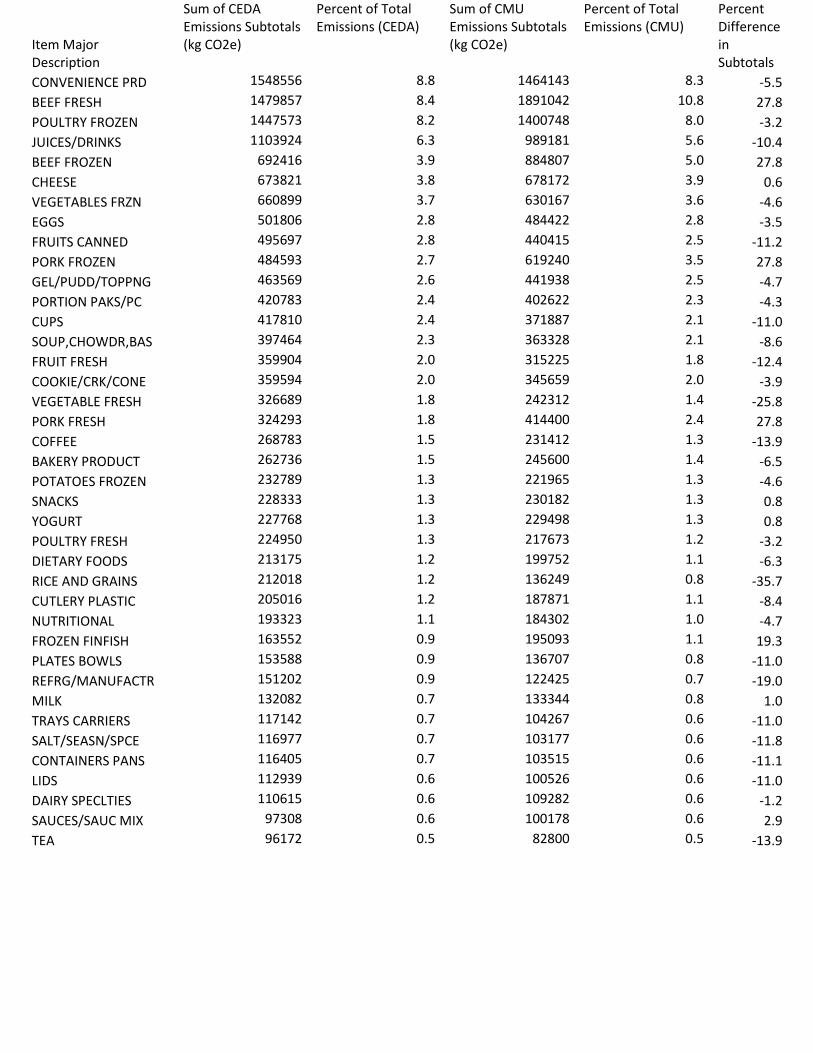
Item Major Description
Sum of CEDA Emissions Subtotals (kg CO2e)
Percent of Total Emissions (CEDA)
Sum of CMU Emissions Subtotals (kg CO2e)
Percent of Total Emissions (CMU)
Percent Difference in Subtotals
CONVENIENCE PRD 1548556 8.8 1464143 8.3 -5.5
BEEF FRESH 1479857 8.4 1891042 10.8 27.8
POULTRY FROZEN 1447573 8.2 1400748 8.0 -3.2
JUICES/DRINKS 1103924 6.3 989181 5.6 -10.4
BEEF FROZEN 692416 3.9 884807 5.0 27.8
CHEESE 673821 3.8 678172 3.9 0.6
VEGETABLES FRZN 660899 3.7 630167 3.6 -4.6
EGGS 501806 2.8 484422 2.8 -3.5
FRUITS CANNED 495697 2.8 440415 2.5 -11.2
PORK FROZEN 484593 2.7 619240 3.5 27.8
GEL/PUDD/TOPPNG 463569 2.6 441938 2.5 -4.7
PORTION PAKS/PC 420783 2.4 402622 2.3 -4.3
CUPS 417810 2.4 371887 2.1 -11.0
SOUP,CHOWDR,BAS 397464 2.3 363328 2.1 -8.6
FRUIT FRESH 359904 2.0 315225 1.8 -12.4
COOKIE/CRK/CONE 359594 2.0 345659 2.0 -3.9
VEGETABLE FRESH 326689 1.8 242312 1.4 -25.8
PORK FRESH 324293 1.8 414400 2.4 27.8
COFFEE 268783 1.5 231412 1.3 -13.9
BAKERY PRODUCT 262736 1.5 245600 1.4 -6.5
POTATOES FROZEN 232789 1.3 221965 1.3 -4.6
SNACKS 228333 1.3 230182 1.3 0.8
YOGURT 227768 1.3 229498 1.3 0.8
POULTRY FRESH 224950 1.3 217673 1.2 -3.2
DIETARY FOODS 213175 1.2 199752 1.1 -6.3
RICE AND GRAINS 212018 1.2 136249 0.8 -35.7
CUTLERY PLASTIC 205016 1.2 187871 1.1 -8.4
NUTRITIONAL 193323 1.1 184302 1.0 -4.7
FROZEN FINFISH 163552 0.9 195093 1.1 19.3
PLATES BOWLS 153588 0.9 136707 0.8 -11.0
REFRG/MANUFACTR 151202 0.9 122425 0.7 -19.0
MILK 132082 0.7 133344 0.8 1.0
TRAYS CARRIERS 117142 0.7 104267 0.6 -11.0
SALT/SEASN/SPCE 116977 0.7 103177 0.6 -11.8
CONTAINERS PANS 116405 0.7 103515 0.6 -11.1
LIDS 112939 0.6 100526 0.6 -11.0
DAIRY SPECLTIES 110615 0.6 109282 0.6 -1.2
SAUCES/SAUC MIX 97308 0.6 100178 0.6 2.9
TEA 96172 0.5 82800 0.5 -13.9
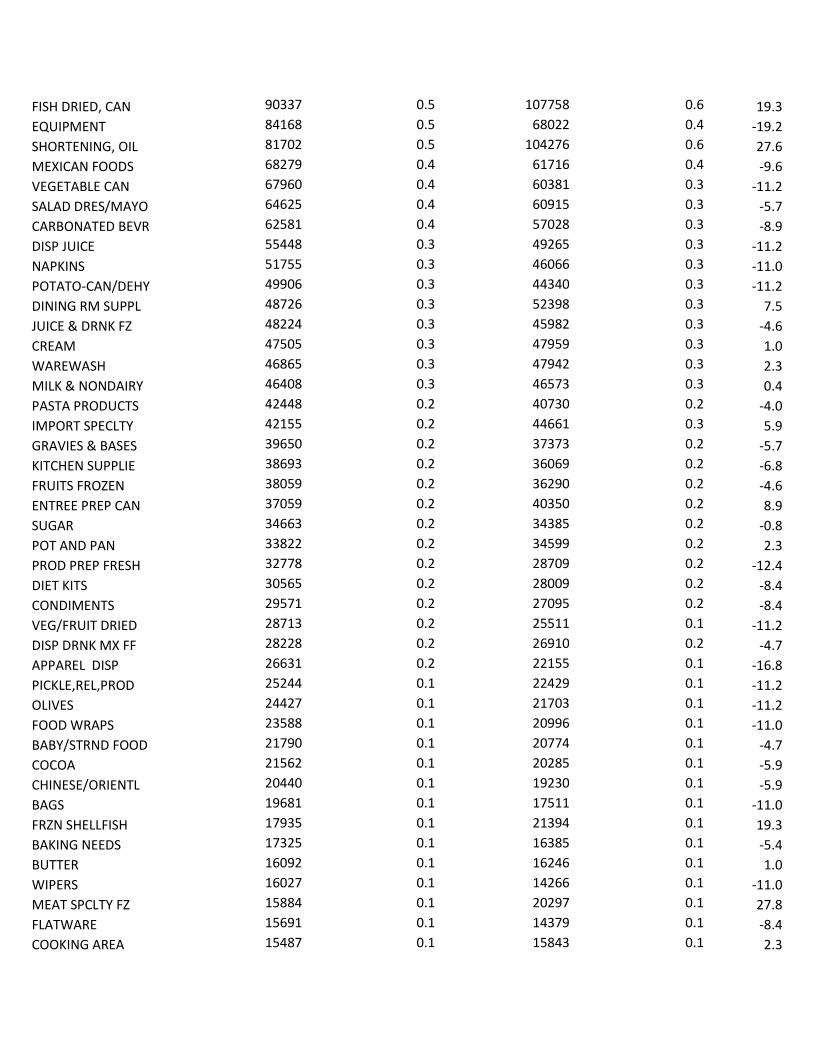
FISH DRIED, CAN 90337 0.5 107758 0.6 19.3
EQUIPMENT 84168 0.5 68022 0.4 -19.2
SHORTENING, OIL 81702 0.5 104276 0.6 27.6
MEXICAN FOODS 68279 0.4 61716 0.4 -9.6
VEGETABLE CAN 67960 0.4 60381 0.3 -11.2
SALAD DRES/MAYO 64625 0.4 60915 0.3 -5.7
CARBONATED BEVR 62581 0.4 57028 0.3 -8.9
DISP JUICE 55448 0.3 49265 0.3 -11.2
NAPKINS 51755 0.3 46066 0.3 -11.0
POTATO-CAN/DEHY 49906 0.3 44340 0.3 -11.2
DINING RM SUPPL 48726 0.3 52398 0.3 7.5
JUICE & DRNK FZ 48224 0.3 45982 0.3 -4.6
CREAM 47505 0.3 47959 0.3 1.0
WAREWASH 46865 0.3 47942 0.3 2.3
MILK & NONDAIRY 46408 0.3 46573 0.3 0.4
PASTA PRODUCTS 42448 0.2 40730 0.2 -4.0
IMPORT SPECLTY 42155 0.2 44661 0.3 5.9
GRAVIES & BASES 39650 0.2 37373 0.2 -5.7
KITCHEN SUPPLIE 38693 0.2 36069 0.2 -6.8
FRUITS FROZEN 38059 0.2 36290 0.2 -4.6
ENTREE PREP CAN 37059 0.2 40350 0.2 8.9
SUGAR 34663 0.2 34385 0.2 -0.8
POT AND PAN 33822 0.2 34599 0.2 2.3
PROD PREP FRESH 32778 0.2 28709 0.2 -12.4
DIET KITS 30565 0.2 28009 0.2 -8.4
CONDIMENTS 29571 0.2 27095 0.2 -8.4
VEG/FRUIT DRIED 28713 0.2 25511 0.1 -11.2
DISP DRNK MX FF 28228 0.2 26910 0.2 -4.7
APPAREL DISP 26631 0.2 22155 0.1 -16.8
PICKLE,REL,PROD 25244 0.1 22429 0.1 -11.2
OLIVES 24427 0.1 21703 0.1 -11.2
FOOD WRAPS 23588 0.1 20996 0.1 -11.0
BABY/STRND FOOD 21790 0.1 20774 0.1 -4.7
COCOA 21562 0.1 20285 0.1 -5.9
CHINESE/ORIENTL 20440 0.1 19230 0.1 -5.9
BAGS 19681 0.1 17511 0.1 -11.0
FRZN SHELLFISH 17935 0.1 21394 0.1 19.3
BAKING NEEDS 17325 0.1 16385 0.1 -5.4
BUTTER 16092 0.1 16246 0.1 1.0
WIPERS 16027 0.1 14266 0.1 -11.0
MEAT SPCLTY FZ 15884 0.1 20297 0.1 27.8
FLATWARE 15691 0.1 14379 0.1 -8.4
COOKING AREA 15487 0.1 15843 0.1 2.3
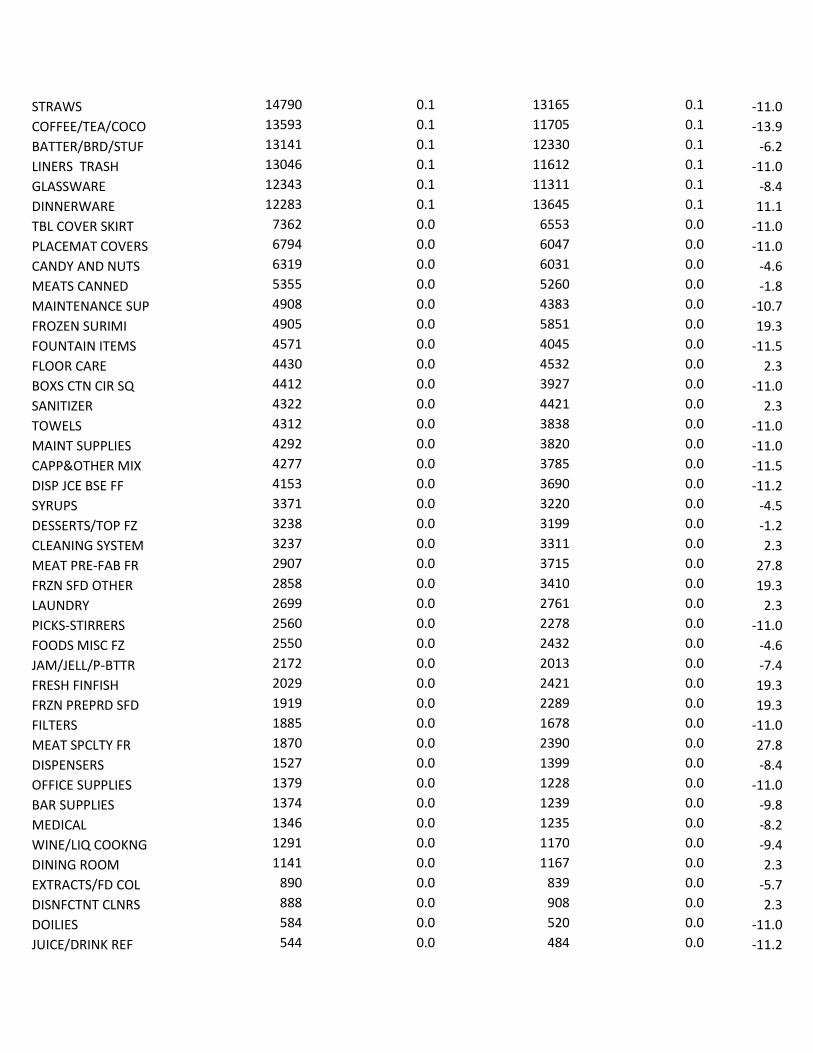
STRAWS 14790 0.1 13165 0.1 -11.0
COFFEE/TEA/COCO 13593 0.1 11705 0.1 -13.9
BATTER/BRD/STUF 13141 0.1 12330 0.1 -6.2
LINERS TRASH 13046 0.1 11612 0.1 -11.0
GLASSWARE 12343 0.1 11311 0.1 -8.4
DINNERWARE 12283 0.1 13645 0.1 11.1
TBL COVER SKIRT 7362 0.0 6553 0.0 -11.0
PLACEMAT COVERS 6794 0.0 6047 0.0 -11.0
CANDY AND NUTS 6319 0.0 6031 0.0 -4.6
MEATS CANNED 5355 0.0 5260 0.0 -1.8
MAINTENANCE SUP 4908 0.0 4383 0.0 -10.7
FROZEN SURIMI 4905 0.0 5851 0.0 19.3
FOUNTAIN ITEMS 4571 0.0 4045 0.0 -11.5
FLOOR CARE 4430 0.0 4532 0.0 2.3
BOXS CTN CIR SQ 4412 0.0 3927 0.0 -11.0
SANITIZER 4322 0.0 4421 0.0 2.3
TOWELS 4312 0.0 3838 0.0 -11.0
MAINT SUPPLIES 4292 0.0 3820 0.0 -11.0
CAPP&OTHER MIX 4277 0.0 3785 0.0 -11.5
DISP JCE BSE FF 4153 0.0 3690 0.0 -11.2
SYRUPS 3371 0.0 3220 0.0 -4.5
DESSERTS/TOP FZ 3238 0.0 3199 0.0 -1.2
CLEANING SYSTEM 3237 0.0 3311 0.0 2.3
MEAT PRE-FAB FR 2907 0.0 3715 0.0 27.8
FRZN SFD OTHER 2858 0.0 3410 0.0 19.3
LAUNDRY 2699 0.0 2761 0.0 2.3
PICKS-STIRRERS 2560 0.0 2278 0.0 -11.0
FOODS MISC FZ 2550 0.0 2432 0.0 -4.6
JAM/JELL/P-BTTR 2172 0.0 2013 0.0 -7.4
FRESH FINFISH 2029 0.0 2421 0.0 19.3
FRZN PREPRD SFD 1919 0.0 2289 0.0 19.3
FILTERS 1885 0.0 1678 0.0 -11.0
MEAT SPCLTY FR 1870 0.0 2390 0.0 27.8
DISPENSERS 1527 0.0 1399 0.0 -8.4
OFFICE SUPPLIES 1379 0.0 1228 0.0 -11.0
BAR SUPPLIES 1374 0.0 1239 0.0 -9.8
MEDICAL 1346 0.0 1235 0.0 -8.2
WINE/LIQ COOKNG 1291 0.0 1170 0.0 -9.4
DINING ROOM 1141 0.0 1167 0.0 2.3
EXTRACTS/FD COL 890 0.0 839 0.0 -5.7
DISNFCTNT CLNRS 888 0.0 908 0.0 2.3
DOILIES 584 0.0 520 0.0 -11.0
JUICE/DRINK REF 544 0.0 484 0.0 -11.2
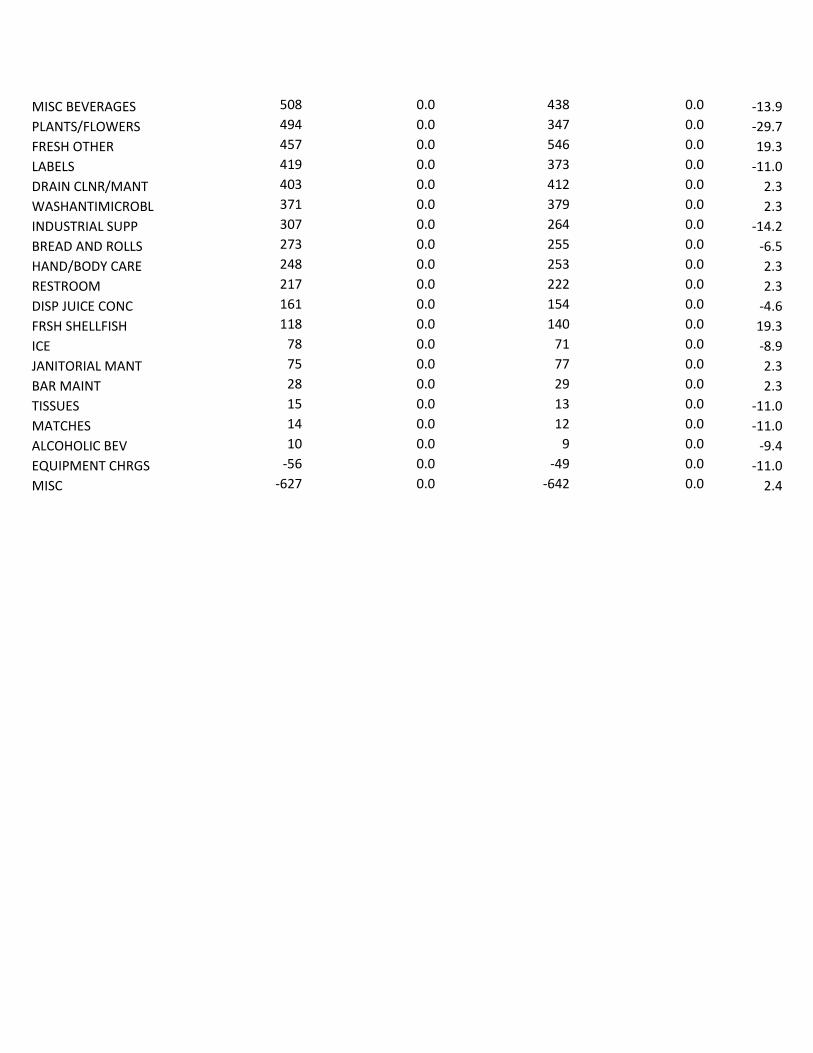
MISC BEVERAGES 508 0.0 438 0.0 -13.9
PLANTS/FLOWERS 494 0.0 347 0.0 -29.7
FRESH OTHER 457 0.0 546 0.0 19.3
LABELS 419 0.0 373 0.0 -11.0
DRAIN CLNR/MANT 403 0.0 412 0.0 2.3
WASHANTIMICROBL 371 0.0 379 0.0 2.3
INDUSTRIAL SUPP 307 0.0 264 0.0 -14.2
BREAD AND ROLLS 273 0.0 255 0.0 -6.5
HAND/BODY CARE 248 0.0 253 0.0 2.3
RESTROOM 217 0.0 222 0.0 2.3
DISP JUICE CONC 161 0.0 154 0.0 -4.6
FRSH SHELLFISH 118 0.0 140 0.0 19.3
ICE 78 0.0 71 0.0 -8.9
JANITORIAL MANT 75 0.0 77 0.0 2.3
BAR MAINT 28 0.0 29 0.0 2.3
TISSUES 15 0.0 13 0.0 -11.0
MATCHES 14 0.0 12 0.0 -11.0
ALCOHOLIC BEV 10 0.0 9 0.0 -9.4
EQUIPMENT CHRGS -56 0.0 -49 0.0 -11.0
MISC -627 0.0 -642 0.0 2.4
Kaiser Permanente Group Project
Final Report
Appendix D
Literature Emissions Data
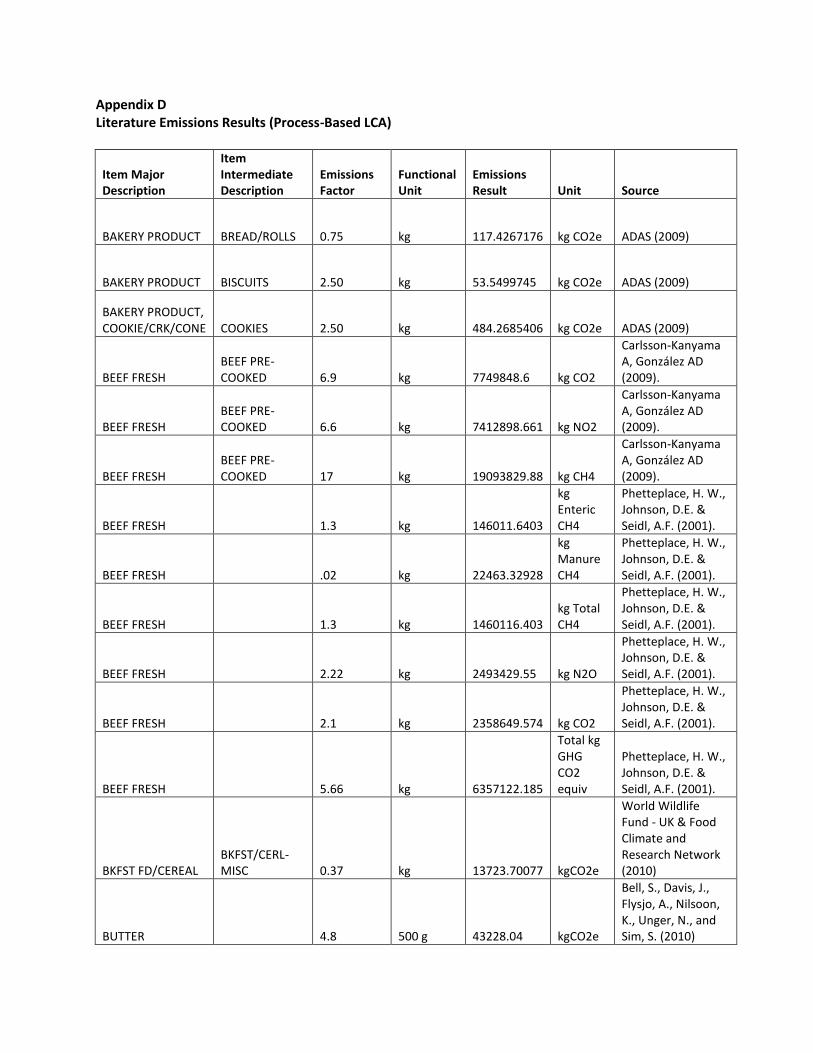
Appendix D Literature Emissions Results (Process-Based LCA)
Item Major Description
Item Intermediate Description
Emissions Factor
Functional Unit
Emissions Result Unit Source
BAKERY PRODUCT BREAD/ROLLS 0.75 kg 117.4267176 kg CO2e ADAS (2009)
BAKERY PRODUCT BISCUITS 2.50 kg 53.5499745 kg CO2e ADAS (2009)
BAKERY PRODUCT, COOKIE/CRK/CONE COOKIES 2.50 kg 484.2685406 kg CO2e ADAS (2009)
BEEF FRESH BEEF PRE-COOKED 6.9 kg 7749848.6 kg CO2
Carlsson-Kanyama A, González AD (2009).
BEEF FRESH BEEF PRE-COOKED 6.6 kg 7412898.661 kg NO2
Carlsson-Kanyama A, González AD (2009).
BEEF FRESH BEEF PRE-COOKED 17 kg 19093829.88 kg CH4
Carlsson-Kanyama A, González AD (2009).
BEEF FRESH 1.3 kg 146011.6403
kg Enteric CH4
Phetteplace, H. W., Johnson, D.E. & Seidl, A.F. (2001).
BEEF FRESH .02 kg 22463.32928
kg Manure CH4
Phetteplace, H. W., Johnson, D.E. & Seidl, A.F. (2001).
BEEF FRESH 1.3 kg 1460116.403 kg Total CH4
Phetteplace, H. W., Johnson, D.E. & Seidl, A.F. (2001).
BEEF FRESH 2.22 kg 2493429.55 kg N2O
Phetteplace, H. W., Johnson, D.E. & Seidl, A.F. (2001).
BEEF FRESH 2.1 kg 2358649.574 kg CO2
Phetteplace, H. W., Johnson, D.E. & Seidl, A.F. (2001).
BEEF FRESH 5.66 kg 6357122.185
Total kg GHG CO2 equiv
Phetteplace, H. W., Johnson, D.E. & Seidl, A.F. (2001).
BKFST FD/CEREAL BKFST/CERL-MISC 0.37 kg 13723.70077 kgCO2e
World Wildlife Fund - UK & Food Climate and Research Network (2010)
BUTTER 4.8 500 g 43228.04 kgCO2e
Bell, S., Davis, J., Flysjo, A., Nilsoon, K., Unger, N., and Sim, S. (2010)
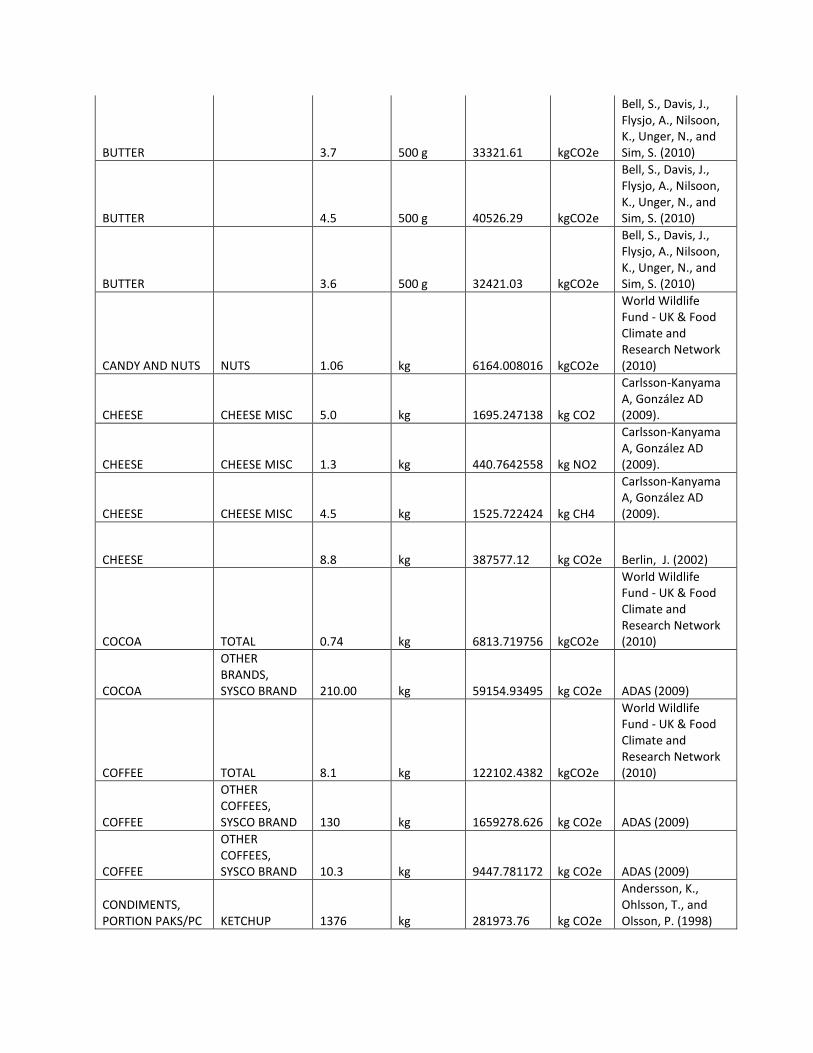
BUTTER 3.7 500 g 33321.61 kgCO2e
Bell, S., Davis, J., Flysjo, A., Nilsoon, K., Unger, N., and Sim, S. (2010)
BUTTER 4.5 500 g 40526.29 kgCO2e
Bell, S., Davis, J., Flysjo, A., Nilsoon, K., Unger, N., and Sim, S. (2010)
BUTTER 3.6 500 g 32421.03 kgCO2e
Bell, S., Davis, J., Flysjo, A., Nilsoon, K., Unger, N., and Sim, S. (2010)
CANDY AND NUTS NUTS 1.06 kg 6164.008016 kgCO2e
World Wildlife Fund - UK & Food Climate and Research Network (2010)
CHEESE CHEESE MISC 5.0 kg 1695.247138 kg CO2
Carlsson-Kanyama A, González AD (2009).
CHEESE CHEESE MISC 1.3 kg 440.7642558 kg NO2
Carlsson-Kanyama A, González AD (2009).
CHEESE CHEESE MISC 4.5 kg 1525.722424 kg CH4
Carlsson-Kanyama A, González AD (2009).
CHEESE 8.8 kg 387577.12 kg CO2e Berlin, J. (2002)
COCOA TOTAL 0.74 kg 6813.719756 kgCO2e
World Wildlife Fund - UK & Food Climate and Research Network (2010)
COCOA
OTHER BRANDS, SYSCO BRAND 210.00 kg 59154.93495 kg CO2e ADAS (2009)
COFFEE TOTAL 8.1 kg 122102.4382 kgCO2e
World Wildlife Fund - UK & Food Climate and Research Network (2010)
COFFEE
OTHER COFFEES, SYSCO BRAND 130 kg 1659278.626 kg CO2e ADAS (2009)
COFFEE
OTHER COFFEES, SYSCO BRAND 10.3 kg 9447.781172 kg CO2e ADAS (2009)
CONDIMENTS, PORTION PAKS/PC KETCHUP 1376 kg 281973.76 kg CO2e
Andersson, K., Ohlsson, T., and Olsson, P. (1998)
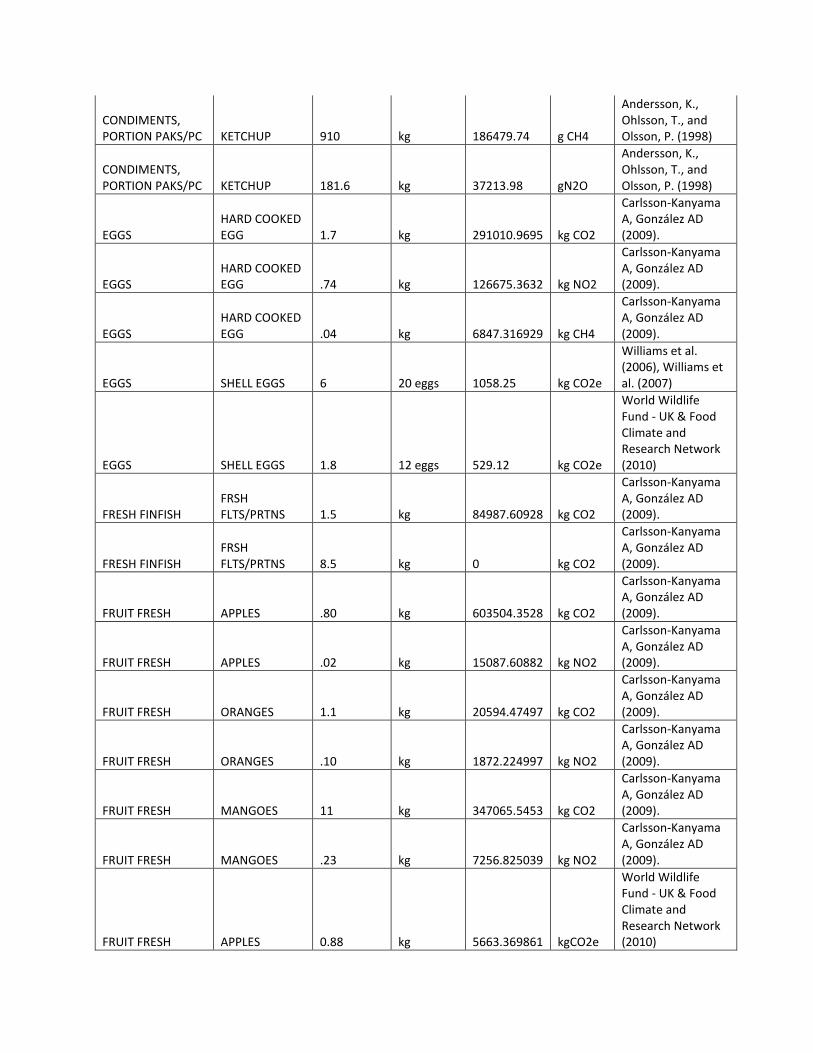
CONDIMENTS, PORTION PAKS/PC KETCHUP 910 kg 186479.74 g CH4
Andersson, K., Ohlsson, T., and Olsson, P. (1998)
CONDIMENTS, PORTION PAKS/PC KETCHUP 181.6 kg 37213.98 gN2O
Andersson, K., Ohlsson, T., and Olsson, P. (1998)
EGGS HARD COOKED EGG 1.7 kg 291010.9695 kg CO2
Carlsson-Kanyama A, González AD (2009).
EGGS HARD COOKED EGG .74 kg 126675.3632 kg NO2
Carlsson-Kanyama A, González AD (2009).
EGGS HARD COOKED EGG .04 kg 6847.316929 kg CH4
Carlsson-Kanyama A, González AD (2009).
EGGS SHELL EGGS 6 20 eggs 1058.25 kg CO2e
Williams et al. (2006), Williams et al. (2007)
EGGS SHELL EGGS 1.8 12 eggs 529.12 kg CO2e
World Wildlife Fund - UK & Food Climate and Research Network (2010)
FRESH FINFISH FRSH FLTS/PRTNS 1.5 kg 84987.60928 kg CO2
Carlsson-Kanyama A, González AD (2009).
FRESH FINFISH FRSH FLTS/PRTNS 8.5 kg 0 kg CO2
Carlsson-Kanyama A, González AD (2009).
FRUIT FRESH APPLES .80 kg 603504.3528 kg CO2
Carlsson-Kanyama A, González AD (2009).
FRUIT FRESH APPLES .02 kg 15087.60882 kg NO2
Carlsson-Kanyama A, González AD (2009).
FRUIT FRESH ORANGES 1.1 kg 20594.47497 kg CO2
Carlsson-Kanyama A, González AD (2009).
FRUIT FRESH ORANGES .10 kg 1872.224997 kg NO2
Carlsson-Kanyama A, González AD (2009).
FRUIT FRESH MANGOES 11 kg 347065.5453 kg CO2
Carlsson-Kanyama A, González AD (2009).
FRUIT FRESH MANGOES .23 kg 7256.825039 kg NO2
Carlsson-Kanyama A, González AD (2009).
FRUIT FRESH APPLES 0.88 kg 5663.369861 kgCO2e
World Wildlife Fund - UK & Food Climate and Research Network (2010)
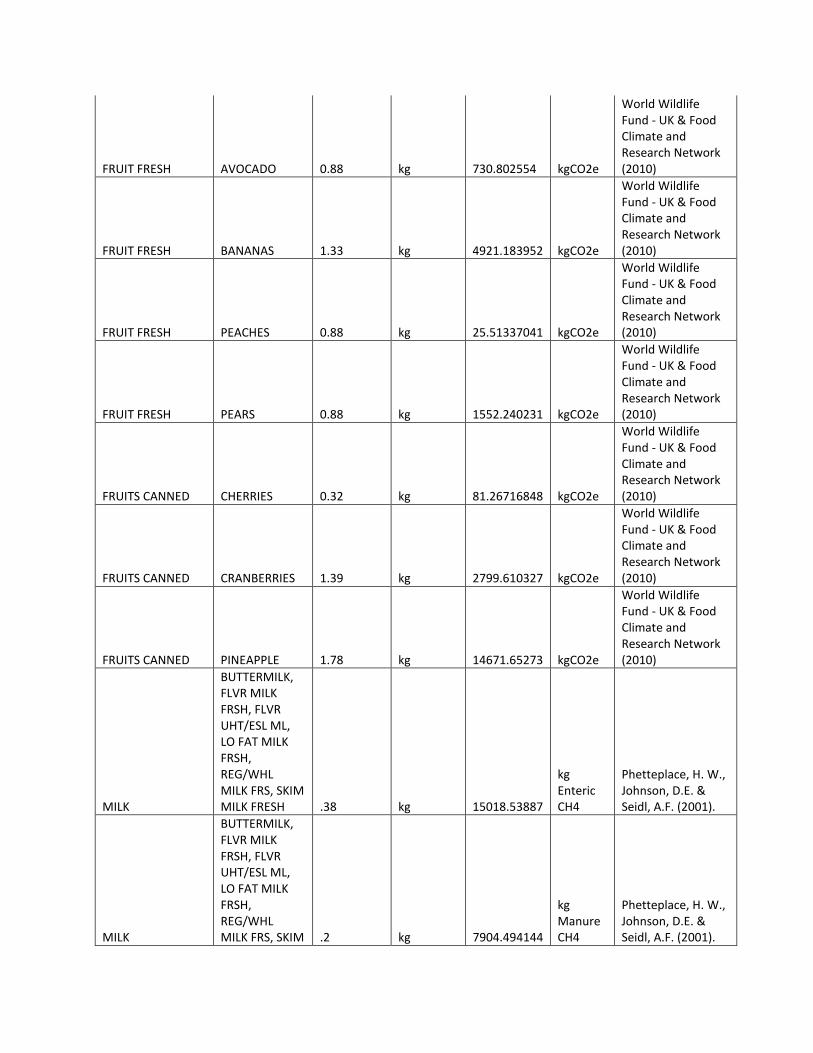
FRUIT FRESH AVOCADO 0.88 kg 730.802554 kgCO2e
World Wildlife Fund - UK & Food Climate and Research Network (2010)
FRUIT FRESH BANANAS 1.33 kg 4921.183952 kgCO2e
World Wildlife Fund - UK & Food Climate and Research Network (2010)
FRUIT FRESH PEACHES 0.88 kg 25.51337041 kgCO2e
World Wildlife Fund - UK & Food Climate and Research Network (2010)
FRUIT FRESH PEARS 0.88 kg 1552.240231 kgCO2e
World Wildlife Fund - UK & Food Climate and Research Network (2010)
FRUITS CANNED CHERRIES 0.32 kg 81.26716848 kgCO2e
World Wildlife Fund - UK & Food Climate and Research Network (2010)
FRUITS CANNED CRANBERRIES 1.39 kg 2799.610327 kgCO2e
World Wildlife Fund - UK & Food Climate and Research Network (2010)
FRUITS CANNED PINEAPPLE 1.78 kg 14671.65273 kgCO2e
World Wildlife Fund - UK & Food Climate and Research Network (2010)
MILK
BUTTERMILK, FLVR MILK FRSH, FLVR UHT/ESL ML, LO FAT MILK FRSH, REG/WHL MILK FRS, SKIM MILK FRESH .38 kg 15018.53887
kg Enteric CH4
Phetteplace, H. W., Johnson, D.E. & Seidl, A.F. (2001).
MILK
BUTTERMILK, FLVR MILK FRSH, FLVR UHT/ESL ML, LO FAT MILK FRSH, REG/WHL MILK FRS, SKIM .2 kg 7904.494144
kg Manure CH4
Phetteplace, H. W., Johnson, D.E. & Seidl, A.F. (2001).
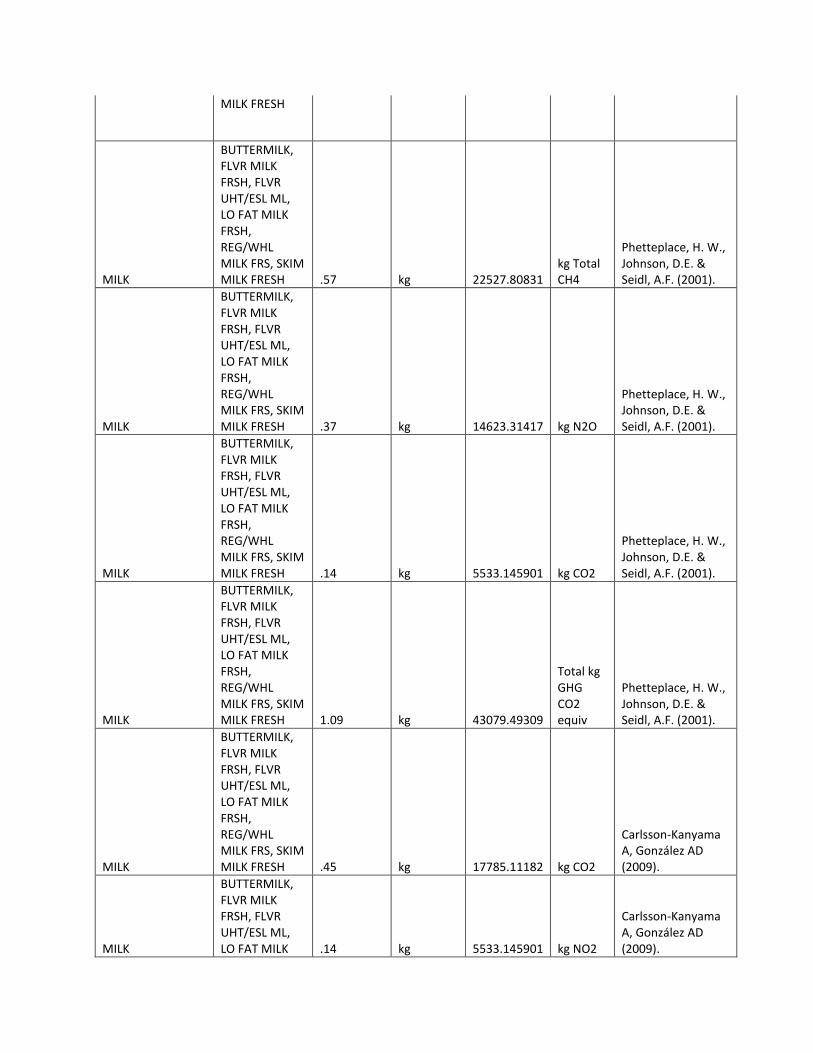
MILK FRESH
MILK
BUTTERMILK, FLVR MILK FRSH, FLVR UHT/ESL ML, LO FAT MILK FRSH, REG/WHL MILK FRS, SKIM MILK FRESH .57 kg 22527.80831
kg Total CH4
Phetteplace, H. W., Johnson, D.E. & Seidl, A.F. (2001).
MILK
BUTTERMILK, FLVR MILK FRSH, FLVR UHT/ESL ML, LO FAT MILK FRSH, REG/WHL MILK FRS, SKIM MILK FRESH .37 kg 14623.31417 kg N2O
Phetteplace, H. W., Johnson, D.E. & Seidl, A.F. (2001).
MILK
BUTTERMILK, FLVR MILK FRSH, FLVR UHT/ESL ML, LO FAT MILK FRSH, REG/WHL MILK FRS, SKIM MILK FRESH .14 kg 5533.145901 kg CO2
Phetteplace, H. W., Johnson, D.E. & Seidl, A.F. (2001).
MILK
BUTTERMILK, FLVR MILK FRSH, FLVR UHT/ESL ML, LO FAT MILK FRSH, REG/WHL MILK FRS, SKIM MILK FRESH 1.09 kg 43079.49309
Total kg GHG CO2 equiv
Phetteplace, H. W., Johnson, D.E. & Seidl, A.F. (2001).
MILK
BUTTERMILK, FLVR MILK FRSH, FLVR UHT/ESL ML, LO FAT MILK FRSH, REG/WHL MILK FRS, SKIM MILK FRESH .45 kg 17785.11182 kg CO2
Carlsson-Kanyama A, González AD (2009).
MILK
BUTTERMILK, FLVR MILK FRSH, FLVR UHT/ESL ML, LO FAT MILK .14 kg 5533.145901 kg NO2
Carlsson-Kanyama A, González AD (2009).
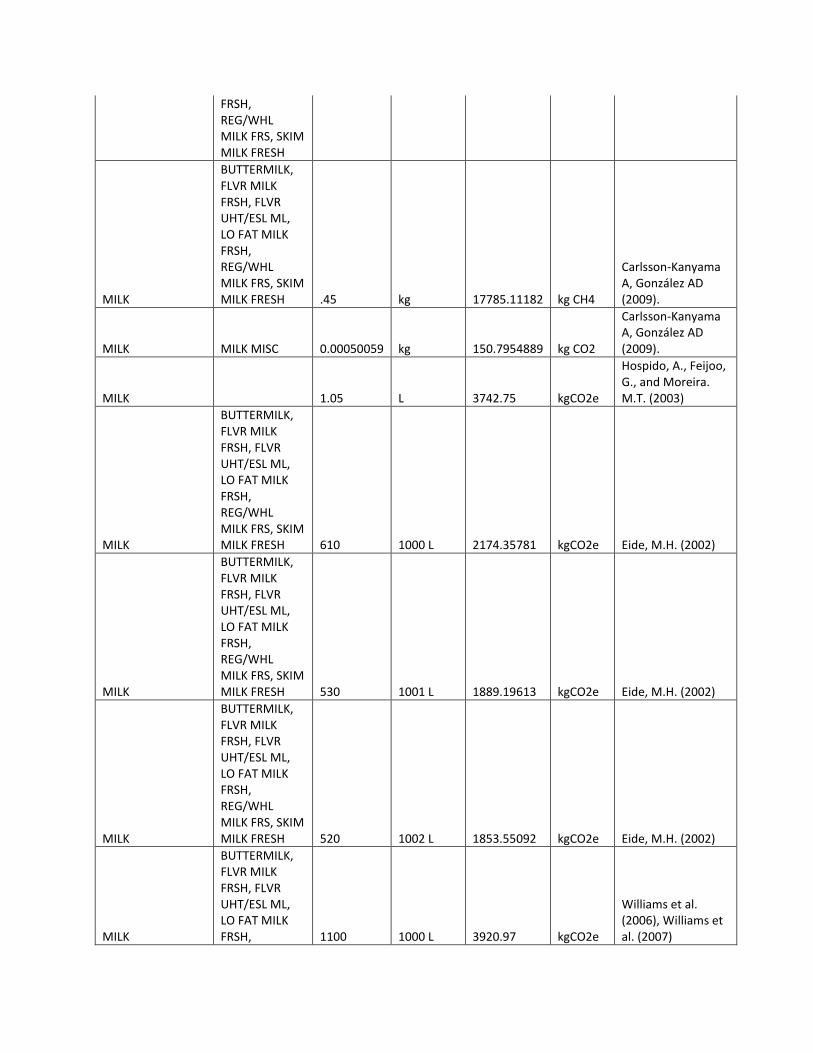
FRSH, REG/WHL MILK FRS, SKIM MILK FRESH
MILK
BUTTERMILK, FLVR MILK FRSH, FLVR UHT/ESL ML, LO FAT MILK FRSH, REG/WHL MILK FRS, SKIM MILK FRESH .45 kg 17785.11182 kg CH4
Carlsson-Kanyama A, González AD (2009).
MILK MILK MISC 0.00050059 kg 150.7954889 kg CO2
Carlsson-Kanyama A, González AD (2009).
MILK 1.05 L 3742.75 kgCO2e
Hospido, A., Feijoo, G., and Moreira. M.T. (2003)
MILK
BUTTERMILK, FLVR MILK FRSH, FLVR UHT/ESL ML, LO FAT MILK FRSH, REG/WHL MILK FRS, SKIM MILK FRESH 610 1000 L 2174.35781 kgCO2e Eide, M.H. (2002)
MILK
BUTTERMILK, FLVR MILK FRSH, FLVR UHT/ESL ML, LO FAT MILK FRSH, REG/WHL MILK FRS, SKIM MILK FRESH 530 1001 L 1889.19613 kgCO2e Eide, M.H. (2002)
MILK
BUTTERMILK, FLVR MILK FRSH, FLVR UHT/ESL ML, LO FAT MILK FRSH, REG/WHL MILK FRS, SKIM MILK FRESH 520 1002 L 1853.55092 kgCO2e Eide, M.H. (2002)
MILK
BUTTERMILK, FLVR MILK FRSH, FLVR UHT/ESL ML, LO FAT MILK FRSH, 1100 1000 L 3920.97 kgCO2e
Williams et al. (2006), Williams et al. (2007)
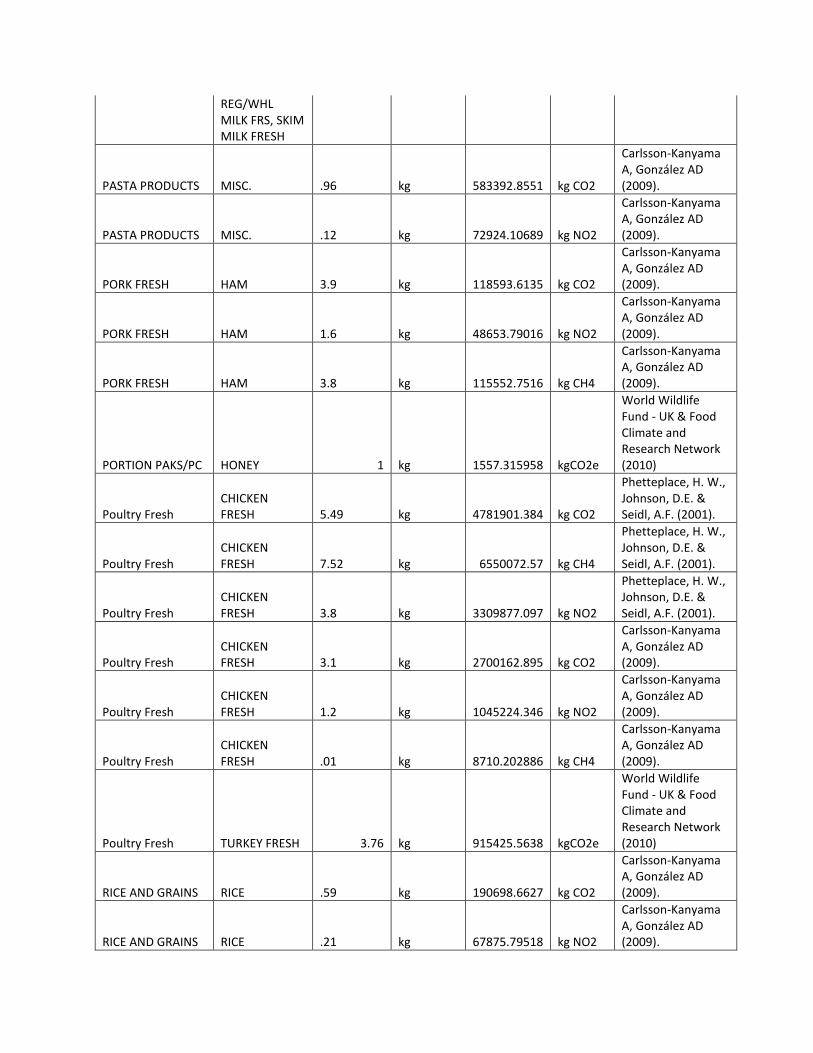
REG/WHL MILK FRS, SKIM MILK FRESH
PASTA PRODUCTS MISC. .96 kg 583392.8551 kg CO2
Carlsson-Kanyama A, González AD (2009).
PASTA PRODUCTS MISC. .12 kg 72924.10689 kg NO2
Carlsson-Kanyama A, González AD (2009).
PORK FRESH HAM 3.9 kg 118593.6135 kg CO2
Carlsson-Kanyama A, González AD (2009).
PORK FRESH HAM 1.6 kg 48653.79016 kg NO2
Carlsson-Kanyama A, González AD (2009).
PORK FRESH HAM 3.8 kg 115552.7516 kg CH4
Carlsson-Kanyama A, González AD (2009).
PORTION PAKS/PC HONEY 1 kg 1557.315958 kgCO2e
World Wildlife Fund - UK & Food Climate and Research Network (2010)
Poultry Fresh CHICKEN FRESH 5.49 kg 4781901.384 kg CO2
Phetteplace, H. W., Johnson, D.E. & Seidl, A.F. (2001).
Poultry Fresh CHICKEN FRESH 7.52 kg 6550072.57 kg CH4
Phetteplace, H. W., Johnson, D.E. & Seidl, A.F. (2001).
Poultry Fresh CHICKEN FRESH 3.8 kg 3309877.097 kg NO2
Phetteplace, H. W., Johnson, D.E. & Seidl, A.F. (2001).
Poultry Fresh CHICKEN FRESH 3.1 kg 2700162.895 kg CO2
Carlsson-Kanyama A, González AD (2009).
Poultry Fresh CHICKEN FRESH 1.2 kg 1045224.346 kg NO2
Carlsson-Kanyama A, González AD (2009).
Poultry Fresh CHICKEN FRESH .01 kg 8710.202886 kg CH4
Carlsson-Kanyama A, González AD (2009).
Poultry Fresh TURKEY FRESH 3.76 kg 915425.5638 kgCO2e
World Wildlife Fund - UK & Food Climate and Research Network (2010)
RICE AND GRAINS RICE .59 kg 190698.6627 kg CO2
Carlsson-Kanyama A, González AD (2009).
RICE AND GRAINS RICE .21 kg 67875.79518 kg NO2
Carlsson-Kanyama A, González AD (2009).
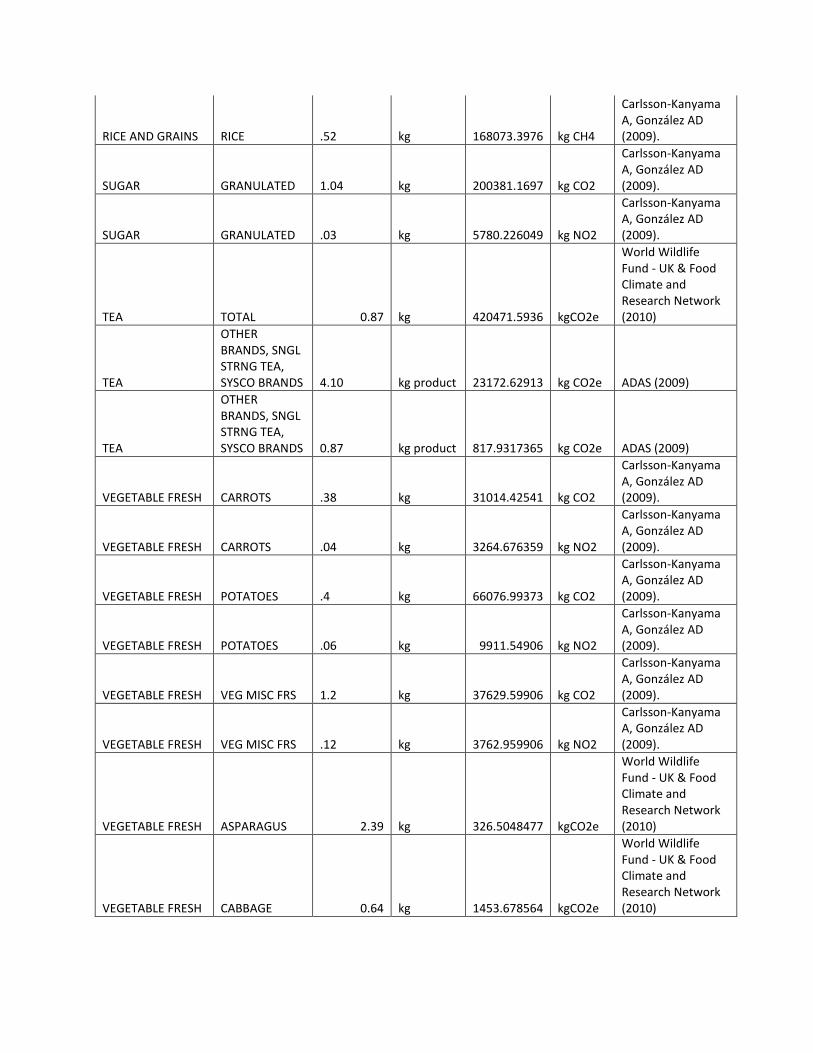
RICE AND GRAINS RICE .52 kg 168073.3976 kg CH4
Carlsson-Kanyama A, González AD (2009).
SUGAR GRANULATED 1.04 kg 200381.1697 kg CO2
Carlsson-Kanyama A, González AD (2009).
SUGAR GRANULATED .03 kg 5780.226049 kg NO2
Carlsson-Kanyama A, González AD (2009).
TEA TOTAL 0.87 kg 420471.5936 kgCO2e
World Wildlife Fund - UK & Food Climate and Research Network (2010)
TEA
OTHER BRANDS, SNGL STRNG TEA, SYSCO BRANDS 4.10 kg product 23172.62913 kg CO2e ADAS (2009)
TEA
OTHER BRANDS, SNGL STRNG TEA, SYSCO BRANDS 0.87 kg product 817.9317365 kg CO2e ADAS (2009)
VEGETABLE FRESH CARROTS .38 kg 31014.42541 kg CO2
Carlsson-Kanyama A, González AD (2009).
VEGETABLE FRESH CARROTS .04 kg 3264.676359 kg NO2
Carlsson-Kanyama A, González AD (2009).
VEGETABLE FRESH POTATOES .4 kg 66076.99373 kg CO2
Carlsson-Kanyama A, González AD (2009).
VEGETABLE FRESH POTATOES .06 kg 9911.54906 kg NO2
Carlsson-Kanyama A, González AD (2009).
VEGETABLE FRESH VEG MISC FRS 1.2 kg 37629.59906 kg CO2
Carlsson-Kanyama A, González AD (2009).
VEGETABLE FRESH VEG MISC FRS .12 kg 3762.959906 kg NO2
Carlsson-Kanyama A, González AD (2009).
VEGETABLE FRESH ASPARAGUS 2.39 kg 326.5048477 kgCO2e
World Wildlife Fund - UK & Food Climate and Research Network (2010)
VEGETABLE FRESH CABBAGE 0.64 kg 1453.678564 kgCO2e
World Wildlife Fund - UK & Food Climate and Research Network (2010)
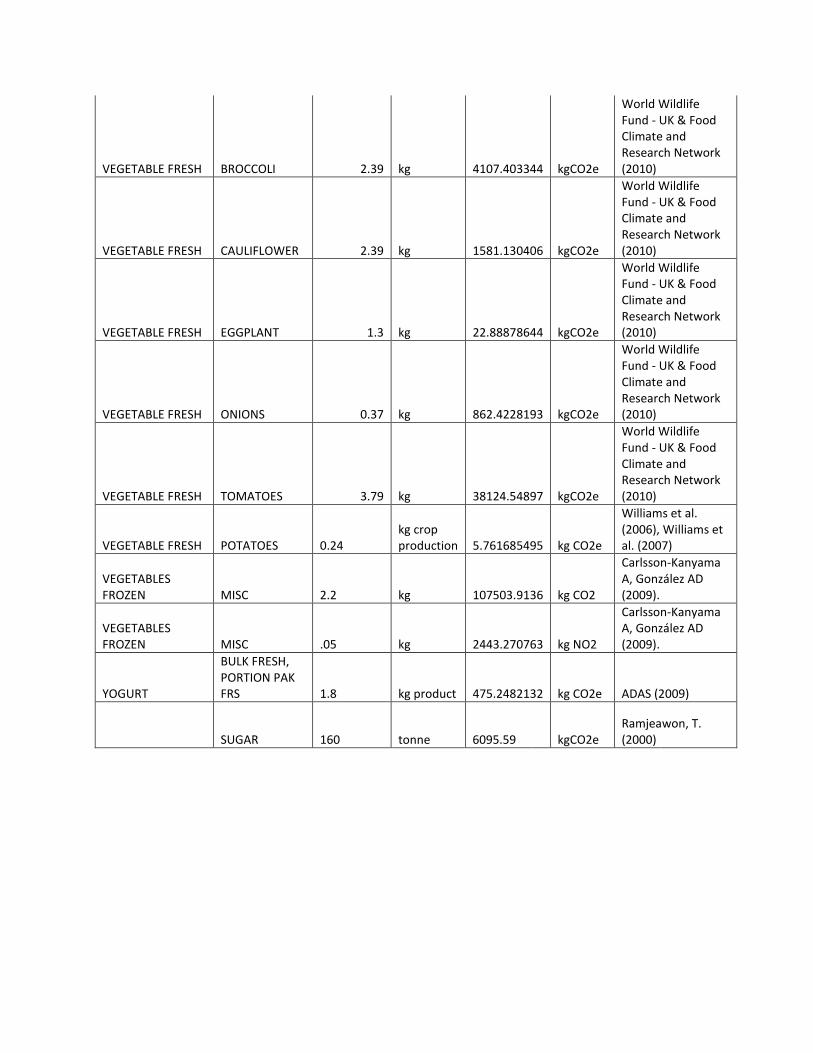
VEGETABLE FRESH BROCCOLI 2.39 kg 4107.403344 kgCO2e
World Wildlife Fund - UK & Food Climate and Research Network (2010)
VEGETABLE FRESH CAULIFLOWER 2.39 kg 1581.130406 kgCO2e
World Wildlife Fund - UK & Food Climate and Research Network (2010)
VEGETABLE FRESH EGGPLANT 1.3 kg 22.88878644 kgCO2e
World Wildlife Fund - UK & Food Climate and Research Network (2010)
VEGETABLE FRESH ONIONS 0.37 kg 862.4228193 kgCO2e
World Wildlife Fund - UK & Food Climate and Research Network (2010)
VEGETABLE FRESH TOMATOES 3.79 kg 38124.54897 kgCO2e
World Wildlife Fund - UK & Food Climate and Research Network (2010)
VEGETABLE FRESH POTATOES 0.24 kg crop production 5.761685495 kg CO2e
Williams et al. (2006), Williams et al. (2007)
VEGETABLES FROZEN MISC 2.2 kg 107503.9136 kg CO2
Carlsson-Kanyama A, González AD (2009).
VEGETABLES FROZEN MISC .05 kg 2443.270763 kg NO2
Carlsson-Kanyama A, González AD (2009).
YOGURT
BULK FRESH, PORTION PAK FRS 1.8 kg product 475.2482132 kg CO2e ADAS (2009)
SUGAR 160 tonne 6095.59 kgCO2e Ramjeawon, T. (2000)