donation experience
TRANSCRIPT

THINK Digital Forum 2011-12 4 of 4 July 2012 by Jason Potts, Director

Agenda
Start (10.00)
1. Introductions, Forum purpose reminder, next intake
2. Updates: Best ever donation form and mobile
3. Benchmarking results
Lunch (1.00-2.00)
4. Case studies
5. See you next year
Finish (4ish)

• To work with a group of non-profits who aspire to be leaders in their usage of digital technologies ...
• To learn from each other, to share without fear ...
• To make our various and diverse organisations fit for purpose in the digital age ...
• To form working groups, commission research or technology to help us succeed
Purpose ...

• Each other
• Other THINKers
• Guest speakers
• Wiki
• Research
• Technology
Resources ...

http://think-digital-forum.wikispaces.com/

• Last one of this intake
• Topics so far ... – Social media
– Mobile
– Usability/testing
– Recruitment
– Trends
– Crowdfundraising
– Video
• Most currently confirmed for next year
• If you could let me know end of the month
• New blood, some people asked to join

Agenda
Start (10.00)
1. Introductions, Forum purpose reminder, next intake
2. Updates: Best ever donation form and mobile
3. Benchmarking results
Lunch (1.00-2.00)
4. Case studies
5. See you next year
Finish (4ish)


A test
807 Visits 5.3% Conversion 69% Single gifts 31% Paypal single gifts 0% Regular gifts

B test
807 visits 6.1% Conversion 38% Single gifts 16% Paypal single gifts 46% Regular gifts

A test Cash value Yr 1= X
DD value Yr 1= Y
Total value over 5 yrs = Z
B test Cash value Yr 1 = + 40%
DD value Yr 1 = + 100%
Total value over 5 yrs = + 550%
WARNING: Still need more volume to be statistically significant and donation
values approximate averages


First results
• The average amount showed an uplift of 17% for
the new donation form:
»Standard form: £49.72
»New form: £58.34
• With an open field more people donated a
smaller amount
• A round number to the free-entry of the standard page

First results
• The standard page had a peak at 10 • The new page had a spike at 25

First results
• The increase mainly came from more
donations at the £100-£300 level

Challenges
• Google analytics tracking
• CSM issues affecting the analysis
• Inflexibility of the credit card payment gateway
service (redesign and test of Sagepay forms)
• Involving key stakeholders
... and it was Christmas


Mobile update


• mobile web - traffic growth
April
2010 April
2011 April
2012
Projected –
April 2013
15%
£
25%
£

• 9% more PayPal donations on mobile
• Av PayPal donation £1 less on mobile
• Av CC donation £3 less on mobile
Mobile Web – payment method trends

• More payments, using mobile to replace till
PayPal in store

• Touch 2 pay • Barclaycard PayTag
Forecast to be worth
$75 Billion per year
by 2015
Isis – a
collaboration
between Verizon,
AT&T + T- mobile
Vodafone & Visa
partnering with
PayWave

• iZettle receipt

• http://www.spring-giving.org.uk/2011/10/mobile-giving-through-justgiving/
• http://www.slideshare.net/JustGiving/the-mobile-donation-revolution
• http://www.slideshare.net/jwaddingham/the-future-of-facebook-fundraising-iof-national-convention-2012
More information:

Agenda
Start (10.00)
1. Introductions, Forum purpose reminder, updates
2. Updates: Best ever donation form/mobile
3. Benchmarking results
4. Lunch (1.00-2.00)
5. Case studies
6. Next years Forum
Finish (4ish)
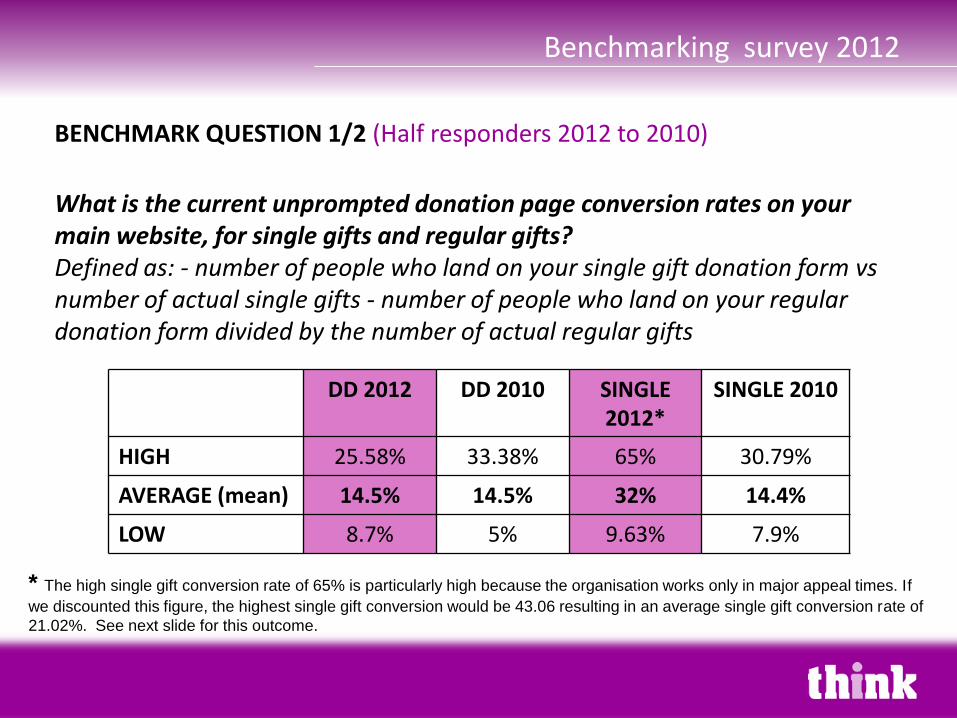
Benchmarking survey 2012
BENCHMARK QUESTION 1/2 (Half responders 2012 to 2010)
What is the current unprompted donation page conversion rates on your main website, for single gifts and regular gifts? Defined as: - number of people who land on your single gift donation form vs number of actual single gifts - number of people who land on your regular donation form divided by the number of actual regular gifts
DD 2012 DD 2010 SINGLE 2012*
SINGLE 2010
HIGH 25.58% 33.38% 65% 30.79%
AVERAGE (mean) 14.5% 14.5% 32% 14.4%
LOW 8.7% 5% 9.63% 7.9%
* The high single gift conversion rate of 65% is particularly high because the organisation works only in major appeal times. If
we discounted this figure, the highest single gift conversion would be 43.06 resulting in an average single gift conversion rate of
21.02%. See next slide for this outcome.

Benchmarking survey 2012
BENCHMARK QUESTION 3 (Half responders 2012 to 2010)
What is your current conversion rate for warm email? Defined as: - number of fundraising specific emails sent to a warm list vs number of donations received and value of donations. This can be for one campaign or an average across all campaigns this year.
2012 2010 Average donation value (2012)
HIGH 25% 1.12% £67
AVERAGE (mean) 12.59% 0.54% £64.75
LOW 0.18% 0.23% £62.5

Benchmarking survey 2012
BENCHMARK QUESTION 4 (Half responders 2012 to 2010)
What is your current conversion rate for Ad words? Defined as: - number of fundraising specific ad word clicks vs number of donations and value of donations. This can be for one campaign or an average across all fundraising ad words delivered this year.
2012 2010 Average donation value (2012)
HIGH 5.4% 3.2% £74
AVERAGE (mean) 2.75% 2.3% £54.26
LOW 1.1% 0.83% £34.53

YouTube TrueView

• Integrates YouTube advertising with Google AdWords
• Incredible opportunity for NPOs to leverage the scale of Google/YouTube
• Niche targeting available
• Retarget video ads
• Pay as you go and scale your costs
YouTube TrueView

YouTube TrueView

Benchmarking survey 2012
BENCHMARK QUESTION 6 (1 responder)
What is your current conversion rate for Remarketing? Defined as: - number of fundraising specific remarketing banners vs number of donations and value of donations. This can be for one campaign or an average across all remarketing banners delivered this year
2012 2010 Average donation value (2012)
HIGH 2.13% 4% £30.28
AVERAGE (mean) 2.13% 3.2% £30.28
LOW 2.13% 2.8% £30.28

Remarketing

How Can We Use Retargeting?
• Custom ads served only to those who saw a specific initiative
– “Sonia is still malnourished and you can help today”
– “We’re 95% to our fundraising goal for project X”
NO
YES

Benchmarking survey 2012
BENCHMARK QUESTION 5 (1 responder)
What is your current conversion rate for affiliates? Defined as: - number of fundraising affiliate banner clicks clicks vs number of donations and value of donations. This can be for one campaign or an average across all fundraising affiliate banners delivered this year
2012 2010 Average donation value (2012)
HIGH 0.51% 2.4% n/a
AVERAGE (mean) 0.51% 2.35% n/a
LOW 0.51% 2.3% n/a

Additional data
IoF and Give as you Live have released some interesting stats from a recent digital giving review...

Digital Giving Review
Give as you Live and the Institute of
Fundraising launched the Digital Giving
Review 2012 to uncover the latest
trends in digital fundraising.
Over 500 charities took part in the
survey.
http://www.giveasyoulive.com/survey
Check out the ‘“Pay with Twitter or
Facebook”’ download button.
Give as you Live Digital Giving Review 2012

Charity audiences
Online audiences combined now account for 51% of overall charity audience. The largest of the online segments is Facebook, accounting for 55% of the total online charity audience. Facebook and Twitter audiences combined have grown to equal 35% of the overall charity audience (in less than a decade).
Give as you Live Digital Giving Review 2012

Donation channels
Online donations generate 30% of the overall donations received; yet the online audience accounts for 51% of the total charity audience. Of this 30%, online donation platforms make up the majority of this income at 90%, with email accounting for 7%, Facebook 3%, and notably 0% of donations received from Twitter across all charities.
Give as you Live Digital Giving Review 2012

Frequency of communications
Charities are communicating with their online audience more frequently than their offline audience.
Give as you Live Digital Giving Review 2012

Barriers to successful online fundraising
‘Internal resources’ is sited as the main barrier to successful online fundraising – followed by ‘Donor Resistance’ .
Give as you Live Digital Giving Review 2012

Interesting titbits from #iofnc
“90% of online giving not generated by charities' online programmes but by supporters' own initiative”
Discuss....

Interesting titbits from #iofnc
• Nearly 1/4 of the funding coming via JustGiving website is Facebook referrals (£22m)
• 120% increase since last year


Agenda
Start (10.00)
1. Introductions, Forum purpose reminder, next intake
2. Updates: Best ever donation form and mobile
3. Benchmarking results
Lunch (1.00-2.00)
4. Case studies
5. See you next year
Finish (4ish)

Agenda
Start (10.00)
1. Introductions, Forum purpose reminder, next intake
2. Updates: Best ever donation form and mobile
3. Benchmarking results
Lunch (1.00-2.00)
4. Case studies
5. See you next year
Finish (4ish)

CDA – What would a cure mean to you? Review meeting April 2012
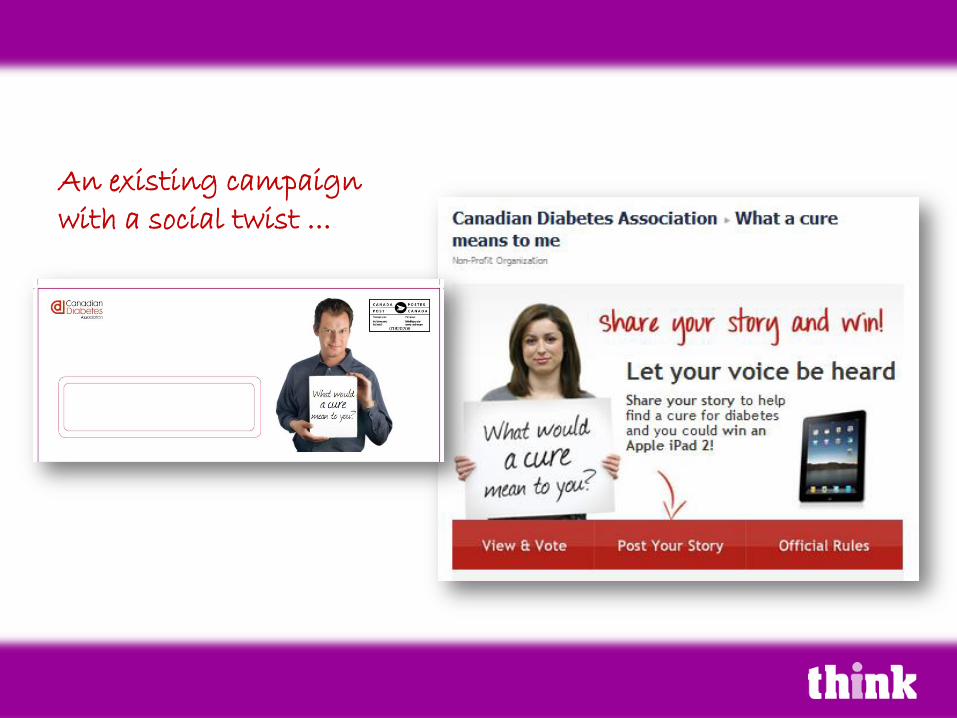
An existing campaign with a social twist ...

Number of people who entered
381
Insert copy from story

Number of people who voted
9,404* Number of people who posted something
10,000 Number of posts
54,656
* 8,188 of these were Canadian, Cities 1. St John’s 2. Toronto 3. Charlottetown 4. Ottawa 5. Montreal

Biggest group
25-44 female
75% female

Number of new likes during the campaign
3,119 Number of new email addresses
3,260 (31% opt-in) Number of people who were exposed to the campaign
Circa 1 million*
* Approx. 1m people reached = 15.4m ad impressions + 5.8m app
impressions divided by 15 (FB stat of how many times people viewed an ad)

Total number of clicks
65,000 Total number of impressions from the app
5.8 million
First
Viral
effect
Second
Winner

21% talking about
as % of likes
76,865 likes, 2,613 talking about
them on March 3rd, Age is 45-54
22nd Feb
3% talking about
as % of likes
26,329 likes, 2,080 talking about
them Daffodil month, Age is 18-34
7% talking about
as % of likes

Key learnings: No clear winner across all demographics but broadly 1. Find a cure 2. Sara 3. ipad

Survey (10% posters) 53% type 1 19% type 2 56% of contributors were driven by the FB ads 64% said reason for participating was to advocate or build awareness of diabetes (opportunity to feel heard about their disease) 97% said easy to download and use application 80% easy to post 82% said experience good, very good or excellent 79% would do it again (88% of these said they would be willing to fundraise)

Survey (1.5% voters) 52% came through a friend or family member 57% said reason for participating was to advocate or build awareness of diabetes 95% said easy to download and use application 97% easy to vote 97% said experience good, very good or excellent 93% would do it again (68% of these said they would be willing to fundraise)

Open rates (overall)
23.5% What a cure and ipad open rates the same Winner announcement
44% posters
20% voters

$40,000 1 million people = 4 cents per exposure

Learning
• 30% uplift in DM appeal
• Could have been bigger, tech issues and many people posted to the Wall
• Better tracking for donations
• Making it a real conversation, in real time
• More resources
• Prizes for creativity
• Seeding 2 weeks before

What next
• Make app mobile responsive
• Make video easier
• Engage in events based fundraising, peer to peer pages, fundraise for the cure
• 2013 matched giving company, every post = a dollar, so would have raised approx $60,000 in 2012, person shares most wins
• 2014 link to fundraising, so person raised most money wins

Video

U N I C E F T A P P R O J E C T
H T T P : / / Y O U T U . B E / C V R 0 4 8 7 R L T 8

C H A R I T Y W A T E R “ T H A N K Y O U ” C A M P A I G N
H T T P : / / W W W . Y O U T U B E . C O M / C H A R I T Y W A T E R T H A N K S

W I N N I P E G H U M A N E S O C I E T Y
H T T P : / / Y O U T U . B E / K 4 F V S S E J I 4 Q

C Y S T I C F I B R O S I S F O U N D A T I O N
H T T P : / / Y O U T U . B E / E S C F I J N - Z 1 E

D O C T O R S W I T H O U T B O R D E R S
H T T P : / / Y O U T U . B E / T M 9 D 3 M A T G K W


From 6 to 76% increase in traditional media coverage of UNICEF and Sahel now
OBSERVATION 4: REVERSE INTEGRATION

Crowds types
.Project
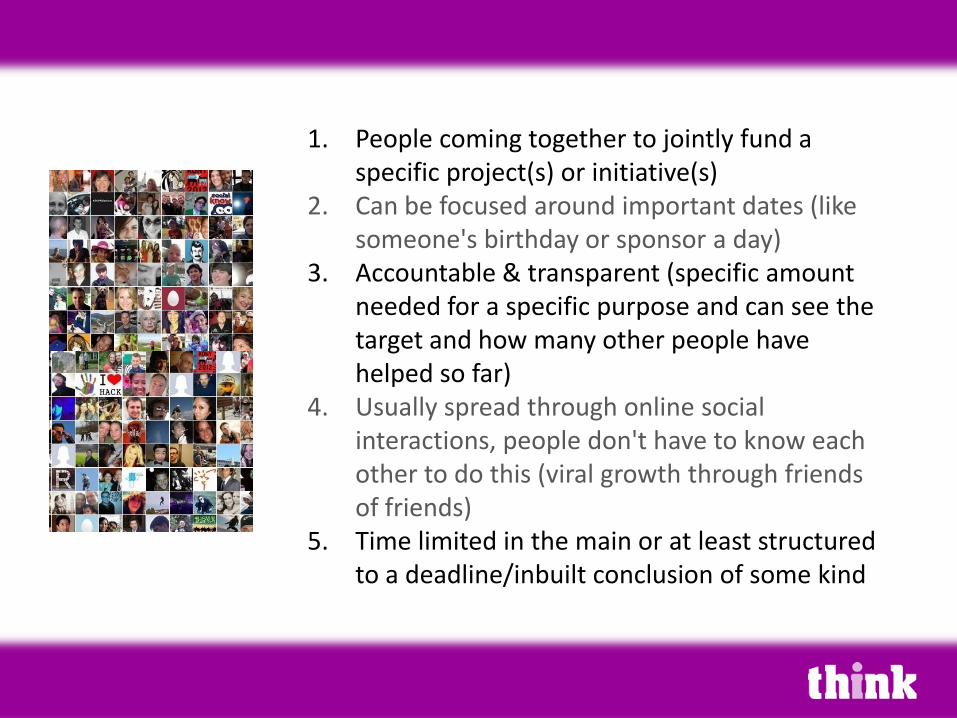
1. People coming together to jointly fund a specific project(s) or initiative(s)
2. Can be focused around important dates (like someone's birthday or sponsor a day)
3. Accountable & transparent (specific amount needed for a specific purpose and can see the target and how many other people have helped so far)
4. Usually spread through online social interactions, people don't have to know each other to do this (viral growth through friends of friends)
5. Time limited in the main or at least structured to a deadline/inbuilt conclusion of some kind

ORG

.ORG


Why is it important?

9
$1.6
Billion $6.2
Billion
2009 2013
http://tinyurl.com/cff56nz - eConsultancy report

Raised a million whilst
in Beta
Roughly 2/3rds of people who donated are new to the
charity

It comes in many shapes and sizes?

1. MICROFINANCE LENDING - http://vimeo.com/28413747

2. BUY THE PARTS TO BUILD THE WHOLE

3. CHOOSE A DAY

4. BRINGING REAL PROJECTS TO LIFE

Case Study
5. CROWDFUNDING LIVE & EXCLUSIVE

6. INSPIRED BY AN INDIVIDUAL

7. THE CROWD IS THE POINT

8. DON’T HIT TARGET, DON’T GET THE MONEY

9. DOESN’T HAVE TO BE FUNDRAISING FIRST

10. INVOLVING THE CROWD (NOT JUST MONEY)

Future Trends The Living Report

Agenda
Start (10.00)
1. Introductions, Forum purpose reminder, next intake
2. Updates: Best ever donation form and mobile
3. Benchmarking results
Lunch (1.00-2.00)
4. Case studies
5. See you next year
Finish (4ish)