don’t be puzzled by glaucoma – the comprehensive ... · borderline p < 0.05 ... ght: outside...
TRANSCRIPT

Don’t be Puzzled by Glaucoma – The Comprehensive Solution for Your Practice

Glaucoma is one of the leading causes of blindness. Early glaucoma detection and reliable progression analysis may prevent loss of vision. A serious management of glaucoma is the basis of an individualized therapy and excellent patient care.
The detection and monitoring of glaucoma require a targeted combination of clinical observations and reliable examination results. Clinical expertise is always the key to a accurate glaucoma diagnosis.
Structural and functional examinations from Heidelberg Engineering provide invaluable information to aide in the diagnosis and treatment of glaucoma.
Advanced glaucoma diagnosis demands advanced technology. A complete picture of glaucoma develops only if the diagnostic information fits together like the pieces of a puzzle.
We provide serious diagnostic power for glaucoma!Comprehensive glaucoma solutions from Heidelberg Engineering.
All Pieces of the Puzzle
The Complete Picture of Glaucoma Diagnosis
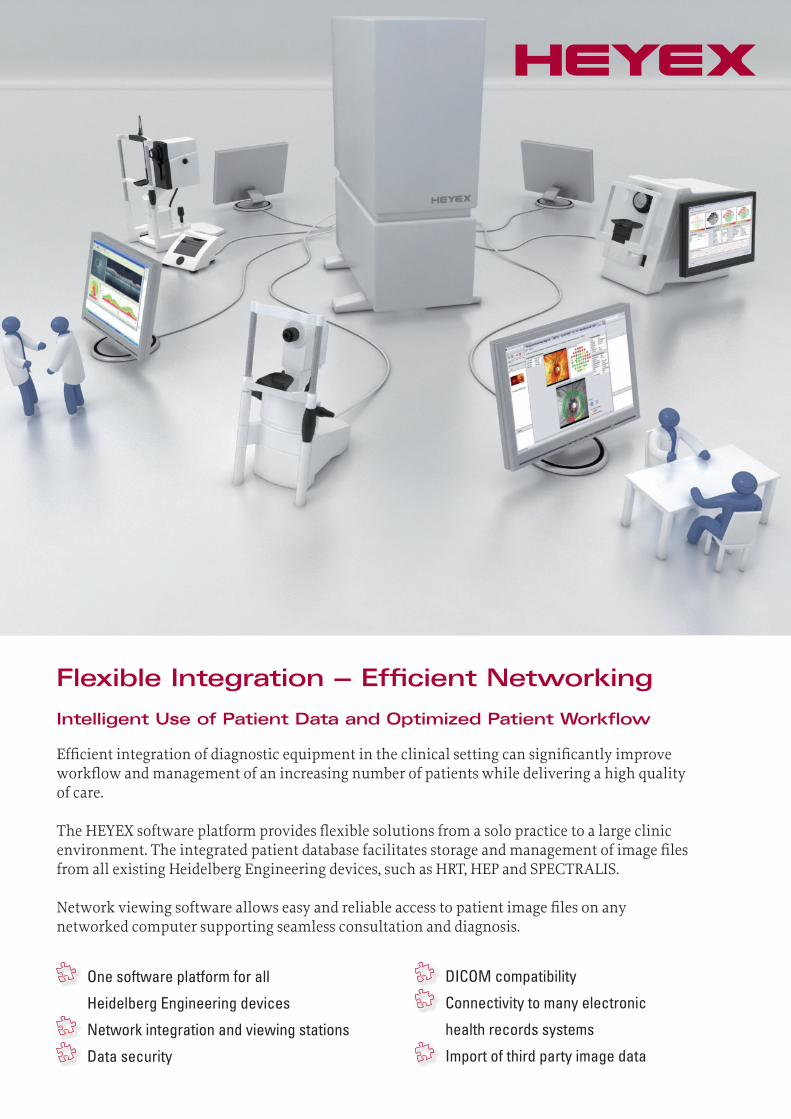
Flexible Integration – Effi cient Networking
Intelligent Use of Patient Data and Optimized Patient Workfl ow
Effi cient integration of diagnostic equipment in the clinical setting can signifi cantly improve workfl ow and management of an increasing number of patients while delivering a high quality of care.
The HEYEX software platform provides fl exible solutions from a solo practice to a large clinic environment. The integrated patient database facilitates storage and management of image fi les from all existing Heidelberg Engineering devices, such as HRT, HEP and SPECTRALIS.
Network viewing software allows easy and reliable access to patient image fi les on any networked computer supporting seamless consultation and diagnosis.
One software platform for all
Heidelberg Engineering devices
Network integration and viewing stations
Data security
DICOM compatibility
Connectivity to many electronic
health records systems
Import of third party image data

Validated DiagnosticsThe excellent diagnostic performance of the Heidelberg Retina Tomograph (HRT) is well established. The HRT has been used worldwide over 20 years for the detection and management of glaucoma. Advanced algorithms like the Moorfi elds Regression Analysis (MRA) and the Glaucoma Probability Score (GPS) allow an objective assessment of morphometric glaucomatous changes. Objective structural parameters complement the 3D topographic profi le of the optic nerve head and facilitate a comprehensive risk assessment of suspect glaucoma patients.
All relevant anatomic structures at a glance – optic nerve head (ONH) excavation, neuroretinal rim and peripapillary retinal nerve fi ber layer
Weinreb 2010: Baseline GPS, MRA, and stereoparameters alone or when combined with baseline clinical and demographic factors can be used to predict the development of POAG end points in OHTS (Ocular Hypertensive Treatment Study) participants and are as effective as stereo photographs for estimating the risk of developing POAG in ocular hypertensive subjects1
Zangwill 2005: HRT MRA is the top predictive factor for glaucoma and can identify those patients at high risk for developing the disease2
Strouthidis 2010: In clinical practice, patients with both an abnormal MRA and an abnormal GPS classifi cation at presentation should be followed closely as they have an increased risk of future visual fi eld or HRT change3
Weinreb 2010: Baseline GPS, MRA,
Strouthidis 2010: In clinical practice, Strouthidis 2010: In clinical practice,
1 Weinreb RN et al; Ophthamol 2010; 117:1674–1683. 2 Zangwill LM. et al.; Arch Ophthalmol 2005;123:1188-1197.3 Strouthidis NG et al.; Glaucoma 2010; 19(5):304-309.
Zangwill 2005: HRT MRA is the top
Examination Report – HRT Moorfi elds Regression Analysis
Heidelberg Retina TomographOU Report
Software Version: 3.2/0www.HeidelbergEngineering.com
Patient: Glaucoma, Outside DOB: 14.Dez.1951 Examination: 24.Sep.2003Pat-ID: Caucasian Gender: male Ethnicity: (Caucasian)
OD OSInitial ReportQuality: Excellent (SD 8 µm)
Focus: -1.00 dpt Operator: dcp
Quality: Excellent (SD 9 µm)Focus: -1.00 dpt Operator: dcp
CUPDisc Size: 2.13 mm² (average) Disc Size: 2.55 mm² (average)
Linear Cup/Disc Ratio [ ]0.76 ❢❢❢❢❢❢❢❢
p = 0.03
Asymmetry0.00
✔✔✔✔✔✔✔✔
p = 0.4
0.76 ✔✔✔✔✔✔✔✔
p = 0.06
Cup Shape Measure [ ]-0.06 ❢❢❢❢❢❢❢❢
p = 0.02
Asymmetry0.00
✔✔✔✔✔✔✔✔
p = 0.45
-0.06 ❢❢❢❢❢❢❢❢
p = 0.04
RIM
MRA: Outside normal limits MRA: Outside normal limits
✔✔✔✔
❢❢❢❢
✖✖✖✖
✖✖✖✖
✖✖✖✖
✖✖✖✖
✔✔✔✔
❢❢❢❢
✖✖✖✖
✖✖✖✖
✖✖✖✖
✖✖✖✖
✖✖✖✖✖✖✖✖ ✔✔✔✔
❢❢❢❢
✖✖✖✖
✖✖✖✖
✖✖✖✖
❢❢❢❢
✔✔✔✔
❢❢❢❢
✖✖✖✖
✖✖✖✖
✖✖✖✖
❢❢❢❢
✖✖✖✖✖✖✖✖
Rim Area [mm²]0.91 ✖✖✖✖✖✖✖✖
p < 0.001
Asymmetry-0.17
✔✔✔✔✔✔✔✔
p = 0.24
1.08 ✖✖✖✖✖✖✖✖
p < 0.001
Rim Volume [mm³]0.16 ✖✖✖✖✖✖✖✖
p < 0.001
Asymmetry-0.09
✔✔✔✔✔✔✔✔
p = 0.16
0.25 ❢❢❢❢❢❢❢❢
p = 0.02
RNFL
0.8
0.6
0.4
0.2
0.0
-0.2
-0.4
36031527022518013590450
T TS NS N NI TI T
RNFL Profile0.8
0.6
0.4
0.2
0.0
-0.2
-0.4
36031527022518013590450
T TS NS N NI TI T
RNFL Profile
Height Variation Contour [mm]0.28 ✔✔✔✔✔✔✔✔
p = 0.16
Asymmetry-0.13
❢❢❢❢❢❢❢❢
p = 0.02
0.41 ✔✔✔✔✔✔✔✔
p > 0.5
Mean RNFL Thickness [mm]0.20 ✔✔✔✔✔✔✔✔
p = 0.28
Asymmetry-0.05
✔✔✔✔✔✔✔✔
p = 0.12
0.25 ✔✔✔✔✔✔✔✔
p > 0.5
Inter-Eye Asymmetry 13 %
0.8
0.6
0.4
0.2
0.0
-0.2
-0.4
36031527022518013590450
T TS NS N NI TI T
Combined RNFL Profile
✔✔✔✔✔✔✔✔ Within normal limits p > 0.05
❢❢❢❢❢❢❢❢ Borderline p < 0.05
✖✖✖✖✖✖✖✖ Outside normal limits p < 0.001
OD RNFL profileOS RNFL profileRNFL profile median
Comments:
Signature:Date: 29.10.2010

Early Detection and Reliable Progression AnalysisThe Topographic Change Analysis (TCA) of the HRT is the best known and most evidence-based method for glaucoma management4. The Gold Standard for objective comprehensive structural analysis of the ONH is the key to an individualized approach to glaucoma diagnosis and treatment.
ONH and retinal nerve fi ber layer change at a glance
Early detection of subtle glaucomatous changes i.e. disease progression
Trend analysis – Volume and area changes indicated
Contour-line and reference plane independent
Follow-up examinations and single scans automatically aligned
ONH and retinal nerve fi ber
Early detection of subtle Early detection of subtle
Trend analysis – Volume and Trend analysis – Volume and
Contour-line and reference
Follow-up examinations and Follow-up examinations and
4 Chauhan BC. et al.; Invest Ophthalmol Vis Sci 2000; 41:775-782.
Examination Report – HRT Topographic Change Analysis
Heidelberg Retina TomographTCA Overview
Software Version: 3.2/140Page 1/1
Patient:
Examination:
Glaucoma, Progression
Sex: female DOB: 20.Mai.1964 Pat-ID: TCA Ethnicity: (Caucasian)
Baseline: 17.Jul.2000 Last Follow-Up: 03.Jul.2003 Elapsed: 35 months OS
Baseline: 17.Jul.2000Examination Date
01/01 01/02 01/03 01/04 01/05 01/06 01/07 01/08 01/09 01/10
Total Size Change Total Volume Change
[mm
²]
2.0
1.5
1.0
0.5
0.0
[1/1000 mm
³]
100
75
50
25
0
Follow-Up: #2, 10.Dez.2001 Follow-Up: #3, 22.Aug.2002 Follow-Up: #4, 22.Aug.2002
Follow-Up: #5, 03.Jul.2003

One Perimeter – Two Methods The visual fi eld examination remains an essential part of glaucoma diagnosis and management, despite rapid developments in imaging technologies5. Heidelberg Engineering complements the Gold Standard of structural glaucoma diagnosis, the Heidelberg Retina Tomograph (HRT) with an innovative and reliable partner, the Heidelberg Edge Perimeter (HEP). The HEP offers two perimetric methods in one device.
Flicker-Defi ned-Form (FDF) Perimetry for early glaucoma detection in patients at risk and ocular hypertensive patients
The Gold Standard, White-on-White Perimetry (SAP) for continuous care of patients with manifest glaucoma
Unique Legacy Scale for a direct comparison with HFA examination results
The Gold Standard, White-
5 Terminology and Guidelines for Glaucoma. 3rd Edition (2008). European Glaucoma Society.
Examination Report – HEP – FDF 24-2 ASTA Standard – OU Report
Heidelberg Edge PerimeterOU ReportPatient: HEP, FDFPat-ID:
DOB: 01-01-1962 (46)Gender: HEP, F OU
OD OSStimulus: FDF FDFPattern: 24-2 24-2Strategy: ASTA Standard ASTA StandardTest Date: 26-11-2008 26-11-2008Test Time: 4:41 PM 4:48 PMPresentations: 317 305Pupil Diameter:Target Size: 5.0 5.0Refr. Error: +0.00 +0.00Cylinder: +0.00 +0 +0.00 +0IOP: 0 0Corr. Lens: unknown unknown
OD OSDuration: 05:13 04:59FP Count: 0 / 317 (0%) 0 / 305 (0%) FN Count: 0 / 3 (0%) 0 / 5 (0%) Fixation Losses: 5 / 317 (1%) 7 / 305 (2%)
MD: -4.48 dB -3.47 dBPSD: +4.22 dB +5.31 dBGHT: Outside Normal Limits Outside Normal Limits
OD OSSensitivity (legacy dB)
2124
2828
21 25
21
2428
28
17 20 18
14 111717
232321
332828 28 31 30
27 25 31 27
13
24
30
27
25
28
24
3018
20
3431
30
31 28
27
27
28
31
31
21
20
24
30 302424
2827
24 28
30
2428
24
23 28 21
14 20148
23204
313130 31 31 27
28 28 25 28
23
28
25
28
30
27
7
21 23
23
2731
24
31 31
30
24
23
33
24
28
31
30
30 30
Grayscale
30 30 30 30
0 dB5
101520253035
---
----
--
--- - - -- - - -
-
--
--
--
---
- --
----
---
----
--
--- - - -- - - -
-
--
--
--
---
- --
----
Total Deviation
Pattern Deviation
----
- --
---
- - --
-
--- - - -- - - -
--
--
--- -
---
-- -
-
-
-
----
---
- --
---
- - --
-
--- - - -- - - -
--
--
--
--
---
- --
-
-
----
p < 5%
p < 2%
p < 1%
p < 0.5%
Comments:
Signature:Reliability Parameter Graph
0 1 2 3 4 5 6 min
FP
FN
FL
ODOS
Software Version: 2, 1, 0, 0 Normal DB Version: 2010-03-17 21:52:51.89
Unique Legacy Scale for a

Structure and FunctionThe structural analysis of the ONH and the functional assessment of the visual fi eld form two pillars of a comprehensive glaucoma diagnosis. Based on the correlation between topographic classifi cation of ONH sectors and visual fi eld regions described by Garway-Heath et al.6, special algorithms have been developed to directly link structural and functional data with each other and to display them in a single examination report.
All relevant information on one printout
First real correlation of structural and functional examination results
Reliable clinical diagnosis
Improved patient and time management
All relevant information
First real correlation of
Reliable clinical diagnosisReliable clinical diagnosis
Improved patient and time Improved patient and time
Examination Report – HRT & HEP – Unique Structure-Function Map
6 Garway-Heath DF. et al.; Ophthalmology 2000;107:1809–1815.
HRT + HEPOU Report
Software Version: HRT: 3.2/6133 HEP: 2.1.0.63 HEP NDB Version: 2010-03-17 21:52:51.89
Patient:
Examination:
HRT, HEPSex: female DOB: 01.01.1926 Pat-ID: --- Ethnicity: (Caucasian)
HRT Date: 22.04.2009HEP(OD) Date: 30.04.2009HEP(OS) Date: 30.04.2009
OD OS
MRA: Borderline MRA: Outside normal limits
Disc Size: 2.71 mm² (large)
✔✔✔✔
✔✔✔✔
❢❢❢❢
❢❢❢❢
✔✔✔✔
❢❢❢❢
✔✔✔✔
✔✔✔✔
❢❢❢❢
❢❢❢❢
✔✔✔✔
❢❢❢❢
❢❢❢❢❢❢❢❢
Disc Size: 2.30 mm² (average)
✔✔✔✔
✔✔✔✔
✔✔✔✔
✔✔✔✔
✔✔✔✔
✖✖✖✖
✔✔✔✔
✔✔✔✔
✔✔✔✔
✔✔✔✔
✔✔✔✔
✖✖✖✖
✔✔✔✔✔✔✔✔
Linear Cup/Disc Ratio✔✔✔✔✔✔✔✔ 0.67 p = 0.24 ✔✔✔✔✔✔✔✔ 0.57 p = 0.42
Cup Shape Measure✔✔✔✔✔✔✔✔ -0.13 p > 0.5 ✔✔✔✔✔✔✔✔-0.23 p > 0.5
Rim Area [mm²]❢❢❢❢❢❢❢❢ 1.48 p = 0.04 ✔✔✔✔✔✔✔✔ 1.56 p > 0.5
Rim Volume [mm³]✔✔✔✔✔✔✔✔ 0.31 p = 0.14 ✔✔✔✔✔✔✔✔ 0.38 p > 0.5
Height Variation Contour [mm]✔✔✔✔✔✔✔✔ 0.40 p > 0.5 ✔✔✔✔✔✔✔✔ 0.55 p > 0.5
Mean RNFL Thickness [mm]✔✔✔✔✔✔✔✔ 0.21 p > 0.5 ✔✔✔✔✔✔✔✔ 0.22 p > 0.5
✔✔✔✔✔✔✔✔ Within normal limits
❢❢❢❢❢❢❢❢ Borderline
✖✖✖✖✖✖✖✖ Outside normal limits
Pattern Deviation
GHT: Outside normal limits
Pattern Deviation
GHT: Outside normal limits
Test:24-2 24-2
Strategy:ASTA Standard ASTA Standard
FP Count:3 3
FN Count:3/3 (100.0%) 3/7 (42.9%)
Fixation Losses:3 (0.7%) 0 (0.0%)
MD:-7.24 dB p<0.05% -6.50 dB p<1%
PSD:+5.66 dB p<0.05% +4.86 dB
p > 5% p < 5% p < 2% p < 1% p < 0.5%
HEP
HRT
Within normal limitsBorderlineOutside normal limits
Comments:
Date: 05.11.2010 Signature:

PrecisionThe SPECTRALIS enables the precise measurement of the nerve fi ber layer thickness around the optic nerve head. Comparing the measurement to a normative database allows a fast and reliable detection of local nerve fi ber defects. The examination results are comprehensively documentedand summarized.
Precise measurement of retinal nerve fi ber layer thickness
Evaluation of more than 1,500 data points on a single circle scan around the optic nerve head
Automatic comparison to an age-adjusted normativedatabase to classify a patient as being within or outside normal limits
High sensitivity and specifi city with TruTrackTM Active Eye Tracking and Fovea-to-Disc (FoDiTM) alignment
High-quality fundus images even under challenging conditions (e.g. cataract)
Evaluation of more than 1,500 Evaluation of more than 1,500
High sensitivity and specifi city High sensitivity and specifi city
Automatic comparison to an
High-quality fundus images even High-quality fundus images even
Examination Report – RNFL Single Exam Report OU

ReproducibilityThe reliable detection of change is critical and defi nes glaucoma in suspect patients. With the SPECTRALIS changes in nerve fi ber layer and retinal thickness as small as 1 µm can be identifi ed.7,8 Structured reports enable a comprehensive documentation of change over time.
Reliable identifi cation of changes as small as 1µm
AutoRescanTM function for follow-up exams
Color-coding of local changes
Visualization of disease progression for easy interpretation
Comprehensive documentation of change over time
Fast localization of nerve fi ber layer changes
Reliable identifi cation of
AutoRescan
Color-coding of local
Visualization of disease
Comprehensive
7 Wolf-Schnurrbusch et al. Macular thickness measurements in healthy eyes using six different optical coherence tomography instruments. Invest Ophthalmol Vis Sci. 2009; 50:3432-3437.8 Wu et al. Reproducibility of retinal nerve fi ber layer thickness measure- ments using spectral domain optical coherence tomography. J Glaucoma. 2010 (Published online ahead of print).
Fast localization of nerve
Examination Report – RNFL progression

Innovative ConceptsThe Posterior Pole Asymmetry Analysis combines mapping of retinal thickness over the entireposterior pole with an innovative asymmetry analysis. The full geographic extend of nerve fi ber and ganglion cell layer defects can be visualized. The combination of nerve fi ber layer thickness and retinal thickness provides an even more robust parameter for glaucoma detection and monitoring of change over time.
Examination Report – RNFL & Asymmetry Analysis
Evaluation of nerve fi ber layer and retinal thickness in a single visit
Targeted combination of multiple parameters
High-resolution thickness maps with fi nely graded color scale
Asymmetry Analysis for early detection of glaucomatous abnormalities
Detailed reports

Excellent Image QualityAnterior Chamber Angle assessment is typically used in a comprehensive glaucoma diagnosis to identify Angle Closure Glaucoma. The SPECTRALIS Anterior Segment Module offers image acquisition of the Cornea and the Sclera. Moreover, both anterior chamber angles can be visualized in a single SD-OCT scan for an effi cient glaucoma diagnosis.
16 mm White-to-White SD-OCT scan
High-resolution images acquired with TruTrackTM Active Eye Tracking and Heidelberg Noise Reduction
Manual measurement tools for Anterior Chamber Angle assessment
16 mm White-to-White
High-resolution images
Manual measurement tools
Examination Report – Anterior Segment Module

Corporate Headquarters Heidelberg Engineering GmbH · Tiergartenstr. 15 · 69121 Heidelberg · Germany
phone +49-62 21-64 63 0 · fax +49-62 21-64 63 62 · www.HeidelbergEngineering.com 9918
5-00
1.E1
0 ©
Hei
delb
erg
Engi
neer
ing
Gm
bH