doosan corporation quarterly business review 3q 2014
TRANSCRIPT
Doosan Corporation Quarterly Business Review 3Q 2014
2014. 10. 30

Disclaimer
1
The following report has been made for informational purposes only and contains
preliminary data which may be materially different from final figures. Forecasts and
projections contained in this material are based on the current business environment
and management strategies and have been made in good faith. Certain data were
obtained from various external sources.
Doosan does not guarantee or take responsibility for the use of this report. The final decision and responsibility for actions rest solely with the reader.

Key Highlights
2
Recorded historic-high quarterly sales and OP(parent basis) in 3Q
1
Significant YoY and QoQ in-house OP growth achieved in 3Q thanks to solid performance of Electro-Materials and Industrial Vehicle
2
New growth and order momentum secured by acquiring and operating Fuel Cell as in-house business on Oct 1st
3
Continued shareholder friendly policy via dividends and share buyback
4
Table of Contents
I. 3Q Business Results
II. Divisional Business Results and Outlook
III. Fuel Cell Business Outlook
IV. Appendix
3

2분기 실적 (별도 기준)
• 3Q sales and OP grew remarkably on YoY and QoQ comparison
- In-house OP increased both YoY and QoQ to KRW 140bn due to strong earnings from Electro-Materials
supported by new product releases in front industry and solid performance of Industrial Vehicle
- Dividend income and others increased due to cash inflow from the disposal of KFC
* Dividend income, brand royalties and others
3Q Business Results (Parent)
4
’13. 3Q ’14. 2Q ’14. 3Q YoY QoQ
Sales 419 448 584 +39.5% +30.5%
OP
(%)
53
(12.6%)
21
(4.6%)
140
(24.0%)
+164.2%
(+11.4%P)
+582.9%
(+19.4%P)
▪ In-house 28 25 31 +12.0% +22.7%
▪ *Dividend income and others
26 -5 109 +328.2% -
(unit: KRW billion, %)
2분기 실적 (연결 기준)
’13. 3Q ’14. 2Q ’14. 3Q YoY QoQ
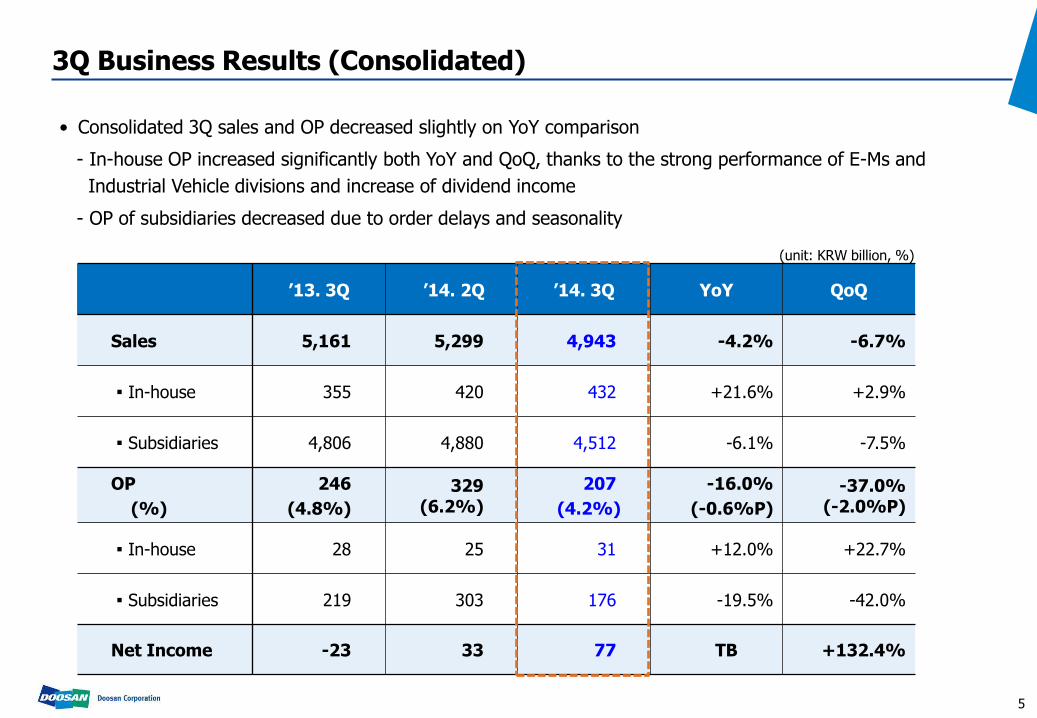
Sales 5,161 5,299 4,943 -4.2% -6.7%
▪ In-house 355 420 432 +21.6% +2.9%
▪ Subsidiaries 4,806 4,880 4,512 -6.1% -7.5%
OP
(%)
246
(4.8%)
329 (6.2%)
207
(4.2%)
-16.0%
(-0.6%P)
-37.0% (-2.0%P)
▪ In-house 28 25 31 +12.0% +22.7%
▪ Subsidiaries 219 303 176 -19.5% -42.0%
Net Income -23 33 77 TB +132.4%
3Q Business Results (Consolidated)
5
• Consolidated 3Q sales and OP decreased slightly on YoY comparison
- In-house OP increased significantly both YoY and QoQ, thanks to the strong performance of E-Ms and
Industrial Vehicle divisions and increase of dividend income
- OP of subsidiaries decreased due to order delays and seasonality
(unit: KRW billion, %)

6
I. 3Q Business Results
II.Divisional Business Results and Outlook
III. Fuel Cell Business Outlook
IV. Appendix
Table of Contents

2분기 실적 (별도 기준) Electro-Materials – 3Q Results (Parent)
3Q Results
• Lowered raw material costs such as copper foil/film
• Diversified sourcing from Chinese companies
• Cost innovation through product simplification and
enhanced production efficiency
• Market expansion in China and Vietnam
• Sales from the new Coverlay business, which is part of
our efforts to provide full line-up for FPC materials
• Expanded sales to global SET makers with additional
applications (Package CCL)
• Stabilized profitability of Circuit Foil Luxembourg by
improving yield rate
Quarterly Sales
• 3Q sales increase QoQ to KRW 164bn thanks to new smartphone release by major clients and sales increase
of Package CCL
185
140
156
138
164
2Q 4Q 3Q ’13.3Q ’14.1Q
Strengthen overseas & new businesses 1
Cost innovation 2
7
(unit: KRW billion)

2분기 실적 (별도 기준) Electro-Materials – 4Q Outlook & Strategy
Sales Trend of Package CCL 4Q Strategy
Diversify client base
New growth opportunity & Secure profitability 3
Increase sales of Package CCL 1
2
• Increase sales to existing clients (Company S,H)
• Sales for additional applications to new clients
(Company I,N,K)
’14(E)
82
’13
77
’12
+36%
• Expand Chinese accounts by enhancing sales network
and strengthening technology support
• Increase sales to Chinese set makers and Company A
• Expand line-up to related area such as automobile CCL
• Maximize synergy between Circuit Foil and seek new
business opportunity such as functional film
111
8
(unit: KRW billion)

2분기 실적 (별도 기준) Industrial Vehicle – 3Q Results (Parent)
• Domestic sales grew 12% YoY in line with market share gains, while exports also increased QoQ due to
economic recovery of developed markets and improving market conditions in Eastern Europe/emerging markets
Quarterly Sales 3Q Results
Strengthened domestic market leadership 1
Enhanced overseas market position 2
• Maintain No.1 position in domestic market due to stable
supply of mid/small-size products and fleet-deal orders
• Sales promotion during slow season
• Better A/S coverage and brand value compared to peers
by extending warranty for key components
• Introduced T4 products in Europe and strengthened
product line-up in North America and EU
• Promoted brand value and technology by hosting dealer
meeting in North America and launching ceremony in UK
• Secured fleet-deal orders in emerging markets
- Mexico, Colombia, Venezuela etc.
142 154
143
159 153
2Q 4Q 3Q ’13.3Q ’14.1Q
9
(unit: KRW billion)

2분기 실적 (별도 기준) Industrial Vehicle – 4Q Outlook & Strategy
• Despite unfavorable condition in emerging market and adverse exchange rate, we expect 4Q sales to increase
YoY thanks to the strong demand in domestic and developed markets
- Domestic : Promote rental business and support dealer’s incentive program
- North America/EU : Strengthen class 3 product line-up and launch T4 product
- Central and South America : Build up network by hosting dealer’s conference
- Middle East/Africa : Conduct service training program to regional dealers
4Q Sales Forecast Domestic M/S and Sales
* 4Q13 sales(parent basis) excludes dividend from overseas subsidiariesKRW5.7bn)
249
277
262
293
'11 '12 '13 '14(E)
46.0%
49.4%
51.8% 52.2%
149
153
'13.4Q '14.4Q
+3.3%
10
(unit: KRW billion) (unit: KRW billion, %)

2분기 실적 (별도 기준) Mottrol – 3Q Results (Parent)
• 3Q sales grew 5% YoY to KRW73bn and OP improved both YoY and QoQ basis
• OP turned positive thanks to our cost reduction efforts despite the market slowdown in China and Europe
Quarterly sales
(unit: KRW billion)
3Q Results
• Expanded supply chain in China (travelling/swing/MCV)
- Supplied swing device to company X and currently testing
pump to supply to company L
- Negotiating with company Su for 3 types of travelling
devices, and developing 6 new travelling/swing products
• Increased sales to advanced companies
- Supplied sample to company J, H and company B
• Accelerated local sourcing in China
- Producing pilot products to company S
• Saved cost via improving production efficiency of
domestic plant
- Integrated painting process, provided internal logistic
services and internalized manufacturing zero tail parts
3Q 2Q
88
’14.1Q
692
4Q
69
79
’13. 3Q
73
88
Diversified Clients and Product Portfolio 1
Improved Profitability 2
11

2분기 실적 (별도 기준) Mottrol – 4Q Outlook
Sales Outlook for 4Q
(unit: KRW billion)
73 82
+13%
’14.4Q ’14.3Q
Fixed Cost
(unit: KRW billion)
74 79
84 74
’14(E) ’13 ’12 ’ 11
-11%
• Expect to receive new orders from major clients in China before the Chinese New Year despite the
continuous Chinese market slowdown, and plan to increase sales via product portfolio diversification
- Continue to expand client base for both local Chinese and advanced companies
- Expand set-based sales to company X
- Improve profitability by increasing local sourcing
- Continue efforts for reducing manufacturing and fixed costs
* Excluding one-off restructuring expenses
*
12

13
I. 3Q Business Results
II. Divisional Business Results and Outlook
III. Fuel Cell Business Outlook
IV. Appendix
Table of Contents
Fuel Cell ― Investment Background
Technology and market
entry opportunities
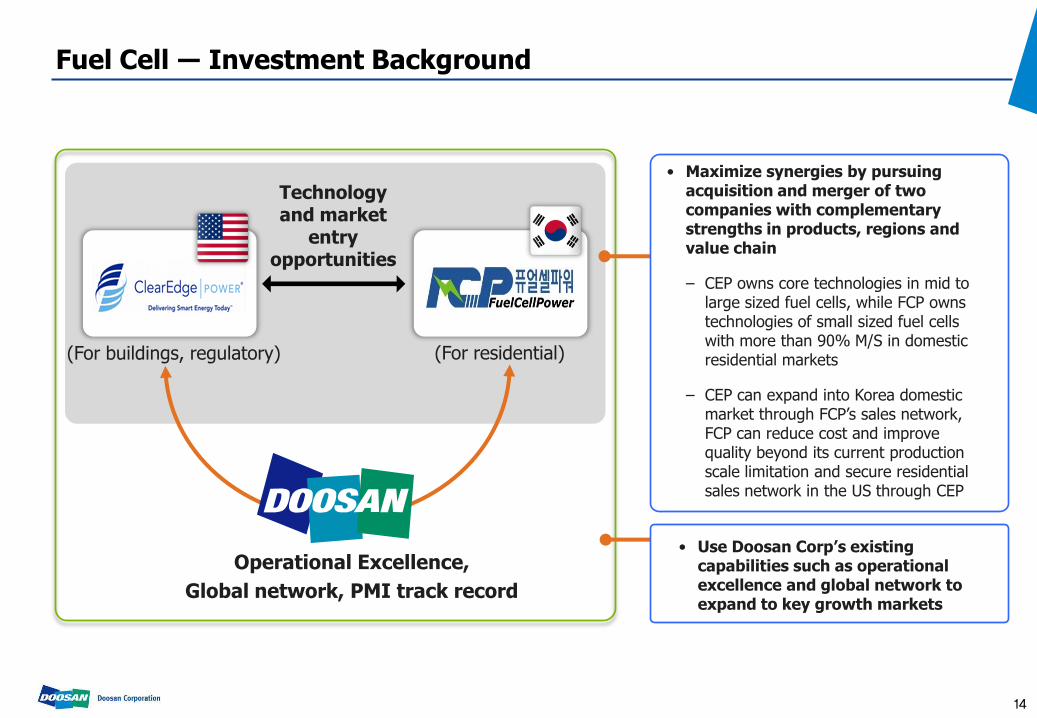
• Maximize synergies by pursuing acquisition and merger of two companies with complementary strengths in products, regions and value chain
– CEP owns core technologies in mid to large sized fuel cells, while FCP owns technologies of small sized fuel cells with more than 90% M/S in domestic residential markets
– CEP can expand into Korea domestic market through FCP’s sales network, FCP can reduce cost and improve quality beyond its current production scale limitation and secure residential sales network in the US through CEP
• Use Doosan Corp’s existing capabilities such as operational excellence and global network to expand to key growth markets
Operational Excellence,
Global network, PMI track record
(For buildings, regulatory) (For residential)
14

Fuel Cell ― Business Progress
• Stabilized operation in the U.S and Korea and received orders since acquiring CEP on July 2014
Business Milestone Doosan FCA (U.S.) Fuel Cell BG Korea BU (Korea)
• Acquired CEP (July 18) • Held proclamation
ceremony of Doosan FCA (July 31)
• Started PMI process • Local manpower reached 40
• MOU to build fuel cell plant in Pyeongtaek (125 unit, 50MW)
Jul. ‘14
• Held Strategy Workshop • Began to stabilize sales
force / supply chain
• Started PMI process of FCP
Aug.
• Merged Fuel Cell Power (FCP)(Sep 30)
• Start the process for internalized core parts
• Stabilized PAFC service network and system
• Started discussing the terms to receive large sized orders
Sep.
• Launched Doosan Fuel Cell BG (Oct 1)
• Held proclamation ceremony of Korea BU (Oct 20)
• Local manpower over 90 • Supplied 1 unit to company
B (existing customers)
• Secured order pipeline of major large power producers
• Developed fuel cells for military application
Oct.
• Reactivated cell production lines
• Prepared to run assembling lines
• In the works to receive orders for building (max. 12 units of M400 products)
• Final process to receive large sized orders
Nov. ~ Dec.
• Initiated production/ sales activities
15
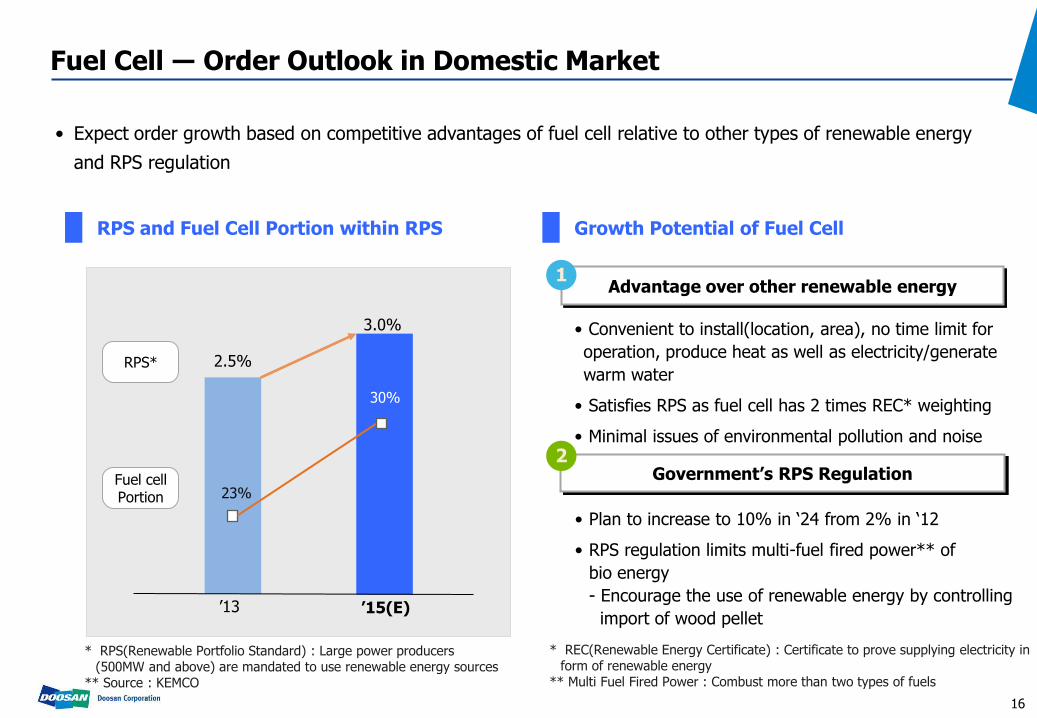
2분기 실적 (별도 기준) Fuel Cell ― Order Outlook in Domestic Market
RPS and Fuel Cell Portion within RPS Growth Potential of Fuel Cell
Government’s RPS Regulation
Advantage over other renewable energy 1
2
• Convenient to install(location, area), no time limit for
operation, produce heat as well as electricity/generate
warm water
• Satisfies RPS as fuel cell has 2 times REC* weighting
• Minimal issues of environmental pollution and noise
• Plan to increase to 10% in ‘24 from 2% in ‘12
• RPS regulation limits multi-fuel fired power** of
bio energy
- Encourage the use of renewable energy by controlling
import of wood pellet
16
• Expect order growth based on competitive advantages of fuel cell relative to other types of renewable energy
and RPS regulation
’15(E)
2.5%
’13
3.0%
RPS*
Fuel cell Portion 23%
30%
* REC(Renewable Energy Certificate) : Certificate to prove supplying electricity in form of renewable energy
** Multi Fuel Fired Power : Combust more than two types of fuels
* RPS(Renewable Portfolio Standard) : Large power producers (500MW and above) are mandated to use renewable energy sources
** Source : KEMCO

2분기 실적 (별도 기준) Fuel Cell ― Domestic Order Pipeline
17
• Market size of more than 700MW is expected in next 5 years in domestic regulatory markets based on current
order pipelines, and Doosan is planning to expand its M/S via technological advantages and cost reduction
Project Expected Size(MW)
Pyeongtaek stage 1
KHNP Busan
Seoul Magok
Seoul Sinnae
Seoul Dobong
Others
Pyeongtaek stage 2
Kwangju PJT
Incheon
Samsung Total
Busan Energy
Others
100
28
30
20
20
13
260
80
60
30
30
43
211MW, KRW 1 tn
503MW, KRW 2.5 tn
‘15
‘16 ~
‘18
Total 714MW, KRW 3.5 tn

Fuel Cell ― Growth Strategy
Based on Technical
Advantage
Secure Order Competitiveness
Cost Reduction
CAPEX Investment
1
2
3
• Competitive advantage in terms of product life time, efficiency, operational temperature,
operating time
- Durability / Feasibility / Operation flexibility
• Strengthen marketing based on product competitive advantage
- Increase personnel to enhance service, marketing and sales
- Support service to domestic power producer and increase spec-in activities
• Improve performance of Cell Stack, develop models for Korean market and power plant
• Strengthen relationship with key suppliers and internalize if necessary
• Diversify supply chain
• Eliminate production inefficiency by optimizing manufacturing process
• Plan to establish PAFC plant in Korea
- Facility investment and hiring of production workers
- Pursue local sourcing
• Build production line based on component internalization
18

Fuel cell – Competitiveness of PAFC
PAFC Strength
8~10 years
Total efficiency 90% (Power efficiency 40%)
170~200 degrees Celsius
6 hours
Average Life
Efficiency
Operating Temperature
Startup time
Advantage in terms of durability
and maintaining cost
High thermal efficiency
Can use low heat-resisting components
Has short down time,
and operation can be flexible
19
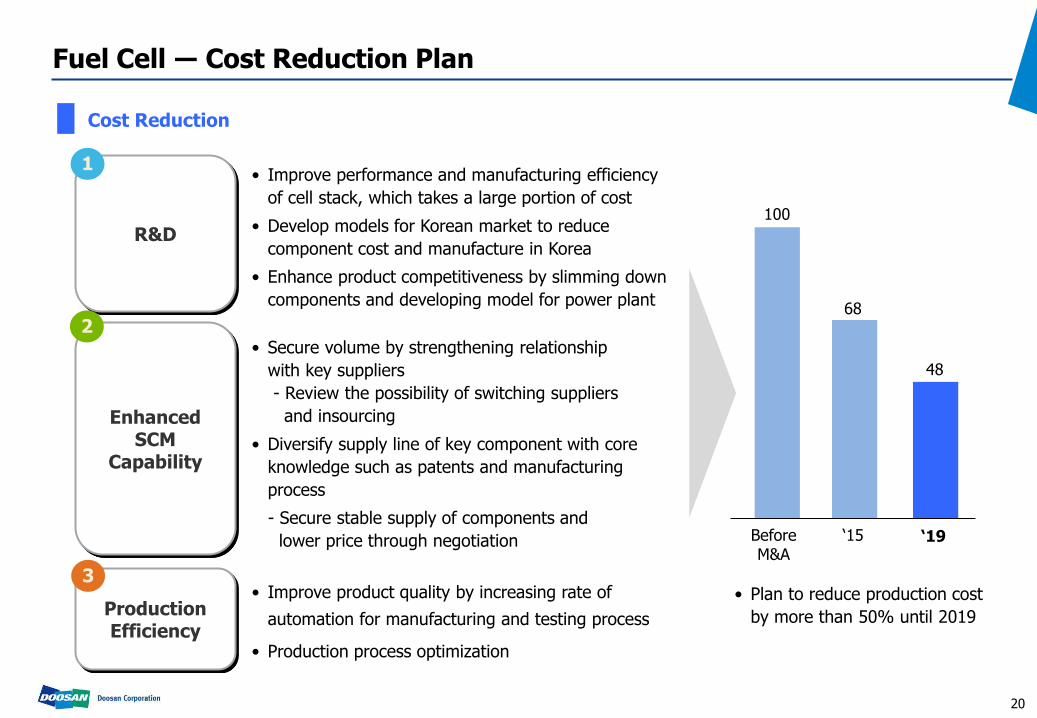
Fuel Cell ― Cost Reduction Plan
R&D
Enhanced SCM
Capability
Production Efficiency
1
2 • Secure volume by strengthening relationship
with key suppliers
- Review the possibility of switching suppliers
and insourcing
• Diversify supply line of key component with core
knowledge such as patents and manufacturing
process
- Secure stable supply of components and
lower price through negotiation
3 • Improve product quality by increasing rate of
automation for manufacturing and testing process
• Production process optimization
Cost Reduction
‘19
68
‘15
100
Before M&A
48
• Plan to reduce production cost
by more than 50% until 2019
20
• Improve performance and manufacturing efficiency
of cell stack, which takes a large portion of cost
• Develop models for Korean market to reduce
component cost and manufacture in Korea
• Enhance product competitiveness by slimming down
components and developing model for power plant

21
I. 3Q Business Results
II. Divisional Business Results and Outlook
III. Fuel Cell Business Outlook
IV. Appendix
Table of Contents

Appendix. Financial Summary
E O D
Financial Summary (B/S)
Parent
’14. 2Q ’14. 3Q
Current Assets
678 737
Non-Current Assets
2,718 2,801
Total Assets 3,396 3,537
Current Liabilities
692 763
Non-Current Liabilities
720 692
Total Liabilities
1,412 1,455
Paid-in Capital
133 135
Total Equity 1,983 2,082
L/E Ratio 71% 70%
Consolidated
’14. 2Q ’14. 3Q
Current Assets 13,342 13,507
Non-Current Assets
18,586 18,733
Total Assets 31,928 32,240
Current Liabilities
13,414 13,326
Non-Current Liabilities
9,728 10,058
Total Liabilities 23,142 23,384
Paid-in Capital 2,974 3,037
Total Equity 8,786 8,857
L/E Ratio 263% 264%
Debt
Parent
’14. 2Q ’14. 3Q
Bank 352 349
Corp. Bonds 530 530
Others 53 53
Debt 934 932
Cash 78 106
Net Debt 857 825
Net D/E Ratio
43% 40%
22
(unit: KRW billion) (unit: KRW billion) (unit: KRW billion)