dose-dependent pharmacokinetics and biliary excretion of bromophenol blue in the rat
TRANSCRIPT
(99) E. F. Leonard and S. B. Jorgensen, Annu. Reu. Riophys. Bioeng.,
(100) R. K. Jain, J . M. Weissbrod, and J. Wei, Adu. Cancer Res., 33,
(101) R. K. Jain, in “Advances in Transport Processes,”vol. 3 Wiley,
(102) R. K. Jain, in “Hyperthermia in Cancer Treatment,” F. K.
(103) R. A. Bender and R. L. Dedrick, Cancer Chernother. Rep., 59,
ACKNOWLEDGMENTS 3,293 (1974).
251 (1980).
New Delhi, 1983, pp. 205-339.
Storm, Ed., G. K. Hall, Boston, Mass., 1983, Chap. 2, pp. 9-46.
805 (1975). helpful comments.
This work was supported by grants from the National Science Foundation and the American Cancer Society, an NIH predoctoral traineeship (LEG), and an NIH Research Career Development Award (RKJ).
for his The authors wish to thank Dr- Robert
RESEARCH ARTICLES
Dose-Dependent Pharmacokinetics and Biliary Excretion of Bromophenol Blue in the Rat
ROBERT J. WILLS *, RANDALL B. SMITH *, and GERALD J. YAKATANx§ Received December 31,1981, from the Drug Dynamics Institute, College o f Pharmacy, Uniuersity of Texas at Austin, Austin, T X 78712. Hoffmann-La Roche, Nutley, NJ 07110; *Clinical Bioavailability Unit, The Upjohn Company, Kalamazoo, MI 49001; §Warner-LambertRarke- Davis, Pharmaceutical Research Division, Morris Plains, NJ 07950.
Accepted for publication August 26, 1982. Present addresses: *Department of Pharmacokinetics and Biopharmaceutics,
Abstract Concentrations of bromophenol blue (I) in plasma, urine, and bile were determined spectrophotometrically after intravenous bolus injections and infusions in rats. The plasma concentrations were found to decrease monoexponentially after all doses except the highest, where the decrease was biexponential. Although the disposition kinetics of I were apparently first-order at all doses, the half-life increased with in- creasing dose. The area under the plasma concentration-time curve (AUCs,) increased disproportionately with increasing dose. The binding of I to rat plasma proteins, as determined by equilibrium dialysis, showed that the fraction bound (96%) remained constant in the concentration range of 10-300 pg/ml. Plasma concentrations were determined at time zero after intravenous administration and after a second dose adminis- tered 20 min later when plasma concentrations from the first dose were minimal. The apparent first-order elimination rate constant for the plasma concentration decline following the second dose was significantly less than after the first dose, indicating that the residual dye in the liver altered the elimination of I after the second dose. The fraction of the dose in the liver decreased with increasing dose, indicating a saturable uptake process. The biliary excretion profile reflected the uptake saturation that occurred in the liver and demonstrated that the biliary excretion of I depended on the amount present in the liver. When liver damage was induced by exposure to carbon tetrachloride, dye concentrations in the plasma, liver, and kidney increased markedly.
Keyphrases 0 Bromophenol blue-in rat urine, plasma, and bile, dose-dependent pharmacokinetics, biliary excretion 0 Pharmacoki- netics-bromophenol blue, rat plasma, urine, and bile, biliary excretion II Biliary excretion-bromophenol blue, rat urine, plasma, and bile, dose-dependent pharmacokinetics
Bromophenol blue (I) is a high molecular weight anionic sulfonephthalein dye (670 g/mole, pK, 4.0). Several re- ports (1-3) have shown that I is extensively excreted in the bile and is not metabolized in a variety of species including the rat.
Takada et al. (4, 5 ) conducted studies aimed at char- acterizing the role of the intracellular protein fractions Y
and Z in the uptake and transport of I in rat hepatocytes, and also developed a linear pharmacokinetic model for the biliary excretion of I after intravenous administration in rats (6). The model adequately described a single low-dose plasma and bile profile, but could not describe the ob- served nonlinearity a t higher doses. The overall aim of these authors was to evaluate I as a model organic anionic compound by characterizing the pharmacokinetics at three different doses. Their report did not fully characterize the pharmacokinetics at any dose. Liver concentrations and plasma protein binding were not measured, and the ob- served nonlinearity was not addressed.
Studies on the pharmacokinetics of drugs excreted in the bile have increased in recent years as investigators have become more interested in the effects of liver disease on drug clearance, the effects of first-pass liver clearance on drug bioavailability, the effects of enterohepatic recircu- lation on drug disposition, and the nonlinear excretion of drugs (7-11). Usually these studies have not considered the extent of protein binding, liver-to-plasma and bile- to-liver drug concentration ratios, hepatic blood flow, and bile flow. These factors contribute to the interpretation of hepatobiliary elimination. In addition, the interpreta- tion has been complicated by the use of compounds such as sulfobromophthalein that undergo metabolism. Ideally, a model compound used in studying hepatobiliary elimi- nation would not undergo metabolism, nor enterohepatic recirculation, and would not be pharmacologically ac- tive.
The organic anion, bromophenol blue (I), possesses these qualities (2, 4). Therefore, the present investigation was undertaken to: (a ) determine the pharmacokinetic profile
0022-3549/83/ 1000-1 127$01.00/0 @ 1983, American Pharmaceutical Association
Journal of Pharmaceutical Sciences I 1127 Vol. 72, No. 10. October 1983
of I elimination from plasma after intravenous adminis- tration of different doses; ( b ) evaluate the effect of prior administration of I on the plasma decline of a subsequent intravenous administration; ( c ) determine the liver con- centration of I after intravenous administration; ( d ) assess the plasma protein binding of I; ( e ) analyze the biliary excretion profile of I after intravenous bolus and infusion administrations; and ( f ) evaluate the utility of I pharma- cokinetics in assessing liver damage.
EXPERIMENTAL
Animal Preparation-Fasted male Sprague-Dawley rats (260-470 g ) were anesthetized with 50 mglkg ip of sodium secobarbital followed by cannulation of the left jugular vein and the right carotid artery with polyethylene tubing'. Doses of I2 were administered as a bolus or infusion through the jugular vein catheter. Blood samples were withdrawn from the carotid artery cannula at selected times after administration, collected in heparinized tubes3, and centrifuged; the plasma was removed and stored frozen at -20" until assayed. The blood collected did not exceed 10% of the total blood volume. Urine was collected as produced and then frozen. All bile was collected in preweighed, screw-cap vials4 and frozen until assayed. Bile collection was at 5-min intervals for 2 hr and then at 15-min intervals for the duration of the experiment. The body temper- atures of the rats were maintained at 37 f 0.5' with a heat lamp and monitored by a rectal thermistor probe5.
Intravenous Studies-Doses of 5.6, 11.2, 22.4, and 33.6 mghg of I dissolved in 0.5 ml of isotonic phosphate buffer (pH 7.4) were adminis- tered to four rats per dose as an intravenous bolus through the jugular vein catheter followed by a 0.3-ml saline wash. Blood samples, 0.2-0.4 ml, were withdrawn from the carotid artery cannula at various times after dosing, collected in heparinized tubes, centrifuged, and the plasma re- moved for assay.
In six other rats, additional surgery exposed the common bile duct through a small midline abdominal incision (2-3 cm) followed by the insertion of a polyethylene6 cannula for bile collection. Two doses of I, 5.6 and 11.2 mglkg, were administered to three rats each as an intravenous bolus. Blood, urine, and bile were collected after administration.
In another experiment, three rats were administered an 11.2-rnghg dose of I as an intravenous bolus through the jugular cannula followed by the administration of a second 11.2-mghg dose 20 min later. Blood samples, 0.2 ml, were withdrawn from the carotid artery at selected in- tervals after each administration of I.
Infusion Studies-Twenty-four rats were prepared for drug admin- istration and blood withdrawal as described above. Twelve rats received an 11.2-mg/kg dose of I and twelve rats received a 22.4-mghg dose of I. At selected times after the dye administration, 4.0-6.0 ml of blood was drawn from the inferior vena cava followed by excision of the liver. The liver was rinsed in normal saline, dried, weighed, and stored frozen at -20' until assayed. A 2-ml plasma sample was subjected to equilibrium dialysis as described below, and the remainder of the sample was frozen until assayed.
Four additional rats were prepared for blood, urine, and bile collection as outlined. Bromophenol blue was infused through a jugular cannula with an infusion pump at rates of 3.0,6.0,10.0, and 24.0 mghr for 2 hr. The time to reach steady state was approximated at 1-1.5 hr using data from the intravenous studies. The approximation was based on linear pharmacokinetics, so an additional 0.5 hr of infusion time was allotted as an adjustment for the observed nonlinearity bringing the total time of infusion to 2 hr. Blood, urine, and bile were collected during and after the infusion of I.
Liver Dysfunction Studies-Undiluted carbon tetrachloride was given by intubation at a dose of 2.5 mllkg, followed by the immediate infusion of I, to three rats which had been fasted for 24 hr. Three addi- tional rats were used as a control. The rats were then allowed food and water ad libitum for the next 24 hr. A t this time the rats were anesthetized with ether and blood (4-6 ml) was drawn from the inferior vena cava; both the liver and kidneys were quickly excised, rinsed in normal saline, blotted
* PE-50, Clay-Adams, Parsippany, N.J. * Allied Chemical Co., New York, N.Y.
4 Kimble. Toledo, Ohio. Vacutainer; Becton, Dickinson & Co., Rutherford. N.J.
Yellow Springs Instruments, Yellow Springs, Ohio. PE-10; Clay-Adams, Parsippany, N.J.
1 b . b O 5.00 l 0 : O O 15.'00 20:OO 25:OO 30.00 MINUTES
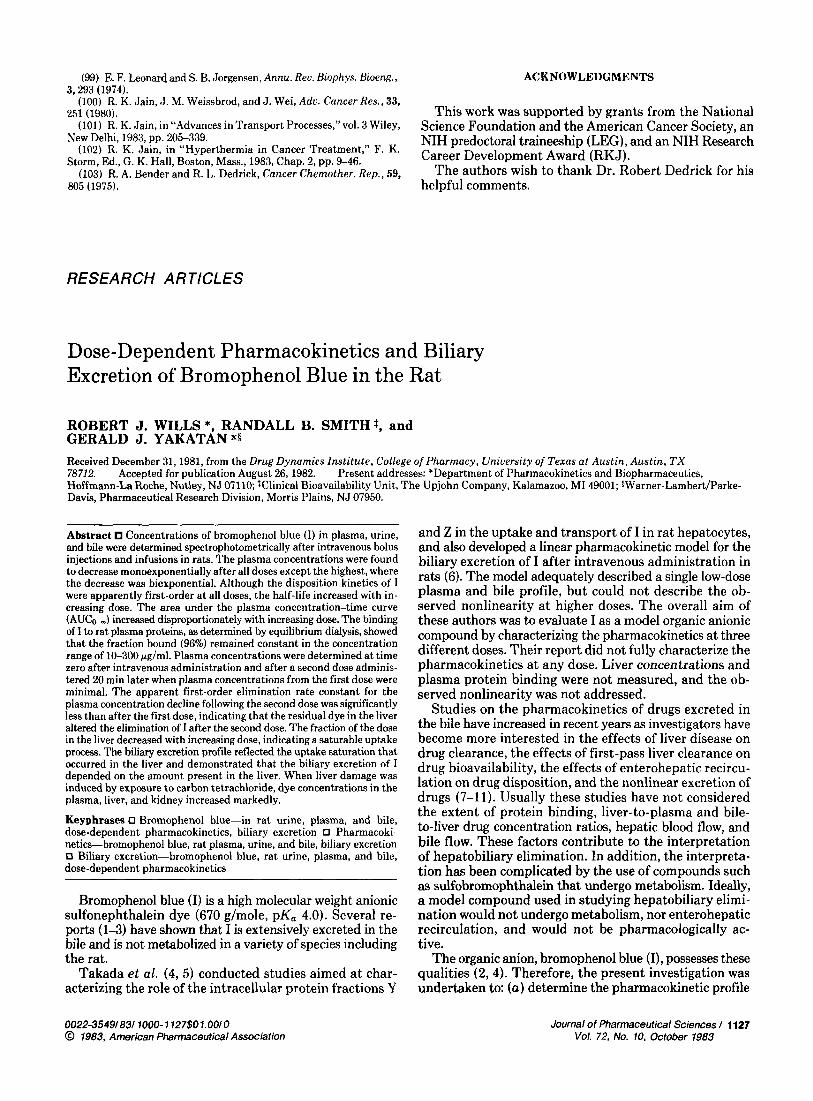
Figure I-Semilogarithmic plot of mean f SD (bars) plasma levels of I as a function of time after intravenous bolus administration of 5.6 mglkg (X); 11.2 mglkg (+); 22.4 mglkg (A); and 33.6 rnglkg (0).
dry, and weighed. The rate of bile production was used as an index of liver dysfunction.
Protein Binding-The binding of I to plasma proteins was deter- mined by equilibrium dialysis. Dialysis tubing, average pore diameter 24 A, was prepared by boiling twice for 20 min in distilled water. Fresh rat plasma, 2 ml, was placed in the dialysis bag and allowed to equilibrate with I in isotonic phosphate buffer (pH 7.4) for 24 hr a t 37'.
Assays-Plasma or urine (25-200 pl) was diluted with 1-2 ml of phosphate buffer (pH 81, and the absorbance was measured at 595 nm with a microsample spectroph~tometer~. Bile was diluted with 2-10 ml of phosphate buffer (pH 8.0) and measured with a double-beam spec- trophotometers. The specific gravity of bile was determined by weighing known volumes of bile. Standard curves were prepared daily from rat plasma, urine, or bile spiked with appropriate concentrations of I. The amount of I in the liver and kidneys was measured after each organ was homogenized with twice its weight of isotonic phosphate buffer (pH 7.4) in an homogenizerg. Six milliliters of acetone was added to 5 ml of ho- mogenate, mixed, and shaken for 15 min in a mechanical shakerlo. The final mixture was centrifuged for 20 min at 2500 rpm. The supernatant was collected, centrifuged again, diluted with phosphate buffer (pH 8), and then measured at 595 nm with a spectroph~tometer~.
Standard curves were prepared on each day of analysis by adding known amounts of I to rat liver or kidney cytoplasm diluted in phosphate buffer (pH 8.0). The standard curves were linear ( r = 0.9998) from 1 to 12 pg/ml with assay sensitivity limits in plasma, urine, bile, and tissue of 0.6,0.6,0.8, and 0.6 pg/ml, respectively.
RESULTS
Intravenous Studies-A semilogarithmic plot of the mean plasma concentration-time curves after intravenous bolus injections of 5.6,11.2, 22.4, and 33.6 mghg of I is shown in Fig. 1. The elimination of I from plasma appeared to be monoexponential in the dose range of 5.6-22.4 mg/kg. The data for these doses were fit by NONLIN (12) to the equa- tion:
(Eq. 1)
Gilford Instruments Laboratories Inc., Oberlin, Ohio. Coleman Model 124, Perkin-Elmer Corp., Marywood, 11. Polytron; Brinkmann Instruments, Westbury, N.Y.
lo Precision Instruments, Chicago, Ill .
1128 I Journal of Pharmaceutical Sciences Vol. 72, No. 10, October 1983
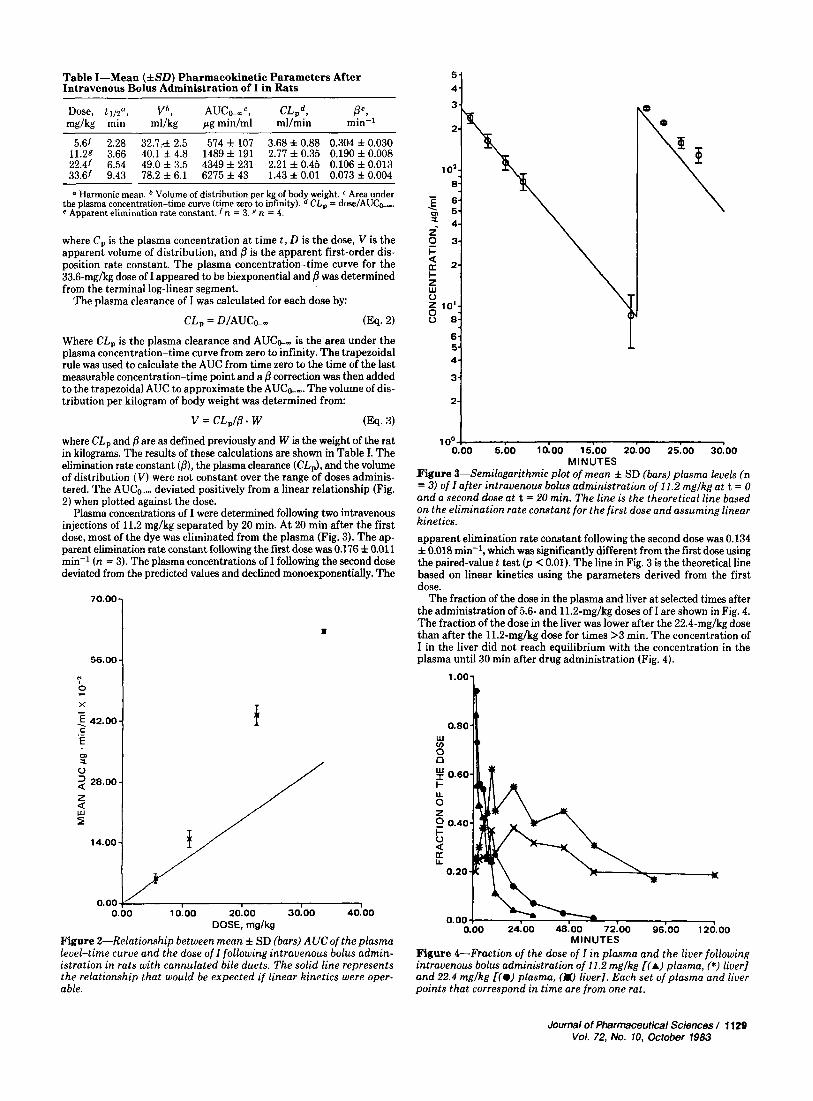
Table I-Mean (*SO) Pharmacokinetic Parameters After Intravenous Bolus Administration of I in Rats
70.00-
56.00-
N , 2 X
Dose, t 1 / Z a , V b , AUCK,~, CL,!, Be9 malka min ml/kn uamin/ml ml/min min-1
5.61 2.28 32.7,& 2.5 574 f 107 3.68% 0.88 0.304 f0.030 11.29 3.66 40.1 f 4.8 1489 f 191 2.77 f 0.35 0.190 f 0.008 22.41 6.54 49.0 f 3.5 4349 f 231 2.21 f 0.45 0.106 f 0.013 33.61 9.43 78.2 f 6.1 6275 f 43 1.43 f 0.01 0.073 f 0.004
0 Harmonic mean. Volume of distribution per kg of body weight. Area under CL, = dose/AUCk,. the plasma concentration-time curve (time zero to infinity).
e Apparent elimination rate constant. n = 3 . 8 n = 4.
where C, is the plasma concentration at time t , D is the dose, V is the apparent volume of distribution, and p is the apparent first-order dis- position rate constant. The plasma concentration-time curve for the 33.6-mghg dose of I appeared to be biexponential and /3 was determined from the terminal log-linear segment.
The plasma clearance of I was calculated for each dose by:
C L , = D/AUC&, (Eq. 2)
Where CL, is the plasma clearance and AUCG., is the area under the plasma concentration-time curve from zero to infinity. The trapezoidal rule was used to calculate the AUC from time zero to the time of the last measurable concentration-time point and a correction was then added to the trapezoidal AUC to approximate the AUCo-,. The volume of dis- tribution per kilogram of body weight was determined from:
v = c L , I p . w (Eq. 3)
where CL, and pare as defined previously and W is the weight of the rat in kilograms. The results of these calculations are shown in Table I. The elimination rate constant (p), the plasma clearance (CL,), and the volume of distribution ( V ) were not constant over the range of doses adminis- tered. The AUCw, deviated positively from a linear relationship (Fig. 2) when plotted against the dose.
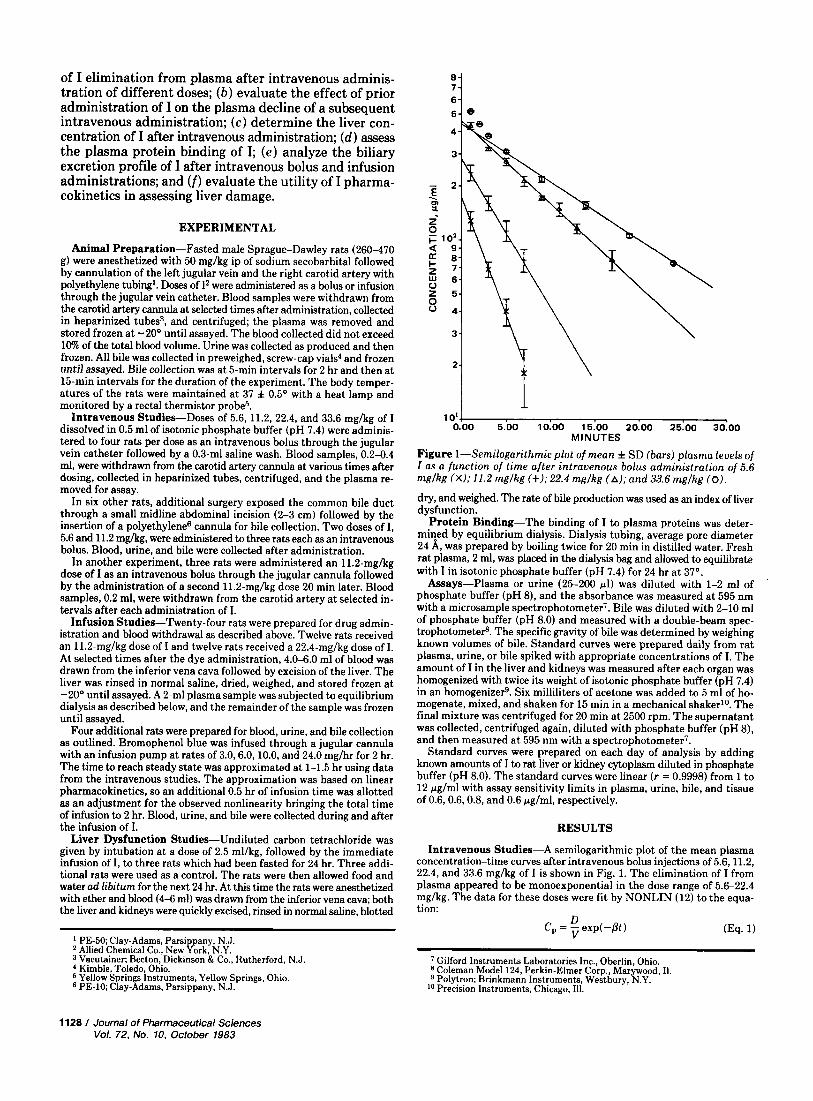
Plasma concentrations of I were determined following two intravenous injections of 11.2 mglkg separated by 20 min. A t 20 min after the first dose, most of the dye was eliminated from the plasma (Fig. 3). The ap- parent elimination rate constant following the fust dose was 0.176 f 0.011 min-' ( n = 3). The plasma concentrations of I following the second dose deviated from the predicted values and declined monoexponentially. The
42.00
I rn a 0 2 28.00
a
0 . o o y 1 1 0.00 10.00 20.00 30.00 40.00
DOSE, mg/kg
Figure 2-Relationship between mean f SD (bars) AUC of the plasma level-time curve and the dose of 1 following intravenous bolus adrnin- istration in rats with cannulated bile ducts. The solid line represents the relationship that would be expected if linear kinetics were oper- able.
4
1
loo ! 0
0.00 5.00 10.00 15.00 20.00 25.00 30.00 MINUTES
.Figure 3-Semilogarithmic plot of mean f SD (bars) plasma levels (n = 3) of I after intravenous bolus administration of 11.2 mglkgat t = 0 and a second dose at t = 20 min. The line is the theoretical line based on the elimination rate constant for the first dose and assuming linear kinetics. apparent elimination rate constant following the second dose was 0.134 f 0.018 min-l, which was significantly different from the first dose using the paired-value t test (p < 0.01). The line in Fig. 3 is the theoretical line based on linear kinetics using the parameters derived from the first dose.
The fraction of the dose in the plasma and liver at selected times after the administration of 5.6- and 11.2-mglkg doses of I are shown in Fig. 4. The fraction of the dose in the liver was lower after the 22.4-mghg dose than after the 11.2-mglkg dose for times >3 min. The concentration of I in the liver did not reach equilibrium with the concentration in the plasma until 30 min after drug administration (Fig. 4).
1 . O O l
0.80 R
0.00'. -1 1 0.00 24.00 4600 72:OO 96.00 120.00
MINUTES Figure 4-Fraction of the dose of I in plasma and the liver following intravenous bolus administration of 11.2 mglkg [(A) plasma, (*) liver] and 22.4 mglkg I(@) plasma, (W liver]. Each set of plasma and liver points that correspond in time are from one rat.
Journal of Pharmaceutical Sciences I 1129 Vol. 72, No. 10, October 1983

Table 11-Tissue Concentration, Concentration Ratios, and Bile Production of I During Constant Intravenous Infusion in Control and Carbon Tetrachloride-Treated Rats a
a loo- z 9:
G 4-
A w 7 - LL 6- 0 w 5-
1.50
1.20
4
n
4
TIME MIDPOINT, min
Figure 5-Mean fraction (n = 3) of 5.6-mglkg (m) and 11.2-mglkg (*) doses expressed as the percent of the dose of I excreted per hour in bile after intravenous bolus administration. The solid lines were simulated and serve as definition of the data points.
The total mean fraction of the dose excreted following a 5.6-mglkg dose (0.93) was greater than the total mean fraction of the dose excreted fol- lowing an 11.2-mghg dose (0.86). The mean rate of excretion (mean fraction per hour) of I in the bile following 5.6- and 11.2-mghg doses are shown in Fig. 5. The mean fractional rate of excretion of I in the bile was greater after the 5.6-mg/kg dose than after the 11.2-mg/kg dose a t 1 2 5 min. When body temperature was not controlled, a reduction in the cu- mulative fraction of the dose excreted in the bile (0.76) following an 11.2-mglkg dose was observed. The cumulative amount of I collected in the urine accounted for 2.5% of the dose, and the amount excreted was not dose related.
Infusion Studies-The amounts of I excreted per hour in bile during
Y A
F I Q
.- 0.00 20:OO 40:OO 60:OO 80100 100.00 126.00
MINUTES
Figure 6-Amount of I excreted per hour in bile during constant in- travenous infusion at the rates of 3.0 mglhr fo), 6.0 mglhr f a , 10.0 mglhr (A), and 24.0 mglhr (*). The concentration of I in the infusion solution was adjusted sa that the volume infused was the same for all infusion rates.
Drug Concentrationb Tissue Control Treated" t Test
Plasma (pg/ml) 6 2 f 15 2 4 0 f 9 p CO.05 Liver ( p /g) 89 f 38 119 f 25 p < 0.05 Bile (pgfml) 2567 f 402 1652 f 613 p < 0.05
p < 0.05 Kidney ( d g ) 58 8 203 f 12 Concentration Ratios
LiverPlasma BileLiver
1.3 f 0.1 0.5 f 0.1 p < 0.05 33 f 10 14 f 2.2 p < 0.05
Kidneyh'lasma 1.3 f 0.8 0.8 f 0.1 n.s.
pllmin-kg
a Mean f SD; n = 3. * At 3 hr during a 5.7-mghr infusion; normalized to a During a 16-mghr.kg
Mean bile production rated, 78 f 1 2 2 f 1 p <0.05
300-g rat. infusion.
Carbon tetrachloride dose of 2.5 m l k g PO.
intravenous infusion at rates of 3.0,6.0,10.0, and 24.0 m g h r are shown in Fig. 6. Saturation of the excretion of I in bile occurred with the 10.0- and 24.0-mghr rates. The maximum excretion rate was 8.5 mg/hr. Again, the amount of I excreted in the urine was small in proportion to the dose administered and was net dose related.
Liver Dysfunction Studies-The results of the carbon tetrachloride treatment are presented in Table 11. The carbon tetrachloride treatment reduced the rate of bile production to one-third that of the control group. Liver-to-plasma and bile-to-liver ratios of I decreased by 60% in the treated rats. It is interesting to note the kidney concentrations increased by 200% in the treated rats.
Protein Binding-The plasma protein binding of I was determined by equilibrium dialysis of pooled rat plasma against I in isotonic phos- phate buffer. The percentage of I bound to plasma proteins was 96.0 f 0.5% at 37' and was constant over the range of 10-300 pglml.
DISCUSSION
The clearance of I from plasma is not a linear process in the dose range investigated. Changes in the binding of I to plasma proteins did not ex- plain these observations since the binding was constant. Referring to Fig. 1, the plasma profiles appear to be first order. Perrier et al. (13) presented theoretical curves which are very similar in nature to the curves in Fig. 1. However, the theoretical curves are the result of either Michaelis- Menten kinetics, substrate inhibition, or product inhibition. Any sug- gestions regarding applicability of I disposition to biotransformation kinetics are inappropriate since I is not metabolized, but adaptation to a Michaelis-Menten type saturable binding equation may be appropriate for successful modeling.
Recently, Stoeckel et al. (11) developed a compartmental model to describe the plasma profile of indocyanine green in rabbits. The model incorporated Michaelis-Menten transfer from the central compartment to the peripheral compartment. However, these authors failed to fit in- docyanine green data from rats and cited experimental difficulties as an explanation. It is likely that the indocyanine green data from the rat do not conform to Michaelis-Menten kinetics. In fact, the actual plasma profile of indocyanine green in rats (Fig. 6 in Ref. 11) appears to be biexponential and first order. It is conceivable that a combination of fast distribution and dose-dependent saturation described herein may result in the nonlinear and apparent first-order profiles observed by Stoeckel et al. ( l l ) , since indocyanine green is in the same chemical class as I and it is not metabolized nor enterohepatically recycled (14).
The consecutive dose administration study showed that the plasma profile after the second injection differed significantly from the plasma profile after the first injection, even though the plasma concentrations after the first injection were approaching zero prior to the second injection (Fig. 3). The difference in the plasma profiles following repeated intra- venous injections of I indicated that the nonlinearity depends not only on the dose of I but also on the residual amount of I in the liver and a rapid distribution from plasma. Smith et al. (3) reported a dye concentration in the liver of rats 20 times the plasma concentration at 5 min after dosing, confirming a rapid distribution from plasma. Thus, the nonlinear plasma elimination of I is related to either differences in liver uptake with in- creasing dose or differences in biliary secretion with increasing dose.
Takada et al. (4) had previously shown that the liver-to-plasma con- centration ratio of I decreased as the dose was increased from 11.2 to 66.7
1130 I Journal of Pharmaceutical Sciences Vol. 72, No. 10, October 1983

mg/kg in rats, indicating that saturation occurred and caused a decrease in the distribution from plasma. There was no change in the bile-to-liver concentration ratio over the same dose range, suggesting that nonlinear plasma elimination was due to saturable liver uptake only.
The data from the liver studies support the data of Takada (4) because a partial saturation of the transfer process (uptake) from the plasma to the liver occurred at the higher dose (Fig. 4). It has been previously hy- pothesized that the saturability of the uptake process is due to the limited binding capacity on the hepatic intracellular macromolecules (Y and Z), which have been shown to be instrumental in the hepatobiliary transport of I (4,5). Nagashima et al. (15) suggested that saturable tissue binding can be responsible for the type of nonlinearity observed with this data. If the macromolecular binding sites for I become saturated at higher doses, the fraction of free drug in the liver should increase. Classically, only free drug can transfer across membranes. Therefore, I could then transfer back into plasma resulting in an increase in the apparent elim- ination @phase) half-life. The same result would occur if a very tight binding site for I was saturated and more dye was bound to a protein for which it normally has less affinity. The data from this study and from previous studies (3-6) support the hypothesis that the plasma nonlin- earity is due to the saturation of the hepatic protein binding sites for I.
The saturation of the liver at higher doses of I was reflected in the bile as well (Fig. 5). Takada et al. (4) reported that the excretion of I in bile was not saturable over the dose range of 11.2-66.7 mg/kg because the bile-to-liver concentration ratio remained unchanged. Therefore, the observed differences in the cumulative amount excreted and in the ex- cretion rate of I in the bile after 5.6- and 11.2-mg/kg doses must be a direct result of the saturation of the uptake process in the liver (Fig. 5). The same result occurred with the infusion data; i.e., the amount of I excreted per hour in the bile plateaued at 8.5 mghr at the two highest infusion rates, indicating a dependence on the amount of I present in the liver (Fig. 6). Overall, the excretion of I in bile was linear.
When liver injury was induced by carbon tetrachloride administration, a significant reduction in the rate of excretion of I in bile occurred (Table 11). The excretion of I in bile in carbon tetrachloride-treated rats de- creased to the extent that it is doubtful that a linear model would apply. The extent of parameter changes that would be calculated from the data may be a reflection of both the liver damage produced by the carbon tetrachloride treatment and the nonlinear behavior of I.
In summary, the disposition of I in the rat was characterized. The ap- parent first-order elimination kinetics of I in plasma were nonlinear be- cause the liver uptake process was saturable. This was evident from the increase in elimination half-life and disproportionate increase in area under the plasma concentration-time curve with increase in dose. The nature of the saturation was not determined in this study, but it does appear that it is not a Michaelis-Menten effect because I is neither me-
tabolized (2) nor does it demonstrate the appropriate plasma concen- tration-time profiles with ascending doses (i .e. , parallel slopes at con- centrations below K,,,). It is also not a facilitated transport effect because metabolic inhibitors do not influence the uptake of I by liver cells (4). The amount of I excreted in bile was dependent on the amount present in the liver reflecting the uptake saturability.
These findings could be applied to other nonmetabolizing organic anions and, with adaptations, to compounds that are metabolized. Fur- ther work regarding the nature of the saturation and regarding the dis- position in higher animals is suggested in order to completely evaluate the use of I as a general index for hepatobiliary function.
REFERENCES
(1) P. C. Hirom, P. Millburn, R. L. Smith, and R. T. Williams, Bio-
(2) T. H. Kim and S. K. Hong, Am. J . Physiol., 202,174 (1962). (3) R. B. Smith, L. McWhorter, and J. W. Triplett, Znt. J. Nucl. Med.
(4) K. Takada, Y. Mizobuchi, and S. Muranishi, Chem. Pharm. Bull.,
(5) K. Takada, M. Ueda, M. Ohno, and S. Muranishi, Chern. Pharm.
(6) K. Takada, S. Muranishi, and H. Sezaki, J. Pharmacokinet.
(7) S. K. Lin, A. A. Moss, R. Motson, and S. Riegelman, J. Pharrn.
(8) P. Chelvan, J. M. T. Hamilton-Miller, and J. N. Brumfit, Br. J.
(9) W. A. Colburn, P. C. Hirom, R. J. Parker, and P. Millburn, Drug
chem. J., 129,1071 (1972).
Biol., 7,37 (1980).
22,922 (1974).
Bull., 22,1477 (1974).
Biopharrn., 2,495 (1974).
Sci., 67,930 (1978).
Clin. Pharrnacol., 8,233 (1979).
Metab. Dispos., 1,100 (1979). (10) R. A. Zit0 and P. R. Reid, J. Clin. Pharrnacol., 21,100 (1981). (11) K. Stoeckel, P. J. McNamara, A. J. McLean, P. duSouich, D.
Lalka, and M. Gibaldi, J. Pharrnacokinet. Biopharm., 8,483 (1980). (12) C. M. Metzler, G. L. Elfring, and A. J. McEwen, “A Users Manual
for NONLIN and Associated Programs,” The Upjohn Co., Kalamazoo, Mich., 1974.
(13) D. Perrier, J. I. Ashley, and G. Levy, J. Pharrnacokinet. Bio- pharm., 1,231 (1973).
(14) F. Barbier and G. A. DeWeerdt, Clin Chim. Acta, 10, 549 (1964). ’ (15) R. Nagashima, G. Levy, and E. J. Sarcione, J. Pharm. Sci., 57, 1881 (1968).
ACKNOWLEDGMENTS
The authors thank Mrs. Judy Webster for typing this manuscript.
Picro toxin- Li ke Lac tones
JAMES D. MCCHESNEY*~ and ALAN F. WYCPALEK Received April 26,1982, from the Department of Medicinal Chemistry, School of Pharmacy, The University of Kansas, Lawrence, KS 66045. Mississippi, University, MS 38677.
Accepted for publication July 23,1982. *Present address: Department of Pharmacognosy, School of Pharmacy, University of
Abstract Preparation of some simple lactone analogues of picrotoxin and their biological evaluation is reported. Certain analogues possessed activity, but a t potencies insufficient to warrant further work.
Keyphrases 0 Picrotoxin-lactone analogue synthesis, CNS activity 0 Analoguesof picrotoxin, synthesis, CNS activity CNS activity-of picrotoxin lactone analogues, synthesis
Although picrotoxin [an equimolar mixture of picrotin (I) and picrotoxinin (1111 was used as early as the 18th century as a fish toxin and clinically in humans during the 1930s and 19409, only in the last decade has an under-
standing of its mode of action as a CNS stimulant begun to emerge. It was first recognized as a y-aminobutyric acid antagonist (l), but more recently its mechanism of an- tagonism has been shown to be inhibition of chloride ion permeability in neuronal preparations (2). Jarboe and coworkers (3) have examined aspects of the structure- activity relationship (SAR) of these materials and con- cluded that in order to possess activity, certain features were required: ( a ) a free bridgehead hydroxyl group, ( b ) a lactone ring connecting carbons 3 and 5 , and ( c ) an iso- propenyl group (which appears to govern potency).
0022-3549/83/ 1000- 113 1$0 1.0010 @ 1983, American Pharmaceutical Association
Journal of Pharmaceutical Sciences I 1131 Vol. 72, No. 10, October 1983