dose reduction in ct while maintaining diagnostic ... · iaea-tecdoc-1621 dose reduction in ct...
TRANSCRIPT
IAEA-TECDOC-1621
Dose Reduction in CT whileMaintaining Diagnostic Confidence:
A Feasibility/Demonstration Study

IAEA-TECDOC-1621
Dose Reduction in CT whileMaintaining Diagnostic Confidence:
A Feasibility/Demonstration Study

The originating Section of this publication in the IAEA was:
Radiation Safety and Monitoring Section International Atomic Energy Agency
Vienna International Centre PO Box 100
1400 Vienna, Austria
DOSE REDUCTION IN CT WHILE MAINTAINING DIAGNOSTIC CONFIDENCE: A FEASIBILITY/DEMONSTRATION STUDY,
IAEA, VIENNA, 2009 IAEA-TECDOC-1621
ISBN 978–92–0–108009–7 ISSN 1011-4289
© IAEA, 2009
Printed by the IAEA in Austria September 2009

FOREWORD
In the last 30–40 years, the pace of innovation in medical imaging has increased, starting with the introduction of computed tomography (CT) in the early 1970s. During the last decade, the rate of change has accelerated further, both in terms of continuing innovation and of its global application. The great majority of patient exposure now arises from practices that barely existed two decades ago, and the technological basis for their successful dissemination only began to flourish in the last decade or so. This evolution is evident in the technology on which this publication is based, CT scanning and its widespread application throughout the world. However, this advance is often achieved at the cost of a large radiation burden to the individual patient, and to the community when the technology is widely deployed. Much effort will be required to ensure that the undoubted benefit to be gained will not be achieved at the cost of an undue level of detriment.
For practitioners and regulators, it is evident that innovation has been driven by both the imaging industry and an increasing array of new applications validated in the clinical environment. It is evident that regulation, industrial standardization, safety procedures, and advice on best practice lag (inevitably) behind the industrial and clinical innovations. This TECDOC, reporting on a Coordinated Research Project (CRP), is designed to help both the medical community and equipment manufacturers/suppliers make their respective important contributions to dose reduction. In particular, it is possible that significant dose savings may be achieved in individual patients by tailoring the exposure they receive to their individual profile. It should be possible to achieve this without any loss in the level of confidence in the images produced, a possibility examined in this publication.
This CRP and TECDOC were developed within the International Atomic Energy Agency’s (IAEA) framework of statutory responsibility to establish standards for the protection of people against exposure to ionizing radiation and to provide for the worldwide application of these standards. The Fundamental Safety Principles and the International Basic Safety Standards for Protection against Ionizing Radiation (BSS) issued by the IAEA and co-sponsored by the Food and Agriculture Organization of the United Nations (FAO), the International Labour Organization (ILO), the World Health Organization (WHO), the Pan American Health Organization (PAHO) and the Nuclear Energy Agency (NEA), among others, require the radiation protection of patients undergoing medical exposures through justification of the procedures involved and through optimization. In keeping with its responsibility on the application of standards, the IAEA programme on Radiological Protection of Patients encourages the reduction of patient doses for radiological procedures (excluding radiotherapy). To facilitate this, it has issued specific advice on the application of the BSS in the field of radiology in Safety Report Series No. 39 and the three volumes on Radiation Protection with Newer Imaging Techniques recently produced. In addition, it has embarked on a series of CRPs, of which this is one, and which add to those already available in radiology, mammography and interventional radiology. This series of Reports is a further contribution to the resources provided by the IAEA in support of implementation of the BSS.
The International Action Plan for the Radiological Protection of Patients, approved by the General Conference of the IAEA in September 2002, requires that “The practice-specific documents under preparation should be finalized as guidance rather than regulations, and they should include input from professional bodies, from international organizations and from authorities with responsibility for radiation protection and medical care”. This TECDOC is prepared and issued in this spirit. The IAEA thanks J. Malone (Ireland) for his role in bringing the final draft to fruition. The IAEA officer responsible for this publication is M.M. Rehani of the Division of Radiation, Transport and Waste Safety.

EDITORIAL NOTE
The use of particular designations of countries or territories does not imply any judgement by the publisher, the IAEA, as to the legal status of such countries or territories, of their authorities and institutions or of the delimitation of their boundaries.
The mention of names of specific companies or products (whether or not indicated as registered) does not imply any intention to infringe proprietary rights, nor should it be construed as an endorsement or recommendation on the part of the IAEA.

CONTENTS
SUMMARY ............................................................................................................................... 1
1. INTRODUCTION ............................................................................................................ 2
1.1. General background ................................................................................................ 2 1.2. Increase in CT doses................................................................................................ 2 1.3. Dose reduction techniques....................................................................................... 3
1.3.1. Image quality and dose.............................................................................. 4 1.4. Scope and goals of the CRP .................................................................................... 5 1.5. Approach and layout ............................................................................................... 6
2. METHODOLOGY AND RELATED BACKGROUND ................................................. 6
2.1. Participating centres ................................................................................................ 6 2.1.1. Identification of hospitals.......................................................................... 6 2.1.2. CT systems ................................................................................................ 7 2.1.3. Selection of procedures ............................................................................. 7
2.2. Purpose and methods............................................................................................... 7 2.3. Dose measurements................................................................................................. 8 2.4. Noise measurements, indices and targets ................................................................ 8
2.4.1. Noise measurement in phantoms .............................................................. 8 2.4.2. Normalization of noise measurements and target noise............................ 9
2.5. Data collection......................................................................................................... 9 2.5.1. Patient data ................................................................................................ 9 2.5.2. Scanning and dose parameters ................................................................ 10 2.5.3. Noise measurements in patient scans...................................................... 10
2.6. Assessment of image quality................................................................................. 10 2.6.1. Test images with defined levels of noise added...................................... 11 2.6.2. Clinical images........................................................................................ 12
3. RESULTS OF SUBJECTIVE IMAGE QUALITY EVALUATION: IMPACT OF NOISE ON IMAGE QUALITY AND ITS ACCEPTABILITY.............................. 12
3.1. Test images with added noise: Perception of image quality in different centres .. 12 3.2. Acceptance of target noise levels in phase 2 study ............................................... 14 3.3. Discussion ............................................................................................................. 15
4. PHASE 1: BASELINE SITUATION – STANDARD DOSE........................................ 15
4.1. Results ................................................................................................................... 16 4.1.1. Patient demographics .............................................................................. 16 4.1.2. Dose data................................................................................................. 16 4.1.3. Noise-correlation with patient-factors: Abdomen................................... 17 4.1.4. Noise-correlation with patient-factors: Chest ......................................... 20 4.1.5. Noise-correlation with patient-factors: Head .......................................... 21
4.2. Discussion ............................................................................................................. 22 4.2.1. Comparison with diagnostic reference levels ......................................... 22 4.2.2. Noise and normalized noise measurements ............................................ 22

5. PHASE 2: DOSE ADAPTATION ................................................................................. 23
5.1. Target noise levels and exposure tables ................................................................ 23 5.1.1. Target noise determination...................................................................... 23 5.1.2. Exposure tables ....................................................................................... 24 5.1.3. Participation level and data presented..................................................... 26
5.2. Results ................................................................................................................... 26 5.2.1. Patient dose ............................................................................................. 26 5.2.2. Achievement of target noise levels after dose reduction......................... 27
5.3. Discussion ............................................................................................................. 29
6. CONCLUSIONS ............................................................................................................ 30
REFERENCES......................................................................................................................... 33
APPENDIX I. NOISE CHARACTERISTICS OF RECONSTRUCTION ALGORITHMS IN THE SCANNERS USED............................................ 39
APPENDIX II. DOSE AND NOISE CALCULATIONS..................................................... 41
APPENDIX III. ADDITIONAL DATA PHASE 1 AND PHASE 2...................................... 46
LIST OF CONTRIBUTORS AND REVIEWERS .................................................................. 55

1
SUMMARY
Recent surveys in large medical centres have found that computed tomography (CT) studies account for an ever increasing fraction of radiological dose; in some centres it now contributes 60 to 70% of patient dose. This has contributed a sense of urgency to the impetus for dose reduction strategies. In computed tomography, image quality depends upon the protocol used and the requirements of the reporting radiologist. In most examinations, tissue contrast, which is influenced by the noise in the image, is the most important parameter. This work attempts to provide advice on the achievement of desired target image noise levels without undue exposure of the patient.
Many factors affect the noise in a CT image including kVp, tube current, slice width, the reconstruction algorithm and the weight of the patient. It has been shown that it is possible to develop a relationship between noise in the image and the patient weight. The relationship can be used to adapt the noise in the image to a preselected value. Using this approach dose reductions were achieved while maintaining an image quality acceptable to the participating radiologists. When the project began, automatic exposure control had just started to become available from CT manufacturers. However, it was realized that many States have CT systems that do not have mAs modulation feature and these may remain in use.
The work was undertaken in two phases using nine CT scanners in six centres worldwide. In the first phase, protocols for patient dosimetry and image quality were established. Information was collected from 707 patients undergoing routine abdomen, chest or head CT examinations. In the second phase, similar information was collected on a smaller sample of patients with modified exposure protocols designed to achieve specific target noise levels according to weight of patients.
For abdominal CT analysis, the data showed a good correlation between image noise and patient weight. After normalization of the data, a simple linear relationship between image noise and patient weight was adopted. This relationship was used to calculate the dose adaptation necessary to achieve target noise levels for any size of patient. Phase 2 showed that each centre was able to achieve the target noise values leading, in some cases, to significant decreases in patient doses.
For chest CT, there was no correlation between image noise and patient weight. This was possibly due to instabilities in the method of measuring image noise. It was felt appropriate to adopt a strategy, similar to that used for abdomen, to adapt noise based on patient weight. Measurements in phase 2 again showed that each centre was able to achieve the target noise values.
For abdominal CT, dose reduction varied from about 25 to 62%; for chest CT, from 12 to 79% in individual cases. The correlation between noise and head size/diameter was low; thus, no attempt was made to reduce dose on this basis.
The work has shown that there is scope to adapt patient image quality and dose. For all the States involved in this work the average patient doses were below EU Diagnostic Reference Levels (DRLs) for CT of the abdomen and chest. For CT of the head, 2 countries had values well over the European DRLs. The image noise was low for several States, and it was still possible to reduce the patient dose even further. This indicates the need for population-specific diagnostic reference levels. In all cases, the dose reductions were achieved without reducing image quality below a level that was regarded as acceptable by the participating radiologists.

2
1. INTRODUCTION
1.1. GENERAL BACKGROUND
When Godfrey Hounsfield developed the first clinical computed tomography (CT) scanner in 1969 [1], a new era of cross-sectional imaging of the human body was initiated. The use of CT examinations has increased rapidly since then. Recent surveys in large medical centres have found that CT studies now often account for 25% of all examinations and 60 to 70% of the patient dose received from diagnostic radiology. In addition, patient surveys reveal a wide range of patient doses for the same examination.
The purpose of this publication is to address some of the requirements of the Fundamental Safety Principles [2] and the International Basic Safety Standards for Protection against Ionizing Radiation and for the Safety of Radiation Sources (BSS) [3] issued by the IAEA. It particularly focuses on optimization of radiation protection of the patient within the type of framework envisaged in the supporting Safety Report Series No. 39, on Applying Radiation Safety Standards in Diagnostic Radiology and Interventional Procedures using X rays [4]. In this publication the results of one of a number of multinational coordinated research projects (CRP) [5] are presented. The purpose of the project was to establish if a simple approach to adjusting exposure for patient size could be devised and be effective without loss of diagnostic confidence or acceptability. If such could be achieved on a widespread basis, it would offer considerable potential for effective dose reduction and optimization. The objective was to create a feasibility/demonstration study as detailed below, using patient data rather than data from phantoms, and to do so in a small number of hospitals, essentially a convenience sample, but with as varied a geographic spread as possible.
According to publications issued by the IAEA in recent years, the objective of application of the Basic Safety Standards in diagnostic radiology is to obtain the requested diagnostic information with the minimum patient exposure within prevailing resource limitations [3–6].
The IAEA, through an earlier coordinated research project (CRP), had investigated the potential for patient dose reduction as part of the optimization of radiological protection of the patient [7]. That publication covered dose reduction in radiography but it only covered situation analysis of patient doses and equipment quality control in CT. It did not deal with dose reduction. Therefore, another CRP was started in 2002 with the objective of patient dose management while maintaining diagnostic confidence. It was felt that the greatest potential existed in the area of adjustment of exposure for patient size.
When this project began, automatic exposure control (AEC) had just started to become available from CT manufacturers. However, it was realized that many States have CT systems without AEC and such systems may remain in use for a decade or more. With improved technology, permitting shorter and shorter scanning times, the increase in use has been faster than the decrease in dose per examination, and change in technology has been faster than effective implementation of dose management strategies.
1.2. INCREASE IN CT DOSES
There is now widespread concern about the increase in CT doses. Several different factors contribute to this. Figure 1 shows the worldwide sales of CT scanners has more than doubled since 1998, and is predicted to continue increasing at the same pace. The trend of increasing use of CT scanning has been and is being documented by international organizations, national bodies and in individual studies. Information is available from the NEXT study in the USA [8], UNSCEAR [9], the EU [10], the NRPB/HPA in the UK [11–15], and from other

3
sources [16-22]. The overwhelming thrust of the data is that the number of installations, the frequency and type of examinations, and the dose per examination are all increasing throughout the world, to the extent that the CT dose now accounts for 60 to 70% of the patient dose in some US tertiary referral centres.
FIG. 1. Worldwide CT sales.
As with other areas of radiology, the concept of diagnostic reference levels (DRLs) is widely recommended for use with CT [23]. The DRL is often set as the third quartile value of the distribution of the dose descriptors observed in patient dose surveys. They are intended to help in the optimization of patient doses, by indicating a level which should not generally have to be exceeded to obtain acceptable image quality. Problems arise when reference values do not easily transfer from one generation of CT examinations to the next. Likewise there have been particular problems with paediatric CT since adult protocols were commonly used in this area and are now being phased out for obvious reasons [24–26].
1.3. DOSE REDUCTION TECHNIQUES
The use of CT is, for the purpose of this project, assumed to be generically justified, and justified in each individual case. Where this may not be so there is considerable room for effective dose reduction through elimination of unjustified examinations [27]. Where the examinations are justified, the main opportunity for dose saving arises from optimization of examinations and techniques. The principle of optimization should be applied on an individual basis so as to achieve image quality sufficient to provide diagnosis with the minimum dose to the patient. Intuition suggests that it would be reasonable to expect to use more radiation to get a satisfactory image with larger and less with smaller patients and vice versa. This CRP is to explore this hypothesis and its application to optimization.
A recent review of dose reduction in CT imaging [28] points out that dose reduction should not be at the cost of poorer imaging, so that ‘appropriate’ imaging parameters might be a better term. In addition, in recent years many papers have shown that adequate diagnostic information can be obtained at lower doses [29–35]. Increasing dose in CT results in images with less noise and fewer streak artefacts, although not necessarily with greater diagnostic information. Thus, in view of the major impact of CT on doses from medical radiation, there

4
has been increasing concern in recent years over the need to minimize doses from CT, particularly since it is believed that image quality sometimes exceeds the clinical requirements for adequate diagnosis. ICRP noted and reiterated that technical and clinical developments in CT have not led to reductions in patient dose per examination, and that there was a clear need for optimization of doses [36, 37]. ICRP recommended specific protocols with lower exposure factors (mAs) for paediatric examinations and stated that anatomically based automatic exposure control would be a helpful improvement in CT equipment for managing dose.
A recent Japanese survey shows an increasing use of dose reduction techniques in routine clinical practice, particularly the use of automatic exposure control techniques [38]. Scanning techniques that have been evaluated for dose reduction include those that can be modified based on patient size and study indications such as tube current, gantry rotation time, pitch, tube potential, scan coverage, radiographic shields, automatic exposure control techniques, and noise reduction filters. Vendors have also developed several techniques for dose reduction, which include improved detector geometry, automatic exposure control, noise reduction filters, metal artefacts reduction algorithms, beam shaping filters, projection adaptive space filters, and pre-patient beam collimators.
Many traditional CT systems used the same exposure settings for each scan type, for example, in every abdominal scan, regardless of patient size. At its extreme the same settings were used for both adult and paediatric scans. Where this is the case more radiation than is necessary to provide an acceptable image is being used. In the last few years, all manufacturers have incorporated automated patient size, longitudinal and rotational automatic exposure control (AEC) systems to deal with this issue [39]. These techniques have demonstrated dose reductions of typically 15–65% [40–42]. They should be used wisely, with a thorough understanding of their principles.
1.3.1. Image quality and dose
In a CT scanner, two of the most commonly used image quality parameters are spatial resolution and low contrast resolution. Spatial resolution is, in practice, determined almost entirely by the number of rays in each projection, and the spacing of the detectors. In the absence of artefacts, low contrast resolution is determined solely by noise. However, noise depends on most aspects of the CT image in non-linear ways [43]. Image noise is affected by mA, scan time, kVp, patient size, pitch in multislice CT, slice thickness, and reconstruction algorithm. Of these, the first five affect both image noise and patient dose; the last two affect only noise. The only parameter that is not in the control of the scanning staff is the patient size or weight.
That patient size is an important determinant of noise has been known for some time, and attempts have been made to modify scan parameters to reduce the variation of noise with size [44–48]. One extreme of size variation is the paediatric patient; in the USA, the FDA issued a warning in 2001 concerning the radiation exposure of children from CT [49].
An extensive literature is available on the assessment of noise in images and how it might be influenced by patient size and technical imaging factors [35, 50–53]. A wide range of both theoretical and practical phantom based studies have been performed. They are generally predicated on the possibility of producing dose savings as a function of patient size, or other imaging parameters such as kVp, mAs or image noise level. Some of the studies have had useful predictive value. For example, Huda et al. calculated that a factor of 100 difference in mAs is required to give the same detector exposure for patients at the extremes of the weight range 10 kg and 120 kg [47]. Despite the extent of the literature, relatively few patient studies

5
are available [54], although studies in which simulated noise has been added to real clinical images have been performed, and are also reported here [55]. In addition some recent studies have attempted to adjust dose with a body weight protocol [56]. The focus of this study is to obtain some patient (as opposed to phantom) data on size, noise, image quality and dose issues.
1.4. SCOPE AND GOALS OF THE CRP
From the above, it is clear that many studies are needed to deal comprehensively with the outstanding CT problems in the areas of patient dose, image quality, noise and the relationships between them. This CRP will make a modest contribution to the area; but by doing so within a practical timeframe, it has had to accept limitations in its scope and methodology. Thus, while the countries participating and equipment involved have been international, they have, in practice, been selected by pragmatic and convenience considerations, rather than random sampling. In addition, it was felt that the project should focus on patients rather than phantoms, and especially on weight/size as an important variable that may be used to minimize dose when setting exposure factors. This was with a view to helping balance the fact that most published work on patient specific scan parameters has been based on phantom studies for specific CT scanners.
In computed tomography the image quality depends upon the imaging protocol and the requirements of the reporting radiologist for a particular examination. In most examinations tissue contrast, which is influenced by the noise in the image, is the most important parameter. This work attempts to provide advice on the achievement of the desired target noise level without undue radiation exposure of the patient. The work proceeded in two phases using nine CT scanners in six hospital centres worldwide. In the first phase, detailed protocol and patient dosimetry and image quality information was collected from 705 patients undergoing routine abdomen, chest or head CT examinations. In the second phase, the same information was collected with modified protocols on a smaller sample of patients with modified protocols designed to achieve specific target noise levels. This work was performed with a variety of CT scanners and a range of protocols.
Ultimately, the objective has been to determine sets of exposure factors that are applicable for patients of different body weight, rather than depending upon the current approach of using default values based upon standard sized patients. It is expected this will reduce the dose to the individual patient while maintaining diagnostic confidence.
Specific goals within the framework of these objectives included:
• Identify a pragmatic approach to noise measurement, and define target values for image noise.
• Study the differences in image quality perceived by radiologists in different countries due to different noise levels or patient body weights.
• Determine patient doses in the various countries and compare them with published diagnostic reference levels.
• Determine the influence of patient weight and technical factors on image noise, image quality.
• Identify patient size parameters that may be used to help optimize exposure factors. • Derive a methodology and exposure tables for individualizing patient exposure without
reducing diagnostic confidence.

6
This publication outlines the methods used and it is hoped that the results, while incomplete, will be sufficient to encourage professionals willing to undertake work on patient dose management in CT to adopt similar approaches themselves.
1.5. APPROACH AND LAYOUT
To achieve these objectives the principal steps were:
• Identification of the participating centres and the prerequisites in terms of equipment, procedures and personnel for joining the study (Section 2).
• Clarification of a theoretical and practical basis for achieving a predefined image noise, independent of the scanner parameters, and the practical steps that lead to achieving it (Section 2 and Appendix II).
• Evaluation of subjective image quality data using both clinical studies and test images to identify what radiologists find acceptable (Section 3).
• Phase 1: A baseline study, which describes the relationship between radiation dose, noise and patient-factors for abdomen, chest and head examinations (Section 4).
• Phase 2: A dose adaptation study, which describes the chosen target noise levels and the exposure tables developed to achieve them, how they were employed, and their effectiveness in achieving dose reduction (Section 5).
• Conclusions, particularly those that will help maintain image quality while reducing dose in clinical practice (Section 6).
2. METHODOLOGY AND RELATED BACKGROUND
This Section summarizes the list of participating centres, the equipment and methodology employed and some theoretical background.
2.1. PARTICIPATING CENTRES
2.1.1. Identification of hospitals
The study employed a convenience, as opposed to a randomly selected, sample. This limitation was accepted because of practical constraints on the time and resources available to the project. Within this limitation, it was important that the participating centres:
• be experienced in clinical CT work, or have access to institutions so involved; • have a capacity for dosimetry and image quality analysis, or have access to a team,
consisting of both radiologists and physicists, with such capacity; • provide as wide a geographic distribution as possible.
The first two requirements were essential either to develop methodology for patient dose optimization linked to image quality, or to provide evidence that might have potential for widespread application. It was decided to proceed once six institutions meeting these criteria had committed. The regions involved included North America, Western Europe, Eastern Europe and Asia. The institutions involved are listed in Table 1.

7
TABLE 1. PARTICIPATING HOSPITALS
Participating hospitals
Vancouver Hospital, Vancouver, Canada Konstantopoulio Agia Olga Hospital, Athens, Greece All India Institute of Medical Sciences, New Delhi, India Nofer Institute of Occupational Medicine, Lodz, Poland King Chulalongkorn Memorial Hospital, Bangkok, Thailand South Manchester University Hospital NHS Trust, Manchester, United Kingdom
2.1.2. CT systems
The CT scanners chosen for inclusion were all either single slice spiral or multidetector-row systems manufactured in 1997 or later. In some cases, more than one unit per participating centre was involved as some of the centres, with more than one scanner, performed specific examinations on particular scanners. Thus, from the six institutions, there were nine CT units involving eight different models, five of which were spiral multidetector-row systems and four single spiral machines. The different models involved are listed in Table 2.
TABLE 2. CT SCANNERS INVOLVED IN THE CRP
Country CT scanner model
Canada Siemens Sensation 16 slice helical (2003)
GE Lightspeed Ultra 8 slice helical (2000)
Greece GE Prospeed single helical (1997)
India Siemens Volume Zoom 4 slice helical (2001)
Siemens Somatom SP single slice helical (1997)
Poland Picker PQ 5000 single slice helical (1997)
Thailand Siemens Sensation 4 slice helical (2003)
Siemens Somatom Plus 4 single slice (1997)
United Kingdom Siemens Sensation 16 slice helical (2003)
2.1.3. Selection of procedures
The CT examinations included the more common examinations in most radiology departments. In addition, it was desirable to have a variation in the size of the region imaged that could influence the image quality or dose for the examination. Based on these requirements, routine adult and paediatric examinations of the head, chest and abdomen were identified as the main examinations for the study.
2.2. PURPOSE AND METHODS
The work is to explore the hypothesis that a thinner patient would need less radiation to get an appropriate CT image than a thicker patient.
8
The CRP was designed to incorporate different brands of CTs in different countries with a large range of patient sizes.
The noise in the image was taken as an index of the image quality. The preference of image quality by different radiologists being different, the noise provided information on this and also a tool to harmonize. The ‘optimized’ noise with regard to dose optimization was called the ‘target’ noise. This work attempts to provide advice on the achievement of the desired target noise level without undue radiation exposure of the patient. The work proceeded in two phases: in phase 1, details were collected from 707 patients undergoing routine CT examinations. In phase 2, the same information was collected on a smaller sample of patients with modified protocols designed to achieve specific target noise levels.
In addition, a subjective image quality rating, graded on a scale of 1 to 5, was performed by two experienced radiologists in each country on clinical images. This was also done on computer generated images on which noise was added.
2.3. DOSE MEASUREMENTS
Two approaches were taken, namely CTDI measurement and use of ImPACT database. Wherever possible, the standard CT dosimetry methodology was employed [57, Appendix II]. In this case, the CTDI was measured in air for all the scanners using a calibrated pencil chamber. The technical parameters were: 120 kVp, single axial 5 mm slice, 100 mAs. Where direct measurement wasn’t practical, the data for the corresponding scanner from the ImPACT web site was used [58]. This provides dose information for practically every routinely used CT scanner; confidence in the information provided was enhanced by the finding that all of the measurements actually made were within 10% of the ImPACT values.
To allow comparison between scanners, CTDI indices were either estimated from phantom measurements and the kVp/mAs settings of the scanner, or taken from the CT scanner console together with the other individual patient technical parameters. Dose values obtained were compared with the available EU [59] and UK [60] reference values or Diagnostic Reference Levels (DRLs) [61].
2.4. NOISE MEASUREMENTS, INDICES AND TARGETS
The term ‘noise’ is used in a number of different senses throughout the project. Noise measurements were made on the relatively simple intuitive basis used in quality control protocols as described in Section 2.3.1. To facilitate intercomparison between centres and scanners, systems of normalization of noise measurements were employed as described in Section 2.3.2. Target Noise Levels were set as objectives to be achieved in phase 2, and are also described in Section 2.3.2. Finally, the ‘noise’ levels in clinical images were subjectively rated by the participating radiologists in each centre as detailed in Sections 2.4.3 and 2.5. Additional information about various aspects of the noise studies is provided in Appendix II.
2.4.1. Noise measurement in phantoms
Image noise measured in homogenous phantoms depends on mAs, kVp, reconstruction algorithm (filter kernel FK), scan mode (e.g. helical interpolation, non-helical), slice collimation (SC) and reconstructed slice width (SW), and factors specific to both the machine and the phantom. These factors are further discussed in Appendix II. In patients, there will also be a dependence on patient properties that can be described by a function f(P).

9
In phantom measurements noise was expressed as the standard deviation (SD) of CT numbers (Hounsfield units, HU) that is automatically displayed together with mean of CT numbers and (usually) area, in a homogenous ROI of approximately 3 cm2 near the centre of the phantom. A dedicated head-equivalent 16 cm PMMA phantom or 20 cm water phantom was used and was scanned 5 times. The noise was normalized to the value for 100 mAs, 5 mm slice width, 120 kVp and standard reconstruction kernel, and the mean value was taken of the CT number SD, calculated for each of the five images. Measurements in patients are described in Section 2.4.3.
2.4.2. Normalization of noise measurements and target noise
To allow intercomparisons between machines and centres, the reference set of machine factors (120 kV, 100 mAs, 5 mm slice thickness, standard reconstruction kernel) was employed and a ‘normalized noise’ metric was used, primarily in phase 1. The normalized noise for any set of conditions used in the clinical environment was taken as the ratio of the noise for those conditions to the noise in the normalized conditions. An arbitrarily selected ‘normalized noise’ value of 1.5 was set for a patient weight of 70 kg (see also Appendix II).
Once the noise is known, the possibility arises of being able to identify the influence any particular patient property, f(P), such as weight or diameter, can have on noise levels. This can be done by observing the variation in noise with that property and the exposure values used.
For the purpose of this study, the specific set of image noise levels that are identified as desirable are referred to as ‘target noise levels’. These are, in practice, levels that are considered acceptable in a defined situation. Such targets could, for example be set at a constant level, independent of patient size. Alternatively they might be made dependent on patient weight, with more target noise for large and less for small patients, using the f(P) relationship mentioned above, which is the approach that was taken in this project. It is also possible to envisage that they might be changed according to the clinical indications or to suit the preferences of a radiologist. Once the level of noise in an image as a function of patient characteristics is known, it is possible to derive the dose or mAs needed to yield that noise level for a particular patient.
2.5. DATA COLLECTION
2.5.1. Patient data
The participating centres were asked to supply data on approximately 50 patients for each type of procedure, i.e. head, chest and abdomen scans. The data collected included height, weight, gender, and age. The adult patient sample (chest and abdomen) was divided into 7 weight categories as presented in Table 3. Each centre selected five contiguous categories (depending on the average weight of their population) and provided data for about ten patients per category in phase 1 and 5 per category in phase 2. Canada and the UK had some problems participating in phase 2 as noted in Sections 3 and 5 below.

10
TABLE 3. PATIENT WEIGHT CATEGORIES
1 < 10 kg
2 10–25 kg
3 26–45 kg
4 46–65 kg
5 66–85 kg
6 86–105 kg
7 > 105 kg
Patient dimensions (PA and lateral (LAT) diameters) were measured at the following levels:
• Head: the basal ganglia; • Chest: the pulmonary hilum; • Abdomen: the liver hilum.
2.5.2. Scanning and dose parameters
The routine technical and dosimetric parameters were recorded or set as appropriate and are detailed in Sections 4 and 5. In particular the weighted CT dose index (CTDIw) for single slice CT systems; volume CT dose index (CTDIvol) for multidetector-row systems; and dose-length product (DLP) for the scan were recorded or calculated. Dose modulation systems were inactivated to allow comparison with systems that did not have such facilities.
Chest and abdomen examinations included only contrast-enhanced scans (portal venous phase for abdomen), except for Canada, where complete data sets for non-enhanced chest CT were included as well. Non-contrast enhanced scans were included for head exams. Patients with gross pathology or studies that required special scanning parameters for any reason were excluded.
2.5.3. Noise measurements in patient scans
Noise measurements were performed at the levels at which diameters were assessed (Section 2.4.1 above), again as the SD of the pixel Hounsfield numbers displayed in the chosen region of interest (ROI). The ROI was placed in a 2 to 3 cm2 homogenous area within the structure of interest; artefacts, lesions, vascular structures in the liver, and calcified plaques in the aorta were carefully excluded. Several images were generally available at each anatomic level; in such cases those with the least structural inhomogeneity within the chosen ROI were selected for use. Homogeneity within the ROI was checked using a window width of 20 HU. Examinations in which noise measurements were impossible due to the absence of a homogenous ROI were excluded. At each anatomic level three noise measurements were performed on each of three separate images. The median of the 9 measurements was used as the final noise value. The average values of CT numbers in the ROIs were also recorded. The Canadian group undertook additional investigations, including noise levels at other locations (aortic arch and liver in chest CT). These are noted in Appendix III.
2.6. ASSESSMENT OF IMAGE QUALITY
In addition to measuring noise in the images of patients participating in phase 1 and phase 2 of the project, two types of subjective assessment image quality were undertaken by the

11
radiologists in the centres participating in the project. The first involved a small number of clinical images to which known incremented amounts of noise was added. This additional subjective image quality assessment was done on abdomen, chest and pelvis images. The second involved the clinical chest and abdominal images encountered on a day to day basis in phase 2 of the investigation.
2.6.1. Test images with defined levels of noise added
A computer-generated set of images was used to assess observer response and interobserver variability in respect of image noise, contrast enhancement and overall image quality. For this purpose variable amounts of noise were artificially incorporated in one image each of an abdominal CT (at the level of liver hilum), a chest CT (at the level of tracheal bifurcation), and a pelvic CT (at the level of actetabulum). This was achieved by simulation using proprietary software to add noise to the images (Philips Medical Systems). This technique generated pseudo low dose images from those acquired at higher doses and had already been validated [35]. Table 4 summarizes mAs levels simulated.
TABLE 4. SIMULATED MAS LEVELS FOR IMAGES OF THE CHEST, ABDOMEN AND PELVIS
Chest (mAs) Abdomen (mAs) Pelvis (mAs)
1 2 1
4 9 16
12 17 31
24 35 45
31 51 61
45 67 76
61 83 91
76 99 106
91 115 122
104 133 -
These images were randomized and reviewed by two radiologists at each centre, blinded to the simulated dose levels. The radiologists were asked to assess for image noise, contrast enhancement, and overall quality. Each image quality parameter was graded on a 5 point scale as detailed in Table 5.
TABLE 5. SCORING SYSTEM FOR IMAGE QUALITY
Image quality Score
Unacceptable 1
Suboptimal 2
Acceptable 3
High quality 4
Too high quality (too little noise)
5

12
2.6.2. Clinical images
At each centre, chest and abdominal clinical images from phase 2 were also assessed by radiologists for noise, contrast and overall image quality. The scoring system detailed in Table 5 above was also used for this purpose.
3. RESULTS OF SUBJECTIVE IMAGE QUALITY EVALUATION: IMPACT OF NOISE ON IMAGE QUALITY AND ITS ACCEPTABILITY
3.1. TEST IMAGES WITH ADDED NOISE: PERCEPTION OF IMAGE QUALITY IN DIFFERENT CENTRES
The results of the evaluation of the chest, abdomen and pelvis CT test images are shown in Figures 2–4. The most striking and reassuring finding is the gradual increase in image quality as the pseudo mAs increases from the very low values to a threshold value, different for chest and abdomen. This occurred in all three systems examined and is evident despite the considerable interobserver variability noted. The image quality scores did not improve at mAs values above 40 for chests and, a somewhat higher value of 80 for abdomen and pelvis. The three figures suggest little gain in image quality once these threshold currents are exceeded.
Each of the figures demonstrates a wide range of interobserver/ intercountry variation. A measure of this is the ratio of the maximum to the minimum image quality score for each country and scan type illustrated in Table 6. The radiologists from Thailand were most consistent and those from Poland, Greece and India least consistent in their rating. Those from the UK and Canada lay between these extremes. They all used their routine viewing conditions, which could be different in different countries.
TABLE 6. RATIO OF MAXIMUM TO MINIMUM IMAGE QUALITY SCORE FOR DIFFERENT SCAN TYPES IN DIFFERENT COUNTRIES
Scan Type Canada Greece India Poland Thailand UK
Chest 3 4.5 5 1.6 3.5
Abdomen 4 5 4.5 5 2.2 1.4
Pelvis 3 5 4 5 1 1.4
There was also, as is evident from the figures, a variation in image quality scores between countries at similar pseudo mAs levels. Test images with higher mAs values were scored much higher by India, Greece and Poland than by other countries. Very noisy low mAs images were scored low by Greece and India.
Importantly, there were also some differences between radiologists with regard to the acceptable image noise in the test images. Multiple factors including training could account for these differences, which were somewhat greater than might have been expected.

13
0
1
2
3
4
5
6
0 20 40 60 80 100 120
Pseudo mAs
Imag
e Q
ualit
y (N
oise
) Sco
re
CanadaIndiaPolandThailandUK
CHEST
FIG. 2. Image quality scores for chest CT images for radiologists from different countries.
FIG. 3. Image quality scores for pelvis CT images for radiologists from different countries.

14
FIG. 4. Image quality scores for abdominal CT images for radiologists from different countries.
3.2. ACCEPTANCE OF TARGET NOISE LEVELS IN PHASE 2 STUDY
Subjective assessment of image quality was conducted for the clinical phase 2 for CT examinations of chest and abdomen. The images were acquired at the target noise levels established based on the phase 1 study. Greece, Poland and Thailand participated. The results, presented in Tables 7 and 8 show that image noise, contrast and overall quality scores achieved were in excess of that required for acceptability (i.e. score 3 as defined in Table 5).
Interestingly, there was no statistically significant difference between subjective assessment scores for all three indices (Image noise, contrast and overall quality) (p= 0.06 - 0.9). This could be interpreted as indicating that the observers did not distinguish sharply between the three indices, which are unlikely to have been identical. This may reflect the subjective nature of the tests involved or a training issue among the observers.
TABLE 7. SUBJECTIVE ASSESSMENT OF IMAGE NOISE, CONTRAST AND OVERALL QUALITY FOR ABDOMINAL CT
Countries Image noise Contrast Overall quality
Greece 3.8±0.7 4.0±0.6 3.9±0.6
Thailand 3.8±0.6 3.9±0.3 4.0±0.4
Poland 4.8±0.4 4.9±0.4 4.9±0.2

15
TABLE 8. SUBJECTIVE ASSESSMENT OF IMAGE NOISE, CONTRAST AND OVERALL QUALITY FOR CHEST CT
Countries Image noise Contrast Overall quality
Greece 3.0±0.6 3.4±0.5 3.2±0.5
Thailand 3.1±0.5 2.9±0.7 3.1±0.6
Poland 4.7±0.5 4.9±0.2 4.9±0.2
Only the participating centres in India and Thailand fully adopted the target noise levels established. The centres in Greece and Poland modified their scanning parameters to the extent possible. Limited abdomen data was available from Canada and no phase 2 data were available from the United Kingdom.
3.3. DISCUSSION
Despite substantial interobserver variability there is a clear increase in the indices of image quality with dose up to a threshold value, beyond which no discernable gain is achieved for further increases in dose. This is as one would expect. Variability between image quality scores for some centres and some radiologists suggests differences in levels of tolerable noise and radiation dose. This variation may have been caused by lack of appropriate perception of noise or different individual preferences for acceptable image noise. These findings support the belief that there is considerable variation in the level of acceptance of image noise between radiologists and throughout the world.
Noise simulation studies, involving a large number of images, would help determine the highest tolerable noise level or lowest acceptable doses for a given patient size, study region, clinical indication etc. However, the relatively small number of noise simulated images in this pilot study precludes such conclusions. Our study demonstrates that dose adaptation based on individual patient size, clinical indication, and study region must be preceded by development of consensus about acceptability and subjective perception of image noise among the radiologist staff. Review of test images will help radiologists and medical physicists determine the level of dose adaptation that will yield acceptable images in a given centre.
Radiologists from the participating centres graded all the indices of image quality for reduced dose chest and abdominal images as acceptable. These results show that dose can be adapted to acquire acceptable quality CT examinations with desired target noise levels. In most cases, radiologists gave similar scores for image noise, contrast, and overall quality. It is felt this may reflect a lack of discrimination between the various endpoints involved or inadequate training.
There are several other limitations in the dose adaptation phase of this study particularly the reduced number of patients. In addition, it provides an illustration of the well recognized difficulties of image quality assessment as well as the notoriously difficult task of training observers to work reproducibly with even simple metrics of image quality.
4. PHASE 1: BASELINE SITUATION – STANDARD DOSE
This Section presents and discusses the data collected for the CT scanning protocols used on a day to day basis in each centre. In addition it collects and presents some of the results of baseline patient noise measurements and examines them as a function of patient size.

16
4.1. RESULTS
4.1.1. Patient demographics
Data were collected for 707 patients undergoing routine head, chest or abdomen CT examination. This included 174 patients (108 adults, 66 children) in the head category, 240 in the chest category and 293 in the abdomen category. The demographic data is shown in Table 9.
TABLE 9. BASIC DEMOGRAPHIC DATA OF PATIENT SAMPLE
Sample Head CT Chest CT Abdomen CT
Total number 174 240 293
Male 51% 63% 51%
Female 49% 37% 49%
Mean age (years) in whole sample 52 54 52
Mean weight (kg) in whole sample 65 65 65
4.1.2. Dose data
Tables 10, 11, 12 and 13 show the most important technical factors used and mean doses recorded in routine adult head, paediatric head, chest and abdomen scans respectively. Except for the head, the CTDIvol and DLP values in all participating centres were below the European and UK Diagnostic Reference Levels (DRLs) in all examination types. For the head, the dose in the Greek and Indian centres substantially exceeded these DRLs.
TABLE 10. HEAD CT IN ADULT PATIENTS: TECHNICAL FACTORS AND DOSE DATA (MEAN VALUES)
* SSCT ** MSCT
TABLE 11. HEAD CT IN PAEDIATRIC PATIENTS: MAIN TECHNICAL FACTORS AND DOSE DATA (MEAN VALUES)
Country Sample kVp mAs Slice (mm) CTDIvol (mGy) DLP (mGy cm)
India 50 140 272 8 91 -
Thailand 16 120 176 6 37.5 349
Country Sample kVp mAs Slice (mm) CTDIvol (mGy) DLP (mGy cm)
UK 10 120 270 4.5/9 51 720
Poland 52 120 250 5/10 51 527
Thailand 36 120 260 7.5 43 386
Greece 10 120 562 3/10 142 -
UK DRLs Posterior fossa Cerebrum
65*/100** 55*/65**
760*/930**
EU DRLs 60 1050

17
TABLE 12. CHEST CT: MAIN TECHNICAL FACTORS AND DOSE DATA (MEAN VALUES)
Country Sample kVp mAs Slice (mm) Pitch CTDIvol (mGy) DLP (mGy cm)
Canada 43 120 268 2 1 8.8 294
Greece 50 120 180 7 1 19.5 540
India 50 140 90 2.5 1.5 12.3 355
Poland 38 120 225 9.5 1.5 14.2 447
Thailand 32 120 90 8 1.5 7.2 247
UK 27 120 93 5 1 6.4 203
UK DRLs 10*/13** 430*/580**
EU DRLs 22 650 * SSCT ** MSCT
TABLE 13. ABDOMEN CT: MAIN TECHNICAL FACTORS AND DOSE DATA (MEAN VALUES)
UK DRLs 13*/14** 460*/470**
EU DRLs 24 1500 * SSCT **MSCT
4.1.3. Noise-correlation with patient-factors: Abdomen
The ranges of patient weights, slice thickness, set kVp, mAs, and resultant dose and noise values (HU) for abdominal scans are shown in Table 14 for the patients who were entered into the study.
Country Sample kVp mAs Slice (mm) Pitch CTDIvol (mGy) DLP (mGy cm)
Canada 43 120 267 5 1.6 14.4 696
Greece 54 120 180 7 1 19.5 740
India 51 120 133 2.5 1.25 12.6 459
Poland 54 120 250 9 1.5 15.8 550
Thailand 66 120 120 8 1.5 9.5 402
UK 25 120 122 5 1 9.5 446

18
TABLE 14. PROTOCOLS USED FOR THE ABDOMEN CT DOSE AND NOISE VALUES
Country Filter SW Weight Noise CTDIvol kVp mAs
Canada STD 5 min 35 8 9.7 120 200
median 72.7 16 12.8 120 250
max 127 29 24.3 120 380
Greece STND 7 min 40 6.3 16.6 120 160
median 80 12 20.8 120 200
max 129 26.8 20.8 120 200
India B30f 5 min 12 2 8.5 120 130
median 52 8.1 12.3 120 140
max 85 16 13.2 120 140
Poland STND 11.5 min 40 5.9 15.8 120 250
median 70 12.1 15.8 120 250
max 108 18.4 15.8 120 250
Thailand B30f 5 min 23 6.8 7.6 120 100
median 56.5 10.3 9.1 120 120
max 92 20.4 13.1 120 140
UK B40f 5 min 27 7.7 8.4 120 108
median 68 14.1 9.1 120 116
max 90 27.5 15.6 120 200
The variation of noise and normalized noise (relative to the standardized conditions 120kV, 100mAs, 5 mm slice thickness, standard reconstruction kernel, see Section 2.3.2) with weight is also shown graphically in Figures 5 and 6. The noise values are from the clinically reported images and illustrate the large overall range of noise levels (from 2 HU minimum in India to 29 HU maximum in Canada). While there is a clear increase in noise with patient weight in all countries, it can also be seen that the noise for a given weight varies by a factor of two between countries. This is partly due to the preference of the radiologists involved, but is also because no account has been taken of the different slice widths, reconstruction algorithms and doses used. Normalizing the noise as described in the methods reduced the spread of the data (Fig. 6). Linear regression of the data gives a correlation coefficient of 0.696.

19
FIG. 5. Noise in abdomen CT as a function of body weight.
FIG. 6. Normalized noise in abdomen CT as a function of body weight.

20
Much additional data was gathered and additional analysis undertaken in Appendix III. For the purpose of the present study, it may be summarized by stating the best correlation between normalized noise and patient size was obtained using effective patient diameters and a power function. However, determination of the AP and lateral diameters (which must be known to calculate effective diameter) may, in practice, be more logistically disruptive to the running of a department than weighing the patient. It was therefore decided to use the latter approach due to the ease with which weight can be measured. Likewise, it was decided that there was merit in using the acceptable linear correlation available rather than the more difficult to visualize/calculate power function. On this basis, the final correlation curve for noise estimation used in later parts of this study takes the form:
Normalized noise σ* = 0.019 × body weight + 0.l5 (1)
4.1.4. Noise-correlation with patient-factors: Chest
The ranges of patient weights, slice thickness, set kVp, mAs, and resultant doses and noise for chest scans are shown in Table 15 for the patients who were entered into the study.
TABLE 15. PROTOCOLS USED FOR THE CHEST CT DATA COLLECTION
Country Filter SW Weight Noise CTDIol kVp mAs
Canada B35f 1 min 35.9 6.9 6.6 120 210
median 76.8 15.7 8.9 120 234
max 159 29.3 19.5 120 325
Greece STND 7 min 35 6.6 16.6 120 160
median 78 10.1 20.8 120 200
max 125 22.4 35 120 300
India B60fL3CON 2.5 min 10 6.3 9.6 90 90
median 49 7.9 12.3 90 90
max 90 13.5 12.3 90 90
Poland STND 10 min 45 7.2 14.2 120 225
median 70 9.8 14.2 120 225
max 95 16.7 14.2 120 225
Thailand B40f 8 min 36 10.6 6.8 90 90
median 57 13.5 6.8 90 90
max 74 18.7 9.8 90 100
UK B40f 5 min 42 16.6 5.8 120 83
median 68 18 6.2 120 88
max 94 20.7 8.2 120 175
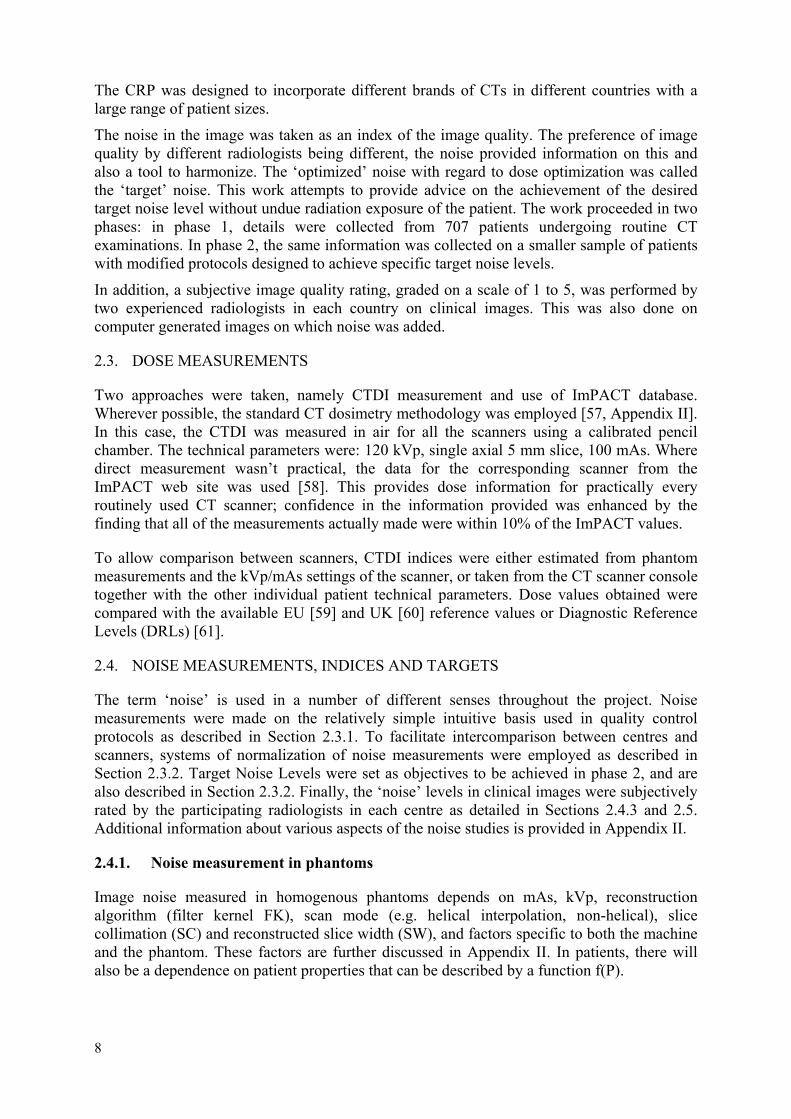
The range of variation in noise in the chest CTs is from 6.3 to 29.3, which is substantial, but less, at the lower end, than that seen in the abdomen. This partly reflects the widely varied parameters favoured by the radiologists in the different participating centres. The noise variation with weight is shown graphically in Figure 7. It can be seen that, in general, the change in noise with patient weight is less than for the abdomen. The linear regression
21
coefficients are also lower. The results were sufficiently discouraging to preclude pursuit of normalized studies. The noise levels at additional locations on the chest scans, and with contrast, were investigated in one country, Canada.
FIG. 7. Noise in chest CT as a function of body weight.
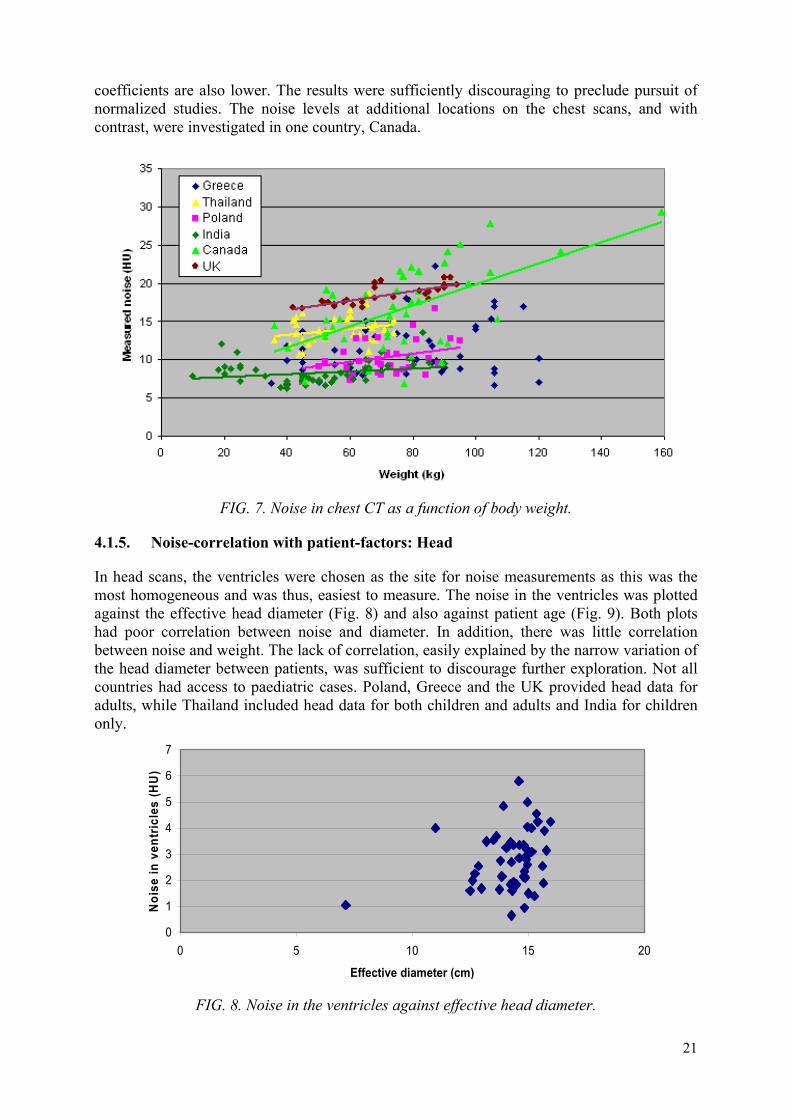
4.1.5. Noise-correlation with patient-factors: Head
In head scans, the ventricles were chosen as the site for noise measurements as this was the most homogeneous and was thus, easiest to measure. The noise in the ventricles was plotted against the effective head diameter (Fig. 8) and also against patient age (Fig. 9). Both plots had poor correlation between noise and diameter. In addition, there was little correlation between noise and weight. The lack of correlation, easily explained by the narrow variation of the head diameter between patients, was sufficient to discourage further exploration. Not all countries had access to paediatric cases. Poland, Greece and the UK provided head data for adults, while Thailand included head data for both children and adults and India for children only.
0
1
2
3
4
5
6
7
0 5 10 15 20
Effective diameter (cm)
Noi
se in
ven
tric
les
(HU
)
FIG. 8. Noise in the ventricles against effective head diameter.

22
FIG. 9. Noise in the ventricles against patient age.
4.2. DISCUSSION
Two principal themes for discussion emerge, first the opportunistic chance to compare practice in the participating institutions with regard to DRLs. Second, the main subject of the project, is the possibility of dose optimization without compromising image quality, using acceptability to radiologists as index.
4.2.1. Comparison with diagnostic reference levels
Tables 10 to 15 illustrate that the doses from most centres in the study were lower than the Reference Levels set by the EU (15). Mean head CTDIw of 39 mGy for the entire sample was comparable to values presented in other studies (34–56 mGy). However, mean head doses for Greece and India were higher than the EU Reference Levels (15). The Indian doses are accounted for by use of 140 kV. The Greek doses are partly attributable to use of a high mAs value. The mean chest CTDIw (9.3 mGy) was lower than the value found in the previous IAEA CRP (16.2 mGy) [50]. Likewise the mean abdomen CTDIw of 10.4 mGy is lower than the previously reported levels (16–29 mGy) [24, 29, 31–35]. In connection with the above, it must be remembered that DRLs are derived from standard operating protocols in the participating centres (14). They do not necessarily reflect the minimum dose at which diagnostically acceptable images can be obtained.
4.2.2. Noise and normalized noise measurements
The wide range of image noise values noted for patients scanned using conventional protocols in the participating centres opens up the opportunity to consider adapting the imaging protocols used so that the anticipated noise levels in the final images will be closer to being constant between centres. The rationale for this is that image quality and noise levels are, in theory, closely related and a constant noise level might reasonably be expected to be a feature of a constant image quality. From theoretical considerations (see Section 2 and Appendix II), it is obvious that one of the easiest ways of adjusting noise is through an appropriate dose (mAs) adjustment. Thus the possibility exists of attempting to achieve a ‘target noise level’ in

23
abdominal scans by adjusting the mAs used for the weight of the patient, using the relationships identified above. In phase 2, the dose values used were adapted on this basis to further explore possibility of dose optimization.
At a technical level, a considerable variation was experienced in reproducibility of noise measurements in chest for the same patient in same image as well as in contiguous image datasets. This may be due to lack of fixed landmark in chest, movement of structures with cardiac pulsations, complex attenuation patterns of chest or the variable effect of reconstruction kernels in the complex attenuation patterns of chest anatomy. However, measurement of image quality in a way that connects with clinical experience is notoriously difficult. Noise measurements were adopted in this investigation partly due to the lack of an alternative simple objective index and partly because they were relatively easy to do and feasible.
The noise/weight relationship seen in the abdomen was not noted for chest or head images. However, a wide range of noise was present in chest images of patients of similar size or weight. Despite the absence of relationship, it was decided to implement dose adaptation for chest CT based on patients’ weight. This was reinforced by the existence of ‘low-dose’ protocols in the literature and by experience reporting substantially lower doses for paediatric chest and correspondingly higher doses for adults.
A similar need for higher doses in head CT of large adult patients was not expected or suggested in relevant literature as head diameter is independent of patient weight and there are few anatomical variations between patients. Hence, it was decided not to adapt doses for head CT. In keeping with this, there was no substantial difference between noise values for different centres.
There are a number of limitations in this study. Among these is the choice of participating institutions. However the results demonstrate the feasibility of the approach being taken over a wide range of geography, in vastly different health services, which can reasonably be expected to have different referral patterns, different local approaches to practice and different population characteristics. The study may also be limited by restricting the participants to large hospitals so the success seen here may require more work to enable it to transfer well to smaller centres.
5. PHASE 2: DOSE ADAPTATION
Exposure tables appropriate to patients of different sizes and weights were established for the various scanners in each centre based on the information generated in phase 1. The patient doses at which these levels were achieved are presented and compared with the phase 1 data. In some countries, this led to a significant decrease in patient doses for both chest and abdominal examinations.
5.1. TARGET NOISE LEVELS AND EXPOSURE TABLES
5.1.1. Target noise determination
The target noise levels for phase 2 were derived from the image noise and normalized noise observations in phase 1. These were moderated to take account of patient weight. With regard to the general increase in noise with weight, various approaches were considered, including a stepped one and a smoothly increasing one. It was felt the stepped approach would lead to inconsistencies at the transition between categories. Hence a linear approach was adopted where it was logistically possible. The values used are illustrated in Figure 10 and employ two

24
target noise levels to accommodate the different noise levels that were felt acceptable in the different countries. Level A (corresponding to 10 HU for the smallest patient weight category) was used in all the participating countries except India which used level B (15 HU). The increases were, in both cases, based on a target noise level increase of 0.5 HU per 10 kg body weight.
In addition, it is important to note that in some circumstances it was clinically desirable to have less noise for paediatric patients because of the decrease in contrast due to lack of fat. Greater noise could be tolerated for large patients, where fat contributes more to tissue contrast.
FIG. 10. Target noise levels used for phase 2 superimposed on the image noise measured in phase 1. Target level B was adopted by India, while the other countries used target level A.
5.1.2. Exposure tables
Based on these target noise levels, the associated dose values and scanner protocols were determined for different patient weights for each machine. The values for a stepped approach at 5 kg intervals for abdominal exposures are illustrated in Table 16. With regard to kVp, while 120 kVp was acceptable for most patients, it was recognized 140 kV would be better for larger patients (more than 100 kg), or where the calculated mAs values were above those achievable on the scanner. Likewise, with smaller patients, 80 or 100 kVp was used when the calculated mAs was below the minimum available on a particular scanner.
With chest scans, phase 1 demonstrated substantial variability of measured noise. As indicated earlier, it is possible that an underlying relationship is being concealed by the rapid changes in density characteristic of chest images. In this case, the consensus of the CRP participants was that 70% of the mAs values in Table 15 be employed. The reduction of mAs by 30% is somewhat arbitrary — but given the correlation in chest and abdominal shape, it was considered practical and better than not adapting dose at all. However, it may be possible to revisit this issue with a better metric for noise in chest images.

25
With head scans, there is little change in measured noise, with patient weight or equivalent diameter, and hence head dose was not adapted for indicators of patient size.
TABLE 16. CALCULATED EXPOSURE PARAMETERS REQUIRED TO ACHIEVE THE PROPOSED NOISE LEVELS IN ABDOMEN CT
Canada Greece India (level B) Poland Thailand
Weight kVp mAs -ideal
kVp mAs -ideal
kVp mAs -ideal
kVp mAs -ideal
kVp mAs -ideal
5 80 65 120 7 80 18 80 9 80 29
10 80 106 120 12 80 29 80 15 80 47
15 80 155 120 18 80 43 80 22 80 67
20 80 212 120 24 80 59 80 30 80 90
25 80 276 120 31 80 76 80 39 80 115
30 120 95 120 39 120 26 120 32 120 42
35 120 115 120 48 120 32 120 39 120 50
40 120 137 120 56 120 38 120 47 120 59
45 120 160 120 66 120 44 120 54 120 68
50 120 184 120 76 120 51 120 63 120 77
55 120 208 120 86 120 58 120 71 120 86
60 120 234 120 96 120 65 120 80 120 96
65 120 260 120 107 120 72 120 89 120 105
70 120 286 120 118 120 79 120 98 120 114
75 120 314 120 129 120 87 120 107 120 124
80 120 341 120 141 120 94 120 116 120 133
85 120 369 120 152 120 102 120 126 120 143
90 120 397 120 164 120 110 120 135 120 152
95 120 426 120 176 120 118 120 145 120 161
100 120 455 120 188 120 126 120 155 120 171
105 140 325 120 200 140 93 120 165 140 129
110 140 345 120 211 140 99 120 175 140 136
115 140 364 120 223 140 104 120 185 140 142
120 140 384 120 235 140 110 120 194 140 149
125 140 403 120 247 140 116 120 204 140 155
130 140 423 120 259 140 121 120 214 140 161
135 140 442 120 271 140 127 120 224 140 167
140 140 462 120 283 140 133 120 234 140 173
145 140 481 120 295 140 138 120 244 140 179
150 140 501 120 307 140 144 120 254 140 186

26
5.1.3. Participation level and data presented
Participation in phase 2 was incomplete and more fragmented than phase 1. For practical or operational reasons some centres had to implement the dose adaptation in a stepwise fashion with respect to patient weight. This is illustrated in the approach used by the Polish Group, which is shown for abdominal scans in Table 17. Canada only applied the dose adaptation formula described here to patients weighing less than 70 kg, and hence only entered only a few patients who are not included in these analyses in sections 5.2 and 5.3 below. The UK was not able to participate in the phase 2 patient data collection.
Additional phase 2 results are presented in Appendix III.
TABLE 17. DOSE ADAPTATION USED BY POLAND FOR DOSE REDUCTION IN ABDOMEN
Mass [kg] Routine mAs Modified mAs % of Dose reduction
40–49 250 100 60
50–59 125 50
60–69 150 40
70–79 200 20
80–89 225 10
90–99 250 0
>100 250 0
5.2. RESULTS
5.2.1. Patient dose
The mean patient doses (CTDIvol and DLP), consequent on implementation of the revised exposure table for abdominal scans, are listed in Table 18, where they are also compared with the values from phase 1. Clearly the values for phase 2 are significantly lower for both indices. A similar trend was seen in chest scans. This was marked in India and modest in Greece. Mean values for dose indices being very similar to median values, they are alternatively used in Tables 14 and 15.The dose levels for chest scans in phase 2 with phase 1 comparative data are in Table 19. The average values for the study population in each category are shown in Table 20 along with a comparison with phase 1 CTDIvol and DLP values. This reflects the average for the four countries fully participating in this phase, and shows a modest overall dose reduction
TABLE 18. MEAN DOSE INDICES FOR ABDOMEN IN PHASE 1 AND PHASE 2 BEFORE AND AFTER DOSE REDUCTION
Country CTDIvol DLP
Phase 1 Phase 2 Phase 1 Phase 2
India 12.6 4.4 459 171
Greece 19.5 14.4 740 548
Poland 15.8 11.8 550 316
Thailand 9.5 7.1 402 287

27
TABLE 19. MEAN DOSE INDICES FOR THE CHEST IN PHASE 1 AND PHASE 2 BEFORE AND AFTER DOSE REDUCTION
Country CTDIvol DLP
Phase 1 Phase 2 Phase 1 Phase 2
India 12.3 2.4 355 74
Greece 19.5 13.4 540 475
Poland 14.2 8.7 447 265
Thailand 7.2 5.6 247 182
TABLE 20. AVERAGE DOSE INDICES FROM FOUR COUNTRIES
Examination No. of patients in phase 1
No. of patients in phase 2
Phase 1 Mean
Phase 2 Mean
Dose reduction %
Chest CTDIvol 243 189 9.3 7.1 23.6
Chest DLP 243 189 348 298 14.4
Abdomen CTDIvol
288 167 10.4 8.1 22.1
Abdomen DLP
288 167 549 318 42.1
The more substantial DLP reduction in abdomen CT may be due to some awareness of the radiographers performing the CT scans to dose, and consequently to shorter lengths being scanned. This phenomenon is not reproduced in chest CTs.
5.2.2. Achievement of target noise levels after dose reduction
There was no significant difference in the distribution of patient weights between the phases 1 and 2 (p> 0.05). Abdominal data for target and measured noise values in phase 2 are summarized in Table 21. The available data from Greece, India, Thailand and Poland show that measured noise levels were not substantially different from the target levels for most weight categories. Like the baseline data, the noise values following dose adaptation showed a reduced but statistically significant correlation with patients’ weight. Overall, the achieved noise was within 2 HU of the target in most cases, indicating the validity of the method.

28
TABLE 21. SUMMARY OF TARGET AND ACHIEVED NOISE LEVELS FOR ABDOMINAL CT (PHASE 2)
Country Weight (kg) Target noise (HU) Measured noise (HU) Difference from target noise (HU)
Greece 15–25 N/A N/A N/A
26–45 11 10.1 0.9
46–65 12 10 2
66–85 12 11.4 0.6
86–105 13 9.2 3.8
>105 14 15 1
India 10–25 10 13.2 3.2
26–45 11 13.4 2.4
46–65 12 12.9 0.9
66–85 14 16.2 2.2
86–105 15 16.5 1.5
Poland 15–39 N/A N/A N/A
40–49 11 9.5 1.5
50–59 12 11.3 0.7
60–69 12 11.9 0.1
70–79 13 12.8 0.2
80–89 13 13.8 0.8
>90 15 16.5 1.5
Thailand 15–25 N/A N/A N/A
25–40 10 11.4 1.4
41–60 11 10.9 0.1
61–80 12 12.8 0.8
81–100 13 12.2 0.8
With chest images, on the other hand, the basis for dose adaptation was somewhat more arbitrary, and likely to be confounded by instability in the patient noise levels due to changes in patient attenuation. However, Table 22 indicates that even with these problems it was found that the noise changes were significant for two of the four countries and bordered on significant in a third.

29
TABLE 22. NOISE IN PHASES 1 AND 2 FOR CHEST
Country Phase 1 Phase 2 P value (t test)
Greece 12.8 11.4 (level A) 0.14
India 9.4 14.4 (level B) <0.001
Poland 11.9 12.9 (level A) 0.06
Thailand 10.5 11.9 (level A) <0.001
5.3. DISCUSSION
Within the framework of the methodology developed it was possible to get agreement on an approach to target noise levels that could be implemented in four of the six participating centres. Two levels were employed, about 5 HU apart, which reflected the weight distributions of the populations involved. The countries that could not participate in phase 2 had difficulties that were either procedural or involved delays in acquiring ethical approval. When setting target noise levels it was also necessary to compensate for the lack of contrast provided by fat in smaller subjects, particularly children. Generally, the transfer from selected noise levels to mAs, as a function of weight, was relatively straightforward, and allowed exposure charts for abdomen and chest be produced for each country.
When implemented, the revised exposure charts produced notable dose reductions and noise levels that were generally within one or two HU of the target value. The dose reductions for individual institutions were sometimes dramatic, particularly for abdomen. However, the mean values were modest and therefore probably did not substantially degraded image quality. Larger dose reductions might have been achieved, but might not have been so readily accepted because of the larger degradation in image quality. It is probable that there is scope for further dose reduction within this approach, but additional investigation will be required to validate it. It is likely that this will be more difficult than the work undertaken here, as the acceptability of the dose reduced images may encounter difficulties not met in this study. It is also probable that further work could be undertaken to identify the best approach to dose reduction for chest images.
Complete data after dose adaptation was available for four countries from both Europe and Asia. For a variety of reasons the European and North American countries could not participate fully in phase 2. While this was disappointing, it still left a range of participants with a wide geographical distribution. For chest and abdomen, and with the exception of very large patients in some countries, there were significant decreases in average CTDI and DLP, ranging, in particular circumstances, from 20 to 75% for chest and 25 to 60% for abdomen. The mean values for chest and abdomen DLP for the study as a whole were 14.4% and 42.1% respectively. These reductions represent a considerable achievement. In particular, the fact that they were achieved in several different parts of the world, in different healthcare systems and required no new or additional technology, is remarkable.
The mean dose indices achieved are systematically less than those for phase 1, and those for abdomen, in which the proposed regime had its most complete application, were substantially and consistently less. As the phase 1 doses were generally less than the EU DRLs, this means the levels in phase 2 were even more clearly inside this advisory framework. However, it must be borne in mind that the EU values were acquired almost a decade ago and that a new generation of scanners to which they may not be appropriate is now in place.
Two papers were published in the framework of this project [62, 63].

30
6. CONCLUSIONS
In keeping with the requirements in BSS on optimization of patient doses, this project sought to develop and evaluate an approach to dose reduction in CT based on patient weight. The approach initially adopted was applied with varying degrees of success to the different anatomical systems selected for study. It had no applicability in the case of head studies, some in the case of chest scans and was very successful in the case of abdominal scans. This was related to both the nature and geometry of each system as well as the practical difficulties of making noise measurements in the system. The overall correlation between image noise and patients’ weight for phase 2 data was substantially less than that for phase 1 images, which suggests that dose adaptation did lead to homogenization of image noise for different patient sizes.
Image quality was assessed using both objective and subjective approaches. Target image noise levels, converted to exposure values, were used to get the desirable levels dose changes, with a marked reduction in all countries for small size patients. The targets are dependent on clinical indication, patient size and radiologists’ preferences.
In practice, the dose reduction achieved was effected without loss of an acceptable level of image quality, as judged in Section 3 of this publication. In addition, those involved in the project reported that nobody complained of an unacceptable systematic deterioration in image quality. It is important to note that in practice the acceptability of images with the greater noise levels consequent on dose adaptation could, in theory, depend on several factors, such as radiologists’ preference, study indications, area of interest, patient size etc. In practice, it is surprising that the target noise images in this study were all acceptable to the participating radiologists. This may reflect the fact that the noise reduction was fairly modest. In practice, if such an initiative is being undertaken, it would be wise to set target noise values locally as there may be scope for further dose savings and/or those established here may not be universally acceptable.
At constant mAs levels, the noise decreases too strongly for small patients and may increase excessively for obese patients. To maintain balance between image noise and patient size, individual dose adaptation is therefore warranted. Our study shows that it is possible to develop a relationship between image noise and patient weight that can be used to adapt the dose for a specific image quality. However, it is an oversimplification to suggest universally applicable weight-based normograms for optimized mAs because scanners vary in output due to factors such as geometry, filtration, detector efficiency and so on.
Nevertheless, for routine chest and abdomen CT examination in an adult population, we found that the target noise chosen was acceptable. For paediatric patients and for indications in which contrast resolution has to be high (e.g. evaluation of liver lesions), lower target noise levels may become necessary. For specific indications (e.g. benign diseases such as kidney stones) and obese patients, a much higher noise level can be acceptable.
In the chest, noise measurements were highly variable and possibly unreliable, but adopting the approach described in Section 5, resulting in abdominal dose reduction by 30%, appears to work in practice. It was felt that there is potential for identification of more useful relationships between noise and size, provided a more stable measurement system can be identified. The lack of correlation between patients’ weight and image noise in the chest may also imply that weight is not an optimum parameter for dose adaptation for chest CT, or that image noise is an unreliable index of objective image quality for chest CT images. Regardless, chest images acquired with dose adaptation based on target noise levels resulted in dose savings in all centres compared to the baseline doses.

31
The doses achieved are systematically less than those for phase 1, and those for abdomen, in which the proposed regime had its most complete application, were substantially and consistently less, except in heavy patients where the homogenization of the image noise led to an increase in dose in three countries. As the phase 1 doses were generally less than the EU reference values, this means the levels in phase 2 were even more clearly inside this advisory framework. Thus, this study shows that it is possible, by making exposure adjustments based on patient weight, to reduce CT doses for chest and abdominal examinations while maintaining an acceptable image quality and hence diagnostic confidence. Where no automated exposure control is available on the scanner, patient weight offers an achievable and practical option as demonstrated here.
In view of the rapid changes occurring in CT technology, the advice in this document will inevitably need to be updated in due course. However, the experience gained to date, and the conclusions reached will be incorporated in the future revision of RS-G-1.5 [6].


33
REFERENCES
[1] HOUNSFIELD, G.N., Computerized transverse axial scanning (tomography): Part I. Description of system, British Journal of Radiology 46 (1973) 1016-1022.
[2] EUROPEAN ATOMIC ENERGY COMMUNITY, FOOD AND AGRICULTURE ORGANIZATION OF THE UNITED NATIONS, INTERNATIONAL ATOMIC ENERGY AGENCY, INTERNATIONAL LABOUR ORGANIZATION, INTERNATIONAL MARITIME ORGANIZATION, OECD NUCLEAR ENERGY AGENCY, PAN AMERICAN HEALTH ORGANIZATION, UNITED NATIONS ENVIRONMENT PROGRAMME, WORLD HEALTH ORGANIZATION, Fundamental Safety Principles, Safety Fundamentals, IAEA Safety Standards Series No. SF-1, IAEA, Vienna (2006).
[3] FOOD AND AGRICULTURE ORGANIZATION OF THE UNITED NATIONS, INTERNATIONAL ATOMIC ENERGY AGENCY, INTERNATIONAL LABOUR ORGANIZATION, OECD NUCLEAR ENERGY AGENCY, PAN AMERICAN HEALTH ORGANIZATION, WORLD HEALTH ORGANIZATION, International Basic Safety Standards for Protection against Ionizing Radiation and for the Safety of Radiation Sources, IAEA Safety Series No. 115, IAEA, Vienna (1996).
[4] INTERNATIONAL ATOMIC ENERGY AGENCY, INTERNATIONAL LABOUR OFFICE, INTERNATIONAL ORGANIZATION FOR MEDICAL PHYSICS, INTERNATIONAL SOCIETY OF RADIOLOGY, PAN AMERICAN HEALTH ORGANIZATION, WORLD HEALTH ORGANIZATION, Applying Radiation Safety Standards in Diagnostic Radiology and Interventional Procedures Using X Rays, Safety Reports Series No. 39, IAEA, Vienna (2006).
[5] INTERNATIONAL ATOMIC ENERGY AGENCY, Optimization of the Radiological Protection of Patients: Image Quality and Dose in Mammography (Coordinated Research in Europe), IAEA-TECDOC-1447, IAEA, Vienna (2005).
[6] INTERNATIONAL ATOMIC ENERGY AGENCY, INTERNATIONAL LABOUR OFFICE, INTERNATIONAL ORGANIZATION FOR MEDICAL PHYSICS, INTERNATIONAL SOCIETY OF RADIOLOGY, PAN AMERICAN HEALTH ORGANIZATION, WORLD HEALTH ORGANIZATION, Radiological Protection for Medical Exposure to Ionizing Radiation, IAEA Safety Standards Series No. RS-G-1.5, IAEA, Vienna (2002).
[7] INTERNATIONAL ATOMIC ENERGY AGENCY, Optimization of the Radiological Protection of Patients Undergoing Radiography, Fluoroscopy and Computed Tomography, IAEA-TECDOC-1423, IAEA, Vienna (2004).
[8] SPELIC, D.C., SULEIMAN, O.H,, KACZMAREK, R.V., STERN, S.H., MOYAL, A., “Nation-wide evaluation of X-ray trends (NEXT) survey of patient radiation exposure from computed tomographic (CT) examinations in the United States”, Poster presentation at the Annual Meeting of the Radiological Society of North America, November 2001, Chicago, USA (2001).
[9] UNITED NATIONS SCIENTIFIC COMMITTEE ON THE EFFECTS OF ATOMIC RADIATION, 2000 Report to the General Assembly, Annex D: Medical Radiation Exposures, New York, NY: United Nations (2000).

34
[10] EUROPEAN UNION, Council Directive 97/43/EURATOM of 30 June 1997 on
health protection of individuals against the dangers of ionizing radiation in relation to medical exposure. (Repealing Directive 84/466/EURATOM, O.J. No. L 265/1, 5.10.1984), Official Journal of the European Communities No. L 180/22–27, Luxembourg (1997).
[11] HART, D., WALL, B.F., UK population dose from medical X-ray examinations, Eur. J. Radiol. 50 (2004) 285–291.
[12] SHRIMPTON, P.C., et al., Survey of CT Practice in the UK, Part 1: Survey of CT practice in the UK, NRPB Report R-248, National Radiological Protection Board, Chilton, Oxon UK, London HMSO (1991).
[13] SHRIMPTON, P.C., et al., Survey of CT Practice in the UK, Part 2: Dosimetric aspects, NRPB Report R-249, National Radiological Protection Board Chilton, Oxon UK, London HMSO (1991).
[14] SHRIMPTON, P.C., et al., Survey of CT Practice in the UK, Part 3: Normalised organ doses calculated using Monte Carlo techniques, NRPB Report R-250, National Radiological Protection Board Chilton, Oxon UK, London HMSO (1991).
[15] SHRIMPTON, P.C., HILLIER, M.C., LEWIS, M.A., DUNN, M., Doses from computed tomography examinations in the UK — 2003 Review, National Radiological Protection Board, Chilton, Didcot, Oxon UK Report NRPB-W67 (2005).
[16] METTLER, F.A., et al., Use of radiology in U.S. general short-term hospitals: 1980-1990, Radiology 189 (1993) 377–380.
[17] STANISZEWSKA, M.A., Evaluation of patient exposure in computerised tomogram in Poland, Radiat Prot Dosimetry 98 4 (2002) 437–440.
[18] BRUGMANS, M.J., BUIJS, W.C., GELEIJNS, J., LEMBRECHTS, J., Population exposure to diagnostic use of ionizing radiation in the Netherlands, Health Phys 82 (2002) 500–509.
[19] ALDRICH, J.E., WILLIAMS, J., Change in patient doses from radiological examinations at the Vancouver General Hospital 1991–2002, Canadian Association of Radiology Journal 56 (2005) 94–99.
[20] BRIX, G., et al., Radiation exposure in multi-slice versus single-slice spiral CT: Results of a nationwide survey, European Journal of Radiology 12 8 (2003) 1979–1991.
[21] REHANI, M.M., BERRY, M., Radiation doses in computed tomography. The increasing doses of radiation need to be controlled, Editorial, BMJ 320 (2000) 593–594.
[22] NICKOLOFF, E.L., ALDERSON, P.O., Radiation exposure to patients from CT: Reality, public perception, and policy, Am J Roentgenol 176 (2001) 285-287.
[23] INTERNATIONAL COMMISSION ON RADIOLOGICAL PROTECTION, Radiological protection and safety in medicine, Publication 73, Annals of the ICRP 26 2, Elsevier (1996).
[24] LINTON, O.W., METTLER, F.A., National conference on dose reduction in CT, with an emphasis on paediatric patients, Am J Roentgenol 181 (2002) 321-329.
[25] KHURSHED, A., HILLIER, M.C., SHRIMPTON, P.C., WALL, B.F., Influence of patient age on normalized effective doses calculated for CT examinations, Br J Radiol 75 (2002) 819–830.

35
[26] The ALARA (as low as reasonably achievable) concept in pediatric CT
intelligent dose reduction, Multidisciplinary conference organized by the Society of Pediatric Radiology, Pediatr Radiol 32 4 (2002) 217–313.
[27] BRENNER, D.J., HALL, E.J., Computed tomography — An increasing source of radiation exposure, New England Journal of Medicine 357 22 (2007) 2277-2284.
[28] KALRA, M.K., et al., Strategies for CT radiation dose optimization, Radiology 230 (2004) 619–628.
[29] GAMSU, G., HELD, B.T., CZUM, J.M., Reduced radiation for adult thoracic CT: A practical approach, Journal of Thoracic Imaging 19 (2004) 93–97.
[30] DONNELLY, L.F., et al., Minimizing radiation dose for pediatric body applications of single-detector helical CT: Strategies at a large children’s hospital, AJR Am J Roentgenol 176 (2001) 303–306.
[31] DIEL, J., et al., Unenhanced helical CT using increased pitch for suspected renal colic: An effective technique for radiation dose reduction? J Comput Assist Tomogr 24 (2000) 795–801.
[32] MAYO, J.R., CT of the chest: minimal tube current required for good image quality with the least radiation dose, Am J Roentgenol 164 (1995) 603–607.
[33] LEE, K.S., et al., Chronic infiltrative lung disease: Comparison of diagnostic accuracies of radiography and low- and conventional-dose thin-section CT, Radiology 191 (1994) 669–673.
[34] ZWIREWICH, C.V., MAYO, J.R., MÜLLER, N.L., Low-dose high-resolution CT of lung parenchyma, Radiology 180 (1991) 413–417.
[35] MAYO, J.R., et al., Simulated dose reduction in conventional chest CT: Validation study, Radiology 202 (1997) 453–457.
[36] INTERNATIONAL COMMISSION ON RADIOLOGICAL PROTECTION, ICRP Publication 87: Managing Patient Dose in Computed Tomography, Annals of the ICRP, Vol. 30/4, Elsevier (2001).
[37] INTERNATIONAL COMMISSION ON RADIOLOGICAL PROTECTION, ICRP Publication 102: Managing Patient Dose in Multi-Detector Computed Tomography (MDCT), Annals of the ICRP Volume 37/1, Elsevier (2007).
[38] MIYAZAKI, O., et al., Current practice of pediatric MDCT in Japan: Survey results of demographics and age-based dose reduction, Nippon Igaku Hoshasen Gakkai Zasshi 65 (2005) 216–223.
[39] KEAT, N., CT scanner automatic exposure control systems, MHRA Report 05016, Department of Health, UK (2005).
[40] TACK, D., DE MAERTELAER, V., GEVENOIS, P.A., Dose reduction in multidetector CT using attenuation-based online tube current modulation, Am J Roentgenol 181 (2003) 331–334.
[41] GREESS, H., et al., Dose reduction in computed tomography by attenuation-based on-line modulation of tube current: evaluation of six anatomical regions, Eur. Radiol. 10 (2000) 391–394.
[42] KALRA, M.K., et al., CT detection of urinary tract stones using Z-axis automatic tube current modulation technique with low radiation dose: Phantom and clinical studies, Radiology 235 (2005) 523–529.
[43] PROKOP, M., GALANSKI, M. (Eds), Spiral and Multislice CT of the Body, Thieme, New York (2003).
[44] PATERSON, A., FRUSH, D.P., DONNELLY, L.F., Helical CT of the body: Are settings adjusted for pediatric patients? Am J Roentgenol 176 (2001) 297-301.

36
[45] McCULLOUCH, C.H., et al., Dose optimization in CT: Creation,
implementation and clinical acceptance of size-based technique charts (abstract) Radiology 225 (2002) 591.
[46] STARCK, G., et al., A method to obtain the same levels of CT image noise for patients of various sizes, to minimize radiation dose, Br J Radiol 75 (2002) 140.
[47] HUDA, W., SCALZETTI, E.M., LEVIN, G., Technique factors and image quality as functions of patient weight at abdominal CT, Radiology 217 (2000) 430–435.
[48] JANGLAND, L., SANNER, E., PERSLIDEN, J., Dose reduction in computed tomography by individual scan protocols, Acta Radiol 45 (2004) 301–307.
[49] FEIGAL, D.W. JR., FDA Public Health Notification, Reducing risk from computed tomography for pediatric and small adult patients, Ped Radiol 32 (2002) 314–316.
[50] KALRA, M.K., et al., Correlation of patient weight and cross-sectional dimensions with subjective image quality at standard dose abdominal CT, Korean J Radiol. 4 (2003) 234–238.
[51] CODY, D.D., et al., Strategies for formulating appropriate MDCT techniques when imaging the chest, abdomen, and pelvis in pediatric patients, Am J Roentgenol 182 (2004) 849–859.
[52] STANISZEWSKA, M.A., ORRZUT, M., RYBKA, K., Phantom studies for possible dose reduction in CT head procedures, Rad Prot Dosimetry (2005) 326–331.
[53] MULLINS, M.E., et al., Comparison of image quality between conventional and low-dose nonenhanced head CT, AJNR Am J Neuroradiol 25 (2004) 533–538.
[54] SIGAL-CINQUALBRE, A.B., HENNEQUIN, R., ABADA, H.T., CHEN, X., PAUL, J.F., Low-kilovoltage multi-detector row chest CT in adults: Feasibility and effect on image quality and iodine dose, Radiology 234 (2004) 169–174.
[55] TACK, D., et al., Multi-detector row CT pulmonary angiography: Comparison of standard-dose and simulated low-dose techniques, Radiology 236 (2005) 318–325.
[56] MAHNKEN, A.H., Detection of coronary calcifications: feasibility of dose reduction with a body weight-adapted examination protocol, AJR Am J Roentgenol. 181 (2003) 533–553.
[57] INTERNATIONAL ATOMIC ENERGY AGENCY, Dosimetry in Diagnostic Radiology: an International Code of Practice, Technical Reports Series No. 457, IAEA, Vienna (2007).
[58] ImPACT, http://www.impactscan.org/. [59] EUROPEAN COMMISSION, Report EUR 16262 EN - European guidelines on
quality criteria for computed tomography, Office for Official Publications of the European Communities, Luxembourg (1999).
[60] NATIONAL RADIOLOGICAL PROTECTION BOARD, Guidelines on patient dose to promote optimisation of protection for diagnostic medical exposures, Documents of the NRPB, 10 1 (1999).
[61] IPEM report 88, Guidance on the establishment and use of diagnostic reference levels for medical x-ray examinations ISBN 1 903613 20 5. IPEM York (2004).
[62] ALDRICH, J. E., CHANG, S., BILAWICH, AM., MAYO. J., Radiation dose in abdominal computed tomography: The role of patient size and the selection of tube current, JACR Journal of Canadian Association of Radiology 57 3 (2006) 152–158.

37
[63] TSAPAKI, V., et al., Dose reduction in CT while maintaining diagnostic confidence: Diagnostic reference levels at routine head, chest and abdominal CT—IAEA-coordinated research project, Radiology 240 3 (2006) 828–834.


39
APPENDIX I. NOISE CHARACTERISTICS OF RECONSTRUCTION ALGORITHMS IN THE SCANNERS USED
I.1. NORMALIZATION FACTORS FOR RECONSTRUCTION FILTER KERNELS, CFK
Noise measurements were performed on each CT system for all the relevant reconstruction filter kernels. The normalization factor for the ‘standard’ recommended filter used was taken as unity, and all the other values were scaled accordingly. The results are displayed in Fig. I.1. As might be expected the noise increases dramatically when higher resolution filters are used. Note also, that with Siemens systems, the CFK for the B filter seems to vary between models.
FIG. I.1. Noise normalization factors CFK for reconstruction filter kernels of various scanners

40
I.2.
NO
ISE
CH
AR
AC
TER
ISTI
CS
OF
REC
ON
STR
UC
TIO
N A
LGO
RIT
HM
S
TAB
LE I.
1 R
ELA
TIV
E N
OIS
E C
OM
PAR
ED T
O S
TAN
DA
RD
REC
ON
STR
UC
TIO
N A
LGO
RIT
HM
, MEA
SUR
ED IN
A W
ATE
R P
HA
NTO
M
Pola
nd
G
reec
e
Can
ada
In
dia
Th
aila
nd
U
K
Scan
ner
Type
R
elat
ive
Noi
se
Scan
ner
Type
R
elat
ive
Noi
se
Scan
ner
Type
R
elat
ive
Noi
se
Scan
ner
Type
R
elat
ive
Noi
se
Scan
ner
Type
R
elat
ive
Noi
se
Scan
ner
Type
R
elat
ive
Noi
se
Pick
er
G
E
GE
Si
emen
s
Siem
ens
Si
emen
s
PQ 5
000
Pr
oSpe
ed
LS
Ultr
a-8
V
Z
S-4
S-
16
B10
f 0.
64
B10
f 0.
60
B10
f 0.
63
Smoo
th
0.79
So
ft 0.
82
Soft
0.80
B
20f
0.83
B
20f
0.79
B
20f
0.81
Stan
dard
1
Stan
dard
1
Stan
dard
1
B30
f 1
B30
f 1
B30
f 1
B35
f 1.
01
B35
f 1.
03
B31
s 0.
94
B36
f 1.
50
B35
f 1.
02
Shar
p 1.
24
Det
ail
1.34
B
40f
1.19
B
40f
1.20
B
40f
1.34
Det
ail
1.58
B
45f
1.76
B
45f
1.69
B
45f
1.78
Bon
e 2.
28
Bon
e 3.
70
B50
f 2.
78
B50
f 2.
62
B50
f 3.
45
Edge
3.
18
Lung
4.
30
B60
f 3.
99
B60
f 3.
50
B60
f 4.
60
PFR
M
4.20
B
one
Plus
5.
25
B70
f 4.
64
B70
f 4.
11
B70
f 5.
61
Bon
e 7.
89
Edge
8.
17
B80
f 4.
83
B80
f 5.
89

41
APPENDIX II. DOSE AND NOISE CALCULATIONS
A dose reduction programme will require dose and noise assessment. Apart form the information provided in the methods section, some additional comment is provided here.
II.1. DOSE MEASUREMENTS
II.1.1. Practical determination of CT quantities discussed
The two important CT dose quantities — CTDI and DLP, can be read directly on the console of almost every CT scanner after the examination is complete. This study mainly used DLP, which is an indicator of the total dose used in the examination. DLP takes into account the number of slices and the variations in pitch for helical scans. It is the most useful dose indicator for the comparison of CT examinations.
Before starting a dose study the CT scanner should be calibrated. Two CTDI values are commonly used. The first is CTDIair , which is measured as below and can be compared with the data on the ImPACT web site, www.impactscan.org. The second is CTDIw which is measured as prescribed by the FDA in 16 cm and 32 cm acrylic cylinders.
II.1.2. CTDIair measurement
The CTDI in air can be measured using the 10 cm pencil ionization chamber, bisected by the scan plane at the isocentre and supported from the patient table. The chamber is placed on the edge of the table and protrudes into the scan plane. Make sure that only the ionization chamber (and not the table) is in the scan plane; carefully aligned, and do measurements in axial mode with less than 2o tilt or swivel (Fig. II.1.).
FIG. II.1. Setup for the measurement of CTDIair.
Prepare the scanning protocol (kV, mA, sec, head or body protocol, slice thickness, standard reconstruction algorithm). Scan the chamber and calculate the CTDI:

42
CTDI100,air = 100 . R . C/T , where:
R: the reading (mGy) C: calibration factor of the ionization chamber (from calibration certificate) T: nominal slice thickness (mm).
II.2. NOISE MEASUREMENTS
This section describes the ways of measuring noise in a CT image, the different factors that may affect noise, the noise-normalization process, the correlation between noise and body-size indices, as well as the criteria for image quality subjective assessment in images with varying levels of noise.
II.2.1. Noise measurement in phantoms
In phantom measurements scan noise is expressed as the standard deviation (SD) of CT numbers (Hounsfield Units, HU) in a homogenous ROI of approximately 3 cm2 near the centre of the phantom. This value is displayed on the image whenever a ROI is drawn. This way of measuring noise is used in all Quality Control protocols for CT. CT noise in this sense is inversely proportional to dose or mAs [II.1]. Photon noise or shot noise on the other hand is a simple statistical quantity directly related to the square root of total exposure (dose or mAs), all other parameters remaining equal, in a Poisson distribution [II.2], and quantum mottle can be quantitatively described as:
σ = SQRT (mean number of photons) = SQRT µ
where µ is the number of x ray photons detected and the relative variation or scan noise decreases when the number of photon increases: relative variation = SQRT µ/µ = 1/SQRT µ
II.2.2. Normalization of noise measurements and target noise
To allow intercomparisons between machines and centres, the reference set of machine factors were employed to measure a scan noise that then served as a normalizing value for all centers. The reference settings were 120 kV, 100 mAs, 5 mm slice thickness and the standard reconstruction kernel. In practice a ‘normalized noise’ metric of this type is used, primarily in phase 1. An arbitrarily selected ‘normalized noise’ value of 1.5 was set for a patient weight of 70 kg. The factors on which scan noise depends include:
• CCT, the scanner-specific factor, which deals with differences between machines, including differences in CTDIAIR;
• CkVp, the noise for chosen kVp divided by the noise for 120 kVp; • CFK, the noise for reconstruction filter FK divided by the noise for the standard
reconstruction filter; • CP, the noise for helical interpolation mode at pitch P divided by the noise for non-
helical mode; • f(P), describes the variation in noise with any patient property P (such as weight or body
diameter); • SW, the slice width (in mm); • I × teff, the product of effective tube current and exposure time in mAs.

43
Identifying a patient-specific factor that correlates well with noise or normalized noise, allows the corresponding correlation curve be used to predict the mAs setting required to reach a specific image noise.
It is not always easy to find uniform tissues in which to make noise measurements. We chose the descending aorta for measurements in the torso and parts of the liver away from the major vessels. As noise also varies as you move from the centre of the patient to the surface, we chose to measure noise within the central third of the patient. Noise is measured by placing a region of interest not less than 2 cm2 over the area of interest on the image display. Two values are usually displayed — the mean CT number and the standard deviation of this CT number. The standard deviation is recorded as the noise value. Repeating the measurement on adjacent slices should give similar values. Regions which show artifacts such as streaks caused by metal clips or contrast should be avoided.
II.2.3. Normalization factors for noise dependence on kVp, CkVp
Noise measurements were performed on each CT system for all the available relevant kVp settings as described above. The results are presented in Table II.1 and Fig. II.2.
TABLE II.1. VALUES OF CKVP NORMALIZATION FACTOR FOR NOISE DEPENDENCE ON KVP
Country Poland Greece Canada India Thailand UK
Manufacturer Picker GE GE Siemens Siemens Siemens
kVp PQ 5000 ProSpeed LS Ultra-8 VZ S-4 S-16
80 2.87 1.91 1.91 1.84 1.92
100 1.23 1.33
120 1.00 1.00 1.00 1.00 1.00 1.00
140 0.76 0.82 0.83 0.85 0.89
Clearly, for all of scanners in this study CkVp and the noise increases as the kVp is decreased. The CkVp is approximately 1.3 for 100 kVp and 1.9 for 80 kVp. On the other hand it decreased to 0.85 at 140 kVp.
0.0
0.5
1.0
1.5
2.0
2.5
3.0
3.5
70 80 90 100 110 120 130 140 150
Tube current (kVp)
Noi
se c
alib
ratio
n fa
ctor
(CkV
p)
PQ 5000
ProSpeedLS Ultra-8
S-4S-16
VZ
FIG.II.2. kVp dependence of noise normalization factors for various scanners.

44
II.2.4. Noise measured with PMMA and water phantoms
As already stated, some centres performed their normalization measurements on a 16 cm PMMA phantom while others used a 20 cm water phantom. The normalization factors relative to 120 kVp or the standard filter were expected to be the same irrespective of whether measurements were made in PMMA or water. This was confirmed by measurements made in the UK and Thailand. The ratio of the normalization factors was 1.002 (UK) and 1.01 (Thailand). This level of difference is unimportant in this investigation.
II.2.5. Determination of correlation curves for noise and body size indices
The normalized noise in head, chest and abdomen scans was compared with the following patient-specific parameters:
• Weight • Body mass index (BMI) • AP diameter • Lateral diameter • Effective diameter = SQRT (AP diameter × lateral diameter)
Only body weight data are presented in the results in the main text. Some of the other results are presented in Appendix III. Linear correlation, power functions and exponential functions were fitted to the data using standard methodology. The correlation curve f (P) describes how normalized noise is related to any specific factor P (i.e. one of the above).
II.2.6. Image quality rating
TABLE II.2. CRITERIA FOR IMAGE QUALITY ASSESSMENT
Score
Anatomic criteria
Physical criteria Diagnostic confidence
Overall quality
1 not possible non-diagnostic non-diagnostic non-acceptable, repeat scan
2 difficult disturbing but diagnostic
low low
3 acceptable acceptable acceptable acceptable
4 good good good good
5 excellent excellent excellent excellent
NA not applicable
II.3. DEFINITIONS
Computed tomography dose index (CTDI): Integral along a line parallel to the axis of rotation (z) of the dose profile (D(z)), measured free-in-air or in a CT dosimetry phantom for a single slice, divided by the nominal slice thickness (T):
D(z)dz T1 = CTDI +
-∫∞∞ (mGy)

45
In practice, it is convenient to use a pencil ionisation chamber with an active length of 100 mm so as to provide a measurement of CTDI100 (mGy to air).
The CTDI is replaced by the CT air kerma index, Cw in Ref. [II.3].
CT dosimetry phantoms: Cylinders of polymethylmethacrylate (PMMA) used for standard measurements of dose in CT, having a diameter of 16 cm (head phantom) or 32 cm (body phantom) and a length of at least 14 cm. The phantoms are constructed with removable inserts parallel to the axis to allow the positioning of a dosimeter at the centre and 1 cm from the outer surface (periphery).
CTDIair: Value of CTDI determined free-in-air or Ca,100
CTDIw: See weighted CTDI or Cw.
Dose-length product (DLP) or CT air kerma-length product PKL,CT: Dose index used as an indicator of overall exposure for a complete CT examination in order to allow comparison of performance against a DRL set for the purpose of promoting optimization of patient protection and to allow computation of the effective dose.
NTCTDI = DLP wi
××∑ mGy.cm
where i represents each scan sequence forming part of an examination, and CTDIw is the weighted CTDI for each of the N slices of thickness T (cm) in the sequence.
Weighted CTDI or weighted CT air-kerma index (CTDIw) or Cw: An estimate of the average dose over a single slice in a CT dosimetry phantom that is used to allow comparison of performance against a DRL set for the purpose of promoting optimization of patient protection.
)CTDI2/3 + CTDI(1/3 = CTDI p100,c100,w mGy
where CTDI100,c or p refer to measurements of CTDI100 at the centre(c) or periphery (p) of the head or body phantom for the settings used in clinical practice.
or )C2/3 + C(1/3 = C p100,PMMAc100,PMMAw ,, mGy
REFERENCES TO APPENDIX II
[II.1] ImPACT, http://www.impactscan.org/ [II.2] WOLBARST, A., Physics of Radiology, 2nd edn, Medical Physics Publishing,
Madison WI (2005) Ch. 39, 411–413. [II.3] INTERNATIONAL ATOMIC ENERGY AGENCY, Dosimetry in Diagnostic
Radiology: An International Code of Practice, Technical Reports Series No. 457, IAEA, Vienna (2007).

46
APPENDIX III. ADDITIONAL DATA PHASE 1 AND PHASE 2
III.1. ADDITIONAL DATA PHASE 1
Additional data for phases 1 and 2 are provided here for reference purposes only. The data are consistent with that provided in the main text. The phase 1 data provides information on normalized noise in abdominal CT with patient weight, effective diameter, BMI, and AP diameter for each of the countries involved. The phase 2 data provides information for one country in each figure in respect of noise before and after the noise reduction initiative for abdominal and chest CT. Some additional phase 2 data from Canada is also included (Fig. III.14). The data is self-explanatory and is provided without further comment.
FIG. III.1. Normalized noise for abdomen CT as a function of body weight. Individual linear
correlation curves by country.
FIG. III.2 Normalized noise for abdomen CT as a function of effective patient diameter. Individual correlation curves by country.

47
FIG. III.3 Normalized noise for abdomen CT as a function of BMI. Individual linear
correlation curves by country.
FIG. III.4 Normalized noise for abdomen CT as a function of AP patient diameter. Individual correlation curves by country.

48
III.2. ADDITIONAL DATA PHASE 2
0.0
5.0
10.0
15.0
20.0
25.0
0 20 40 60 80 100 120 140
Patients weight (kg)
Noi
se (H
U)
Phase 1Phase 2
FIG. III.5. Comparison of noise before and after dose reduction for abdominal CT in India.
FIG. III.6. Comparison of noise before and after dose reduction for abdominal CT in Thailand.

49
0.0
5.0
10.0
15.0
20.0
25.0
30.0
35.0
0 20 40 60 80 100 120 140
Patients weight (kg)
Noi
se (H
U)
Phase 2Phase 1
FIG. III.7. Comparison of noise before and after dose reduction for abdominal CT in Canada.
FIG. III.8. Comparison of noise before and after dose reduction for abdominal CT in Greece.

50
0.0
5.0
10.0
15.0
20.0
25.0
0 20 40 60 80 100 120Patients weight (kg)
Noi
se (H
U)
Phase 1
Phase 2
FIG. III.9. Comparison of noise before and after dose reduction for abdominal CT in Poland.
FIG. III.10. Comparison of noise before and after dose reduction for chest CT in Poland.

51
FIG. III.11. Comparison of noise before and after dose reduction for chest CT in India.
FIG. III.12. Comparison of noise before and after dose reduction for chest CT in Thailand.

52
FIG. III.13. Comparison of noise before and after dose reduction for chest CT in Greece.
FIG. III.14. Noise in chest CT examinations measured at the levels of the pulmonary hilum (chest 1), the aorta (chest 2) and the liver.

53
TABLE III.1. MEASURED IMAGE NOISE AND TARGET NOISE FOR CHEST CT
Weight Greece India Thailand Poland
15–25 18.4
25–40 9 13.6 11.4 13
40–59 11.9 12.9 10.9 15.5
60–79 11.1 14.4 12.8 14.6
80–89 13.6 12.2 13
>90 14.5


55
LIST OF CONTRIBUTORS AND REVIEWERS
Aldrich, J. Vancouver Hospital, Canada
Hufton, A. Christie Hospital, United Kingdom
Kalra, M.K. Massachusetts General Hospital, United States of America
Krisanachinda, A. Chulalongkorn University, Thailand
Malchair, F. International Atomic Energy Agency
Malone, J. Private consultant, Ireland
Prokop, M. University Medical Center Utrecht, Netherlands
Rehani, M.M. International Atomic Energy Agency
Sharma, R. All India Institute of Medical Sciences, India
Staniszewska, M. Nofer Institute of Occupational Medicine, Poland
Tsapaki, V. Konstantopoulio Agia Olga Hospital, Greece
Consultants Meetings
Vienna, Austria: 3–7 March 2003
Manchester, United Kingdom: 28 June–2 July 2004
Athens, Greece: 21–25 October 2005