double metal-insulator transitions and mr in la0.67ca0 ... [email protected] phone:...
TRANSCRIPT

1
1
Double metal-insulator transitions and MR in La0.67Ca0.33Mn1-xRuxO3 (x ≤ 0.10): A qualitative understanding in light of possible magnetic phase separation
L. Seetha Lakshmi, V. Sridharan , D.V. Natarajan, Rajeev Rawata, Sharat Chandra,
V.Sankara Sastry and T.S. Radhakrishnanb Materials Science Division, Indira Gandhi Centre for Atomic Research,
Kalpakkam 603102, Tamil Nadu, India a Inter University Consortium for DAE Facilities, Khandwa Road, Indore,
Madhya Pradesh, India. bPresent contact e-address: [email protected]
Abstract: We report results of the magnetotransport measurements on La0.67Ca0.33Mn1-xRuxO3 (0 ≤ x ≤ 0.1) compounds in the light of proposed magnetic phase separation in our previous work wherein two metal to insulator transitions (MITs) were reported (Ref.: L.Seetha Lakshmi et.al, J.Magn.Magn. Mater. 257, 195 (2003)). With the application of magnetic field, a significant reduction in resistance and a shift in MITs to higher temperatures but with different rates are observed. The temperature dependent magnetoresistance (MR) exhibits two maxima, a pronounced one at higher temperature and a shallow one at low temperature, corresponding to the two MITs. The peak value of MR at high temperature MITs (H=5T) does not change systematically with Ru concentration. The low temperature MR peak becomes perceptible for x ≥ 0.03 and shows a nominal enhancement with Ru concentration. The double maxima, both exhibiting magnetoresistance phenomena in the magnetotransport properties of Ru doped manganites are analysed within the context of magnetic phase separation. PAC numbers: 75.30 .Vn Key words: manganites; Ru substitution; colossal magnetoresistance; phase separation; ----------------------------------------------------------------------------------------------------------------
Corresponding Author: Dr. V. Sridharan, Materials Science Division, Indira Gandhi Centre for Atomic Research, Kalpakkam, Tamil Nadu – 603 102, India Email: [email protected] Phone: +91-04114-280081: Fax-091-04114-280081

2
2
Introduction:
The underlying mechanism governing the colossal magnetoresistance (CMR)
in the mixed valent perovskite manganites is still a matter of discussion. Enormous
efforts in the theoretical as well as in the experimental fronts have clearly established
that the earlier proposals, such as Double Exchange Mechanism [1-3], strong
electron phonon coupling manifesting in the form of Jahn–Teller polarons [4-6],
Anderson type localizations [7-8] are inadequate for a realistic explanation for the
CMR phenomena and its ground state properties. The detailed numerical studies by
Dagotto et. al [9-12] indicate that manganites, belonging to strongly correlated
electron systems exhibit a tendency towards intrinsically inhomogeneous states.
Abundant experimental works also have established the presence of such
inhomogeneous states [13-19]. Thus, the CMR phenomenon is shown to be linked to
phase co-existence over a wide range of temperature with different magnetic and
electrical properties and to the competition between them. From the present
understanding, the mixed phase tendencies are broadly categorised into two types:
the electronic phase separation involving two phases with different electronic density
with nanometer scale clusters and the disorder induced phase separation with
percolative characteristics between equal density of states near its first order MITs
forming co-existing clusters in the sub-micrometer scale [13].
As the essential degrees of freedom pertinent to the manganites such as spin,
charge, lattice and orbital are intimately linked to Mn ion, any perturbation at the Mn
site is expected to modify its ground state properties [20-26]. In this context, role of
Mn-site substitutions on the electrical as well as the magnetotransport properties
should be studied within the framework of mixed phase tendency. In the process of
understanding the role of local structure due to the modified ionic size at the Mn site

3
3
as well as the local magnetic coupling on the ground state properties of CMR
manganites, we have carried out diamagnetic (Al3+, Ga3+, Ti4+, Zr4+ and Hf4+) as well
as paramagnetic substitutions (Fe3+ and Ru4+) at the Mn site of La0.67Ca0.33MnO3, a
canonical example of intermediate bandwidth CMR manganites [27-30]. It is found
that all substitutions suppress the transition temperatures to different extent and
eventually modify the Ferromagnetic-Metallic (FM-M) ground state to a cluster glass
(CG). Wide variation in the rate of suppression of the transition temperatures on
substitution with a FM-M ground state are understood in terms of the effect of local
structure as well as local magnetic coupling at the Mn site. It is noteworthy that
paramagnetic Ru4+ ion, with smaller ionic radius as compared to Mn3+ suppresses
the transition temperatures at a rate of 3 K/at. %, the least reported in the Mn site
substituted CMR manganites [29]. Among the paramagnetic substitutions, Ru is
reported to be the most efficient in inducing ferromagnetism and metallicity in the
charge ordered rare earth manganites [31-35], with a MIT as high as 240 K, where
as in others it was reported to be typically less than 150K [32]. Hence, Ru appears
to be exceptional among the paramagnetic substitutions, which will provide a better
insight into the role of local magnetic coupling on the transport properties of
manganites.
In our previous work [29], we have reported the structural, electrical and
magnetic properties of Ru doped La0.67Ca0.33MnO3 compounds. From the increase in
the lattice parameters and the expansion in the unit cell in the composition range (x ≤
0.085) studied, we infer Ru to be in the mixed valence state of Ru3+ and Ru4+, rather
than Ru4+ and/or Ru5+ reported in other manganites [31,35]. Double MITs -
characterised by a high temperature maximum followed by a broad low temperature

4
4
maximum spanning a relatively wider temperature range, both shifting to lower
temperatures, at a rate of 2.3 and 17 K/at% respectively- could be seen in the
temperature dependence of electrical resistivity. Unlike the high temperature
maximum, no magnetic feature could be discerned either in ac susceptibility or in dc
magnetization associated with the low temperature broad maximum in the electrical
resistivity. Based on the structural, magnetic and electrical properties, we proposed a
magnetic phase separation in the system with two FM-M phases coexisting in the
ground state. In this paper, we report the magnetotransport properties of
La0.67Ca0.33Mn1-xRuxO3 (0 ≤ x ≤ 0.10) compounds under an applied magnetic field of
1 and 5T. The field dependent resistance was also measured at 300, 235, 125 and 5
K. The experimental results will be analysed within the framework of a magnetic
phase separation occurring in the system.
Experiment:
La0.67Ca0.33Mn1-xRuxO3 (0 ≤ x ≤ 0.10) compounds were synthesized by a
standard solid state reaction between the stoichiometric mixtures of La2O3, CaCO3,
MnO2 and RuO2 according to the procedure reported in our previous work [29]. High-
resolution room temperature powder X-ray diffraction (XRD) patterns were recorded
in the 2θ range 15-120° using a STOE (Germany) diffractometer. The temperature
variation of resistivity in the temperature range 300 - 4.2 K was measured in van der
Pauw geometry [36]. Silver paint was used for the electrical contacts for the disc
shaped pellets. The ac susceptibility measurements were performed on powder
samples using a home-built ac susceptometer under an average field of 0.25 Oe at a
frequency of 947 Hz. In our discussion, the in-phase component of ac susceptibility
(χ') alone is considered. The magnetoresistance measurements (MR) in an applied

5
5
magnetic field H of 1 and 5T were carried out on the rectangular bar shaped pellets
by a standard four-probe method. A superconducting magnet was employed with the
magnetic field direction parallel to the current direction. The field dependent MR
measurements were also carried out at 300, 235, 120 and 5 K. Differential Scanning
Calorimeter (Mettler DSC821e) measurements were performed in the temperature
interval 160 -300 K with Ar as purge gas.
Results and Discussion
The room temperature powder XRD patterns of the compounds are shown in
Fig. 1. From the XRD studies, the compounds were found to be monophasic. Over
the entire range of composition of Ru under the present study, the structure was
determined to be orthorhombic (SG: Pnma). The lattice parameters and the unit cell
volume were found to increase with Ru substitution. The detailed analysis of the
structural characterization was published elsewhere [29]. The temperature variation
of resistivity (ρ(T)) of La0.67Ca0.33Mn1-xRuxO3 (0 ≤ x ≤ 0.10) compounds in the
absence of an applied magnetic field are shown in Fig. 2. The virgin compound,
La0.67Ca0.33MnO3 undergoes a metal to insulator transition (MIT) characterised by a
maximum at T=TMI in the ρ(T) curve. Close to this transition, a ferromagnetic to
paramagnetic transition at T=TC could also be observed. Interestingly, Ru
substitution results in two maxima in the ρ(T) curve, a high temperature maximum at
T=TMI1 followed by a low temperature maximum at T=TMI2 spanning relatively wider
temperature range. Both the maxima were found to shift to lower temperatures with
the Ru substitution. While the former shifts at a rate of ~3K/at. % up to x=0.085 and
much more rapidly for x=0.10, the smallest rate reported for the Mn-site substituted
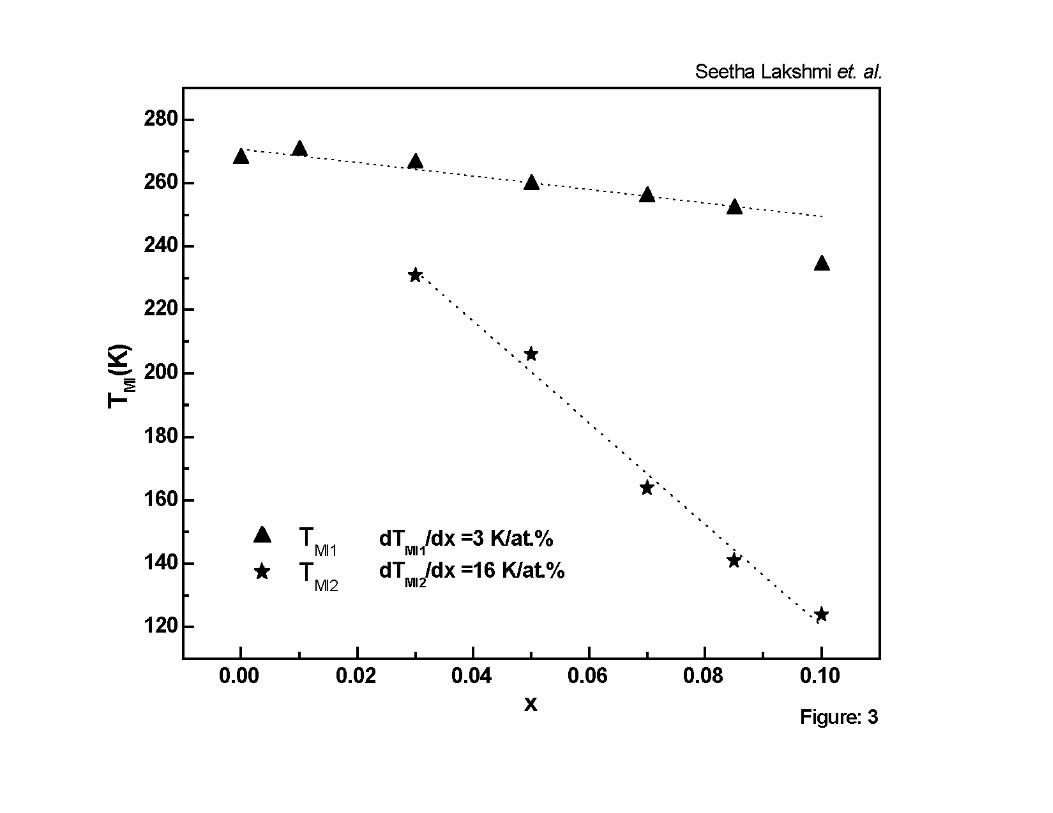
CMR manganites, the latter shifts at a rate of 16 K/at. % (Fig. 3). This is in contrast

6
6
to charge ordered Ru doped La0.4Ca0.6MnO3 [33], wherein the second peak is
reported not to shift with doping but remained centred at 125 K.
The ferro to paramagnetic transition temperature closely matches with TMI1
and decreases with Ru substitution at the same rate as that of TMI1. But no
characteristic feature of magnetic transition associated with TMI2 could be observed
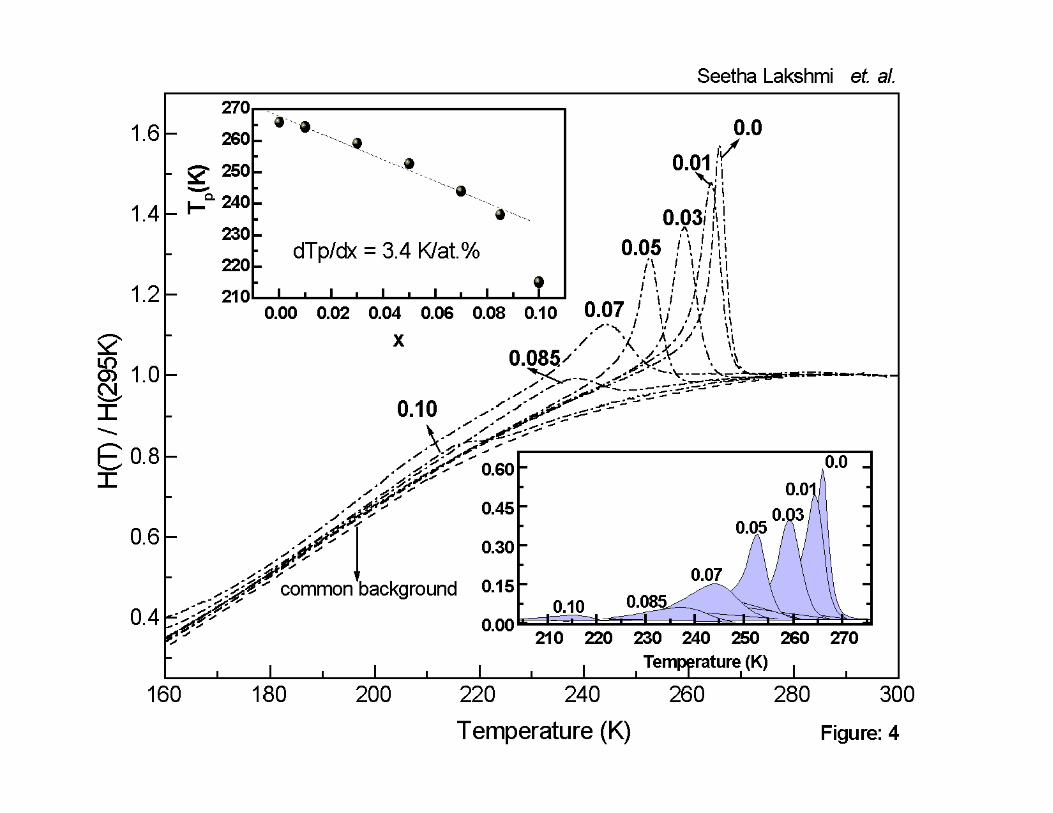
in the χ' signal [29]. Figure 4 shows the normalised DSC thermograms of compounds
in the temperature interval of 160 to 300 K. A smooth background (dashed line in
Fig. 4) common to these thermograms was subtracted and the resultant DSC curves
are shown as the lower right inset in Fig. 4. In all the thermograms, a single peak
alone could be seen. This peak shifts to lower temperatures (upper inset panel of
Fig. 4) and becomes progressively broader with an increase of Ru concentration.
These observations are in general agreement with that of susceptibility
measurements. The progressive broadening of DSC peaks as well as χ' signal with
an increase in Ru doping clearly demonstrates that the system is magnetically
inhomogeneous. This is further supported by a non-liner decrease in the magnetic
moment upon Ru substitution [29].
In our previous work, we have interpreted the double MITs in the Ru doped
La0.67Ca0.33MnO3 compounds in terms of possible magnetic phase separation: two
ferromagnetic metallic (FM-M) phases co-existing in the ground state. The FM-M
phase with dTC/dx~3K/at. % corresponds to a Ru4+ rich region wherein the Ru4+
couples ferromagnetically with the neighbouring Mn spins. The other FM-M phase
(with dTC/dx~16 K/at.%) being a Ru3+ rich region with a local antiferromagnetic
coupling of the Ru3+ with neighbouring Mn spins. Of the two, the latter is a poor
conducting magnetic phase. Weigand et. al. from MXCD measurements, have
shown such an local antiferromagnetic coupling between mixed valent Ru3+ and Ru4+

7
7
and Mn ions for the Ru substituted layered manganite La1.2Sr1.8Mn2O7 [37].The
presence of a local antiferromagnetic coupling between Fe3+ (isoelectronic of Ru3+)
and neighbouring Mn ions in La0.67Ca0.33Mn1-xFexO3 is well-established [38].
Complementing the previous work, magnetoresistance as a function of
temperature under the applied magnetic field of 1 and 5T were carried out. For the
sake of clarity, representative curves are shown in Fig. 5. With the application of
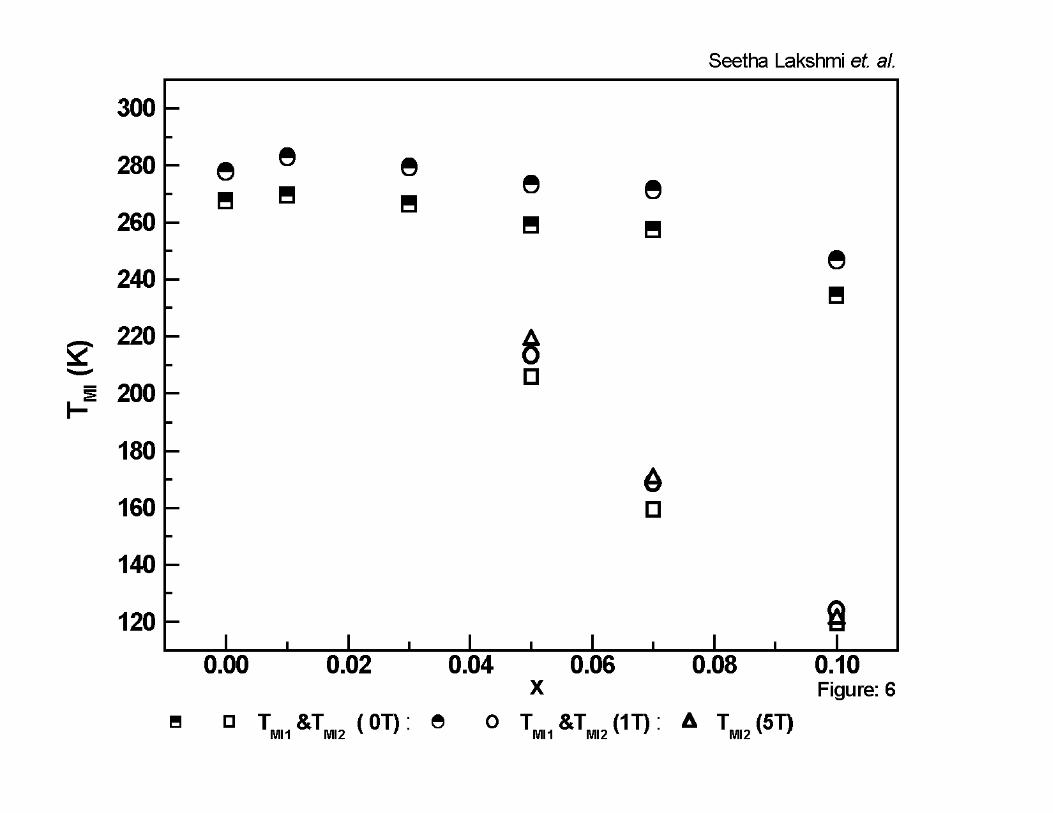
magnetic field, both the maxima broaden and shift to higher temperatures (Fig. 5), a
characteristic feature of the CMR manganites. As the magnetic field further broadens
the inherently broad TMI2, we could not determine the same for x = 0.01 and 0.03.
While the magnetic field of 1T shifts TMI1 more or less constantly by 14K (Fig. 6), for
5T the peak shifts beyond the maximum temperature range of measurement, viz.,
300K . On the other hand, shift of TMI2 under 1 and 5T is not constant over the
doping range of present study; it decreases with an increase of Ru composition and
for x = 0.10, a negligible shift is observed (Fig. 6).
A significant reduction in the resistance, on application of magnetic field was
observed over the entire temperature range of study. The magnetoresistance
defined as
MR = -100* (R[H]-R [0])/ R [0]
was calculated and are shown in Fig. 7 (a) and (b) for H=1 and 5T respectively. It is
seen from Fig. 7(a) that for all Ru concentrations, the MR (H=5T) exhibits a dominant
maximum at high temperature. A weak but definite maximum at lower temperature is
also observed (marked by arrows) which becomes dominant and distinct for x = 0.1.
There is a overall agreement between the TMI s and corresponding maximum in the
MR. The magnetoresistance curves for H=1T exhibits a prominent maximum
corresponding to TMI1, a semblance of it could be seen at lower temperatures
8
8
(corresponding to TMI2). The high temperature MR peaks for H=5T are considerably
broader compared to that of H=1T. Also, for a given magnetic field, the MR peak
shifts to lower temperature, in accordance with the shift of TMI1 and gets
progressively broader as well with an increase of Ru concentration. There also exists
a significant magnetoresistance away from the peaks showing a weak temperature
dependence on further lowering the temperature, a characteristic feature of
polycrystalline manganites [39,40].
Figure 8 (a, b, c & d), shows the variation of MR at 300K, 235K (TMI1 of
x = 0.1), 120 K (~ TMI2 of x = 0.1) and 5K respectively. In the paramagnetic state
(300 K), MR of the samples decreases with field exhibiting a H2 dependence and at
any given field strength, it decreases with the increase of Ru. In contrast to this, the
low temperature MR exhibits a sharp linear decrease at low fields (<1T) followed by
a much slower linear decrease above 1 T. The low field MR absent for the single
crystals, is due to grain boundary (GB) arising from the intergrain tunnelling of the
spin polarised electrons [41,42]. The GB MR enhances as the temperature is
lowered leading to a well-developed knee structure (Fig. 8(c) and 8(d)). The MR of
the x = 0.1 compound is the highest at 235 K and 120 K (Fig. 8(b) and 8(c)) which
correspond to its TMI1 and TMI2. The contribution of GB to MR is estimated by back
extrapolating the linear high field slope and finding its intercept at zero magnetic field
[40]. The value of the MR due to GB at 5 K is ∼ 24% and does not vary much with
substitution.
Presence of double maxima feature in the ρ(T) curve has been reported by
many workers. Most of these reports had attributed the origin of the double maxima
feature to extrinsic factors such as the grain size (GS), grain boundary (GB) and
oxygen off-stiochiometry [43-49]. Presence of two peaks have also been reported for

9
9
the Ln-site substituted LnMnO3 system with Ce4+ ion [43]. However, it was shown
that samples were multiphasic evidenced by the presence of additional peak(s) in
the XRD pattern. From the high statistics XRD pattern collected, we exclude the
presence of impurity phase with volume fraction more than 1% and no peak was left
unindexed. Additionally, the transition temperatures determined from the resistivity,
ac susceptibility and DSC measurements are in close agreement and decrease
linearly over the entire composition range ruling out impurity phase formation.
Hence, secondary phase could be ruled out as being the cause for the double
maxima in the ρ(T). Two maxima in the ρ(T) are reported for samples with GS less
than 1 µm and the MR(T,H) curves exhibit a single peak only [49]. On the other
hand, as the GS of all samples of present study are in the range 15 to 20 µm [29],
we unambiguously exclude the GS as being the cause of low temperature maximum.
The insensitiveness of the GBMR to the Ru substitution implies that GB is not altered
an extent to warrant a low temperature maxima [49].
Oxygen deficiency (δ) in La0.7Ca0.3MnO3-δ is also reported to result in two
maxima in the resistivity curve [49]. With the increase of δ, the “magnitude” of the low
temperature maximum increases and shifts to lower temperature. If the low
temperature maximum observed in the present study is due to oxygen
off-stoichiometry, then from the reported shift of this peak the value of δ is estimated
to be as high as δ=0.2. However, such a large value of δ is reported to produce a
structural change [50], which we do not observe as evident from XRD data. Also,
such large value of δ should have resulted in drastic increase in the value of ρo,
typically by few orders of magnitude. On the other hand, such a large change in ρo is
not observed in our compounds. We conclude that oxygen off-stoichiometry is not
the cause for the low temperature maximum upon Ru substitution. From the
10
10
foregoing discussions, it is seen that the low temperature maximum in ρ(T) curve is
intrinsic and is associated with a metal to insulator transition. It is noteworthy that
such a feature is present in certain paramagnetic ions substituted at the Mn site of
CMR manganites [23,51,52].
The peak in the resistivity of (La:Ca)MnO3 system is understood in the context
of phase separation; coexistence of a ferromagnetic-metallic (FM-M) phase and an
antiferromagnetic insulating phase. The FM-M phase, present as clusters of ~12Å
size in the paramagnetic-insulating regime, grows as the temperature is lowered
from the paramagnetic state [16]. As the critical volume (VC) for percolative
conductivity is reached, a sharp fall in the resistance is observed. This results in a
maximum in the resistivity. At a given temperature, application of magnetic field
enhances the volume fraction of the FM-M phase and the VC is attained at a higher
temperature. This results in the shift of the maximum to higher temperature; higher
the field strength, larger will be the shift of the maximum. Thus, the application of the
magnetic field results in the enhancement in the volume fraction of FM-M phase
leading to reduction in the resistivity and shifts the maximum to higher temperature.
However, dramatic changes in the resistivity will be seen close to VC, i.e. near TMI,
largely due to the contrast in the conductivity of the percolating conducting phase
and the insulating matrix. The shift of the maximum to higher temperature along with
reduction in ρ in the presence of magnetic field results in colossal magnetoresistance
at about TC.
The scenario is somewhat different in the case of magnetic phase separation
wherein two ferromagnetic metallic phases co-exist in its ground state. As the
sample is cooled down from higher temperatures (i.e. paramagnetic insulating
phase) a ferromagnetic phase (FM-M1) evolves within a paramagnetic (PM) matrix,

11
11
having appreciable resistivity contrast between the phases. Upon reaching VC, FM-
M1 establishes a percolative path and the resistivity drops drastically resulting in a
maximum in ρ(T). On further cooling, the PM phase itself undergoes a para to
ferromagnetic transition. As the system is percolatively conducting below the TMI1,
magnetic transition of the PM phase is not expected to produce drastic drop in the
resistivity, as seen for TMI1. The magnetic field results in an expected shift of TMI1 to
higher temperature. Such a shift is not expected in the case of TMI2 for the reason
that the magnetic transition of PM phase takes place within a conducting FM-M1
matrix with a low conductivity contrast. Such a low conductivity contrast results in an
almost vanishing magnetoresistance maximum corresponding to TMI1 for H = 1 T.
This signal grows into a broad maximum under a magnetic field of 5 T but far smaller
compared to that of TMI1. These features, negligible shift of TMI2 and substantially
reduced MR maximum associated with TMI2 support our conjecture of magnetic
phase separation occurring in La0.67Ca0.33Mn1-xRuxO3.
In passing, we also wish to bring another interesting observation
concerning the magnetoresistance. As pointed out, the higher temperature MR
maximum, for H=1 & 5 T shifts to lower temperature with Ru doping (Fig. 6(a) &
6(b)). However, the value of MR at the maximum does not change appreciably
among the Ru substituted systems. This is in contrast to La-site substituted systems
wherein magnitude of MR is shown to exponentially increase with the decrease of
TC.
In summary, Ru substituted system exhibits two maxima in the resistivity
variation with temperature. It is shown that they are intrinsic and are attributed to the
metal to insulator transition. While the high temperature transition shifts to higher
temperature with the application of magnetic field, relatively a negligible shift is

12
12
observed for the low temperature transition. This result in an appreciable
magnetoresistance associated with the former transition, but only a sparing
magnetoresistance for the low temperature transition. These features are explained
in terms of magnetic phase separation: coexistence of two ferromagnetic metallic
phases in its ground state.
Acknowledgement:
Authors thank Ms. T. Geetha Kumary and Dr. Y. Hariharan for extending the low
temperature experimental facilities. L.Seetha Lakshmi also thanks Council of
Scientific and Industrial Research, New Delhi for awarding a Senior Research
Fellowship.

13
13
References: [1] C. Zener, Phys. Rev. 82 (1951) 403.
[2] P.W. Anderson, H. Hasegawa, Phys. Rev. 100 (1955) 675.
[3] P.G. de Gennes, Phys. Rev. 118 (1960) 141.
[4] A. J. Millis, Nature 392 (1998) 147.
[5] A. J. Millis, P.B. Littlewood, B.I. Shraiman, Phys. Rev. Lett. 74 (1995) 5144.
[6] A. J. Millis, B.I. Shraiman, R. Mueller, Phys. Rev. Lett. 77 (1996) 175.
[7] J. M. D. Coey, M. Viret, L. Ranno, K. Ounadjela, Phys. Rev. Lett. 75 (1995)
3910.
[8] L. Sheng, D.Y. Xing, D.N. Sheng, C. S. Ting, Phys. Rev. B 56 (1997) R 7053.
[9] E. Dagotto, T. Hotta, A. Moreo, Phys. Reports 344 (2001) 1.
[10] J. Burgy, M. Mayor, V. Martin-Mayor, A. Moreo, E. Dagotto, Phys. Rev. Lett.
87 (2001) 277202.
[11] A. Moreo, M. Mayor, A. Feiguin, S. Yunoki, E. Dagotto, Phys. Rev. Lett. 84
(2000) 5568.
[12] M. Mayor, A. Moreo, J. Verges, J. Arispe, A. Feiguin, E. Dagotto,
Phys. Rev.Lett 86 (2001) 135.
[13] M. Uehara, S. Mori, C. H. Chen, S. W. Cheong, Nature 399 (1999) 560.
[14] M. Fath, S. Freisem, A. A. Menovsky, Y. Tomioka, J. Aarts , J. A. Mydosh,
Science 285, (1999) 1540.
[15] S. J. L. Billinge, Th. Proffen, V. Petkov, J. L. Sarrao, S. Kycia,
Phys. Rev. B 62 (2000-II) 1203.
[16] J. M. De Teressa, M. R .Ibarra , P. A .Algarabel, C. Ritter, C. Marquina,
J. Blasco, J. Garcia, A. del Moral, Z. Arnold, Nature 386 (1997) 256 .
[17] J. W. Lynn, R. W. Erwin, J. A. Borchers, Q. Huang, A. Santoro, J. L Peng,

14
14
Z.Y. Li, Phys. Rev. Lett. 76 (1996) 4046.
[18] G. Allodi, R. De Renzi, G. Guindi, F. Licci, M.W. Pieper, Phys. Rev. B
56 (1997) 6036.
[19] R. H. Heffner, J. E. Sonier, D. E. Mac Laughlin, G. J. Nieuwenhuys, G. Ehlers,
F. Mezei, S. W. Cheong, J. S. Gardner, H. Röder, Phys. Rev. Lett. 85 (2000)
3285.
[20] J. Blasco, J. Garcia, J.M. de Teresa, M.R. Ibarra, J. Perez, P.A. Algarabel,
C. Marquina, C. Ritter, Phys. Rev. B 55 (1997) 8905.
[21] Xianming Liu, Xiaojun Xu, Yuheng Zhang, Phys. Rev. B 62 (2000) 15 112.
[22] Young Sun, Xiaojun Xu, Lei Zheng, Yuheng Zhang, Phys. Rev. B 60 (1999)
12317.
[23] Young Sun, Xiaojun, Yuheng Zhang, Phys. Rev. B 63 (2001) 54404.
[24] N. Gayathri, A.K. Raychaudhuri, S.K. Tiwary, R. Gundakaram, Anthony Arulraj,
C.N.R. Rao, Phys. Rev. B 56 (1997) 1345.
[25] K. M. Krishnan, H. L. Ju, Phys. Rev. B 60 (1991) 14 793.
[26] K.H. Ahn, X.W. Wu, K. Liu, C.L. Chien, J. Appl. Phys. 81 (1997) 5505.
[27] V. Sridharan, L. Seetha Lakshmi, R. Nithya, R. Govindraj, D.V.Natarajan,
T.S.Radhakrishnan, J. Alloys. Comp. 326 (2001) 65.
[28] L.Seetha Lakshmi, V. Sridharan, D.V. Natarajan, V. Sankara Sastry,
T.S. Radhakrishnan, Pramana, J. Phys. 58 (2002)1019.
[29] L. Seetha Lakshmi, V. Sridharan, D.V. Natarajan, V. Sankara Sastry ,
T.S. Radhakrishnan, Ponnpandian, R. Justine Joseyphus,
A. Narayananasamy, J. Magn. Magn. Mater, 257 (2003) 195.
[30] L.Seetha Lakshmi, V. Sridharan, D.V. Natarajan, Sharat Chandra,
R.Rajaraman, V. Sankara Sastry ,T.S. Radhakrishnan ( under communication).
15
15
[31] A. Maignan, C. Martin, M. Hervieu, B. Raveau, J. Appl. Phys. 89 (2001) 500.
[32] S. Hebert, A. Maignan, C. Martin, B. Raveau, Solid State Commun. 121 (2002)
229.
[33] B. Raveau, A. Maignan, C. Martin, R. Mahindran, M. Hervieu, J. Solid State
Chem. 151 (2000) 330.
[34] J. S. Kim, D. C. Kim, G. C. McIntosh, S. W. Chu, Y. W. Park, B. J. Kim,
Y. C. Kim, A. Maignan, B. Raveau, Phys. Rev. B 66 (2002) 224427.
[35] C. Autret, C. Martin, A. Maignan, M. Hervieau, B. Raveau, G. Andre,
F. Bouree, A. Kurbakov V. Trounov, J. Magn. Magn. Mater. 241(2002) 303.
[36] van der Pauw, Philips Res. Repts, 13 (1958) 1.
[37] F. Weigand, S. Gold, A. Schmid, J. Geissler, E. Goering, K. Dorr, G. Krabbes,
R. Ruck, Appl. Phys. Lett. 81 (2002) 2035.
[38] S. B. Ogale, R. Shreekala, R. Bethe, S. K. Date, S.I. Patil, B. Hannoyer,
F. Petit, G. Marest, Phys. Rev. B 57 (1998) 7841.
[39] H.L. Ju, J. Gopalakrishnan, J.L. Peng, Q. Li, G.C. Xiong, T. Venkatesan,
R.L. Greene, Phys. Rev. B 51 (1995) 6143.
[40] H.L. Ju, H. Sohn, Solid State Commun.102 (1997) 463.
[41] H. Y. Hwang, S. W. Cheong, N. P. Ong, B. Batlogg, Phys.Rev.Lett 77 (1996)
2041.
[42] P. Lyu, D.Y. Xing, J. Dong, J. Magn. Magn. Mater. 202 (1999) 405.
[43] J. R. Gebhardi, S. Roy, N. Ali, J. Appl. Phys. 85 ( 1999) 5390.
[44] N. Zhang, W. Ding, W. Zhong, D. Xing, Y. Du, Phys. Rev. B 56 ( 1997) 8138.
[45] P. Mandal, S. Das, Phys. Rev. B 56 (1997) 15703.
[46] M. Izumi, Y. Konishi, T. Nishihara, Appl. Phys. Lett. 73 ( 1998) 2497.
[47] J. R. Sun, G. H. Rao, Y. Z. Zhang, Appl. Phys. Lett. 72 (1998) 3208.

16
16
[48] K. M. A. Hossain, L. F. Cohen, T. Kodenkandeth, J. Macmanus- Driscoll,
N. McN. Alford, J. Magn. Magn.Mater. 195 (1999) 31.
[49] L. Malavasi, M. C. Mozzati, C. B. Azzoni, G. Chiodelli, G. Flor, Solid State
Commun.123 ( 2002) 321.
[50] C. Ritter, M. R. Ibarra, J. M. De Teresa, P. A. Algarabel , C. Marquina,
J. Blasco, J. Garcia, S. Oseroff, S. W. Cheong, Phys. Rev. B 56 (1997) 8902.
[51] C. L. Yuan, Y. Zhu, P. P. Ong, Solid State Commun.120 (2001) 495.
[52] F. Rivadulla, M. A. Lopez- Quintela, L. E. Hueso, P. Sande, J. Rivas,
R. D. Sanchez, Phys. Rev. B 62 (2000) 5678.

17
17
Figure Captions:
1. High statistics room temperature powder X-ray diffraction patterns of
La0.67Ca0.33Mn1-xRuxO3 compounds ( x = 0, 0.01, 0.03, 0.05, 0.07, 0.085 & 0.10 ).
2. Temperature dependence of resistivity of La0.67Ca0.33Mn1-xRuxO3 compounds
( x = 0, 0.01, 0.03, 0.05, 0.07, 0.085 & 0.10) in the absence of magnetic field.
3. Variation of metal to insulator transition temperatures (TIM1 &TIM2) as a function of
Ru concentration (x) of La0.67Ca0.33Mn1-xRuxO3 compounds ( x = 0, 0.01, 0.03,
0.05, 0.07, 0.085 & 0.10). Dotted lines are the best linear fit to the experimental
data to estimate the rate of suppression in the transition temperatures.
4. DSC curves of La0.67Ca0.33Mn1-xRuxO3 compounds ( x = 0, 0.01, 0.03, 0.05, 0.07,
0.085 & 0.10). Upper panel of the inset shows the variation of the peak
temperature as a function of Ru concentration. Dotted line is the best linear fit to
estimate the rate of suppression of the transition temperature. Lower panel of the
inset shows the variation of the area under the peak as a function of Ru
concentration, after subtracting a common background. Refer text for details.
5. Temperature dependence of resistance of La0.67Ca0.33Mn1-xRuxO3 compounds.
Under a magnetic field of 0 (closed circles), 1 (solid line) and 5 T (dotted line).
Representative curves of x = 0,0.03, 0.05, 0.07 & 0.10 are given for the sake of
clarity. Refer text for details.
6. Variation of magnetoresistance peaks (TIM1& TIM2) as a function of Ru
concentration of La0.67Ca0.33Mn1-xRuxO3 compounds ( x = 0, 0.03, 0.05, 0.07 &
0.10 ) under a magnetic field of 1 and 5T.
7. Temperature dependence of magnetoresistance (MR) of La0.67Ca0.33Mn1-xRuxO3
compounds. Representative curves of x = 0.03, 0.05, 0.07 & 0.10 are given. Up

18
18
(a) H= 1T; (b) H= 5T. For the sake of clarity, similar curves for x=0.0 are given in
the inset of each panel
8. Field dependence of magnetoresistance at 300 (a), 235 (b), 120 (c) & 5 K (d))
of La0.67Ca0.33Mn1-xRuxO3 compounds (x =0, 0.03, 0.05, 0.07 & 0.10).


0 50 100 150 200 250 3000.00.10.20.30.4
Seetha Lakshmi et. al.
Figure: 5
x=0.0
0.000.040.080.120.16
0.000.040.080.120.160.20
x=0.03
x=0.05
0.000.040.080.120.16
Resis
tance
(ohm
)
Temperature (K)
0.2
0.4
0.6
0.8
5 T
5 T
5 T
1 T
1 T
1 T
0 T
0 T
0 T
5 T
1 T
0 T
5 T
1 T
0 T
x=0.07
x=0.10


0 1 2 3 4 5-80-60-40-20
0
Seetha Lakshmi et. al
Figure :8
MR =
{R[H
]-R[0]
}/R[0]
(%)
H (T)
-80-60-40-20
0
-80-60-40-20
0
-80-60-40-20
0
(d) 5 K
(c) 120 K
(b) 235 K
(a) 300 K 0.00 0.03 0.05 0.07 0.10