doubling your monetary base and surviving: some international
TRANSCRIPT

FEDERAL RESERVE BANK OF ST. LOUIS REVIEW NOVEMBER/DECEMBER 2010 481
Doubling Your Monetary Base and Surviving:Some International Experience
Richard G. Anderson, Charles S. Gascon, and Yang Liu
The authors examine the experience of selected central banks that have used large-scale balance-sheet expansion, frequently referred to as “quantitative easing,” as a monetary policy instrument.The case studies focus on central banks responding to the recent financial crisis and Nordic centralbanks during the banking crises of the 1990s; others are provided for comparison purposes. Theauthors conclude that large-scale balance-sheet increases are a viable monetary policy tool providedthe public believes the increase will be appropriately reversed. (JEL E40, E52, E58)
Federal Reserve Bank of St. Louis Review, November/December 2010, 92(6), pp. 481-505.
rently sparse empirical evidence suggests thatquantitative easing actions likely must be largebecause the private-sector’s substitution elastici-ties among high-quality financial assets are small.
In this article, we examine the experience ofselected central banks that have used large-scalebalance-sheet expansion as a policy instrument.We conclude that such increases are a viablemonetary policy tool for central banks with sig-nificant independence and credibility, assumingthe public believes the increase will be appropri-ately reversed.
To some analysts, large balance-sheetincreases raise the specter of higher inflation.Historically, an absence of fiscal discipline wasthe cause of large-scale increases in central bankbalance sheets. Sargent (1982), for example,reviews cases of hyperinflation and Meltzer (2005)reviews monetary policy in the United States dur-
T he recent financial crisis has challengedmonetary policymakers around theworld on a scale that has not been seensince the 1930s. In normal times, the
monetary policy for most central banks is imple-mented by (i) targeting an overnight interest rateand (ii) holding as assets securities issued bythe country’s own national treasury. In somecases, a central bank’s assets also include foreignexchange or other nations’ sovereign debt. Whenlarge shocks occur and in response the policyrate has already been reduced to (near) zero,some central banks have aggressively expandedtheir balance sheet, a policy widely referred toas quantitative easing.1 In the United States, forexample, the Federal Reserve’s mid-2010 balancesheet was approximately triple its size of twoyears earlier.
The essence of quantitative easing policies isthe purchase of assets from the private sectorwith newly created central bank deposits; suchexchanges promise to reduce both risk and termpremia in longer-term interest rates.2 The cur-
1 See Bernanke and Reinhart (2004).
2 See Bernanke, Reinhart, and Sack (2004). Purchasing lower-qualityassets raises discussion of the boundary between monetary andfiscal policy. Recent academic papers include those by Jeanne andSvensson (2007), Cúrdia and Woodford (2010a,b), Gertler andKaradi (2009), Reis (2009), Borio and Disyatat (2009), andSöderström and Westermark (2009).
Richard G. Anderson is an economist and vice president, Charles S. Gascon is a research support coordinator, and Yang Liu is a researchassociate at the Federal Reserve Bank of St. Louis.
© 2010, The Federal Reserve Bank of St. Louis. The views expressed in this article are those of the author(s) and do not necessarily reflect theviews of the Federal Reserve System, the Board of Governors, or the regional Federal Reserve Banks. Articles may be reprinted, reproduced,published, distributed, displayed, and transmitted in their entirety if copyright notice, author name(s), and full citation are included. Abstracts,synopses, and other derivative works may be made only with prior written permission of the Federal Reserve Bank of St. Louis.

ing the late 1960s and 1970s. Recent actions inthe United States, United Kingdom, Switzerland,Australia, and others have proactively used mas-sive balance-sheet changes as a policy tool whilesustaining a commitment to avoid rapid inflation.
SOME MACROECONOMIC THEORY
Our principal lesson—that large, visiblemoney injections made in response to specialevents can increase near-term economic activitywithout increasing inflation if policymakers credi-bly commit to reverse the increase at a later date—arises in a variety of macro models. The keyelement is that inflation expectations are littleaffected by increases in central bank balancesheets that are perceived as temporary. Goodfriendand King (1981) showed this result in the contextof Barro’s (1976) rational expectations model byintroducing a central bank that credibly commitsto a long-run path for the money stock even whilesharply increasing the near-term money supply.3
Recently Berentsen and Waller (2009) showed thesame result in a search-theoretic real businesscycle model.4 In contrast, many early rationalexpectations macroeconomic models (during the1970s) specified that all changes in the moneysupply were unanticipated and permanent—thatis, the money stock followed a random walk. Insuch models, changes in the money stock, becausethey were anticipated to be permanent, causedthe price level to jump and real economic activityto remain unchanged. Similar results arise in theclassical long-run equilibria of New Keynesianmodels that contain incomplete information and
adjustment costs, although there may be interimincreases in economic activity.5
A central bank’s promise to reverse a large-scale balance-sheet increase in a timely fashionlacks credibility if the central bank is not suffi-ciently independent of the political process.Although earlier studies tended to be equivocalregarding a negative correlation between inflationand central bank independence, more recentresearch using longer sample periods and broadermeasures has found stronger correlations (Croweand Meade, 2008). Central banks that have usedquantitative easing successfully rank high onmeasures of independence, transparency, andaccountability. Laurens, Arnone, and Segalotto(2009), for example, ranked 98 central banks onthese characteristics—successful central banks(except Australia) tended to rank at or above the15th percentile. The Sveriges Riksbank (Sweden)and the Swiss National Bank (SNB) are ranked4th and 5th, respectively. The Reserve Bank ofAustralia (RBA), however, ranked 48th.
CASE STUDIES: SUCCESSFUL LARGE-SCALE BALANCE-SHEET INCREASES
This section explores the practical use oflarge-scale balance-sheet increases as a policyinstrument. Selected countries with recent large-scale central bank balance-sheet increases areshown in Table 1.6 A subset of these countries isexplored in greater detail. The countries looselyfall into three groups: (i) countries that respondedin a temporary manner to the recent financialcrisis, (ii) the Nordic countries during the banking
Anderson, Gascon, Liu
482 NOVEMBER/DECEMBER 2010 FEDERAL RESERVE BANK OF ST. LOUIS REVIEW
3 Specifically, Goodfriend and King (1981, p 382) outline a mecha-nism by which “for a given wealth, an individual who suffers ananticipated temporary reduction in measured real balances mightshift expenditure from present to future periods, in order to takeadvantage of lower net costs of transactions in these periods.”Presumably a sharp but temporary increase in money balancesprovided by the central bank might induce individuals to shiftexpenditure to present from future periods to take advantage ofnow-lower costs in the present period.
4 The Berentsen-Waller model (2009) is based on the Lagos-Wrightdouble coincidence of wants framework. Monetary policy isassumed to have short-run and long-run components, the formerfocused on stabilizing real activity (in the presence of shocks) andthe latter on the long-run inflation trend.
5 See, for example, Woodford (2003) and Clarida, Galí, and Gertler(1999). Among the differences in these papers noted by Berentsenand Waller (2009, p. 2) is that New Keynesian models rely on “nomi-nal rigidities, such as price or wage stickiness, that allows monetarypolicy to have real effects” and that the models “are ‘cashless’ inthe sense that there are no monetary trading frictions.” In theirgeneral equilibrium real business cycle model, all prices are flexiblebut money overcomes trading frictions. Hence, in New Keynesianmodels, ad hoc stickiness may allow real effects of monetary shockseven under complete information.
6 The currency symbols used throughout the text are listed in Table 1.Unless otherwise indicated, monetary values are listed as U.S.dollars.

Anderson, Gascon, Liu
FEDERAL RESERVE BANK OF ST. LOUIS REVIEW NOVEMBER/DECEMBER 2010 483
Table 1
Selected Countries with Major Increases in Their Monetary Base
Co
un
try/
Cu
rren
cy (
cod
e, s
ymb
ol)
Peri
od
of
incr
ease
Peak
dat
ePe
ak q
uan
tity
Perc
ent
incr
ease
Argentina/peso (ARS, $)
February 2002–Present
January 2010
121.7 billion ARS
778.9
Australia/dollar (AUD, $)
October 2008–February 2009
December 2008
73.6 billion AUD
45.9
Belgium/euro (EUR, €)
September 2008–July 2009
September 2008
166.3 billion EUR
83.9
Brazil/real (BRL, RS)
December 2005–Present
September 2008
254.9 billion BRL
56.9
China/yuan (CNY, ¥)
December 2006–Present
December 2009
14.4 trillion CNY
109.1
Czech Republic/koruny (CZK, Kč�)
April 1993–December 2001
November 2001
545.3 billion CZK
494.7
Denmark/krone (DKK, kr)
June 1993–June 2000
December 1999
192.9 billion DKK
300.3
Finland/euro (EUR, €)
January 1994–October 1997
March 1997
11.5 billion EUR
80.7
Egypt/pound (EGP, £)
August 2005–Present
July 2008
362.4 billion EGP
150.4
Iceland/krona (ISK, kr)
April 2007–Present
July 2009
173.9 billion ISK
252.7
Ireland/euro (EUR, €)
September 2008–Present
June 2009
132.5 billion EUR
184.7
Japan/yen (JPY, ¥)
March 2001–April 2006
December 2005
116.6 trillion JPY
76.5
Korea/won (KRW, ₩)
December 2006–Present
March 2009
71.7 trillion KRW
80.5
The Netherlands/euro (EUR, €)
September 2008–Present
October 2008
113.5 billion EUR
94.0
New Zealand/dollar (NZD, NZ$)
July 2006–December 2006
December 2006
12.8 billion NZD
140.8
Poland/zlotych (PLN, zł�)
January 2006–Present
December 2009
139.3 billion PLN
93.6
Russia/ruble (RUB, руб)
September 1998–May 2007
May 2007
5,350.8 billion RUB
2,510.0
Sweden/krona (SEK, kr)
November 1993–January 1997
June 1994
208.3 billion SEK
118.0
October 2009–Present
December 2008
319.1 billion SEK
201.2
Switzerland/franc (CHF)
October 2008–Present
April 2009
117.0 billion CHF
203.0
United Arab Emirates/dirham (AEDد ,
إ.)
February 2007–Present
March 2008
279.7 billion AED
214.2
United Kingdom/pound (GBP, £)
February 2009–Present
January 2010
208.9 billion GBP
204.1
United States/dollar (USD, $)
September 2008–Present
February 2010
2,150.9 billion USD
146.8
NOTE: The table includes advanced and larger emerging-market economies wherein the monetary base significantly increased during the past 20 years. We omit the large
number of developing and smaller emerging-market economies with similar or, often larger, increases. The “Period of increase” is the time interval (in our judgment) during
which the monetary base increased rapidly, was elevated, and (if applicable) decreased to a more-typical level. Measures of the monetary base vary by country. The central
banks of Argentina, Brazil, Iceland, Japan, Russian, Sweden, Switzerland, and the United States publish monetary base measures, and we use those data. The Central Bank of
the Russian Federation (Bank of Russia) did not publish its monetary base until 2002; therefore, “reserve money” data published by the International Monetary Fund (IMF) are
used. Sweden’s monetary base is measured using the Riksbank’s traditional definition (notes and coins in circulation plus liabilities to monetary policy counterparties); we omit
the Riksbank’s changed definition in late 2008 when it added special deposits from banks and debt certificates issued by the Riksbank. The monetary bases for Belgium, Finland,
Ireland, and The Netherlands are measured as the sum of currency in circulation plus liabilities to banking institutions. For other countries, the monetary base is the series
“reserve money” published by the IMF.
SOURCE: Central Bank of Argentina, Banco Central do Brasil, International Monetary Fund, Central Bank of Iceland, Bank of Israel, Bank of Japan, Bank of Russia, Sveriges
Riksbank, Statistics Sweden, Swiss National Bank, Federal Reserve Bank of St. Louis, and authors’ calculations.

Anderson, Gascon, Liu
484 NOVEMBER/DECEMBER 2010 FEDERAL RESERVE BANK OF ST. LOUIS REVIEW
250
200
150
100
350
250
150
50
200160
12080
240
180140
10060
220
30020010080
400500
300200100
0
400500600
160140120100
180200
200150100
50
250300350
140120100
80
160180200
350
250150
50
450
2003 2004 2005 2006 2007 2008 2009 2005 2006 2007 2008 2009
2005 2006 2007 2008 2009
2005 2006 2007 2008 2009
2005 2006 2007 2008 20092005 2006 2007 2008 2009
2005 2006 2007 2008 2009
1991 1992 1993 1994 1995 1996 1997 1998 1999
1991 1992 1993 1994 1995 1996 1997 1998 19991990
2000 2001 2002 2003 2004 2005 2006 20071999
United States United Kingdom
Switzerland Japan
Sweden (1990s) Sweden (2000s)
Finland Australia
Iceland New Zealand
Figure 1
Doubling of the Monetary Base in Selected Countries
NOTE: The figure displays 10 cases of extraordinary monetary base changes in nine countries. To illustrate clearly the magnitude of thechange, in each panel the monetary base series is indexed (normalized) to 100 at the first observation. The horizontal (time) scale variesby country, reflecting primarily four different episodes. Changes in the United States, the United Kingdom, Switzerland, Sweden (2000s),Iceland, and Australia reflect the 2008 global financial crisis. Changes in Finland and Sweden during the 1990s reflect the Nordic bankingcrisis. Changes in Japan reflect its quantitative easing from 2001-06. Finally, New Zealand increased its monetary base permanently in2006 to improve operation of its payment system.
SOURCE: Federal Reserve Board, Bank of England, Swiss National Bank, Bank of Japan, Sveriges Riksbank, International MonetaryFund, Central Bank of Iceland, Reserve Bank of Australia, and Reserve Bank of New Zealand.

Anderson, Gascon, Liu
FEDERAL RESERVE BANK OF ST. LOUIS REVIEW NOVEMBER/DECEMBER 2010 485
531
–1
8
4
0
12
10.05.00.0
15.020.0
0
2
4
6
0.1–0.1
0.30.5
1357
2003 2004 2005 2006 2007 2008 2009 2005 2006 2007 2008 2009
2005 2006 2007 2008 2009
2005 2006 2007 2008 2009
2005 2006 2007 2008 20092005 2006 2007 2008 2009
2005 2006 2007 2008 2009
1993 1994 1995 1996 1997 1998 1999
1991 1992 1993 1994 1995 1996 1997 1998 19991990
2000 2001 2002 2003 2004 2005 2006 20071999
United States United Kingdom
Switzerland Japan
Sweden (1990s) Sweden (2000s)
Finland Australia
Iceland New Zealand
2.51.50.5
–0.5
3.5
2008 2009 2010
151050
2025
3210
45
2468
2.01.00.0
3.04.0
2005 2006 2007 2008 2009
Euro Zone
Perc
ent
Perc
ent
Perc
ent
Perc
ent
Perc
ent
Perc
ent
Perc
ent
Perc
ent
Perc
ent
Perc
ent
Perc
ent
UpperLower
Figure 2
Central Bank Policy Rates
NOTE: The figure displays central bank policy rates in nine countries and the euro zone. In some cases, dramatic decreases in policytarget rates accompanied expansions of the monetary base. In others, changes were modest (e.g, Australia and New Zealand). In the1990s, foreign exchange crises occasionally caused sharp increases in policy rates not accompanied closely by changes in the mone-tary base (e.g., Sweden and Finland). The Bank of Japan kept the uncollateralized overnight call rate as low as 0 percent during thequantitative easing period.
Rates shown (daily data): United States, federal funds rate; United Kingdom, Bank Rate; Switzerland, target range of 3-month LIBORrate; Japan, uncollateralized overnight call rate; Sweden, marginal rate (January 1990–May 1994), and repo rate (June 1994–present);Finland, tender rate (January 1993–December 1998), and minimum bid rate of the European Central Bank’s main financing operation(January 1999–present); Australia, interbank overnight cash rate; Iceland, nominal discount rate; New Zealand, Official Cash Rate; eurozone, minimum bid rate of the European Central Bank’s main financing operation. Sweden’s official interest rate topped 50 percentin September 1992 as the result of the Riksbank’s exchange rate defense. We omit observations of Sweden’s marginal rate that arehigher than 24 percent.
SOURCE: Federal Reserve Board, Central Bank of Iceland, Bank of England, Swiss National Bank, Bank of Finland, Bank of Japan,European Central Bank, Bank of Russia, Riksbank, Reserve Bank of Australia, Reserve Bank of New Zealand.

Anderson, Gascon, Liu
486 NOVEMBER/DECEMBER 2010 FEDERAL RESERVE BANK OF ST. LOUIS REVIEW
8
40
12
16
–2
0
2
4
2003 2004 2005 2006 2007 2008 2009 2005 2006 2007 2008 2009
2005 2006 2007 2008 2009
2005 2006 2007 2008 2009
2005 2006 2007 2008 20092005 2006 2007 2008 2009
2005 2006 2007 2008 2009
1993 1994 1995 1996 1997 1998 1999
1991 1992 1993 1994 1995 1996 1997 1998 19991990
2000 2001 2002 2003 2004 2005 2006 20071999
United States United Kingdom
Switzerland Japan
Sweden (1990s) Sweden (2000s)
Finland Australia
Iceland New Zealand
1.50.5
–0.5–1.5
2.5
1.5
2.5
3.5
4.5
Perc
ent
Perc
ent
Perc
ent
Perc
ent
Perc
ent
Perc
ent
Perc
ent
Perc
ent
Perc
ent
Perc
ent3
1–1–3
5
1.00.0
–1.0–2.0
2.0
–2
2
6
10
–2
0
2
4
2.01.0
0.0
3.0
4.0
3.02.01.0
4.05.0
1992
Consumer Price Inflation: Year-over-year increase in consumer prices (monthly)Expected Inflation: Anticipated change in consumer prices during the next 12 months (monthly)
Figure 3
Actual and Expected Inflation
SOURCE: United States, Survey of Consumers conducted by Thomson Reuters and the University of Michigan; United Kingdom,Citigroup Inflation Tracker conducted by YouGov and Citigroup; Australia, Melbourne Institute Survey of Consumer InflationaryExpectations conducted by the Melbourne Institute of Applied Economic and Social Research; New Zealand, Survey of Expectationsconducted by the Reserve Bank of New Zealand; Sweden, Consumer Tendency Survey conducted by the National Institute of EconomicResearch; Finland, Consumer Survey conducted by Statistics Finland; Japan, Consumer Confidence Survey conducted by the Economicand Social Research Institute. Values of expected inflation in Japan are calculated using the median of the anticipated change in con-sumer prices during the next 12 months. Switzerland, Consumer Confidence Survey by the State Secretariat for Economic Affairs.Switzerland’s Consumer Confidence Survey reports an index of expected inflation. Data are transformed into an index with a meanequal to the mean consumer price inflation series over the observed period.

crisis of the 1990s, and (iii) selected other coun-tries, for comparison, with (apparently) permanentincreases. Figure 1 shows changes in the monetarybase of these countries during periods of quanti-tative easing (each country’s series is normalizedto 100 at the date when major balance-sheetexpansion began).7 Sweden’s monetary baseduring the Nordic banking crisis of the 1990s,for example, rapidly doubled and remained atthat level for two years before slowly returningto its pre-expansion level. Japan’s monetary baseincreased slowly starting in 2001 and fell rapidly
in 2006 when the Bank of Japan (BOJ) reversedpolicy. New Zealand, in a cooperative agreementwith its banks to improve operation of the pay-ment system, doubled its monetary base to a new,sustained level.
Large-scale balance-sheet increases inresponse to financial crises often occur afterpolicymakers have reduced their target interestrate to (near) zero; the paths of central bank policyrates are shown in Figure 2. During December2008, for example, the BOJ reduced its target over -night interest rate to 0.1 percent and the FederalReserve reduced its target federal funds rate to arange between zero and 0.25 percent. Exceptionsare Australia and Iceland, which are discussedlater.
Anderson, Gascon, Liu
FEDERAL RESERVE BANK OF ST. LOUIS REVIEW NOVEMBER/DECEMBER 2010 487
7 Generally, the monetary base is defined as the sum of currency incirculation outside the central bank plus deposits of financialinstitutions at the central bank. Variations for individual countriesare noted in the case studies.
INFLATION EXPECTATIONSWell-anchored inflation expectations are crucial to the success of unconventional monetary
policy actions, including large increases in central bank balance sheets. Figure 3 shows both con-sumer price inflation and expected inflation for selected countries that have experienced suchincreases. Actual inflation is measured as the year-over-year increase in consumer prices. Expectedinflation is the anticipated change in consumer prices during the next 12 months as determinedfrom household surveys. We selected household surveys based on their availability across coun-tries. Other surveys are available. A cross-country comparison of inflation expectations is routinelyincluded in the IMF’s World Economic Outlook. The Reserve Bank of New Zealand’s Survey ofExpectations is a market-based survey, whereas all other surveys are household based. A compari-son of household surveys and market surveys can be found in Batchelor and Dua (1989).
The onset of financial crisis and recession typically reduces both actual and expected infla-tion. At the same time, if expansionary monetary policies are anticipated to stimulate economicactivity, households might expect that actual inflation will return to its long-run trend in the nearfuture. This pattern is evident in most of the countries we surveyed.
During 2008, for example, the United States, the United Kingdom, Switzerland, Sweden,and Australia experienced sharp decreases in actual and expected inflation. At the end of 2008,expected inflation generally stabilized (albeit at a lower rate than the recent trend) even as actualinflation continued to fall. As economic activity stabilized during 2009, inflation expectationsincreased (particularly in the second quarter), even while actual inflation continued to ease. Higherexpectations were somewhat validated by higher inflation during the second half of 2009. It appearsthat both actual and expected inflation had returned to the long-run trends by the end of 2009.
The 1990s Nordic banking crisis is another example. Inflation in Sweden and Finland was highin 1990 and 1991. As Swedish and Finnish central banks and governments pursued aggressiveexpansionary policy, consumer price inflation declined below these central banks’ inflation tar-gets. The National Institute of Economic Research in Sweden and Statistics Finland started to sur-vey inflation expectations in 1993 and 1995, respectively. In both countries, expected inflationwas stable around the respective central bank’s inflation target.

The inflation experience in these countriesis shown in Figure 3, which displays both actualinflation and survey-based measures of expectedinflation. Consistent with the visibility of thefinancial crisis and high credibility levels of thesecentral banks, inflation expectations moved little,if at all, as balance sheets increased—indeed, thetime series for actual and anticipated inflationare nearly indistinguishable.
The United States8
Before September 2008, the size of the FederalReserve’s balance sheet had changed little duringthe financial crisis of 2007-08 because holdings ofTreasury securities decreased as lending throughcredit-market programs increased (Figure 4). InSeptember, the Fed ceased shrinking its Treasuryportfolio and large-scale balance-sheet increasesbegan. In turn, the federal funds rate slippedsteadily; on December 16, 2008, the FederalOpen Market Committee (FOMC) set a targetrange for the federal funds rate of 0 to 0.025 per-cent. On November 25, 2008, the Federal Reserveannounced that it would purchase up to $100billion of debt issued by the Federal Home LoanBanks, FNMA, and FHLMC, plus up to $500 bil-lion of mortgage-backed securities (MBS) backedby FNMA, FHLMC, and GNMA with the statedpurpose to “reduce the cost and increase the avail-ability of credit for the purchase of houses.”9
Purchases began in January 2009. As of late January 2009, the Federal Reserve’s
total assets and liabilities were approximately$2 trillion versus $900 billion in late August2008; purchases of housing-related debt and MBSaccounted algebraically for about one-third ofthe increase and a variety of credit and lendingprograms accounted for the rest. At its March 17-18, 2009, meeting the FOMC
announced its intent to purchase by year-end
2009 up to $1.25 trillion of agency MBS and upto $200 billion of agency debt, plus up to $300billion in longer-term Treasury securities duringthe next six months. These purchases, laterreferred to as the Large-Scale Asset Purchaseprogram, sustained the size of the Fed balancesheet even as various credit and lending programsclosed. As of the April 2010 FOMC meeting, totalassets were $2.34 trillion.
United Kingdom
Rapid expansion of the U.K.’s monetary basebegan in February 2009, eventually tripling to£208.04 billion in July 2009 from £68.69 billionin January 2009. Motivating aggressive increasesin the monetary base was a sharp slowing in eco-nomic activity: Real output during 2008:Q4 and2009:Q1 fell at 7 percent and 10 percent annualrates, respectively. The Bank of England (BOE)’sMonetary Policy Committee (MPC) had reducedits policy rate (Bank Rate) from 5 percent inOctober 2008 to 1 percent in February 2009.10 Yet,forecasts suggested an increased risk that inflationmight undershoot the MPC’s 2 percent target.In March, the MPC decided to ease monetary
conditions in the United Kingdom by reducingBank Rate to 0.5 percent and to begin aggressiveexpansion of its balance sheet. The Bank’s firstpurchase was £75 billion of government bonds(gilts) during the first week of March. DuringMarch, the Bank purchased £982 million of com-mercial paper, £128 million of commercial bonds,and £12.9 billion of gilts. The monetary base roseto £90.12 billion by the end of March.11 By theend of May, additional purchases pushed theBOE’s total assets close to £300 billion and themonetary base to £156.14 billion.Figure 5 shows the impact of these programs
on the BOE’s balance sheet and the monetary base.
8 See Bernanke (2009) for a summary of the U.S. experience.
9 GNMA (Government National Mortgage Association, or “GinnieMae”), part of the U.S. Department of Housing and Urban Develop -ment, issues no debt but does issue MBS on which it guaranteespayment of principal and interest. FNMA (Federal NationalMortgage Association, or “Fannie Mae”) and FHLMC (FederalHome Loan Mortgage Corporation, or “Freddie Mac”) issue bothdebt and MBS on which they guarantee the timely payment ofprincipal and interest.
Anderson, Gascon, Liu
488 NOVEMBER/DECEMBER 2010 FEDERAL RESERVE BANK OF ST. LOUIS REVIEW
10 Before March 5, 2008, the U.K. Asset Purchase Facility (APF) pur-chased £986 million in commercial paper. Because these purchaseswere financed by the sale to the public of Treasury bills, and hencehad little impact on the monetary base, we omit them from ouranalysis. For details of the APF’s operation, see BOE (2009a,b).
11 In 2006 the BOE discontinued publication of its monetary base,referred to as M0. Here, we calculate the monetary base as thesum of BOE banknotes in circulation plus deposits of banks at theBOE (reserves).

Anderson, Gascon, Liu
FEDERAL RESERVE BANK OF ST. LOUIS REVIEW NOVEMBER/DECEMBER 2010 489
Assets
0
500
1,000
1,500
2,000
2,500
3,000
Jan07
Apr07
Jul07
Oct07
Jan08
Apr08
Jul08
Oct08
Jan09
Apr09
Jul09
Oct09
Jan10
Apr10
Short-Term Lending to Financial Firms and Markets
Rescue Operations
Operations Focused on Longer-Term Credit Conditions
Traditional Portfolio
$ Billions
Liabilities
0
500
1,000
1,500
2,000
2,500
3,000Source Base
Treasury Financing Account
Traditional Liabilities and Capital Account
$ Billions
Jan07
Apr07
Jul07
Oct07
Jan08
Apr08
Jul08
Oct08
Jan09
Apr09
Jul09
Oct09
Jan10
Apr10
Figure 4
Composition of Federal Reserve Balance Sheet
NOTE: See Federal Reserve Bank of St. Louis, U.S. Financial Data, for a description of chart categories.
SOURCE: Federal Reserve Board, Federal Reserve Statistical Release H.4.1.

Anderson, Gascon, Liu
490 NOVEMBER/DECEMBER 2010 FEDERAL RESERVE BANK OF ST. LOUIS REVIEW
0
50
100
150
200
250
300
350
May06
Aug06
Nov06
Feb07
May07
Aug07
Nov07
Feb08
May08
Aug08
Nov08
Feb09
May09
Aug09
Nov09
Feb10
£ Billions
Other Assests
Long-Term Reverse Repo
Bonds and Securities Purchased
Advance to HM Government
Short-Term Market Operations
0
50
100
150
200
250
300
350Other Liabilities
Short-Term Market Operations
Reserves
Notes in Circulation
£ Billions
May06
Aug06
Nov06
Feb07
May07
Aug07
Nov07
Feb08
May08
Aug08
Nov08
Feb09
May09
Aug09
Nov09
Feb10
Assets
Liabilities
Figure 5
Composition of Bank of England Balance Sheet
SOURCE: Bank of England (www.bankofengland.co.uk/markets/balancesheet/).

On the asset side of the balance sheet, the largeincrease in the “Long-Term Reverse Repo” cate-gory reflects the assets acquired by expandingthe types of collateral that may be pledged ontraditional lending facilities. The later increasein the “Other Assets” category reflects the BOE’sincrease in dollar lending and assets purchasedunder the Asset Purchase Facility. On the liabili-ties side of the BOE’s balance sheet, the monetarybase is measured as the sum of “Notes in Circula -tion” plus “Reserves” at the BOE. Note that theBOE issues liabilities (BOE bills) that are not partof the monetary base as we have measured it inthis analysis. During the fall of 2008, the BOEissued 1-week maturity bills to finance expandedlending to banks. The BOE shifted away fromusing its own bills for financing during 2009,causing liabilities in the “Short-Term MarketOperations” category to decline and bank reservesto increase.
The BOE reports that balance-sheet actionsreduced yields on medium- and long-dated gov-ernment bonds, as well as spreads of commercialpaper and commercial bonds over overnight indexswaps. Yields on 10-year U.K. bonds fell whenpurchase programs were announced and subse-quently drifted upward as purchases occurred.Inflation expectations plummeted from a high of4.5 percent in September 2008 to a low of 1 per-cent (see the dashed line in Figure 3) before laterdrifting and leveling off near 2 percent.
Switzerland
The impact of the global financial crisis onSwitzerland has been modest, albeit sufficient toresult in recession. During 2008:Q4 and 2009:Q1,real gross domestic product (GDP) declined at anannual rate of 2.5 percent and 3.5 percent, respec-tively. The Swiss National Bank’s (SNB) 2009Financial Stability Report describes the steps theytook.12 In October 2008 the SNB reduced its targetfor the 3-month Swiss franc London Interbankoffering rate (LIBOR) and began expanding itsbalance sheet. The SNB also began participatingin foreign currency swaps with the Federal
Reserve in October 2008, eventually reachingmore than CHF 60 billion in March 2009. InDecember 2008 the SNB created a loan stabiliza-tion fund to “finance the acquisition of illiquidassets from UBS, largely composed of assetsbacked by US residential and commercial mort-gages.” Under terms of the loan, UBS, amongother financial institutions, will make partialpayments extending up to 12 years. (Assets inthis program were CHF 22 billion as of September2009.) Between October 2008 and April 2009,the Swiss monetary base approximately tripled,reaching CHF 117 billion in April 2009. OnMarch 12, 2009, the SNB announced a policyshift toward foreign exchange market interven-tion, saying the appreciation of the Swiss franc“represents an inappropriate tightening of mone-tary conditions.”
The SNB’s unconventional policies sharplyincreased the size of its balance sheet and theSwiss monetary base. Figure 6 shows the growthand changing composition of the SNB assets andliabilities. The largest increase among assets is inforeign currency swap transactions. On the liabili-ties side, the largest increase is in bank depositsat the SNB (top category on the graph)—from anaverage of CHF 6 billion in 2007 to more thanCHF 75 billion in March 2009. To temper theincrease in the monetary base and “absorb liquid-ity in the market” resulting from unconventionalmonetary policies, the SNB began issuing itsown debt in October 2008 (labeled as “SNB DebtCertificates” in Figure 6). As of September 2009,the SNB had CHF 25 billion outstanding in SNBnotes. These notes have a maximum maturity ofone month.
Although we cannot yet assess the impact, ifany, of the monetary base expansion on inflation,it seems reasonable to explore the SNB’s inflationforecasts underlying its policy actions. In March2009, the SNB forecast deflation for most of 2009and close to zero inflation in 2010 and 2011. Theforecast six months later projects deflation onlyin early 2009 and 2 percent inflation by the endof 2011. Perhaps tripling the monetary base hasforestalled further undesired decreases in infla-tion (or even deflation): Inflation expectationsplummeted in mid-2008, reaching close to zero
Anderson, Gascon, Liu
FEDERAL RESERVE BANK OF ST. LOUIS REVIEW NOVEMBER/DECEMBER 2010 491
12 For additional details, see Swiss National Bank (2009); all quota-tions in this section are from this report.

Anderson, Gascon, Liu
492 NOVEMBER/DECEMBER 2010 FEDERAL RESERVE BANK OF ST. LOUIS REVIEW
0
50
100
150
200
250
300
Jan05
Jul05
Jan06
Jul06
Jan07
Jul07
Jan08
Jul08
Jan09
Jul09
Jan10
CNF Billions
Swap Transactions
Loan Stabilization Fund
Dollar Repo Claims
Foreign Currency Investment
Franc Repo Claims
Other Assets
Deposits at SNB
SNB Debt Certificates
Other Term Liabilities
Other Liabilities
Banknotes in Circulation
0
50
100
150
200
250
300
Jan05
Jul05
Jan06
Jul06
Jan07
Jul07
Jan08
Jul08
Jan09
Jul09
Jan10
CNF Billions
Assets
Liabilities
Figure 6
Composition of the Swiss National Bank Balance Sheet
SOURCE: Swiss National Bank.

percent by March 2009 (see Figure 3). Expectedinflation has been positive and slowly trendingupward since the SNB began quantitative easing.
Japan
Japan’s economic growth has slowed sharplysince the bursting of the asset price bubble in theearly 1990s—from a 5.1 percent annual rate dur-ing the latter half of the 1980s, to a 1.5 percentannual rate during the 1990s, to a less than 0.5percent annual rate since 2000.13 Here, we reviewthree episodes of BOJ quantitative easing efforts—the zero interest rate policy of the 1990s, a quan-titative easing policy from 2001 to 2006, and itsactions in response to the most recent financialcrisis.
During the 1990s, the BOJ adopted the “zerointerest rate policy” regime in which the policytarget rate (overnight call rate) was set at 0.1 per-cent. The BOJ maintained its balance sheet at alevel just sufficient to sustain the overnight callrate (near) zero. Nevertheless, real GDP growthduring the decade averaged only 1.5 percent peryear and the economy was stagnant at the decade’send. Worse, the threat of deflation had not eased—year-over-year consumer price index (CPI) infla-tion was negative (see Figure 3).
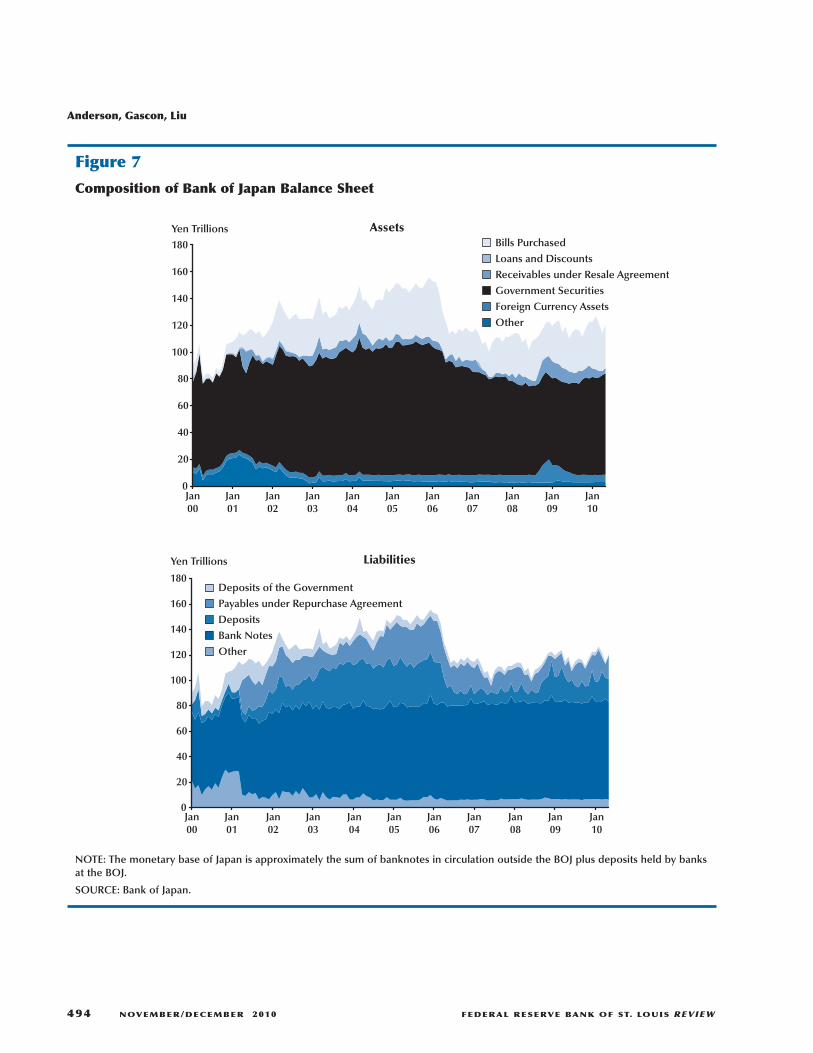
In March 2001, with a policy rate at zero, theBOJ initiated a quantitative easing policy in whichit would maintain the call rate at zero until theyear-over-year increase in the CPI “became posi-tive on a sustained basis.”14 The expansion ofthe balance sheet was regulated by a targeted levelof current account balances held by banks at theBOJ. To achieve its targets, the BOJ purchasedgovernment securities and bank bills backed byeligible collateral (i.e., corporate bonds or com-mercial paper). The BOJ more or less smoothlyincreased its holdings of long-term Japanese gov-ernment bonds (JGBs); its holdings doubled by2006 to roughly ¥90 trillion. In contrast, the BOJpurchased bank bills to quickly increase its bal-
ance sheet, reaching roughly ¥40 trillion in 2006(Figure 7). The BOJ began a two-tier exit strategyin 2006 when the CPI displayed signs of steadyincrease, allowing its holdings of bank bills andlong-term government securities (JGBs) to runoff. Empirical studies have concluded that theBOJ’s policy actions reduced longer-term rates,thereby flattening the yield curve, and had apositive, but small, effect on economic growth(Ugai, 2007).
In response to the current financial crisis,the BOJ reduced its policy target rate to 0.3 per-cent from 0.5 percent on October 31, 2008, andto 0.1 percent on December 19, 2008, and hasinitiated or expanded several programs to providefunds to the market.15 Commercial paper waspurchased outright during 2009:Q1 (¥1.6 trillion)but a rapid runoff occurred during the secondquarter, and corporate bond purchases were madeduring the third quarter (¥400 billion). In addition,approximately ¥4 trillion of commercial paperwas purchased during the first quarter under repo,and approximately ¥6 trillion in “special funds”was provided to banks as advances against cor-porate debt as collateral. These combined actionswere modest relative to the size of the BOJ’s bal-ance sheet (see Figure 7).
In November 2009, the BOJ declared that theeconomy had officially entered a period of defla-tion with a negative year-over-year change in theCPI. On December 1, 2009, the BOJ announceda new liquidity supply initiative to fight weakeconomic activity, deflation, and a rising yenexchange rate. This program calls for the BOJ tofurnish up to ¥10 trillion in 3-month loans tobanks at the 0.1 percent target level of the policyrate (overnight unsecured call rate) against avariety of collateral, including JGBs, corporatebonds, and commercial paper. The BOJ said theprogram should “further enhance easy monetaryconditions” and “encourage a further decline inlonger term interest rates.” Deflation continuesin Japan, however, with a pace of –1 percent peryear as of April 2010 (see Nishimura, 2010).
Anderson, Gascon, Liu
FEDERAL RESERVE BANK OF ST. LOUIS REVIEW NOVEMBER/DECEMBER 2010 493
13 Shirakawa (2010) argues that quantitative easing policy actionssuccessfully boosted Japanese economic activity and the story of“The Lost Decade” is myth.
14 For details, see Oda and Ueda (2007) or Maeda et al. (2005).Humpage and Shenk (2008) provide a very readable summary.Shiratsuka (2009) summarizes recent thought.
15 The BOJ’s actions as of April 2010 are well summarized in “TheBank of Japan’s Policy Measures in the Current Financial Crisis”(www.boj.or.jp/en/type/exp/seisaku_cfc/index.htm).
Anderson, Gascon, Liu
494 NOVEMBER/DECEMBER 2010 FEDERAL RESERVE BANK OF ST. LOUIS REVIEW
0
20
40
60
80
100
120
140
160
180
Jan00
Jan01
Jan02
Jan03
Jan04
Jan05
Jan06
Jan07
Jan08
Jan09
Jan10
Bills Purchased
Loans and Discounts
Receivables under Resale Agreement
Government Securities
Foreign Currency Assets
Other
Yen Trillions
Deposits of the Government
Payables under Repurchase Agreement
Deposits
Bank Notes
Other
0
20
40
60
80
100
120
140
160
180
Yen Trillions
Assets
Liabilities
Jan00
Jan01
Jan02
Jan03
Jan04
Jan05
Jan06
Jan07
Jan08
Jan09
Jan10
Figure 7
Composition of Bank of Japan Balance Sheet
NOTE: The monetary base of Japan is approximately the sum of banknotes in circulation outside the BOJ plus deposits held by banksat the BOJ.
SOURCE: Bank of Japan.

Scandinavia
Sweden and Finland provide a unique set ofcases because they have each undergone twoepisodes of quantitative easing during the pasttwo decades: once during the banking crisis ofthe 1990s and more recently during the 2007-09financial crisis. They are excellent case studiesof how to do it right.
Sweden. Sweden was affected by two severefinancial crises during the past two decades: the1990s Nordic banking crisis and the 2007-08global financial crisis. Each time, the Riksbankused large-scale increases in its balance sheet asa policy tool; the monetary base more than dou-bled during the Nordic banking crisis and hastripled during the most recent global financialcrisis.
The Nordic banking crisis of the early 1990saffected all Scandinavian countries.16 In eachcountry, central bank support to the banking sys-tem sharply increased the nation’s monetary base.Starting in 1992, the Riksbank used its foreigncurrency reserves to provide liquidity support tobanks. Because the government had guaranteedall bank debt, the Riksbank allowed banks to bor-row freely through normal liquidity facilities.The monetary base more than doubled within 10months—from SEK 83.73 billion in August 1993to SEK 208.26 billion in June 1994. When condi-tions stabilized, the monetary base decreasedrapidly to SEK 81.11 billion by February 1997.Although inflation did not increase significantlyduring or after the monetary base expansionperiod, CPI inflation during 1994 was more thandouble the Riksbank’s 2 percent inflation targetand inflation expectations increased modestly asthe Riksbank expanded its balance sheet. As aresult, even with the monetary base at elevatedlevels, the Riksbank gradually increased its policytarget rate during 1994 and 1995. The inflationrate returned to a 2 percent pace by late 1995,slipping negatively the following year. Inflationexpectations retreated below the Riksbank’s 2percent inflation target to near 1.5 percent.
Anderson, Gascon, Liu
FEDERAL RESERVE BANK OF ST. LOUIS REVIEW NOVEMBER/DECEMBER 2010 495
Policy actions by the Riksbank during therecent financial crisis resemble those during the1990s. The growth and composition of theRiksbank’s balance sheet are shown in Figure 8.In September 2008, the Riksbank created a loanfacility that provided access to U.S. dollars, fundedby currency swap agreements with the FederalReserve.17 This program increased the balance-sheet asset item “Claims on Residents insideSweden Denominated in Foreign Currency” andthe liability item “Liabilities outside SwedenDenominated in Kronor.” To further assist banks,in October 2008 the Riksbank created an addi-tional loan facility designed to accept collateralwith maturities longer than those accepted at itstraditional lending facilities.
To fund some lending programs, the Riksbankissued debt—Riksbank certificates—with a matu-rity of one week. The Riksbank, unlike othercentral banks, includes these certificates in itsmeasure of the monetary base (see Figure 8).18
Based on this measure, Sweden’s monetary baseincreased almost fivefold from SEK 105.92 billionin September 2008 to a peak in November 2009.Alternatively, measured using the commonplacedefinition of the monetary base as the sum ofcurrency in circulation plus the deposits heldby financial institutions at the central bank,Sweden’s monetary base tripled to peak of SEK319 billion in December 2008.
Finland. Finland likely was the countrymost severely affected by the Nordic bankingcrisis, recording decreases in real GDP growthfor three consecutive years (1990:Q3–1993:Q3).19
From 1992 to 1997, strong government interven-tion included equity investments in the nation’s
16 Honkapohja (2009) and Anderson (2009) discuss causes and thepolicy response; see also the references cited therein.
17 For details, see Öberg (2009).
18 For comparison purposes, the data in Figure 1 report a measure ofthe monetary base without Riksbank certificates.
19 The Bank of Finland’s takeover of the shaky commercial bankSkopbank in the fall of 1991 perhaps was the climax of the coun-try’s financial crisis. Skopbank was one of the pillars of Finland’scommercial banking industry, widely referred to as the “centralbank” for the country’s savings banks. The takeover is reported tohave eventually cost FIM 15 billion, the equivalent of 3 percent ofGDP in 1991 (Sandal, 2004). The eventual resolution of the crisisand unwinding of government support programs cost Finland anamount equal to approximately 6 percent of one year’s GDP; forSweden and Norway, the eventual cost was near zero. For addi-tional details, see Anderson (2009).

Anderson, Gascon, Liu
496 NOVEMBER/DECEMBER 2010 FEDERAL RESERVE BANK OF ST. LOUIS REVIEW
0
100
200
300
400
500
600
700
800
Mar06
Sep06
Mar07
Sep07
Mar08
Sep08
Mar09
Sep09
Mar10
SEK Billions
Claims on Residents Inside Sweden Denominated in Foreign Currency
Lending to Monetary Policy Counterparties
Claims on Residents Outside Sweden
Denominated in Foreign Currency
Gold and Other Assets
Other Liabilites and Capital
Liabilities Outside Sweden in SEK
Riksbank Certificates
Bank Deposits
Currency in Circulation
0
100
200
300
400
500
600
700
800
Mar06
Sep06
Mar07
Sep07
Mar08
Sep08
Mar09
Sep09
Mar10
SEK Billions
Assets
Liabilities
Figure 8
Composition of the Riksbank’s Balance Sheet
NOTE: The Riksbank defines Sweden’s monetary base as “Currency in Circulation” plus “Bank Deposits” and “Riksbank Certificates.”
SOURCE: The Riksbank.

Anderson, Gascon, Liu
FEDERAL RESERVE BANK OF ST. LOUIS REVIEW NOVEMBER/DECEMBER 2010 497
0
10
20
30
40
50
60
70
80
90
100
Jan91
Jan92
Jan93
Jan94
Jan95
Jan96
Jan97
Jan98
FIM BillionsOther Assets
Gold and Foreign Currency Claims
Claims on Financial Institutions
Loans for Stabilizing the Money Market
Capitalized Expenditures Due to
Stabilizing the Money Market
Other Liabilities and Capital
CDs
Liabilities to Financial Institutions
Notes and Coin in Circulation
0
10
20
30
40
50
60
70
80
90
100 FIM Billions
Assets
Liabilities
Jan91
Jan92
Jan93
Jan94
Jan95
Jan96
Jan97
Jan98
Figure 9
Composition of Bank of Finland’s Balance Sheet
SOURCE: Bank of Finland.

banks and in a government-funded bank guaran-tee fund. By the end of 1997, the government hadextended FIM 43 billion in direct bank support.20
The Finnish monetary base expanded from FIM34.5 billion in January 1992 to FIM 68.7 billionin March 1997 (Figure 9). Banking institutionsstarted repaying the government in October1997; thereafter, the monetary base decreasedrapidly to FIM 36.2 billion in December 1997.
Inflation in Finland was high before the bank-ing crisis started: The monthly year-over-year CPIrate topped 7 percent in spring 1990 and stayedabove 5 percent during 1990. Inflation subsidedas the crisis deepened; the year-over-year ratefell below 2 percent (the Bank of Finland’s infla-tion target) in mid-1993. Inflation remained lowfor the remainder of the 1990s and inflation expec-tations remained anchored between 2 and 2.5percent.
Finland adopted the euro in 1999, and henceduring the financial crisis of 2007-09 exercisedno independent monetary policy. Its responsehas been limited to banking supervision andsupport (Liikanen, 2009). Perhaps the largestcountry-specific impact was the spinoff of theFinnish operations of the Icelandic bank Glitnirinto a new Finnish corporation in October 2008.
OTHER CASES OF LARGE-SCALEBALANCE-SHEET INCREASES
In this section, we briefly examine the expe-riences of three other countries with recent large-scale central bank balance-sheet increases.
Australia
Australia experienced a sharp but mild reces-sion during late 2008 and early 2009, caused inpart by reduced export demand and weaker con-sumer confidence. Stevens (2009) notes that theReserve Bank of Australia had started easingpolicy in early September due to moderatingdemand, reducing its target overnight rate from7.25 percent to 7 percent. Easing acceleratedafter the Lehman Brothers failure; the target was
reduced by 300 basis points during the last fourmonths of 2008 (including a 100-basis-point cuton October 8, 2008, coordinated with 50-basis-point or larger reductions by other G-10 centralbanks). Private net capital flows were negative inthe third and fourth quarters of 2008, in partbecause Australian banks found Federal Reserveforeign currency swap lines a lower-cost source offunds than alternatives, particularly in 2008:Q4.21
By mid-2009, global short-term credit marketswere normalizing and Australian banks wereobtaining funds in the market below the cost ofthe Fed’s swap facility. The policy target ratereached its low of 3 percent on April 8, 2009,and on October 7, 2009, the Research Bank ofAustralia (RBA) started the process of increasingits target rate toward “a more normal setting”with a 25-basis-point increase.
The RBA’s policy actions do not merit thelabel “quantitative easing” because the policytarget rate never reached zero during mid-2009.Yet, the RBA balance sheet expanded sharplybetween August and December 2008, resulting ina 54 percent increase in the monetary base (mea-sured as the sum of “Reserves and Notes” plus“Term Deposits”). Figure 10 shows the growthand changing composition of the RBA balancesheet. A number of domestic programs affectedthe balance sheet, including (i) broadening thepool of eligible collateral accepted by the RBA,(ii) conducting open market operations at longermaturities to increase the impact on longer-termyields, and (iii) offering term deposits at the RBA.22
Deposits obtained by the RBA under the FederalReserve’s swap lines are included in the asset“Gold and Foreign Exchange,” whereas theAustralian dollars held as collateral by the FederalReserve are included in the liability item “Depositsof Overseas Institutions.” Interestingly, the RBAunwound its balance-sheet expansion in the firsthalf of 2009 without rapid increases in its policytarget rate: By May 2009, the level of the mone-tary base had returned approximately to its trendwith the policy target rate at 4.25 percent.
21 D’Arcy and Ossolinski (2009) report that some Australian banks,successful bidders for U.S. dollars at RBA auctions, apparentlyreloaned the dollar funds to foreign parents.
22 For additional details, see Stevens (2010) and Debelle (2008).
Anderson, Gascon, Liu
498 NOVEMBER/DECEMBER 2010 FEDERAL RESERVE BANK OF ST. LOUIS REVIEW
20 For details, see Mutikainen (1998).

Anderson, Gascon, Liu
FEDERAL RESERVE BANK OF ST. LOUIS REVIEW NOVEMBER/DECEMBER 2010 499
Other
Deposits of Government
Deposits of Overseas Institutions
Term Deposits
Reserves and Notes
0
20
40
60
80
100
120
140
160
180
Jan05
Jul05
Jan06
Jul06
Jan07
Jul07
Jan08
Jul08
Jan09
Jul09
A$ Billions
Jan10
Liabilities
0
20
40
60
80
100
120
140
160
180Gold and Foreign Exchange
Australian Dollar Securities
Other Assets
Clear Items
A$ Billions Assets
Jan05
Jul05
Jan06
Jul06
Jan07
Jul07
Jan08
Jul08
Jan09
Jul09
Jan10
Figure 10
Composition of Reserve Bank of Australia Balance Sheet
NOTE: The monetary base of Australia is approximately equal to “Reserves and Notes” plus “Term Deposits.”
SOURCE: Reserve Bank of Australia.

There is no evidence that the RBA’s actionsaffected inflation. Before the crisis, the Australianeconomy had experienced year-over-year growthin consumer prices averaging just under 3 percent,within the RBA’s target range of 2 to 3 percent.Inflation expectations, however, reached as highas 6 percent as Australia’s business cycle peakedin May 2008 (see Figure 3), but the late 2008 dis-turbances in financial markets caused inflationexpectations to decline precipitously. Unlike inthe United States, United Kingdom, and Japan,inflation expectations in Australia never raisedthe specter of deflation. A prompt unwinding ofits balance sheet appears to have protected infla-tion stability.
Iceland
We mention Iceland primarily because of itswidely reported role in the banking crises of sev-eral European nations. Iceland is unusual, in thisanalysis, because its policy target rate and centralbank balance sheet increased simultaneously.
Iceland’s financial system was seriouslyharmed by the recent financial crisis. Three ofthe country’s largest commercial banks failed inOctober 2008; the government assumed the roleas insurer of their deposits and replaced eachboard of directors.23 These banks, however, hadcustomer liabilities with other countries in addi-tion to Iceland, equal to roughly 10 times Iceland’sannual gross national product (see Central Bankof Iceland [CBI], 2009b, p. 13). As a result of thebank failures, Iceland’s exchange rate fell sharplyin October 2008; Iceland obtained a $2.1 billionloan from the International Monetary Fund (IMF)to stabilize its financial system.
Before receiving the IMF loan to stabilize thecountry’s economy, in January 2008 the CBI hadexpanded the list of eligible collateral at its regu-lar lending facilities to include bonds issued indollars, euros, or British pounds but continuedto require that at least 50 percent of collateral bedenominated in kronor. By August 2008, the CBIwent a step further, expanding the list of eligiblecollateral to include asset-backed securities and
reducing the krona requirement to 30 percent.Bank runs began the first week of October:Currency in circulation increased 53 percentthat week (see Central Bank of Iceland, 2009b,pp. 24-25). The CBI used its reserves—even oldbanknotes no longer intended for circulation—to meet public demand. The combination ofincreased loans to banks24 and currency in cir-culation caused the CBI’s balance sheet to increaserapidly during the fall of 2008. At its peak,Iceland’s monetary base had increased by 70percent with highly volatile swings from monthto month.
The CBI sought to distinguish its traditionalapproach to monetary policy (targeting the dis-count rate) from its balance-sheet actions. InOctober 2008, for example, the CBI increased itspolicy rate (the nominal discount rate) from 12percent to 18 percent. At this time, year-over-yearinflation had been steadily increasing since 2007and was close to 15 percent. In pursuing its infla-tion target of 2.5 percent, the CBI had held itspolicy rate above 10 percent since 2005.25 TheCBI changed course in March 2009 after inflationbegan to subside (albeit still at high levels). Thenominal discount rate dropped to 11 percent inNovember 2009. Because inflation was well abovethe target at the beginning of the crisis, it is diffi-cult to assess whether the balance-sheet expan-sion affected either actual or expected inflation.However, the CBI forecasts that inflation willreach its target of 2.5 percent sometime in early2011 (Central Bank of Iceland, 2009b), suggestingthat the monetary base increases are not antici-pated to increase inflation pressures.
New Zealand26
New Zealand’s monetary base increased 138percent between July and December 2006. Noadverse “shock” to the economy caused theReserve Bank of New Zealand (RBNZ) to increaseits monetary base. Rather, the increase was the
23 For additional details, see Central Bank of Iceland (2009a).
Anderson, Gascon, Liu
500 NOVEMBER/DECEMBER 2010 FEDERAL RESERVE BANK OF ST. LOUIS REVIEW
24 Iceland’s treasury purchased a 75 percent share in one bank (Glitnir)for €600 million and a week later the CBI loaned €500 million toanother bank (Kaupthing) for four days.
25 The CBI adopted an inflation target in March 2001.
26 For additional details, see Nield (2008).

Anderson, Gascon, Liu
FEDERAL RESERVE BANK OF ST. LOUIS REVIEW NOVEMBER/DECEMBER 2010 501
0
5
10
15
20
25
30
35
40
Jan05
Jul05
Jan06
Jul06
Jan07
Jul07
Jan08
Jul08
Jan09
Jul09
Jan10
NZD Billions
Marketable Securities in Foreign Currency
Advances (in NZD)
Other Assets in Foreign Currency
Government Securities (in NZD)
Other Assets (in NZD)
Other Liabilities
Reserve Bank Bills
Deposits
Currency
0
5
10
15
20
25
30
35
40
Jan05
Jul05
Jan06
Jul06
Jan07
Jul07
Jan08
Jul08
Jan09
Jul09
Jan10
NZD Billions
Assets
Liabilities
Figure 11
Composition of Reserve Bank of New Zealand Balance Sheet
NOTE: The Reserve Bank of New Zealand does not publish a series on the monetary base. It does publish data on settlement institutiondeposits at the RBNZ and currency in circulation, the sum of which is a measure of the monetary base.
SOURCE: Reserve Bank of New Zealand.

culmination of a collaborative project betweenthe Reserve Bank and the settlement banks toimprove the payment system to “reduce risk andenhance certainty in the financial system” (Nield,2008, p. 10). The RBNZ-operated payment systemdoes not permit daylight overdrafts (i.e., paymentson behalf of a bank that exceed the bank’s avail-able account balance at the RBNZ). Increasedsettlement balances at the RBNZ significantlyreduced delays in the payment system. The RBNZalso began paying interest on its settlement bal-ances to increase the acceptance of the systemand to discourage banks from using these reservebalances to fund new lending.
The new settlement system was implementedbetween August and October 2006. The RBNZexpected the monetary base would increase tobetween NZ$7 billion and NZ$10 billion (Nield,2008) as banks gradually unwound Treasury billholdings and used foreign exchange swaps topurchase New Zealand dollars. The RBNZ deter-mined that since the cash was purchased at ratesconsistent with the policy rate, there would beno inflationary pressures. In fact, year-over-yeargrowth in consumer prices fell from 3.4 percentin 2006:Q3 to 1.8 percent in 2007:Q3. It did, how-ever, increase to 5 percent in 2008:Q3 only toagain drop under 2 percent in 2009:Q2. Over thesame period, inflation expectations remainedwell anchored around 3 percent.
The financial crisis hit New Zealand in mid-2008. Between July 2008 and April 2009, as infla-tion expectations plummeted, the RBNZ reducedits target for the official cash rate to 2.5 percentfrom 8.25 percent. Although the RBNZ has notemphasized increases in its balance sheet as partof its policy, Figure 11 shows clearly that largebalance-sheet increases did occur. More recently,the RBNZ balance sheet has contracted somewhatas the crisis has eased, although a weak economicoutlook has caused the RBNZ to sustain a lowpolicy target rate.
CONCLUSIONDuring the past two decades, large increases—
and decreases—in central bank balance sheetshave become a viable monetary policy tool. His -torically, doubling or tripling a country’s mone-tary base was a recipe for certain higher inflation.Often such increases occurred only as part of afailed fiscal policy or, perhaps, as part of a policyto defend the exchange rate. Both economicmodels and central bank experience during thepast two decades suggest that such changes areuseful policy tools if the public understands theincrease is temporary and if the central bank hassome credibility with respect to desiring a low,stable rate of inflation. We find little increasedinflation impact from such expansions.
For monetary policy, our study suggests sev-eral findings:
(i) A large increase in a nation’s balance sheetover a short time can be stimulative.
(ii) The reasons for the action should be com-municated. Inflation expectations do notmove if households and firms understandthe reason(s) for policy actions so long asthe central bank can credibly commit tounwinding the expansion when appropriate.
(iii) The type of assets purchased matters lessthan the balance-sheet expansion.
(iv) When the crisis has passed, the balancesheet should be unwound promptly.
Anderson, Gascon, Liu
502 NOVEMBER/DECEMBER 2010 FEDERAL RESERVE BANK OF ST. LOUIS REVIEW

REFERENCESAnderson, Richard G. “Resolving a Banking Crisis, the Nordic Way.” Federal Reserve Bank of St. LouisEconomic Synopses, 2009, No. 10, February 18, 2009;http://research.stlouisfed.org/publications/es/09/ES0910.pdf.
Bank of England. “Asset Purchase Facility.” 2009a; www.bankofengland.co.uk/markets/apf/index.htm.
Bank of England. “Quantitative Easing Explained.” 2009b; www.bankofengland.co.uk/monetarypolicy/assetpurchases.htm.
Bank of Finland. Bank of Finland Annual Report 2008. March 2009; www.bof.fi/NR/rdonlyres/19D57A56-427D-4A21-B3CB-0D3B32217A59/0/VK08E.pdf.
Barro, Robert J. “Rational Expectations and the Role of Monetary Policy.” Journal of Monetary Economics,January 1976, 2(1), pp. 1-32.
Batchelor, Roy A. and Dua, Pami. “Household versus Economist Forecasts of Inflation: A Reassessment: Note.”Journal of Money, Credit, and Banking, May 1989, 21(2), pp. 252-257.
Berentsen, Aleksander and Waller, Christopher. “Price Level Targeting and Stabilization Policy.” Working PaperNo. 2009-033B, Federal Reserve Bank of St. Louis, revised October 2009;http://research.stlouisfed.org/wp/2009/2009-033.pdf (forthcoming in Journal of Money, Credit, and Banking).
Bernanke, Ben S. “The Federal Reserve’s Balance Sheet: An Update.” Speech at the Federal Reserve BoardConference on Key Developments in Monetary Policy, Washington, DC, October 8, 2009; www.federalreserve.gov/newsevents/speech/bernanke20091008a.htm.
Bernanke, Ben S. and Reinhart, Vincent R. “Conducting Monetary Policy at Very Low Short-Term Interest Rates.”American Economic Review, May 2004, 94(2), pp. 85-90.
Bernanke, Ben S.; Reinhart, Vincent R. and Sack, Brian P. “Monetary Policy Alternatives at the Zero Bound: An Empirical Assessment.” Brookings Papers on Economic Activity, 2004, 2, pp. 1-78.
Borio, Claudio and Disyatat, Piti. “Unconventional Monetary Policies: An Appraisal.” BIS Working Papers No. 292, Bank for International Settlements, November 2009; www.bis.org/publ/work292.pdf.
Central Bank of Iceland. Annual Report 2008. 2009a; www.sedlabanki.is/lisalib/getfile.aspx?itemid=7076.
Central Bank of Iceland. Financial Stability Report 2009. October 6, 2009b; www.sedlabanki.is/?PageID=1061.
Crowe, Christopher and Meade, Ellen E. “Central Bank Independence and Transparency: Evolution andEffectiveness.” European Journal of Political Economy, December 2008, 24(4), pp. 763-77.
Clarida, Richard; Galí, Jordi and Gertler, Mark. “The Science of Monetary Policy: A New Keynesian Perspective.”Journal of Economic Literature, December 1999, 37(4), pp. 1661-707.
Cúrdia, Vasco and Woodford, Michael. “The Central-Bank Balance Sheet as an Instrument of Monetary Policy.”Prepared for Carnegie-Rochester Conference on Public Policy, “The Future of Central Banking,” April 16-17,2010a; www.carnegie-rochester.rochester.edu/april10-pdfs/Curdia%20Woodford.pdf.
Cúrdia, Vasco and Woodford, Michael. “Conventional and Unconventional Monetary Policy.” Federal ReserveBank of St. Louis Review, July/August 92(4), 2010b;http://research.stlouisfed.org/publications/review/10/07/Curdia.pdf.
D’Arcy, Patrick and Ossolinski, Crystal. “Australian Capital Flows and the Financial Crisis.” Reserve Bank ofAustralia Bulletin, November 2009, pp. 1-6; www.rba.gov.au/publications/bulletin/2009/nov/pdf/bu-1109-1.pdf.
Debelle, Guy. “Market Operations in the Past Year.” Presented at the 2008 FTA Congress, Melbourne, Australia,October 31, 2008, Reserve Bank of Australia; www.rba.gov.au/speeches/2008/sp-ag-311008.html.
Anderson, Gascon, Liu
FEDERAL RESERVE BANK OF ST. LOUIS REVIEW NOVEMBER/DECEMBER 2010 503

Gertler, Mark and Karadi, Peter. “A Model of Unconventional Monetary Policy.” Unpublished manuscript,New York University, April 2009; www.econ.nyu.edu/user/gertlerm/gertlerkaradiapril2010conference.pdf.
Goodfriend, Marvin S. and King, Robert G. “A Note on the Neutrality of Temporary Monetary Disturbances.”Journal of Monetary Economics, 1981, 7(3), pp. 371-85.
Humpage, Owen F. and Shenk, Michael. “Japan’s Quantitative Easing Policy.” Federal Reserve Bank of ClevelandEconomic Trends, December 10, 2008; www.clevelandfed.org/research/trends/2008/1208/01intmar.cfm.
Honkapohja, Seppo. “The 1990’s Financial Crises in Nordic Countries.” Bank of Finland Research DiscussionPapers No. 5, 2009.
Jeanne, Olivier and Svensson, Lars E.O. “Credible Commitment to Optimal Escape from a Liquidity Trap: TheRole of the Balance Sheet of an Independent Central Bank.” American Economic Review, March 2007, 97(1),pp. 474-90.
Laurens, Bernard J.; Arnone, Marco and Seglaotto, Jean-Francois. Central Bank Independence, Accountability,and Transparency. Hampshire, UK: Palgrave Macmillan, 2009.
Liikanen, Erkki. “Central Banking in a Global Financial Crisis.” Presented at the Finnish Economic Associationmeeting, January 29, 2009; www.bof.fi/en/suomen_pankki/ajankohtaista/puheet/2009/EL_puhe29012009.htm.
Maeda, Eiji; Fujiwara, Bunya; Mineshima, Aiko and Taniguchi, Ken. “Japan’s Open Market Operations underthe Quantitative Easing Policy.” Bank of Japan Working Paper Series No. 05-E-3, April 8, 2005;www.boj.or.jp/en/type/ronbun/ron/wps/data/wp05e03.pdf.
Meltzer, Allan. “The Origins of the Great Inflation.” Federal Reserve Bank of St. Louis Review, March/April 2005,87(2, Part 2), pp. 145-75; http://research.stlouisfed.org/publications/review/05/03/part2/Meltzer.pdf.
Mutikainen, Tapio. “Recession, Economic Policy and Banking Crisis Management in Finland in the 1990’s.”Ministry of Finance discussion paper, June 23, 1998;www.vm.fi/vm/fi/04_julkaisut_ja_asiakirjat/03_muut_asiakirjat/discussion_paper.pdf.
Nield, Ian. “Evolution of the Reserve Bank’s Liquidity Facilities.” Reserve Bank of New Zealand Bulletin,December 2008, 71(4), pp. 5-17; www.rbnz.govt.nz/research/bulletin/2007_2011/2008dec71_4nield.pdf.
Nishimura, Kiyohiko G. “Japan’s Economy and Monetary Policy.” Speech at a Meeting with Business Leadersin Miyagi, April 21, 2010; www.boj.or.jp/en/type/press/koen07/data/ko1004d.pdf.
Öberg, Svante. “Sweden and the Financial Crisis.” Speech at Carlson Investment Management, Stockholm,January 20, 2009; www.riksbank.com/templates/Page.aspx?id=30276.
Oda, Nobuyuki and Ueda, Kazuo. “The Effects of the Bank of Japan’s Zero Interest Rate Commitment andQuantitative Monetary Easing on the Yield Curve: A Macro-Finance Approach.” Japanese Economic Review,2007, 58(3), pp. 303-28.
Reis, Ricardo. “An Interpretation of the Unconventional U.S. Monetary Policy Response to the 2007-09 Crisis.”Presented at the September 2009 Brookings Conference on Economic Activity. (Forthcoming in BrookingsPapers on Economic Activity; August 2009 draft version available atwww.brookings.edu/~/media/Files/Programs/ES/BPEA/2009_fall_bpea_papers/2009_fall_bpea_reis.pdf).
Sandal, Knut. “The Nordic Banking Crises in the Early 1990s—Resolution Methods and Fiscal Costs,” inThorvald G. Moe, Jon A. Solheim, and Bent Vale, eds., The Norwegian Banking Crisis (Norges BanksSkriftserie/Occasional Papers No. 33, 2004). Chap. 3. Oslo, Norway: Norges Bank, 2004, pp. 77-115;www.norges-bank.no/upload/import/publikasjoner/skriftserie/33/chapter3.pdf.
Sargent, Thomas U. “The Ends of Four Big Inflations,” in Robert Hall, ed. Inflation: Causes and Effects. Chap. 2.Chicago: University of Chicago Press, 1982, pp. 41-92; www.nber.org/chapters/c11452.pdf.
Anderson, Gascon, Liu
504 NOVEMBER/DECEMBER 2010 FEDERAL RESERVE BANK OF ST. LOUIS REVIEW

Shirakawa, Maasaki. “Uniqueness or Similarity? Japan’s Post-Bubble Experience in Monetary Policy Studies.”Keynote address at Second IJCB Fall Conference hosted by the Institute for Monetary and Economic Studies,the Bank of Japan. September 16, 2010; www.boj.or.jp/en/type/press/koen07/data/ko1009c.pdf.
Shiratsuka, Shigenori. “Size and Composition of the Central Bank Balance Sheet: Revisiting Japan’s Experienceof the Quantitative Easing Policy.” Bank of Japan, IMES Discussion Paper No. 2009-E-25, November 2009;www.imes.boj.or.jp/english/publication/edps/2009/09-E-25.pdf.
Söderström, Ulf and Westermark, Andreas. “Monetary Policy When the Interest Rate Is Zero.” Sveriges RiksbankEconomic Review, 2, pp. 5-30;www.riksbank.se/upload/Dokument_riksbank/Kat_publicerat/Rapporter/2009/2009_2_pv_eng.pdf.
Stevens, Glenn. “The Conduct of Monetary Policy in Crisis and Recovery.” Address to The John CurtinInstitute of Public Policy and Financial Services Institute of Australasia Public Policy Breakfast Forum, Perth,Australia, October 15, 2009; www.rba.gov.au/speeches/2009/sp-gov-151009.html.
Stevens, Glenn. “Recent Financial Developments.” Address to ACI 2010 49th World Congress, Sydney,Australia, March 26, 2010; www.bis.org/review/r100330c.pdf.
Swiss National Bank. 2009 Financial Stability Report. June 2009;www.snb.ch/en/mmr/reference/stabrep_2009/source/stabrep_2009.en.pdf.
Ugai, Hiroshi. “Effects of the Quantitative Easing Policy: A Survey of Empirical Analyses.” Monetary andEconomic Studies, March 2007, 25(1), pp. 1-48.
Woodford, Michael. “Inflation Targeting and Optimal Monetary Policy.” Federal Reserve Bank of St. LouisReview, July/August 2004, 86(4), pp. 15-41;http://research.stlouisfed.org/publications/review/04/07/Woodford.pdf.
Anderson, Gascon, Liu
FEDERAL RESERVE BANK OF ST. LOUIS REVIEW NOVEMBER/DECEMBER 2010 505

506 NOVEMBER/DECEMBER 2010 FEDERAL RESERVE BANK OF ST. LOUIS REVIEW