dowdupont (2017 earnings...
TRANSCRIPT
February 1, 2018
(1) Adjusted earnings per share, Pro forma adjusted earnings per share, Operating EBITDA and Pro forma operating EBITDA are non-GAAP measures. See page 9 for further discussion.Full-year 2017 and prior year information is on a pro forma basis and was determined in accordance with Article 11 of Regulation S-X.
(2) Pension/OPEB (other post employment benefit plans) costs include all components of net periodic benefit cost from continuing operations.
DowDuPont Reports Fourth Quarter and Full Year 2017 Results• 4Q GAAP Loss Per Share from Continuing Operations of $0.52; Adj. EPS Up 41% to $0.83• 4Q GAAP Net Loss from Continuing Operations of $1.2B; Op. EBITDA Up 24% to $3.9B• 4Q Net Sales Rise 13% to $20.1B, with Gains in all Operating Segments and Geographies• 2017 GAAP EPS from Continuing Operations of $0.95; Pro Forma Adj. EPS Up 22% to $3.40• 2017 GAAP Net Income from Continuing Operations of $1.7B; Pro Forma Op. EBITDA Up 15%
to $16.2B• 2017 GAAP Net Sales of $62.5B; Pro Forma Net Sales Grow 12% to $79.5B, with Gains in all
Operating Segments and Geographies
Fourth Quarter 2017 Highlights• DowDuPont reported a GAAP loss per share from continuing operations of $0.52. Adjusted earnings1
per share increased 41 percent to $0.83, compared with pro forma adjusted earnings per share in theyear-ago period of $0.59. Adjusted earnings per share excludes significant items in the quartertotaling net charges of $1.26 per share, as well as a $0.09 per share charge for DuPont amortizationof intangible assets.
• Net sales increased 13 percent to $20.1 billion, with gains in all operating segments andgeographies, from pro forma net sales of $17.7 billion in the year-ago period. The primary salesgrowth drivers by division were: Materials Science – Industrial Intermediates & Infrastructure(27 percent) and Packaging & Specialty Plastics (17 percent); Specialty Products – Transportation &Advanced Polymers and Nutrition & Biosciences (10 percent each); and Agriculture (5 percent).Regional sales increases were led by Europe, Middle East and Africa (EMEA) (25 percent) and NorthAmerica (10 percent), with gains in all divisions, led by the Materials Science operating segments.
• Volume grew 6 percent on a pro forma basis, with increases in all operating segments andgeographies on broad-based, consumer-led and investment-driven demand. Volume gains were ledby Industrial Intermediates & Infrastructure (13 percent), Packaging & Specialty Plastics (8 percent),Electronics & Imaging (6 percent) and Transportation & Advanced Polymers (5 percent). Regionalvolume growth was led by EMEA (10 percent) and Asia Pacific (6 percent).
• Local price rose 5 percent on a pro forma basis, led by increases in all geographies and double-digitgains in Industrial Intermediates & Infrastructure (12 percent) and Performance Materials & Coatings(10 percent).
• Operating EBITDA1 increased 24 percent on a pro forma basis to $3.9 billion, driven by volume andprice gains, including new capacity additions in the U.S. Gulf Coast and Saudi Arabia; cost synergies;lower pension/OPEB costs2; and higher equity earnings. These gains more than offset higherfeedstock costs and startup expenses related to new assets on the U.S. Gulf Coast.
• The Company achieved an annual cost synergy run-rate of more than $800 million and more than$200 million of realized savings in the fourth quarter. DowDuPont is announcing today that it isincreasing its cost synergy commitment from $3 billion to $3.3 billion.
• Cash flow from operations in the quarter was $4.2 billion, driven by increased cash earnings andAgriculture’s seasonal cash inflow, partly offset by contributions to pension plans.
• The Company returned nearly $2 billion to shareholders in the quarter through dividends ($0.9 billion)and share repurchases ($1 billion).
• Fourth quarter GAAP results include net tax benefits of $1.1 billion (a significant item of $0.46 pershare) related to remeasurements and charges as a result of new U.S. tax legislation. The Companyexpects this new legislation to translate into a 1-2 percentage point reduction in its 2018 tax rateversus previous expectations.
• The Company is announcing today that it has updated the timing and sequence of the intendedseparation of the companies: Materials Science is expected to separate by the end of the first quarterof 2019, and Agriculture and Specialty Products are expected to separate by June 1, 2019.
CEO Quote
“Our fourth quarter operating results continued the strong performance that we delivered throughout2017, as we grew our top and bottom lines by double digits in the quarter and the full year,” said EdBreen, chief executive officer of DowDuPont. “Our 2017 results reflect robust underlying demand formany of our products, the power of our innovation engine and our leading positions in growing markets.We delivered these results while completing our merger, realigning the business around key end-markets, and achieving more than $800 million in run-rate savings from our cost synergy programs.Based on the progress we’ve made, we are raising our commitment for cost synergies from $3 billion to$3.3 billion, an increase of 10 percent. We also are making significant progress standing up the intendedpublic companies, which we now expect to spin about 14 to 16 months from today.”
2017 Full-Year Highlights
• GAAP earnings per share from continuing operations was $0.95. Pro forma adjusted earnings pershare increased 22 percent to $3.40 versus the year-ago period. Pro forma adjusted earnings pershare excludes significant items totaling net charges of $1.90 per share, as well as a $0.33 per sharecharge for DuPont amortization of intangible assets.
• GAAP net sales increased 30 percent. Pro forma net sales increased to $79.5 billion, up 12 percentversus the year-ago period, with gains in all operating segments and all geographies. Primary salesgrowth drivers were: Materials Science – Performance Materials & Coatings (37 percent), IndustrialIntermediates & Infrastructure (17 percent) and Packaging & Specialty Plastics (13 percent);Specialty Products – Transportation & Advanced Polymers (14 percent) and Electronics & Imaging(12 percent); and Agriculture (2 percent). Sales rose double-digits in EMEA (17 percent), Asia Pacific(15 percent) and North America (10 percent). Sales in Latin America grew 5 percent.
• Pro forma operating EBITDA increased 15 percent to $16.2 billion, driven by volume and price gains,including new capacity additions; cost synergies and productivity actions; higher equity earnings;lower pension/OPEB costs; and the full-year contribution of silicones. These gains more than offsethigher feedstock costs, startup expenses on the U.S. Gulf Coast and the unfavorable impact ofhurricanes. Increases were achieved in most operating segments, led by double-digit growth inPerformance Materials & Coatings; Industrial Intermediates & Infrastructure; Electronics & Imaging;Transportation & Advanced Polymers; and Agriculture.
• Less than two weeks following merger close, DowDuPont announced certain targeted portfolioadjustments to the Materials Science and Specialty Products divisions to better align with end-markets and further enhance the competitive advantages of the intended companies.
• DowDuPont satisfied key regulatory remedies required of the merger transaction, including: divestingDuPont’s cereal broadleaf herbicides and chewing insecticides portfolios, as well as certain parts ofits crop protection R&D pipeline and organization to FMC; divesting Dow’s PRIMACOR™ ethyleneacrylic acid copolymers and ionomers business; and divesting a select portion of Dow AgroSciences'corn seed business in Brazil. The Company also closed its acquisition of FMC's Health and Nutritionbusiness.
2
Fourth Quarter Segment Information
Agriculture
Sales of $2.8 billion were up 5 percent from pro forma net sales of $2.7 billion in the year-ago period.Volume and currency improvements of 2 percent and 1 percent, respectively, were partially offset bylocal price declines. Portfolio-related actions increased sales by 3 percent.
Organic revenue growth was realized in both seed and crop protection. Seed volume and price roseslightly as earlier Brazil safrinha deliveries, doubling of corn sales in Argentina, driven by penetration ofLeptra® corn hybrids, and growth in the European sunflower and corn seed business were partially offsetby the reduction in Brazil summer corn area. Crop protection volume improvement was driven by thecontinued penetration of new products such as Vessarya™ fungicide and increased demand forOptinyte™ nitrogen stabilizers and novel seed treatment solutions. Crop protection pricing declined,driven by generic pricing pressure, specifically in Latin America and Asia Pacific.
Operating EBITDA for the segment more than doubled to $224 million, versus pro forma operatingEBITDA of $100 million in the year-ago period. The improvement resulted primarily from synergies andother cost reductions, lower pension/OPEB costs, volume increases, and a net portfolio gain. Thisimprovement was partially offset by lower local price due to generic crop protection pricing pressure andhigher soybean royalties.
Full-year pro forma net sales of $14.3 billion rose 2 percent from pro forma net sales of $14.1 billionreported in the year-ago period driven by higher volumes and a portfolio gain. Full-year seed salesincreased 5 percent due to both volume and price improvement. Full-year crop protection sales weredown 1 percent as growth from new products was more than offset by pricing pressures in Latin Americaand high inventory levels in China.
Full-year pro-forma operating EBITDA for the segment improved 12 percent to $2.6 billion versus proforma operating EBITDA of $2.3 billion in the year-ago period. The improvement resulted primarily fromhigher volumes, synergies, lower pension/OPEB costs and currency. Pro forma operating EBITDAgrowth was partially offset by lower local price due to generic crop protection pricing pressure and highersoybean royalties.
Materials Science
Performance Materials & CoatingsPerformance Materials & Coatings reported net sales of $2.2 billion, up 15 percent versus pro forma netsales of $1.9 billion in the year-ago period. The year-over-year gain was primarily driven by double-digitgrowth in both businesses, as well as double-digit increases across all geographic regions. Local priceincreased 10 percent, with gains in all geographic regions and both businesses. Volume grew 4 percent,driven by gains in North America, Asia Pacific and Latin America.
Consumer Solutions delivered double-digit sales growth in all geographic regions, driven by strong gainsin local price in Asia Pacific and EMEA; disciplined price/volume management in upstream siliconeintermediate products; and broad-based demand for downstream applications including pressuresensitive adhesives and high performance building solutions. Coatings & Performance Monomersachieved double-digit growth in sales, on strong local price increases in all geographic regions andhigher demand in North America.
3
Operating EBITDA increased to $613 million, up 56 percent from pro forma operating EBITDA of$392 million in the year-ago period, primarily due to increased pricing, higher equity earnings, strongend-market demand and cost synergies.
Equity earnings for the segment totaled $223 million, compared with pro forma equity earnings of$176 million in the year-ago period, driven by two factors at the HSC Group – higher demand from thephotovoltaics end-market and DowDuPont’s share of a settlement of a long-term polysilicon salesagreement.
Industrial Intermediates & InfrastructureIndustrial Intermediates & Infrastructure reported net sales of $3.6 billion, up 27 percent versus pro formanet sales of $2.8 billion in the year-ago period. Double-digit sales gains were reported in all geographicregions. Volume grew 13 percent while local price rose 12 percent.
Polyurethanes & Chlor-Alkali and Vinyl (CAV) delivered robust sales growth in all geographic regions,driven by double-digit price and volume gains. The business also reported strong price and demandincreases in downstream, higher-margin systems applications, as well as higher merchant sales ofmethylene diphenyl diisocyanate (MDI) and caustic where industry supply/demand fundamentalsremained tight. Industrial Solutions grew sales double digits, led by surfactants, glycol ethers andethylene glycols in consumer-driven applications, including electronics processing, crop defense andfood and pharmaceuticals. The business delivered volume and price gains in all geographic regions.Construction Chemicals delivered sales growth driven by demand for methyl cellulosics in EMEA. EnergySolutions reported lower sales due to reduced project activity in energy market sectors.
Operating EBITDA was $677 million, up 38 percent from pro forma operating EBITDA of $489 million inthe year-ago period. Pricing momentum, improved equity earnings and demand growth in mostbusinesses more than offset the impact of higher raw material costs.
Equity earnings for the segment totaled $71 million, compared with pro forma equity earnings of$31 million in the year-ago period. The year-over-year growth was driven by improvement in Sadaraequity losses due to further progression of facility startups and contributions from the EQUATE jointventure as a result of higher monoethylene glycol pricing.
Packaging & Specialty PlasticsThe Packaging & Specialty Plastics segment reported net sales of $6.1 billion, up 17 percent from proforma net sales of $5.2 billion in the year-ago period. Sales growth was driven by volume gains of8 percent, local price increases of 7 percent and a 2 percent tailwind from currency, primarily in Europe.Volume highlights included double-digit percent growth in North America and EMEA on higherhydrocarbons sales, new capacity additions on the U.S. Gulf Coast and ramp-up in Sadara production.Local price gains were recorded in all geographic regions.
The Packaging and Specialty Plastics business grew volume on continued consumer-led demand acrosskey end-markets. Notable highlights included double-digit sales growth in food and specialty packagingas well as in industrial and consumer packaging end-markets in EMEA, enabled by the contributions ofvolumes from the Sadara joint venture. Volume growth in North America was driven by robust demand infood and specialty packaging as well as in health and hygiene applications, supported by start-up of theELITE™ polyethylene unit. Gradual recovery from hurricane-related supply limitations continued to impactpolyethylene sales volumes, particularly exports to Latin America, as well as global sales of ethylenecopolymers and products for wire and cable applications. The business also delivered volume gains in
4
elastomers applications, including: footwear and photovoltaics applications in Asia Pacific; hot meltadhesives in EMEA; and infrastructure applications in North America.
Operating EBITDA for the segment totaled $1.3 billion, flat with pro forma operating EBITDA in the year-ago period. Price and volume gains, including the benefit of new capacity additions, were offset byincreased feedstock costs; cost and production impacts from hurricane-related disruptions andmaintenance activities; as well as commissioning and startup costs for the U.S. Gulf Coast growthprojects.
Equity earnings for the segment were $59 million, down from pro forma equity earnings of $64 million inthe year-ago period. Improvement in Sadara equity losses, driven by higher sales of polyethylene, weremore than offset by reduced earnings at the Thai joint ventures, due to rising raw material costs, and atthe Kuwait joint ventures, driven by planned maintenance activities.
Specialty Products
Electronics & ImagingElectronics & Imaging delivered net sales of $1.2 billion, an increase of 1 percent versus pro forma netsales in the year-ago period. Net sales growth was led by volume gains of 6 percent, which more thanoffset a 5 percent negative impact from portfolio-related actions (sales of the Display Films andAuthentication businesses).
Volume growth in the segment was driven by double-digit gains in consumer electronics, industrial andsemiconductor end-markets, primarily in Asia Pacific. Continued demand for mobile phones and otherconsumer electronics, as well as industrial applications drove volume gains. Increased semiconductorcontent in end-use applications drove strong demand in both memory and logic market segments.Partially offsetting this growth was a decline in photovoltaics as demand for Tedlar® film was more thanoffset by continued declines in Solamet® paste due to competitive pressure.
Operating EBITDA for the segment was $367 million, up 11 percent from pro forma operating EBITDA of$331 million in the year-ago period. Volume growth, lower pension/OPEB costs, and cost synergies morethan offset hurricane-related costs, a negative impact from portfolio and higher raw material costs.
Nutrition & BiosciencesNutrition & Biosciences reported net sales of $1.6 billion, up from pro forma net sales of $1.4 billion in theyear-ago period. Net sales growth of 10 percent was due to a 6 percent net benefit from portfolio, a2 percent benefit from volume and a 2 percent benefit from currency. The positive impact from portfolio-related actions was due to the acquisition of FMC’s Health & Nutrition business.
Volume growth in the segment was led by increased demand for bioactives, continued growth inprobiotics, demand for microbial control solutions in energy markets in North America, and growth inpharmaceuticals, including excipients and vegetal-based encapsulations. Growth in bioactives reflectedstrength in home and personal care and animal nutrition markets due to new product introductions.Continued growth in probiotics was driven by demand in Asia Pacific and Europe. Partially offsetting thisgrowth were declines in systems and texturants due to continued weakness in packaged food markets,primarily in North America, and specific actions taken to exit low-margin market segments.
Operating EBITDA for the segment was $352 million, up 14 percent from pro forma operating EBITDA of$309 million in the year-ago period driven by a portfolio benefit, lower pension/OPEB costs, cost
5
synergies, and volume growth. Partially offsetting these gains was the absence of a $27 million gain froma prior-year asset sale.
Transportation & Advanced PolymersTransportation & Advanced Polymers reported net sales of $1.3 billion, up from pro forma net sales of$1.2 billion in the year-ago period. Net sales growth of 10 percent included volume gains of 5 percent,local price benefits of 4 percent and 1 percent from currency. The growth, which was achieved in mostgeographies, was led by strong demand from the automotive market and broad-based demand fromelectronics and industrial markets. Focused application development and continued trends in lightweighting of vehicles and higher temperature environments fueled stronger demand for adhesives andengineered polymers. The segment continued to outpace global industry auto builds, which according toIHS rose 1 percent in the quarter versus last year.
Volume gains were also achieved by Kalrez® and Vespel® high-performance parts as demand from theelectronics and aerospace markets remained robust while demand for specialty silicones in medicaldevices remained solid. Volume growth was led by Asia Pacific, followed by the Americas and Europe.
Operating EBITDA for the segment was $365 million, up 32 percent from pro forma operating EBITDA of$276 million in the year-ago period. Benefits from lower pension/OPEB costs, volume gains, improvedlocal price and cost synergies more than offset higher raw material costs.
Safety & ConstructionSafety and Construction delivered net sales of $1.3 billion, compared with pro forma net sales of$1.2 billion for the year-ago period. Net sales growth of 4 percent was driven by volume gains of4 percent and currency of 1 percent, partly offset by a decrease in local price of 1 percent. Volumegrowth reflected continued solid demand across industrial markets, construction and medical packaging.Local price declines reflected pressure in isolated areas of aramids as well as product mix, partly offsetby gains in building solutions.
The volume gain was led by Tyvek® protective materials, which achieved double-digit percent volumegrowth due to increased demand from industrial and construction markets as well as medical packaging.Contributing to the volume gain was a high-single-digit percent increase in Kevlar® high-strengthmaterials, reflecting higher demand from industrial markets. A low-single-digit percent volume gain fromwater filtration reflected strength in ion exchange resins and ultra-filtration in industrial applications.Building Solutions volumes also rose by the low-single-digits percent with gains in foam board amidstronger construction demand. Nomex® thermal-resistant garment volumes were even with strong salesin the prior year’s quarter while Corian® design volume was constrained by raw material availability.Regionally, volume growth was driven by Europe, followed by Asia Pacific and Latin America. Driversincluded Tyvek® for graphics and house wrap in EMEA, and gains from Kevlar® in Asia Pacific.
Operating EBITDA for the segment was $285 million, up 26 percent from pro forma operating EBITDA of$227 million in the year-ago period as lower pension/OPEB costs and broad-based volume growth waspartly offset by the impact of lower local price and higher raw material costs.
6
Outlook
“The trajectory of global economic expansion has gained momentum – driven by robust fundamentals inconsumer and business confidence, employment and wage growth and manufacturing and infrastructureinvestment activity,” said Andrew Liveris, executive chairman of DowDuPont. “In developed economies inparticular, such as the United States, Germany, France, Canada and the U.K., we continue to see strongleading indicators of broad-based growth. Furthermore, early signs from the business community point toU.S. tax reform as a catalyst for further domestic capital investments, which will take advantage ofenhanced competitiveness and pro-business incentives. Adding to this, the emerging middle class indeveloping economies, most notably in India and China, but also in Africa and the Middle East, continuesto support sustainable growth.
“All of this bodes well for the products and technologies within DowDuPont’s portfolio, which are wellpositioned to meet growing needs in the Materials Science, Agriculture and Specialty Product sectors.Looking ahead, our levers of value creation are clear: continuing to further unlock the cost and growthsynergies of this merger transaction, capitalizing on our early success and achieving the enhanced costsynergy commitment we are announcing today; delivering new products from our in-flight growthinvestments and powerful innovation pipeline; and quickly standing and separating into three industry-leading companies on the new accelerated timeline we announced today.”
Conference Call
The Company will host a live webcast of its fourth quarter and full-year earnings conference call withinvestors to discuss its results, business outlook and other matters today at 8:00 a.m. ET. The slidepresentation that accompanies the conference call will be posted on the DowDuPont Investor Relationsevents and presentations page. A replay of the webcast will also be available on the investor events andpresentations page of www.dow-dupont.com.
About DowDuPont™DowDuPont (NYSE: DWDP) is a holding company comprised of The Dow Chemical Company andDuPont with the intent to form strong, independent, publicly traded companies in agriculture, materialsscience and specialty products sectors that will lead their respective industries through productive,science-based innovation to meet the needs of customers and help solve global challenges. For moreinformation, please visit us at www.dow-dupont.com.
Contact Information:
Investors:Greg [email protected]+1 302-774-4994
Neal [email protected]+1 989-636-6347
Media:Rachelle [email protected]+1 989-638-4090
Dan [email protected]+1 302-996-8372
7
Cautionary Statement About Forward-Looking Statements
This communication contains “forward-looking statements” within the meaning of the federal securities laws, including Section 27A of theSecurities Act of 1933, as amended, and Section 21E of the Securities Exchange Act of 1934, as amended. In this context, forward-lookingstatements often address expected future business and financial performance and financial condition, and often contain words such as “expect,”“anticipate,” “intend,” “plan,” “believe,” “seek,” “see,” “will,” “would,” “target,” similar expressions, and variations or negatives of these words.
On December 11, 2015, The Dow Chemical Company (“Dow”) and E. I. du Pont de Nemours and Company (“DuPont”) announced entry into anAgreement and Plan of Merger, as amended on March 31, 2017, (the “Merger Agreement”) under which the companies would combine in an all-stock merger of equals transaction (the “Merger”). Effective August 31, 2017, the Merger was completed and each of Dow and DuPont becamesubsidiaries of DowDuPont Inc. (“DowDuPont” or the “Company”).
Forward-looking statements by their nature address matters that are, to varying degrees, uncertain, including the intended separation, subject toapproval of the Company’s board of directors, of DowDuPont’s agriculture, materials science and specialty products businesses in one or moretax efficient transactions on anticipated terms (the “Intended Business Separations”). Forward-looking statements are not guarantees of futureperformance and are based on certain assumptions and expectations of future events which may not be realized. Forward-looking statementsalso involve risks and uncertainties, many of which are beyond the Company’s control. Some of the important factors that could causeDowDuPont’s, Dow’s or DuPont’s actual results to differ materially from those projected in any such forward-looking statements include, but arenot limited to: (i) costs to achieve and achieving the successful integration of the respective agriculture, materials science and specialty productsbusinesses of Dow and DuPont, anticipated tax treatment, unforeseen liabilities, future capital expenditures, revenues, expenses, earnings,productivity actions, economic performance, indebtedness, financial condition, losses, future prospects, business and management strategiesfor the management, expansion and growth of the combined operations; (ii) costs to achieve and achievement of the anticipated synergies bythe combined agriculture, materials science and specialty products businesses; (iii) risks associated with the Intended Business Separations,including conditions which could delay, prevent or otherwise adversely affect the proposed transactions, including possible issues or delays inobtaining required regulatory approvals or clearances related to the Intended Business Separations, associated cost, disruptions in the financialmarkets or other potential barriers; (iv) disruptions or business uncertainty, including from the Intended Business Separations, could adverselyimpact DowDuPont’s business (either directly or as conducted by and through Dow or DuPont), or financial performance and its ability to retainand hire key personnel; (v) uncertainty as to the long-term value of DowDuPont common stock; and (vi) risks to DowDuPont’s, DuPont’s andDow’s business, operations and results of operations from: the availability of and fluctuations in the cost of energy and feedstocks; balance ofsupply and demand and impact of balance on prices; failure to develop and market new products and optimally manage product life cycles;ability, cost and impact on business operations, including the supply chain, of responding to changes in market acceptance, rules, regulationsand policies and failure to respond to such changes; outcome of significant litigation, environmental matters and other commitments andcontingencies; failure to appropriately manage process safety and product stewardship issues; global economic and capital markets conditions,including the continued availability of capital and financing, as well as inflation, interest and currency exchange rates; changes in politicalconditions, business or supply disruptions; security threats, such as acts of sabotage, terrorism or war, natural disasters and weather events andpatterns which could result in a significant operational event for the Company, adversely impact demand or production; ability to discover,develop and protect new technologies and to protect and enforce the Company’s intellectual property rights; failure to effectively manageacquisitions, divestitures, alliances, joint ventures and other portfolio changes; unpredictability and severity of catastrophic events, including, butnot limited to, acts of terrorism or outbreak of war or hostilities, as well as management’s response to any of the aforementioned factors. Theserisks are and will be more fully discussed in the current, quarterly and annual reports filed with the U. S. Securities and Exchange Commissionby DowDuPont. While the list of factors presented here is, considered representative, no such list should be considered to be a completestatement of all potential risks and uncertainties. Unlisted factors may present significant additional obstacles to the realization of forward-looking statements. Consequences of material differences in results as compared with those anticipated in the forward-looking statements couldinclude, among other things, business disruption, operational problems, financial loss, legal liability to third parties and similar risks, any of whichcould have a material adverse effect on DowDuPont’s, Dow’s or DuPont’s consolidated financial condition, results of operations, credit rating orliquidity. None of DowDuPont, Dow or DuPont assumes any obligation to publicly provide revisions or updates to any forward-looking statementswhether as a result of new information, future developments or otherwise, should circumstances change, except as otherwise required bysecurities and other applicable laws.
8
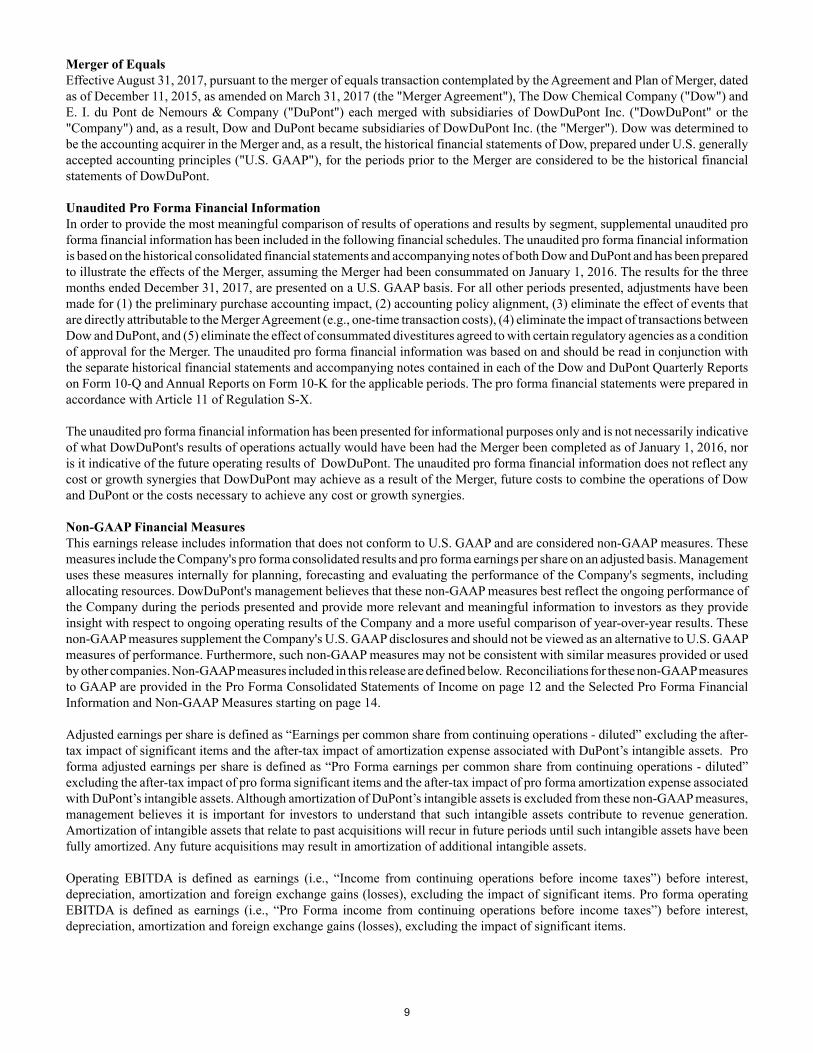
Merger of EqualsEffective August 31, 2017, pursuant to the merger of equals transaction contemplated by the Agreement and Plan of Merger, dated as of December 11, 2015, as amended on March 31, 2017 (the "Merger Agreement"), The Dow Chemical Company ("Dow") and E. I. du Pont de Nemours & Company ("DuPont") each merged with subsidiaries of DowDuPont Inc. ("DowDuPont" or the "Company") and, as a result, Dow and DuPont became subsidiaries of DowDuPont Inc. (the "Merger"). Dow was determined to be the accounting acquirer in the Merger and, as a result, the historical financial statements of Dow, prepared under U.S. generally accepted accounting principles ("U.S. GAAP"), for the periods prior to the Merger are considered to be the historical financial statements of DowDuPont.
Unaudited Pro Forma Financial InformationIn order to provide the most meaningful comparison of results of operations and results by segment, supplemental unaudited pro forma financial information has been included in the following financial schedules. The unaudited pro forma financial information is based on the historical consolidated financial statements and accompanying notes of both Dow and DuPont and has been prepared to illustrate the effects of the Merger, assuming the Merger had been consummated on January 1, 2016. The results for the three months ended December 31, 2017, are presented on a U.S. GAAP basis. For all other periods presented, adjustments have been made for (1) the preliminary purchase accounting impact, (2) accounting policy alignment, (3) eliminate the effect of events that are directly attributable to the Merger Agreement (e.g., one-time transaction costs), (4) eliminate the impact of transactions between Dow and DuPont, and (5) eliminate the effect of consummated divestitures agreed to with certain regulatory agencies as a condition of approval for the Merger. The unaudited pro forma financial information was based on and should be read in conjunction with the separate historical financial statements and accompanying notes contained in each of the Dow and DuPont Quarterly Reports on Form 10-Q and Annual Reports on Form 10-K for the applicable periods. The pro forma financial statements were prepared in accordance with Article 11 of Regulation S-X.
The unaudited pro forma financial information has been presented for informational purposes only and is not necessarily indicative of what DowDuPont's results of operations actually would have been had the Merger been completed as of January 1, 2016, nor is it indicative of the future operating results of DowDuPont. The unaudited pro forma financial information does not reflect any cost or growth synergies that DowDuPont may achieve as a result of the Merger, future costs to combine the operations of Dow and DuPont or the costs necessary to achieve any cost or growth synergies.
Non-GAAP Financial MeasuresThis earnings release includes information that does not conform to U.S. GAAP and are considered non-GAAP measures. These measures include the Company's pro forma consolidated results and pro forma earnings per share on an adjusted basis. Management uses these measures internally for planning, forecasting and evaluating the performance of the Company's segments, including allocating resources. DowDuPont's management believes that these non-GAAP measures best reflect the ongoing performance of the Company during the periods presented and provide more relevant and meaningful information to investors as they provide insight with respect to ongoing operating results of the Company and a more useful comparison of year-over-year results. These non-GAAP measures supplement the Company's U.S. GAAP disclosures and should not be viewed as an alternative to U.S. GAAP measures of performance. Furthermore, such non-GAAP measures may not be consistent with similar measures provided or used by other companies. Non-GAAP measures included in this release are defined below. Reconciliations for these non-GAAP measures to GAAP are provided in the Pro Forma Consolidated Statements of Income on page 12 and the Selected Pro Forma Financial Information and Non-GAAP Measures starting on page 14.
Adjusted earnings per share is defined as “Earnings per common share from continuing operations - diluted” excluding the after-tax impact of significant items and the after-tax impact of amortization expense associated with DuPont’s intangible assets. Pro forma adjusted earnings per share is defined as “Pro Forma earnings per common share from continuing operations - diluted” excluding the after-tax impact of pro forma significant items and the after-tax impact of pro forma amortization expense associated with DuPont’s intangible assets. Although amortization of DuPont’s intangible assets is excluded from these non-GAAP measures, management believes it is important for investors to understand that such intangible assets contribute to revenue generation. Amortization of intangible assets that relate to past acquisitions will recur in future periods until such intangible assets have been fully amortized. Any future acquisitions may result in amortization of additional intangible assets.
Operating EBITDA is defined as earnings (i.e., “Income from continuing operations before income taxes”) before interest, depreciation, amortization and foreign exchange gains (losses), excluding the impact of significant items. Pro forma operating EBITDA is defined as earnings (i.e., “Pro Forma income from continuing operations before income taxes”) before interest, depreciation, amortization and foreign exchange gains (losses), excluding the impact of significant items.
9
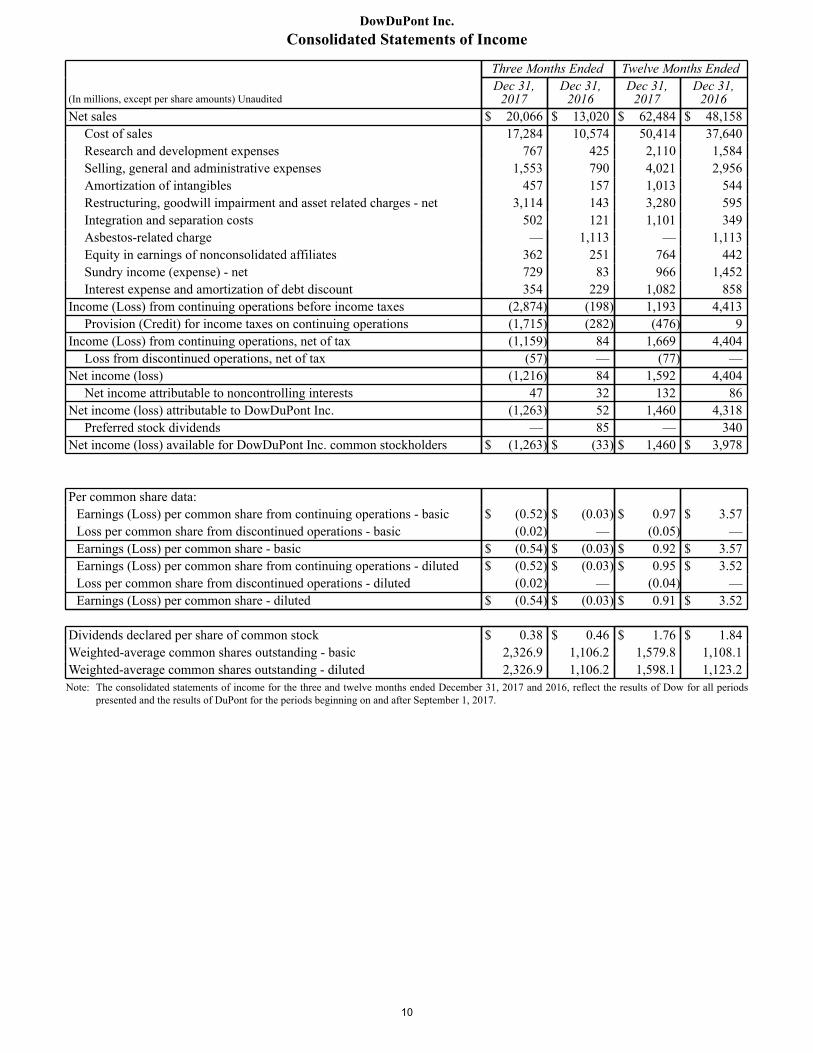
DowDuPont Inc.Consolidated Statements of Income
(In millions, except per share amounts) Unaudited
Three Months Ended Twelve Months EndedDec 31,
2017Dec 31,
2016Dec 31,
2017Dec 31,
2016Net sales $ 20,066 $ 13,020 $ 62,484 $ 48,158
Cost of sales 17,284 10,574 50,414 37,640Research and development expenses 767 425 2,110 1,584Selling, general and administrative expenses 1,553 790 4,021 2,956Amortization of intangibles 457 157 1,013 544Restructuring, goodwill impairment and asset related charges - net 3,114 143 3,280 595Integration and separation costs 502 121 1,101 349Asbestos-related charge — 1,113 — 1,113Equity in earnings of nonconsolidated affiliates 362 251 764 442Sundry income (expense) - net 729 83 966 1,452Interest expense and amortization of debt discount 354 229 1,082 858
Income (Loss) from continuing operations before income taxes (2,874) (198) 1,193 4,413Provision (Credit) for income taxes on continuing operations (1,715) (282) (476) 9
Income (Loss) from continuing operations, net of tax (1,159) 84 1,669 4,404Loss from discontinued operations, net of tax (57) — (77) —
Net income (loss) (1,216) 84 1,592 4,404Net income attributable to noncontrolling interests 47 32 132 86
Net income (loss) attributable to DowDuPont Inc. (1,263) 52 1,460 4,318Preferred stock dividends — 85 — 340
Net income (loss) available for DowDuPont Inc. common stockholders $ (1,263) $ (33) $ 1,460 $ 3,978
Per common share data:Earnings (Loss) per common share from continuing operations - basic $ (0.52) $ (0.03) $ 0.97 $ 3.57Loss per common share from discontinued operations - basic (0.02) — (0.05) —Earnings (Loss) per common share - basic $ (0.54) $ (0.03) $ 0.92 $ 3.57Earnings (Loss) per common share from continuing operations - diluted $ (0.52) $ (0.03) $ 0.95 $ 3.52Loss per common share from discontinued operations - diluted (0.02) — (0.04) —Earnings (Loss) per common share - diluted $ (0.54) $ (0.03) $ 0.91 $ 3.52
Dividends declared per share of common stock $ 0.38 $ 0.46 $ 1.76 $ 1.84Weighted-average common shares outstanding - basic 2,326.9 1,106.2 1,579.8 1,108.1Weighted-average common shares outstanding - diluted 2,326.9 1,106.2 1,598.1 1,123.2Note: The consolidated statements of income for the three and twelve months ended December 31, 2017 and 2016, reflect the results of Dow for all periods
presented and the results of DuPont for the periods beginning on and after September 1, 2017.
10
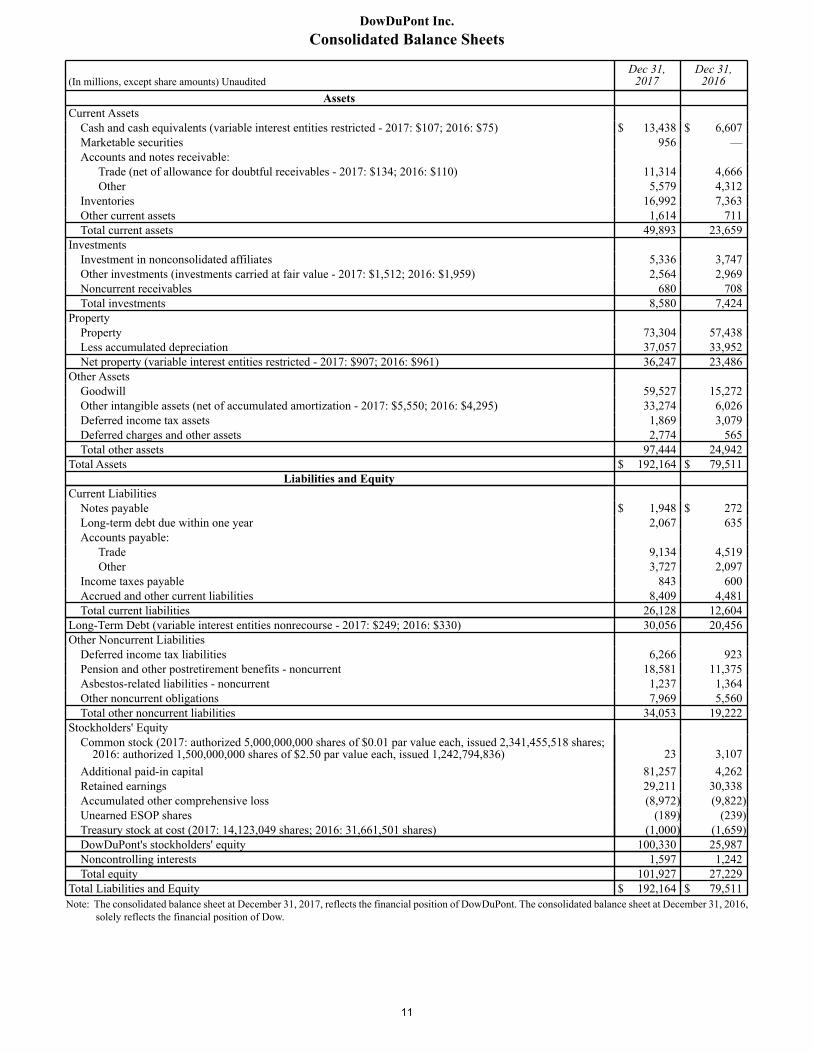
DowDuPont Inc.Consolidated Balance Sheets
(In millions, except share amounts) UnauditedDec 31,
2017Dec 31,
2016Assets
Current AssetsCash and cash equivalents (variable interest entities restricted - 2017: $107; 2016: $75) $ 13,438 $ 6,607Marketable securities 956 —Accounts and notes receivable:
Trade (net of allowance for doubtful receivables - 2017: $134; 2016: $110) 11,314 4,666 Other 5,579 4,312
Inventories 16,992 7,363Other current assets 1,614 711Total current assets 49,893 23,659
InvestmentsInvestment in nonconsolidated affiliates 5,336 3,747Other investments (investments carried at fair value - 2017: $1,512; 2016: $1,959) 2,564 2,969Noncurrent receivables 680 708Total investments 8,580 7,424
PropertyProperty 73,304 57,438Less accumulated depreciation 37,057 33,952Net property (variable interest entities restricted - 2017: $907; 2016: $961) 36,247 23,486
Other AssetsGoodwill 59,527 15,272Other intangible assets (net of accumulated amortization - 2017: $5,550; 2016: $4,295) 33,274 6,026Deferred income tax assets 1,869 3,079Deferred charges and other assets 2,774 565Total other assets 97,444 24,942
Total Assets $ 192,164 $ 79,511Liabilities and Equity
Current LiabilitiesNotes payable $ 1,948 $ 272Long-term debt due within one year 2,067 635Accounts payable:
Trade 9,134 4,519 Other 3,727 2,097
Income taxes payable 843 600Accrued and other current liabilities 8,409 4,481Total current liabilities 26,128 12,604
Long-Term Debt (variable interest entities nonrecourse - 2017: $249; 2016: $330) 30,056 20,456Other Noncurrent Liabilities
Deferred income tax liabilities 6,266 923Pension and other postretirement benefits - noncurrent 18,581 11,375Asbestos-related liabilities - noncurrent 1,237 1,364Other noncurrent obligations 7,969 5,560Total other noncurrent liabilities 34,053 19,222
Stockholders' EquityCommon stock (2017: authorized 5,000,000,000 shares of $0.01 par value each, issued 2,341,455,518 shares;
2016: authorized 1,500,000,000 shares of $2.50 par value each, issued 1,242,794,836) 23 3,107Additional paid-in capital 81,257 4,262Retained earnings 29,211 30,338Accumulated other comprehensive loss (8,972) (9,822)Unearned ESOP shares (189) (239)Treasury stock at cost (2017: 14,123,049 shares; 2016: 31,661,501 shares) (1,000) (1,659)DowDuPont's stockholders' equity 100,330 25,987Noncontrolling interests 1,597 1,242Total equity 101,927 27,229
Total Liabilities and Equity $ 192,164 $ 79,511Note: The consolidated balance sheet at December 31, 2017, reflects the financial position of DowDuPont. The consolidated balance sheet at December 31, 2016,
solely reflects the financial position of Dow.
11
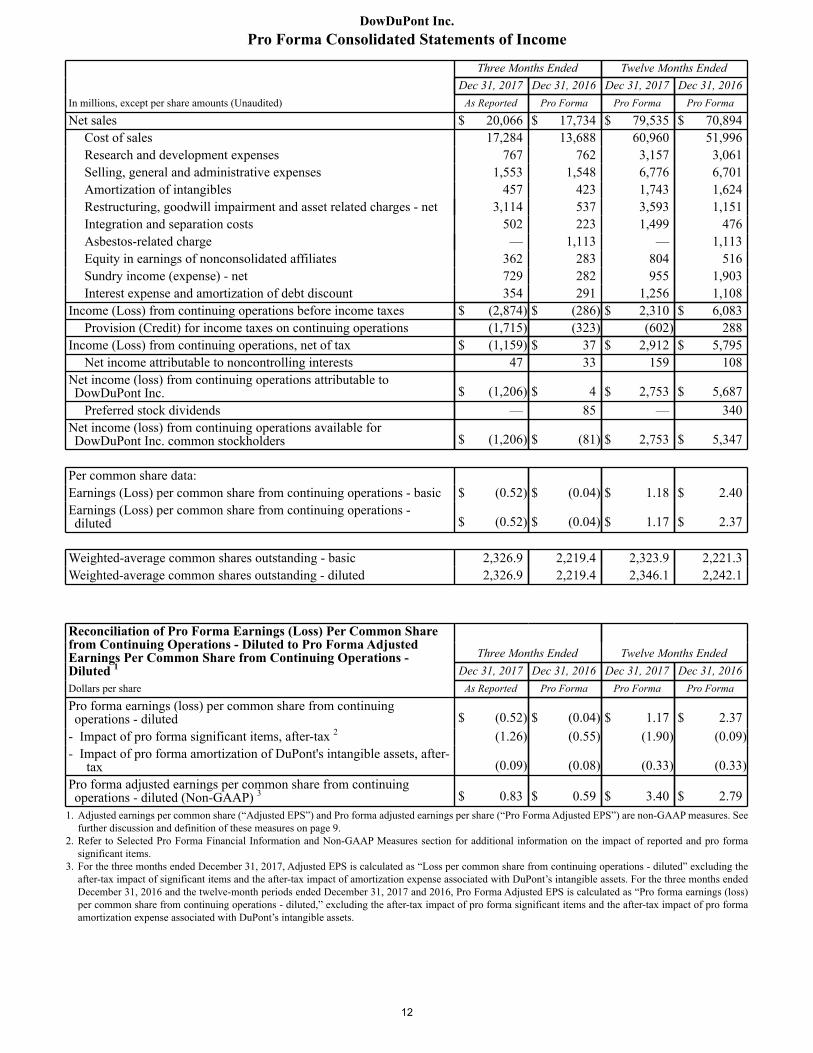
DowDuPont Inc.Pro Forma Consolidated Statements of Income
In millions, except per share amounts (Unaudited)
Three Months Ended Twelve Months EndedDec 31, 2017 Dec 31, 2016 Dec 31, 2017 Dec 31, 2016
As Reported Pro Forma Pro Forma Pro Forma
Net sales $ 20,066 $ 17,734 $ 79,535 $ 70,894Cost of sales 17,284 13,688 60,960 51,996Research and development expenses 767 762 3,157 3,061Selling, general and administrative expenses 1,553 1,548 6,776 6,701Amortization of intangibles 457 423 1,743 1,624Restructuring, goodwill impairment and asset related charges - net 3,114 537 3,593 1,151Integration and separation costs 502 223 1,499 476Asbestos-related charge — 1,113 — 1,113Equity in earnings of nonconsolidated affiliates 362 283 804 516Sundry income (expense) - net 729 282 955 1,903Interest expense and amortization of debt discount 354 291 1,256 1,108
Income (Loss) from continuing operations before income taxes $ (2,874) $ (286) $ 2,310 $ 6,083Provision (Credit) for income taxes on continuing operations (1,715) (323) (602) 288
Income (Loss) from continuing operations, net of tax $ (1,159) $ 37 $ 2,912 $ 5,795Net income attributable to noncontrolling interests 47 33 159 108
Net income (loss) from continuing operations attributable toDowDuPont Inc. $ (1,206) $ 4 $ 2,753 $ 5,687
Preferred stock dividends — 85 — 340Net income (loss) from continuing operations available forDowDuPont Inc. common stockholders $ (1,206) $ (81) $ 2,753 $ 5,347
Per common share data:Earnings (Loss) per common share from continuing operations - basic $ (0.52) $ (0.04) $ 1.18 $ 2.40Earnings (Loss) per common share from continuing operations -diluted $ (0.52) $ (0.04) $ 1.17 $ 2.37
Weighted-average common shares outstanding - basic 2,326.9 2,219.4 2,323.9 2,221.3Weighted-average common shares outstanding - diluted 2,326.9 2,219.4 2,346.1 2,242.1
Reconciliation of Pro Forma Earnings (Loss) Per Common Share from Continuing Operations - Diluted to Pro Forma Adjusted Earnings Per Common Share from Continuing Operations - Diluted 1
Three Months Ended Twelve Months EndedDec 31, 2017 Dec 31, 2016 Dec 31, 2017 Dec 31, 2016
Dollars per share As Reported Pro Forma Pro Forma Pro Forma
Pro forma earnings (loss) per common share from continuingoperations - diluted $ (0.52) $ (0.04) $ 1.17 $ 2.37
- Impact of pro forma significant items, after-tax 2 (1.26) (0.55) (1.90) (0.09)- Impact of pro forma amortization of DuPont's intangible assets, after-
tax (0.09) (0.08) (0.33) (0.33)Pro forma adjusted earnings per common share from continuing operations - diluted (Non-GAAP) 3 $ 0.83 $ 0.59 $ 3.40 $ 2.79
1. Adjusted earnings per common share (“Adjusted EPS”) and Pro forma adjusted earnings per share (“Pro Forma Adjusted EPS”) are non-GAAP measures. See further discussion and definition of these measures on page 9.
2. Refer to Selected Pro Forma Financial Information and Non-GAAP Measures section for additional information on the impact of reported and pro forma significant items.
3. For the three months ended December 31, 2017, Adjusted EPS is calculated as “Loss per common share from continuing operations - diluted” excluding the after-tax impact of significant items and the after-tax impact of amortization expense associated with DuPont’s intangible assets. For the three months ended December 31, 2016 and the twelve-month periods ended December 31, 2017 and 2016, Pro Forma Adjusted EPS is calculated as “Pro forma earnings (loss) per common share from continuing operations - diluted,” excluding the after-tax impact of pro forma significant items and the after-tax impact of pro forma amortization expense associated with DuPont’s intangible assets.
12
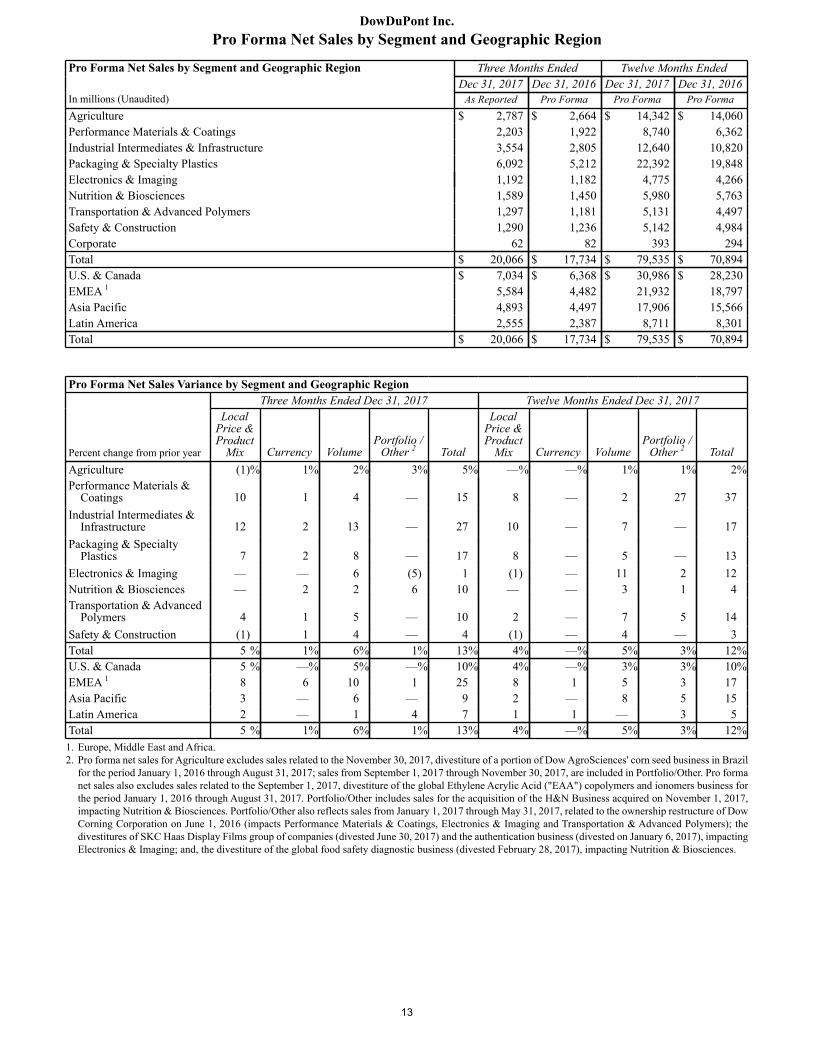
DowDuPont Inc.Pro Forma Net Sales by Segment and Geographic Region
Pro Forma Net Sales by Segment and Geographic Region Three Months Ended Twelve Months Ended
In millions (Unaudited)Dec 31, 2017 Dec 31, 2016 Dec 31, 2017 Dec 31, 2016
As Reported Pro Forma Pro Forma Pro FormaAgriculture $ 2,787 $ 2,664 $ 14,342 $ 14,060Performance Materials & Coatings 2,203 1,922 8,740 6,362Industrial Intermediates & Infrastructure 3,554 2,805 12,640 10,820Packaging & Specialty Plastics 6,092 5,212 22,392 19,848Electronics & Imaging 1,192 1,182 4,775 4,266Nutrition & Biosciences 1,589 1,450 5,980 5,763Transportation & Advanced Polymers 1,297 1,181 5,131 4,497Safety & Construction 1,290 1,236 5,142 4,984Corporate 62 82 393 294Total $ 20,066 $ 17,734 $ 79,535 $ 70,894U.S. & Canada $ 7,034 $ 6,368 $ 30,986 $ 28,230EMEA 1 5,584 4,482 21,932 18,797Asia Pacific 4,893 4,497 17,906 15,566Latin America 2,555 2,387 8,711 8,301Total $ 20,066 $ 17,734 $ 79,535 $ 70,894
Pro Forma Net Sales Variance by Segment and Geographic RegionThree Months Ended Dec 31, 2017 Twelve Months Ended Dec 31, 2017
Percent change from prior year
LocalPrice &Product
Mix Currency VolumePortfolio /
Other 2 Total
LocalPrice &Product
Mix Currency VolumePortfolio /
Other 2 TotalAgriculture (1)% 1% 2% 3% 5% —% —% 1% 1% 2%Performance Materials &
Coatings 10 1 4 — 15 8 — 2 27 37Industrial Intermediates &
Infrastructure 12 2 13 — 27 10 — 7 — 17Packaging & Specialty
Plastics 7 2 8 — 17 8 — 5 — 13Electronics & Imaging — — 6 (5) 1 (1) — 11 2 12Nutrition & Biosciences — 2 2 6 10 — — 3 1 4Transportation & Advanced
Polymers 4 1 5 — 10 2 — 7 5 14Safety & Construction (1) 1 4 — 4 (1) — 4 — 3Total 5 % 1% 6% 1% 13% 4% —% 5% 3% 12%U.S. & Canada 5 % —% 5% —% 10% 4% —% 3% 3% 10%EMEA 1 8 6 10 1 25 8 1 5 3 17Asia Pacific 3 — 6 — 9 2 — 8 5 15Latin America 2 — 1 4 7 1 1 — 3 5Total 5 % 1% 6% 1% 13% 4% —% 5% 3% 12%1. Europe, Middle East and Africa.2. Pro forma net sales for Agriculture excludes sales related to the November 30, 2017, divestiture of a portion of Dow AgroSciences' corn seed business in Brazil
for the period January 1, 2016 through August 31, 2017; sales from September 1, 2017 through November 30, 2017, are included in Portfolio/Other. Pro forma net sales also excludes sales related to the September 1, 2017, divestiture of the global Ethylene Acrylic Acid ("EAA") copolymers and ionomers business for the period January 1, 2016 through August 31, 2017. Portfolio/Other includes sales for the acquisition of the H&N Business acquired on November 1, 2017, impacting Nutrition & Biosciences. Portfolio/Other also reflects sales from January 1, 2017 through May 31, 2017, related to the ownership restructure of Dow Corning Corporation on June 1, 2016 (impacts Performance Materials & Coatings, Electronics & Imaging and Transportation & Advanced Polymers); the divestitures of SKC Haas Display Films group of companies (divested June 30, 2017) and the authentication business (divested on January 6, 2017), impacting Electronics & Imaging; and, the divestiture of the global food safety diagnostic business (divested February 28, 2017), impacting Nutrition & Biosciences.
13
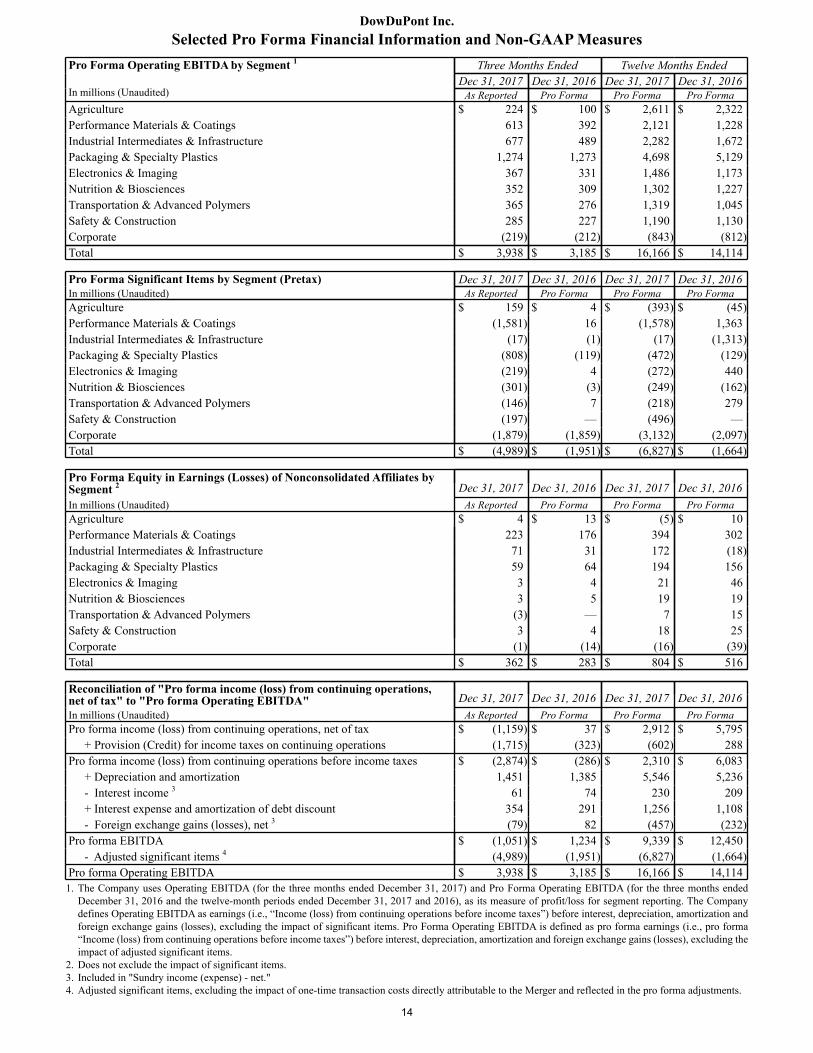
DowDuPont Inc.Selected Pro Forma Financial Information and Non-GAAP Measures
Pro Forma Operating EBITDA by Segment 1 Three Months Ended Twelve Months Ended
In millions (Unaudited)Dec 31, 2017 Dec 31, 2016 Dec 31, 2017 Dec 31, 2016
As Reported Pro Forma Pro Forma Pro FormaAgriculture $ 224 $ 100 $ 2,611 $ 2,322Performance Materials & Coatings 613 392 2,121 1,228Industrial Intermediates & Infrastructure 677 489 2,282 1,672Packaging & Specialty Plastics 1,274 1,273 4,698 5,129Electronics & Imaging 367 331 1,486 1,173Nutrition & Biosciences 352 309 1,302 1,227Transportation & Advanced Polymers 365 276 1,319 1,045Safety & Construction 285 227 1,190 1,130Corporate (219) (212) (843) (812)Total $ 3,938 $ 3,185 $ 16,166 $ 14,114
Pro Forma Significant Items by Segment (Pretax) Dec 31, 2017 Dec 31, 2016 Dec 31, 2017 Dec 31, 2016In millions (Unaudited) As Reported Pro Forma Pro Forma Pro FormaAgriculture $ 159 $ 4 $ (393) $ (45)Performance Materials & Coatings (1,581) 16 (1,578) 1,363Industrial Intermediates & Infrastructure (17) (1) (17) (1,313)Packaging & Specialty Plastics (808) (119) (472) (129)Electronics & Imaging (219) 4 (272) 440Nutrition & Biosciences (301) (3) (249) (162)Transportation & Advanced Polymers (146) 7 (218) 279Safety & Construction (197) — (496) —Corporate (1,879) (1,859) (3,132) (2,097)Total $ (4,989) $ (1,951) $ (6,827) $ (1,664)
Pro Forma Equity in Earnings (Losses) of Nonconsolidated Affiliates by Segment 2 Dec 31, 2017 Dec 31, 2016 Dec 31, 2017 Dec 31, 2016In millions (Unaudited) As Reported Pro Forma Pro Forma Pro FormaAgriculture $ 4 $ 13 $ (5) $ 10Performance Materials & Coatings 223 176 394 302Industrial Intermediates & Infrastructure 71 31 172 (18)Packaging & Specialty Plastics 59 64 194 156Electronics & Imaging 3 4 21 46Nutrition & Biosciences 3 5 19 19Transportation & Advanced Polymers (3) — 7 15Safety & Construction 3 4 18 25Corporate (1) (14) (16) (39)Total $ 362 $ 283 $ 804 $ 516
Reconciliation of "Pro forma income (loss) from continuing operations,net of tax" to "Pro forma Operating EBITDA" Dec 31, 2017 Dec 31, 2016 Dec 31, 2017 Dec 31, 2016In millions (Unaudited) As Reported Pro Forma Pro Forma Pro FormaPro forma income (loss) from continuing operations, net of tax $ (1,159) $ 37 $ 2,912 $ 5,795
+ Provision (Credit) for income taxes on continuing operations (1,715) (323) (602) 288Pro forma income (loss) from continuing operations before income taxes $ (2,874) $ (286) $ 2,310 $ 6,083
+ Depreciation and amortization 1,451 1,385 5,546 5,236- Interest income 3 61 74 230 209+ Interest expense and amortization of debt discount 354 291 1,256 1,108- Foreign exchange gains (losses), net 3 (79) 82 (457) (232)
Pro forma EBITDA $ (1,051) $ 1,234 $ 9,339 $ 12,450- Adjusted significant items 4 (4,989) (1,951) (6,827) (1,664)
Pro forma Operating EBITDA $ 3,938 $ 3,185 $ 16,166 $ 14,1141. The Company uses Operating EBITDA (for the three months ended December 31, 2017) and Pro Forma Operating EBITDA (for the three months ended
December 31, 2016 and the twelve-month periods ended December 31, 2017 and 2016), as its measure of profit/loss for segment reporting. The Company defines Operating EBITDA as earnings (i.e., “Income (loss) from continuing operations before income taxes”) before interest, depreciation, amortization and foreign exchange gains (losses), excluding the impact of significant items. Pro Forma Operating EBITDA is defined as pro forma earnings (i.e., pro forma “Income (loss) from continuing operations before income taxes”) before interest, depreciation, amortization and foreign exchange gains (losses), excluding the impact of adjusted significant items.
2. Does not exclude the impact of significant items.3. Included in "Sundry income (expense) - net."4. Adjusted significant items, excluding the impact of one-time transaction costs directly attributable to the Merger and reflected in the pro forma adjustments.
14
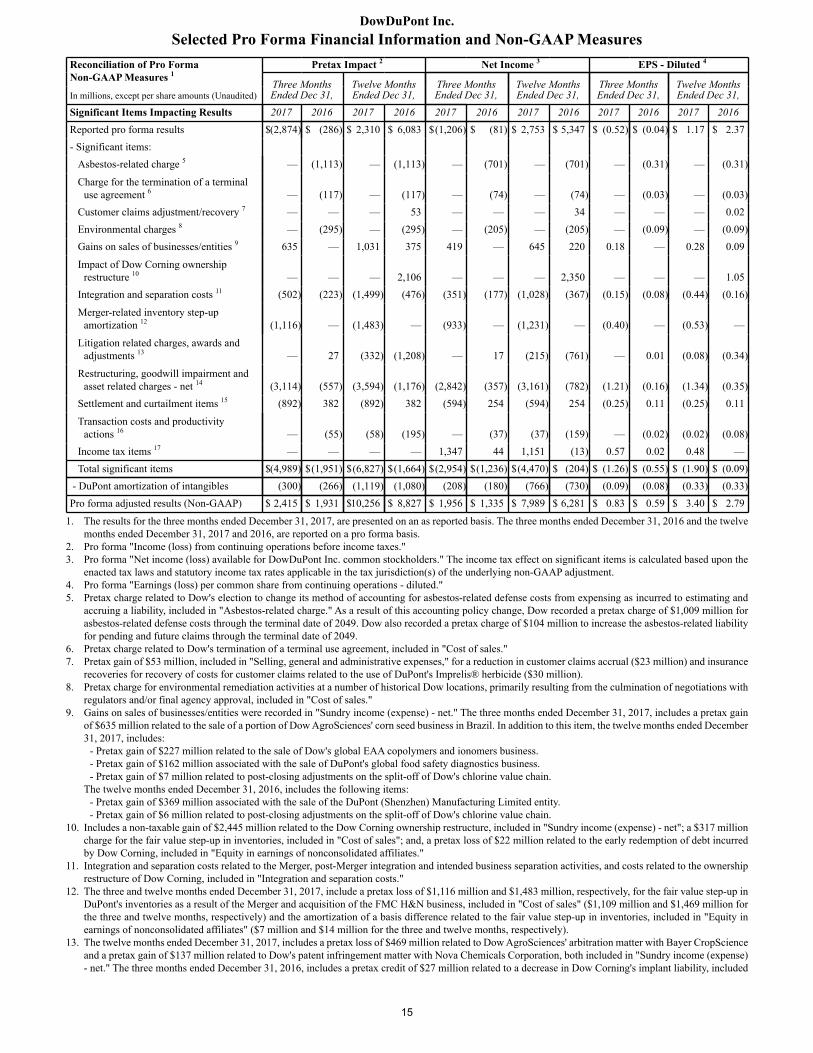
DowDuPont Inc.Selected Pro Forma Financial Information and Non-GAAP Measures
Reconciliation of Pro Forma Non-GAAP Measures 1
Pretax Impact 2 Net Income 3 EPS - Diluted 4
Three MonthsEnded Dec 31,
Twelve MonthsEnded Dec 31,
Three MonthsEnded Dec 31,
Twelve MonthsEnded Dec 31,
Three MonthsEnded Dec 31,
Twelve MonthsEnded Dec 31,In millions, except per share amounts (Unaudited)
Significant Items Impacting Results 2017 2016 2017 2016 2017 2016 2017 2016 2017 2016 2017 2016Reported pro forma results $(2,874) $ (286) $ 2,310 $ 6,083 $(1,206) $ (81) $ 2,753 $ 5,347 $ (0.52) $ (0.04) $ 1.17 $ 2.37- Significant items:
Asbestos-related charge 5 — (1,113) — (1,113) — (701) — (701) — (0.31) — (0.31)
Charge for the termination of a terminal use agreement 6 — (117) — (117) — (74) — (74) — (0.03) — (0.03)
Customer claims adjustment/recovery 7 — — — 53 — — — 34 — — — 0.02Environmental charges 8 — (295) — (295) — (205) — (205) — (0.09) — (0.09)Gains on sales of businesses/entities 9 635 — 1,031 375 419 — 645 220 0.18 — 0.28 0.09
Impact of Dow Corning ownership restructure 10 — — — 2,106 — — — 2,350 — — — 1.05
Integration and separation costs 11 (502) (223) (1,499) (476) (351) (177) (1,028) (367) (0.15) (0.08) (0.44) (0.16)
Merger-related inventory step-up amortization 12 (1,116) — (1,483) — (933) — (1,231) — (0.40) — (0.53) —
Litigation related charges, awards and adjustments 13 — 27 (332) (1,208) — 17 (215) (761) — 0.01 (0.08) (0.34)
Restructuring, goodwill impairment and asset related charges - net 14 (3,114) (557) (3,594) (1,176) (2,842) (357) (3,161) (782) (1.21) (0.16) (1.34) (0.35)
Settlement and curtailment items 15 (892) 382 (892) 382 (594) 254 (594) 254 (0.25) 0.11 (0.25) 0.11
Transaction costs and productivity actions 16 — (55) (58) (195) — (37) (37) (159) — (0.02) (0.02) (0.08)
Income tax items 17 — — — — 1,347 44 1,151 (13) 0.57 0.02 0.48 —Total significant items $(4,989) $(1,951) $(6,827) $(1,664) $(2,954) $(1,236) $(4,470) $ (204) $ (1.26) $ (0.55) $ (1.90) $ (0.09)
- DuPont amortization of intangibles (300) (266) (1,119) (1,080) (208) (180) (766) (730) (0.09) (0.08) (0.33) (0.33)Pro forma adjusted results (Non-GAAP) $ 2,415 $ 1,931 $10,256 $ 8,827 $ 1,956 $ 1,335 $ 7,989 $ 6,281 $ 0.83 $ 0.59 $ 3.40 $ 2.79
1. The results for the three months ended December 31, 2017, are presented on an as reported basis. The three months ended December 31, 2016 and the twelve months ended December 31, 2017 and 2016, are reported on a pro forma basis.
2. Pro forma "Income (loss) from continuing operations before income taxes."3. Pro forma "Net income (loss) available for DowDuPont Inc. common stockholders." The income tax effect on significant items is calculated based upon the
enacted tax laws and statutory income tax rates applicable in the tax jurisdiction(s) of the underlying non-GAAP adjustment.4. Pro forma "Earnings (loss) per common share from continuing operations - diluted."5. Pretax charge related to Dow's election to change its method of accounting for asbestos-related defense costs from expensing as incurred to estimating and
accruing a liability, included in "Asbestos-related charge." As a result of this accounting policy change, Dow recorded a pretax charge of $1,009 million for asbestos-related defense costs through the terminal date of 2049. Dow also recorded a pretax charge of $104 million to increase the asbestos-related liability for pending and future claims through the terminal date of 2049.
6. Pretax charge related to Dow's termination of a terminal use agreement, included in "Cost of sales."7. Pretax gain of $53 million, included in "Selling, general and administrative expenses," for a reduction in customer claims accrual ($23 million) and insurance
recoveries for recovery of costs for customer claims related to the use of DuPont's Imprelis® herbicide ($30 million).8. Pretax charge for environmental remediation activities at a number of historical Dow locations, primarily resulting from the culmination of negotiations with
regulators and/or final agency approval, included in "Cost of sales."9. Gains on sales of businesses/entities were recorded in "Sundry income (expense) - net." The three months ended December 31, 2017, includes a pretax gain
of $635 million related to the sale of a portion of Dow AgroSciences' corn seed business in Brazil. In addition to this item, the twelve months ended December 31, 2017, includes:
- Pretax gain of $227 million related to the sale of Dow's global EAA copolymers and ionomers business.- Pretax gain of $162 million associated with the sale of DuPont's global food safety diagnostics business.- Pretax gain of $7 million related to post-closing adjustments on the split-off of Dow's chlorine value chain.
The twelve months ended December 31, 2016, includes the following items:- Pretax gain of $369 million associated with the sale of the DuPont (Shenzhen) Manufacturing Limited entity. - Pretax gain of $6 million related to post-closing adjustments on the split-off of Dow's chlorine value chain.
10. Includes a non-taxable gain of $2,445 million related to the Dow Corning ownership restructure, included in "Sundry income (expense) - net"; a $317 million charge for the fair value step-up in inventories, included in "Cost of sales"; and, a pretax loss of $22 million related to the early redemption of debt incurred by Dow Corning, included in "Equity in earnings of nonconsolidated affiliates."
11. Integration and separation costs related to the Merger, post-Merger integration and intended business separation activities, and costs related to the ownership restructure of Dow Corning, included in "Integration and separation costs."
12. The three and twelve months ended December 31, 2017, include a pretax loss of $1,116 million and $1,483 million, respectively, for the fair value step-up in DuPont's inventories as a result of the Merger and acquisition of the FMC H&N business, included in "Cost of sales" ($1,109 million and $1,469 million for the three and twelve months, respectively) and the amortization of a basis difference related to the fair value step-up in inventories, included in "Equity in earnings of nonconsolidated affiliates" ($7 million and $14 million for the three and twelve months, respectively).
13. The twelve months ended December 31, 2017, includes a pretax loss of $469 million related to Dow AgroSciences' arbitration matter with Bayer CropScience and a pretax gain of $137 million related to Dow's patent infringement matter with Nova Chemicals Corporation, both included in "Sundry income (expense) - net." The three months ended December 31, 2016, includes a pretax credit of $27 million related to a decrease in Dow Corning's implant liability, included
15
DowDuPont Inc.Selected Pro Forma Financial Information and Non-GAAP Measures
in "Sundry income (expense) - net." In addition to this item, the twelve months ended December 31, 2016, includes a pretax loss of $1,235 million related to Dow's settlement of the urethane matters class action lawsuit and the opt-out cases litigation, included in "Sundry income (expense) - net."
14. The three and twelve months ended December 31, 2017, include the following pretax impacts recorded in “Restructuring, goodwill impairment and asset related charges, net”:
- Impairment charge of $1,491 million related to goodwill associated with the Coatings & Performance Monomers reporting unit; and an impairment charge of $939 million related to Dow manufacturing assets and facilities and an equity method investment.
- Restructuring charges of $695 million and $875 million during the three and twelve months, respectively, related to the DowDuPont Cost Synergy Program (including the following charges for the three and twelve months, respectively: $331 million and $500 million of severance and related benefit costs, $290 million and $301 million of asset write-downs and write-offs, and $74 million for contract termination costs).
- Restructuring charge of $312 million during the twelve months consisting of severance charges of $33 million and asset-related charges of $279 million, primarily associated with actions to improve DuPont plant productivity.
- Gain of $11 million and $23 million for the three and twelve months, respectively, related to adjustments to prior years’ restructuring programs.The three and twelve months ended December 31, 2016, include the following pretax impacts recorded in “Restructuring, goodwill impairment and asset related charges, net” unless specifically addressed below:
- Impairment charge of $435 million related to the write-down of DuPont's uncompleted enterprise resource planning system.- Charge related to AgroFresh, including a partial impairment charge of $143 million of Dow’s investment in AgroFresh Solutions Inc. and post-closing
adjustments of $20 million related to non-cash consideration (included in "Sundry income (expense) - net").- Net gains of $34 million and $102 million during the three and twelve months, respectively, related to adjustments to DuPont’s 2016 and 2014 restructuring
programs. The charge in the twelve months includes $3 million recorded in "Sundry income (expense) - net."- Gain of $7 million and net charge of $68 million during the three and twelve months, respectively, related to the decision to not re-start the insecticide
manufacturing facility at the DuPont site in La Porte, Texas. - Charge of $449 million during the twelve months for a restructuring plan that incorporated actions related to the ownership restructure of Dow Corning.- Asset impairment charge of $158 million during the twelve months related to DuPont’s indefinite lived intangible assets. - Charge of $5 million during the twelve months related to adjustments to Dow’s 2015 restructuring program.
15. The three and twelve months ended December 31, 2017, include a pretax settlement charge of $892 million related to the payment of plan obligations to certain participants of a Dow U.S. non-qualified pension plan as a result of the Merger, included in "Cost of sales" ($888 million) and "Selling, general and administrative expenses" ($4 million). The three and twelve months ended December 31, 2016, include a pretax gain of $382 million related to changes to DuPont's U.S. pension plan and U.S. other postretirement benefits plan, included in "Cost of sales" ($172 million), "Selling, general and administrative expenses" ($153 million) and "Research and development expenses" ($57 million).
16. Includes implementation costs associated with Dow's restructuring programs and other productivity actions, recorded in:- "Cost of sales" ($39 million in the three months ended December 31, 2016; $49 million and $123 million in the twelve months ended December 31, 2017
and 2016, respectively).- "Selling, general and administrative expenses" ($8 million in the three months ended December 31, 2016; $9 million and $31 million in the twelve months
ended December 31, 2017 and 2016, respectively).- "Sundry income (expense) - net" ($8 million and $41 million in the three and twelve months ended December 31, 2016, respectively).
17. Income tax items were recorded in "Provision (Credit) for income taxes on continuing operations." The three months ended December 31, 2017, includes a net tax benefit of $1,086 million related to the recognition of the effects of new U.S. tax legislation, as well as a net tax benefit of $261 million related to an internal legal entity restructuring associated with the intended business separations. In addition to this item, the twelve months ended December 31, 2017, includes:
- Tax charge of $267 million related to changes in tax attributes resulting from the Merger, including a reduction in a deferred tax asset in Germany and the recognition of deferred tax gains in the United States.
- Tax benefit of $100 million related to a reduction in DuPont's unrecognized tax benefits, and reversal of associated interest, due to the closure of various tax statutes of limitations.
- Tax charge of $29 million related to the elimination of a tax benefit resulting from DuPont's second quarter 2017 principal U.S. pension plan contribution.The three and twelve months ended December 31, 2016, include a tax benefit of $44 million and a tax charge of $57 million, respectively, for the settlement of an uncertain tax position associated with a historical change in the legal ownership structure of a Dow nonconsolidated affiliate.
®™ Trademark of The Dow Chemical Company ("Dow") or E. I. du Pont de Nemours and Company ("DuPont") or affiliated companies of Dow or DuPont.
16
DowDuPont Inc.Selected Pro Forma Financial Information and Non-GAAP Measures
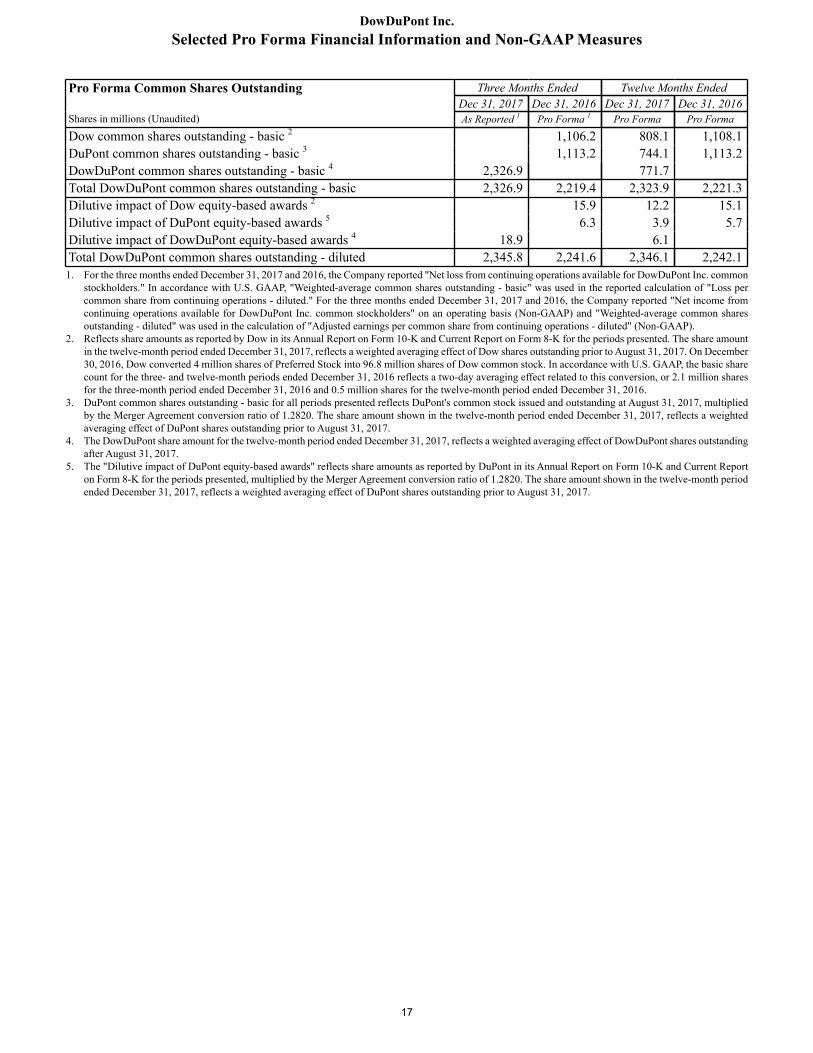
Pro Forma Common Shares Outstanding Three Months Ended Twelve Months Ended
Shares in millions (Unaudited)Dec 31, 2017 Dec 31, 2016 Dec 31, 2017 Dec 31, 2016As Reported 1 Pro Forma 1 Pro Forma Pro Forma
Dow common shares outstanding - basic 2 1,106.2 808.1 1,108.1DuPont common shares outstanding - basic 3 1,113.2 744.1 1,113.2DowDuPont common shares outstanding - basic 4 2,326.9 771.7Total DowDuPont common shares outstanding - basic 2,326.9 2,219.4 2,323.9 2,221.3Dilutive impact of Dow equity-based awards 2 15.9 12.2 15.1Dilutive impact of DuPont equity-based awards 5 6.3 3.9 5.7Dilutive impact of DowDuPont equity-based awards 4 18.9 6.1Total DowDuPont common shares outstanding - diluted 2,345.8 2,241.6 2,346.1 2,242.11. For the three months ended December 31, 2017 and 2016, the Company reported "Net loss from continuing operations available for DowDuPont Inc. common
stockholders." In accordance with U.S. GAAP, "Weighted-average common shares outstanding - basic" was used in the reported calculation of "Loss per common share from continuing operations - diluted." For the three months ended December 31, 2017 and 2016, the Company reported "Net income from continuing operations available for DowDuPont Inc. common stockholders" on an operating basis (Non-GAAP) and "Weighted-average common shares outstanding - diluted" was used in the calculation of "Adjusted earnings per common share from continuing operations - diluted" (Non-GAAP).
2. Reflects share amounts as reported by Dow in its Annual Report on Form 10-K and Current Report on Form 8-K for the periods presented. The share amount in the twelve-month period ended December 31, 2017, reflects a weighted averaging effect of Dow shares outstanding prior to August 31, 2017. On December 30, 2016, Dow converted 4 million shares of Preferred Stock into 96.8 million shares of Dow common stock. In accordance with U.S. GAAP, the basic share count for the three- and twelve-month periods ended December 31, 2016 reflects a two-day averaging effect related to this conversion, or 2.1 million shares for the three-month period ended December 31, 2016 and 0.5 million shares for the twelve-month period ended December 31, 2016.
3. DuPont common shares outstanding - basic for all periods presented reflects DuPont's common stock issued and outstanding at August 31, 2017, multiplied by the Merger Agreement conversion ratio of 1.2820. The share amount shown in the twelve-month period ended December 31, 2017, reflects a weighted averaging effect of DuPont shares outstanding prior to August 31, 2017.
4. The DowDuPont share amount for the twelve-month period ended December 31, 2017, reflects a weighted averaging effect of DowDuPont shares outstanding after August 31, 2017.
5. The "Dilutive impact of DuPont equity-based awards" reflects share amounts as reported by DuPont in its Annual Report on Form 10-K and Current Report on Form 8-K for the periods presented, multiplied by the Merger Agreement conversion ratio of 1.2820. The share amount shown in the twelve-month period ended December 31, 2017, reflects a weighted averaging effect of DuPont shares outstanding prior to August 31, 2017.
17
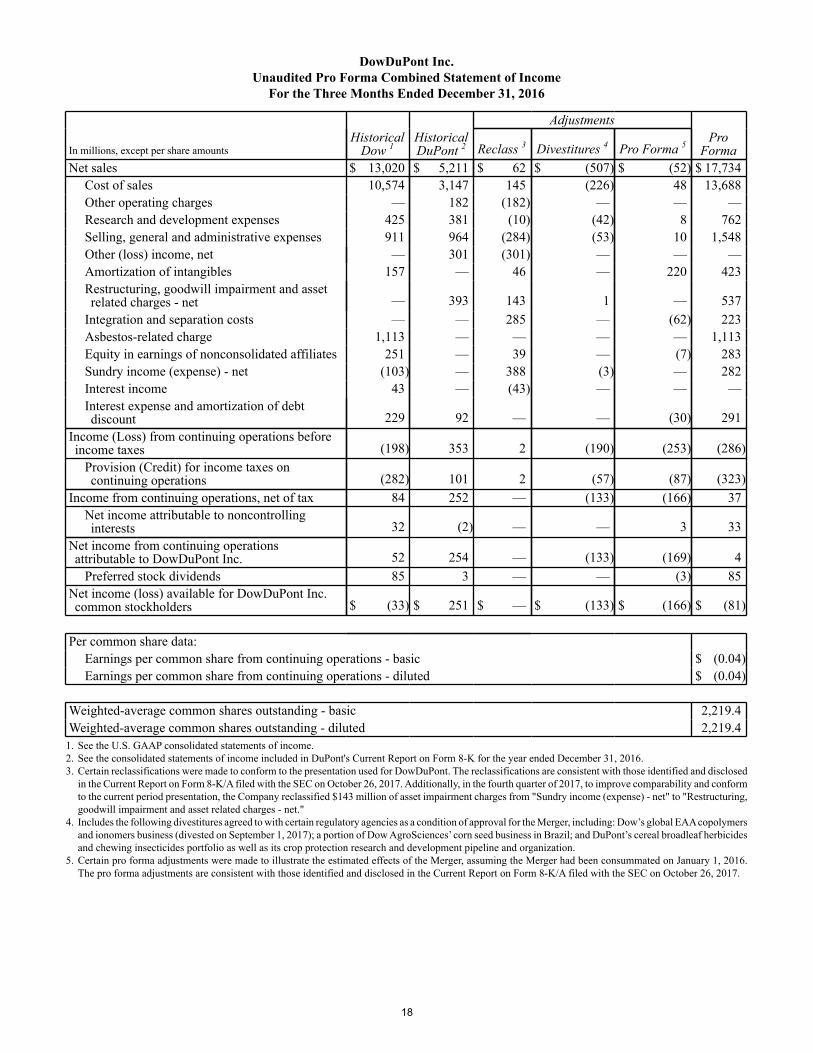
DowDuPont Inc.Unaudited Pro Forma Combined Statement of Income
For the Three Months Ended December 31, 2016
Adjustments
In millions, except per share amountsHistorical
Dow 1Historical DuPont 2 Reclass 3 Divestitures 4 Pro Forma 5
ProForma
Net sales $ 13,020 $ 5,211 $ 62 $ (507) $ (52) $ 17,734Cost of sales 10,574 3,147 145 (226) 48 13,688Other operating charges — 182 (182) — — —Research and development expenses 425 381 (10) (42) 8 762Selling, general and administrative expenses 911 964 (284) (53) 10 1,548Other (loss) income, net — 301 (301) — — —Amortization of intangibles 157 — 46 — 220 423Restructuring, goodwill impairment and assetrelated charges - net — 393 143 1 — 537
Integration and separation costs — — 285 — (62) 223Asbestos-related charge 1,113 — — — — 1,113Equity in earnings of nonconsolidated affiliates 251 — 39 — (7) 283Sundry income (expense) - net (103) — 388 (3) — 282Interest income 43 — (43) — — —Interest expense and amortization of debtdiscount 229 92 — — (30) 291
Income (Loss) from continuing operations beforeincome taxes (198) 353 2 (190) (253) (286)
Provision (Credit) for income taxes oncontinuing operations (282) 101 2 (57) (87) (323)
Income from continuing operations, net of tax 84 252 — (133) (166) 37Net income attributable to noncontrollinginterests 32 (2) — — 3 33
Net income from continuing operationsattributable to DowDuPont Inc. 52 254 — (133) (169) 4
Preferred stock dividends 85 3 — — (3) 85Net income (loss) available for DowDuPont Inc.common stockholders $ (33) $ 251 $ — $ (133) $ (166) $ (81)
Per common share data:Earnings per common share from continuing operations - basic $ (0.04)Earnings per common share from continuing operations - diluted $ (0.04)
Weighted-average common shares outstanding - basic 2,219.4Weighted-average common shares outstanding - diluted 2,219.4
1. See the U.S. GAAP consolidated statements of income.2. See the consolidated statements of income included in DuPont's Current Report on Form 8-K for the year ended December 31, 2016.3. Certain reclassifications were made to conform to the presentation used for DowDuPont. The reclassifications are consistent with those identified and disclosed
in the Current Report on Form 8-K/A filed with the SEC on October 26, 2017. Additionally, in the fourth quarter of 2017, to improve comparability and conform to the current period presentation, the Company reclassified $143 million of asset impairment charges from "Sundry income (expense) - net" to "Restructuring, goodwill impairment and asset related charges - net."
4. Includes the following divestitures agreed to with certain regulatory agencies as a condition of approval for the Merger, including: Dow’s global EAA copolymers and ionomers business (divested on September 1, 2017); a portion of Dow AgroSciences’ corn seed business in Brazil; and DuPont’s cereal broadleaf herbicides and chewing insecticides portfolio as well as its crop protection research and development pipeline and organization.
5. Certain pro forma adjustments were made to illustrate the estimated effects of the Merger, assuming the Merger had been consummated on January 1, 2016. The pro forma adjustments are consistent with those identified and disclosed in the Current Report on Form 8-K/A filed with the SEC on October 26, 2017.
18
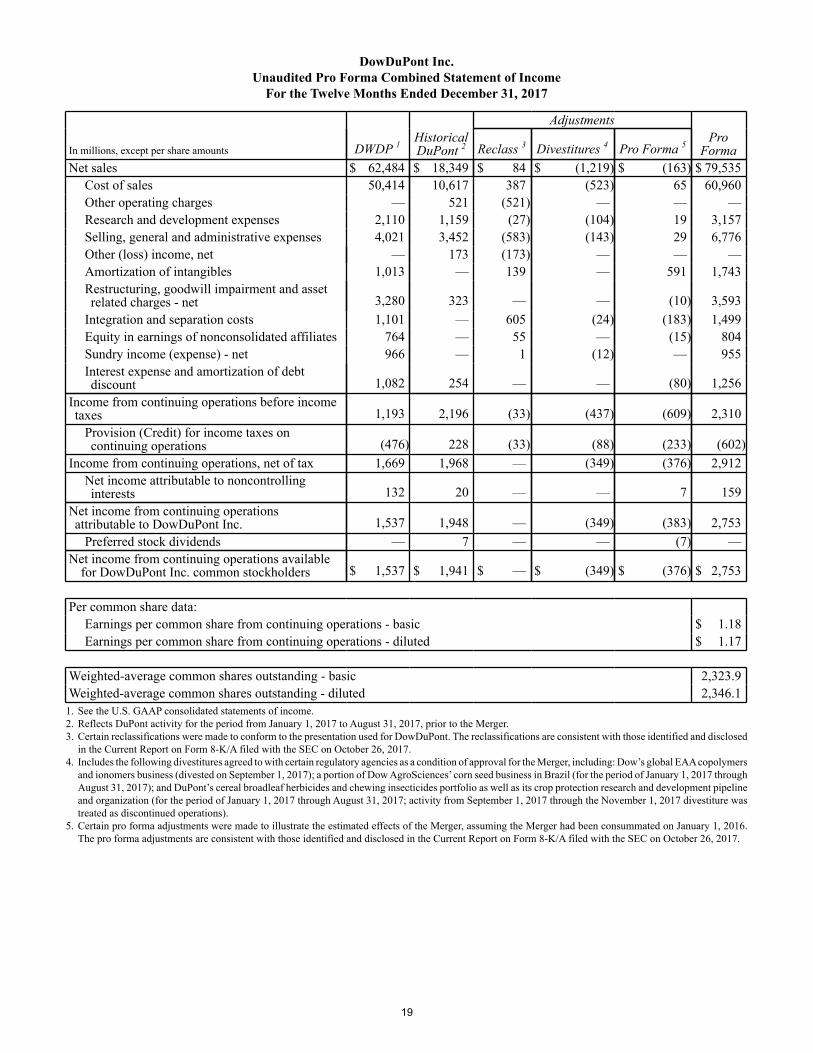
DowDuPont Inc.Unaudited Pro Forma Combined Statement of Income
For the Twelve Months Ended December 31, 2017
Adjustments
In millions, except per share amounts DWDP 1Historical DuPont 2 Reclass 3 Divestitures 4 Pro Forma 5
ProForma
Net sales $ 62,484 $ 18,349 $ 84 $ (1,219) $ (163) $ 79,535Cost of sales 50,414 10,617 387 (523) 65 60,960Other operating charges — 521 (521) — — —Research and development expenses 2,110 1,159 (27) (104) 19 3,157Selling, general and administrative expenses 4,021 3,452 (583) (143) 29 6,776Other (loss) income, net — 173 (173) — — —Amortization of intangibles 1,013 — 139 — 591 1,743Restructuring, goodwill impairment and assetrelated charges - net 3,280 323 — — (10) 3,593
Integration and separation costs 1,101 — 605 (24) (183) 1,499Equity in earnings of nonconsolidated affiliates 764 — 55 — (15) 804Sundry income (expense) - net 966 — 1 (12) — 955Interest expense and amortization of debtdiscount 1,082 254 — — (80) 1,256
Income from continuing operations before incometaxes 1,193 2,196 (33) (437) (609) 2,310
Provision (Credit) for income taxes oncontinuing operations (476) 228 (33) (88) (233) (602)
Income from continuing operations, net of tax 1,669 1,968 — (349) (376) 2,912Net income attributable to noncontrollinginterests 132 20 — — 7 159
Net income from continuing operationsattributable to DowDuPont Inc. 1,537 1,948 — (349) (383) 2,753
Preferred stock dividends — 7 — — (7) —Net income from continuing operations available
for DowDuPont Inc. common stockholders $ 1,537 $ 1,941 $ — $ (349) $ (376) $ 2,753
Per common share data:Earnings per common share from continuing operations - basic $ 1.18Earnings per common share from continuing operations - diluted $ 1.17
Weighted-average common shares outstanding - basic 2,323.9Weighted-average common shares outstanding - diluted 2,346.1
1. See the U.S. GAAP consolidated statements of income.2. Reflects DuPont activity for the period from January 1, 2017 to August 31, 2017, prior to the Merger.3. Certain reclassifications were made to conform to the presentation used for DowDuPont. The reclassifications are consistent with those identified and disclosed
in the Current Report on Form 8-K/A filed with the SEC on October 26, 2017.4. Includes the following divestitures agreed to with certain regulatory agencies as a condition of approval for the Merger, including: Dow’s global EAA copolymers
and ionomers business (divested on September 1, 2017); a portion of Dow AgroSciences’ corn seed business in Brazil (for the period of January 1, 2017 through August 31, 2017); and DuPont’s cereal broadleaf herbicides and chewing insecticides portfolio as well as its crop protection research and development pipeline and organization (for the period of January 1, 2017 through August 31, 2017; activity from September 1, 2017 through the November 1, 2017 divestiture was treated as discontinued operations).
5. Certain pro forma adjustments were made to illustrate the estimated effects of the Merger, assuming the Merger had been consummated on January 1, 2016. The pro forma adjustments are consistent with those identified and disclosed in the Current Report on Form 8-K/A filed with the SEC on October 26, 2017.
19
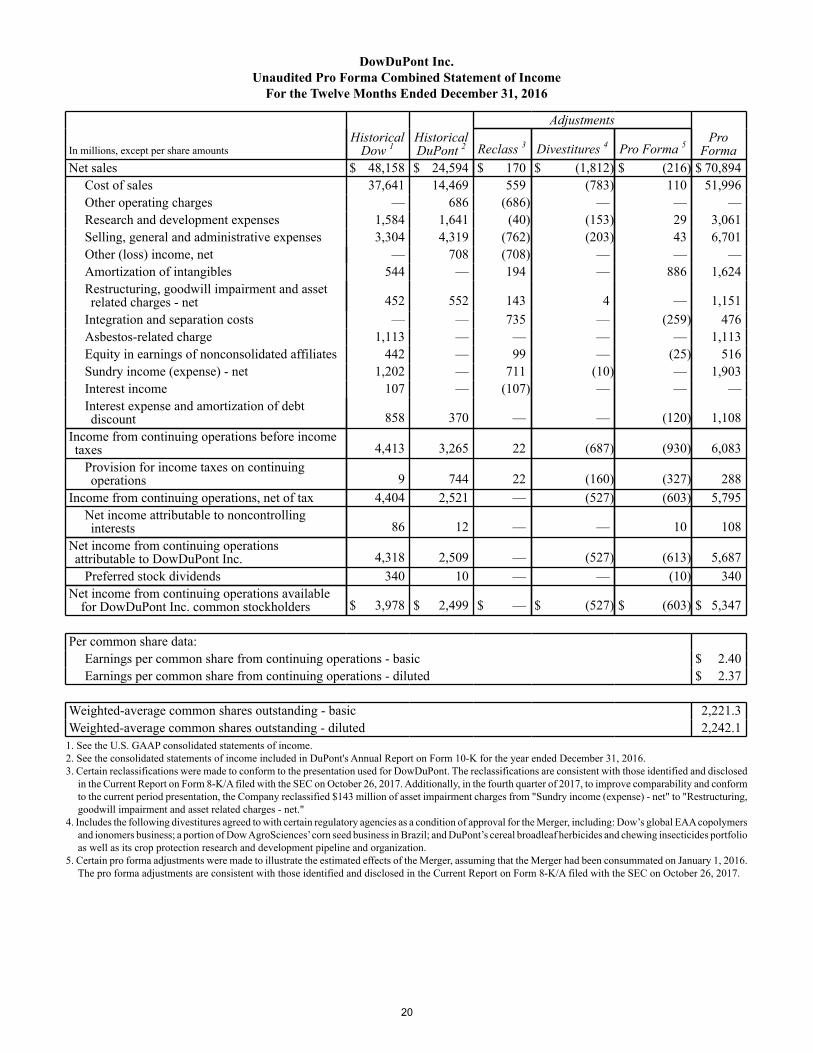
DowDuPont Inc.Unaudited Pro Forma Combined Statement of Income
For the Twelve Months Ended December 31, 2016
Adjustments
In millions, except per share amountsHistorical
Dow 1Historical DuPont 2 Reclass 3 Divestitures 4 Pro Forma 5
ProForma
Net sales $ 48,158 $ 24,594 $ 170 $ (1,812) $ (216) $ 70,894Cost of sales 37,641 14,469 559 (783) 110 51,996Other operating charges — 686 (686) — — —Research and development expenses 1,584 1,641 (40) (153) 29 3,061Selling, general and administrative expenses 3,304 4,319 (762) (203) 43 6,701Other (loss) income, net — 708 (708) — — —Amortization of intangibles 544 — 194 — 886 1,624Restructuring, goodwill impairment and assetrelated charges - net 452 552 143 4 — 1,151
Integration and separation costs — — 735 — (259) 476Asbestos-related charge 1,113 — — — — 1,113Equity in earnings of nonconsolidated affiliates 442 — 99 — (25) 516Sundry income (expense) - net 1,202 — 711 (10) — 1,903Interest income 107 — (107) — — —Interest expense and amortization of debtdiscount 858 370 — — (120) 1,108
Income from continuing operations before incometaxes 4,413 3,265 22 (687) (930) 6,083
Provision for income taxes on continuingoperations 9 744 22 (160) (327) 288
Income from continuing operations, net of tax 4,404 2,521 — (527) (603) 5,795Net income attributable to noncontrollinginterests 86 12 — — 10 108
Net income from continuing operationsattributable to DowDuPont Inc. 4,318 2,509 — (527) (613) 5,687
Preferred stock dividends 340 10 — — (10) 340Net income from continuing operations available
for DowDuPont Inc. common stockholders $ 3,978 $ 2,499 $ — $ (527) $ (603) $ 5,347
Per common share data:Earnings per common share from continuing operations - basic $ 2.40Earnings per common share from continuing operations - diluted $ 2.37
Weighted-average common shares outstanding - basic 2,221.3Weighted-average common shares outstanding - diluted 2,242.1
1. See the U.S. GAAP consolidated statements of income.2. See the consolidated statements of income included in DuPont's Annual Report on Form 10-K for the year ended December 31, 2016.3. Certain reclassifications were made to conform to the presentation used for DowDuPont. The reclassifications are consistent with those identified and disclosed
in the Current Report on Form 8-K/A filed with the SEC on October 26, 2017. Additionally, in the fourth quarter of 2017, to improve comparability and conform to the current period presentation, the Company reclassified $143 million of asset impairment charges from "Sundry income (expense) - net" to "Restructuring, goodwill impairment and asset related charges - net."
4. Includes the following divestitures agreed to with certain regulatory agencies as a condition of approval for the Merger, including: Dow’s global EAA copolymers and ionomers business; a portion of Dow AgroSciences’ corn seed business in Brazil; and DuPont’s cereal broadleaf herbicides and chewing insecticides portfolio as well as its crop protection research and development pipeline and organization.
5. Certain pro forma adjustments were made to illustrate the estimated effects of the Merger, assuming that the Merger had been consummated on January 1, 2016. The pro forma adjustments are consistent with those identified and disclosed in the Current Report on Form 8-K/A filed with the SEC on October 26, 2017.
20