download (308kb) - munich personal repec archive
TRANSCRIPT

Munich Personal RePEc Archive
Efficiency evaluation of Greek equity
funds
Vassilios, Babalos and Guglielmo-Maria, Caporale and
Philippas, Nikolaos
May 2012
Online at https://mpra.ub.uni-muenchen.de/37954/
MPRA Paper No. 37954, posted 09 Apr 2012 23:50 UTC

1
Efficiency evaluation of Greek equity funds
Vassilios Babalos
Department of Banking & Financial Management, University of Piraeus, Greece
Guglielmo Maria Caporale
Centre for Empirical Finance, Brunel University, London, UK
Nikolaos Philippas
Department of Business Administration, University of Piraeus, Greece
Abstract
This study assesses the relative performance of Greek equity funds employing a non-
parametric method, namely Data Envelopment Analysis (DEA). Specifically, we
evaluate the funds’ total productivity change using the DEA-based Malmquist Index.
Our results reveal significant losses in funds’ productivity for the period of 2003-
2009, which calls for the attention of domestic policy makers and market regulators.
Significant implications for the investors' fund selection process arise from our
analysis since we are able to identify potential sources of operational inefficiencies.
Employing a panel logit model we document a significant negative relationship
between the probability of being efficient and funds’ size, a finding which may be
related to the microstructure of the domestic stock market. Furthermore, we provide
evidence against the notion of funds' mean-variance efficiency.
JEL Classification: G14, G15, G21, G23
Keywords: data envelopment analysis, operational efficiency, equity funds, DEA-
Malmquist productivity index
1. Introduction
Open-end mutual funds are one of the most successful institutions in modern financial
markets worldwide. These are collective investment vehicles that pool money from individual

2
investors to buy the most attractive securities in order to achieve the maximum benefit in
terms of risk-adjusted return. Their great popularity is mainly due to the advantages of
professional management and risk reduction through portfolio diversification they offer to
their shareholders. However, the delegated nature of the fund industry can result in conflicts
of interest between shareholders who wish to maximize their return and fund managers who
seek to maximize their compensation that depends on the fund's assets (Chevallier & Ellison,
1997).
The problem of investor's optimal portfolio selection has received a lot of attention since the
pioneering work of Markowitz (1952) and Tobin (1958). In the context of modern portfolio
mean-variance theory investors seek to maximize their utility choosing among all possible
mean-variance efficient portfolios given their risk preferences. Mean-variance efficiency is
defined as the ability of a set of assets to yield the maximum return for a given level of risk
or, alternatively, to produce the minimum level of risk for a given expected return.
Another issue related to portfolio efficiency is portfolio performance evaluation. The most
common criteria are the Sharpe ratio (1966),that measures the excess return of a portfolio
adjusted for the variability of its returns measured by their standard deviation, Treynor ratio
(1965) and Jensen's alpha (1968), the latter two being based on the CAPM theory. In the last
three decades, following the equilibrium model of capital market prices of Sharpe (1964) and
Lintner (1965), researchers have proposed various parametric measures for portfolio
performance assessment.
However, almost all the employed measures are plagued with two important shortcomings
that have been extensively analyzed in the relevant literature. The first concerns the choice of
a proper benchmark, which is closely related to what constitutes normal performance of a
portfolio. In the context of modern portfolio theory, benchmark return is defined by a strategy
of comparable risk that combines investment in a risk-free asset and in the tangent portfolio
that contains all risky assets. Various studies have pinpointed the sensitivity of portfolio
performance evaluation to the employed measures (Roll 1977, Lehman & Modest 1987). The
second important problem arising from the traditional performance measures is their inability
to incorporate the various costs incurred by the mutual fund shareholders. Open-end fund
investors face a series of direct and indirect charges which ultimately reduce their received
net return. These costs include sales charges (front and back-end loads) and other operational,
administrative and marketing costs that are usually proxied by the fund's expense ratio. A
series of studies (Malkiel 1995, Carhart 1997, Prather et al 2004, Babalos et al 2009) has
examined the impact of costs on fund's returns and detected a negative relationship between
fund's performance and various fund's costs.

3
The inherent disadvantages of traditional performance measures can be effectively alleviated
by employing an alternative non-parametric measure that was firstly introduced by Murtrhi et
al. (1997). This is obtained using a method known as Data Envelopment Analysis (DEA,
Charnes et al., 1978), which is applied extensively in operational management research to
compute relative measures of efficiency. The DEA approach allows us to gauge an individual
fund's investment performance by measuring its efficiency compared to the peer group funds.
DEA accomplishes this by constructing an efficient frontier from a linear combination of the
perfectly efficient funds and determining fund deviations from that frontier, which represent
performance inefficiencies defined as slacks.
The present study addresses the important topic of portfolio performance evaluation
combining financial as well as operational dimensions. In particular, we employ the non-
parametric DEA method to measure the performance of a sample of Greek domestic equity
funds. We further evaluate the funds’ total productivity change using Malmquist index. The
DEA method allows us to compute inefficiency measures of the individual input and output
factors in order to identify the source and extent of any performance inefficiency. The
oligopolistic structure of the Greek mutual fund industry, combined with the small size and
illiquidity of the Athens Stock Exchange (ASE), makes the Greek case an interesting one.
Specifically, we are able to explore whether the percentage of fund assets under management
affects the successful implementation of a fund's investment strategy given the small
capitalization and illiquidity of the domestic stock market.
The issue of funds’ operational efficiency is crucial for both investors and managers.
Investors, in particular, are concerned that the various charges imposed by the funds are used
effectively in their best interest and that funds exploit their available resources in the most
productive manner. On the other hand, managers are also concerned about funds’ efficiency
since long-term success of the delegated nature of active management depends crucially on
adopting practices that serve effectively clients’ investment purposes.
Our analysis contributes to the existing literature in several ways. To our knowledge, this
study constitutes the first attempt to measure relative efficiency of the Greek equity funds. We
provide results for a small, developed and bank-dominated European market, with possible
implications for other markets of similar size and institutional characteristics. At the same
time we examine the impact on the efficiency of the domestic equity funds industry of a
significant legislation change that took place in 2004 (Law 3283/2004). We use the
Malmquist index in order to assess shifts in funds’ total productivity whereas we employ for
the first time in the relevant literature Carhart’s (1997) risk-adjusted return as an output
measure.

4
As part of the sensitivity analysis, we extend our work to investigate the relationship between
fund and its size as in Coelli et al. (1998). Following previous work of Grinblatt & Titman
(1989) and Murthi et al. (1997) we explore the interaction between fund’s efficiency and asset
size in the context of a capital market with unique characteristics such as small capitalization
and illiquidity.
To preview our results, we find that the majority of domestic equity funds for the period
under examination exhibit significant operational inefficiencies. Inefficiency is mainly driven
by funds’ expenses that inevitably reduce investor’s wealth. As for portfolio diversification,
domestic equity funds appear not to have eliminated effectively the non-systematic
component of their portfolio riskiness since the risk variable exhibits significant inefficiencies
(slacks). With respect to total productivity change we document a substantial productivity loss
that is mainly driven by lack of technological advances. The second-stage evaluation of DEA
efficiency scores reveal interesting aspects of funds’ inadequacies. A higher probability of
being efficient is associated with a smaller fund size. A large asset base seems to be a
constraint in view of the microstructure characteristics of the domestic stock market: large
funds are frequently obliged to invest disproportionally in particular stocks, especially in the
case of illiquid stock markets, thereby eroding fund performance1.
The remainder of the paper is organized as follows: in the next section we provide a
description of the main hypotheses we test in our study. Section 3 reviews the relevant
literature, while in section 4 we present a brief description of the Greek mutual fund industry.
Section 5 provides details of the variables and the sample used, and of the calculation of risk-
adjusted returns; Section 6 outlines the DEA method, and Section 7 presents the empirical
results. Finally, Section 8 offers some concluding remarks and possible policy implications.
2. Hypotheses to be tested
Below we specify the various hypotheses tested in the present study.
Hypothesis 1
Total productivity of domestic equity funds has improved following a series of institutional
changes
Productivity shift of a fund can be measured by comparing its efficiency over two successive
periods. In particular, we opt for evaluating the industry’s relative efficiency by employing a
number of variables to measure inputs and outputs that integrate operational as well as
financial characteristics. Productivity can be decomposed into two components, namely
1 See, inter alia, Chen et al (2004).

5
technical efficiency change and technological change, allowing robust inference regarding
how privately managed funds should be organized and operated. As the fund management
process is the key determinant of returns to shareholders, it has been the subject of numerous
studies in the context of delegated portfolio management since the seminal paper of Jensen
(1968), with the evidence suggesting funds’ underperformance relative to known benchmarks.
Given the multi-dimensional process of the fund management process (that involves
collecting money from investors, investing assets in a range of financial products and
providing a range of supporting services). it is rather crucial to evaluate technical efficiency at
a fund level. Moreover, because of the prominent role of collective investment schemes in
the well-functioning of the financial system regulatory and supervisory advancements are
important for more transparency and better governance of the fund management industry.
Garcia (2010) has concluded that despite significant legislation amendments conducted in the
Portuguese pension fund industry there was still room for improvement in order to achieve
operational efficiency.
Hypothesis 2
Domestic equity funds’ portfolios are mean variance efficient
The mean variance theory established by the pioneering work of Markowitz (1952, 1959)
states that investors employing the benefits of diversification can construct mean variance
efficient portfolios that provide the maximum expected return for a given level of risk
measured by its variance of returns. In other words, an investor can reduce the risk of his
investment by allocating effectively his wealth in a variety of assets, diversification
eliminating idiosyncratic risk. Hence mutual funds are an attractive form of investment for
those individuals who do not possess enough wealth to construct a fully diversified portfolio.
One of the major advantages of the non-parametric data envelopment analysis technique is the
identification of sources of inefficiency by means of the slack variables. By definition, slack
variables indicate whether portfolio managers use resources inefficiently. Therefore,
examining the slacks of the employed risk variable we can infer if domestic equity funds hold
mean variance efficient portfolios (Murthi et al., 1997).
Hypothesis 3
An increase in a fund’s size causes an increase in the probability of the fund being efficient

6
Despite the contradictory evidence this hypothesis is central to our perception of the role of
mutual funds in the economy, i.e. of the economies of scale in the active management
industry. A better understanding of this issue would naturally be useful for investors,
especially in light of the significant outflows that domestic funds have experienced in the
recent past. Moreover, the scale-ability of investment funds is strongly related to the
persistence of fund performance (see, e.g., Gruber, 1996; Berk and Green, 2004). Given the
delegated nature of active management the existence of economies of scale in the industry
may also have implications for the agency relationship between managers and shareholders
and the best compensation contract between them. A positive relationship between fund size
and performance would be indicative of economies of scale such as more resources for
research and lower expense ratios (see, e.g., Otten & Bams 2002).
On the other hand, there is a belief that a large fund size may have a detrimental effect on
fund performance due to trading costs associated with liquidity or price impact (Andre Perold
& Robert S. Salomon 1991, Roger Lowenstein 1997). In other words, smaller funds have an
advantage over larger funds because trading can be done without any significant impact on
securities prices. As Chen et al. (2004) pointed out, while a small fund can easily invest all of
its money in its best ideas, a lack of liquidity forces a large fund to invest in its not-so-good
ideas and take larger positions per stock than is optimal, resulting in inferior performance.
Grinblatt & Titman (1989) and more recently Prather et al. (2004) examined the effect of fund
size on performance and found that the mutual funds with the smallest net asset values exhibit
the best performance.
3. A Brief Literature Review
The literature on the measurement of funds' performance by means of a non-parametric
approach is rather limited compared with the numerous studies using the traditional
parametric methods such as reward-to-volatility ratios (Treynor 1965, Sharpe 1966) or
regression-based abnormal return measures (e.g. Treynor & Mazuy model 1966, Jensen's
alpha 1968, Carhart's alpha 1997) as in Romacho & Cortez (2006). Murthi et al. (1997) were
the first to apply the DEA method for fund performance evaluation. They employed data for a
sample of 2083 US equity mutual funds which were drawn from Morningstar and covered the
third quarter of 1993. They detected a significant positive relation between their efficiency
index and Jensen's alpha for all categories of funds. The model specification included
standard deviation of returns, expense ratio, load and turnover as inputs, and mean gross
return as output. Basso & Funari (2001) employed both a single input-output formulation and

7
a generalized version of the DEA approach incorporating as one of the outputs a stochastic
dominance criterion. They used several risk measures (standard deviation, standard semi-
deviation and beta) and subscription and redemption costs as inputs, and the mean return and
the percentage of periods in which the fund was non-dominated as outputs. Their aim was to
evaluate the performance of a sample of 47 Italian funds that were classified as equity, bond
and balanced funds over the period from 1/1/1997 to 30/6/1999. Their results stressed the
importance of the subscription and redemption costs in determining fund rankings. Murthi &
Choi (2001), employing the same inputs and outputs as in Murthi et al. (1997), established a
relation between mean-variance and cost-return efficiency by linking their new non-
parametric, DEA-based performance measure to the traditional Sharpe index. They applied
their new performance measure to a sample of 731 US equity funds belonging to 7 different
categories that reported data for the third quarter of 1993. A striking result was that more than
90% of aggressive growth funds exhibited increasing returns to scale. Funds' loads and
turnover were identified as major sources of slacks across all funds' categories. Galagadera
and Silvapulle (2002) used DEA to assess the relative performance of 257 Australian mutual
funds for the period 1995-1999. Minimum initial investment and several time horizons (1,2,3
and 5 years) for the mean return were used as inputs. Their results suggest that scale
efficiency is the main source of overall technical efficiency and that both are higher for risk-
averse funds with high positive net asset flows. Sengupta (2003) examined the relative
performance for a dataset of 60 US fund portfolios from Morningstar for a period of 11 years
(1988-1998). He employed raw returns as output and loads, expenses, turnover, risk (standard
deviation or beta) and skewness of returns as inputs in his model. More than 70% of the funds
were found to be efficient, but with significant deviations depending on the category of funds.
The examination of slacks revealed no significant negative effect of the standard deviation on
funds' efficiency, providing support for the assertion that funds were mean-variance efficient.
The measurement of relative performance of US Real Estate Mutual Funds (RMFs) for the
period 1997-2001 was the object of the study of Anderson et al. (2004). The sample size
varied substantially from 28 RMFs in 1997 to 110 in 2001 while the source of their data was
Morningstar. They employed a series of inputs such as loads, various costs and a standard
measure of funds' risk (the standard deviation), and raw return as output. Their results
indicated that 12b-1 fees along with the loads are responsible for funds' operating
inefficiency. Daraio & Simar (2006) proposed a robust non-parametric performance measure
based on the concept of order-m frontier. Their sample consisted of more than 3000 US
mutual funds that were collected from Morningstar for the period June 2001- May 2002. They
used standard deviation, expense ratio, turnover and fund size as inputs and mean raw return
as output. According to their results, most mutual funds did not benefit from the economies of

8
scale resulting from the unique structure of the fund industry such as portfolio management
and shareholder services on a variety of securities and customers. More interestingly, the
analysis of slacks suggested that for some of the categories mutual funds did not lie on the
mean-variance efficiency frontier during the period analyzed. Lozano & Gutierez (2008)
performed a relative efficiency analysis for a sample of 108 Spanish funds and a four-year
period from January 2002 to December 2005 using six different DEA-like linear
programming models that incorporate second-order stochastic dominance and are consistent
with a rational, risk-averse investor. The proposed models include mean return as input and
various measures of risk as outputs.
4. The case of Greece
The Greek mutual fund industry is a quite an interesting case to examine because it is
oligopolistic while the Athens Stock Exchange (ASE) is relatively small in total capitalization
and characterized by illiquidity. During the period we examine, Greece was an emerging
market growing to maturity, now part of EMU and fully integrated in the international
financial system. Domestic market is currently regulated by the provisions of Law 3283/2004
which amends previous Law 1969/91. Law 3283/2004 combined with a series of
supplementary acts incorporates into Greek legislation important directives stipulated by
European Parliament 2001/107 & 2001/108) that regulate crucial issues with regard to UCITS
(Undertaking for Collective Investment in Transferable Securities). Among other things, it
introduces creation of UCITS established in another EU member country, clearly defined
asset allocation limits of each fund category, mandatory disclosure of fund’ operational costs
etc that provide greater transparency and enhanced protection of shareholders’ interests.
The growth of the domestic mutual fund industry was remarkable. While there were only two
stately controlled funds managing 4 billion drachmas in 1985 (252.9 million drachmas, Base
date=2009), by December 2004 there existed 262 funds of all types managing more than
31.65 billion Euros (an equivalent of 10.7 trillion drachmas or 122 billion drachmas, Base
date=2009). However, following the adverse effects of the global financial crisis the size of
the domestic fund industry by December 2009 declined to 10.68 billion euros.
Regarding the domestic equity funds, there existed only 27 funds in 1998, while in 2004 their
number rose to 63 managing 3.94 billion euros. The decline in asset prices combined with the
prolonged volatility in the stock market led to significant outflows from equity funds.

9
Therefore, by the end of December 2009 there were 46 equity funds2 with 1.87 billion under
management.
Panel A of Table 1 presents some interesting figures regarding the evolution of the domestic
equity fund industry such as number of funds, total assets under management and fund
median size while Panel B reports the same useful information for our sample funds.
Please insert Table 1 here
5. Data sources and description
Efficiency frontier estimation requires data on various inputs and outputs for the employed
decision making units (DMUs). Data for a sample of 31 Greek domestic equity funds during
period 2003-2009 have been collected. The time period along with the number of funds
analyzed was determined by data availability. The primary objective of the analysis is to
measure the individual performance of equity funds from an investor's point of view using
Data Envelopment Analysis (DEA). From the investors' viewpoint, the goal is to minimize
the inputs for a given level of output; thus, we employ the DEA input-oriented model. Next,
employing a balanced panel data on Greek equity funds (31 funds x 7 years=207
observations) we attempt to identify changes in funds’ total productivity through the
estimation of the Malmquist index.
A common problem encountered in the DEA financial literature is the presence of negative
values in the input or output variables which contradicts the non-negativity assumption of the
basic DEA models. For this purpose, a number of alternative solutions have been suggested -
see, inter alias, Ali & Seiford (1990), Basso & Funari (2005). A transformation of the original
data along with the use of a translation-invariant DEA model such as the additive model has
been the most popular methods of tackling the negative data problem. With regard to this
issue, we employ an output measure which is always non-negative and is financially
meaningful, that is:
W=1+Rj (1)
where Rj stands for the actual return achieved by the mutual fund j during the investment
period and is proxied by the annualized risk adjusted return from a multi factor model,
2 We exclude from our analysis domestic equity funds that are domiciled in Luxembourg.
10
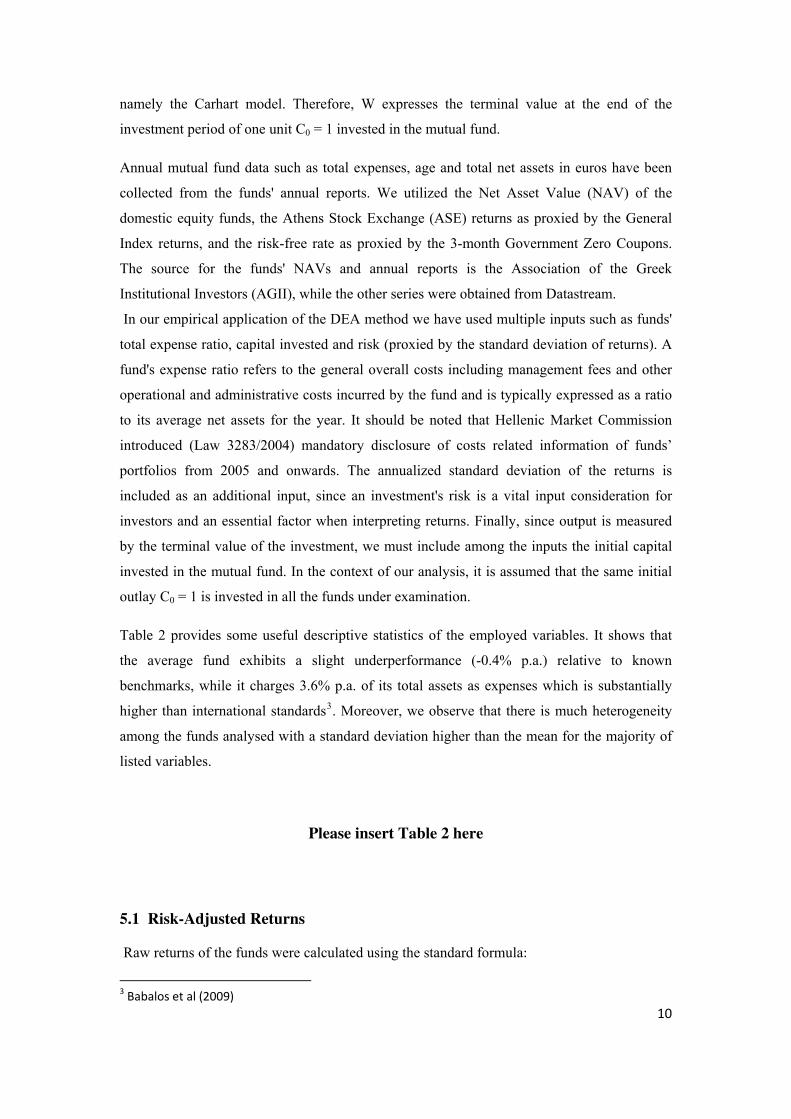
namely the Carhart model. Therefore, W expresses the terminal value at the end of the
investment period of one unit C0 = 1 invested in the mutual fund.
Annual mutual fund data such as total expenses, age and total net assets in euros have been
collected from the funds' annual reports. We utilized the Net Asset Value (NAV) of the
domestic equity funds, the Athens Stock Exchange (ASE) returns as proxied by the General
Index returns, and the risk-free rate as proxied by the 3-month Government Zero Coupons.
The source for the funds' NAVs and annual reports is the Association of the Greek
Institutional Investors (AGII), while the other series were obtained from Datastream.
In our empirical application of the DEA method we have used multiple inputs such as funds'
total expense ratio, capital invested and risk (proxied by the standard deviation of returns). A
fund's expense ratio refers to the general overall costs including management fees and other
operational and administrative costs incurred by the fund and is typically expressed as a ratio
to its average net assets for the year. It should be noted that Hellenic Market Commission
introduced (Law 3283/2004) mandatory disclosure of costs related information of funds’
portfolios from 2005 and onwards. The annualized standard deviation of the returns is
included as an additional input, since an investment's risk is a vital input consideration for
investors and an essential factor when interpreting returns. Finally, since output is measured
by the terminal value of the investment, we must include among the inputs the initial capital
invested in the mutual fund. In the context of our analysis, it is assumed that the same initial
outlay C0 = 1 is invested in all the funds under examination.
Table 2 provides some useful descriptive statistics of the employed variables. It shows that
the average fund exhibits a slight underperformance (-0.4% p.a.) relative to known
benchmarks, while it charges 3.6% p.a. of its total assets as expenses which is substantially
higher than international standards3. Moreover, we observe that there is much heterogeneity
among the funds analysed with a standard deviation higher than the mean for the majority of
listed variables.
Please insert Table 2 here
5.1 Risk-Adjusted Returns
Raw returns of the funds were calculated using the standard formula:
3 Babalos et al (2009)

11 /)( −−−= ptptptpt NAVNAVNAVR (2)
where NAVpt represents Net Asset Value for fund p at time t.
It is a common practice for fund management companies to advertise their funds’ high raw
returns in the financial press in order to attract new investors. However, raw returns are not
indicative of managerial ability since they do not take into account the funds’ different
exposures to systematic risk sources. Jensen (1968) suggested a risk-adjusted return measure
that is rooted in the CAPM and is widely employed. However, in order to capture excess
returns generated by tactical asset allocation strategies exploiting the inconsistencies of the
CAPM such as size or value strategies, we employ a multi-index performance evaluation
model. More specifically, we use Carhart's multifactor model (1997) which decomposes
excess fund returns into excess market returns, returns generated by buying small size stocks
and selling big size stocks (Small Minus Big- SMB), returns generated by buying stocks with
high book-to-market ratios (value) and selling stocks with low book-to-market ratios
(Growth) returns generated by buying and selling stocks with high and low past year's returns
(MOM) respectively. The four-factor abnormal return is given by the intercept of the
following regression:
ptpppmtpptpt MOMHMLSMBRR εββββα +++++= 3210 (3)
where
Rpt is the fund's excess returns
Rmt is the market portfolio excess returns
SMB is the difference in returns between a portfolio of small and big stocks
HML is the difference in returns between a portfolio of high book-to-market and low book-to-
market ratio stocks
MOM is the difference in returns between a portfolio of winners and losers stocks during the
previous year
11

6.Methodology
In this section we measure relative efficiency of domestic equity funds employing the DEA
non-parametric approach used in the estimation of production functions. This method was
developed in the pioneering work of Charnes, Cooper and Rhodes (1978) and has been used
extensively to measure the relative performance of decision-making units (DMUs) such as
social and lately financial institutions which are characterized by multiple objectives and/or
multiple inputs structure. DEA estimates the maximum potential output for a given set of
inputs. For every decision-making unit it assigns an efficiency measure relative to the best
operating unit within a specific group. It consists in computing the optimal weights given a
best level of efficiency measure usually set equal to 1, which will be reached only by the most
efficient units. The DEA efficiency measure for a decision-making unit j is defined as a ratio
of a weighted sum of outputs to a weighted sum of inputs:
∑
∑
=
=m
i
iji
t
r
rjr
xv
yu
1
1=h (4)
Let us define j=1,2,….,n as the number of decision-making units, r=1,2,….,t as the number of
outputs and i=1,2,…..,m as the number of inputs. Additionally, yrj stands for the amount of
output r for unit j, xij the amount of input i for unit j, ur the weight assigned to output r and vi
the weight assigned to input i.
As already mentioned, the most efficient units are characterized by an efficiency measure
equal to 1: at least with the most favorable weights, these units cannot be dominated by the
other ones in the set. Thus the DEA method leads to a Pareto efficiency measure in which the
efficient units lie on the efficient frontier (see Charnes et al., 1994).
Following Charnes et al. (1994), in order to compute the DEA efficiency measure for a
decision-making unit under examination j₀ {1,2,…,n} we must find the optimal solution to
the following fractional linear programming problem:
{ }
∑
∑
=
==m
i
iji
t
r
rjr
uv
xv
yu
hri
1
10,
0
0
max (5)
12

s.t. 1
1
1 ≤
∑
∑
=
=m
i
iji
t
r
rjr
xv
yu
j=1,...,n (6)
ru ε≥ r=1,...,t (6.1)
i
v ε≥ i=1,...,m (6.2)
where ε stands for a sufficient small positive number ensuring that the weights will not take
negative values.
The optimal objective function value that is given in (5) represents the efficiency measure
assigned to the target unit j₀ considered. The efficiency measures of other decision-making
units are computed by solving similar problems for each unit in turn.
We can convert the fractional problem defined above into an equivalent linear programming
problem; by setting we obtain the so-called input-oriented Charnes, Cooper and
Rhodes (CCR) linear model:
1
10=∑
=
m
i
iji xv
(7) ∑=
t
r
rjr yu
10
max
(8) ∑=
m
i
iji xvts
10
..
j=1,2,….n (9) 0
11
≤−∑∑==
m
i
iji
t
r
rjr xvyu
The optimization problem consists in computing the values of t+m variables, that is, the
weights ur and vi, subject to n+t+m+1 constraints.
13

14
7.Results
7.1 Basic Results
For all funds in the sample and for each year we have computed a relative measure of
efficiency using the DEA method as described above. We employ a typical input-oriented
DEA model, in which an efficient fund relative to the other funds being evaluated is indicated
with a measure of 1. On the other hand, a DEA measure of less than 1 indicates that the fund
is inefficient relative to the others. The magnitude of a fund's inefficiency is calculated as the
difference between the efficiency measure and 1 - the larger the difference, the more
inefficient the fund.
In Graph 1 we show the evolution of the funds’ mean efficiency during the period under
examination. It is clear that the average efficiency of Greek equity funds is at relatively high
levels (consistently above 0.90), while exhibiting a significant variation. Specifically, mean
efficiency ranges from 0.9 in 2003 to 0.95 in 2009 confirming a long-term upward trend.
Moreover, it can be seen that, during 2008, funds have experienced a significant drop in their
efficiency levels resulting from the effects of the global financial crisis.
Please insert Graph 1 here
Table 3 lists individual DEA efficiency scores for the sample funds for each year separately.
We can see that the number of efficient funds is rather low, ranging from 1 to 8 funds. In
other words, the majority of funds operate away from the efficiency frontier indicating
sources of inefficiencies among domestic equity funds that will be analyzed in detail later.
Please insert Table 3 here
In addition to efficiency scores, the DEA method allows the estimation of inefficiency
measures or slack variables which are defined as the difference between the target input and
output values and the unit's actual values. We can determine the key factors that are
responsible for fund’s inefficiency and what modifications need to be made in order to make
each fund efficient by examining the inefficiency measures of each input factor. Therefore,

15
Panel A of Table 4 reports mean values of slack variables for our sample funds. Following
Murthi et al. (1997), we examine the mean of the inefficiencies in individual inputs. In
particular, we attempt to measure the degree of inefficient use by portfolio managers of
certain cost and risk variables. Mutual funds are probably the preferred investment vehicle for
individuals because they provide a low cost access to a professionally managed and highly
diversified portfolio. A fund’s expense ratio gauges the overall costs associated with running
and managing a fund, including management fees and other operational and administrative
costs, and is defined as the ratio of a fund’s total expenses to its average net assets for each
year. A number of possible explanations have been put forward regarding the relationship
between costs and fund performance. Acting in an informationally inefficient framework as in
Grossman & Stiglitz (1980) informed investors should be rewarded with higher returns than
uninformed investors (Ippolito 1989). However, the various expenses are deducted from
funds’ assets, inevitably leading to performance erosion (Carhart 1997,Chen et al. 2004,
Babalos et al 2009). With respect to portfolio diversification we examine another important
input variable, that is fund’s total investment risk. The evidence in Table 4 suggests that both
the expense ratio and the risk variable measured by the standard deviation of returns exhibit
substantial slacks throughout the analyzed period. For example, in 2006 a fund characterised
as inefficient needed to reduce its expenses by 0.010 units (or 27.5%) and its risk levels by
0.038 units (or 20.8%) in order to operate on the efficient frontier.
Please insert Table 4 here
Panel B of Table 4 presents relative mean slacks, which is defined as the absolute mean slack
in input divided by the mean value of inputs. Employing the relative slacks it is possible to
evaluate the marginal impact of each input variable on funds’ efficiency.
As stated earlier, the examination of slack variables allows to infer whether or not fund
managers allocate resources efficiently. A striking result is that the risk of the funds as
measured by the standard deviation of returns exhibits nonzero slacks for the sample of our
funds. This finding contradicts the notion of mean-variance efficiency of funds' portfolios.
Among the other input variables, total expenses exhibit the larger slacks with a relative slack
of 0.134 confirming previous evidence (Babalos et al., 2009) that expenses might in effect
erode fund’s performance.

16
7.2 Further results
7.2.1 Malmquist productivity index
In order to gain additional insights into the domestic equity funds’ market we rank funds
according to the change in total productivity for the period 2003-2009. For our analysis, we
have adopted the non-parametric efficient frontier approach that allows estimating the
Malmquist productivity index (Malmquist, 1953) based on data envelopment analysis. There
are various formulations of the Malmquist index according to Caves et al (1982) and Fare et
al. (1992). In line with similar studies, we estimate an output-oriented Malmquist productivity
index based on DEA. Output-oriented models aim at identifying technical inefficiency in the
form of a proportional reduction in input usage.
Results from the estimation of funds’ total productivity change scores are presented in Table
5. Fund’s total productivity change can be decomposed into a technical efficient change
(catch-up or diffusion term) which measures the degree a fund improves or worsens its
efficiency, and a technological efficient change (innovation or frontier-shift term) that reflects
the change in the estimated frontiers between two periods. Technological change (column (2))
in the active management industry is the consequence of innovation such as investing in new
methods, practices and techniques with the objective of achieving superior risk-adjusted
returns. Additionally, we break down technical efficient change into pure efficient change
(column (3)) and scale-efficient change (column (4)) which is related to fund size. The change
in pure technical efficiency could be a sign of enhanced managerial skills or even of upgraded
management structure resulting in a better balance between inputs and outputs, accurate
reporting, effective decision making and so on. With respect to the frontier-shift term, a value
larger than one indicates an improvement in the employed technology. Domestic equity funds
are ranked according to the values of the Malmquist total productivity index reported in
column (5) of Table 5. Values of the Malmquist index larger than one indicate total
productivity gains for the relevant fund.
Please insert Table 5 here
The results suggest that Greek domestic equity funds experienced an average annual decrease
in total productivity of 4.2% for the period 2003-2009. This indicates that innovation
deteriorated in the analyzed period for our sample of equity funds leading us to conclude that
there was no investment in new technologies and in comparable managerial skills upgrades.
In general, domestic equity funds experienced a substantial productivity loss for the period
2003-2009, which should represent a major concern on the part of domestic policy makers.
The total productivity decrease is mainly driven by the adverse technological change
undergone by the majority of our sample funds. In particular, the average annual
technological regression is 5.2% while the average technical efficiency change, though
positive, is low, at only 1% percent per year. For the period of analysis, 14 out of 31 funds
exhibited a positive technically efficiency change indicating an improvement of technical
efficiency in the period of interest. Decomposing technically efficiency change into pure
technically efficiency change and scale efficiency change that is related to fund size reveals
substantial gains for 14 out of 31 funds only in one area. The scale efficiency is equal to one
for all our funds indicating that there was no growth in technical efficiency associated with
scale.
7.2.2 Determinants of efficiency
As a next step in our analysis we opt for exploring potential factors responsible for funds’
efficiency by means of a two-step approach, as suggested by Coelli et al. (1998). Our method
is based on a conditional Logit probability model that seeks to establish a relation between the
probabilities of a fund being efficient and various funds’ operational characteristics such as
assets and age. A logistic regression coefficients indicate the change (increase when βi>0,
decrease when βi<0) in the predicted logged odds of having a characteristic of interest for a
one-unit change in the independent variables. Therefore, we estimate the following regression
employing a balanced panel and assuming random effects:
itiititit vAgeAssetsEff εβββ ++++= 210 i=1,…….,N ,t=1,…….,T (10)
where
17

18
Eff is a binary variable that takes value 1 if fund i is efficient and 0 if otherwise
Assets is the fund’s i total assets at the end of the year expressed in millions of euros
Age is the fund’s i age measured in years from its inception
Please insert Table 6 here
A first conclusion is that fund’s size contributes negatively to the probability of being
efficient. In other words, the bigger a fund is the lower its efficiency. This is a very important
result probably linked with the domestic stock market’s microstructure indicating that the size
of the funds acts as a constraint for domestic equity funds, especially in a stock market which
is characterized by illiquidity and small capitalization. The latter is reinforced by the statistics
regarding the Athens Stock Exchange that are presented in the following Table 7 and Table 8.
Finally, age seems to have a positive although insignificant influence on the probability of
being efficient. It seems that older funds might have developed better management
techniques, more effective organizational structure or even better understanding of the
financial environment in general.
Please insert Table 7 here
Please insert Table 8 here
7.2.3 Predictive power of the proposed performance measure
Studies examining the predictive power of various performance measures are numerous,
dating back to Jensen (1968), Grinblatt & Titman (1992), Malkiel (1995), Gruber (1996),
Carhart (1997) and more recently to Bollen & Busse (2005), Fama & French (2010) for US
funds. However, the results regarding mutual fund performance persistence are still
inconclusive. Currently, a series of papers testing the predictive power of different
performance measures for international fund markets has emerged – see, inter alia, Cortez,
Paxson, and Rocha (1999) for Portuguese funds, Fletcher and Forbes (2002) for UK fund

19
industry, Otten & Bams (2004) for 5 European markets, Ferruz, Vicente, and Andreu (2007)
for the Spanish and the German equity funds. With regard to the domestic equity funds
Babalos et al (2007,2008) reported weak evidence of performance persistence that is sensitive
to the selection of the appropriate performance measure.
Despite the numerous studies on the predictive power of the traditional performance
measures, namely raw returns, regression-based measures the literature on testing the
practical relevance of relative performance measures similar to ours is scarce. Hence, we opt
for employing the Spearman rank correlation coefficient in order to examine the degree of
association between fund rankings based on the proposed measure over one-year horizons
during the period 2003-2009. The results are presented in Table 9 indicating the absence of
significant correlation between fund rankings. In other words, the proposed performance
measure carries no predictive power over time. However, further research on the robustness
of our findings would be useful.
Please insert Table 9 here
8. Conclusions
The purpose of the present study is twofold. Firstly, we attempted to measure operational
efficiency for a sample of Greek domestic equity funds between 2003 and 2009 by means of
the non-parametric Data Envelopment Analysis (DEA) method. With regard to efficiency
measurement, we have employed an original dataset spanning cost and risk characteristics of
the funds analyzed, whereas a sophisticated risk-adjusted return measure, namely Carhart’s
alpha (1997), was employed as the output measure. The empirical findings shed light on some
important aspects of the domestic equity fund industry. In particular, only a small percentage
of the funds in the sample are found to operate on the efficient frontier. Another interesting
result which can be inferred by examining the slacks is the negative effect that expenses exert
on funds’ operational efficiency. More interestingly, the evidence does not support the notion
of mean-variance efficiency for the equity funds in our sample.
Examining total productivity change through estimation of a DEA-based Malmquist index
provides some interesting evidence with respect to the diffusion of best-practice technology in
the domestic fund industry. In particular, we observed a substantial productivity loss for
domestic equity funds for the period analyzed. The lack of investments in leading
technologies and related management techniques by fund management companies appears to
have caused a significant technological regression. With regard to the determinants of funds’

20
operational inadequacies and as a part of a sensitivity analysis, we have employed a second-
stage panel logit regression that documented the existence of a negative relationship between
the probability of being efficient and assets under management. This adverse effect may be
attributed to microstructure features of the domestic stock market, which is characterized by
illiquidity and small market capitalization.
These results have practical relevance for domestic equity fund shareholders, since investors
might take into account some of the funds' characteristics analyzed here in their fund selection
process. Clearly, one would expect investors to prefer a fund that provides the maximum
benefit (return) at a minimum cost (in the form of charges, front-end loads etc.). In particular,
investors should pay attention to fund size and expenses when selecting an equity fund
investing in the domestic stock market since these variables appear to be the source of
significant operational inefficiencies. Additional analysis points to a lack of predictive power
of the proposed measure of performance evaluation, although further research on the
robustness of this result would be advisable.
However, we reckon that there is potential for upgrading funds’ operational efficiency mainly
through two different channels. Firstly, fund management companies exhibiting the poorest
performances should adopt a more efficient, incentive-oriented managerial policy that would
allow them to cover the distance from the efficient frontier. In particular, fund companies
should minimise the costs charged to shareholders exploiting in more effective ways the
economies of scale and scope of the industry. The objective of achieving better levels of
diversification in their managed portfolios should remain high in managers’ agenda.
Secondly, their effort towards improvement should rest on technological innovations in terms
of methods, techniques, launching new products and so on. Moreover, improvements in the
efficiency of domestic equity funds depend indisputably on the actions of market regulatory
authorities such as (1) reinforcing the implementation of its regulatory obligations, (2)
requiring the disclosure of funds’ detailed operational information in order to establish greater
transparency into the market, (3) providing favorable tax treatment for fund management
companies and fund investors and (4) implementing ‘best practices’ introduced by other
regulatory authorities in preserving investors’ best interest.
Finally, technical inefficiency measures can be used for competitive benchmarking
(‘‘yardstick competition’’) in which management fees are dependent on the costs of similar
(in terms of input mix) but more efficient funds. Such a framework can (1) enhance the fund
managers’ incentives to achieve efficiency and (2) reduce the informational asymmetry
between fund managers (the agent) and regulators and investors (the principal).
Acknowledgements

21
We would like to thank the editor and an anonymous referee for their valuable
comments that helped improve the paper considerably.

22
References
Anderson R., Brockman C., Giannikos C & McLeod R., 2004, "A non-parametric
examination of Real Estate mutual fund efficiency", Int. J. Bus. Econ. 3, pp. 225-
238.
Babalos V., Kostakis, A. and Philippas, N, 2007, “Spurious results in testing mutual
fund performance persistence: evidence from the Greek market”, Appl. Finan. Econ.
Letters 3, pp. 103-108
Babalos, V. Caporale, G.M. Kostakis, A. and Philippas, N., 2008, “Testing for
persistence in mutual fund performance and the ex-post verification problem:
evidence from the Greek market”, Europ. J. Finance 14,pp. 735-753
Babalos V., Kostakis A. & Philippas N., 2009, "Managing mutual funds or managing
expense ratios? Evidence from the Greek fund industry", J. Mult. Financ. Manag. 19,
pp. 256-272
Barber B.M, Odean T.& Zheng L., 2005," Out of sight, out of mind: The effect of
expenses on mutual fund flows", J. Bus. 78, pp. 2095-2120.
Basso Antonella & Stefania Funari, 2001, "A data envelopment analysis approach to
measure the mutual fund performance.", Eur. J. Oper. Res. 135 , pp. 477-492.
Bollen N. P. B. , Busse J. A., 2005, “Short term persistence in mutual fund
performance”, Rev. Finan. Stud. 18, pp 569-597.
Brau J. C., Rodríguez J., 2009, ‘An empirical analysis of Mexican and US closed-end
mutual fund IPOs’, Res Int Bus Finance 23, pp. 1-17
Carhart, M., 1997, "On persistence in mutual fund performance", J. Financ. 52, pp.
52-82.
Caves D.W., Christensen L.R., Diewert W.E., 1982a, ‘Multilateral comparisons of
output, input and productivity using superlative index numbers’., Economic Journal,
Royal Economic Society 92, pp. 73-86
Caves D.W., Christensen L.R., Diewert W.E., 1982b, ‘The economic theory of index
numbers and the measurement of input, output and productivity, Econometrica 50,pp.
1393-1414
Charnes A, Cooper W. & Rhodes E., 1978, "Measuring the efficiency of decision
making units", Eur. J. Oper. Res. 2, pp. 429-444.
Charnes A, Cooper W., Lewin A.Y & Seiford L.M., 1994," Data envelopment
analysis: Theory, methodology and application." Kluwer, Boston

23
Chen J.,Hong H., Huang M. & Kubik J., 2004, "Does fund size erode performance?
The role of liquidity and organization ", Am. Econ. Rev. 94, pp.1276--1302
Chevallier J. & Ellison G, 1997, "Risk taking by mutual funds as a response to
incentives", J. Polit. Econ. 105, pp. 1167-1200.
Coelli T.J., Rao P., Battese G.E. 1998, ‘An Introduction to Efficiency and
Productivity Analysis, Kluwer Academic Press
Cooper, W, Seiford L & Tone K., 2007,"Data envelopment analysis: A
comprehensive text with models, applications, references and DEA-Solver software",
Springer Science-Business Media
Cortez R., M., Paxson, D. A. & Rocha M. J., 1999, “Persistence in Portuguese mutual
fund performance”, Europ. J. Finance 5, pp. 342-365.
Daraio C & Simar L., 2006, "A robust nonparametric approach to evaluate and
explain the performance of mutual funds", Eur. J. Oper. Res. 175, pp.516-542.
Fama, E. F. & French, K. R, 1993, "Common risk factors in the returns on bonds and
stocks ", J. Financ. Econ. 33, pp 3-53.
Fama, E. F. & French, K. R., 1996, "Multifactor explanations of asset pricing
anomalies", J. Financ. 51, pp 55-84
Fama E & French K., 2010, “Luck versus Skill in the Cross Section of Mutual Fund
Returns”, J. Financ. 65, pp. 1725-54
Ferruz, L., J.L. Sarto, and L. Andreu. 2007, “A comparison between German and
Spanish equity fund markets”, Journal of Asset Management 8, pp. 147–151.
Fletcher, J. Forbes D., 2002, “An exploration of the persistence of UK unit trust
performance”, J. Empirical Finance 9, pp. 475-493.
Garcia M.T.M, 2010, ‘Efficiency evaluation of the Portuguese pension funds
management companies’, J. Int. Financ. Mark. Instit. Money 20, pp. 259-266
Grinblatt, M., and Titman S., 1989, “Mutual fund performance: An analysis of
quarterly portfolio holdings”, J. Bus. 62, pp. 393-416.
Grinblatt, M., and Titman S., 1992, “The Persistence of mutual fund performance”, J.
Financ. 47, pp. 1977-1984.
Grossman, S. & Stiglitz S., 1980, “On the impossibility of informational efficient
markets”, Am. Econ. Rev. 70, pp. 393-408
Gruber, M. J., 1996, “Another puzzle: The growth in actively managed mutual funds,”
J. Financ. 51, pp. 783-810.

24
Huang M. Y., Lin J. B., 2011, ‘Do ETFs provide effective international
diversification?’, Res Int Bus Finance 25, pp. 335-344
Ippolito, Richard A., 1989, “Efficiency with costly information: A study of mutual
fund performance 1965-1984”, Q. J. Econ. 104, pp. 1-22
Jegadeesh N. and Titman S., 1993, "Returns to buying winners and selling losers:
Implications for stock market efficiency", J. Financ. 48, pp. 65-91.
Jensen, M., 1968, "The performance of mutual funds in the period 1945-64," J.
Financ. 23, pp. 389-416.
Lehman B. & Modest D., 1987, "Mutual fund performance evaluation:A comparison
of benchmarks and benchmark comparisons" , J. Financ. 42, pp. 233-26
Lintner J., 1965. "The Valuation of risky Assets and the selection of risky investments
in stock portfolios and capital budgets." Rev. Econ. Stat. 47, pp. 13-37.
Lozano S. & Gutierez E., 2008, "Data envelopment analysis of mutual funds based on
second-order stochastic dominance", Eur. J. Oper. Res. 189, pp. 230-244.
Malkiel B., 1995," Returns from investing in equity mutual funds 1971-1991", J.
Financ. 50, pp. 549-572.
Malmquist S.,1953, ‘ Index numbers and indifference surfaces’, Trabajos de
Estatistica 4, pp. 209-242
Markowitz H. , 1952, "Portfolio selection ", J. Financ. 7, pp. 77-91.
Murthi, B. P. S., Yoon K. Choi, Preyas Desai,1997,"Efficiency of mutual funds and
portfolio performance measurement: A non-parametric approach.", Eur. J. Oper. Res.
98, pp. 408-418.
Murthi, B. P. S. & Choi. Y, 2001, "Relative performance evaluation of mutual funds:
A non-parametric approach.", J. Bus. Financ. Account. 28, pp.853-876.
Otten R. & Bams D., 2002, "European mutual fund performance," Eur. Financ.
Manag. 8, pp.75-101.
Prather, L., Bertin, W.J, Henker, T., 2004, "Mutual fund characteristics, managerial
attributes, and fund performance ", Rev. Financ. Econ. 13, pp. 305-326.
Romacho J.C. Cortez M. C., 2006, ‘Timing and selectivity in Portuguese mutual fund
performance’, Res Int Bus Finance 20, pp. 348-368
Roll R., 1977, "A critique of the Asset Pricing Theory's Tests: Part I: On past and
potential testability of the theory", J. Financ. Econ., pp. 129-176.
25
Sengupta J., 2003, "Efficiency tests for mutual fund portfolios", Appl. Financ. Econ.
13, pp. 869-876
Sharpe, W. F. ,1966, "Mutual fund performance", J. Bus. 39, pp. 119-38.
Sharpe W.F, 1964, "Capital asset prices: A theory of market equilibrium under
conditions of risk", J. Financ. 19, pp. 425-442.
Tobin J., 1958, "Liquidity preference as behavior towards risk", Rev. Econ. Stud. 25,
pp. 65-86.
Treynor J. ,1965, "How to rate management of Investment Funds;", Harvard Bus.
Rev., pp. 63-75.
Zera S.P., Madura J., 2001, ‘The empirical relationship between mutual fund size
and operational efficiency’, Appl. Financ. Econ. 11, pp. 243-251.

26
Appendix
Table 1
Evolution of domestic equity fund industry
Panel A: Whole market
Year No of funds
Total
Assets
Fund
Median
Size
(billion
€)
(million
€)
2003 66 3.85 12.27
2004 63 3.94 15.84
2005 55 4.4 23.14
2006 57 4.65 25.64
2007 51 4.15 33.95
2008 52 1.54 12.41
2009 46 1.87 17.02
Panel B:
Sample funds
2003 31 2.93 32.37
2004 31 3.14 34.29
2005 31 3.73 41.43
2006 31 3.95 44.94
2007 31 3.49 43.07
2008 31 1.33 16.01
2009 31 1.65 22.05
Note: This table reports domestic equity fund industry figures such as number of funds, total assets and
median size. Data are reported for each year during the period January 2003-December 2009. Panel A
reports data for all domestic equity funds while Panel B reports data only for the sample funds. Index
funds and equity funds domiciled in Luxembourg are excluded. The data were obtained from the
Association of Greek Institutional Investors (AGII).
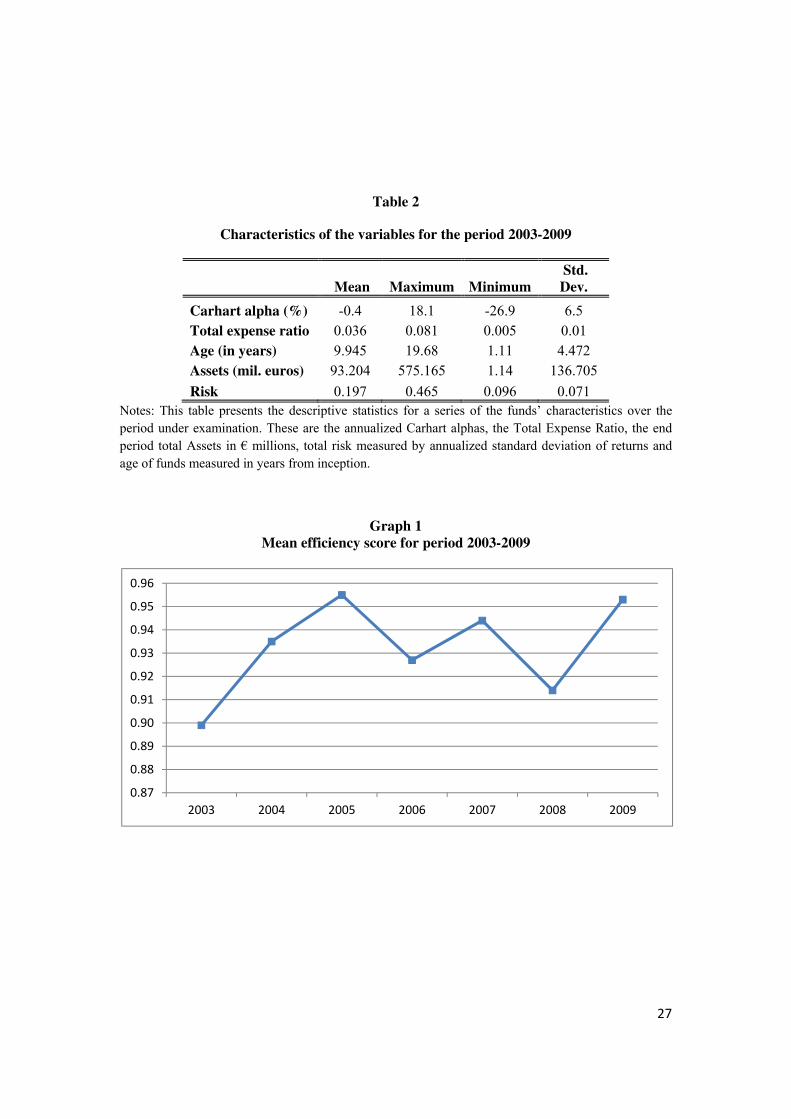
Table 2
Characteristics of the variables for the period 2003-2009
Mean
Maximum
Minimum
Std.
Dev.
Carhart alpha (%) -0.4 18.1 -26.9 6.5
Total expense ratio 0.036 0.081 0.005 0.01
Age (in years) 9.945 19.68 1.11 4.472
Assets (mil. euros) 93.204 575.165 1.14 136.705
Risk 0.197 0.465 0.096 0.071
Notes: This table presents the descriptive statistics for a series of the funds’ characteristics over the
period under examination. These are the annualized Carhart alphas, the Total Expense Ratio, the end
period total Assets in € millions, total risk measured by annualized standard deviation of returns and
age of funds measured in years from inception.
Graph 1
Mean efficiency score for period 2003-2009
0.87
0.88
0.89
0.90
0.91
0.92
0.93
0.94
0.95
0.96
2003 2004 2005 2006 2007 2008 2009
27

28
Table 3
Individual efficiency scores
FUND 2003 2004 2005 2006 2007 2008 2009
1 0.766 0.882 0.985 0.933 0.971 1.000 0.968
2 0.896 0.918 0.951 0.902 0.936 1.000 1.000
3 0.888 0.995 0.944 0.968 0.913 0.885 0.973
4 0.888 0.971 0.953 0.960 0.894 0.861 0.933
5 0.935 0.965 0.952 0.918 0.976 0.943 0.945
6 0.923 0.995 0.954 0.918 0.976 0.936 0.945
7 0.883 1.000 0.969 1.000 1.000 1.000 1.000
8 0.907 1.000 1.000 0.917 1.000 1.000 0.913
9 0.887 0.966 0.960 0.943 0.912 0.902 0.907
10 0.866 0.910 1.000 0.956 0.982 0.725 0.914
11 0.883 0.944 0.952 0.875 0.949 0.903 0.934
12 0.853 0.963 0.941 0.916 0.906 0.959 0.937
13 1.000 0.957 0.933 0.960 1.000 1.000 0.995
14 1.000 0.967 1.000 0.905 1.000 0.920 0.985
15 0.905 0.900 0.922 0.911 0.913 0.841 0.954
16 0.851 0.989 0.869 0.942 0.958 0.771 0.971
17 0.808 0.990 0.911 0.904 0.909 0.870 0.894
18 0.859 0.823 0.970 0.954 0.928 0.960 0.900
19 1.000 0.859 0.947 0.912 0.894 0.973 0.955
20 0.929 0.985 0.933 0.891 0.899 0.967 0.951
21 0.845 0.897 0.950 0.901 0.897 0.976 0.967
22 0.931 0.997 1.000 0.891 0.913 0.974 0.999
23 0.857 0.946 0.939 0.954 0.923 0.992 0.974
24 0.879 0.901 0.960 0.987 0.975 0.758 0.957
25 0.976 0.874 0.976 0.952 0.965 0.857 0.954
26 0.950 0.941 0.947 0.924 0.875 1.000 0.878
27 1.000 0.852 1.000 0.955 0.952 0.834 0.965
28 0.847 0.929 0.904 0.841 0.948 0.799 0.953
29 0.918 0.797 0.983 0.915 0.991 0.734 0.975
30 0.836 0.940 0.960 0.925 0.921 1.000 0.948
31 0.891 0.947 0.942 0.898 1.000 1.000 1.000
No of
efficient
funds 4 2 5 1 5 8 3

29
No of
inefficient
funds 27 29 26 30 26 23 28
Notes: This table reports DEA-CRS annual efficiency scores for funds for the period 2003-2009. The
number of efficient (inefficient) funds is reported at the bottom of the table.
Table 4
Mean slacks in inputs
Panel A:Mean
absolute slacks
Year Capital Expenses Risk
2003 0 0 0.026
2004 0.002 0.004 0.016
2005 0 0.009 0.018
2006 0 0.01 0.038
2007 0 0.005 0.002
2008 0 0.001 0.003
2009 0 0.005 0.003
Mean 0 0.005 0.015
Panel B:Relative
slacks (absolute
slack/mean value
of inputs)
Year Capital Expenses Risk
2003 0 0 0.141
2004 0.002 0.113 0.114
2005 0 0.262 0.144
2006 0 0.275 0.208
2007 0 0.129 0.013
2008 0 0.028 0.01
2009 0 0.127 0.011
Mean 0 0.134 0.091
Notes: This table summarizes the mean of the absolute slacks and the relative mean slacks which are
defined as absolute mean slack in input or output divided by the mean value of the inputs/outputs.
Slacks indicate the extent to which an input (output) needs to be decreased (increased) in order for the
fund to achieve a relative efficiency of 1. Panel A presents the results for the estimated mean absolute
slacks while Panel B reports computed relative slacks.

30
Table 5
Average technically efficient change and technological change of domestic equity
funds: 2003-2009
Fund
Technically
efficient
change
Technological
change
Pure
technical
efficiency
change
Scale
efficiency
change
Malmquist
index
(TFP
change)
1
Interamerican Developing
Companies 1.022 0.969 1.022 1.000 0.990
2 ATE Small & Medium Cap 1.020 0.971 1.020 1.000 0.990
3 Geniki Selected Values 1.040 0.938 1.040 1.000 0.976
4 Hermis Pionneer 1.014 0.962 1.014 1.000 0.975
5 Probank 1.019 0.955 1.019 1.000 0.973
6 ALLIANZ 1.015 0.957 1.015 1.000 0.971
7 Attikis 1.023 0.950 1.023 1.000 0.971
8 Alico 1.019 0.952 1.019 1.000 0.970
9 Eur. Reliance Growth 1.009 0.958 1.009 1.000 0.967
10 Interamerican Dynamic 1.009 0.959 1.009 1.000 0.967
11 Alico Small & Medium Cap 1.010 0.956 1.010 1.000 0.966
12 KYPROU Hellenic Dynamic 0.996 0.969 0.996 1.000 0.965
13 Eurobank Institutional Portfolios 1.021 0.945 1.021 1.000 0.965
14 ALLIANZ Aggressive Strategy 1.008 0.956 1.008 1.000 0.964
15 Hermis Dynamic 1.016 0.949 1.016 1.000 0.964
16 Delos Top-30 1.021 0.943 1.021 1.000 0.963
17 HSBC Medium & Small Cap 0.997 0.964 0.997 1.000 0.961
18 ALPHA TRUST Growth 1.021 0.940 1.021 1.000 0.960
19 Millenium Mid cap 0.994 0.965 0.994 1.000 0.959
20 ΑΤΕ 1.004 0.953 1.004 1.000 0.957
21 Delos Blue Chips 1.004 0.952 1.004 1.000 0.956
22 International Selection 1.008 0.945 1.008 1.000 0.953
23 CitiFund Equity 1.012 0.942 1.012 1.000 0.953
24 Delos Small Cap 1.009 0.943 1.009 1.000 0.952
25
ALPHA TRUST New
Companies 1.001 0.950 1.001 1.000 0.951
26 International Growth 1.017 0.934 1.017 1.000 0.950
27 ALPHA Blue Chips 1.004 0.945 1.004 1.000 0.948
28 HSBC Growth 0.999 0.945 1.000 0.999 0.944

31
29 ALPHA 1.002 0.941 1.002 1.000 0.943
30 Millenium Blue Chips 0.987 0.953 0.987 1.000 0.940
31 KYPROU Hellenic 0.992 0.837 0.992 1.000 0.831
Mean 1.010 0.948 1.010 1.000 0.958
Notes: This table presents results of the estimated output-oriented Malmquist index for the period
2003-2009. Column (3) reports the results for technically efficiency change while column (4) reports
the results of technological change. In columns (5) and (6) we present pure technically efficiency
change and scale efficiency change respectively. Total factor productivity change (Malmquist index) is
presented in column (7). All Malmquist index averages are geometric means.
Table 6
Conditional Logit panel regression
Period 2003-2009
(217 observations)
β0 -3.04
t-statistic -3.50***
β1 -0.011
t-statistic -1.68*
β2 0.11
t-statistic 1.39
Notes: This table reports estimated regression coefficients from the conditional, random effects logit
model for the period 2003-2009.
*** (*) denotes statistical significance at 1% (10%)

32
Table 7
Summary statistics of Athens Stock Exchange
Year Capitalization Avg no of trades
Large
Capitalization
Medium &
Small
Capitalization Other Total
Large
Capitalization
Medium &
Small
Capitalization Other
2006 143.78 10.70 3.44 157.93 28602.76 12457.29 0.04
2007 166.22 15.12 14.16 195.5 26630.88 11613.72 295.24
2008 55.28 6.68 6.17 68.12 24200.9 2894.1 447.95
2009 70.44 5.59 7.42 83.45 32186.64 4519.06 589.75
Year Volume of trades
Large
Capitalization
Medium &
Small
Capitalization Other
2006 382.78 241.40 21.23
2007 544.11 136.18 46.93
2008 646.34 50.36 32.98
2009 703.18 101.84 37.00
Notes: This table presents capitalization (billion of €), average daily number of trades and volume of
trades (millions of shares) of Athens Stock Exchange. Daily average of trades is without block of trades
while volume of trades refers to trades recorded in December of each year. Data are available only after
2006 since January of 2006 the internationally known sector classification FTSE Dow Jones Industry
Classification Benchmark (ICB) is applied in Athex. Data were collected from Athens Stock Exchange

33
Table 8
Average trade spread in Athens Stock Exchange
Year
Trade
spread
2005 1.77
2006 1.36
2007 1.23
2008 2.35
2009 2.79
Notes: This table reports average trade spread for the whole market for the period 2005-2009. The
spread is defined as the ratio of the difference between the best ask and the best bid price over the
average of the sum of the two prices. Average trade spread is the weighted, by traded value, average or
the spreads corresponding to these trades. The spread that corresponds to a trade is the one experienced
exactly before the trade. Data were retrieved from Athens Stock Exchange.
Table 9
Predictive power of fund’s performance measure
Period
Spearman
Correlation
coefficient
2003-04 0.027
(0.14)
2004-05 -0.131
(-0.71)
2005-06 0.255
(1.42)
2006-07 0.224
(1.24)
2007-08 0.008
(0.04)
2008-09 0.231
(1.28)
Note: This table reports Spearman rank correlation coefficient for fund rankings in the specified period
while in brackets we report the associated t-statistic.

34