download the old mutual annual report pdf
TRANSCRIPT
ANNUAL REPORTAND ACCOUNTS 2013

CONTENTS
Strategic report1 Welcome2 Group at a glance4 Chairman’s message to shareholders5 Chief Executive’s review10 Our vision, strategy and values18 Business model22 Our markets28 Responsible Business30 Key performance indicators32 Principal risks and uncertainties36 Group Executive Committee38 Business review summary48 Financial disclosure supplement
Business review52 Emerging Markets56 Nedbank61 Property & Casualty63 Old Mutual Wealth68 US Asset Management70 Non-core business – Bermuda72 Financial review
Find out more about Old Mutual
Governance82 Risk and capital management88 Board of Directors90 Directors’ report on corporate governance106 Directors’ remuneration report
Financials128 Group financial statements238 Financial statements of the Company247 MCEV276 Shareholder information
Annual Report www.oldmutual.com/reports2013
Corporate website www.oldmutual.com
Reporting centre www.oldmutual.com/reportingcentre
For each 1,000 Old Mutual shareholders that elect to read the Annual Report online, a tonne of paper can been saved.
Sign up for electronic communications at www.oldmutual.com/ecomms

1
Strategic report
OUR MISSIONTo enable positive futures for all our stakeholders – our customers, our employees, our communities, our environment and our shareholders
OUR VISIONTo become our customers’ most trusted partner – passionate about helping them achieve their lifetime financial goals
OUR VALUESAccountability, Integrity, Respect, Pushing beyond Boundaries
OUR STRATEGYGrowing and transforming our businesses to lead in a responsible and sustainable way
WELCOMETO OLD MUTUAL
Old Mutual plcAnnual Report and Accounts 2013
2
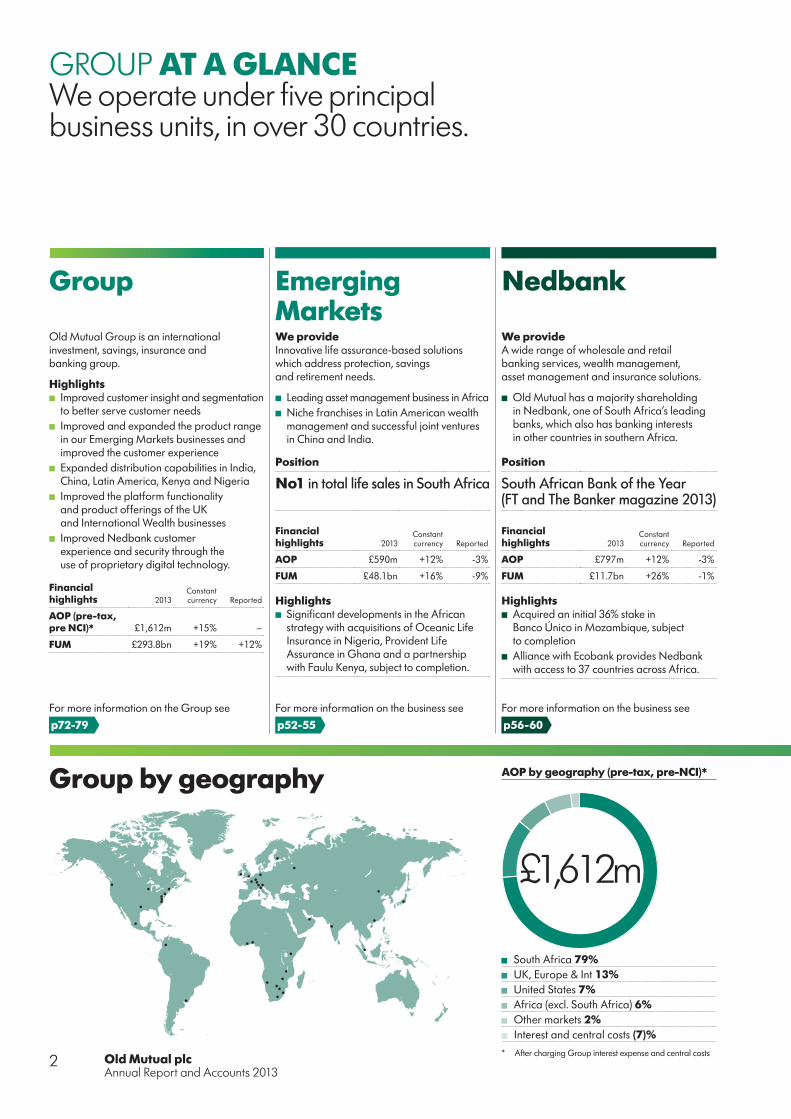
GROUP AT A GLANCEWe operate under five principal business units, in over 30 countries.
Group
Old Mutual Group is an international investment, savings, insurance and banking group.
Highlights ■ Improved customer insight and segmentation to better serve customer needs
■ Improved and expanded the product range in our Emerging Markets businesses and improved the customer experience
■ Expanded distribution capabilities in India, China, Latin America, Kenya and Nigeria
■ Improved the platform functionality and product offerings of the UK and International Wealth businesses
■ Improved Nedbank customer experience and security through the use of proprietary digital technology.
Financial highlights 2013
Constant currency Reported
AOP (pre-tax, pre NCI)* £1,612m +15% –
FUM £293.8bn +19% +12%
Emerging MarketsWe provide Innovative life assurance-based solutions which address protection, savings and retirement needs.
■ Leading asset management business in Africa ■ Niche franchises in Latin American wealth management and successful joint ventures in China and India.
Position
No1 in total life sales in South Africa
Financial highlights 2013
Constant currency Reported
AOP £590m +12% -3%
FUM £48.1bn +16% -9%
Highlights ■ Significant developments in the African strategy with acquisitions of Oceanic Life Insurance in Nigeria, Provident Life Assurance in Ghana and a partnership with Faulu Kenya, subject to completion.
Nedbank
We provide A wide range of wholesale and retail banking services, wealth management, asset management and insurance solutions.
■ Old Mutual has a majority shareholding in Nedbank, one of South Africa’s leading banks, which also has banking interests in other countries in southern Africa.
Position
South African Bank of the Year (FT and The Banker magazine 2013)
Financial highlights 2013
Constant currency Reported
AOP £797m +12% -3%
FUM £11.7bn +26% -1%
Highlights ■ Acquired an initial 36% stake in Banco Único in Mozambique, subject to completion
■ Alliance with Ecobank provides Nedbank with access to 37 countries across Africa.
Group by geography
South Africa 79%UK, Europe & Int 13%United States 7%Africa (excl. South Africa) 6%Other markets 2%
AOP by geography (pre-tax, pre-NCI)*
£1,612m
Interest and central costs (7)%
For more information on the Group see
p72-79
For more information on the business see
p52-55
For more information on the business see
p56-60
* After charging Group interest expense and central costs
3
Strategic report
Old Mutual WealthWe provide Integrated wealth management products and services, combining asset management as well as saving and investment solutions to 1.4 million affluent clients in the UK, Europe and selected international markets.
Position
OMGI recorded the second highest UK retail net inflows in 2013††
Financial highlights 2013 Reported
AOP £217m +11%
FUM £78.5bn +13%
Highlights ■ Our asset management brand, OMGI, was launched successfully in the first half of the year
■ Good flows of new business, further strengthened by the expansion of the UK equities team.
† † Pridham Report
US Asset ManagementWe provide A diverse range of investment strategies and products, operating as OMAM, and delivered via a multi-boutique model to institutional investors around the world.
Position
Leading Institutional Asset Manager
Financial highlights 2013
Constant currency Reported
AOP £111m +21% +22%
FUM £155.3bn +23% +21%
Highlights ■ Generated growth in the portfolio through increased NCCF, investment performance, product and channel initiatives and complementary global distribution
■ Non-US clients account for 36% of FUM (2012: 35%).
Property & CasualtyWe provide General insurance solutions in Africa, operating as Mutual & Federal and iWYZE in South Africa.
Position
Top 2 in property and casualty insurance in South Africa†
Financial highlights 2013
Constant currency Reported
AOP £4m -88% -89%
FUM £0.2bn – –
Highlights ■ Acquired Oceanic’s Nigerian general insurance business from Ecobank
■ Acquired Agricola UMA, contributing 13% growth in GWP.
† based on the latest available industry data in respect of gross written premium
Emerging Markets 49%Nedbank 40%Property & Casualty 2%Old Mutual Wealth 9%US Asset Management**
Customer numbers
16m
** Institutional clients
AOP by business unit (pre-tax, pre-NCI)*
£1,612m
Emerging Markets 37%Nedbank 49%Property & Casualty 0%Old Mutual Wealth 14%US Asset Management 7%Interest and central costs (7)%
Employees by business unit
56,812
Emerging Markets 35%Nedbank 52%Property & Casualty 5%Old Mutual Wealth 5%US Asset Management 2%Other 1%
For more information on the business see
p61-62
For more information on the business see
p63-67
For more information on the business see
p68-69

Old Mutual plcAnnual Report and Accounts 2013
4
CHAIRMAN’SMESSAGE TO SHAREHOLDERS
2013 was a year of achievement for the Old Mutual Group.
activities, the key performance indicators by which we monitor progress and the main elements of our current strategy. This is intended to be helpful to you in gaining a good understanding of our major businesses and the opportunities that exist, throughout the Group, to grow value for both customers and shareholders.
We have also, this year, divided our Directors’ Remuneration Report into two sections: one of these sets out the Directors’ Remuneration Policy (which will be subject to a formal binding vote at least every three years) and the other is the Annual Report on Remuneration, which explains the directors’ remuneration in 2013 and how the policy will be implemented during 2014.
Responsible businessWe recognise that, in many markets in which we operate, we have a responsibility and opportunity to help customers at the lower end of the market to access appropriate financial services products that deliver value for them. Our approach, as a business with a long-term perspective, is to set and attain specific targets for our responsible business objectives. In this way, we provide a better service to our customers, supporting the communities in which we operate. Further details about our targets in this area are contained in our Responsible Business Report for 2013.
ConclusionWe are starting to see some signs of economic recovery, albeit that markets where the Group operates are growing at different rates. The current tapering of US quantitative easing is creating uncertainty and the wider consequences of this around the globe are, as yet, unpredictable. Macro factors such as this will affect our customers, but, as you will read from commentary specific to our individual businesses elsewhere in this Annual Report, we expect to see continued underlying strength in our core markets. Our strategy remains clear: it delivered value for our shareholders in 2013 and we have every expectation that it will continue to do so in the future.
Patrick O’Sullivan Chairman
Patrick O’SullivanCHAIRMAN
Overview of the year2013 was a year of achievement for the Old Mutual Group: we delivered substantial growth in our net client cash flows and funds under management; we reduced our level of gearing; and we made progress in relation to our strategy for growth, particularly in new markets in East and West Africa.
In South Africa, the exchange rate of the rand against sterling weakened by 27% over the year, which reduced our reported earnings in sterling from what they would otherwise have been. Our adjusted operating earnings per share were 18.4 pence, 5% higher than in 2012 but, if we exclude the effect of currency depreciation, up by 21% on a constant currency basis.
Group IFRS profit after tax from continuing operations was £980 million: this was 7% higher than in 2012 and 24% higher on a constant currency basis.
During the year we continued to execute our debt repayment programme and have now achieved our target, with total repayments of £1.7 billion. The Group now has a strong high quality balance sheet and levels of regulatory capital that should give comfort to all our stakeholders.
Board developments and Group employeesSince last year’s report, we have recruited three new independent non-executive directors to the Old Mutual plc Board, thereby widening the Board’s skills and experience, which will be invaluable as we continue to pursue our stated strategy. These appointments also brought the number of female Board members to four, which achieves, nearly two years early, the Davies target of at least 25% female representation. In December 2013, we announced that our Group Finance Director, Philip Broadley, would be leaving the Board during 2014. On behalf of the Board, I thank him for his major contribution to the Group over the past five years.
Our employees’ dedication and commitment to our values are exceptional. I would like to thank them for all they contribute, while embracing change with enthusiasm!
Changes to the structure of this year’s Annual ReportWe have restructured this year’s Annual Report, in line with recent developments in UK reporting practice. In our Strategic Review, we have set out an overview of the Group’s
5
Strategic report
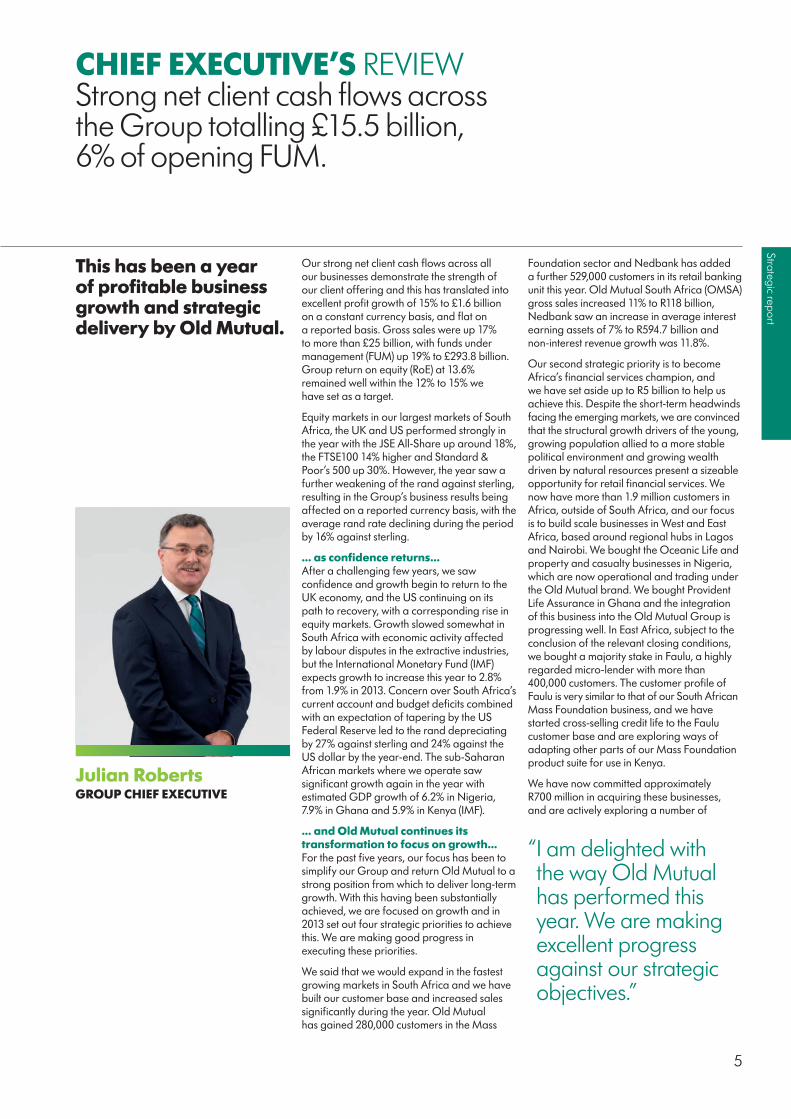
CHIEF EXECUTIVE’S REVIEWStrong net client cash flows across the Group totalling £15.5 billion, 6% of opening FUM.
This has been a year of profitable business growth and strategic delivery by Old Mutual.
Our strong net client cash flows across all our businesses demonstrate the strength of our client offering and this has translated into excellent profit growth of 15% to £1.6 billion on a constant currency basis, and flat on a reported basis. Gross sales were up 17% to more than £25 billion, with funds under management (FUM) up 19% to £293.8 billion. Group return on equity (RoE) at 13.6% remained well within the 12% to 15% we have set as a target.
Equity markets in our largest markets of South Africa, the UK and US performed strongly in the year with the JSE All-Share up around 18%, the FTSE100 14% higher and Standard & Poor’s 500 up 30%. However, the year saw a further weakening of the rand against sterling, resulting in the Group’s business results being affected on a reported currency basis, with the average rand rate declining during the period by 16% against sterling.
… as confidence returns…After a challenging few years, we saw confidence and growth begin to return to the UK economy, and the US continuing on its path to recovery, with a corresponding rise in equity markets. Growth slowed somewhat in South Africa with economic activity affected by labour disputes in the extractive industries, but the International Monetary Fund (IMF) expects growth to increase this year to 2.8% from 1.9% in 2013. Concern over South Africa’s current account and budget deficits combined with an expectation of tapering by the US Federal Reserve led to the rand depreciating by 27% against sterling and 24% against the US dollar by the year-end. The sub-Saharan African markets where we operate saw significant growth again in the year with estimated GDP growth of 6.2% in Nigeria, 7.9% in Ghana and 5.9% in Kenya (IMF).
… and Old Mutual continues its transformation to focus on growth…For the past five years, our focus has been to simplify our Group and return Old Mutual to a strong position from which to deliver long-term growth. With this having been substantially achieved, we are focused on growth and in 2013 set out four strategic priorities to achieve this. We are making good progress in executing these priorities.
We said that we would expand in the fastest growing markets in South Africa and we have built our customer base and increased sales significantly during the year. Old Mutual has gained 280,000 customers in the Mass
Foundation sector and Nedbank has added a further 529,000 customers in its retail banking unit this year. Old Mutual South Africa (OMSA) gross sales increased 11% to R118 billion, Nedbank saw an increase in average interest earning assets of 7% to R594.7 billion and non-interest revenue growth was 11.8%.
Our second strategic priority is to become Africa’s financial services champion, and we have set aside up to R5 billion to help us achieve this. Despite the short-term headwinds facing the emerging markets, we are convinced that the structural growth drivers of the young, growing population allied to a more stable political environment and growing wealth driven by natural resources present a sizeable opportunity for retail financial services. We now have more than 1.9 million customers in Africa, outside of South Africa, and our focus is to build scale businesses in West and East Africa, based around regional hubs in Lagos and Nairobi. We bought the Oceanic Life and property and casualty businesses in Nigeria, which are now operational and trading under the Old Mutual brand. We bought Provident Life Assurance in Ghana and the integration of this business into the Old Mutual Group is progressing well. In East Africa, subject to the conclusion of the relevant closing conditions, we bought a majority stake in Faulu, a highly regarded micro-lender with more than 400,000 customers. The customer profile of Faulu is very similar to that of our South African Mass Foundation business, and we have started cross-selling credit life to the Faulu customer base and are exploring ways of adapting other parts of our Mass Foundation product suite for use in Kenya.
We have now committed approximately R700 million in acquiring these businesses, and are actively exploring a number of
“ I am delighted with the way Old Mutual has performed this year. We are making excellent progress against our strategic objectives.”
Julian RobertsGROUP CHIEF EXECUTIVE
Old Mutual plcAnnual Report and Accounts 2013
6
CHIEF EXECUTIVE’S REVIEWcontinuedImproved collaboration between Old Mutual, Nedbank and Mutual & Federal.
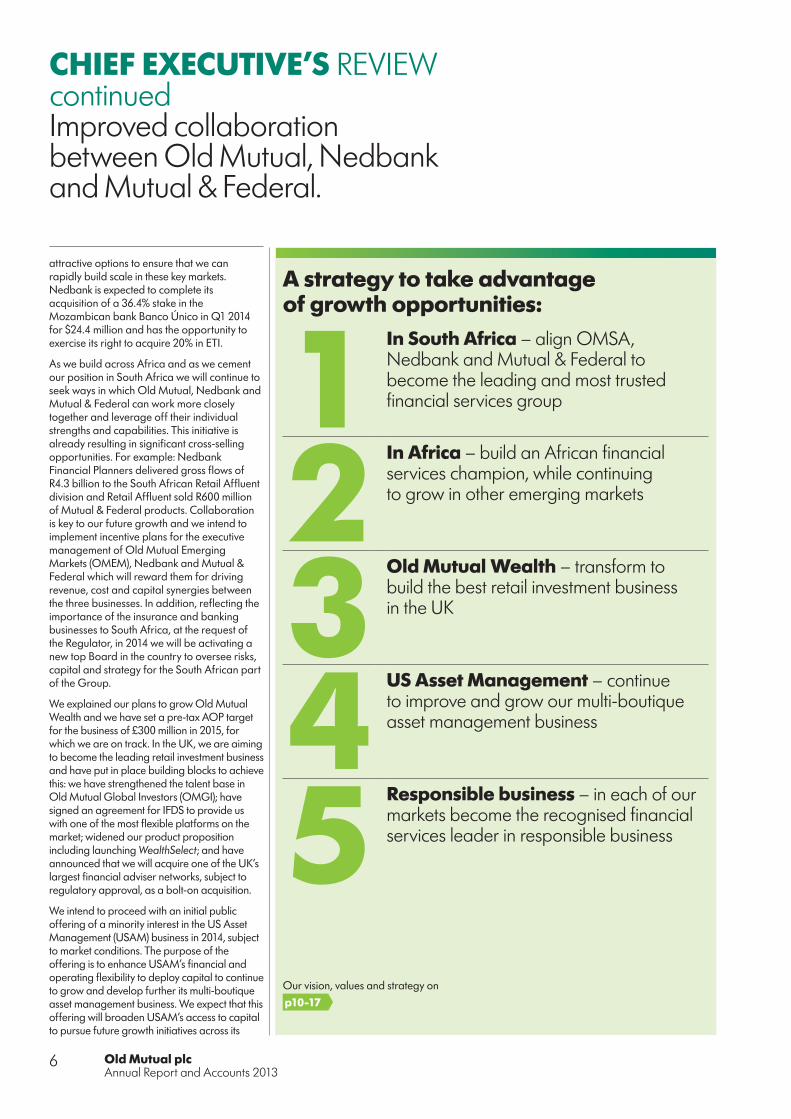
A strategy to take advantage of growth opportunities:
1In South Africa – align OMSA, Nedbank and Mutual & Federal to become the leading and most trusted financial services group
2In Africa – build an African financial services champion, while continuing to grow in other emerging markets
3Old Mutual Wealth – transform to build the best retail investment business in the UK
4US Asset Management – continue to improve and grow our multi-boutique asset management business
5Responsible business – in each of our markets become the recognised financial services leader in responsible business
attractive options to ensure that we can rapidly build scale in these key markets. Nedbank is expected to complete its acquisition of a 36.4% stake in the Mozambican bank Banco Único in Q1 2014 for $24.4 million and has the opportunity to exercise its right to acquire 20% in ETI.
As we build across Africa and as we cement our position in South Africa we will continue to seek ways in which Old Mutual, Nedbank and Mutual & Federal can work more closely together and leverage off their individual strengths and capabilities. This initiative is already resulting in significant cross-selling opportunities. For example: Nedbank Financial Planners delivered gross flows of R4.3 billion to the South African Retail Affluent division and Retail Affluent sold R600 million of Mutual & Federal products. Collaboration is key to our future growth and we intend to implement incentive plans for the executive management of Old Mutual Emerging Markets (OMEM), Nedbank and Mutual & Federal which will reward them for driving revenue, cost and capital synergies between the three businesses. In addition, reflecting the importance of the insurance and banking businesses to South Africa, at the request of the Regulator, in 2014 we will be activating a new top Board in the country to oversee risks, capital and strategy for the South African part of the Group.
We explained our plans to grow Old Mutual Wealth and we have set a pre-tax AOP target for the business of £300 million in 2015, for which we are on track. In the UK, we are aiming to become the leading retail investment business and have put in place building blocks to achieve this: we have strengthened the talent base in Old Mutual Global Investors (OMGI); have signed an agreement for IFDS to provide us with one of the most flexible platforms on the market; widened our product proposition including launching WealthSelect; and have announced that we will acquire one of the UK’s largest financial adviser networks, subject to regulatory approval, as a bolt-on acquisition.
We intend to proceed with an initial public offering of a minority interest in the US Asset Management (USAM) business in 2014, subject to market conditions. The purpose of the offering is to enhance USAM’s financial and operating flexibility to deploy capital to continue to grow and develop further its multi-boutique asset management business. We expect that this offering will broaden USAM’s access to capital to pursue future growth initiatives across its
Our vision, values and strategy on
p10-17

7
Strategic report
business, including collaborative investments in affiliate growth and further penetration of non-US markets through its global distribution platform, as well as strategic partnerships with high quality boutique asset management firms with complementary investment products.
… while remaining financially strong and cash generative We have a strong balance sheet with a low level of indebtedness. In 2013, we completed our £1.7 billion debt repayment programme through the purchase of £176 million of outstanding debt. The Group, excluding Nedbank, had gross IFRS debt of £1.3 billion at 31 December 2013. We continue to generate strong cash returns which give us the ability to continue to invest for growth and remain strongly capitalised while maintaining a progressive dividend.
Emerging Markets continues its growth trajectory…The Emerging Markets business as a whole saw good growth in the year, with gross sales up 9% to R165 billion. NCCF improved by 52% to R24.7 billion, with FUM up 16% to R838 billion. Pre-tax AOP on an IFRS basis was up 12% to R8.9 billion.
OMEM’s successful performance was underpinned by a focus on understanding and meeting our customers’ needs. We introduced new offerings in our markets, including: the Old Mutual Wealth proposition in South Africa, which was launched in September and in its first six months of operations reached R1 billion of FUM; XtraMAX, a structured investment product in South Africa; a mobile phone operated transactional money account in Namibia; and a personal pension plan in Kenya. We also boosted the number of agents we have. In Kenya, we now have approximately 600 agents; since acquiring AIVA in Latin America, we have recruited a further 460 agents; in the Mass Foundation business we have grown our adviser numbers to 4,160 from 3,750 last year. Product innovation and customer service remain critical for the success of our business and will continue to be a key focus for our employees.
In Old Mutual South Africa, strong sales across the business were largely driven by product innovation. In Retail Affluent, non-covered sales were up 22% due to strong demand for our Galaxy and unit trust products, and covered sales increased by 9%, with a particularly strong performance in single premium sales, up 28%, largely into XtraMAX. The Mass Foundation
segment maintained its growth path with gross sales up 14%, primarily due to a larger adviser force, and profits were also up by 14%. We maintain a tight grip on the quality of the new business we are writing, for example, by enhancing new business submission standards and have introduced various retention initiatives.
Gross Corporate sales were up 17% mainly due to excellent growth in single premium business. Old Mutual Investment Group (OMIG) saw good flows into equity boutiques, however sales as a whole declined 7% against 2012 which was a particularly strong year.
Old Mutual Finance, our 50% joint venture, continues to have a conservative approach to lending and we have maintained collection rates on our active portfolio of more than 90%. We maintain a tight focus on unsecured credit and have strict underwriting criteria.
In Africa (excl. SA), we saw excellent growth in covered sales, up 17%, as we secured large corporate deals in Namibia, growth in Retail Affluent sales in Kenya and the inclusion of Nigeria for the first time. Non-covered sales decreased by 14%, mainly due to the exclusion of Kenya broker flows in 2013 and lower institutional sales in Namibia.
In Latin America and Asia, profits were up 80% boosted by favourable exchange rates, a reallocation of central expenses and the first time inclusion of AIVA profits in 2013.
Overall Emerging Markets non-covered sales for the period were flat at R116 billion reflecting the reclassification of Asia sales from non-covered to covered and the strong performance of the comparative period.
We have set out a number of clear targets for the Emerging Markets business. We are aiming to grow our customer base to at least 9 million by 2015, maintain our RoE target between 20% to 25%, and have the profits from Africa (excl. SA), including Property & Casualty, reaching 15% of South African profits by 2015. As part of our plan to achieve this, we are exploring a number of options in both East and West Africa which will allow us to build the scale that we believe we need in these key markets.
… Nedbank produces another year of increased profit…Nedbank produced another set of excellent results, with headline earnings up 15.9% to R8.7 billion driven by good revenue growth, impairments increasing at a slower rate than
net interest income and disciplined expense management. Non-interest revenue saw growth of 11.8% to R19.4 billion and net interest income increased by 7.8% to R21.2 billion. The credit loss ratio for the year was 1.06%, up slightly from last year (1.05%) which was expected given the economic climate, more conservative provisioning and a single large impairment recorded by the business banking division. Nedbank remains well capitalised with the Basel III common-equity Tier 1 ratio at 12.5%.
… while the environment remains challenging for Property & Casualty…The tough conditions we have seen for Property & Casualty insurance continued into the second half of 2013, as the industry in South Africa as a whole suffered from weather-related losses in the last quarter, drought conditions affected our Agriculture underwriting results in the first half, and a continued soft market especially in motor. These conditions contributed to a disappointing underwriting loss of R437 million. Gross written premiums grew by 16.6% in the year, with strong growth of 36.7% in the Corporate & Niche segment due to the new Treaty Inwards business. In iWYZE, we saw solid growth in gross written premiums of 10.8% and a significant improvement in the claims ratio.
The new management team has a clear plan to address the challenges that the business faces. We are confident that following the implementation of the plan we will meet our published targets but acknowledge that it will take time for this to come through in the business’ financial results. By 2016, we expect this business to have a sustainable top 2 position in the South African market; to have built significant operations in the major markets in Africa; to maintain an RoE of 15% to 20% through the cycle; and with an underwriting margin of 4% to 6%.
… Old Mutual Wealth delivers operational growth and strategic transformation…It was a significant year for Old Mutual Wealth with the changes following the implementation of the long awaited Retail Distribution Review (RDR), with significant progress made in the strategy to build the leading retail investment business in the UK, and developing new customer propositions, all alongside a strong operational performance. Profits were up 11% on the prior year to £217 million. The 2012 total included additional exceptional policyholder tax benefits of £22 million and
Old Mutual plcAnnual Report and Accounts 2013
8
£13 million of profit from the now sold Finnish business. Excluding these items, the underlying profit was up by 36%, from £160 million.
Gross sales for the year were up 24%, with all core businesses contributing to the uplift. NCCF was up 15% on the prior year as we saw strong sales on the UK Platform, by OMGI, and through our International business. As a result of the strong NCCF and an uplift in equity markets, FUM increased by 13% to £78.5 billion.
In the UK, the Platform recorded NCCF of £2.4 billion, which was a particularly good performance given the challenging start to the year with the introduction of RDR. Confidence amongst advisers has returned and we have seen good sales across the collective investment products and ISA products, leading to a strong fourth quarter. FUM on the Platform now stands at £27.3 billion, up 21% on the prior year, and contributing to the increase in profits from £2 million last year to £13 million in 2013. Importantly, gross new business sales on the Platform into OMGI funds were 16% at the end of 2013. The Platform was recognised as the ‘Best Platform’ at the Professional Advisers Awards.
Our International cross-border business had NCCF of £0.5 billion, up 150% on the prior year, predominantly due to new product launches and improved sales in South Africa. Sales in Hong Kong and Europe were also much improved and sales in Latin America have developed well with the acquisition of AIVA, which saw some large single premium business towards the end of the year.
We have strengthened the OMGI asset management capabilities in UK equities and this, combined with continued strong investment performance, led to NCCF for the year of £0.7 billion, up from £0.3 billion in 2012. NCCF from UK third parties reached £1.3 billion, against £0.1 billion in 2012. We saw further Nordic outflows, which were anticipated following the sale of the Nordic business in 2012, totalling £1.0 billion. We expect the final £200 million of Nordic outflows in 2014. We continue to look to broaden our investment styles where appropriate.
In 2012, we outlined our plans for transforming Old Mutual Wealth into the leading retail investment business in the UK and we have taken a number of significant strides in this respect. It is now operating under one reporting
structure and management team and this year all businesses will be rebranded from Skandia to Old Mutual Wealth.
A key pillar of our strategy was to strengthen our asset management offering. We have brought in a new UK equities team and will look to strengthen our teams in other asset classes where necessary. We have launched a new proposition to the market – WealthSelect, which provides financial advisers with the most comprehensive range of portfolio management solutions in the market. During the year we continued to embed Wealth Interactive, our cross-border international platform, and we signed an outsourcing arrangement with IFDS which will transform our platform into one of the most flexible in the market, with associated transformation costs of approximately £140 million over the next three years after £20 million of costs have already been incurred.
We have announced that we are purchasing Intrinsic Financial Services Limited (‘Intrinsic’), one of the largest adviser networks in the UK with 3,000 advisers, both restricted and independent. We believe that the provision of advice is of fundamental and growing importance in the retail financial services market and that restricted advice will become more dominant in time. The purchase of Intrinsic is a critical part of our strategy of creating a leading wealth management business that combines financial advice, investment solutions and high quality asset management to deliver first class outcomes for our customers.
… and US Asset Management maintains its momentumThe excellent first six months of 2013 continued into the second half of the year translating into profit and margin growth and sustained positive NCCF. Profits at $174 million increased by 21% on the prior year’s reported result and NCCF at $16.3 billion, represented 7.8% of the opening FUM, with our Global Distribution team accounting for approximately a quarter of NCCF. Net flows were highly diversified with six out of our eight affiliates recording positive or flat flows. FUM stands at $257.4 billion, 23% higher than the prior year due to a combination of the strong net flows and positive market movements.
We are playing our part in the communities where we operate…We recognise that we have an impact on the societies in which we operate. Secure,
transparent and affordable financial products are at the heart of a strong and thriving society, and that is what we seek to provide to all of our customers. Our products and services are key to a sustainable economy, and often serve the lower income groups of society.
In our markets we support economic development and society as a whole in a number of ways. In South Africa, we signed an R80 million deal that will fund the development and operations of four low-fee independent schools over the next five years and are set to reach 4,100 pupils. This deal is the third of its kind for the Schools Investment Fund, a fund established by the Public Investment Corporation (PIC), the Government Employees Pension Fund (GEPF) and Old Mutual to address the shortage of quality affordable schools in South Africa. In all our businesses we work through our employees and directly with community partners to support projects and in 2013 we spent £16.1 million across the Group in community investment programmes.
We are committed to monitoring, managing and reducing our environmental impact and as part of this we will be adopting non-financial targets that support our Responsible Business strategy. These will be communicated in our Responsible Business report to be published at the beginning of April.
… and ensuring we are always focused on the customer…We can only be successful with the continued support and trust of our customers. Ensuring that we treat them fairly and provide them with the products, returns and service levels they expect from an institution to which they entrust their savings is critical. It is why we spend significant resources making the customer the central focus of our company. We have made significant progress in this regard, in particular in enhancing our customer insights and improving and expanding our product range.
In the past year we have taken a number of further steps by, for example, improving our proposition: through the launch of Old Mutual Wealth in South Africa and enhancing our distribution in Kenya via the acquisition of Faulu. We have made our products more accessible by: expanding Old Mutual Finance’s branch footprint to 225 and by launching new world solutions such as Nedbank’s app suite and the I-invest mobile unit trust savings product in Kenya. We have improved the customer feedback capability in each geography where we are present, and
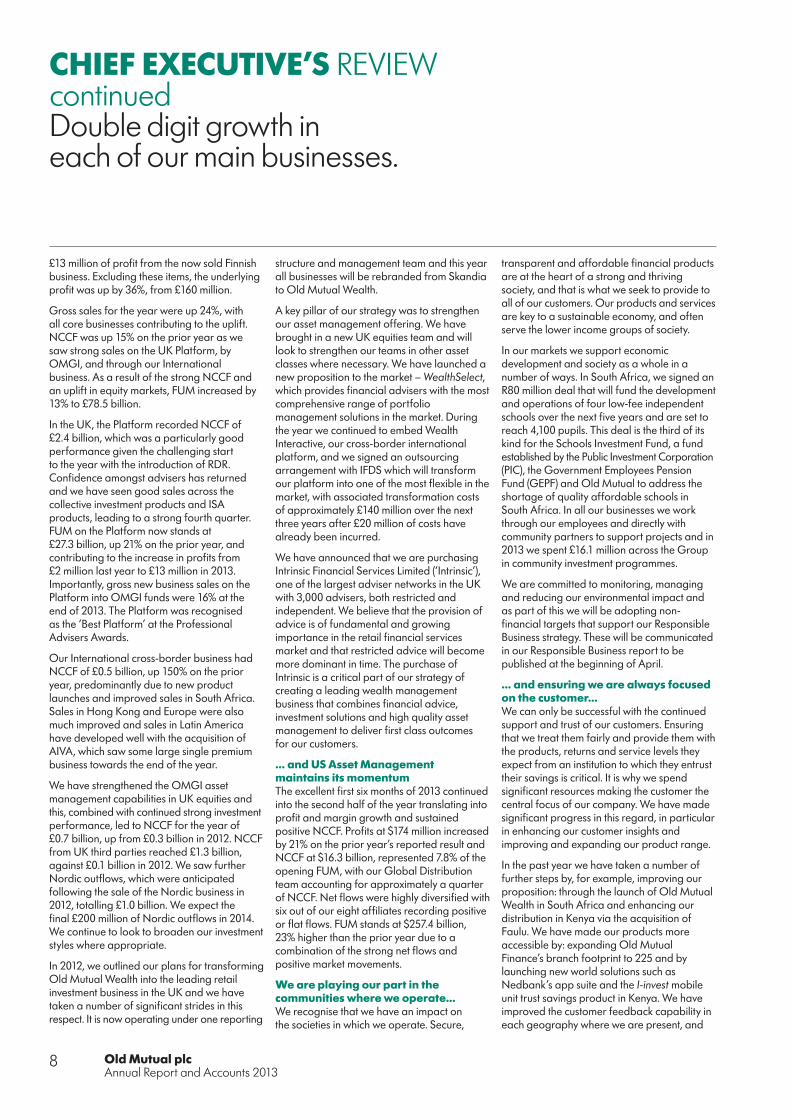
CHIEF EXECUTIVE’S REVIEWcontinuedDouble digit growth in each of our main businesses.

9
Strategic report
we have seen a steady improvement in our Net Promoter Score, which is a customer loyalty metric.
… while building a strong, responsible culture within Old MutualEmbedding the right culture and values in the organisation is similarly important. As part of this process, senior management are formally assessed to ensure that they demonstrate the Company’s desired values and a proportion of their remuneration is dependent on this.
Senior management receive specific feedback via a 360 degree process to understand their strengths and where they need to develop in terms of these behaviours. Our leadership development programmes help to develop the mindset and skills needed. For employees at all levels we have training and recognition schemes focused on instilling the behaviours we want to encourage. These form part of our induction of new employees and we ask every person each year via a culture and values survey to describe the values and behaviours they see in the way the Company operates. We use this feedback to identify actions to continually align the way we do things with our values.
Our strong cash generation and capital position supports a 16% increase in dividendThe Board has considered the position in respect of the final dividend for 2013 and is recommending the payment of a final dividend for 2013 of 6.0p per ordinary share (or its equivalent in other applicable currencies). Based on this recommendation the full-year ordinary dividend would be 8.1p, a 16% increase on the prior year. No scrip dividend alternative will be available in relation to this dividend.
Dividend policyThe Board intends to pursue a progressive dividend policy consistent with our strategy, having regard to overall capital requirements, liquidity and profitability, and targeting a dividend cover in the range of 2.0 to 2.25 times IFRS AOP earnings in future. Interim dividends will continue to be set at about 30% of the prior year’s full ordinary dividend.
Board changesWe were pleased to welcome Dr Nkosana Moyo, Zoe Cruz and Adiba Ighodaro to the Board as independent non-executive directors. Dr Moyo is the Executive Chairman of the Mandela Institute for Development Studies, and was previously Vice President and Chief
Operating Officer of the African Development Bank and Managing Partner of the African business of Actis Capital, an emerging markets investment firm. Ms Cruz was previously Co-President for Institutional Securities and Wealth Management at Morgan Stanley with responsibility for running major revenue generating businesses there, including overseeing their securities risk management and information technology. She also founded and ran her own investment management firm, Voras Capital Management. Ms Ighodaro is currently a partner with Actis. Before joining Actis she was Head of West Africa for the Commonwealth Development Corporation.
Dr Moyo is a member of the Group Audit and Remuneration Committees; Ms Cruz is a member of the Risk and Remuneration Committees; and Ms Ighodaro is a member of the Audit Committee.
Bongani Nqwababa resigned as an independent non-executive director of the Company on 6 January 2014.
Philip Broadley, Group Finance Director of Old Mutual since November 2008, has notified the Group of his intention to leave in 2014. Mr Broadley has played a critical role in the transformation of Old Mutual and leaves a much simpler and more resilient business, focused on meeting customers’ needs and with a clear strategy for growth. We are currently conducting a thorough internal and external search for Mr Broadley’s successor.
South African empowermentWe continue to transform our business in South Africa, with Old Mutual South Africa and Nedbank maintaining their level 2 accreditation for B-BBEE using the new Financial Sector Code.
OutlookWe have a clear strategy and clear priorities which we are focused on achieving. While the external environment is likely to remain uncertain, and in particular the impact of the movement of the rand on our reported results, we believe that the long-term structural growth trends in Africa and strong demand for banking, protection and savings products remain intact and will continue to drive sustainable and profitable growth for Old Mutual.

Old Mutual plcAnnual Report and Accounts 2013
10
OUR VISION
TO BECOME OUR CUSTOMERS’ MOST TRUSTED PARTNER – PASSIONATE ABOUT HELPING THEM ACHIEVE THEIR LIFETIME FINANCIAL GOALS
OUR STRATEGY
GROWING AND TRANSFORMING OUR BUSINESSES TO LEAD IN A RESPONSIBLE AND SUSTAINABLE WAY
1In South Africa – align OMSA, Nedbank and Mutual & Federal to become the leading and most trusted financial services group
2In Africa – build an African financial services champion, while continuing to grow in other emerging markets
3Old Mutual Wealth – transform to build the best retail investment business in the UK
4US Asset Management – continue to improve and grow our multi-boutique asset management business
5Responsible business – in each of our markets become the recognised financial services leader in responsible business
OUR VALUES
ACCOUNTABILITY, INTEGRITY, RESPECT, PUSHING BEYOND BOUNDARIES
OUR VISION, STRATEGY AND VALUES

11
Strategic report
IN SOUTH AFRICA – ALIGN OMSA, NEDBANK AND MUTUAL & FEDERAL TO BECOME THE LEADING AND MOST TRUSTED FINANCIAL SERVICES GROUP 1In South Africa we will be the leading and most trusted financial services group through driving increased alignment between our strong and complementary businesses.
Building on a strong baseA large customer base – OMSA, Nedbank and Mutual & Federal have a combined base of 11 million retail customers and are best positioned to benefit from the rapid growth in South Africa’s retail mass market.
Strong brands and extensive distribution – Our South African businesses have strong, longstanding and trusted brands and have access to powerful, extensive and fast growing distribution engines.
Synergistic world class competencies – Nedbank brings world-class competencies in progressive digital and mobile technologies and capital management, while OMSA brings leading capabilities in serving the retail mass market and in alternative asset management.
An engaged workforce – Our businesses have healthy organisational cultures and high levels of employee engagement, with OMSA being the top-ranked large company in the esteemed 2013 Deloitte Best Large Company to Work For Survey.
A recognised leader in social transformation – OMSA and Nedbank are the most socially transformed financial services companies in South Africa, with Nedbank also seen as leading in environment management. Nedbank and OMSA both achieved Level 2 DTI transformation status for the fourth consecutive year, and both businesses are recognised by the NGO community as leaders in community development.
Priorities for 2014: accelerate alignmentDrive greater strategic alignment between our South African businesses, for greater operational and customer-facing co-operation and co-ordination.
Increase cross-selling through jointly serving the OMSA, Nedbank and Mutual & Federal customer bases with innovative propositions, and tailored customer loyalty programmes.
Leverage our combined distribution power through jointly developing our digital capability and increasing the degree to which our businesses leverage each other’s distribution channels.
Increase efforts to share skills and experience between our businesses, particularly OMSA’s expertise in insurance, asset management and serving the retail mass market, Nedbank’s expertise in banking, capital management, digital channels and approach to sustainability, and Mutual & Federal’s capability in general insurance.
Drive further efficiency improvements through increasing joint procurement, and sharing of assets, resources and technology among our South African businesses.
Lead in Responsible Business by co-ordinating OMSA, Nedbank and Mutual & Federal’s sustainability efforts to create South Africa’s most responsible financial services group.
Progress towards identifying and realising synergies of circa R1.0 billion through tapping into the opportunities outlined above.
Key focus area – leveraging our combined customer base to realise synergies
OMSANedbank
15%*
Mutual & Federal
* Percentage of OMSA and Mutual & Federal customers with a Nedbank account
Old Mutual plcAnnual Report and Accounts 2013
12
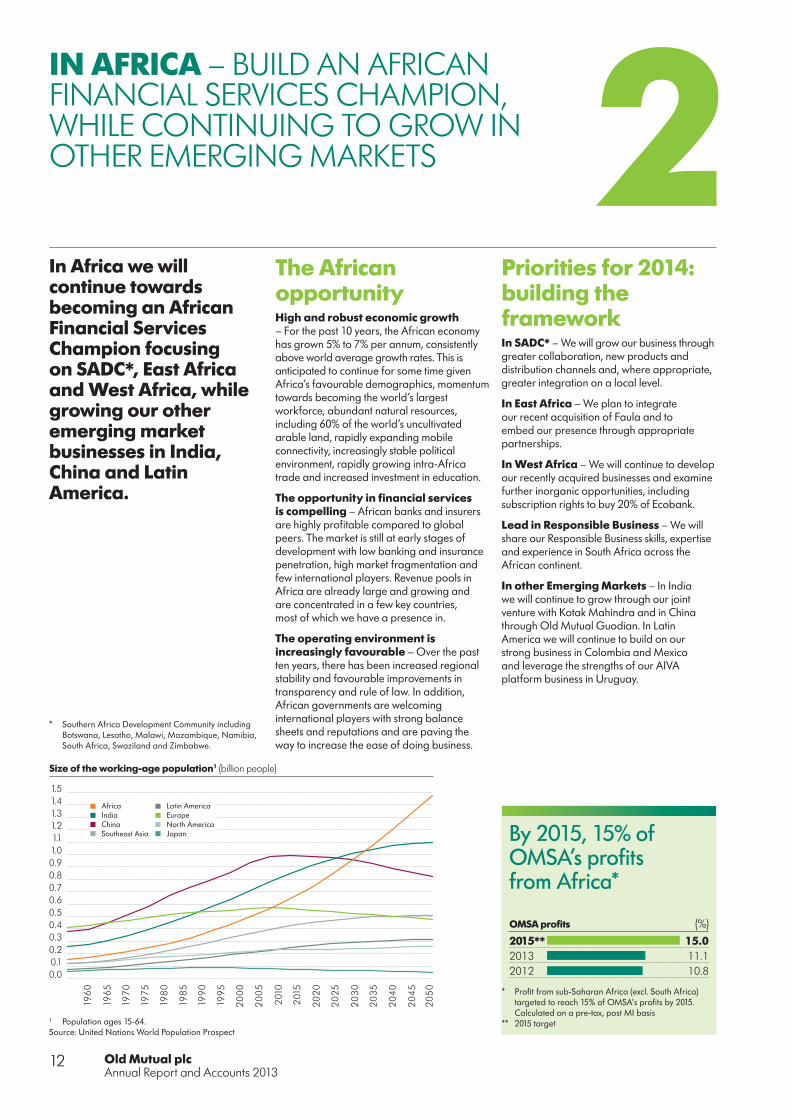
IN AFRICA – BUILD AN AFRICAN FINANCIAL SERVICES CHAMPION, WHILE CONTINUING TO GROW IN OTHER EMERGING MARKETS 2In Africa we will continue towards becoming an African Financial Services Champion focusing on SADC*, East Africa and West Africa, while growing our other emerging market businesses in India, China and Latin America.
The African opportunityHigh and robust economic growth – For the past 10 years, the African economy has grown 5% to 7% per annum, consistently above world average growth rates. This is anticipated to continue for some time given Africa’s favourable demographics, momentum towards becoming the world’s largest workforce, abundant natural resources, including 60% of the world’s uncultivated arable land, rapidly expanding mobile connectivity, increasingly stable political environment, rapidly growing intra-Africa trade and increased investment in education.
The opportunity in financial services is compelling – African banks and insurers are highly profitable compared to global peers. The market is still at early stages of development with low banking and insurance penetration, high market fragmentation and few international players. Revenue pools in Africa are already large and growing and are concentrated in a few key countries, most of which we have a presence in.
The operating environment is increasingly favourable – Over the past ten years, there has been increased regional stability and favourable improvements in transparency and rule of law. In addition, African governments are welcoming international players with strong balance sheets and reputations and are paving the way to increase the ease of doing business.
Priorities for 2014: building the framework In SADC* – We will grow our business through greater collaboration, new products and distribution channels and, where appropriate, greater integration on a local level.
In East Africa – We plan to integrate our recent acquisition of Faula and to embed our presence through appropriate partnerships.
In West Africa – We will continue to develop our recently acquired businesses and examine further inorganic opportunities, including subscription rights to buy 20% of Ecobank.
Lead in Responsible Business – We will share our Responsible Business skills, expertise and experience in South Africa across the African continent.
In other Emerging Markets – In India we will continue to grow through our joint venture with Kotak Mahindra and in China through Old Mutual Guodian. In Latin America we will continue to build on our strong business in Colombia and Mexico and leverage the strengths of our AIVA platform business in Uruguay.
0.00.10.20.30.40.50.60.70.80.91.01.11.21.31.41.5
Size of the working-age population1 (billion people)
196
0
196
5
197
0
197
5
198
0
198
5
199
0
199
5
20
00
20
05
201
0
201
5
20
20
20
25
20
30
20
35
20
40
20
45
20
50
AfricaIndiaChinaSoutheast Asia
Latin AmericaEuropeNorth AmericaJapan By 2015, 15% of
OMSA’s profits from Africa*
2015**20132012
15.011.110.8
(%)OMSA profits
1 Population ages 15-64.Source: United Nations World Population Prospect
* Southern Africa Development Community including Botswana, Lesotho, Malawi, Mozambique, Namibia, South Africa, Swaziland and Zimbabwe.
* Profit from sub-Saharan Africa (excl. South Africa) targeted to reach 15% of OMSA’s profits by 2015. Calculated on a pre-tax, post MI basis
** 2015 target

13
Strategic report
3OLD MUTUAL WEALTH – TRANSFORM TO BUILD THE BEST RETAIL INVESTMENT BUSINESS IN THE UK
We are transforming Old Mutual Wealth by building a modern, retail investment and asset management business.
Making good progressWe have simplified our business and continue to focus on our core markets. As a result, we have agreed the sale of our business in Poland.
We have launched the OMGI brand and significantly strengthened our asset management capability including key new appointments.
We have become fully RDR compliant and simplified our charging structures.
We have improved platform profitability by reducing costs in the business.
We have revitalised our protection range, with positive industry reviews and strong early sales.
Priorities for 2014: transformation Build one business – With a shared vision of becoming the UK’s best retail investment business, and move to one brand in 2014.
Move to profitable platforms – 2014 will be a critical year in building our new UK IT platform which will improve our proposition and continue to reduce operating costs. We will also migrate our International business onto its completed IT platform, improving flexibility and service for advisers and end clients.
Build an outstanding asset management business – We will continue to build on the strong momentum of 2013, currently ranking as No. 2 in net retail asset management flows in the UK.
Expand our offering of investment and protection products – We have launched WealthSelect in February 2014 and expect to see significant uptake as it provides clients access to top funds at best prices.
Enhance multi-channel distribution – We will build upon our acquisition of Intrinsic and continue to build a strong digital capability, to introduce new functionality both for advisers and clients.
Improve profitability and maintain service levels in heritage books – We will continue to drive strong performance from our heritage books.
Lead in Responsible Business – Particularly with respect to Responsible investment.
CASE STUDY
Innovative Customer Solutions
This year, the annual Group Customer Conference focused on senior Customer Champions, with each business unit discussing their approaches to customer service. Short sessions on progress and challenges were shared across the Group, with Anthony Scammell, Head of Customer Experience for Old Mutual Wealth UK (pictured), discussing ‘Customer CaSanoVa’s’. This project, launched
in 2012, utilises employee champions to deliver a response and resolution time of 24 hours to deal with customer issues. In its first year, the approach had an 83% success rate, and in 2013 was shortlisted under the ‘Customer Satisfaction Innovation of the Year’ category in the UK Customer Satisfaction Awards by the Institute of Customer Service. The initiative empowers employees who act as CaSanoVa’s to develop their own approach to dealing with issues.
We are making strong progress towards our 2015 profit* target of £300 million
* Pre-tax adjusted operating profit
20152013
300217
(£m)Profit

Old Mutual plcAnnual Report and Accounts 2013
14
4US ASSET MANAGEMENT – CONTINUE TO IMPROVE AND GROW OUR MULTI-BOUTIQUE ASSET MANAGEMENT BUSINESS
In the US we will continue to improve and grow our multi-boutique asset management business.
We have built strong momentum since 2010Rationalised our portfolio – We have completed a significant affiliate portfolio restructuring, launched several affiliate growth initiatives and are building out the international distribution platform.
Positive net flows – We achieved sustained positive net client cash flows and strong long-term investment performance.
Improved profitability – Adjusted Operating Profit (AOP) and operating margin are both continuing to grow strongly. We have achieved margin expansion from our profit share model and from lower expense growth.
Established a portfolio of leading affiliates – which gives us a diversified and attractive product portfolio.
Priorities for 2014: continue to improve and growDrive organic growth in our affiliates.
Generate collaborative growth through new product and channel initiatives and seed capital.
Enhance growth through complementary international distribution.
Continue to seek selective acquisitions to augment the portfolio and fill product and asset class gaps.
Continue to consider Responsible Business practices in each element of our business strategy.
CASE STUDY
Responsible investment workshops
During 2013, US Asset Management conducted a number of training and education sessions with our Affiliates on Responsible investment initiatives, led by Jon Duncan from Old Mutual Investment Group (pictured). These sessions included a workshop with a particular focus on the United Nations supported Principles for Responsible Investing, linking to Old Mutual Group activities, who were the main sponsor for this event in 2013. The workshops were attended by a range of individuals from across the US and beyond and reflect the growing interest in the topic from clients and competitors alike.
Annual target: net client cash inflows of 3% to 5% of opening FUM

15
Strategic report
5RESPONSIBLE BUSINESS – IN EACH OF OUR MARKETS BECOME THE RECOGNISED FINANCIAL SERVICES LEADER IN RESPONSIBLE BUSINESS
In each of our markets we will increasingly position and differentiate ourselves as the leader in Responsible Business, making explicit a way of behaving that flows naturally from our core values.
In conclusionBy growing and transforming our businesses, we are confident that we will continue to deliver attractive earnings growth, a return on equity in the range of 12% to 15% and a strong balance sheet, as well as continue our progressive dividend policy for the period 2014 – 2016.
Responsible to our customers Putting the customer first in everything we do.
Responsible investment Systematic incorporation of material environmental, social and governance criteria in our investment and ownership decisions.
Responsible to our employees Building a culture of excellence which our employees are proud to be part of.
Responsible to our communities Providing sustainable, tailored and meaningful support to the communities in which we operate.
Responsible environmental management Helping to monitor, manage and reduce our direct and indirect environmental impacts.
Priorities for 2014: five pillars of Responsible Business
We are already leading in South AfricaIn South Africa, OMSA and Nedbank are the recognised leaders in community investment and Nedbank in environmental management, with OMSA having been voted the most trustworthy name in the life assurance category and Nedbank the leader in Corporate Social Investment (Sunday Times Top 100).
Being a Responsible Business is core to our valuesOur annual Culture Survey results show that our employees ranked accountability as the number one current as well as desired organisational value and also as their top personal value in every one of our core businesses. It was also ranked as the top value across our Old Mutual Leadership Group.
Accountability ranking
Personal value
Current values
Desiredvalues
Old Mutual Leadership Group #1 #1 #1
Gender diversity targets
Gender diversity across the Group
Women in… 2013 (Actual) 2018 (Target)
Board33%
(at Jan 2014)More than
30%
Key Roles* 15% 30%
* Key Roles are approximately the top 120 executive positions around the Group
Our long-term competitive advantage is reinforced by our unique positioning in key growth markets, our clear and focused strategy to access these opportunities and our group-wide and proven culture of delivery. We are further differentiated by our responsible and sustainable approach to
business and our integral value of accountability. Building on this, we are confident that Old Mutual will continue to deliver value to all our stakeholders – employees, customers, communities, the environment and shareholders – now and in the long-term future.

Old Mutual plcAnnual Report and Accounts 2013
16
OUR BIG 5 PRIORITIES FROM 2009 TO 2013 HAVE CONSISTENTLY GUIDED OUR EFFORTS TOWARDS SIMPLIFICATION AND FOCUSED LONG-TERM GROWTH
2009 – 2013Progress on our strategy in 2013 Key metric
Develop the customer proposition and experience
■ Launch of new Wealth proposition in OMSA ■ Expansion of Old Mutual Finance branch footprint to over
200 branches ■ RDR compliant platform established in the UK ■ Improved, more flexible investment platform for cross-border
business in Singapore and UK (Wealth Interactive) ■ Launch of Nedbank appsuite and approve-it mobile solution ■ Acquisition of Faulu micro-lending capability in Kenya ■ Roll out of I-invest mobile investment solution in Kenya ■ Customer feedback loops established in every geography with
improved Customer insight and a steady improvement in NPS (net promoter score) in most business units
20132012201120102009
5.91.9
-3.9-2.5-0.7
(%)NCCF/FUM
Deliver high performance in all business units
■ Continued strong growth in Nedbank with strong improvement in NIR ■ Continued strong growth in Emerging Markets – from Retail and
Corporate, supplemented by substantial progress in Africa and Latin America
■ Strong increase in profitability and gross sales in Old Mutual Wealth, successfully adapted to Retail Distribution Review (RDR), continued to build asset management capabilities and managed costs down
■ Sustained improvement in USAM with NCCF very strong across a broad range of asset classes driven by continued strong long-term investment performance
20132012201120102009
18.417.515.714.311.6
(p)AOP Earnings per Share
Increase collaboration among key businesses
■ Joint telecoms infrastructure procurement by OMSA, Nedbank and Mutual & Federal, resulting in significant savings
■ Rolled out the South African mass market offering into Mexico and commenced roll-out in Swaziland, and used South African back-office to support product launches across emerging markets
■ Grew iWYZE through collaboration between OMSA and Mutual & Federal, and launched Nedbank direct offering
■ UK Platform sales into OMGI improved to 16%
201320122011
161413
(%)UK Platform sales managed by OMGI
Build a group-wide culture of excellence
■ Reinforced the agreed ACT NOW! leadership behaviours ■ Conducted the third annual culture survey for the Group ■ Engagement scores improved ■ Old Mutual Emerging Markets (OMEM) ranked Top Employer and
number one Best Company to Work For in local surveys ■ Increased accountability through the introduction of an improved
performance management process for senior leaders ■ Focused on development of current and next generation of leaders ■ OMSA and Nedbank retained their Level 2 B-BBEE transformation ■ Nedbank named the most transformed company of the top 100
listed on the JSE
201320122011
11.711.412.2
(%)Cultural entropy
This is a measure from the Culture Survey: the lower the score, the healthier the culture, scores below 19% indicating a well-functioning organisation.
Continue to simplify our structure to unlock value
■ Restructured our South African businesses under a common holding company for the purpose of managing risk, capital and strategy
■ Continued to manage and substantially reduced residual exposures in Old Mutual Bermuda
■ Further simplifying the Group through the proposed sale of our Polish business
■ Completed the transfer of our Colombian and Mexican businesses to OMEM
■ Closed down and divested non-core US Asset Management affiliates for increased focus on our high performers
20132012201120102009*
13.613.014.614.2
9.1
(%)Group RoE
* Includes the results of the Nordic business, which was disposed of in 2011. Results for 2010 and 2011 have been restated.

17
Strategic report
OUR BIG 5 PRIORITIES 2014 AND BEYOND – GROWING AND TRANSFORMING OUR BUSINESSES TO LEAD IN A RESPONSIBLE AND SUSTAINABLE WAY
2014 and beyond Key management actions 2014 – 2016
1In South Africa – align OMSA, Nedbank and Mutual & Federal to become the leading and most trusted financial services group
■ In South Africa, drive increased collaboration and alignment among OMSA, Nedbank and Mutual & Federal
■ In OMSA, capture growth in the Mass Foundation and Retail Affluent segments and improve profitability in Corporate segment
■ Grow Nedbank by: growing transactional banking, client-centred innovation, grow a pan-African banking network and tilt the portfolio to maximise economic profit growth
■ Target pre-tax value of synergies of circa R1.0 billion across OMSA, Nedbank and Mutual & Federal on a run rate basis.
2In Africa – build an African financial services champion, while continuing to grow in other emerging markets
■ Grow existing businesses in SADC, expand into East Africa, in West Africa build on Oceanic acquisition in Nigeria, and leverage Ecobank’s pan-African banking footprint
■ Increase collaboration among Old Mutual, Nedbank and Mutual & Federal in African markets ■ Continue to selectively invest and grow in Latin America and Asia ■ By 2015, 15% of Old Mutual’s profits from Africa (excl. South Africa) ■ 2016 LTIP target: customer growth in Africa (excluding banking) of 15% (excl. South Africa).
3Old Mutual Wealth – transform to build the best retail investment business in the UK
■ Build the best Retail Investment business in the UK – focus on cost reduction, expanding product proposition, diversifying distribution and increasing share of AUM through building its asset management capability
■ Continue to deliver operational efficiency ■ Further simplification by disposing of non-core or sub-scale businesses, where appropriate ■ Execute the manage-for-value strategy in Continental Europe ■ 2015 target: Adjusted Operating profit (pre-tax) of £300 million.
4US Asset Management – continue to improve and grow our multi-boutique asset management business
■ Continue to improve USAM performance – develop investment capabilities of core affiliates and complement with centre-led distribution and selective acquisitions
■ Continue to deliver operational efficiency ■ Annual target: net client cash inflows of 3% to 5% of opening FUM ■ Further derisking at Old Mutual Bermuda.
5Responsible business – in each of our markets become the recognised financial services leader in responsible business
Responsible to our customers ■ Fulfil on the four elements of our customer
promise: to be most accessible; to provide best financial education and advice; to offer solutions most certain to deliver on customer promises; and to be most supportive of the communities we serve
Responsible investment ■ Incorporate material environmental, social and
governance criteria into our investment and ownership decision-making process, and develop sustainable and ‘future-proof’ savings and investment products for our customers
Responsible to our employees ■ Continue to build a culture of excellence
and embed ACT NOW! Leadership behaviours across the Group, to develop our leadership and talent pipeline, particularly in key growth markets, and to promote diversity and inclusion
Responsible to our communities ■ Continue to focus on financial education and
inclusion, and sustainable enterprise and skills development in each of our markets, through business as usual and community investment, as well as through employee volunteering and giving programmes
Responsible environmental management
■ Continue to reduce our direct and indirect environmental impact across the Group, and help shape environmental management and climate change policy

Old Mutual plcAnnual Report and Accounts 2013
18
by providing a range of products to help them achieve their lifetime financial goals...
BUSINESS MODEL IN OUTLINEWe generate value for all our stakeholders.
We are focused on becoming our customers’ most trusted partner...
16mRetail, Institutional, Government and Corporate Customers
Fees, underwriting income, interest and investment gains
Our business model is delivered through our commitment to
Annuities, claims, interest and investment gains
PAYMENTS
INFLOWS/OUTFLOWS
OF CASH
SALE
S
DIRECT+INTERMEDIARIES
£294bnFunds under management and £33bn in loans and advances
InvestmentSavings
InsuranceBanking

19
Strategic report
delivered through five business units...
enabling us to generate value for all our stakeholders
REINVESTMENT
13.6% ROE
£336m returns to shareholders and £272m returns to bondholders2
£16m investment in communities3
Over £1,914m development and reward of employees
£1,477m taxes to governments4
£327m reinvestment in future growth5
Emerging Markets AOP £590mNedbank AOP £797mProperty & Casualty AOP £4mOld Mutual Wealth AOP £217mUS Asset Management AOP £111m
£1,612m AOP1
the development of our skills, resources and relationships.1 Pre-tax, pre NCI and includes Group interest expense and central costs2 Interest and principal repaid on our debt in the period3 Corporate donations made through our foundations and other community investment projects (excludes employee donations through workplace fundraising)4 Taxes paid or collected5 Includes capital investment and new business strain on covered business

Old Mutual plcAnnual Report and Accounts 2013
20
BUSINESS MODEL IN DETAILWe generate value by focusing on our customers’ lifetime financial goals.
CustomersWe focus on our customers’ long-term needs.Creating trusted relationships with customers is at the heart of everything we do. We aim to help them achieve their lifetime financial goals through our investment, savings, insurance and banking.
Despite volatility in the world economy and the equity and currency markets, the basic needs of consumers around the world do not change. People want to protect themselves and their families against critical life events and to provide for expenses such as education, healthcare and retirement – particularly against a backdrop of reduced government and employer capacity to provide these services.
ProductsOur skills and resources enable our business units to excel in their respective markets.InvestmentWe provide appropriate and tax-efficient investment products to our customers as they accumulate assets to safeguard their futures.
SavingsWe provide goal-orientated savings products, for example, helping customers to save towards their children’s education.
InsuranceOur protection business provides life assurance products that offer financial security against single or multiple risks such as death or disability. For example, in South Africa we provide products to help our customers save for funerals. This has significant cultural importance.
Our Property & Casualty business protects individuals, commercial and corporate customers from losses due to damage, theft or other financial claims.
BankingOur banking services include retail and corporate lending, transactional banking and savings/current accounts.
Funds under managementThe cash generated from the sale of products results in funds under management on which we earn performance and management fees and generate investment returns. Customers’ funds and their value can rise or fall with the underlying markets. So the value of our profits from these products varies with the movements in markets.
Inflows/outflowsWe generate cash flow and profits from the products we sell. The timing of cash flows and recording of profits varies depending on the products. For example, a life insurance policy creates profits over a long-term and annual car insurance policy over a short-term.
Customers buy our products either directly or through an intermediary such as a financial adviser. This generates cash inflows. In due course we make payments to our customers, in line with our promise. This generates cash outflows.
Our aim is that in any period our net flow – inflows less outflows – will be positive. This increases our overall funds under management.
ResourcesTo deliver our business model we draw on our strong pool of resources.People and valuesA strong values-driven culture is embedded across the Group. We have our geographic and cultural diversity and we expect all our employees to live and be judged by the following values:
■ Accountability ■ Integrity ■ Respect ■ Pushing beyond boundaries
Skills and expertiseWe are committed to developing our employees’ skills and expertise. This promotes efficiency, good morale and a positive work environment.
StrategyWe drive growth by leveraging on the capabilities of our people and by accelerating collaboration between our businesses. Our five strategic priorities are:
1. In South Africa we will be the leading and most trusted financial services group through driving increased alignment between OMSA, Nedbank and Mutual & Federal
2. In Africa we will continue towards becoming an African Financial Services Champion, while continuing to grow our other emerging market businesses
3. In the UK we will build the best retail investment business through growing and transforming Old Mutual Wealth
4. In the US we will continue to improve and grow our multi-boutique asset management business
5. Across the Group we will become the leader in Responsible Business

21
Strategic report
Business unitsWe offer a wide range of financial services and products.Emerging MarketsOld Mutual Emerging Markets operates in 13 countries across Asia, Africa and Latin America, providing long-term savings, protection and investment solutions to individuals, businesses, corporates and institutions.
NedbankWe own a majority share in Nedbank Group, one of the four largest banking groups in South Africa. Nedbank provides retail and wholesale banking services as well as insurance, asset management and wealth management.
Property & CasualtyMutual & Federal is Southern Africa’s oldest property and casualty insurer, with a history dating back more than 180 years. It has an extensive range of products to meet personal, commercial and corporate needs.
Old Mutual WealthOld Mutual Wealth provides advice-driven investment solutions through independent intermediaries to affluent and high net worth clients in the UK and a number of markets in the Far East, Middle East, Latin America, South Africa and Europe.
US Asset ManagementThe US Asset Management business is headquartered in Boston and has a global distribution footprint. It offers institutional investors a diverse range of investment strategies and products through a well-diversified multi-boutique framework.
StakeholdersCash generated is used both to reward various stakeholders and to invest in future growth.Returns to shareholdersWe pay out a portion of our annual profits to shareholders and on occasions will make additional payments out of surplus capital.
Returns to bond holdersWe service the interest on our debt and expect to repay the principal on our debt as it falls due. Interest rates payable vary in some cases due to wider market conditions.
Returns to communitiesOur support for communities is not just about giving money to good causes, but about making real and sustainable positive impacts. It is in our interest to build a stronger society by supporting communities effectively, especially in the emerging markets where we operate.
At Group level we have policies that encourage engagement with our communities and employee volunteering. At local level there is flexibility to focus on the issues that are most appropriate to that business. We support and invest in a range of areas, but the three focus areas that are common across the Group are financial education, enterprise and skills development, and community development.
Returns to governmentsWe are a substantial payer of taxation, levies and fees to governments where we operate. We also collect other taxes such as payroll deduction. Our investment activities also generate economic activity which further raises revenues for governments.
Returns to employeesWe employ a substantial number of people across our Group and believe in paying appropriate compensation for the effort and contribution made in our business operations.
Treating our employees well is one of our most important priorities.
Reinvestment into our businesses for future growthWe reinvest in our employees and businesses to allow us to build a sustainable long-term environment in which we can continue to grow and adapt to new opportunities and challenges.
Governance and risk managementWe have invested significantly over the past five years in creating a robust and deeply embedded governance and risk management framework. Our transparent processes for managing, monitoring and controlling risks support sound business decisions.
RelationshipsWe deliver value in its wider sense. Our international operations generate employment, investment and tax revenues around the world. The relationships we form with our customers, our employees, governments, regulators and community groups are vital to the success of our business.
ResponsibilityWe are committed to operating responsibly, making decisions that take account of our impact on those around us.
For more about our stakeholder engagement and Responsible Business activities, please see the Responsible Business Report.
Customers Products Business units Stakeholders
Resources
Inflows/Outflows

Old Mutual plcAnnual Report and Accounts 2013
22
OUR MARKETSA high-level overview of the drivers in our key markets – in Africa, the UK, the US and across the globe.
DemographicsDemographic trends in our largest markets inform our business and our strategy. Populations are growing in all our markets and, in most cases, also living longer. But the spread of population within age bands varies significantly, so we design our product offerings to suit the different demand dynamics.
The sub-Saharan Africa population increased by 27% to 911 million1 between 2003 and 20121. South Africa’s population grew by 11% to 51 million1 over the same period. The proportion of the working-age population also increased over this period. In western Europe the number of retirees continued to increase, with the over-65 population of the European Union rising from 16.3% in 2003 to 18.0% in 20121.
The UK average life expectancy was 72 years in 19701, had risen to 81 years by 20111 and continues to rise. In sub-Saharan Africa, average life expectancy increased from 44 years in 19701 to 56 years in 20111, while in South Africa average life expectancy increased from 53 years in 19701 to 55 years in 20111.
At the same time, living standards and expectations have also increased. In our more mature markets people will spend longer in retirement and, as a result, will need a higher level of pension savings to fund their desired standard of living and healthcare costs. In emerging markets, growing economic empowerment is driving demand for a broad range of protection, savings and investment products.
Economic trendsEmerging economies have been achieving higher GDP growth rates than developed economies for some years. GDP per capita in both South Africa and sub-Saharan Africa more than doubled between 2003 and 20121, and annual GDP growth in sub-Saharan Africa exceeded 4% in eight of the nine years1.
As emerging markets develop, average incomes rise and the requirement for financial services evolves from simple funding and transactional products to more sophisticated protection and savings products. Our strategy is to shape our offering to fit the wider macro marketplace.
Lower interest rates and slower growth in the European and US markets mean people will have to save more to meet their target levels of retirement income. Our capabilities in long-term savings products position us well to help them.
Funding of customer needsAgeing populations and rising health expectations are reducing the extent to which governments can afford to meet their social commitments, specifically on pensions and healthcare. Increasingly, individuals will need to fund their own provision.
Regulatory developmentFinancial services have faced increased regulatory intervention over the past few years and we expect this to continue.
We have anticipated and prepared for many of the regulatory changes ahead, including Solvency II in Europe and Solvency Assessment and Management in South Africa, the introduction of Basel III and the changes in the structure of the industry and the products it sells in the UK arising from the Retail Distribution Review (RDR).
Regulatory timetables have generally extended as consultations have taken place with stakeholders. This has led to changes in our implementation plans and inevitably some increase in costs and diversion of management resource from other activities.
Impact on Old MutualThese themes all provide opportunities for Old Mutual. We are well positioned in our markets, have the products that consumers need, and have built effective distribution channels for them.
Emerging Markets 43%UK 50%Europe 7%
Gross sales:
Emerging Markets 48%UK 40%Europe 12%
APE sales split:
Emerging Markets 20%UK 23%Europe 4%
Assets under management:
US 53%1 World Bank Development indicators

23
Strategic report
Our African operations – South Africa and AfricaThere are around 200 million households in sub-Saharan Africa, which are becoming increasingly urbanised, much like Asia in the recent past.
The IMF has forecast that sub-Saharan Africa’s GDP will reach US$2.3 trillion by 2020. McKinsey has forecast that by 2020 more than half of African households will have discretionary income, rising from 85 million households to almost 130 million in 2020. This represents a considerable opportunity, and we aim to attract a proportion of that discretionary income into savings. Our work on financial education and literacy in the region supports the development of this new market.
Our South African operationsOld Mutual continues to be a leading financial services provider in South Africa with more than 5.5 million customers across its retail and corporate businesses. Together with Nedbank, Mutual & Federal and Old Mutual Finance (JV), Old Mutual South Africa is able to offer
Sub-Saharan Africa’s GDP to reach US$2.3 trillion by 2020
0 500 1,000 1,500 2,000 2,500
US$bn
Growth in Africa’s GDP1
2020F2015F
200520001995
2010
19901985
Source: IMF Regional Economic Outlook 20121 Includes South Africa
Insurance markets in Africa which are nascent and under-penetrated
Gross Domestic Product per capita
Inde
x of
insu
ranc
e pe
netr
atio
n
Nigeria
Malawi
Zimbabwe
Kenya
EgyptAlgeria
Tunisia
Morocco
Botswana
Mauritius
RwandaZambia
Uganda
Ghana
Cameroon
Mozambique
Angola
Trend line of insurance penetration and GDP growthNew entry in 2013
Other African marketsMarkets in which Old Mutual insurance businesses operate
Swaziland
Namibia
Tanzania
Note: Based on Life and Property & Casualty insurance GWP Size of circles represent the relative size of population
a holistic range of financial services solutions to a broad range of customer segments, across all their life stages. Our range of solutions includes long-term savings, protection, investment, banking, unsecured lending, and property & casualty (also known as short-term insurance).
We are the biggest life assurer in South Africa, with a significant overall market share in both total sales and value of new business. Our Mass Foundation business is a market leader in this growth segment, and we are well positioned to grow our presence further as the market expands. We have strong market shares in our Retail Affluent and Corporate franchises, and remain the country’s biggest asset manager.
South Africa has a well-established banking industry, maintaining sound and traditional banking practices within a well managed and regulated environment. Nedbank is positioned as a bank for all, providing retail and wholesale banking services as well as insurance and asset and wealth management

Old Mutual plcAnnual Report and Accounts 2013
24
OUR MARKETScontinued
Operationally, our businesses face a number of regulatory initiatives, such as Treating Customers Fairly, Retirement Fund Reform and a review of adviser remuneration models similar to the UK’s RDR. These will increase the cost and complexity of doing business. Competition is also intensifying, with greater pressure from non-traditional players such as banks, mobile operators and direct providers. However, we are making good progress in transforming our businesses in response to these challenges.
Our operations in Africa In the medium- to long-term we have a client-focused, risk-mitigated and capital-efficient growth strategy. In Africa, our long-term savings operations are based in countries with urban populations that have high per-capita GDP – albeit at levels well below those of Europe, the US and developed Asian markets – but as yet relatively low spend on insurance. We currently have more than 1.9 million customers in eight countries – Namibia, Swaziland, Zimbabwe, Malawi, Kenya, Nigeria, Ghana and Botswana – and are the market leader in many of them. We believe these markets offer significant growth opportunities which we are well placed to capture. Our largest business by profits and funds under
There is a growing demographic dividend in Africa
0.00.10.20.30.40.50.60.70.80.91.01.11.21.31.41.5
Size of the working-age population1 (billion people)
196
0
196
5
197
0
197
5
198
0
198
5
199
0
199
5
20
00
20
05
201
0
201
5
20
20
20
25
20
30
20
35
20
40
20
45
20
50
AfricaIndia
ChinaSoutheast Asia
Latin AmericaEurope
North AmericaJapan
1 Population ages 15-64.Source: United Nations World Population Prospect
through five clusters: Nedbank Capital, Nedbank Corporate, Nedbank Business Banking, Nedbank Retail and Nedbank Wealth. Nedbank is the fourth largest bank by way of both deposits and advances. During the year, Nedbank Retail added a further five staffed outlets and 334 ATMs, while increasing its client base by 9%. Nedbank Business Banking gained 440 new transactional banking clients and Nedbank Wealth increased assets under management by 26%. The other clusters continued to deepen client relationships and raise cross-sell levels.
The country’s property and casualty market experienced a marked softening in rates for personal lines of business and a significant level of catastrophe losses. To reduce the impact of rate softening on its underwriting margin at this stage of the underwriting cycle, Mutual & Federal focused on claims management and expense containment. It introduced enhanced management of the quality of new business written and up for renewal, particularly through its direct channel iWyze and underwriting management agencies.
The South African macro-economic environment presented tough operating conditions for our businesses during 2013, with GDP slowing to a four-year low of 1.9%. Growth over 2014 – 2016 is forecast to be between 2.7% and 3.5%. Socio-political challenges including ongoing labour unrest and widening political divisions continue to hinder the country’s growth prospects. The rand fell significantly over the period, partly because moves by the US to reduce monetary stimulus reduced appetite for emerging market currencies. These effects, coupled with low employment growth and growing levels of personal debt, have put pressure on consumers’ disposable incomes and ability to save.
On the positive side, South Africa’s emerging middle class is growing rapidly, and this is forecast to continue over the medium term. We are increasingly well positioned in these segments as we collaborate as a Group, placing our customers at the centre of what we do and delivering innovative financial solutions to meet their evolving financial services needs. Examples include XtraMax in our Affluent business and severe illness protection for people with HIV/AIDS.
management is in Namibia, followed closely by Zimbabwe. We have recently acquired life licences in Nigeria and Ghana, where we see significant growth potential.
Nedbank currently operates in five countries across Southern Africa and is exploring further expansion in the Southern African Development Community and East Africa. Its strategic alliance with Ecobank, focused on Central and West Africa, gives customers access to the largest pan-African banking network, with more than 2,000 staffed outlets in 37 countries. We have created an opportunity for shareholders to participate in our Africa growth story through our right to acquire 20% in Ecobank Transnational Incorporated.
Our Property & Casualty operations in Africa are broadly aligned to Old Mutual’s long-term savings operations. This allows both businesses to leverage each other’s distribution networks and creates cost and revenue synergies. We see increasing scope for property and casualty, life and savings and banking businesses to work together more closely. For example, we have acquired a property and casualty business in Nigeria which will be integrated in the newly acquired life business there.
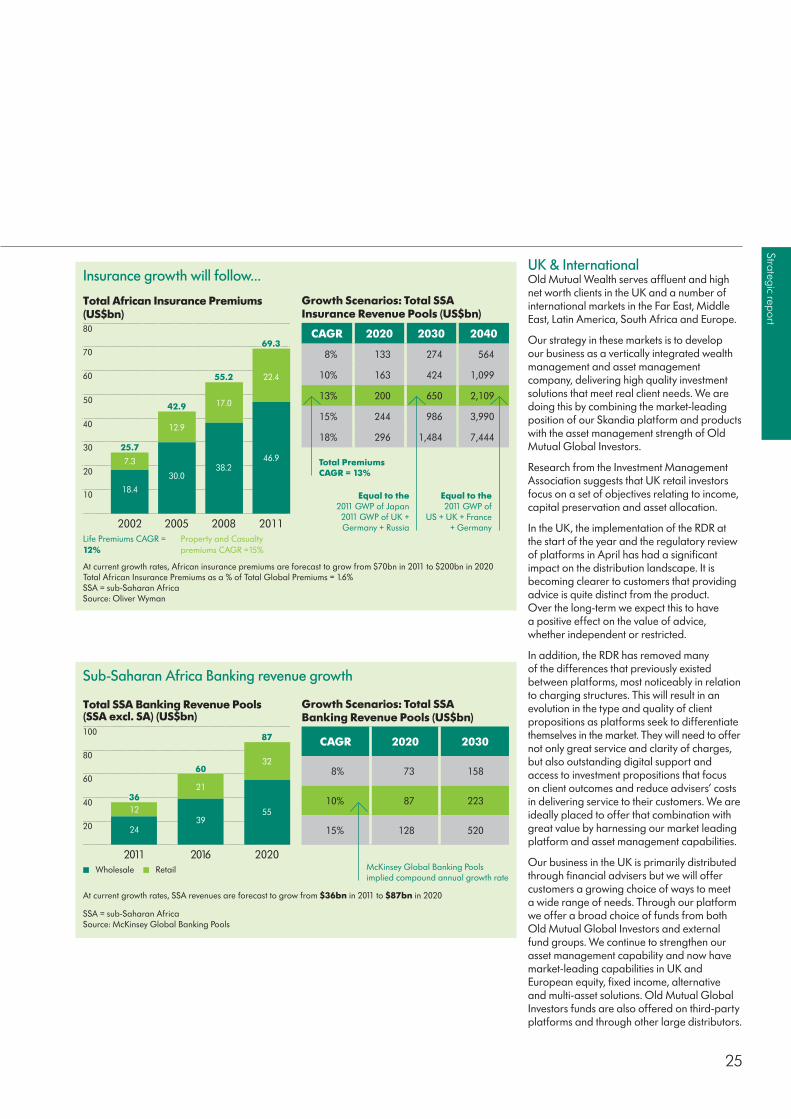
25
Strategic report
Insurance growth will follow…
Total African Insurance Premiums(US$bn)
18.4
2002 2005 2011
17.0
12.9
50
40
30
207.3
30.038.2
55.2
42.9
10
60
70
80
2008
22.4
46.9
69.3
25.7
Life Premiums CAGR =12%
Property and Casualty premiums CAGR =15%
Growth Scenarios: Total SSA Insurance Revenue Pools (US$bn)
CAGR 2020 2030 2040
8% 133 274 564
10% 163 424 1,099
13% 200 650 2,109
15% 244 986 3,990
18% 296 1,484 7,444
Total Premiums CAGR = 13%
Equal to the 2011 GWP of Japan
2011 GWP of UK + Germany + Russia
Equal to the 2011 GWP of
US + UK + France + Germany
At current growth rates, African insurance premiums are forecast to grow from $70bn in 2011 to $200bn in 2020Total African Insurance Premiums as a % of Total Global Premiums = 1.6%SSA = sub-Saharan AfricaSource: Oliver Wyman
UK & InternationalOld Mutual Wealth serves affluent and high net worth clients in the UK and a number of international markets in the Far East, Middle East, Latin America, South Africa and Europe.
Our strategy in these markets is to develop our business as a vertically integrated wealth management and asset management company, delivering high quality investment solutions that meet real client needs. We are doing this by combining the market-leading position of our Skandia platform and products with the asset management strength of Old Mutual Global Investors.
Research from the Investment Management Association suggests that UK retail investors focus on a set of objectives relating to income, capital preservation and asset allocation.
In the UK, the implementation of the RDR at the start of the year and the regulatory review of platforms in April has had a significant impact on the distribution landscape. It is becoming clearer to customers that providing advice is quite distinct from the product. Over the long-term we expect this to have a positive effect on the value of advice, whether independent or restricted.
In addition, the RDR has removed many of the differences that previously existed between platforms, most noticeably in relation to charging structures. This will result in an evolution in the type and quality of client propositions as platforms seek to differentiate themselves in the market. They will need to offer not only great service and clarity of charges, but also outstanding digital support and access to investment propositions that focus on client outcomes and reduce advisers’ costs in delivering service to their customers. We are ideally placed to offer that combination with great value by harnessing our market leading platform and asset management capabilities.
Our business in the UK is primarily distributed through financial advisers but we will offer customers a growing choice of ways to meet a wide range of needs. Through our platform we offer a broad choice of funds from both Old Mutual Global Investors and external fund groups. We continue to strengthen our asset management capability and now have market-leading capabilities in UK and European equity, fixed income, alternative and multi-asset solutions. Old Mutual Global Investors funds are also offered on third-party platforms and through other large distributors.
Sub-Saharan Africa Banking revenue growth
Total SSA Banking Revenue Pools (SSA excl. SA) (US$bn)
24
2011 2016 2020
32
21
100
80
60
40
20
1239
55
36
87
60
Wholesale Retail
Growth Scenarios: Total SSA Banking Revenue Pools (US$bn)
CAGR 2020 2030
8% 73 158
10% 87 223
15% 128 520
McKinsey Global Banking Pools implied compound annual growth rate
At current growth rates, SSA revenues are forecast to grow from $36bn in 2011 to $87bn in 2020
SSA = sub-Saharan AfricaSource: McKinsey Global Banking Pools
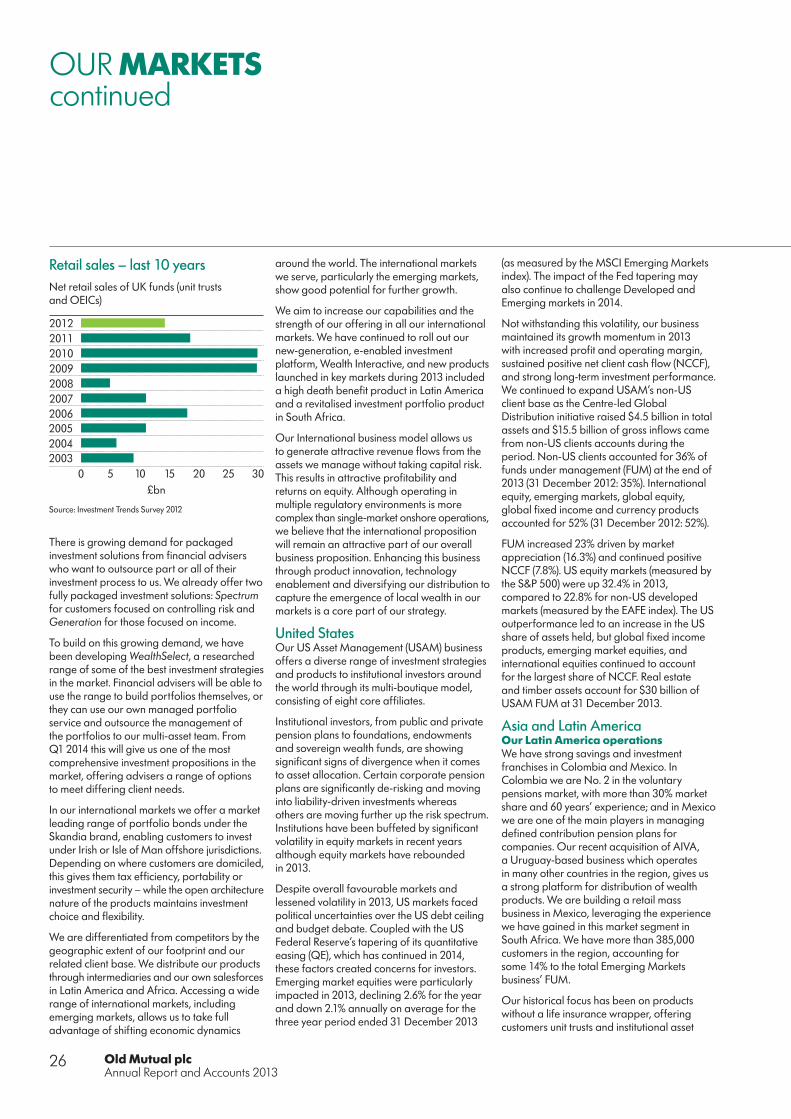
Old Mutual plcAnnual Report and Accounts 2013
26
There is growing demand for packaged investment solutions from financial advisers who want to outsource part or all of their investment process to us. We already offer two fully packaged investment solutions: Spectrum for customers focused on controlling risk and Generation for those focused on income.
To build on this growing demand, we have been developing WealthSelect, a researched range of some of the best investment strategies in the market. Financial advisers will be able to use the range to build portfolios themselves, or they can use our own managed portfolio service and outsource the management of the portfolios to our multi-asset team. From Q1 2014 this will give us one of the most comprehensive investment propositions in the market, offering advisers a range of options to meet differing client needs.
In our international markets we offer a market leading range of portfolio bonds under the Skandia brand, enabling customers to invest under Irish or Isle of Man offshore jurisdictions. Depending on where customers are domiciled, this gives them tax efficiency, portability or investment security – while the open architecture nature of the products maintains investment choice and flexibility.
We are differentiated from competitors by the geographic extent of our footprint and our related client base. We distribute our products through intermediaries and our own salesforces in Latin America and Africa. Accessing a wide range of international markets, including emerging markets, allows us to take full advantage of shifting economic dynamics
around the world. The international markets we serve, particularly the emerging markets, show good potential for further growth.
We aim to increase our capabilities and the strength of our offering in all our international markets. We have continued to roll out our new-generation, e-enabled investment platform, Wealth Interactive, and new products launched in key markets during 2013 included a high death benefit product in Latin America and a revitalised investment portfolio product in South Africa.
Our International business model allows us to generate attractive revenue flows from the assets we manage without taking capital risk. This results in attractive profitability and returns on equity. Although operating in multiple regulatory environments is more complex than single-market onshore operations, we believe that the international proposition will remain an attractive part of our overall business proposition. Enhancing this business through product innovation, technology enablement and diversifying our distribution to capture the emergence of local wealth in our markets is a core part of our strategy.
United StatesOur US Asset Management (USAM) business offers a diverse range of investment strategies and products to institutional investors around the world through its multi-boutique model, consisting of eight core affiliates.
Institutional investors, from public and private pension plans to foundations, endowments and sovereign wealth funds, are showing significant signs of divergence when it comes to asset allocation. Certain corporate pension plans are significantly de-risking and moving into liability-driven investments whereas others are moving further up the risk spectrum. Institutions have been buffeted by significant volatility in equity markets in recent years although equity markets have rebounded in 2013.
Despite overall favourable markets and lessened volatility in 2013, US markets faced political uncertainties over the US debt ceiling and budget debate. Coupled with the US Federal Reserve’s tapering of its quantitative easing (QE), which has continued in 2014, these factors created concerns for investors. Emerging market equities were particularly impacted in 2013, declining 2.6% for the year and down 2.1% annually on average for the three year period ended 31 December 2013
(as measured by the MSCI Emerging Markets index). The impact of the Fed tapering may also continue to challenge Developed and Emerging markets in 2014.
Not withstanding this volatility, our business maintained its growth momentum in 2013 with increased profit and operating margin, sustained positive net client cash flow (NCCF), and strong long-term investment performance. We continued to expand USAM’s non-US client base as the Centre-led Global Distribution initiative raised $4.5 billion in total assets and $15.5 billion of gross inflows came from non-US clients accounts during the period. Non-US clients accounted for 36% of funds under management (FUM) at the end of 2013 (31 December 2012: 35%). International equity, emerging markets, global equity, global fixed income and currency products accounted for 52% (31 December 2012: 52%).
FUM increased 23% driven by market appreciation (16.3%) and continued positive NCCF (7.8%). US equity markets (measured by the S&P 500) were up 32.4% in 2013, compared to 22.8% for non-US developed markets (measured by the EAFE index). The US outperformance led to an increase in the US share of assets held, but global fixed income products, emerging market equities, and international equities continued to account for the largest share of NCCF. Real estate and timber assets account for $30 billion of USAM FUM at 31 December 2013.
Asia and Latin AmericaOur Latin America operationsWe have strong savings and investment franchises in Colombia and Mexico. In Colombia we are No. 2 in the voluntary pensions market, with more than 30% market share and 60 years’ experience; and in Mexico we are one of the main players in managing defined contribution pension plans for companies. Our recent acquisition of AIVA, a Uruguay-based business which operates in many other countries in the region, gives us a strong platform for distribution of wealth products. We are building a retail mass business in Mexico, leveraging the experience we have gained in this market segment in South Africa. We have more than 385,000 customers in the region, accounting for some 14% to the total Emerging Markets business’ FUM.
Our historical focus has been on products without a life insurance wrapper, offering customers unit trusts and institutional asset
OUR MARKETScontinued
Retail sales – last 10 yearsNet retail sales of UK funds (unit trusts and OEICs)
0 5 10 15 20 25 30£bn
20122011
200920082007
2010
2006200520042003
Source: Investment Trends Survey 2012

27
Strategic report
“We believe incorporating Responsible investment into the investment process aligns with our pursuit of long-term returns and broader interests of society.”Roger Birt, Head, Mandate Management, Old Mutual South Africa
CASE STUDY
Strengthening diversity
The Clothing Bank is one of the Enterprise Development projects funded by the Old Mutual Foundation. We have funded them since 2012 and the 2013 funding went towards expanding the project into the Gauteng province.
The Clothing Bank is an innovative NGO with a passionate mission to empower unemployed single mothers through enterprise development so that they can become financially and socially independent. It was founded in 2010 in response to the rapidly increasing rate of unemployment among single mothers and the lack of support they receive from the fathers of their children.
The main focus of The Clothing Bank’s enterprise development initiative is a two-year holistic training programme that
aims to equip and empower unemployed mothers with the vital skills and resources they need to start small, sustainable clothing trading businesses.
By helping them to sell surplus and waste clothing merchandise donated by major South African retailers, The Clothing Bank teaches unemployed women valuable skills and business acumen.
The women earn, on average, R3,500 per month and over the past three years The Clothing Bank has successfully trained 330 women who have collectively made a profit of over R10 million. With this money, they have been able to improve their lives, settle debts and embrace a culture of independence and saving, while simultaneously stimulating other community-based small businesses.
management solutions. However, we also see promising opportunities in life insurance as the region’s GDP per capita has been steadily improving and life insurance premiums have been growing strongly over the last few years.
We have robust strategies to continue serving our market niches despite challenges to our Mexican and Colombian businesses from tax reforms as governments strive to accelerate structural economic reforms. These reforms would constrain demand for our voluntary pensions businesses by diminishing the tax incentives to save, particularly among our affluent customers.
Our Asian operationsIn Asia we operate with joint venture partners in both India and China, where we have life insurance licences offering protection, savings and investment products across various customer segments.
In India we have a successful 74:26 joint venture with Kotak Mahindra Bank. Together we have been able to create one of the few insurers that continue to operate profitably in Indian life insurance, and we were voted Most Respected JV Insurance Company in India by Business World magazine in 2013. Regulation of insurance distribution in India has significantly weakened salesforce morale and slowed the pace of sales growth recently. In China, Old Mutual Guodian Life Insurance is our 50:50 partnership with the Guodian Group, a well respected state-owned enterprise. We are growing rapidly, broadening our distribution and well positioned in the fast-growing high-end affluent segment, where we have over 40,000 customers.
While India faces a number of macro-economic and political challenges over the short-term, GDP growth is expected to recover in 2014. In China the government favours further development of the life insurance industry but the key question remains whether the country can sustain economic growth as it has over the past 30 years. China and India have a combined population of 2.6 billion, with a rapidly growing middle class currently estimated at some 200 million individuals. This, coupled with low levels of insurance penetration, should drive demand for insurance and long-term savings over time.
Our operational priority remains to grow the value of our Asian joint ventures, principally by diversifying our product and channel offerings to existing and new customer segments.
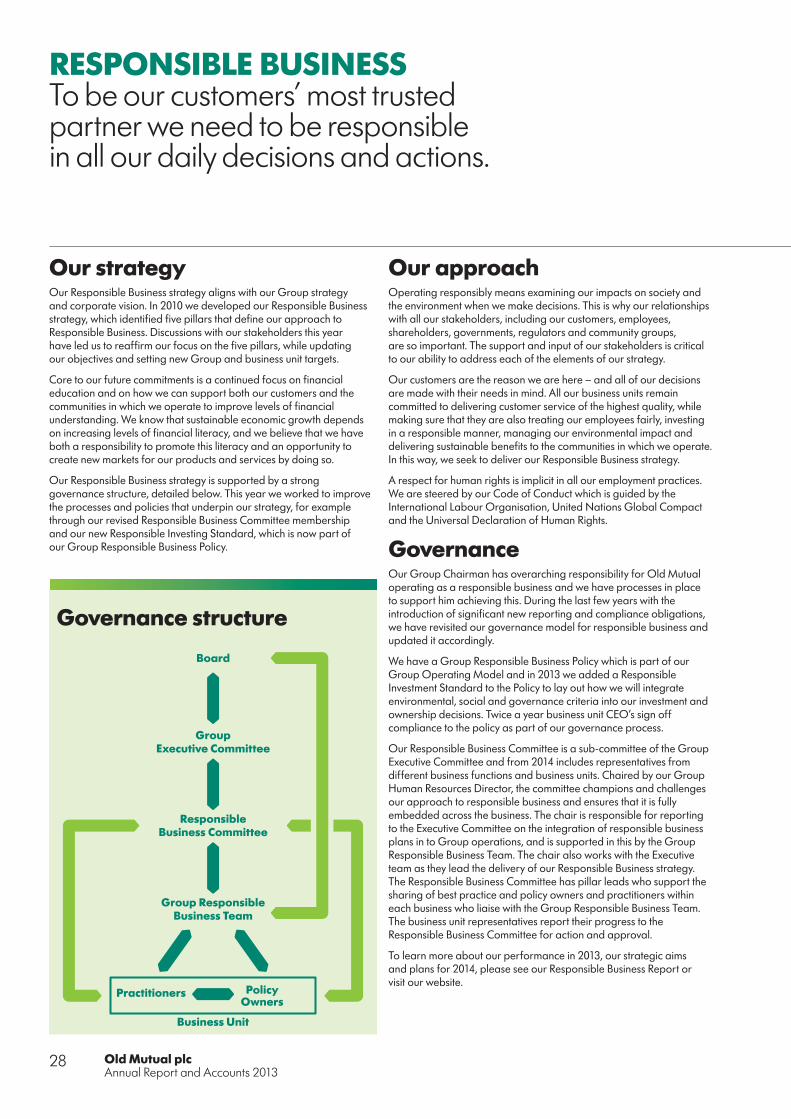
Old Mutual plcAnnual Report and Accounts 2013
28
RESPONSIBLE BUSINESSTo be our customers’ most trusted partner we need to be responsible in all our daily decisions and actions.
Our strategyOur Responsible Business strategy aligns with our Group strategy and corporate vision. In 2010 we developed our Responsible Business strategy, which identified five pillars that define our approach to Responsible Business. Discussions with our stakeholders this year have led us to reaffirm our focus on the five pillars, while updating our objectives and setting new Group and business unit targets.
Core to our future commitments is a continued focus on financial education and on how we can support both our customers and the communities in which we operate to improve levels of financial understanding. We know that sustainable economic growth depends on increasing levels of financial literacy, and we believe that we have both a responsibility to promote this literacy and an opportunity to create new markets for our products and services by doing so.
Our Responsible Business strategy is supported by a strong governance structure, detailed below. This year we worked to improve the processes and policies that underpin our strategy, for example through our revised Responsible Business Committee membership and our new Responsible Investing Standard, which is now part of our Group Responsible Business Policy.
Our approachOperating responsibly means examining our impacts on society and the environment when we make decisions. This is why our relationships with all our stakeholders, including our customers, employees, shareholders, governments, regulators and community groups, are so important. The support and input of our stakeholders is critical to our ability to address each of the elements of our strategy.
Our customers are the reason we are here – and all of our decisions are made with their needs in mind. All our business units remain committed to delivering customer service of the highest quality, while making sure that they are also treating our employees fairly, investing in a responsible manner, managing our environmental impact and delivering sustainable benefits to the communities in which we operate. In this way, we seek to deliver our Responsible Business strategy.
A respect for human rights is implicit in all our employment practices. We are steered by our Code of Conduct which is guided by the International Labour Organisation, United Nations Global Compact and the Universal Declaration of Human Rights.
GovernanceOur Group Chairman has overarching responsibility for Old Mutual operating as a responsible business and we have processes in place to support him achieving this. During the last few years with the introduction of significant new reporting and compliance obligations, we have revisited our governance model for responsible business and updated it accordingly.
We have a Group Responsible Business Policy which is part of our Group Operating Model and in 2013 we added a Responsible Investment Standard to the Policy to lay out how we will integrate environmental, social and governance criteria into our investment and ownership decisions. Twice a year business unit CEO’s sign off compliance to the policy as part of our governance process.
Our Responsible Business Committee is a sub-committee of the Group Executive Committee and from 2014 includes representatives from different business functions and business units. Chaired by our Group Human Resources Director, the committee champions and challenges our approach to responsible business and ensures that it is fully embedded across the business. The chair is responsible for reporting to the Executive Committee on the integration of responsible business plans in to Group operations, and is supported in this by the Group Responsible Business Team. The chair also works with the Executive team as they lead the delivery of our Responsible Business strategy. The Responsible Business Committee has pillar leads who support the sharing of best practice and policy owners and practitioners within each business who liaise with the Group Responsible Business Team. The business unit representatives report their progress to the Responsible Business Committee for action and approval.
To learn more about our performance in 2013, our strategic aims and plans for 2014, please see our Responsible Business Report or visit our website.
Group Executive Committee
Board
Responsible Business Committee
Group Responsible Business Team
Practitioners Policy Owners
Business Unit
Governance structure

29
Strategic report
Our five pillars Group highlights in 2013
Responsible to our customersPutting the customer first in everything we do
■ Our annual Group Customer Conference, this year held in South Africa, was attended by over 90 of our Executives
■ Rationalised, improved and expanded the product range in our Emerging Markets businesses and improved the customer experience
■ Grew distribution capabilities in India, China, Latin America, Kenya and Nigeria.
Responsible investmentIncorporation of environmental, social and governance criteria into our investment and ownership decisions
■ Launched a publicly available Responsible Investment Standard across the Group ■ Provided training on responsible investment and the environmental, social and governance issues related to our investment capabilities to relevant employees
■ We were a principal sponsor of ‘PRI in Person’ – a United Nations-supported Principles for Responsible Investment event, held in South Africa. This and the JSE SRI pre-event had speakers from Old Mutual’s Executive Committees.
Responsible to our employeesBuilding a culture of excellence which our employees are proud to be part of
■ The annual Group Culture Survey maintained a high response rate and a positive overall culture score in the Group. It confirmed that people experience many of our company values and ACT NOW! Behaviours in their everyday work
■ In January 2014 the Old Mutual plc Board announced that it had achieved 33% female membership. Our target was 30% by 2015. Across the Group 57% of our employees are female
■ Old Mutual South Africa and Nedbank maintained their Broad-Based Black Economic Empowerment Level 2 rating.
Responsible to our communitiesProviding sustainable, tailored and meaningful support to the communities in which we operate
■ Invested £16.1 million in our community programmes – representing 1% of pre-tax annual operating profit
■ Continued to align the strategy of our community investment programmes to deliver maximum positive impact
■ Launched and enhanced internal initiatives across the Group to promote employee volunteering.
Responsible environmental management*Helping to monitor, manage and reduce our direct and indirect environmental impacts
■ Improved our ranking in the Carbon Disclosure Leadership Index for FTSE350 financial services companies – from eighth to fifth position
■ Our Group carbon intensity for 2013 was 3.0 tonnes CO2e per £m FUM ■ Increased our carbon emissions by 9.5% per m2 in our property portfolio ■ Increased our carbon emissions by 1.9% per employee in our employee-occupied properties.
“ To provide fully for our customers, we need to make sure that they understand that they can trust us and this trust is represented by being a responsible business in all aspects of what we do.”
Julian Roberts, Group Chief Executive
All of which are underpinned by:
Governance ■ We updated our Group Responsible Business Strategy ■ We reviewed† the members of our Responsible Business Committee to reflect our new commitments and strategic priorities
* Our carbon footprint and intensity indicators have been restated for 2011 and 2012 to account for material changes to the conversion factors provided by DEFRA for company reporting purposes as well as the Responsible Business Committee decision to change our reporting methodology from an equity share to an operational control approach, to better align with financial reporting.
† Changes came into force from 1 January 2014.

Old Mutual plcAnnual Report and Accounts 2013
30
KEY PERFORMANCE INDICATORS (KPIs)Here we describe the financial and non-financial KPIs that we use to monitor the performance of our business.
Financial KPIs Relevance
RoE (%) Return on Equity is an indicator of our profitability and capital efficiency in using the resources provided by our shareholders.
20132012201120102009*
13.6%13.0%14.6%14.2%
9.1%
* Includes the results of the Nordic business, which was disposed of in 2011. Results for 2010 and 2011 have been restated.
We will continue to drive profitability throughout our businesses and make the best possible use of the capital invested, particularly with the execution of our growth strategy in Africa.
Long-term incentive (LTI): 12% to 15%
See Directors’ Remuneration Report for further details on LTI awards for 2014
p106-125
NCCF/FUM (%) NCCF/Opening Funds Under Management (FUM) measures our success in attracting new business and retaining existing customers, and provides a good indication of investor confidence in our ability to manage their funds effectively.
20132012201120102009
5.9%1.9%
-3.9%-2.5%-0.7%
Achieve positive cash flows (eg. premiums, deposits and investments) faster than cash outflows (eg. paying out claims, annuities and redemptions).
See Financial review for further details
p72-79
Capital Strength (£bn) Capital strength measured under the EU Financial Groups Directive
20132012201120102009
£2.1bn£2.1bn£2.0bn£2.1bn£1.5bn
Retain regulatory capital at its current level, whilst complying with local statutory requirements.
See Financial review for further details
p72-79
Adjusted Operating Earnings per Share (pence)
Adjusted Operating Earnings per Share (EPS) is an indicator of our profitability that measures how much we earn for the average number of ordinary shares in issue during the period. The trend in the movement of EPS demonstrates our rate of growth.
20132012201120102009
18.4p17.5p15.7p14.3p11.6p
Sustainable growth in earnings per share through continued revenue growth and operational efficiency.
Long-term incentive (LTI): 5% to 10% growth
See Directors’ Remuneration Report for further details on LTI awards for 2014
p106-125
Non-financial KPIs 2012 2013 +/-%
Customer Numbers (m) Customers across the Group.
The size of the customer base is an indication of the scale of the business. Growth in the number of customers indicates that we have an attractive proposition for new customers and are satisfying the needs of our existing customers.
14m 16m +14%(millions)
Putting the customer first in everything we do.
Emerging Markets to increase their customer numbers to over 9 million by 2015.
See Responsible Business Report for further details on how we are responsible to our customers
Community Investment (% of pre-tax AOP)
The value of Old Mutual’s Community Investment made through our Foundations and other community projects (excludes employee donations through workplace fundraising).
1.0%1 1.0% –(% of pre-tax AOP)
Providing sustainable, tailored and meaningful support to the communities in which we operate.
Spending 1% of pre-tax profit on community investment.
See Responsible Business Report for further details on how we are responsible to our communities
Carbon Emissions2 (tonnes of CO2e)
Scope 1 & 2 carbon emissions in employee-occupied locations and in Old Mutual investment property.
Scope 1 are direct emissions from sources that are owned or controlled by the Group. Scope 2 are indirect emissions resulting from the generation of electricity, heat or steam purchased by the Group.
4.33 4.25 -1.8%(tonnes of CO2e per employee)
0.21 0.23 +9.5%(tonnes of CO2e per m2)
Reducing carbon emissions in our employee-occupied locations and investment property portfolio: 20% reduction by 2020 from a 2010 base-year
See Responsible Business Report for further details on our approach to responsible environmental management
Cultural Entropy (%) Cultural entropy measures the amount of negative or limiting values that exist within an organisation which results in unproductive work.
The lower the score the healthier the culture.12.2
2011 2012 2013
15129630
11.4 11.7
(%) Building a culture of excellence which our employees are proud to be part of.
A healthy working culture in every business by 2020: a cultural entropy score of between 9% and 13%.
See Responsible Business Report for further details on how we are responsible to our employees
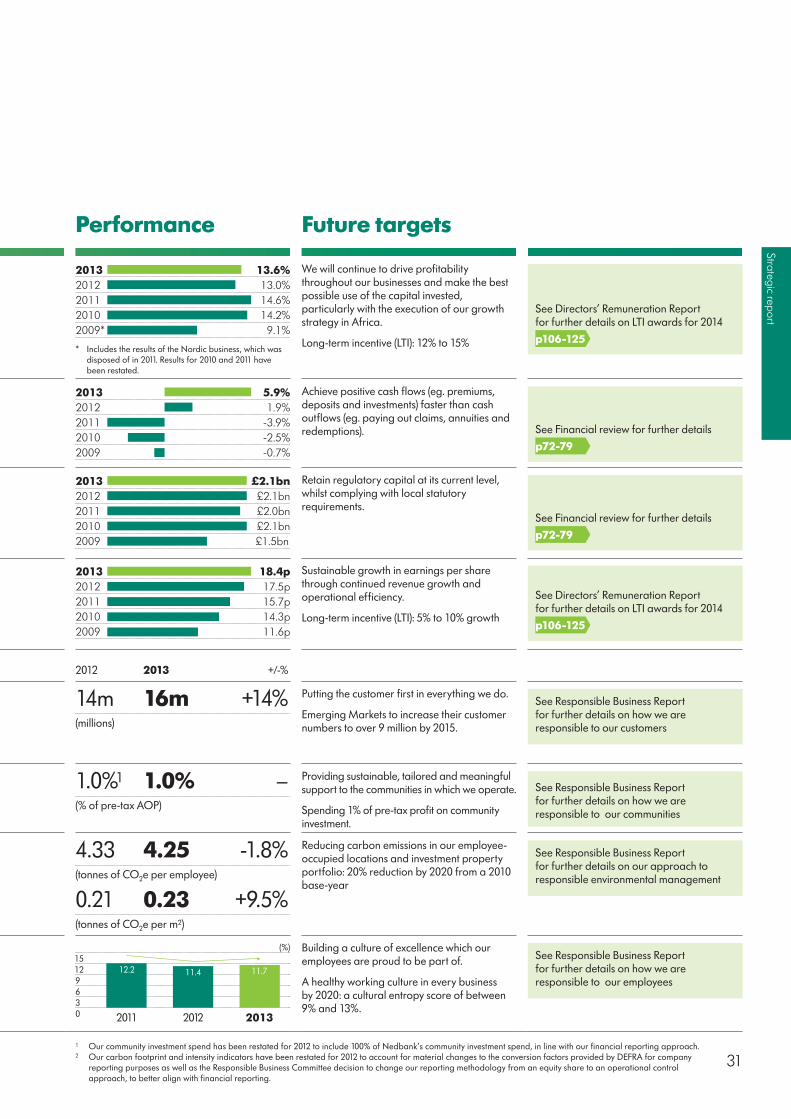
31
Strategic report
1 Our community investment spend has been restated for 2012 to include 100% of Nedbank’s community investment spend, in line with our financial reporting approach.2 Our carbon footprint and intensity indicators have been restated for 2012 to account for material changes to the conversion factors provided by DEFRA for company
reporting purposes as well as the Responsible Business Committee decision to change our reporting methodology from an equity share to an operational control approach, to better align with financial reporting.
Performance Future targets
RoE (%) Return on Equity is an indicator of our profitability and capital efficiency in using the resources provided by our shareholders.
20132012201120102009*
13.6%13.0%14.6%14.2%
9.1%
* Includes the results of the Nordic business, which was disposed of in 2011. Results for 2010 and 2011 have been restated.
We will continue to drive profitability throughout our businesses and make the best possible use of the capital invested, particularly with the execution of our growth strategy in Africa.
Long-term incentive (LTI): 12% to 15%
See Directors’ Remuneration Report for further details on LTI awards for 2014
p106-125
NCCF/FUM (%) NCCF/Opening Funds Under Management (FUM) measures our success in attracting new business and retaining existing customers, and provides a good indication of investor confidence in our ability to manage their funds effectively.
20132012201120102009
5.9%1.9%
-3.9%-2.5%-0.7%
Achieve positive cash flows (eg. premiums, deposits and investments) faster than cash outflows (eg. paying out claims, annuities and redemptions).
See Financial review for further details
p72-79
Capital Strength (£bn) Capital strength measured under the EU Financial Groups Directive
20132012201120102009
£2.1bn£2.1bn£2.0bn£2.1bn£1.5bn
Retain regulatory capital at its current level, whilst complying with local statutory requirements.
See Financial review for further details
p72-79
Adjusted Operating Earnings per Share (pence)
Adjusted Operating Earnings per Share (EPS) is an indicator of our profitability that measures how much we earn for the average number of ordinary shares in issue during the period. The trend in the movement of EPS demonstrates our rate of growth.
20132012201120102009
18.4p17.5p15.7p14.3p11.6p
Sustainable growth in earnings per share through continued revenue growth and operational efficiency.
Long-term incentive (LTI): 5% to 10% growth
See Directors’ Remuneration Report for further details on LTI awards for 2014
p106-125
Non-financial KPIs 2012 2013 +/-%
Customer Numbers (m) Customers across the Group.
The size of the customer base is an indication of the scale of the business. Growth in the number of customers indicates that we have an attractive proposition for new customers and are satisfying the needs of our existing customers.
14m 16m +14%(millions)
Putting the customer first in everything we do.
Emerging Markets to increase their customer numbers to over 9 million by 2015.
See Responsible Business Report for further details on how we are responsible to our customers
Community Investment (% of pre-tax AOP)
The value of Old Mutual’s Community Investment made through our Foundations and other community projects (excludes employee donations through workplace fundraising).
1.0%1 1.0% –(% of pre-tax AOP)
Providing sustainable, tailored and meaningful support to the communities in which we operate.
Spending 1% of pre-tax profit on community investment.
See Responsible Business Report for further details on how we are responsible to our communities
Carbon Emissions2 (tonnes of CO2e)
Scope 1 & 2 carbon emissions in employee-occupied locations and in Old Mutual investment property.
Scope 1 are direct emissions from sources that are owned or controlled by the Group. Scope 2 are indirect emissions resulting from the generation of electricity, heat or steam purchased by the Group.
4.33 4.25 -1.8%(tonnes of CO2e per employee)
0.21 0.23 +9.5%(tonnes of CO2e per m2)
Reducing carbon emissions in our employee-occupied locations and investment property portfolio: 20% reduction by 2020 from a 2010 base-year
See Responsible Business Report for further details on our approach to responsible environmental management
Cultural Entropy (%) Cultural entropy measures the amount of negative or limiting values that exist within an organisation which results in unproductive work.
The lower the score the healthier the culture.12.2
2011 2012 2013
15129630
11.4 11.7
(%) Building a culture of excellence which our employees are proud to be part of.
A healthy working culture in every business by 2020: a cultural entropy score of between 9% and 13%.
See Responsible Business Report for further details on how we are responsible to our employees

Old Mutual plcAnnual Report and Accounts 2013
32
PRINCIPAL RISKS AND UNCERTAINTIESThe Group’s overall risk profile and capital position remains stable despite difficult economic conditions and weakened global recovery.
Risk description 2013 and beyond Risk mitigation and management action
1. Potential slowing of the South African economyA significant portion of our earnings comes from our South African businesses. In our insurance and investment businesses, our earnings are at risk if our customers are not able to keep up premiums on existing business, or if they cancel existing policies or withdraw their savings earlier than anticipated. Additionally our future profits will be at risk if customers do not buy insurance policies from us or invest their savings with us at the levels we anticipate.
This may also impact credit risk, as discussed overleaf.
Customers’ propensity to save and to purchase and maintain insurance policies is a function of, among other factors, their disposable income and their confidence in their future prospects. Disposable income will be affected by the rate of increase of customers’ real incomes, the unemployment rate in the economy and levels of consumer confidence. Each of these factors is in turn affected by macro-economic factors, such as inflation and interest rates, which is outside of our control and difficult to predict.
Whilst our business plans assume nominal GDP growth in South Africa in the next 2 to 3 years that is lower than its long-term trend rate, other scenarios have also been considered.
Understanding customers’ financial position at an individual level at the point of sale.
Managing premium collections and monitoring for early indicators of financial distress.
Monitoring multiple external economic factors and incorporating these into stress and scenario testing to understand our earnings and capital resilience to severe macro-economic events. Management actions have been identified to mitigate the impact on earnings of a pessimistic low growth scenario.
Our risk profile is considered through different lenses, reflecting the possible effect of risk on earnings, capital and the future sustainability of our business. The table below summarises the Group’s top five topical risks, taking into account the likelihood and severity of risks, where the severity assessment considers the financial, reputational, regulatory, people and legal impact of a risk. These risks are largely strategic in nature and are closely monitored and overseen by Group management, which gives regular updates to the Board and Executive Risk Committees.
Our business is also affected by a number of inherent risks, such as the exposure to market levels and insurance risk, which drives a significant proportion of our capital requirement and earnings at risk. Although market risk is material, a large portion is inherent within the nature of our product offering, as we are exposed to the impact of market movements on asset-based fees generated from client-selected investment. Our risk exposure to earnings and capital is measured and monitored half-yearly, with more frequent monitoring of key risk indicators to identify and track developing trends.
More information on our risk and capital management and risk profile is contained in the Risk and Capital Management section in this Annual Report. Additional risk information is disclosed in the consolidated financial statements, note E, in this Annual Report.
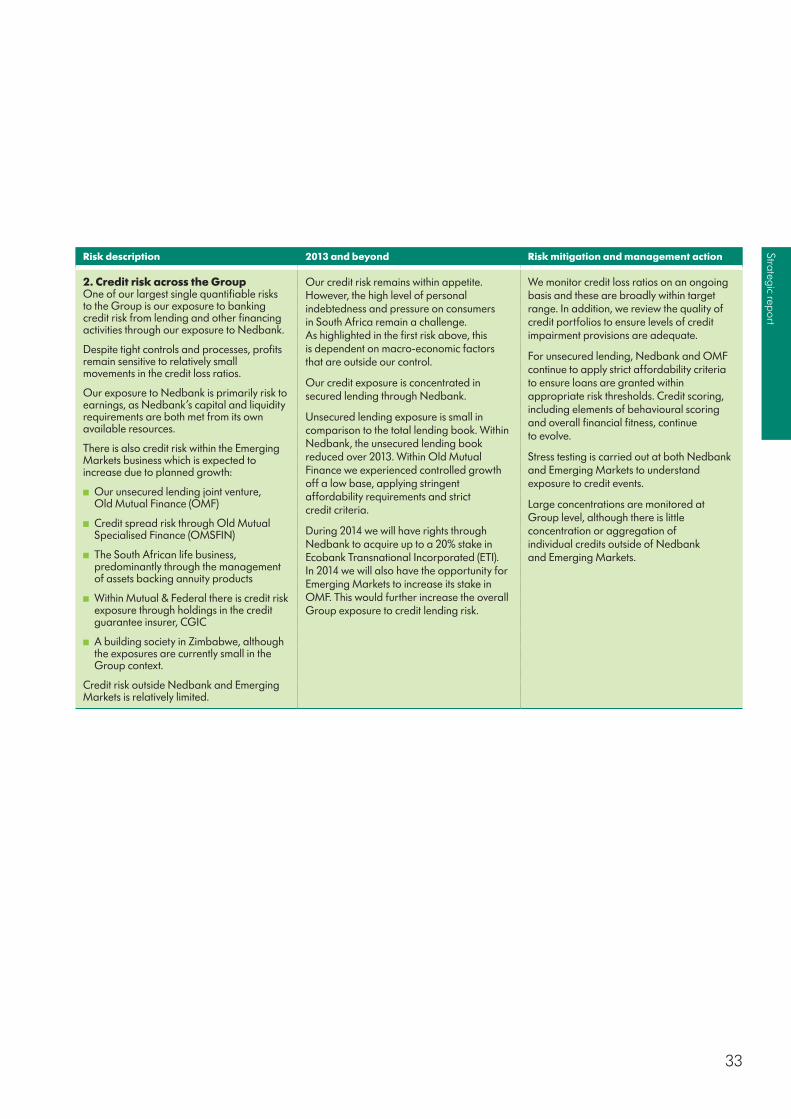
33
Strategic report
Risk description 2013 and beyond Risk mitigation and management action
2. Credit risk across the GroupOne of our largest single quantifiable risks to the Group is our exposure to banking credit risk from lending and other financing activities through our exposure to Nedbank.
Despite tight controls and processes, profits remain sensitive to relatively small movements in the credit loss ratios.
Our exposure to Nedbank is primarily risk to earnings, as Nedbank’s capital and liquidity requirements are both met from its own available resources.
There is also credit risk within the Emerging Markets business which is expected to increase due to planned growth:
■ Our unsecured lending joint venture, Old Mutual Finance (OMF)
■ Credit spread risk through Old Mutual Specialised Finance (OMSFIN)
■ The South African life business, predominantly through the management of assets backing annuity products
■ Within Mutual & Federal there is credit risk exposure through holdings in the credit guarantee insurer, CGIC
■ A building society in Zimbabwe, although the exposures are currently small in the Group context.
Credit risk outside Nedbank and Emerging Markets is relatively limited.
Our credit risk remains within appetite. However, the high level of personal indebtedness and pressure on consumers in South Africa remain a challenge. As highlighted in the first risk above, this is dependent on macro-economic factors that are outside our control.
Our credit exposure is concentrated in secured lending through Nedbank.
Unsecured lending exposure is small in comparison to the total lending book. Within Nedbank, the unsecured lending book reduced over 2013. Within Old Mutual Finance we experienced controlled growth off a low base, applying stringent affordability requirements and strict credit criteria.
During 2014 we will have rights through Nedbank to acquire up to a 20% stake in Ecobank Transnational Incorporated (ETI). In 2014 we will also have the opportunity for Emerging Markets to increase its stake in OMF. This would further increase the overall Group exposure to credit lending risk.
We monitor credit loss ratios on an ongoing basis and these are broadly within target range. In addition, we review the quality of credit portfolios to ensure levels of credit impairment provisions are adequate.
For unsecured lending, Nedbank and OMF continue to apply strict affordability criteria to ensure loans are granted within appropriate risk thresholds. Credit scoring, including elements of behavioural scoring and overall financial fitness, continue to evolve.
Stress testing is carried out at both Nedbank and Emerging Markets to understand exposure to credit events.
Large concentrations are monitored at Group level, although there is little concentration or aggregation of individual credits outside of Nedbank and Emerging Markets.

Old Mutual plcAnnual Report and Accounts 2013
34
Risk description 2013 and beyond Risk mitigation and management action
3. Currency translation riskAt a Group level our earnings, dividend and regulatory surplus capital are expressed in pounds but the majority of the Group’s earnings and its surplus capital are denominated in rand. The translation of our rand earnings and capital are therefore affected by movements in exchange rates.
In 2013, the rand depreciated from R13.77 to R17.43 against the pound, following a period of some years during which the rand exchange rate was in a range of R10 to R15 to the pound. Future exchange rates are difficult to predict but there are some macro-economic factors that point to possible further rand weakness in the medium-term. These include the current account deficit, 6.5% of GDP in Q4 2013, and the possibility of capital outflows from South Africa as some external investors may sell their holdings of South African government bonds should global interest rates rise.
Holding capital resources (including the Group’s issued debt) to meet our capital requirements in matched currencies and servicing interest on debt with matching earnings.
The balance of cash flows earned in rand and other currencies is closely monitored and the dividend policy, through its link to earnings, in part addresses this risk.
In addition, the Group’s plans to grow the proportion of earnings in currencies other than the rand in the medium-term is expected to reduce the proportion of the Group’s dividend that is met by remittances in rand from group-owned businesses.
Forward currency contracts are used to hedge expected rand cash flows used to make dividend payments in pounds.
Understanding of the resilience of the Group’s capital and capacity to pay dividends in the event of significant appreciation and depreciation of the currencies to which the Group is exposed is improved through stress and scenario testing.
4. Strategic execution risk and pace of change across the Old Mutual GroupThere is currently, and for the foreseeable future, a high degree of execution risk associated with the scale and pace of change across the Group. Most notably:
■ Implementation of the outsourcing arrangement with IFDS within Old Mutual Wealth
■ The build out of the asset management capability within Old Mutual Wealth
■ Emerging Markets is facing significant transformation in the South African life and property and casualty businesses, and simultaneous expansion into East and West Africa.
The Old Mutual Wealth business plan seeks to transform the business into a simpler, unified business with updated IT systems. This strategy focuses mainly on the UK and international markets. The level of operational risk within Old Mutual Wealth is increasing in the short-term, reflecting the significant changes to the operating model and staffing changes resulting in less continuity. In addition, a key focus over the next few years will be on the execution of the outsourcing arrangement with IFDS and of the Intrinsic Financial Services acquisition.
During 2013, Emerging Markets acquired stakes in a number of businesses across Africa. During 2014, work will continue on integrating these businesses and pursuing further acquisitions.
During the past year new governance structures have been put in place in both Old Mutual Wealth and Emerging Markets to streamline their boards, aiming to leverage experienced local non-executive director skills and experience to more effectively challenge key strategic initiatives.
In addition, executive and risk functions have been enhanced in many areas to provide clearer line of oversight.
For key projects across the Group, there is centralised oversight at Group Head Office over and above the business unit oversight.
Within Old Mutual Wealth, there is executive oversight of the IFDS outsourcing project, together with a dynamic programme governance approach that takes into account lessons learnt from previous major projects (eg. Retail Distribution Review implementation) and activity prioritisation.
We will continue to focus on the control environment and prompt escalation in order to mitigate the increased operational risk.
PRINCIPAL RISKS AND UNCERTAINTIEScontinued
35
Strategic report
Risk description 2013 and beyond Risk mitigation and management action
5. Changing shape of the industry due to changing customer needs and regulations, particularly consumer-focused regulationsAttracting new and retaining existing customers is key to delivering our strategy. New and evolving consumer-focused regulation, non-traditional distribution methods, new technologies and changing customers’ needs and preferences are altering the distribution and competitive landscape across the Group’s geographies. This may place business plans and our growth strategy at risk if our business model is not flexible to allow us to adapt quickly and effectively to the changing landscape.
Our customers’ needs are evolving. Consumers want to be more in control of their finances. With the growing digital era and technological advances, consumers increasingly rely on and prefer technological tools for a number of tasks. Despite this, a need for individual attention remains. Consumers seek quality as well as original offerings that meet their personal needs, and it is important that service remains convenient both in terms of time and effort.
From a regulatory perspective, regulators across the globe continue to focus on the fair treatment of customers and both principles and appropriate regulation in this area are evolving. In particular, there is increased focus on product design, advice and the product life cycle after the sales process.
The strategic initiatives across the Group are focused on streamlining our business to allow us to adapt more easily to the changing customer needs and regulations. This includes implementation of IT solutions that allow us to implement new products and system changes more quickly.
In addition, our brand promise and commitment to operating responsibly, with a strong customer focus and culture, positions us well to respond to consumer-focused regulation.
Our KPIs include a customer advocacy measure in the form of the Net Promoter Score (NPS). The NPS is a customer loyalty metric that looks at how likely our customers are to recommend Old Mutual to their family and friends.
In addition, our ACT NOW! Leadership Behaviours, which are formally measured as part of our performance management system, includes a behaviour around putting the customer first, and we measure our customer culture annually through our group-wide culture survey.
From a regulatory perspective, where there are similar regulatory themes developing, we leverage knowledge from different geographies across the Group to anticipate and implement the regulations as they arise.

Old Mutual plcAnnual Report and Accounts 2013
36
GROUP EXECUTIVE COMMITTEE1 2 3 4 5
The Group Executive Committee comprises the Group Chief Executive, the Group Finance Director and nine other members of senior executive management of the Group.
3. Peter Bain (55) President and Chief Executive Officer, US Asset ManagementPeter Bain is President and Chief Executive Officer of US Asset Management, the US-based international asset management business of Old Mutual plc. He has more than two decades of experience leading and advising firms in the investment management industry. Previously he was a Senior Executive Vice President at Legg Mason, Inc., where he held leadership positions from 2000 – 2009. Most recently he served as Head of Affiliate Management and Corporate Strategy there, with responsibility for overseeing the firm’s investment managers. Prior to that, he was Chief Administrative Officer, responsible for the firm’s overall administration and operations.
4. Mike Brown (47) Chief Executive, Nedbank GroupMike Brown has been Chief Executive of Nedbank Group Limited since March 2010. He was previously the Chief Financial Officer of Nedbank Group and of Nedbank Limited from June 2004. Prior to that, he headed Property Finance at Nedbank and before that he was an executive director of BoE Limited.
5. Paul Feeney (50) Chief Executive, Old Mutual WealthPaul Feeney has been Chief Executive of Old Mutual Wealth, incorporating Skandia Investment Group and Old Mutual Global Investors, since July 2012. He joined Old Mutual in January 2012 as CEO of Asset Management within the Long-Term Savings Division before moving into his present position. Prior to joining Old Mutual, he was Executive Director and Global Head of Distribution for BNY Mellon Asset Management and before that Group Managing Director of Gartmore Investment Management and CEO of Natwest Private Banking.
1. Julian Roberts (56) Group Chief ExecutiveAlso a member of the Nomination Committee and a non-executive director of Nedbank Group Limited, Nedbank Limited and Old Mutual Life Assurance Company (South Africa) Limited.
Julian Roberts joined Old Mutual in 2000 as Group Finance Director, moving on to become CEO of Skandia following its purchase by Old Mutual in 2006. He was appointed as Group Chief Executive in September 2008. Before joining Old Mutual, he was Group Finance Director of Sun Life & Provincial Holdings plc and, before that, Chief Financial Officer of Aon UK Holdings Limited.
2. Philip Broadley (53) Group Finance DirectorAlso a non-executive director of Old Mutual Wealth Management Limited, Old Mutual (Bermuda) Limited and Old Mutual (US) Holdings Inc., the parent company of US Asset Management.
Philip Broadley joined Old Mutual as Group Finance Director in November 2008. Prior to that, he had been Group Finance Director of Prudential plc from 2000 – 2008, having previously been a partner in Arthur Andersen from 1993 – 2000. He has been Chairman of the 100 Group of Finance Directors, was a founding member and trustee of the CFO Forum of European Insurance Company Finance Directors, and was a member of the IASB’s Insurance Working Group. He is a member of the Code Committee of the UK Takeover Panel and of the Oxford University Audit and Scrutiny Committee.

37
Strategic report
6 7 8 9 10 11
6. Ian Gladman (49) Group Strategy DirectorIan Gladman has been Group Strategy Director since January 2012. He previously worked at UBS Investment Bank for 16 years, most recently as Co-Head of Financial Institutions, EMEA, covering a wide range of UK and European insurance companies, banks and asset managers. He was previously Head of Corporate Finance, South Africa for UBS from 1998 to 2001, during which time he led the local UBS team advising Old Mutual on its demutualisation and original listing. He also advised Nedbank on a number of assignments and BoE on its acquisition by Nedbank. Prior to joining UBS, he worked at Goldman Sachs and at JP Morgan.
7. Paul Hanratty (52) Group Operating OfficerPaul Hanratty has been Group Operating Officer since March 2013. He is a fellow of the Institute of Actuaries and has held a number of roles at Old Mutual, including CEO of Old Mutual South Africa and CEO of Long-Term Savings businesses.
8. Carlton Hood (42) Group Customer DirectorCarlton Hood became Group Customer Director in April 2013, having rejoined Old Mutual in 2011 as Strategic Marketing Director for the Long-Term Savings Division. Prior to that, he had been CEO of Confused.com, an online price comparison business. From 2000 – 2008 he held a number of positions with the Old Mutual Group in Cape Town, including the role of GM Strategy and Marketing for OMSA. He started his career in strategy consulting, working for the Boston Consulting Group in London for seven years.
9. Sue Kean (51) Chief Risk OfficerSue Kean has been Chief Risk Officer since January 2012, having joined Old Mutual in July 2010 as Head of Governance & Regulatory Compliance. She has over 25 years’ experience in insurance and financial services. She previously worked at Friends Provident and Aviva in a variety of risk and regulatory roles. She also spent time at the Financial Services Authority, and held positions in relation to Solvency II on industry bodies such as the Chief Risk Officer Forum and the European insurance trade body, the Comité Européen des Assurances (CEA).
10. Ralph Mupita (41) CEO, Old Mutual Emerging MarketsRalph Mupita has been CEO of OMEM since February 2012. He joined Old Mutual in 2001, became Managing Director of Old Mutual Unit Trusts in 2004 and OMSA’s Strategy Director in 2006. In 2008 he was appointed Managing Director of OMSA’s Retail Affluent division and in April 2011 he became CEO of Old Mutual Life and Savings. He is a director of OMEM, OMLACSA and Old Mutual Africa Holdings and serves on various external boards such as the Association for Savings & Investments SA, Business Leadership South Africa, Brand SA and the University of Cape Town advisory board.
11. Don Schneider (56) Group Human Resources DirectorDon Schneider has been Group Human Resources Director since May 2009. He is also a non-executive director of Old Mutual (US) Holdings Inc., the parent company of Old Mutual US Asset Management. He was previously at Merrill Lynch, where he was Senior Vice President, Head of Human Resources for their Global Wealth Management Division based in New York. Prior to that, he headed HR for their Global Markets and Investment Banking Division and originally joined Merrill Lynch in 1997 as Head of International Human Resources based in London. Previously, he worked for Morgan Stanley for 13 years, where he held a variety of senior HR roles in both New York and London. He started his career as a consultant in human resources.
NOTE: The nine members of the senior executive management are listed alphabetically.

Old Mutual plcAnnual Report and Accounts 2013
38
BUSINESS REVIEW SUMMARY
Emerging MarketsBusiness reviewOld Mutual Emerging Markets operates in 13 countries across Africa, Latin America and Asia. We provide individuals, businesses, corporates and institutions with long-term savings, protection and investment solutions in these geographies and through these business segments:
South AfricaRetail Affluent offers a wide range of wealth creation and protection products, as well as asset management, to customers in the middle-income to high net worth bracket.
Mass Foundation offers a wide range of savings and protection products to customers in the lower income and foundation market, as well as loans through its joint venture, Old Mutual Finance.
Corporate segment caters for the needs of institutional and corporate investors through retirement and group risk products.
Old Mutual Investment Group (OMIG) is a multi-boutique asset management and investment business that offers clients access to a full array of investment offerings, styles and asset classes. Its priority is to deliver performance through focus.
Africa (excluding SA)Old Mutual currently has operations in Namibia, Zimbabwe, Malawi, Kenya, Swaziland, Nigeria and Ghana where we offer various corporate and retail solutions in the areas of life and savings, property and casualty, asset management and banking. Our products are punctuated by sound financial advice, efficient service and value for money to our customers.
Asia and Latin AmericaIn Colombia we operate in the affluent market, providing mandatory and voluntary pensions, investment and saving solutions, offshore investment products and institutional asset management.
In Mexico we focus on providing the corporate market with voluntary private pension plans and providing the retail market with long-term savings and risk products, solutions and advice.
AIVA is a newly acquired distribution platform based in Uruguay, spanning the Latin American region. It provides services to a network of IFAs, wealth managers and other institutions.
Old Mutual-Guodian is a 50/50 joint venture in China with Guodian, one of the country’s
Ralph MupitaCHIEF EXECUTIVE OFFICEREMERGING MARKETS
Solid operational delivery and strategic progress in Africa through a challenging economic environment.
five largest power producers. It provides long-term savings solutions through a tied adviser force and a telesales company. Customers include Guodian employees and affluent bank customers.
Old Mutual Kotak Mahindra is our 26%-owned joint venture in India with Kotak Mahindra Bank, providing life insurance, retirement pensions, savings and investments.
Competitive environmentIn total life sales we rank first among South African peers including Sanlam, Liberty, Discovery and MMI, with over 20% market share.
Our key competitors in African markets are our large South African insurance peers, with limited competition from the large international insurers in selected markets. We have dominant market share positions in the Southern African Development Community (SADC) region, while our businesses in East and West Africa are developing rapidly from a relatively small base.
In Mexico, we we have a strong Corporate business, with 6% market share in Voluntary pensions, and in Colombia, we have over 33% of the voluntary unit trust market. In India, Kotak Life Insurance ranks eighth out of 23 life JVs. In China the Old Mutual-Guodian JV ranks fifth out of 26 life JVs.
Market trendsIn recent years there has been a continuing shift in the South African affluent market from traditional life products to investment products including unit trusts.
In the mass foundation market, funeral policies sold through tied agents form the bulk of sales, although sales of investment and savings products are rising rapidly as incomes continue to grow.
Protection sales continue to be a significant part of the industry, reflecting low levels of public provision and relatively high mortality and morbidity compared to other middle-income countries.
In the corporate market there has been a shift away from traditional employee benefits towards umbrella offerings and a consolidation of smaller, standalone administration platforms.
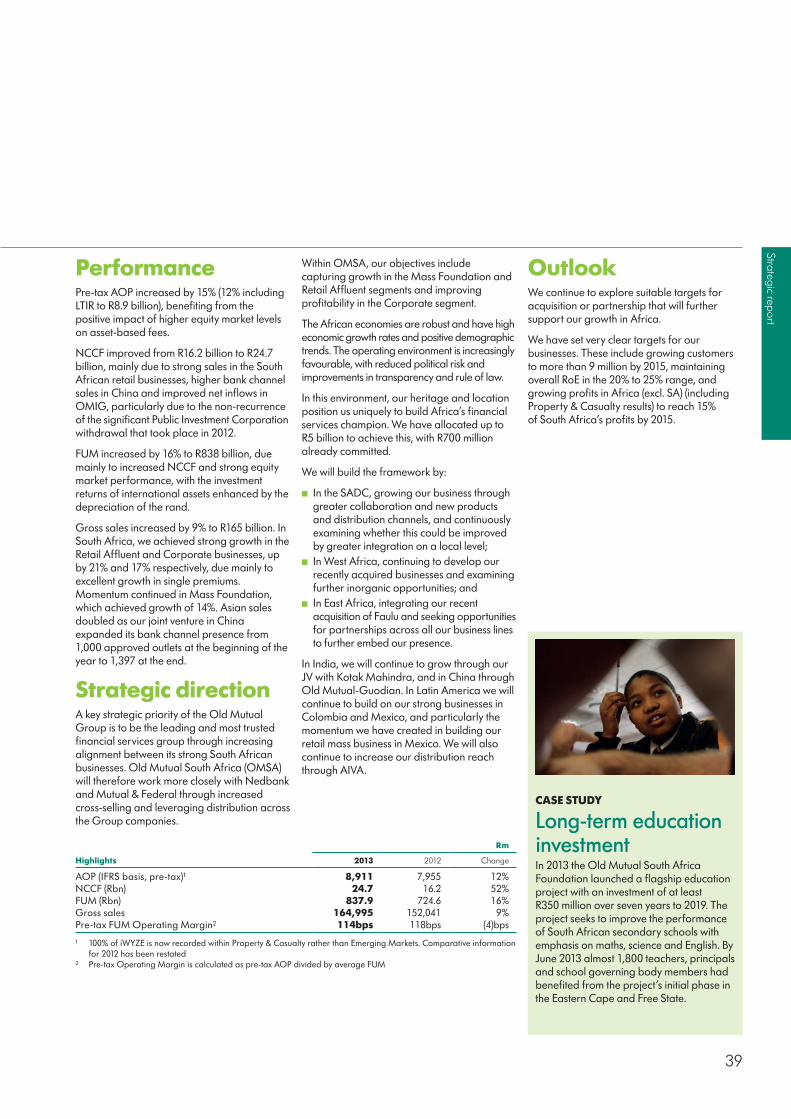
39
Strategic report
PerformancePre-tax AOP increased by 15% (12% including LTIR to R8.9 billion), benefiting from the positive impact of higher equity market levels on asset-based fees.
NCCF improved from R16.2 billion to R24.7 billion, mainly due to strong sales in the South African retail businesses, higher bank channel sales in China and improved net inflows in OMIG, particularly due to the non-recurrence of the significant Public Investment Corporation withdrawal that took place in 2012.
FUM increased by 16% to R838 billion, due mainly to increased NCCF and strong equity market performance, with the investment returns of international assets enhanced by the depreciation of the rand.
Gross sales increased by 9% to R165 billion. In South Africa, we achieved strong growth in the Retail Affluent and Corporate businesses, up by 21% and 17% respectively, due mainly to excellent growth in single premiums. Momentum continued in Mass Foundation, which achieved growth of 14%. Asian sales doubled as our joint venture in China expanded its bank channel presence from 1,000 approved outlets at the beginning of the year to 1,397 at the end.
Strategic directionA key strategic priority of the Old Mutual Group is to be the leading and most trusted financial services group through increasing alignment between its strong South African businesses. Old Mutual South Africa (OMSA) will therefore work more closely with Nedbank and Mutual & Federal through increased cross-selling and leveraging distribution across the Group companies.
Within OMSA, our objectives include capturing growth in the Mass Foundation and Retail Affluent segments and improving profitability in the Corporate segment.
The African economies are robust and have high economic growth rates and positive demographic trends. The operating environment is increasingly favourable, with reduced political risk and improvements in transparency and rule of law.
In this environment, our heritage and location position us uniquely to build Africa’s financial services champion. We have allocated up to R5 billion to achieve this, with R700 million already committed.
We will build the framework by:
■ In the SADC, growing our business through greater collaboration and new products and distribution channels, and continuously examining whether this could be improved by greater integration on a local level;
■ In West Africa, continuing to develop our recently acquired businesses and examining further inorganic opportunities; and
■ In East Africa, integrating our recent acquisition of Faulu and seeking opportunities for partnerships across all our business lines to further embed our presence.
In India, we will continue to grow through our JV with Kotak Mahindra, and in China through Old Mutual-Guodian. In Latin America we will continue to build on our strong businesses in Colombia and Mexico, and particularly the momentum we have created in building our retail mass business in Mexico. We will also continue to increase our distribution reach through AIVA.
OutlookWe continue to explore suitable targets for acquisition or partnership that will further support our growth in Africa.
We have set very clear targets for our businesses. These include growing customers to more than 9 million by 2015, maintaining overall RoE in the 20% to 25% range, and growing profits in Africa (excl. SA) (including Property & Casualty results) to reach 15% of South Africa’s profits by 2015.
Rm
Highlights 2013 2012 Change
AOP (IFRS basis, pre-tax)¹ 8,911 7,955 12%NCCF (Rbn) 24.7 16.2 52%FUM (Rbn) 837.9 724.6 16%Gross sales 164,995 152,041 9%Pre-tax FUM Operating Margin2 114bps 118bps (4)bps
¹ 100% of iWYZE is now recorded within Property & Casualty rather than Emerging Markets. Comparative information for 2012 has been restated
2 Pre-tax Operating Margin is calculated as pre-tax AOP divided by average FUM
CASE STUDY
Long-term education investmentIn 2013 the Old Mutual South Africa Foundation launched a flagship education project with an investment of at least R350 million over seven years to 2019. The project seeks to improve the performance of South African secondary schools with emphasis on maths, science and English. By June 2013 almost 1,800 teachers, principals and school governing body members had benefited from the project’s initial phase in the Eastern Cape and Free State.

Old Mutual plcAnnual Report and Accounts 2013
40
BUSINESS REVIEW SUMMARY
NedbankBusiness reviewStructure and servicesNedbank provides a wide range of wholesale and retail banking services and a growing insurance, asset management and wealth management offering through five main business clusters: Nedbank Retail, Nedbank Business Banking, Nedbank Capital, Nedbank Corporate and Nedbank Wealth. Nedbank is positioned as a bank for all, servicing multiple market segments.
Nedbank Group is listed on the Johannesburg and Namibian Stock Exchanges, with a market capitalisation of over R100 billion at the end of 2013. Old Mutual has a majority shareholding and owned 52% of Nedbank at 31 December 2013.
Geographic presenceHeadquartered in Sandton, Johannesburg, the banking group has a regional branch network of over 1,050 staffed outlets across South Africa, banking subsidiaries in 6 African countries of Namibia, Lesotho, Malawi, Swaziland and Zimbabwe, as well as an initial shareholding of 36.4% in Banco Unico (targeted for completion by the end of the first quarter of 2014) in Mozambique. In addition, Nedbank has representative offices in Kenya and Angola and presence in key financial centres including London, Isle of Man, Guernsey, Toronto and Dubai.
Nedbank has had a strategic alliance with Ecobank Transnational International (ETI), a banking group based in Togo, West Africa since 2008 and together with Ecobank, we have the ability to service our customers across 37 countries in Africa. We have subscription rights to take up to a 20% shareholding in ETI and a formal decision will be made during the rights exercise period in 2014.
Competitive position and competitorsSouth Africa has a strong four pillar banking industry with Standard Bank holding 25% of the total advances, First Rand 22%, Barclays Africa 21% and Nedbank 19%.
Nedbank Group is the fourth largest South African bank measured on market capitalisation, total assets and headline earnings. We are a top two corporate bank, a market leader in commercial property finance and our repositioned retail bank has gained 2.2 million customers over the past few years to 6.4 million.
Through our pan-African banking alliance with Ecobank, we give our customers access to the largest banking network across Africa.
We also hold leadership positions in sustainability, transformation and community development.
PerformanceNedbank Group performed well for the year ended 31 December 2013. The results reflect the tougher-than-anticipated economic environment offset by delivery on our strategic focus areas and continued internal momentum in building and growing the Nedbank franchise.
Headline earnings increased 15.9% to R8,670 million, driven by good revenue growth, impairments increasing at a slower rate than net interest income and disciplined expense management.
Diluted headline earnings per share (HEPS) increased 15.0% to 1,829 cents and diluted earnings per share increased 15.1% to 1,822 cents.
We have continued to create value for our shareholders by increasing net asset value per share by 12.1% to 13,143 cents and dividends per share by 19.0% to 895 cents per share.
Rm
Highlights 2013 2012 % change
AOP (IFRS basis, pre-tax) 12,026 10,738 12%Headline earnings 8,670 7,483 16%Net interest income 21,220 19,680 8%Non-interest revenue 19,361 17,324 12%Net interest margin 3.57% 3.53%Credit loss ratio 1.06% 1.05%Return on Equity 15.6% 14.8%Common equity Tier 1 ratio1 12.5% 11.6%
1 Calculated by Nedbank as a Basel III basis
Mike BrownCHIEF EXECUTIVE OFFICERNEDBANK
Solid performance off strong foundations in a more difficult environment.

41
Strategic report
Nedbank generated economic profit (EP) of R2,114 million, up 39.0%. The return on average ordinary shareholders’ equity (RoE), excluding goodwill, increased to 17.2% (2012: 16.4%) and the RoE increased to 15.6% (2012: 14.8%), benefiting from an increased return on assets (RoA) of 1.23% (2012: 1.13%).
Nedbank Group is well capitalised, with the Basel III common-equity tier 1 ratio at 12.5% – at the top end of our internal target range. Funding and liquidity levels remained sound, with the surplus liquidity buffer at R28.0 billion (2012: R24.4 billion), and the final-quarter average long-term funding ratio was maintained at 26.2%. We are Liquidity Coverage Ratio (LCR) compliant on a proforma basis.
Strategic directionOur vision is to be Africa’s most admired bank by our employees, customers, shareholders, regulators and communities. Over the past four years, Nedbank’s franchise has grown strongly: our brand value has increased by 38% to R10.9bn since 2009 as measured by Brand Finance South Africa’s 50 Most Valuable Brands Survey.
We have made significant progress in delivering on our four key strategic focus areas of repositioning Nedbank Retail, growing NIR, implementing the portfolio tilt strategy and expanding into Africa. We have now refined these to better reflect these underlying drivers of our strategic growth strategy:
■ Client centred innovation ■ Growing our transactional banking franchise
■ Optimise to invest ■ Strategic Portfolio Tilt ■ Pan-African banking network.
OutlookImproved prospects for developed economies, together with the tapering off of quantitative easing, will lead to global volatility and pose downside risk to many emerging markets. A further concern is China’s economic slowdown, given its importance as a trade partner for South Africa.
Nedbank currently anticipates South African GDP growth of 2.6% in 2014. Growth in household credit demand is unlikely to improve in 2014 while employment conditions remain poor, real income constrained and consumer debt levels high. The rate and extent of further interest rate increases will impact the consumers’ ability to service their debts.
In the context of this volatile and uncertain economic outlook, forecast risk is high. Against this background, we expect our advances to grow at mid- to upper single digits and our net interest margin to remain stable. We anticipate the credit loss ratio to be within the new range of 80 to 120 basis points, improving slightly on 2013. Non-interest revenue is anticipated to grow at mid- to upper single digits and expenses at upper single digits. We currently expect organic diluted HEPS growth in 2014 to be greater than the growth in nominal GDP.
CASE STUDY
Nedbank App SuiteNedbank recognised the growing importance of mobile banking and in 2013 launched the Nedbank App Suite – a mobile application platform for customers across retail, business banking and wholesale banking. Over 340,000 downloads have been received since the Nedbank App Suite was launched and transactions valued at over R6 billion have taken place through this platform (over 10.5m transactions). In addition, the Nedbank App Suite along with other electronic banking channels such as internet
banking, utilises Approve ITTM a world class security feature that has enabled a significant reduction in fraud incidents and positions Nedbank at the forefront of risk management in mobile banking. As a result Nedbank won the 2013 MTN Android Consumer App of the year award, demonstrating the progress we have made, and our increasing relevance and responsiveness to our customers in an increasingly competitive banking environment.

Old Mutual plcAnnual Report and Accounts 2013
42
BUSINESS REVIEW SUMMARY
Property & Casualty
Raimund SnydersCHIEF EXECUTIVE OFFICERMUTUAL & FEDERAL
Tough operating conditions whilst business changes are being implemented.
Business reviewStructure and servicesMutual & Federal, the Old Mutual Group’s property and casualty business, is southern Africa’s oldest short-term (otherwise known as general or property and casualty) insurer. Our history dates back more than 180 years. As one of the leading players in the region’s short-term insurance landscape, we are proud of our tradition of service and quality, as well as our range of products.
We offer an extensive range of insurance products and solutions to meet personal, commercial and corporate needs. We also provide cover for the agricultural, engineering and marine sectors. We often partner with brokers to deliver personal advice and service to customers, and work in partnership with the Group’s Mass Foundation business and Nedbank Retail to deliver direct insurance solutions through iWYZE.
Geographic presenceThe Old Mutual Group has property and casualty businesses in South Africa, Namibia, Botswana, Zimbabwe, and most recently Nigeria, through our acquisition of Oceanic General Insurance.
Competitive position and competitorsIn South Africa we are the number two property and casualty insurer with a 9.9% share of the overall short-term market, according to the latest available industry data. Santam is the largest player and other significant market players include Hollard & Etana, Outsurance and Zurich.
In Botswana we are ranked fourth among all the short-term players as of December 2011.
In Namibia we are ranked second in terms of market share, with over 28% of the market.
Although Oceanic commands a fairly small portion of the Nigerian market, we believe our
collaboration with Old Mutual and Ecobank will generate significant growth in the coming years.
In Swaziland we currently own 16% of Swaziland Royal Insurance Corporation, the country’s foremost provider of short-term insurance.
In Zimbabwe RM Insurance is ranked third in terms of market share, with 11.7% of the market.
Market trendsThe South African property and casualty industry saw combined ratios deteriorate significantly during 2013. The year was characterised by large claims arising from severe hailstorms, floods and droughts in different parts of South Africa, as well as rising motor claims costs as a result of increasing prices for imported car parts.
PerformanceA disappointing underwriting loss of R437 million can largely be attributed to severe weather-related losses in the fourth quarter, drought conditions leading to poor Agriculture results in the first half and a continuing soft market in the South African property and casualty sector. The underwriting loss deteriorated from the prior year with the margin worsening by 3.2% to a loss of 4.9%. Flood and hail damage caused an increase in both claims frequency and severity.
Gross written premium grew 17% year on year, reflecting strong growth of 36.7% in the Corporate & Niche segment which delivered gross written premiums of R3,527 million (2012: R2,581 million). Much of the growth in premiums was due to inwards reinsurance business, which primarily consist of open market and strategic attritional losses treaty business.
iWYZE, our joint venture with the Old Mutual Mass Foundation business, achieved solid growth in gross written premium of 10.8%, and a significant improvement in the claims ratio.
Rm
Highlights 2013 20121 % change
Underwriting margin (4.9)% (1.7)%Underwriting result (437) (132) (231)%AOP (IFRS basis, pre-tax) 58 475 (88)%Gross written premiums 11,315 9,706 17%
¹ Comparatives have been restated to reflect 100% of the iWYZE results

43
Strategic report
CASE STUDY
Weather alerts for customers
In 2012 and 2013, South Africa experienced severe hailstorms which resulted in an increase in the number of claims related to hail damage. In August 2013 we partnered with a weather service provider to introduce a weather alerts service to our customers. This warns customers of forecast adverse weather conditions such as hail, so that they can avoid damage – and reduce claims cost and frequency – by parking their vehicles under cover.
Strategic directionManagement has clear plans to address challenges over the current business planning period by focusing on:
■ Remediating rates and improving risk selection in Personal lines
■ Improving claims efficiency and effectiveness while combating claims fraud
■ Reducing operating expenses ■ Improving the operating model ■ Improving customer and broker experience ■ Creating a high-performance culture.
At the same time were are planning significant expansion in Africa:
■ West Africa: Successfully establish our new business in Nigeria and explore the prospects for using this as a springboard for further expansion into the region, specifically into Ghana
■ East Africa: Investigate and engage opportunities to enter the region through Kenya and complement the Group’s efforts to build scale and capacity in the region
■ Southern Africa: Explore opportunities to generate more value for the Group in countries such as Botswana, Swaziland and Zambia and consider eventual entry into Mozambique and Angola.
OutlookIn the latter part of the year, remedial action taken in our personal lines division showed some modest impact as the policy count began to stabilise, but the continued depreciation of the rand led to increased motor-related claims costs on imported parts.
Despite the challenging market conditions in 2013, we expect a hardening of the market in 2014 as competitors also increase premiums in response to rising claims cost pressures. Our primary focus is on restoring the profitability of the business in 2014 rather than on premium growth. In our personal segment, greater collaboration within the Old Mutual Group will be the driving force behind future growth as well as the expansion into Africa.
In the longer term, the management team is focused on improving return on equity to 15% to 20% by 2016 through the management of claims costs, capital management and underwriting margin.
We are confident that our management actions will positively impact progress towards our stated targets, while acknowledging that an increase in the frequency and severity of weather-related claims increases our earnings volatility, given the current business risk profile.
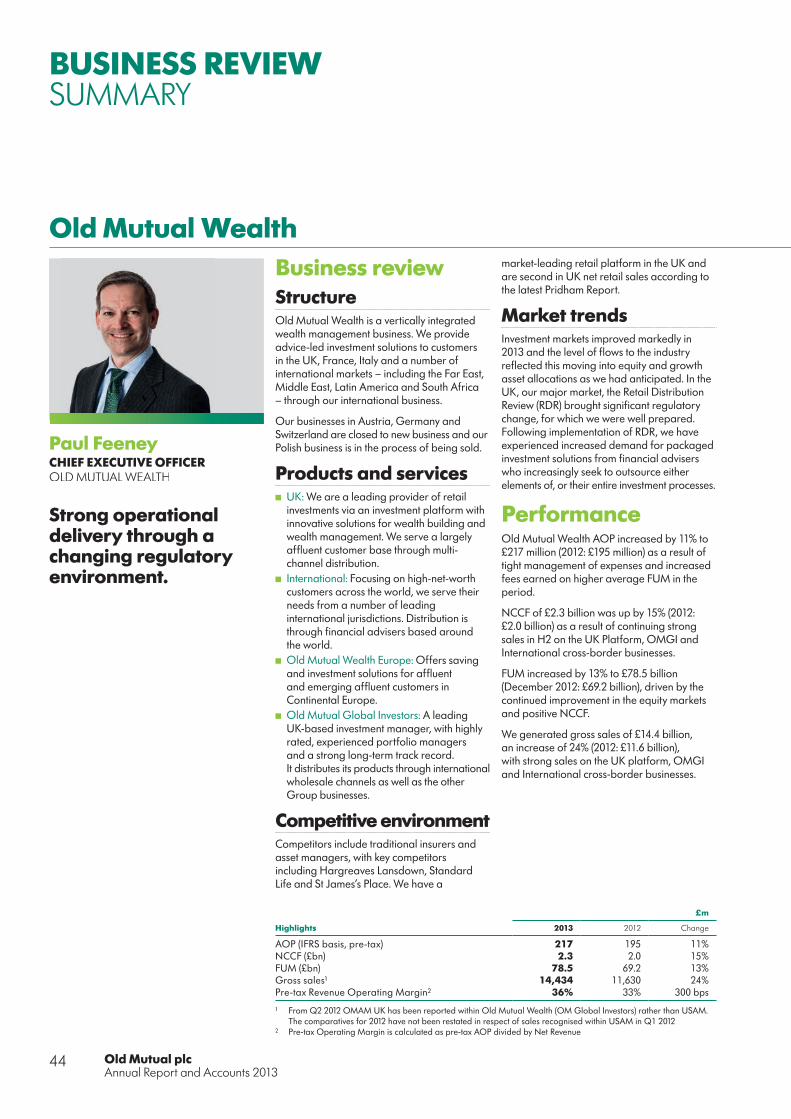
Old Mutual plcAnnual Report and Accounts 2013
44
BUSINESS REVIEW SUMMARY
Old Mutual Wealth
Paul FeeneyCHIEF EXECUTIVE OFFICEROLD MUTUAL WEALTH
Strong operational delivery through a changing regulatory environment.
Business reviewStructure Old Mutual Wealth is a vertically integrated wealth management business. We provide advice-led investment solutions to customers in the UK, France, Italy and a number of international markets – including the Far East, Middle East, Latin America and South Africa – through our international business.
Our businesses in Austria, Germany and Switzerland are closed to new business and our Polish business is in the process of being sold.
Products and services ■ UK: We are a leading provider of retail investments via an investment platform with innovative solutions for wealth building and wealth management. We serve a largely affluent customer base through multi-channel distribution.
■ International: Focusing on high-net-worth customers across the world, we serve their needs from a number of leading international jurisdictions. Distribution is through financial advisers based around the world.
■ Old Mutual Wealth Europe: Offers saving and investment solutions for affluent and emerging affluent customers in Continental Europe.
■ Old Mutual Global Investors: A leading UK-based investment manager, with highly rated, experienced portfolio managers and a strong long-term track record. It distributes its products through international wholesale channels as well as the other Group businesses.
Competitive environmentCompetitors include traditional insurers and asset managers, with key competitors including Hargreaves Lansdown, Standard Life and St James’s Place. We have a
market-leading retail platform in the UK and are second in UK net retail sales according to the latest Pridham Report.
Market trendsInvestment markets improved markedly in 2013 and the level of flows to the industry reflected this moving into equity and growth asset allocations as we had anticipated. In the UK, our major market, the Retail Distribution Review (RDR) brought significant regulatory change, for which we were well prepared. Following implementation of RDR, we have experienced increased demand for packaged investment solutions from financial advisers who increasingly seek to outsource either elements of, or their entire investment processes.
PerformanceOld Mutual Wealth AOP increased by 11% to £217 million (2012: £195 million) as a result of tight management of expenses and increased fees earned on higher average FUM in the period.
NCCF of £2.3 billion was up by 15% (2012: £2.0 billion) as a result of continuing strong sales in H2 on the UK Platform, OMGI and International cross-border businesses.
FUM increased by 13% to £78.5 billion (December 2012: £69.2 billion), driven by the continued improvement in the equity markets and positive NCCF.
We generated gross sales of £14.4 billion, an increase of 24% (2012: £11.6 billion), with strong sales on the UK platform, OMGI and International cross-border businesses.
£m
Highlights 2013 2012 Change
AOP (IFRS basis, pre-tax) 217 195 11%NCCF (£bn) 2.3 2.0 15%FUM (£bn) 78.5 69.2 13%Gross sales¹ 14,434 11,630 24%Pre-tax Revenue Operating Margin2 36% 33% 300 bps
¹ From Q2 2012 OMAM UK has been reported within Old Mutual Wealth (OM Global Investors) rather than USAM. The comparatives for 2012 have not been restated in respect of sales recognised within USAM in Q1 2012
2 Pre-tax Operating Margin is calculated as pre-tax AOP divided by Net Revenue

45
Strategic report
Strategic directionWe are creating a modern, vertically integrated wealth management and asset management business. In the UK we are building the leading retail investment business.
We are making strong progress towards our IFRS profit target of £300 million by 2015, through capital-efficient delivery of customer-focused investment and risk solutions.
We have made significant progress in our strategy of developing into an integrated wealth management business through six key steps:
■ Creating one business ■ Building-out the asset management business ■ Widening our proposition: WealthSelect and other product launches
■ Transforming our platforms: Wealth Interactive and UK administration
■ Building-out distribution: Asia and AIVA ■ Managing for value: European and UK Heritage businesses
OutlookWe have made significant progress in transforming our business in 2013 and 2014 will see further change. In the UK, we will launch the WealthSelect fund management suite, conclude the terms of our administrative outsourcing agreement and broaden our distribution capabilities. The objective is to increase our speed to market for our proposition and to service customers in the way that they find most convenient. We expect the sales momentum to continue into 2014 as we introduce further protection and retirement enhancements.
With Wealth Interactive implemented in International, we intend to increase our penetration in the markets we operate delivering flexible and user friendly products on an efficient platform.
We continue the planning for our outsourcing contract to boost product capability and lower our cost base from 2017 onwards. We expect an additional cash cost of approximately £140 million of the outsourcing agreement to be spent in the period of 2014 – 2016, which will be reported as exceptional IFRS costs and so excluded from adjusted operating profit.
The acquisition of the distribution business Intrinsic Financial Services, will allow us to diversify our distribution by becoming a ‘complementary’ advice channel, and will better position us to offer our own solutions. Given the substantial changes occurring in the industry, this move will solidify and maintain our presence in the advisory channel in the UK. It will also allow us to compete with other product providers who are acquiring their own distributors.
A revitalised Asia strategy will be launched at the end of Q1 2014 with the exclusive sales agreement with a leading institutional broker signed in December. We expect further collaboration with AIVA in Latin America, with the Life Investment Portfolio building a strong pipeline at the end of 2013 for 2014.
In OMGI, we expect continued strong growth of the UK Equity and Alternatives desks as well as through the Spectrum fund range. We remain focused on the launch of our multi-asset offerings including our Foundation fund in addition to developing our investment proposition in Asia.
At the same time as the WealthSelect launch in Q1 2014, there will be the final transfer of the heritage assets from the UK to OMGI of around £400 million. A final £200 million in Nordic outflows is expected in 2014.
We announced in November that we had agreed to sell our Polish business, as part of our commitment to simplify our operations and focus on a select number of core growth markets. The transaction is subject to regulatory approvals and other customary conditions and we expect to complete the sale in the next six months.
Given our current business profile and our ability to improve margin through increasing sales of our funds through our platforms, we remain confident of achieving our financial targets for Old Mutual Wealth and developing it into a fully-fledged wealth management business.
CASE STUDY
RDR readinessThe new Retail Distribution Review regulations represent the biggest overhaul of the UK financial services industry for some time and have a major impact on providers and advisers.
Thanks to the hard work and dedication of the RDR project teams, we completed the huge task of achieving compliance on time. One of many achievements is the launch of a consumer website in the UK supporting customers who no longer have a relationship with a financial adviser.
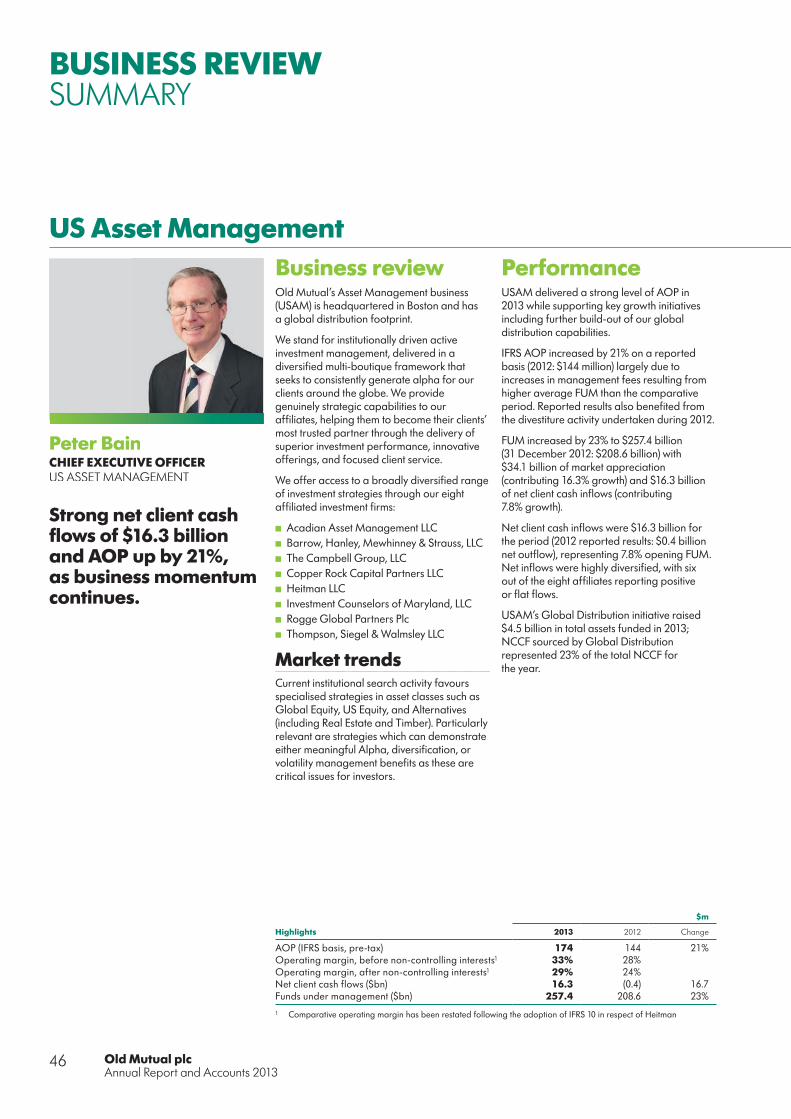
Old Mutual plcAnnual Report and Accounts 2013
46
US Asset Management
Peter BainCHIEF EXECUTIVE OFFICERUS ASSET MANAGEMENT
Strong net client cash flows of $16.3 billion and AOP up by 21%, as business momentum continues.
BUSINESS REVIEW SUMMARY
Business reviewOld Mutual’s Asset Management business (USAM) is headquartered in Boston and has a global distribution footprint.
We stand for institutionally driven active investment management, delivered in a diversified multi-boutique framework that seeks to consistently generate alpha for our clients around the globe. We provide genuinely strategic capabilities to our affiliates, helping them to become their clients’ most trusted partner through the delivery of superior investment performance, innovative offerings, and focused client service.
We offer access to a broadly diversified range of investment strategies through our eight affiliated investment firms:
■ Acadian Asset Management LLC ■ Barrow, Hanley, Mewhinney & Strauss, LLC ■ The Campbell Group, LLC ■ Copper Rock Capital Partners LLC ■ Heitman LLC ■ Investment Counselors of Maryland, LLC ■ Rogge Global Partners Plc ■ Thompson, Siegel & Walmsley LLC
Market trendsCurrent institutional search activity favours specialised strategies in asset classes such as Global Equity, US Equity, and Alternatives (including Real Estate and Timber). Particularly relevant are strategies which can demonstrate either meaningful Alpha, diversification, or volatility management benefits as these are critical issues for investors.
PerformanceUSAM delivered a strong level of AOP in 2013 while supporting key growth initiatives including further build-out of our global distribution capabilities.
IFRS AOP increased by 21% on a reported basis (2012: $144 million) largely due to increases in management fees resulting from higher average FUM than the comparative period. Reported results also benefited from the divestiture activity undertaken during 2012.
FUM increased by 23% to $257.4 billion (31 December 2012: $208.6 billion) with $34.1 billion of market appreciation (contributing 16.3% growth) and $16.3 billion of net client cash inflows (contributing 7.8% growth).
Net client cash inflows were $16.3 billion for the period (2012 reported results: $0.4 billion net outflow), representing 7.8% opening FUM. Net inflows were highly diversified, with six out of the eight affiliates reporting positive or flat flows.
USAM’s Global Distribution initiative raised $4.5 billion in total assets funded in 2013; NCCF sourced by Global Distribution represented 23% of the total NCCF for the year.
$m
Highlights 2013 2012 Change
AOP (IFRS basis, pre-tax) 174 144 21%Operating margin, before non-controlling interests1 33% 28%Operating margin, after non-controlling interests1 29% 24%Net client cash flows ($bn) 16.3 (0.4) 16.7 Funds under management ($bn) 257.4 208.6 23%
1 Comparative operating margin has been restated following the adoption of IFRS 10 in respect of Heitman

47
Strategic report
OutlookAssuming favourable market conditions, we expect strong business performance and financial growth to continue in 2014, including sustained positive net client cash flows and an operating margin greater than 30%, pre non-controlling interests. On an ongoing basis, we continue to target average annual net client cash inflows of 3% to 5% of opening FUM.
We remain focused on investing in affiliate growth initiatives and further penetration of non-US markets through our Global Distribution initiative.
We will also continue to explore selective inorganic growth opportunities that augment the portfolio and fill critical product or asset class gaps in our business.
CASE STUDY
Enhanced employee wellbeing schemeThis year, we redeveloped our employee wellness programme, reflecting employee suggestions to cover new topics including nutrition and retirement savings. We have initiated the provision of a telephone wellness coach and next year will introduce medical premium subsidies for employees
who participate in pre-defined wellness initiatives. We have also introduced treadmill desks in our Boston Head Office (pictured) that allow employees to exercise whilst working. These treadmill desks can be booked for meetings as well as individual working.

Old Mutual plcAnnual Report and Accounts 2013
48
FINANCIAL DISCLOSURESUPPLEMENT
Earnings
Adjusted Operating Profit (AOP) reflects the underlying performance of the business. It is intended to exclude any distortions from one-off items, market volatility and accounting treatments that are not reflective of Old Mutual’s performance.
AOP core operations (£m) 2013 2012 2011 20102 20092/3
Emerging Markets 590 611 570 539 446Old Mutual Wealth 217 195 223 248 128Property & Casualty 4 37 89 103 70Nedbank 797 825 755 601 470US Asset Management 111 91 67 72 83
1,719 1,759 1,704 1,563 1,197Finance costs (92) (130) (128) (128) (104)
Long-Term Investment Return (LTIR) represents that rate of return that is expected to be earned on assets in the long term. This eliminates short and medium effects of market volatility.
Excess assets – The value of assets that exceed the required assets to be held for regulatory purposes.
LTIR on excess assets 43 54 37 31 91Net interest payable to non-core operations (11) (18) (23) (39) (40)Other net expenses (47) (53) (75) (56) (85)
AOP 1,612 1,612 1,515 1,371 1,059
EPS (pence) 18.4 17.5 18.01 16.31 11.41
AOP (ZARm) 24,335 20,976 17,641 15,505 13,952
EPS (cents) 277.8 227.7 209.51 184.81 150.51
Note: Sterling AOP is converted into ZAR multiplying the reported AOP by the average ZAR:GBP rate of each year.
Measure of the Group’s ability to meet its interest payments by calculating number of times a company could make interest payments on its debt using pre-tax earnings.
Balance sheet and financing2013 2012 2011 20102 20092,4
Net assets (£m) 9,037 9,773 9,147 9,736 8,428
Net debt (£m) 707 1,000 2,002 2,436 2,273
Total interest cover 14.4x 8.8x 7.7x2 8.1x 7.2x Measure of the Group’s ability to meet its interest payments by calculating number of times a company could make interest payments on its debt using pre-tax earnings excluding African profits.
Hard interest cover 4.2x 1.9x 1.7x2 2.6x 1.8x
Regulatory capital2013 2012 2011 2010 2009
Old Mutual plc FGD 169% 159%5 154%5 146%5 135%5
OMLAC(SA) FSV 3.3x 4.0x 4.0x 3.9x 4.1xOld Mutual Wealth Solvency I 2.7x 2.3x 2.0x 2.8x 2.9xNedbank (Total capital ratio) Basel III/II.5/II 15.7% 15.1% 14.6% 15.0% 14.9%
Note: Nedbank’s capital requirements: 2013 and 2012 – Basel III; 2011 – Basel II.5; 2010 and 2009 – Basel II.
Holding Company cash
2013 2012 2011 2010 2009
plc opening balance 472 441 438 414 3Operational remittances from business units 544 470 748 476 529Net proceeds from business disposals 114 2,174 (57) – –
1,130 3,085 1,129 890 532Net debt (repaid)/raised (176) (1,073) (339) (110) 128
954 2,012 790 780 660Interest paid (78) (142) (155) (138) (117)Group head office expenses (34) (54) (57) (60) (85)Other operational flows 39 (117) (25) (36) (44)Ordinary cash dividends (336) (268) (112) (108) –Special dividend – (959) – – –
plc closing balance (£m) 545 472 441 438 414
Note: Cash is as per plc holding company and does not include any free cash held in subsidiaries. Allocations between lines have been restated where necessary to ensure a like for like comparison.1 Restated to reflect the share consolidation2 Excludes Nordic3 Excludes interest from US Life4 Excludes US Life5 As reported to the Prudential Regulatory Authority (PRA), previously Financial Services Authority (FSA)

49
Strategic report
Dividends declared
2013 2012 2011 2010 2009
Interim 98 79 76 54 –Full year 275 238 178 145 77 Special – 915 – – –
Total (£m) 373 1,232 254 199 77
Dividend per share (pence) 8.1 25.0 5.0 4.0 1.5
50
100
150
200
250
300
Old Mutual plc – LSEFTSE100
Old Mutual plc – JSEJSE All share
2009 2010 2011 2012 2013
Uni
ts: A
nnua
l clo
sing
(200
9 =
100%
)
Total shareholder return (rebased)
90
100
110
120
130
140
150
Old Mutual plc – LSEFTSE100
Old Mutual plc – JSENedbank Group – JSEJSE All share
2009 2010 2011 2012 2013
Share price (rebased)
Uni
ts: A
nnua
l clo
sing
(200
9 =
100%
)
Total shareholder return is an annualised percentage that is calculated by adding the appreciation in the share price and the total dividends paid to the shareholders.

BUSINESS REVIEWIn this section, we set out a review of our financial performance during 2013 and the outlook for our businesses.

51
Business review
BUSINESS REVIEW
Emerging Markets 52
Nedbank 56
Property & Casualty 61
Old Mutual Wealth 63
US Asset Management 68
Non-core business – Bermuda 70
Financial review 72

Old Mutual plcAnnual Report and Accounts 2013
52
BUSINESS REVIEWEMERGING MARKETS
Solid operational delivery and strategic progress in Africa through a challenging economic environment
Rm
Highlights 2013 2012 % Change
AOP (IFRS basis, pre-tax)1 8,911 7,955 12%NCCF (Rbn) 24.7 16.2 52%FUM (Rbn) 837.9 724.6 16%Return on equity1 25% 25%Gross sales 164,995 152,041 9%Covered sales (APE)2,3 8,442 6,808 24%Covered sales (PVNBP)3,4 51,470 43,345 19%Non-covered sales3,5 116,441 116,275 –Value of new business (VNB)3,4 2,043 1,762 16%APE margin4 27% 27%PVNBP margin4 4.0% 4.1%Operating MCEV earnings (covered business, post-tax) 4,965 4,269 16%MCEV (covered business) 51,473 45,395 13%Return on Embedded Value 11.0% 10.7%
1 100% of iWYZE is now recorded within Property & Casualty rather than Emerging Markets. Comparative information for 2012 has been restated2 From 1 January 2013, Africa life APE sales are reported net of minority interest whereas previously these were reported gross of minority interest. Comparatives have not
been restated3 From 1 January 2013, sales by the India and China businesses have been disclosed as life APE sales rather than non-covered sales. Comparatives have not been restated.
No VNB or PVNBP is calculated in respect of these sales4 From 1 January 2013, VNB, PVNBP and the respective margins include all countries in Africa (previously only Namibia). Comparatives have not been restated 5 From 1 January 2013, client broker account flows in Kenya are no longer classified as non-covered sales. Comparatives, which have not been restated, included R819 million
of such flows
Operating environmentAlthough global activity strengthened during the second half of 2013, economic activity in South Africa was volatile throughout the year with labour disputes disrupting a number of industries. Consumer income growth has been lower than in previous years, but corporate profitability has generally remained strong.
The JSE All Share Index ended the year 18% higher, as world markets rallied strongly on signs of an economic recovery in the US. Bonds performed poorly as long-term yields, as measured by the 10-year government bond yield, increased from 6.9% to 8.1% in 2013. The total return on the JSE All Bond Index was approximately 2% for 2013.
South African budget and current account deficits have grown in the year, with interest rate levels still historically low. The South African rand depreciated approximately 27% against the sterling and 24% against the US dollar in 2013.
Old Mutual Life Assurance Company South Africa (OMLACSA) remains one of South Africa’s highest-rated institutions from a financial strength perspective. In January 2014, Fitch upgraded OMLACSA’s long-term rating to AAA(zaf) and affirmed its national insurer financial strength rating at AAA(zaf) with stable outlook.
The growth rate in Africa has been in excess of 5% and, while natural resources have historically led the way, the developing middle class across the continent is increasingly recognised as the next big driver of growth. At a country level, Kenya grew by 5.9%, Zimbabwe by 3.2%, Namibia by 4.4% and Nigeria by 6.2% (IMF). Equity markets in all these countries ended 2013 at higher levels, with Nigeria increasing by 47% and Zimbabwe increasing by 33% for the year.
China’s growth rate stabilised at around 8%, whilst in Latin America, growth was mixed across the region.
Business developmentsAfrican expansionWe have continued to expand our operations in Africa through both acquisitions and organic growth by increasing the size of our sales forces and product development efforts. As previously indicated, we have allocated up to R5 billion for potential investment in the African expansion programme. In 2013, we committed or funded an acquisition spend of approximately R700 million, comprised of the following acquisitions:
■ Oceanic Life business in Nigeria; ■ Oceanic General Insurance business in Nigeria; ■ Provident Life Assurance, the fifth largest life company in Ghana; and
■ Faulu Kenya DTM LTD, a micro-finance company, subject to the conclusion of the relevant closing conditions.
Our businesses in Nigeria are in place to offer a comprehensive customer value proposition for a one-stop insurance solution that provides customers with a suite of life and savings and property and casualty insurance product offerings.
Faulu, which serves a similar customer base to our Mass Foundation business in South Africa, provides access to around 400,000 customers in Kenya and has an excellent distribution network with more than 100 “bricks and mortar” distribution outlets, as well as a distribution agreement with the Kenyan Post Office. We aim to leverage off Faulu’s existing customer and distribution network to sell our retail insurance products. In addition, we have made significant strides in growing organically and now have approximately 600 agents in Kenya.

53
Business review
Distribution and product development Several innovative product launches and new service offerings in 2013 have enhanced our customer value proposition:
■ Old Mutual Wealth was launched to South African customers in September and the first phase of adviser training has been successfully completed with more than 1,500 advisers trained and accredited;
■ In Retail Affluent in South Africa, we launched a structured investment product called XtraMAX in May;
■ We acquired an online digital capability, 22seven; which provides financial planning tools to South African customers;
■ In Namibia, the Old Mutual Card was launched – a transactional money account operated from customers’ mobile phones;
■ In Kenya, we launched a personal pension plan aimed at providing Kenyans of all income levels with access to affordable retirement savings, as well as an occupational umbrella pension scheme for small to medium-sized enterprises; and
■ In Mexico, ‘Contigo Seguro para Padres’ (parental life insurance) was launched in October.
In Latin America, we concluded the purchase of AIVA in January 2013 and we continue to work with AIVA to build our broker channel in Mexico. As part of this successful integration, we have recruited more than 460 agents in the new broker channel with sales being in line with our expectations.
Supporting economic transformation in South AfricaWe believe that we have an obligation to support the communities in which we operate and we continue to invest significantly in projects that will make a real, visible difference to the lives of these communities.
We launched the Old Mutual Education Fund (R350 million over the next seven years) to support improvements in learning for children across different age groups.
We also signed an R80 million deal that will fund the development and operations of four low-fee independent schools over the next five years which are set to reach 4,100 learners. This deal is the third of its kind for the Schools Investment Fund, a fund established by the Public Investment Corporation (PIC), the Government Employees Pension Fund (GEPF) and Old Mutual to address the shortage of quality affordable schools in South Africa.
The Masisizane Fund has approved loans of more than R76 million in 2013 with 47% in the agricultural sector and 26% in franchising. A total of 1,746 job opportunities have been facilitated in 2013 through these investments.
Old Mutual South Africa maintained its level 2 accreditation for B-BBEE using the new Financial Sector Code.
IFRS AOP results Pre-tax AOP increased by 15% (12% including LTIR to R8.9 billion) benefiting from the positive impact of higher equity market levels on asset-based fees.
Retail Affluent and Mass Foundation profits grew by 11% and 14% respectively, helped by the non-recurrence of adverse tax and yield curve changes in 2012. Further progress was made in 2013 to implement solutions that would protect South African IFRS AOP from
the impact of yield curve movements, such as an extension of our hedging programme. As a consequence, yield curve movements did not have a material impact on South African IFRS AOP in 2013. This hedging programme has been continued into 2014, subject to ongoing review in line with changes in economic conditions.
Corporate profits rose by 9% partly due to higher mortality profits on group assurance and the success of an ongoing cost reduction programme.
Africa (excl. SA) showed a marginal 2% decline (10% increase including LTIR) due to an increase in central costs incurred to support growth initiatives and expansion activities, partially offset by the favourable impact of strong equity market returns in Zimbabwe.
Asia and Latin America profits grew 80%, largely due to favourable exchange rates, the reallocation between profits and OMEM central expenses, and the first time inclusion of profits from AIVA.
Within the Old Mutual Investment Group (OMIG), Old Mutual Specialised Finance (OMSFIN) profits grew strongly from successful investment results, while profits in the rest of OMIG declined mainly as a result of incentive accruals released in 2012 and lower associate income.
Central expenses decreased by 10% due to lower IT costs and more conservative management of expenses.
Net client cash flow (NCCF)NCCF improved from R16.2 billion to R24.7 billion, mainly due to strong sales in the South African retail businesses, higher bank channel sales in China and improved net inflows in OMIG, particularly due to the non-recurrence of the significant PIC withdrawal that took place in 2012.
Net flows in Latin America decreased substantially due to a large withdrawal by a public communications company in 2013 and a large inflow from a government pension deal in 2012.
Funds under management (FUM)FUM increased by 16% to R837.9 billion mainly due to the increased NCCF and strong equity market performance, with the investment returns of the international assets enhanced by the depreciation of the rand. At 31 December 2013, 21% of total start manager FUM originated from our emerging market businesses outside of South Africa, up from 19% at 31 December 2012.
The new Wealth proposition in South Africa accumulated FUM of over R1.0 billion within six months of its launch in September 2013.
Gross salesGross sales increased by 9% to R165 billion. In South Africa, strong growth was achieved in the Retail Affluent and Corporate businesses, which grew by 21% and 17% respectively, mainly due to excellent growth in single premiums. Momentum continued in Mass Foundation which recorded growth of 14%. Asian sales doubled, benefiting from our joint venture in China expanding its bank channel presence from 1,000 approved outlets at the beginning of the year to 1,397 at the end of December 2013. At an aggregate level the modest 9% growth is largely due to the comparative period being boosted by large institutional sales in Latin America and lower OMIG sales given the exceptional new business won in 2012.

Old Mutual plcAnnual Report and Accounts 2013
54
BUSINESS REVIEWEMERGING MARKETScontinued
Non-covered salesNon-covered sales were flat at R116 billion reflecting the reclassification of Asia sales in 2013 from non-covered to life assurance sales and a particularly strong comparative period that was boosted by a number of large one-off deals in OMIG and Latin America.
In South Africa, Retail Affluent sales grew by 22% due to strong Galaxy and OMUT sales, reflecting the continuing shift from traditional life products to investment products including unit trusts, as well as higher acsis institutional sales. OMIG had strong flows into the equity boutiques in 2013, although sales reduced by 7% due to large mandates and flows secured by non-equity boutiques such as Dibanisa and Futuregrowth in 2012, as well as delays from draw-downs in the Alternative investment portfolio in 2013.
Sales in Africa (excl. SA) reduced by 14% following the exclusion of client broker account flows in Kenya, as well as lower institutional sales in Namibia.
In Latin America, unit trust and mutual fund sales decreased by 8% despite being appointed the fund manager of three mutual funds in Colombia and winning two large corporate deals in 2013. This was mainly due to the comparative period including three large one-off mandates. There were also higher sales of the Global Trust products in Mexico.
Covered sales (APE)Life APE sales increased by 24% to R8.4 billion boosted by the reclassification of Asia sales which were reported as non-covered sales in 2012.
In South Africa, Retail Affluent single premium sales were 28% up on 2012, mainly due to strong Max saving sales following the launch of the new XtraMAX product in May 2013 and improved fixed bond sales. Corporate single premium sales increased by 23% mainly due to large inflation-linked and with-profit annuity deals. Both these businesses experienced weaker regular premium sales with Greenlight sales continuing to be affected by a highly competitive market and Corporate sales having benefited from significant deals in 2012.
Growth in Mass Foundation sales of 13% was primarily due to a larger sales force with tied agent sales, particularly in the branches, being stronger than broker and call centre sales.
A 17% increase in Africa (excl. SA) sales followed large corporate deals secured in Namibia, higher Retail Affluent sales in Kenya as a result of additional advisers, higher reported sales in Zimbabwe due to exchange rate movements and the first time inclusion of R29 million of sales following the acquisition of Oceanic Life in Nigeria. Sales for 2013 are reported net of minority interests with no restatement of comparatives. On a like-for-like basis, gross of minority interests, the growth rate was significantly higher at 31%.
Within Asia & Latin America, Mexico experienced strong life APE sales growth, albeit off a low base, mainly from the launch of the Multitrust product as well as the Retail Mass business gaining momentum. As a result of strong single premium sales in China, we are now ranked fifth in the JV league tables in terms of total premiums.
Old Mutual Finance (OMF)The decline in the credit approval rate to 31% reflects OMF’s continued conservative approach to lending, following evidence of elevated client debt levels. Credit losses rose slightly from 13.3% in 2012 to 14.0% in 2013. OMF’s collection rates on the active portfolio remained above 90% and our strengthened credit scoring, implemented in 2012, has resulted in improved credit performance on the later vintages. Credit life sales to OMF customers increased from R186 million to R211 million, reflecting the moderate 14% increase in loans advanced in the year. OMF’s contribution to Mass Foundation sales has grown, with in-house adviser sales of traditional insurance products from OMF branches now over 14% of Mass Foundation sales on an APE basis (21% including credit life).
Value of new business (VNB) and margins VNB improved by 16% to R2.0 billion with the APE margin remaining stable at 27%. Retail Affluent and Mass Foundation growth of 16% and 14% respectively was largely due to volume growth and a favourable change in the economic basis. Corporate VNB decreased by 21% mainly due to a greater proportion of lower margin inflation-linked annuities being sold in 2013. Africa (excl. SA) VNB increased by 130% due to strong growth in Namibia following large Absolute Secure Growth portfolio sales and the contribution of R37 million from other African countries reporting VNB for the first time. VNB in Latin America was negative (compared to positive VNB in the comparative period) following a change in expense allocation methodology which resulted in a larger allocation to acquisition rather than maintenance expenses.
Embedded valueOperating MCEV earnings (post-tax) increased by 16% to R5.0 billion. The main contributors to this growth were improved VNB and positive experience variances and other operating variances, both of which were negative in 2012. This was partly offset by negative operating assumption changes compared with positive assumption changes in 2012.
Good mortality experience was partly offset by worse persistency experience, where Mass Foundation was adversely affected by a less favourable mix of stop order and debit order business, as well as general economic strain in the market affecting affordability.
Operating assumption changes consist mainly of the negative impact of persistency assumption changes in Mass Foundation, which were partly offset by positive maintenance expense assumption changes.
Return on Embedded Value (RoEV) improved from 10.7% to 11.0%.
Total MCEV earnings (post-tax) increased by 11% on prior year, benefiting from continued good investment returns in addition to higher operating earnings.
OutlookMacro-economic prospects in South Africa are subdued, with the economy adjusting to the depreciating rand and due to labour demands and political uncertainty especially in the run up to the national elections in May 2014. Nevertheless, real GDP growth in 2014 is expected to improve to 2.8% according to the IMF, from the 2013 level of around 1.9%.

55
Business review
South African household incomes are expected to come under further pressure in the year ahead, particularly in the lower income market. However, affluent customers are expected to be more resilient.
We continue to expect good sales performance from our Retail businesses with double digit sales growth in our Mass Foundation business despite increased financial pressure on our customers from rising inflation as well as low employment levels. The quality of new business and impacts on persistency are being carefully managed through enhanced new business submission standards and retention initiatives.
We are embedding and strengthening the Treating Customers Fairly (TCF) principles in our businesses and we will work with the industry and regulators to achieve clarity on application, particularly with regard to legacy products.
Prospects in the other emerging market economies in which we operate remain largely positive, particularly in Africa as a result of a developing middle class. This, as well as the low levels of insurance penetration in most African countries, means that we expect good growth levels to persist. However, there is some risk arising from more difficult global conditions such as weak commodity prices and lower capital flows to emerging markets.
We continue to explore suitable targets for acquisition or partnership that will further support our growth in Africa.
We have set very clear targets for our businesses. These include growing customers to more than 9 million by 2015, maintaining overall RoE in the range of 20% to 25%, and growing profits in Africa excl. SA (including Property & Casualty results) to 15% of South Africa’s profits by 2015.
Emerging Markets data tables (Rand)
Adjusted operating profit (pre-tax)
Rm
2013 2012 % Change
Retail Affluent 3,028 2,725 11%Mass Foundation1 1,937 1,702 14%Corporate 1,224 1,127 9%South Africa LTIR 1,211 1,317 (8)%
South Africa Life and Savings 7,400 6,871 8%Africa (excl. SA)2 548 561 (2)%Africa (excl. SA) LTIR2 396 296 34%
Africa (excl. SA) 944 857 10%Asia & Latin America3 392 218 80%
Life and Savings 8,736 7,946 10%OMIG 1,003 933 8%Central expenses3 (828) (924) 10%
Total Emerging Markets 8,911 7,955 12%
1 100% of iWYZE is now recorded within Property & Casualty rather than Emerging Markets. Comparatives have been restated2 In 2013, Namibia’s holding company returns were reclassified from Africa (excl. SA) profits to LTIR. Comparatives have not been restated3 Asia & Latin America profit in the comparative period is net of overhead costs which are now classified as OMEM central expenses
Gross sales and funds under management1
Rbn
FUM1-Jan-13 Gross sales ² Redemptions Net flows
Market & other
movements4FUM
31-Dec-13
Retail Affluent 121.2 59.9 (51.9) 8.0 21.1 150.3 Mass Foundation3 – 7.8 (3.5) 4.3 (4.3) – Corporate 1.3 17.8 (20.9) (3.1) 3.2 1.4 OMIG3 463.3 32.5 (26.8) 5.7 37.9 506.9
Total South Africa 585.8 118.0 (103.1) 14.9 57.9 658.6
Africa (excl. SA) 38.4 12.2 (8.5) 3.7 11.8 53.9 Asia & Latin America 100.4 34.8 (28.7) 6.1 18.9 125.4
Total Emerging Markets 724.6 165.0 (140.3) 24.7 88.6 837.9
1 FUM shown on an end manager basis. The Financial Disclosure Supplement shows additional disclosure of FUM on a start manager basis2 Gross sales are cash inflows for the period and thus include prior period recurring premium flows3 Mass Foundation gross sales are recorded by segment but all FUM is managed by OMIG4 Includes the foreign exchange impact of translating FUM managed outside of South Africa
Further financial information on the performance of the business can be found in the Financial Disclosure Supplement on our website www.oldmutual.com

Old Mutual plcAnnual Report and Accounts 2013
56
BUSINESS REVIEWNEDBANK
Solid performance off strong foundations in a more difficult environment
Rm
Highlights 2013 2012 % Change
AOP (IFRS basis, pre-tax) 12,026 10,738 12%Headline earnings1 8,670 7,483 16%Net interest income1 21,220 19,680 8%Non-interest revenue1 19,361 17,324 12%Net interest margin1 3.57% 3.53%Credit loss ratio1 1.06% 1.05%Cost to income ratio1 55.2% 55.6%Return on equity1 15.6% 14.8%Return on equity (excluding goodwill)1 17.2% 16.4%Common equity Tier 1 ratio2 12.5% 11.6%
1 As reported by Nedbank in its results for the year ended 31 December 2013 and 31 December 20122 Calculated by Nedbank on a Basel III basis
The full text of Nedbank’s results for the year ended 31 December 2013, released on 24 February 2014, can be accessed on our website http://www.oldmutual.com/ir/pressReleases/index.jsp. The following is an edited extract:
Banking and economic environmentGlobally, economic conditions improved during 2013, led by better prospects in key developed economies. In contrast, growth in emerging market economies generally slowed during the year. The improved US environment has resulted in a tapering off of quantitative easing, and significant liquidity outflows from emerging markets and lower commodity prices led to currency depreciation in many emerging markets, in particular those with current and fiscal account deficits.
Locally, the economic environment remained challenging, with growth in gross domestic product (GDP) slowing to 1.9% in 2013 and the current account and fiscal deficits continuing to widen. The downgrading of SA’s sovereign credit rating by three of the major credit rating agencies in late 2012 and early 2013, now placing SA two notches above investment grade and the US commencement of the tapering off of quantitative easing contributed to the rand’s 24% depreciation against the US dollar in 2013.
Growth in household credit demand fell to levels last seen during the global financial crisis as a result of lower overall wages due to strike action, persistently high unemployment rates and increases in administered prices, which, together with elevated levels of indebtedness, eroded consumer confidence.
Declining business confidence kept private sector investment at low levels. The demand for corporate credit generally fared better than household credit demand, as a modest increase in government fixed-capital investment on energy, transport and other infrastructure sectors provided some underpin.
Review of resultsNedbank performed well over the year ended 31 December 2013 (‘the period’). The results reflect the tougher-than-anticipated economic environment offset by delivery on our strategic focus areas and continued internal momentum in building and growing the Nedbank franchise.
Headline earnings increased 15.9% to R8,670 million (2012: R7,483 million), driven by good revenue growth, impairments increasing at a slower rate than net interest income and disciplined expense management.
Diluted headline earnings per share (HEPS) increased 15.0% to 1,829 cents (2012: 1,590 cents) and diluted earnings per share increased 15.1% to 1,822 cents (2012: 1,583 cents).
We have continued to create value for our shareholders by increasing net asset value per share by 12.1% to 13,143 cents (2012: 11,721 cents) and dividends per share by 19.0% to 895 cents per share (2012: 752 cents per share).
Nedbank generated economic profit (EP) of R2,114 million, up 39.0% (2012: R1,521 million). The return on average ordinary shareholders’ equity (RoE), excluding goodwill, increased to 17.2% (2012: 16.4%) and the RoE increased to 15.6% (2012: 14.8%), benefiting from an increased return on assets (RoA) of 1.23% (2012: 1.13%).
Nedbank is well capitalised, with the Basel III common-equity tier 1 ratio at 12.5% – at the top end of our internal target range (2012: Basel III proforma ratio 11.6%). Funding and liquidity levels remained sound, with the surplus liquidity buffer at R28.0 billion (2012: R24.4 billion), and the final-quarter average long-term funding ratio was maintained at 26.2%.
Cluster performance Nedbank benefited from the diversified earnings streams from its clusters. Stronger earnings growth rates were achieved by Nedbank’s wholesale clusters, while earnings growth in Nedbank Retail and Nedbank Business Banking was impacted by higher impairments and continued investment for growth.
Nedbank Capital produced an outstanding set of results. Growth in earnings came from good draw-downs in the investment banking pipeline and improvements in impairments to within the cluster’s through-the-cycle target range.
Nedbank Corporate’s strong earnings and RoE growth was achieved through excellent performance by Property Finance as a result of strong advances growth coupled with fair value gains. Corporate Banking contributed to this achievement through continued growth in transactional income and increased liability revenues. This performance was underpinned by stable impairments and good expense management.
57
Business review
Nedbank Business Banking delivered headline earnings and an RoE similar to those in 2012, notwithstanding the single-client specific-impairments charge in June 2013. The full-year credit loss ratio (CLR) at 0.65% is within the target range due to the quality of client advances and proactive risk management practices. The strong growth in non-interest revenue (NIR) and asset payouts, mainly to existing clients, is reflective of good underlying business momentum, despite the protracted challenges facing the small-and-medium-enterprise sector in SA.
Nedbank Retail generated headline earnings of R2.5 billion, which included absorbing a pre-tax charge of R323 million in additional impairments as downside-risk protection for deteriorating levels of consumer credit health, fuelled by the high, industry-wide unsecured lending growth rates in preceding years and resultant industry tightening of credit availability. The embedding of sound risk management practices and early comprehensive risk-mitigating actions resulted in the CLR of 2.16%, which is within the Retail CLR target range. Overall defaulted loans continued to decline, while coverage strengthened further.
The excellent momentum in sustainably repositioning the Retail Cluster, strategically and financially, was maintained in a very challenging macro-economic and competitive environment. Investment in distribution and distinctive client value propositions is yielding significant client gains, with increases in related transactional, deposit and lending volumes contributing to good NIR growth – still ahead of expense growth. The proactive measures to de-risk personal loans by slowing advances growth and offering lower priced credit life products with increased benefits have lowered NIR growth by one percentage point.
Nedbank Wealth achieved record headline earnings in 2013. The results were mainly attributable to strong growth in the areas of asset management, financial planning and stockbroking, as well as a significant year-on-year reduction in impairments.
Headline earnings at the centre represent, inter alia, an increase in earnings in the Rest of Africa Division, a reversal of R88 million of insurance provisions following court rulings in our favour in the first half of the year, a small fair value profit on hedging activities and net interest income (NII) earned on higher levels of surplus equity held at the centre. These were offset by an R60 million portfolio provision raised in the second half of the year in view of various economic and regulatory uncertainties.
Detailed segmental information is available on Nedbank’s website at www.nedbankgroup.co.za under the ‘Financial information’ section.
Financial performanceNet interest incomeNet interest income grew 7.8% to R21,220 million (2012: R19,680 million), with average interest-earning banking assets growth of 6.8% (2012 growth: 7.5%).
The net interest margin (NIM) increased to 3.57% (2012: 3.53%), led by liability margin gains from a lower cost of marginal wholesale funding, deposit mix benefits and slightly lower levels of average long-term debt, partially offset by a decrease in asset margins. Notwithstanding improved risk-adjusted pricing of new advances, the asset margin was impacted by mix changes from the planned slowdown in growth of personal loans.
Impairments charge on loans and advancesImpairments increased 7.0% to R5,565 million (2012: R5,199 million). The CLR was similar to that of 2012 at 1.06% (2012: 1.05%), having improved from 1.31% at June 2013.
Sound asset quality and proactive risk management resulted in lower levels of inflows into defaulted advances, which declined 9.4% to R17,455 million (2012: R19,273 million), and amounted to 2.95% of gross advances (2012: 3.58%).
All clusters reported CLR within their respective through-the-cycle target ranges. The total CLR remained above Nedbank’s target range due to the higher weighting of retail impairments. Nedbank Retail’s CLR of 2.16% is up on the 2012 ratio of 2.01% due to the additional aforementioned R323 million impairment charges. The six-month write off period for personal loans, methodology changes and steps taken in prior periods to reduce risk led to personal loan defaulted advances peaking in May 2013 and the CLR improving since June 2013.
The coverage ratio for total and specific impairments increased to 65.6% (2012: 56.4%) and 42.8% (2012: 38.6%) respectively. Portfolio coverage on the performing book continued to strengthen to 0.70% (2012: 0.66%).
Our collections processes are robust and generated post-write off recoveries of R888 million (2012: R866 million), reflecting the prudency of cash accounting recoveries on the written-off book. This includes recoveries in Personal Loans of R276 million (2012: R243 million).
Non-interest revenueNIR increased by 11.8% to R19,361 million (2012: R17,324 million), due to the following:
■ Commission and fee income increased strongly by 11.8% to R14,023 million (2012: R12,538 million) from good transactional volume increases across Nedbank and improved cross-sell
■ Insurance income growth of 13.7% to R1,927 million (2012: R1,695 million) remained robust, with good sales in motor vehicle insurance and an improvement in the claims environment partly offset by the volume-related slowdown in credit life income
■ Trading income held up well, increasing 4.1% to R2,564 million (2012: R2,464 million) off the high 2012 base
■ Private-equity income of R225 million (2012: R391 million) was recorded following unrealised losses in Nedbank Capital and the higher realisations in 2012
■ Sundry income increased to R526 million (2012: R394 million) mostly owing to the reversal of insurance provisions following court rulings in our favour in June 2013
■ Fair value gains of R40 million (2012: R265 million loss) were recognised mainly as a result of basis risk on centrally hedged banking book positions and accounting mismatches in the hedged fixed-rate advances portfolios
Our strategy to grow NIR has resulted in an NIR increase of 13.0% (excluding fair value adjustments) on a compound basis since 2009, with an increase in the NIR-to-expenses ratio from 78.8% in 2009 to 86.4% in 2013 (2012: 84.4%) to exceed our medium-to-long-term target of > 85% for the first time over a full year since the introduction of this metric.
Old Mutual plcAnnual Report and Accounts 2013
58
BUSINESS REVIEWNEDBANKcontinued
ExpensesDisciplined cost management, combined with ongoing investment in the franchise, resulted in operating expenses growing 9.2% to R22,362 million (2012: R20,485 million).
Growth in expenses was primarily driven by:
■ An employee-related cost increase of 10.5%, comprising salary and wage cost growth of 8.3% following average inflation-related annual increases of 6.5% and 1.4% growth in average headcount, and a variable-compensation increase in line with Nedbank’s financial performance, with the short-term incentive (STI) up 15.9% and long-term incentive (LTI) up 23.4%;
■ Investment in distribution channels of R151 million; ■ Marketing costs growth of 13.3% as we invest in building our franchise and transactional banking client base; and
■ A computer processing increase of 10.5% in line with increases in business volume growth.
TaxationThe base effect of capital gains tax and secondary tax on companies in 2012, together with lower levels of dividend income, resulted in a lower effective tax rate of 25.2% (2012: 26.8%).
Statement of financial position CapitalStrong balance sheet management and organic earnings growth during the period caused all capital adequacy ratios to remain well above the Basel III minimum regulatory capital requirements and at or above the top of Nedbank’s Basel III internal target ranges.
During the year a total of R3.0 billion of new-style, fully loss-absorbent, Basel III-compliant, tier 2 subordinated debt was successfully issued to replace the R2.1 billion of Basel II tier 2 capital that matured in September 2013.
Further detail on risk and capital management will be available in the Risk and balance sheet management review section of Nedbank’s results booklet and the Pillar 3 Report to be published on their website at www.nedbankgroup.co.za on 31 March 2014.
Funding and liquidity Nedbank’s surplus liquid asset buffer increased to R28.0 billion (2012: R24.4 billion), reflecting a strong liquidity position. Nedbank has low levels of reliance on interbank and foreign currency funding, and continues successfully to diversify and lengthen its funding profile.
The last quarter average long-term funding ratio was maintained at 26.2%, supported by the successful conclusion of a R2.0 billion five-year commercial-mortgage securitisation in March 2013 as well as R5.8 billion in senior unsecured debt issued during the year, replacing R3.4 billion that matured in March and April 2013. Nedbank has been compliant with the Basel III Liquidity Coverage Ratio on a proforma basis since 31 December 2012.
Loans and advancesLoans and advances increased 9.9% to R579.4 billion (2012: R527.2 billion), with good wholesale banking advances growth of 16.1%. Gross new advances payouts increased 10.1% to R158.9 billion (2012: R144.3 billion).
Banking advances growth in Nedbank Capital remained robust, following steady draw-down of the deal pipeline throughout the year, including the Renewable Energy Independent Power Producer Procurement Programme (REIPPPP), of which Nedbank supported over a third of the allocated renewable-energy capacity in the first and second phases. Growth in the trading advances book came largely from foreign-currency placements and deposits placed under reverse repurchase agreements related to surplus liquidity and the hedging of Nedbank’s liquid asset portfolio.
The increase in Nedbank Corporate’s advances is comprised of 5.3% growth in corporate banking and 11.0% growth in property finance. Nedbank’s market-leading commercial property franchise earned the accolade of being voted the best property finance bank in SA in the PWC SA banking survey 2013.
Nedbank Business Banking recorded advances growth of 4.4% as the small-to-medium-sized enterprises sector continued to experience economic pressure throughout 2013.
Retail banking advances continued to grow modestly at 2.5%. Advances growth was led by an increase of 14.2% and 13.8% for card and vehicle finance respectively, while personal loan and home loan advances declined 9.4% and 2.1% respectively in line with the selective origination strategy in both advances categories ahead of expected interest rate increases.
At a total level personal loan advances now represent 3.6% and home loan advances 23.0% of total advances.
Growth in advances at the centre was led by increased business activity in the Rest of Africa, consistent with Nedbank’s focus on deepening its Pan-African banking client relationships and expanding its presence in Africa.
DepositsDeposits grew 9.5% to R603.0 billion (2012: R550.9 billion) and a sound loan-to-deposit ratio of 96.1% (2012: 95.7%) was maintained.
The portfolio tilt strategy to drive deposit growth is reflected in good contributions seen from all the clusters. Current accounts increased 5.1% (2012: 7.9%) and savings accounts grew by a strong 30.3% (2012: 9.3%), as saving deposits held in Nedbank Wealth were boosted by rand depreciation. Call and term deposit balances were 9.7% (2012: 9.9%) higher due to increased funding from the commercial and asset management sectors. The strategy also focused on increasing fixed deposits, which resulted in 16.3% (2012: 8.2%) growth in fixed deposits while negotiable certificates of deposit were up 13.7% (2012: negative 21.4%).
Economic outlookThe economic outlook for developed economies is expected to be more positive in 2014, with accelerated momentum in the US and UK, and the Eurozone beginning to show signs of fragile growth. These improved prospects, together with the effects of a tapering off of quantitative easing, will lead to global volatility and pose downside risk to many emerging markets. A further concern is China’s economic slowdown, given its importance as a trade partner for SA.
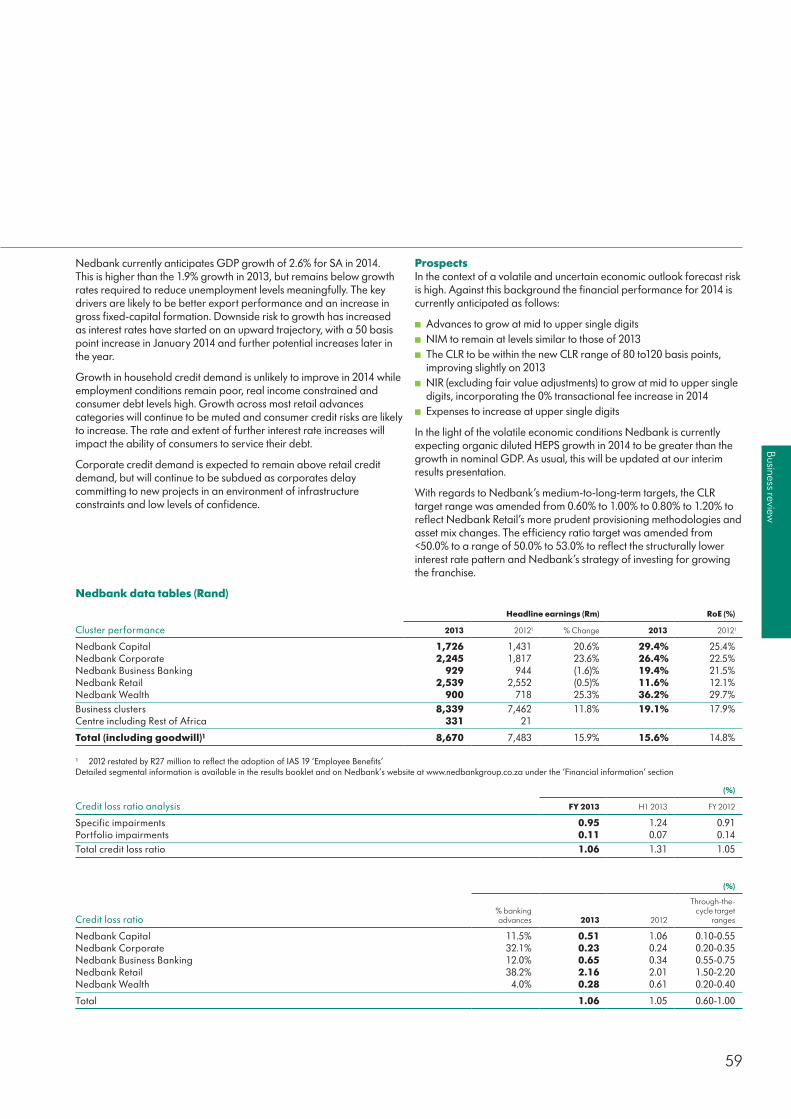
59
Business review
Nedbank currently anticipates GDP growth of 2.6% for SA in 2014. This is higher than the 1.9% growth in 2013, but remains below growth rates required to reduce unemployment levels meaningfully. The key drivers are likely to be better export performance and an increase in gross fixed-capital formation. Downside risk to growth has increased as interest rates have started on an upward trajectory, with a 50 basis point increase in January 2014 and further potential increases later in the year.
Growth in household credit demand is unlikely to improve in 2014 while employment conditions remain poor, real income constrained and consumer debt levels high. Growth across most retail advances categories will continue to be muted and consumer credit risks are likely to increase. The rate and extent of further interest rate increases will impact the ability of consumers to service their debt.
Corporate credit demand is expected to remain above retail credit demand, but will continue to be subdued as corporates delay committing to new projects in an environment of infrastructure constraints and low levels of confidence.
ProspectsIn the context of a volatile and uncertain economic outlook forecast risk is high. Against this background the financial performance for 2014 is currently anticipated as follows:
■ Advances to grow at mid to upper single digits ■ NIM to remain at levels similar to those of 2013 ■ The CLR to be within the new CLR range of 80 to120 basis points, improving slightly on 2013
■ NIR (excluding fair value adjustments) to grow at mid to upper single digits, incorporating the 0% transactional fee increase in 2014
■ Expenses to increase at upper single digits
In the light of the volatile economic conditions Nedbank is currently expecting organic diluted HEPS growth in 2014 to be greater than the growth in nominal GDP. As usual, this will be updated at our interim results presentation.
With regards to Nedbank’s medium-to-long-term targets, the CLR target range was amended from 0.60% to 1.00% to 0.80% to 1.20% to reflect Nedbank Retail’s more prudent provisioning methodologies and asset mix changes. The efficiency ratio target was amended from <50.0% to a range of 50.0% to 53.0% to reflect the structurally lower interest rate pattern and Nedbank’s strategy of investing for growing the franchise.
Nedbank data tables (Rand)
Headline earnings (Rm) RoE (%)
Cluster performance 2013 20121 % Change 2013 20121
Nedbank Capital 1,726 1,431 20.6% 29.4% 25.4%Nedbank Corporate 2,245 1,817 23.6% 26.4% 22.5%Nedbank Business Banking 929 944 (1.6)% 19.4% 21.5%Nedbank Retail 2,539 2,552 (0.5)% 11.6% 12.1%Nedbank Wealth 900 718 25.3% 36.2% 29.7%Business clusters 8,339 7,462 11.8% 19.1% 17.9%Centre including Rest of Africa 331 21
Total (including goodwill)1 8,670 7,483 15.9% 15.6% 14.8%
1 2012 restated by R27 million to reflect the adoption of IAS 19 ‘Employee Benefits’Detailed segmental information is available in the results booklet and on Nedbank’s website at www.nedbankgroup.co.za under the ‘Financial information’ section
(%)
Credit loss ratio analysis FY 2013 H1 2013 FY 2012
Specific impairments 0.95 1.24 0.91 Portfolio impairments 0.11 0.07 0.14 Total credit loss ratio 1.06 1.31 1.05
(%)
Credit loss ratio% bankingadvances 2013 2012
Through-the-cycle target
ranges
Nedbank Capital 11.5% 0.51 1.06 0.10-0.55Nedbank Corporate 32.1% 0.23 0.24 0.20-0.35Nedbank Business Banking 12.0% 0.65 0.34 0.55-0.75Nedbank Retail 38.2% 2.16 2.01 1.50-2.20Nedbank Wealth 4.0% 0.28 0.61 0.20-0.40
Total 1.06 1.05 0.60-1.00

Old Mutual plcAnnual Report and Accounts 2013
60
BUSINESS REVIEWNEDBANKcontinued
(%)
Capital
31-Dec-13ratio
(Basel III)31-Dec-12 ratio
(Basel III)
Internal target range
(Basel III)
Regulatory minimum (Basel III)1
Common equity Tier 1 ratio 12.5 11.6 10.5-12.5 4.5%Tier 1 ratio 13.6 13.1 11.5-13.0 6.0%
Total capital ratio 15.7 15.1 14.0-15.0 9.5%
1 The Basel III regulatory minima are being phased in between 2013 and 2019, and exclude Pillar 2B add-ons
Rm
Loans and advances by cluster 31-Dec-13 31-Dec-12 % Change
Nedbank Capital 109,549 82,494 32.8%Banking activity 72,066 52,732 36.7%Trading activity 37,483 29,762 25.9%
Nedbank Corporate 175,274 162,730 7.7%Nedbank Business Banking 62,785 60,115 4.4%Nedbank Retail 195,435 190,647 2.5%Nedbank Wealth 22,082 19,864 11.2%Centre including Rest of Africa 14,247 11,316 25.9%Total 579,372 527,166 9.9%
Nedbank Group targets
Metric 2013 performance Medium-to-long-term targets 2014 outlook1
RoE (excluding goodwill) 17.2%5% above cost of ordinary
shareholders’ equity Below targetGrowth in diluted headline earnings
per share 15.0%≥ consumer price index
+ GDP growth + 5%≥ consumer price index
+ GDP growth
Credit loss ratio 1.06%Between 0.8% and
1.2% of average banking advancesMeet target,
improving slightly NIR-to-expense ratio 86.4% > 85% At targetEfficiency ratio 55.2% 50.0% to 53.0% At targetTier 1 capital adequacy ratio
(Basel III) 12.5% 10.5% to 12.5%At or above the
top end of targetEconomic capital Internal Capital Adequacy Assessment Process (ICAAP): A debt rating (including 10% capital buffer)
Dividend cover 2.11 times 1.75 to 2.25 times 1.75 to 2.25 times
1 Shareholders are advised that these forecasts are based on organic earnings and Nedbank’s latest macro-economic outlook and have not been reviewed or reported on by Nedbank’s independent auditors

61
Business review
BUSINESS REVIEWPROPERTY & CASUALTY
Tough operating conditions whilst business changes are being implemented
Rm
Highlights 2013 20121 % Change
Underwriting margin (4.9)% (1.7)%Underwriting result (437) (132) (231)%Long-term investment return (LTIR) 472 608 (22)%Income from associate (Zimbabwe) 40 19 111%AOP (IFRS basis, pre-tax) 58 475 (88)%Gross written premiums 11,315 9,706 17%Net earned premiums 8,856 7,573 17%Claims ratio 75.5% 72.4%Combined ratio 104.9% 101.7%International solvency ratio 54.1% 64.0%Return on equity 0.6% 7.1%
1 Comparatives have been restated to reflect 100% of the iWYZE results
Overview and operating environmentA disappointing underwriting loss of R437 million can largely be attributed to severe weather-related losses in the fourth quarter, drought conditions leading to poor Agriculture results in the first half and a continuing soft market in the South African property and casualty sector. The underwriting loss deteriorated from the prior year with the margin worsening by 3.2% to a loss of 4.9%. Flood and hail damage caused an increase in both claims frequency and severity. The South African property and casualty industry has seen combined ratios deteriorate significantly during 2013.
Gross written premium grew 17% year on year, reflecting strong growth of 36.7% in the Corporate & Niche segment (including CGIC) which delivered gross written premiums of R3,527 million (2012: R2,581 million). Much of the growth in premiums was due to inwards reinsurance business, which primarily consist of open market and strategic attritional losses treaty business. Credit Guarantee (CGIC) grew 10.8% to R860 million. The Personal segment grew 5.9% to R3,065 million and Commercial by 12.1% to R3,935 million with Agriculture contributing R145 million and Africa (excl. SA) by 9.3% to R788 million. The Personal lines quote to acceptance conversion rate fell, reflecting the implementation of tougher underwriting criteria.
iWYZE, our joint venture with the Old Mutual Mass Foundation business, achieved solid growth in gross written premium of 10.8%, and a significant improvement in the claims ratio. Reflecting the early stage in the life cycle of the business, the underwriting margin on iWYZE is (42.1)%, an improvement compared to the previous year (54.6)%. In 2014, premium in iWYZE is expected to grow through substantial collaboration with Old Mutual. The retention rate will be improved through a combination of accurate customer segmentation, careful analysis of renewal lapse rates and appropriate renewal moderation, and through the introduction of product innovations aimed at improving longevity. We will also work on diversifying the types of risks underwritten in the iWYZE book.
The company remains well capitalised with a 54.1% international solvency ratio (net assets: net premiums).
Business developmentManagement have clear action plans to address challenges over the current business planning period. The focus will be on:
■ Remediating rates and improving risk selection in Personal lines — We will continue introducing price increases across the Personal book, with the impact expected at renewal
— We will incorporate improved risk selection on new business — Our pricing initiatives will be supported by a greater degree of automation in the underwriting process, which will allow for tighter control and more effective validation
■ Improving claims efficiency and effectiveness while combating claims fraud
— We will implement a new claims operating model which will improve efficiencies in Personal lines by adopting a segmented approach to claims handling
— We will focus on improved procurement of claims-related expenditure to reduce the average claims cost
■ Reducing operating expenses — We will keep the annual increase in payroll costs in line with inflation — We will reduce IT costs following our migration off a mainframe based system
■ Improving the operating model — We will be reviewing our current operating model in key segments and will be introducing improvements aimed at customer satisfaction and operational efficiency
■ Improving broker distribution capabilities — We will provide a single point of contact for each broker with a focus on key account management
— We will improve broker experience by creating continuous feedback loops to business
■ Creating a high performance culture
— We will align performance scorecards to the strategy and business plan by providing clear and concise messaging on targets and introducing robust performance measurement

Old Mutual plcAnnual Report and Accounts 2013
62
BUSINESS REVIEWPROPERTY & CASUALTYcontinued
The new organisational structure, consisting of Personal, Commercial, Corporate & Niche and Africa (excl. SA) has been bedded down over the last quarter where executive appointments have been completed for our underwriting segments in South Africa. We expect improved results as operational efficiencies and strategic objectives begin to gain traction.
Underwriting and IFRS AOP resultsThe deterioration of the underwriting result was materially affected by weather-related claims specifically in the fourth quarter with R176 million of net losses from flooding in Western Cape and hail storms in and around Johannesburg. By segment, Corporate & Niche and Commercial lines suffered the most significant reduction in the underwriting result by R157 million and R156 million respectively. The decrease in the underwriting result led to an 88% reduction in AOP and a reduction in RoE from 7.1% to 0.6%.
The deterioration in the overall claims ratio to 75.5% (2012: 72.4%) was primarily due to higher claims severity in both the Personal and Commercial motor classes. However, with re-pricing and other remedial actions taking place we are starting to see positive trends. There was a higher incidence of fire claims in the Corporate & Niche segment, which experienced a claims ratio of 73.4% and drought-related Agriculture claims.
CGIC generated strong premium growth of 10.8%. However, challenging economic conditions have adversely affected its claims and expense ratios, resulting in a lower underwriting result compared to the previous year.
Overall, the expense ratio improved by 1% due to a combination of the premium growth and a continued focus on expense management.
The net commission ratio was 16.6% for 2013 with a 1.1% increase year on year due to changes in business mix and the commencement of binder fee regulations, whereby intermediaries provide claims handling and policy administration services.
Africa (excluding SA)In Africa (excl. SA), the claims ratio deteriorated to 62.9% (2012: 54.2%) mainly due to three large corporate claims in Namibia of R20.5 million and two large commercial claims in Botswana of R6.3 million which together contributed 5.5% to the claims ratio. An increase in the Incurred But Not Reported (IBNR) provision added a further 0.8%. A 7.3% increase in the Personal lines claims ratio in Namibia from 74.6% to 81.9% was due to premium rate reductions in an attempt to grow the book. Remediation plans have already been implemented and we will continue to monitor their progress.
OutlookIn the latter part of the year, whilst there has been some tentative impact from remedial action taken in our Personal lines division as the policy count begins to stabilise, the continued depreciation of the rand has led to increased motor related claims costs on imported parts.
Despite challenging market conditions experienced in 2013, we expect competitors to also increase premiums in response to the rising claims cost pressures. We anticipate a hardening of the market in 2014. Our primary focus is on restoring the profitability of the business in 2014 rather than on premium growth. In our Personal segment, greater collaboration within the Old Mutual Group will be the driving force behind future growth prospects as well as the expansion into Africa.
In the longer term, the management team is focused on delivering the plan to improve return on equity to 15% to 20% by 2016 through the management of claims costs, capital management and underwriting margin.
Whilst we are confident that our management actions will have a positive impact in achieving our stated targets, we acknowledge that an increase in the frequency and severity of weather-related claims increases our earnings volatility, given the current business risk profile.

63
Business review
BUSINESS REVIEWOLD MUTUAL WEALTH
Strong operational delivery through a changing regulatory environment
£m
Highlights 2013 2012 % Change
AOP (IFRS basis, pre-tax) 217 195 11%NCCF (£bn)1 2.3 2.0 15%FUM (£bn) 78.5 69.2 13%Return on equity 16% 13%Gross sales1 14,434 11,630 24%Life assurance sales (APE) 606 610 (1)%PVNBP 5,556 5,334 4%Non-covered sales1,2 8,207 5,612 46%Value of new business 76 62 23%APE margin 13% 10%PVNBP margin 1.4% 1.2%
1 From Q2 2012 OMAM UK has been reported within Old Mutual Wealth (OM Global Investors) rather than USAM. The comparatives for 2012 have not been restated in respect of flows recognised within USAM in Q1 2012
2 Includes unit trust, mutual fund, ISAs and other sales
Operating environmentInvestment markets improved markedly in 2013 and the level of flows to the industry reflected this with the move into equity and growth asset allocations, as we had anticipated. Significant regulatory change in the UK, our major market, arose from the Retail Distribution Review (RDR) for which we were well prepared. Following the implementation of RDR, we have experienced increased demand for packaged investment solutions from financial advisers who increasingly seek to outsource either elements of, or their entire investment processes.
During 2013, we developed WealthSelect which is a researched range of some of the best investment strategies in the market, available through Old Mutual Global Investors (OMGI) funds. Financial advisers will either be able to use the range to build portfolios themselves or they can use our own managed portfolio service and outsource the management of the portfolios to our Multi-Asset team. The launch in Q1 2014 will provide us with one of the most comprehensive investment propositions in the market, giving advisers a range of options to meet differing client needs. We already offer investment solutions for clients focused on controlling risk, called Spectrum, and for income, known as Generation.
In our international markets, we offer a market-leading range of portfolio bonds which enable clients to invest via our Ireland or Isle of Man offshore jurisdictions. Depending on where clients are domiciled this provides them with tax efficiency, portability and/or investment security, whilst maintaining investment choice and flexibility due to the open structure of the products.
Business developmentsWe have made significant progress in our strategy of developing into an integrated wealth management business. There have been six key steps:
■ Creating one business: — We have consolidated our management and reporting structure and during 2014 we will implement the rebranding of the business from Skandia to Old Mutual Wealth. This will enable us to focus our brand building activity on one name and help us leverage on the Group’s brand strategy.
■ Building out the asset management business: — With the high profile launch of the OMGI brand, the appointments in our UK Equity capabilities and the continued strong investment performance, we made good progress against our financial targets. At 31 December, over 66% of OMGI funds performed above median over a 3 year period and 44% were in the first quartile. We are now in the process of investing in the business to build a robust, efficient and scaleable investment skill set from which we can drive future growth.
■ Widening our proposition: — WealthSelect: The new WealthSelect proposition has now been launched to the market. Over £1 billion has already transferred in from existing portfolios that were administered but not managed in-house. The funds are all operated by OMGI, with many of them sub-advised to some of the leading fund managers covering all the main asset classes. The funds are competitively priced with an average Asset Management Charge (AMC) of 52 basis points and we provide a full managed portfolio service to advisers and clients at no additional charge. We expect to see high demand for this proposition during 2014.
— Product launches: Having revitalised our UK protection proposition in late 2012, we have added several new features to the critical illness product in 2013. We will continue to make further enhancements to this product in 2014 and will grow an established presence in the critical illness market.In early 2013, we added a new high life cover wealth protection offering to address the needs of High Net Worth (HNW) investors in our international and cross-border markets. The product, known as Life Investment Portfolio, has proved highly successful in Latin America and we plan to launch a similar offering in Asia during the course of 2014. This will allow us to further expand and diversify our customer base by accessing a growing share of the local HNW wealth segment.

Old Mutual plcAnnual Report and Accounts 2013
64
BUSINESS REVIEWOLD MUTUAL WEALTHcontinued
We have strengthened and revitalised our proposition in South Africa by adding a new offering to the product range there. Known as the Investment Portfolio+, the product enables investors to access a broad range of assets within controlled parameters, tailored for a range of investment tiers. The product has had successful traction with local investors wishing to benefit from greater investment flexibility and we will continue adding new features and enhancing the service around this offering throughout 2014.
■ Transforming our platforms: — Wealth Interactive: During the course of 2013, we have continued embedding Wealth Interactive, our international cross-border platform, into the business. This significantly enhances electronic capabilities and straight-through processing across multiple currencies, markets, languages and time zones. Wealth Interactive is a transformational programme and is changing the way advisers interact with us. To support the adoption of the new system, we have strengthened our support to advisers by building a team of online specialists located internationally, available face to face and within the same time zone. As we continue to introduce international advisers on to the new technology platform throughout 2014, we plan to deliver further enhancements to functionality and add new products and features for added value and maximum flexibility.
— UK administration: Our outsourcing arrangement with IFDS is progressing well during the scoping phase of the project. It will transform our UK platform into one of the most flexible in the market with new services and functionality expected to come online during 2016.
■ Building out distribution: — Intrinsic Financial Services: The purchase of Intrinsic is a critical part of our strategy of creating a leading wealth management business that combines financial advice, investment solutions and high quality asset management to deliver first class outcomes for our customers.
— Asia: As new wealth continues to emerge across Asia, our ambition is to access a wider range of customers, including local investors, across multiple wealth tiers and through different channels. To achieve this we are looking to diversify our distribution channels, including partnering with institutional brokers in order to access local and regional private banks, who typically own the relationships with HNW investors. To ensure we are well positioned to capture the growth opportunities the region can offer, we have strengthened our presence in Asia during the year by making a number of senior appointments to support our HNW proposition and distribution strategy.
— AIVA: We will continue to evolve our distribution partnership with the AIVA network in Latin America, which involves accessing a wider set of investors across the region through local and international private banks.
■ Managing for value: — Heritage businesses: following the closure of the businesses in Germany, Austria and Switzerland, our retention strategy has been rolled out successfully across the Heritage business in Europe with higher than expected top-ups to existing business received throughout the year.
IFRS AOP resultsOld Mutual Wealth AOP increased by 11% to £217 million (2012: £195 million) as a result of tight management of expenses and increased fees earned on higher average FUM in the period. Profit grew by 19% after excluding £13 million of profits from Finland, which was sold in H2 2012. In 2012, there were exceptional policyholder tax contributions of £22 million in part due the move to a new life tax regime. Underlying profits before tax have therefore grown from £160 million to £217 million.
While overall profits continue to grow, the quality of these earnings is also improving. The open book activities undertaken by the UK Platform, asset management, International cross-border and European open businesses contributed £99 million of profit in 2013 compared to £68 million in 2012. Operating margin for Old Mutual Wealth improved to 36% from 33% in 2012. The reduced cost base in the business generated positive operating leverage as revenues rose on higher funds under management.
UK Platform profits improved to £13 million from £2 million in the prior period reflecting higher FUM and increased inflows over 2013, and positive operating leverage as the business maintained a stable cost base.
International cross-border profits, after removing the impact of Finland on the 2012 comparative were 11% down on prior year to £49 million. The reduction in profit reflects the increased investment in the second half of the year in the development and roll-out of the Wealth Interactive platform. Total spend was approximately £13 million.
OMGI profits improved to £15 million from £2 million in the prior period reflecting the higher FUM levels in the business, improved performance-related fees earned during the year and the continued migration of assets from the UK Heritage business to asset offerings at OMGI which earn a higher margin. The Europe open business has also returned strong results in 2013 following improved sales in Italy and the significantly reduced expense base in France. In France we recorded an operating profit for the business for the first time, while in Italy we exceeded our target return on equity for the local business of 12%.
The Heritage business continues to generate good results with profits of £112 million for 2013 (2012: £126 million), with the prior year comparative including the £22 million exceptional policyholder tax contribution. The Heritage portfolios contributed 52% of the Old Mutual Wealth profit in 2013, down from 65% in 2012, while overall profit levels have continued to grow.
65
Business review
Net client cash flow (NCCF)NCCF of £2.3 billion increased by 15% on prior year (2012: £2.0 billion) as a result of continuing strong sales in the second half of the year on the UK Platform, OMGI, and International cross-border businesses.
A strong fourth quarter contributed to the UK Platform delivering NCCF of £2.4 billion, up 9% on prior year (2012: £2.2 billion). Following a challenging start to the year with the implementation of the RDR changes, confidence amongst advisers returned and good sales were seen for the remainder of the year, particularly across the collective investments and ISA products.
In International, NCCF of £0.5 billion was 150% higher than prior year (2012: £0.2 billion) with increased sales momentum.
NCCF from UK third party distribution channels in OMGI reached £1.3 billion, continuing to reflect the positive impact of the recent appointments within the UK Equities team. New business sales through the UK Platform into OMGI funds are 16% for the full year 2013.
Gross outflows from the lower margin Nordic business totalled £1.2 billion following the divestment of the business in 2012, although this was partially offset by the continued internalisation of funds from the UK Heritage business of approximately £1.0 billion (gross) in 2013. The core OMGI NCCF excluding this internalisation of funds and the Nordic outflows more than doubled to £0.9 billion from £0.4 billion in 2012.
Within Europe, both Italy and France have improved NCCF compared with prior year. In Italy NCCF of £395 million was 18% higher than prior year (2012: £336 million) as a result of a number of new distribution agreements implemented throughout 2013. This has also resulted in reduced sales concentration risk locally. In France, following significant restructuring, work with key relationships throughout 2013 has seen NCCF improve 3% compared with 2012.
Within the European Heritage business, Germany, Austria and Switzerland have seen NCCF reduce, as expected, following their closure to new business in 2012. NCCF has reduced to £74 million for 2013 compared to £151 million in the prior year. Effective retention strategies continue to ensure that the persistency of this business remains ahead of our expectations.
In the UK, net outflows of legacy assets have declined marginally in 2013. Market growth in these investments overall has resulted in funds under management closing at higher levels than those at the start of the year despite a net outflow position during the year.
Funds under management (FUM)FUM has increased to £78.5 billion, up 13% on the start of 2013 (December 2012: £69.2 billion) with the continued improvement in the equity markets and positive NCCF.
The UK Platform assets were £27.3 billion, up 21% on prior year (December 2012: £22.6 billion). OMGI investment performance remained strong with 44% of Open Ended Investment Company (OEIC) funds in the first quartile over a three year period and a total of 66% of funds above the median. This has contributed to FUM increasing 16% to £16.0 billion (December 2012: £13.8 billion).
Gross sales We generated gross sales of £14.4 billion, an increase of 24% on the prior period (2012: £11.6 billion) with strong sales on the UK platform, OMGI and International cross-border businesses.
UK Platform sales increased by 14% to £4.7 billion (2012: £4.1 billion). Following the challenging start to the year in the UK market, sales momentum built through the year reflecting the improved market conditions. The second half of 2013 saw a 7% increase compared with the first half of the year due to higher sales of collective investments and ISAs.
UK sales from other lines of business were 15% lower than prior year, as 2012 sales had benefited from a £182 million premium received from an institutional provider. The year ended strongly with sales in the last quarter 50% higher than those in the third quarter.
International cross-border sales of £1,921 million were up 14% on the prior period (2012: £1,681 million), benefiting from improved sales in South Africa, which were enhanced further by the launch of the IP+ product in the second half of 2013. Elsewhere, product launches at the end of 2012 were initially slow to gain traction but in 2013 have significantly exceeded prior year sales. In Europe we have seen strong sales of Qualifying Recognised Overseas Pension Schemes (QROPS), while Hong Kong has benefited from improved Portfolio Bond sales. Sales in Latin America have developed well following the AIVA acquisition, and have been supported by the addition of the Life Investment Portfolio product which was launched in H2 2013. We expect this level of sales performance to continue into 2014. Latin America sales benefited from some large single premium business towards the end of the year.

Old Mutual plcAnnual Report and Accounts 2013
66
BUSINESS REVIEWOLD MUTUAL WEALTHcontinued
OMGI sales were strong through both UK third party channels and the UK Platform. Sales of £7,572 million were up 68% on prior year (2012: £4,506 million). Improved sales were seen across the Alternatives and Equities asset classes, with the latter benefiting from new appointments during the year, the improvement in the markets, consumer confidence and a shift from fixed income back into equities. A significant uplift in the fourth quarter was achieved, with inflows of 22% of all UK Platform sales into OMGI. This is following OMGI’s improved offering, continued strong investment performance and the sales teams gaining traction in the market after several months of work with brokers’ investment committees.
Within the European open businesses, we have seen continued strong sales in Italy, up 10% on the comparative period to £949 million, as a result of increased sales through both established and new distributors. Sales in France remained broadly in line with 2012 as the work with established distributors during a period of significant change has led to us retaining our market share.
Life and embedded value summaryGross single premium covered business sales on the UK Platform increased by 2% against prior year. Platform sales accounted for £232 million of the £606 million total Old Mutual Wealth sales on an APE basis.
In the International market, sales increased by 11% to £201 million on an APE basis.
Sales in Europe open portfolios increased by 2% to £127 million, with good performance in Italy partially offset by weaker activity levels in Poland and France.
The value of new business of £76 million was £14 million higher than prior year. Although APE remained largely unchanged, the decline in acquisition expenses had a positive impact on the value of new business. Overall APE margin has increased from 10% in 2012 to 13% in 2013.
OutlookWe have made significant progress in transforming our business in 2013 and 2014 will see further change. In the UK, we will launch the WealthSelect fund management suite, conclude the terms of our administrative outsourcing agreement and broaden our distribution capabilities. The objective is to increase our speed to market for our proposition and to service customers in the way that they find most convenient. We expect the sales momentum to continue into 2014 as we introduce further protection and retirement enhancements.
With Wealth Interactive implemented in International, we intend to increase our penetration in the markets we operate delivering flexible and user friendly products on an efficient platform.
We continue the planning for our outsourcing contract to boost product capability and lower our cost base from 2017 onwards. We expect an additional cash cost of approximately £140 million of the outsourcing agreement to be spent in the period of 2014-2016, which will be reported as exceptional IFRS costs and so excluded from adjusted operating profit.
The acquisition of the distribution business Intrinsic Financial Services, will allow us to diversify our distribution by becoming a ‘complementary’ advice channel, and will better position us to offer our own solutions. Given the substantial changes occurring in the industry, this move will solidify and maintain our presence in the advisory channel in the UK. It will also allow us to compete with other product providers who are acquiring their own distributors.
A revitalised Asia strategy will be launched at the end of Q1 2014 with the exclusive sales agreement with a leading institutional broker signed in December. We expect further collaboration with AIVA in Latin America, with the Life Investment Portfolio building a strong pipeline at the end of 2013 for 2014.
In OMGI, we expect continued strong growth of the UK Equity and Alternatives desks as well as through the Spectrum fund range. We remain focused on the launch of our multi-asset offerings including our Foundation fund in addition to developing our investment proposition in Asia.
At the same time as the WealthSelect launch in Q1 2014, there will be the final transfer of the heritage assets from the UK to OMGI of around £400 million. A final £200 million in Nordic outflows is expected in 2014.
We announced in November that we had agreed to sell our Polish business, as part of our commitment to simplify our operations and focus on a select number of core growth markets. The transaction is subject to regulatory approvals and other customary conditions and we expect to complete the sale in the next six months.
Given our current business profile and our ability to improve margin through increasing sales of our funds through our platforms, we remain confident of achieving our financial targets for Old Mutual Wealth and developing it into a fully-fledged wealth management business.

67
Business review
Old Mutual Wealth data tables (Sterling)
£m
Adjusted operating profit 2013 2012 % Change
Invest & Grow marketsUK Platform 13 2 550% UK Other1 6 1 500% International2 49 68 (28%)Old Mutual Global Investors3 15 2 650%
Total Invest & Grow 83 73 14% Manage for Value marketsEurope – open book4 22 (4) 650% Heritage business5 112 126 (11%)
Total Manage for Value 134 122 10%
Total Old Mutual Wealth 217 195 11%
1 Includes Protection, Series 6 pensions, and UK Institutional business 2 Comparative includes Finland, which was sold in H2 2012 and contributed £13 million of AOP in 20123 OMAM (UK) profits were recorded in USAM up until its transfer to OMGI in Q2 20124 Includes business written in France, Italy and Poland5 Includes UK Heritage and Europe Heritage book (Germany, Austria, Switzerland and Liechtenstein)
£bn
Gross sales and funds under management 1-Jan-13 Gross sales Redemptions Net flows
Market and other
movements 31-Dec-13
Invest & Grow marketsUK Platform1 22.6 4.7 (2.3) 2.4 2.3 27.3 UK Other2 4.7 0.8 (0.9) (0.1) 1.0 5.6 International 13.9 1.9 (1.4) 0.5 0.6 15.0 Old Mutual Global Investors3,4 13.8 7.6 (6.9) 0.7 1.5 16.0
Total Invest & Grow 55.0 15.0 (11.5) 3.5 5.4 63.9 Manage for Value marketsEurope – open book5 5.9 1.3 (0.8) 0.5 0.2 6.6 Heritage business6 14.3 0.7 (1.8) (1.1) 2.2 15.4
Total Manage for Value 20.2 2.0 (2.6) (0.6) 2.4 22.0
Elimination of intra-Group assets4,7 (6.0) (2.6) 2.0 (0.6) (0.8) (7.4)
Total Old Mutual Wealth 69.2 14.4 (12.1) 2.3 7.0 78.5
1 UK Platform FUM excludes intra-group assets from our International business of £1.5 billion in 2013 (2012: £1.4 billion)2 Includes Protection, Series 6 pensions and UK Institutional business3 OMGI redemptions include Nordic sale-related net outflow of £1.0 billion in 2013 (2012: £0.1 billion) 4 OMGI and intra-Group eliminations include net inflows from the Heritage business of £0.9 billion (2012: nil)5 Includes business written in France, Italy and Poland6 Includes UK Heritage and Europe Heritage (Germany, Austria, Switzerland and Liechtenstein)7 Assets and flows managed by OMGI on behalf of other Old Mutual Wealth businesses
Further financial information on the performance of the business can be found in the Financial Disclosure Supplement on our website www.oldmutual.com

Old Mutual plcAnnual Report and Accounts 2013
68
BUSINESS REVIEWUS ASSET MANAGEMENT
Overview Business momentum continued in 2013 for USAM, including AOP and operating margin growth, sustained positive net client cash flows, and strong long-term investment performance. IFRS AOP of $174 million increased by 21% on the reported 2012 result. Net client cash inflows were $16.3 billion, representing 7.8% of beginning FUM (2012: $0.4 billion net outflow on a reported basis), which coupled with positive market conditions led to 23% growth in FUM for the year.
IFRS AOP results and operating marginOperating resultsUSAM delivered a strong level of AOP in 2013 while supporting key growth initiatives including further build-out of our global distribution capabilities.
IFRS AOP increased by 21% on a reported basis (2012: $144 million) and 15% on a continuing basis (2012: $151 million) largely due to increases in management fees resulting from higher average FUM than the comparative period. Reported results also benefited from the divestiture activity undertaken during 2012.
Revenues of $609 million for the period were 14% higher than 2012 continuing operations ($536 million), driven by higher average FUM.
AOP margin before non-controlling interests increased by 5% to 33% from reported results in the prior year (1% increase on a continuing basis), reflecting the 2012 divestitures and operating leverage as revenue has increased. On a post non-controlling interests basis, reported operating margin increased 5% to 29%, and has continued to progress towards the upper end of our targeted 25% to 30% range.
Investment performance for continuing operations Over the one-, three- and five-year periods ended 31 December 2013, 48%, 90% and 88% of assets outperformed benchmarks, compared to 39%, 62% and 81% at 30 September 2013 and 62%, 66% and 76% at 31 December 2012. The improvement in three-year performance from 30 September 2013 was driven by one value equity product outperforming its respective benchmark, while the improvement in one-year performance relates largely to select global equity products.
USAM also evaluates investment performance weighted by the revenue generated by its products. As of 31 December 2013, assets representing 66%, 91% and 84% of revenue outperformed benchmarks over the one-, three- and five-year periods (31 December 2012: 67%, 71% and 68%).
Continued strong long-term investment performance and improved distribution capabilities remain key to generating future positive cash flows.
Strong net client cash flows of $16.3 billion and AOP up by 21%, as business momentum continues
$m
Highlights1 20132012
Continuing Change2012
Reported Change
AOP (IFRS basis, pre-tax) 174 151 15% 144 21%Operating margin, before non-controlling interests² 33% 32% 28%Operating margin, after non-controlling interests² 29% 28% 24%Net client cash flows ($bn) 16.3 1.4 14.9 (0.4) 16.7 Funds under management ($bn) 257.4 208.6 23% 208.6 23%
1 Continuing operations exclude affiliates disposed of during 2012 and OMAM(UK), which was transferred to Old Mutual Wealth in Q2 2012. Includes Echo Point which was discontinued in Q4 2013
2 Comparative operating margin has been restated following the adoption of IFRS 10 in respect of Heitman

69
Business review
Operating resultsFUM increased by 23% to $257.4 billion (31 December 2012: $208.6 billion) with $34.1 billion of market appreciation (contributing 16.3% growth) and $16.3 billion of net client cash inflows (contributing 7.8% growth). During Q4 2013, the decision was made to close Echo Point Investment Management, reducing FUM by $1.6 billion.
FUM consists primarily of long-term investment products diversified across equities (60.2%), fixed income (26.8%) and alternative investments (13.0%).
Net client cash inflows were $16.3 billion for the period (2012 reported results: $0.4 billion net outflow, 2012 continuing operations: $1.4 billion net inflow), representing 7.8% of opening FUM. Net inflows were highly diversified, with six out of the eight affiliates reporting positive or flat flows.
Net client cash inflows during the period are expected to result in a $46.9 million positive impact to annualised revenue, relating to higher fee equity products ($24.3 million), alternatives ($13.0 million), and fixed income products ($9.6 million).
Gross inflows totalled $39.9 billion (2012 reported results: $32.1 billion, 2012 continuing operations: $28.7 billion), with flows in global fixed income, international equities, dividend focus equities and emerging markets equities. Gross inflows of $13.1 billion were from new client accounts. Gross inflows of $15.5 billion came from non-US clients during the period.
Gross outflows totalled $23.6 billion (2012 reported results: $32.5 billion, 2012 continuing operations: $27.3 billion), concentrated in US value equities, along with international equities and global fixed income. Gross outflows of $1.0 billion relate to investment-driven hard asset disposals by Heitman, USAM’s real estate manager.
USAM’s Global Distribution initiative raised $4.5 billion in total assets funded in 2013; NCCF sourced by Global Distribution represented 23% of the total NCCF for the year. Non-US clients currently account for 36% of FUM (31 December 2012: 35%). International equity, emerging markets, global equity, global fixed income and currency products account for 52% of year-end FUM (31 December 2012: 52%).
Business developmentsDuring Q4 2013, USAM announced plans to close its international equity investment affiliate, Echo Point Investment Management LLC, a process which will be completed during Q1 2014.
USAM’s UK-based global fixed income manager, Rogge Global Partners, announced the appointment of David Jacob, effective from 13 January 2014, as successor to the firm’s founder and chief executive officer, Olaf Rogge. Mr. Rogge will continue as chairman and co-chief investment officer.
OutlookAssuming favourable market conditions, USAM expects strong business performance and financial growth to continue in 2014, including sustained positive net client cash flows and an operating margin of greater than 30%, pre non-controlling interests. On an ongoing basis, USAM continues to target average annual net client cash inflows of 3% to 5% of opening FUM.
Global equity market trends whilst volatile suggest that investor preferences may shift from fixed income to equity products in 2014. The impact on USAM of such a shift depends on the specific nature of this shift, although generally equity fees are higher than fixed income fees.
USAM’s Global Distribution team experienced a strong and successful start to its non-US initiatives in 2013 with several significant fundings of mandates won with their assistance. USAM remains focused on investing in affiliate growth initiatives and further penetration of non-US markets through its Global Distribution initiative.
We will also continue to explore selective inorganic growth opportunities which are additive to the portfolio and fill critical product or asset class gaps within our business.
Funds under management and net client cash flows $bn
Continuing operations
Disposed of or transferred
affiliates Reported
2013 2012¹ 2012 2012
Opening FUM 208.6 183.3 48.2 231.5 Gross inflows 39.9 28.7 3.4 32.1 Gross outflows (22.6) (25.3) (5.2) (30.5)
Total client driven net flows 17.3 3.4 (1.8) 1.6 Hard asset disposals (1.0) (2.0) – (2.0)
Net client cash flows 16.3 1.4 (1.8) (0.4)Disposals (1.6) – (42.0) (42.0)Transferred to Old Mutual Wealth – – (6.6) (6.6)Market and other 34.1 23.9 2.2 26.1
Closing FUM 257.4 208.6 – 208.6
¹ Continuing operations exclude affiliates disposed of during 2012 and OMAM(UK), which was transferred to Old Mutual Wealth in Q2 2012. Includes Echo Point which was discontinued in Q4 2013

Old Mutual plcAnnual Report and Accounts 2013
70
BUSINESS REVIEWNON-CORE BUSINESS – BERMUDA
Bermuda remains a non-core business. Its results are excluded from the Group’s IFRS AOP, except for the interest expense charged to AOP relating to the inter-company loans from Bermuda.
Overview and operating environmentBermuda has continued to implement its run-off strategy of risk reduction while managing for value. Favourable experience continued with contracts containing the Universal Guarantee Option (UGO) Guaranteed Minimum Accumulation Benefit (GMAB) experiencing higher than assumed surrender rates during the 5-year top-up period that ended in August 2013. The total cash cost of the top-ups made to contracts reaching their 5-year anniversary dates between 5 January 2012 and 29 August 2013 was $525 million, significantly lower than the 31 December 2011 projection of $689 million, mainly as a result of favourable equity market movements during the period.
In December 2013, the Bermuda Monetary Authority (BMA) agreed to the release of $100 million of capital through the cancellation of inter-company loan notes. This was in addition to the $450 million of capital release approved in July 2013. The release of capital reflects the reduction in size of the remaining liabilities, risk management strategy and de-risking actions taken.
Surrender developmentIn aggregate, there was $1,210 million of surrenders in 2013 (2012: $1,929 million). At 31 December 2013 around 81% of the non-Hong Kong UGO GMAB policies and around 67% of the Hong Kong policies originally written (by guarantee amount) had surrendered on or after their 5-year anniversary date.
The development of the Bermuda policyholder account values is shown below:$m
Period 31-Dec-13 31-Dec-12 % Change
Account Value: GMAB 1,031 1,856 (44)%Account Value: Non-GMAB 407 679 (40)%
Total Account Value 1,438 2,535 (43)%
Business developmentsA 5-year hedge was purchased in Q2 2013 for the 10-year risk associated with the highest anniversary value (HAV) feature of the Hong Kong policies which could potentially arise in 2017-18. The structured “look back” options (HAV Options) provide protection against markets rising above the 120% guarantee and then subsequently falling. This is designed to reduce future volatility of earnings and capital requirements emanating from the HAV.
The risks below the 120% guarantee continue to be managed by the dynamic hedge programme at a 50% hedge ratio as at 31 December 2013 for the residual non-US dollar currency exposures and equity market risk.
Key Metrics and OutcomesIFRS resultsThe IFRS post-tax profit for the period was $51 million (2012: $254 million), due to net realised gains on the bond portfolio and the favourable guarantee performance, net of hedging. The decrease on prior year profit was mainly due to reduced fee revenue in 2013 given the run-off of the book, reduced investment income following the liquidation of the investment portfolio, losses booked on the HAV Options and lower favourable lapse experience and assumption changes.
Total insurance liabilitiesOf year-end insurance liabilities totalling $1,522 million (2012: $2,764 million):
■ $1,234 million (2012: $2,119 million) was held in separate accounts relating to variable annuity investments, of which $1,031 million was related to GMAB policies (2012: $1,856 million)
■ $84 million (2012: $229 million) related to the variable annuity guarantee reserve on the GMAB policies
■ $204 million (2012: $416 million) related to other policyholder liabilities. These included deferred and fixed indexed annuity business as well as variable annuity fixed credited interest investments
The majority of the variable annuity guarantee reserve relates to contracts with UGO GMABs. The 2013 year-end UGO GMAB reserve was $79 million, a decrease of $140 million over the year, due mainly to the realisation of the remaining 5-year top-ups, improved overall equity market levels, rising US interest rates performance and the high level of UGO GMAB surrenders experienced.
Highest Anniversary ValueOn an account value basis at 31 December 2013, 86% of the UGO GMAB book had a HAV feature, providing policyholders with a 10-year guarantee value based on their highest policy value at any anniversary date. As at 31 December 2013, 9% of the total UGO GMAB book had a 10-year guarantee above 120%.
Reserve developmentThe UGO GMAB reserve relates to the full remaining period of the relevant policies, including the 10-year 120% top-up of total premiums and any contracts with a HAV feature.
The table below shows the level of guarantee reserves and, in respect of the UGO GMAB fifth-anniversary guarantees, the cumulative top-ups paid over 2012-13:

71
Business review
$m
Calculation Date
Guarantee reserves for
UGO GMAB
Actual cumulative
top-ups paid¹,²
Estimated remaining
top-up payment¹,²
Total estimated cash cost¹,²
31-Dec-11 1,035 – 689 689 31-Dec-12 219 425 105 530 31-Dec-13 79 525 – –
1 To meet UGO GMAB fifth anniversary payments2 Estimated cash cost before gains on hedge options
Treasury management of Bermuda assets The Bermuda business assets backing the liabilities include:
$m
31-Dec-13 31-Dec-12 % Change
Cash and other liquid assets 71 268 (74)%Treasury portfolio 62 62 –Fixed income general account portfolio 5 195 (97)%Collateral for hedge assets & FV of equity options 32 52 (38)%Inter-company loan notes 466 1,032 (55)%Investment in affiliated subsidiary (Group seed investments) 260 260 –Separate account assets 1,234 2,119 (42)%Other assets 27 58 (53)%
Total Assets 2,157 4,046 (47)%
The fixed income portfolio has been substantially sold except for a residual amount of less liquid holdings. The balance is $5 million as at 31 December 2013 (31 December 2012: $195 million). The sales of investments were undertaken during Q2 2013 to realise gains at prevailing favourable market conditions. The cash realised has been utilised to meet surrender activity and withdrawals.
The inter-company loan notes are structured in tranches allowing capital and treasury management flexibility, when cash is required from this source. Additional cash funding may also be required to provide for margin collateral due to the dynamic hedging activity depending on market movements and changes in hedging strategy.
Collateral posted for the hedge assets will adjust as the liabilities develop and could be released back to the business as the business evolves.
Capital and surplusStatutory capital and surplus decreased to $604 million at 31 December 2013 (31 December 2012: $1,105 million), reflecting the cumulative capital release of $550 million approved by the BMA during the year, and after the $51 million profit. Capital allocated to the business on a local level includes the inter-company loan notes from the business to the Group.
The future level of capital required on both an economic and a regulatory basis will be influenced by the nature and extent of the run-off of the book of business in Bermuda and the amount of the investment hedge in place. We expect to continue to review the regulatory capital requirement regularly with the BMA in 2014.
Strategy and outlookOld Mutual Bermuda will continue to implement its run-off strategy of reducing risk while managing for value, with liability management, fund management, hedging and de-risking initiatives for the remaining book, including the 10-year 120% guarantee and HAV policies still in force. The remaining UGO GMAB reserves will change in response to movements in exchange rates, interest rates, equity markets, surrender activity and the effluxion of time. The overall remaining guarantee cost is subject to the performance and extent of the hedging activity.
Going forward, it is expected that fee income will broadly match operating expenses, whilst the prospects for significantly higher than assumed lapses of remaining policies have in all likelihood reduced, given the surrenders that have already occurred.
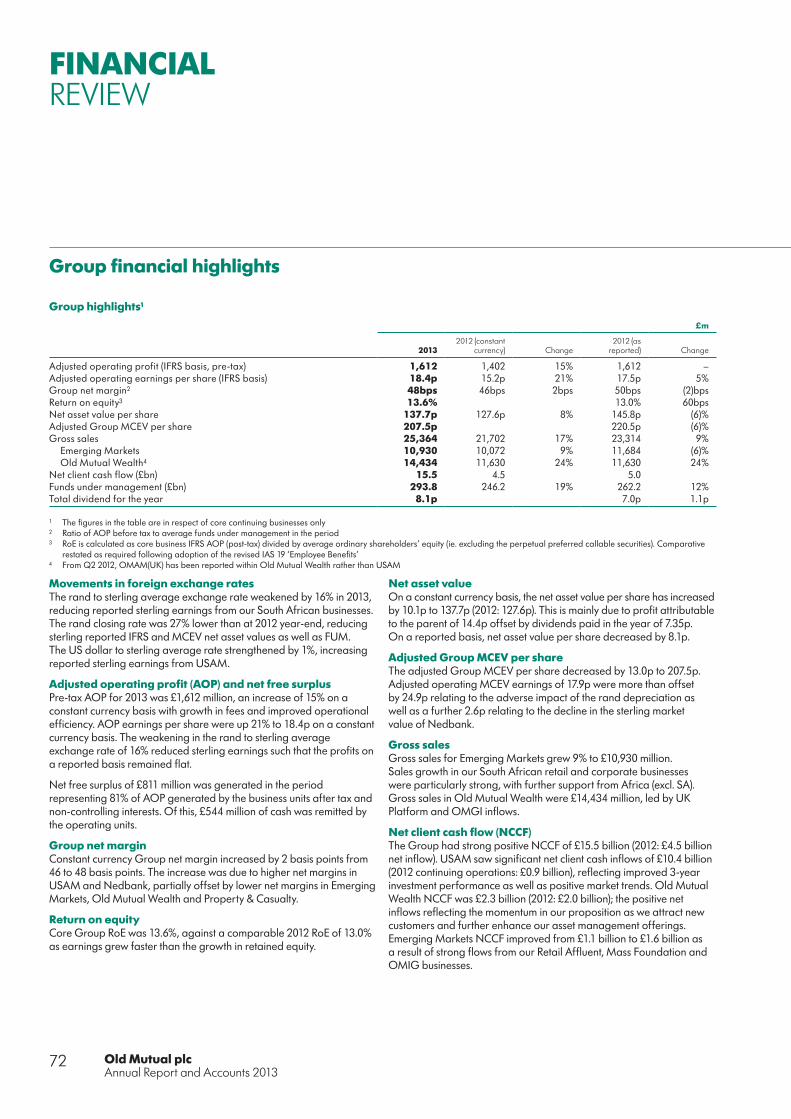
Old Mutual plcAnnual Report and Accounts 2013
72
FINANCIALREVIEW
Group financial highlights
Group highlights¹
£m
20132012 (constant
currency) Change2012 (as
reported) Change
Adjusted operating profit (IFRS basis, pre-tax) 1,612 1,402 15% 1,612 –Adjusted operating earnings per share (IFRS basis) 18.4p 15.2p 21% 17.5p 5%Group net margin2 48bps 46bps 2bps 50bps (2)bpsReturn on equity3 13.6% 13.0% 60bpsNet asset value per share 137.7p 127.6p 8% 145.8p (6)%Adjusted Group MCEV per share 207.5p 220.5p (6)%Gross sales 25,364 21,702 17% 23,314 9%
Emerging Markets 10,930 10,072 9% 11,684 (6)%Old Mutual Wealth4 14,434 11,630 24% 11,630 24%
Net client cash flow (£bn) 15.5 4.5 5.0 Funds under management (£bn) 293.8 246.2 19% 262.2 12%Total dividend for the year 8.1p 7.0p 1.1p
1 The figures in the table are in respect of core continuing businesses only2 Ratio of AOP before tax to average funds under management in the period3 RoE is calculated as core business IFRS AOP (post-tax) divided by average ordinary shareholders’ equity (ie. excluding the perpetual preferred callable securities). Comparative
restated as required following adoption of the revised IAS 19 ‘Employee Benefits’4 From Q2 2012, OMAM(UK) has been reported within Old Mutual Wealth rather than USAM
Movements in foreign exchange ratesThe rand to sterling average exchange rate weakened by 16% in 2013, reducing reported sterling earnings from our South African businesses. The rand closing rate was 27% lower than at 2012 year-end, reducing sterling reported IFRS and MCEV net asset values as well as FUM. The US dollar to sterling average rate strengthened by 1%, increasing reported sterling earnings from USAM.
Adjusted operating profit (AOP) and net free surplusPre-tax AOP for 2013 was £1,612 million, an increase of 15% on a constant currency basis with growth in fees and improved operational efficiency. AOP earnings per share were up 21% to 18.4p on a constant currency basis. The weakening in the rand to sterling average exchange rate of 16% reduced sterling earnings such that the profits on a reported basis remained flat.
Net free surplus of £811 million was generated in the period representing 81% of AOP generated by the business units after tax and non-controlling interests. Of this, £544 million of cash was remitted by the operating units.
Group net margin Constant currency Group net margin increased by 2 basis points from 46 to 48 basis points. The increase was due to higher net margins in USAM and Nedbank, partially offset by lower net margins in Emerging Markets, Old Mutual Wealth and Property & Casualty.
Return on equity Core Group RoE was 13.6%, against a comparable 2012 RoE of 13.0% as earnings grew faster than the growth in retained equity.
Net asset valueOn a constant currency basis, the net asset value per share has increased by 10.1p to 137.7p (2012: 127.6p). This is mainly due to profit attributable to the parent of 14.4p offset by dividends paid in the year of 7.35p. On a reported basis, net asset value per share decreased by 8.1p.
Adjusted Group MCEV per share The adjusted Group MCEV per share decreased by 13.0p to 207.5p. Adjusted operating MCEV earnings of 17.9p were more than offset by 24.9p relating to the adverse impact of the rand depreciation as well as a further 2.6p relating to the decline in the sterling market value of Nedbank.
Gross salesGross sales for Emerging Markets grew 9% to £10,930 million. Sales growth in our South African retail and corporate businesses were particularly strong, with further support from Africa (excl. SA). Gross sales in Old Mutual Wealth were £14,434 million, led by UK Platform and OMGI inflows.
Net client cash flow (NCCF)The Group had strong positive NCCF of £15.5 billion (2012: £4.5 billion net inflow). USAM saw significant net client cash inflows of £10.4 billion (2012 continuing operations: £0.9 billion), reflecting improved 3-year investment performance as well as positive market trends. Old Mutual Wealth NCCF was £2.3 billion (2012: £2.0 billion); the positive net inflows reflecting the momentum in our proposition as we attract new customers and further enhance our asset management offerings. Emerging Markets NCCF improved from £1.1 billion to £1.6 billion as a result of strong flows from our Retail Affluent, Mass Foundation and OMIG businesses.
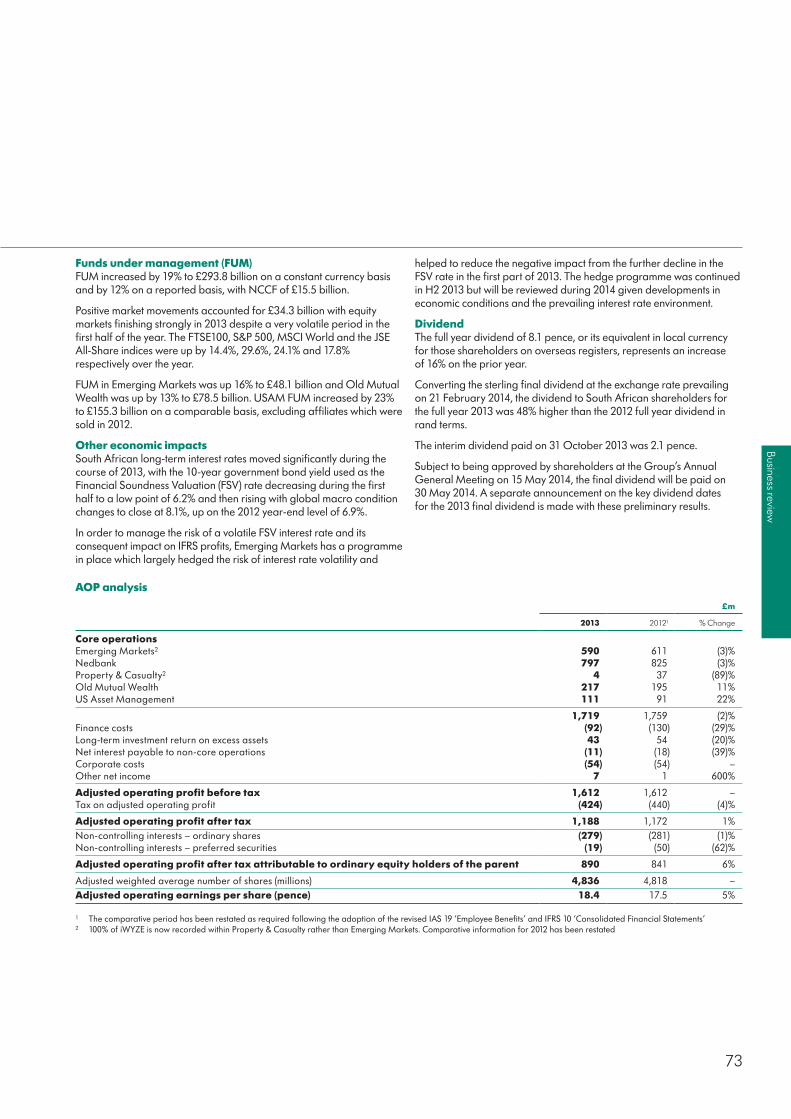
73
Business review
Funds under management (FUM)FUM increased by 19% to £293.8 billion on a constant currency basis and by 12% on a reported basis, with NCCF of £15.5 billion.
Positive market movements accounted for £34.3 billion with equity markets finishing strongly in 2013 despite a very volatile period in the first half of the year. The FTSE100, S&P 500, MSCI World and the JSE All-Share indices were up by 14.4%, 29.6%, 24.1% and 17.8% respectively over the year.
FUM in Emerging Markets was up 16% to £48.1 billion and Old Mutual Wealth was up by 13% to £78.5 billion. USAM FUM increased by 23% to £155.3 billion on a comparable basis, excluding affiliates which were sold in 2012.
Other economic impactsSouth African long-term interest rates moved significantly during the course of 2013, with the 10-year government bond yield used as the Financial Soundness Valuation (FSV) rate decreasing during the first half to a low point of 6.2% and then rising with global macro condition changes to close at 8.1%, up on the 2012 year-end level of 6.9%.
In order to manage the risk of a volatile FSV interest rate and its consequent impact on IFRS profits, Emerging Markets has a programme in place which largely hedged the risk of interest rate volatility and
helped to reduce the negative impact from the further decline in the FSV rate in the first part of 2013. The hedge programme was continued in H2 2013 but will be reviewed during 2014 given developments in economic conditions and the prevailing interest rate environment.
DividendThe full year dividend of 8.1 pence, or its equivalent in local currency for those shareholders on overseas registers, represents an increase of 16% on the prior year.
Converting the sterling final dividend at the exchange rate prevailing on 21 February 2014, the dividend to South African shareholders for the full year 2013 was 48% higher than the 2012 full year dividend in rand terms.
The interim dividend paid on 31 October 2013 was 2.1 pence.
Subject to being approved by shareholders at the Group’s Annual General Meeting on 15 May 2014, the final dividend will be paid on 30 May 2014. A separate announcement on the key dividend dates for the 2013 final dividend is made with these preliminary results.
AOP analysis
£m
2013 20121 % Change
Core operationsEmerging Markets2 590 611 (3)%Nedbank 797 825 (3)%Property & Casualty2 4 37 (89)%Old Mutual Wealth 217 195 11%US Asset Management 111 91 22%
1,719 1,759 (2)%Finance costs (92) (130) (29)%Long-term investment return on excess assets 43 54 (20)%Net interest payable to non-core operations (11) (18) (39)%Corporate costs (54) (54) – Other net income 7 1 600%
Adjusted operating profit before tax 1,612 1,612 – Tax on adjusted operating profit (424) (440) (4)%
Adjusted operating profit after tax 1,188 1,172 1%Non-controlling interests – ordinary shares (279) (281) (1)%Non-controlling interests – preferred securities (19) (50) (62)%
Adjusted operating profit after tax attributable to ordinary equity holders of the parent 890 841 6%
Adjusted weighted average number of shares (millions) 4,836 4,818 – Adjusted operating earnings per share (pence) 18.4 17.5 5%
1 The comparative period has been restated as required following the adoption of the revised IAS 19 ‘Employee Benefits’ and IFRS 10 ‘Consolidated Financial Statements’2 100% of iWYZE is now recorded within Property & Casualty rather than Emerging Markets. Comparative information for 2012 has been restated
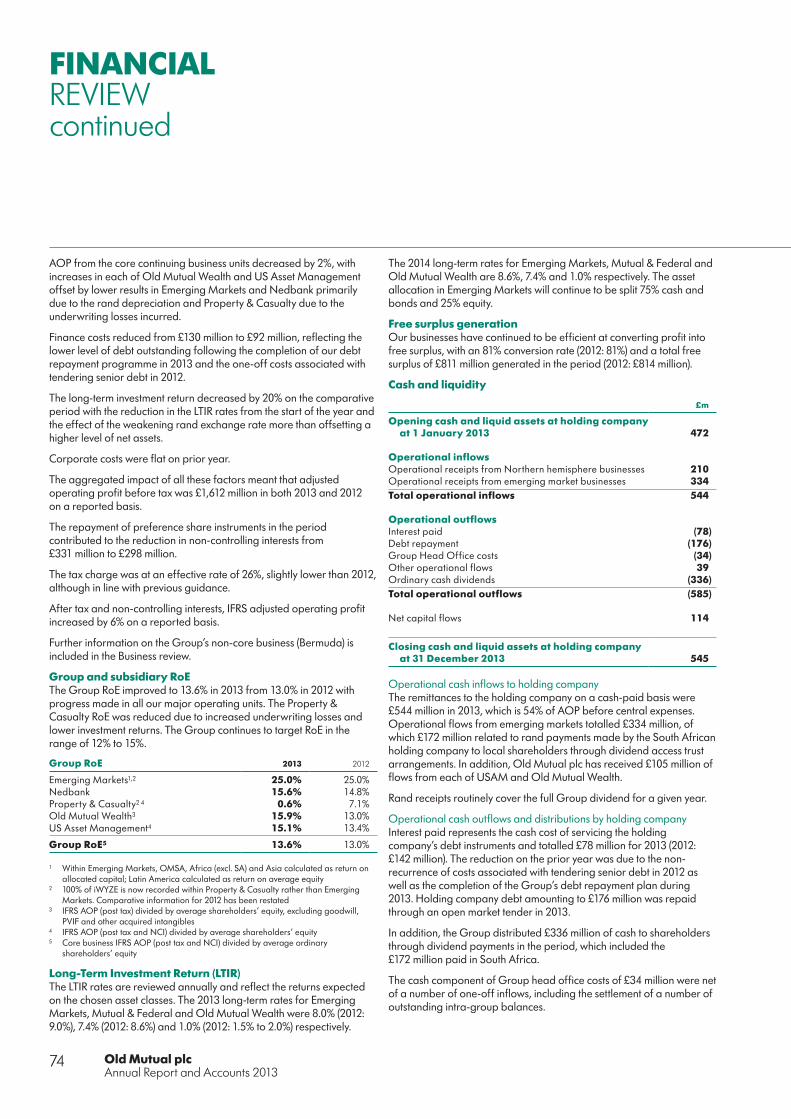
Old Mutual plcAnnual Report and Accounts 2013
74
AOP from the core continuing business units decreased by 2%, with increases in each of Old Mutual Wealth and US Asset Management offset by lower results in Emerging Markets and Nedbank primarily due to the rand depreciation and Property & Casualty due to the underwriting losses incurred.
Finance costs reduced from £130 million to £92 million, reflecting the lower level of debt outstanding following the completion of our debt repayment programme in 2013 and the one-off costs associated with tendering senior debt in 2012.
The long-term investment return decreased by 20% on the comparative period with the reduction in the LTIR rates from the start of the year and the effect of the weakening rand exchange rate more than offsetting a higher level of net assets.
Corporate costs were flat on prior year.
The aggregated impact of all these factors meant that adjusted operating profit before tax was £1,612 million in both 2013 and 2012 on a reported basis.
The repayment of preference share instruments in the period contributed to the reduction in non-controlling interests from £331 million to £298 million.
The tax charge was at an effective rate of 26%, slightly lower than 2012, although in line with previous guidance.
After tax and non-controlling interests, IFRS adjusted operating profit increased by 6% on a reported basis.
Further information on the Group’s non-core business (Bermuda) is included in the Business review.
Group and subsidiary RoE The Group RoE improved to 13.6% in 2013 from 13.0% in 2012 with progress made in all our major operating units. The Property & Casualty RoE was reduced due to increased underwriting losses and lower investment returns. The Group continues to target RoE in the range of 12% to 15%.
Group RoE 2013 2012
Emerging Markets1,2 25.0% 25.0%Nedbank 15.6% 14.8%Property & Casualty2 4 0.6% 7.1%Old Mutual Wealth3 15.9% 13.0%US Asset Management4 15.1% 13.4%
Group RoE5 13.6% 13.0%
1 Within Emerging Markets, OMSA, Africa (excl. SA) and Asia calculated as return on allocated capital; Latin America calculated as return on average equity
2 100% of iWYZE is now recorded within Property & Casualty rather than Emerging Markets. Comparative information for 2012 has been restated
3 IFRS AOP (post tax) divided by average shareholders’ equity, excluding goodwill, PVIF and other acquired intangibles
4 IFRS AOP (post tax and NCI) divided by average shareholders’ equity 5 Core business IFRS AOP (post tax and NCI) divided by average ordinary
shareholders’ equity
Long-Term Investment Return (LTIR)The LTIR rates are reviewed annually and reflect the returns expected on the chosen asset classes. The 2013 long-term rates for Emerging Markets, Mutual & Federal and Old Mutual Wealth were 8.0% (2012: 9.0%), 7.4% (2012: 8.6%) and 1.0% (2012: 1.5% to 2.0%) respectively.
FINANCIALREVIEWcontinued
The 2014 long-term rates for Emerging Markets, Mutual & Federal and Old Mutual Wealth are 8.6%, 7.4% and 1.0% respectively. The asset allocation in Emerging Markets will continue to be split 75% cash and bonds and 25% equity.
Free surplus generation Our businesses have continued to be efficient at converting profit into free surplus, with an 81% conversion rate (2012: 81%) and a total free surplus of £811 million generated in the period (2012: £814 million).
Cash and liquidity
£m
Opening cash and liquid assets at holding company at 1 January 2013 472
Operational inflowsOperational receipts from Northern hemisphere businesses 210 Operational receipts from emerging market businesses 334 Total operational inflows 544
Operational outflowsInterest paid (78)Debt repayment (176)Group Head Office costs (34)Other operational flows 39 Ordinary cash dividends (336)Total operational outflows (585)
Net capital flows 114
Closing cash and liquid assets at holding company at 31 December 2013 545
Operational cash inflows to holding companyThe remittances to the holding company on a cash-paid basis were £544 million in 2013, which is 54% of AOP before central expenses. Operational flows from emerging markets totalled £334 million, of which £172 million related to rand payments made by the South African holding company to local shareholders through dividend access trust arrangements. In addition, Old Mutual plc has received £105 million of flows from each of USAM and Old Mutual Wealth.
Rand receipts routinely cover the full Group dividend for a given year.
Operational cash outflows and distributions by holding companyInterest paid represents the cash cost of servicing the holding company’s debt instruments and totalled £78 million for 2013 (2012: £142 million). The reduction on the prior year was due to the non-recurrence of costs associated with tendering senior debt in 2012 as well as the completion of the Group’s debt repayment plan during 2013. Holding company debt amounting to £176 million was repaid through an open market tender in 2013.
In addition, the Group distributed £336 million of cash to shareholders through dividend payments in the period, which included the £172 million paid in South Africa.
The cash component of Group head office costs of £34 million were net of a number of one-off inflows, including the settlement of a number of outstanding intra-group balances.

75
Business review
Net capital flowsOld Mutual plc has received £44 million and £120 million in respect of the transfer to Old Mutual South Africa of its ownership of shares in the Chinese joint venture and in the Colombian and Mexican businesses respectively.
In May 2013, the Group provided £27 million of funding to OM Bermuda in support of hedging the Highest Anniversary Value (HAV) risk on the remaining liabilities. A further £23 million of outflows related to the investment of seed capital.
LiquidityAt 31 December 2013, the Group had available liquid assets and undrawn committed facilities of £1.3 billion (2012: £1.7 billion). The reduction in headroom is the result of debt repaid during the period, combined with a reduction in the Group’s committed Revolving Credit Facility (RCF) from £1,200 million to £800 million. The unutilised portion of this facility forms part of the holding company’s overall liquidity headroom and, in addition to this facility and the cash at Old Mutual plc, each of the individual businesses also maintains liquidity to support its normal trading operations.
At 31 December 2013, the Group had $466 million of inter-company loan notes outstanding to Old Mutual Bermuda following the Bermuda Monetary Authority’s agreement during the year to the cancellation of a total of $550 million of loan notes held at 31 December 2012. Additional cash funding for the business may be required; for example, to provide for margin collateral due to the dynamic hedging activity, depending on market movements and changes in hedging strategy.
Capital and leverageDebt strategy, profile and maturitiesThe Group excluding Nedbank had gross debt on an IFRS basis of £1,342 million at 31 December 2013 (2012: £1,569 million). In November 2013 we reduced Group debt by a further £176 million via an open market tender, to complete our stated debt reduction target of £1.7 billion. Following the tender, there are no plans to repay further Group debt in the immediate future.
The Group has first calls on debt instruments amounting to €374 million (£311 million) in November 2015 and £273 million in March 2020. In addition, the Group has £112 million of senior debt maturing in October 2016. The £500 million bond issued in June 2011 matures in June 2021. Included in subordinated Group debt at the year-end is a R3 billion debt instrument with a first call in October 2015, issued by Old Mutual Life Assurance Company (South Africa).
Business local statutory capital coverThe Group’s subsidiary businesses continue to have strong local statutory capital cover.
31-Dec-13 31-Dec-12
Old Mutual Life Assurance Company (South Africa) 3.3x 4.0x
Mutual & Federal1 1.8x 1.8xUK 2.7x 2.3xNedbank2
Common equity Tier 1: 12.5% 11.6%Tier 1: 13.6% 13.1%Total: 15.7% 15.1%
Bermuda3 1.4x 1.6x
1 Local statutory cover is based on interim Solvency Assessment and Management (SAM) framework for non-life insurers, implemented on 1 January 2012
2 This includes unappropriated profits and is calculated on a Basel III basis3 Based on Bermuda’s insurance (Prudential Standards) Class E Capital Rules
Financial Groups Directive resultsThe Group’s regulatory capital surplus, calculated under the EU Financial Groups Directive (FGD), was £2.1 billion at 31 December 2013 and represents a statutory coverage ratio of 169%. Increases in financial resources attributable to retained earnings in the year were reduced by the repayment of debt and net increases in the capital requirements of the Group’s businesses, with the result that the absolute surplus was stable when compared to 2012.
This is a level with which we are comfortable given our earnings, our cash flow profile, the natural currency hedges of our capital resources and requirements and risk assessment. A 1% fall in the ZAR/GBP exchange rate would result in a £10 million reduction in the surplus (2012: £16 million reduction in the surplus). Given that the capital resources and the capital requirement both fluctuate with changes in exchange rates, the cover ratio remains broadly unaffected by such a change in currency rates.
Economic capitalWe continue to manage our business and monitor capital coverage internally on an economic capital at risk (ECaR) basis. We are comfortably capitalised on this basis with a coverage ratio of over 160%. We intend to make disclosures of our economic capital position in respect of 2013 during the first half of 2014.
Old Mutual calculates its economic coverage ratio on an internal basis. ECaR is calculated using a bottom-up risk based approach applied to product lines within operating entities. Old Mutual has chosen to calculate ECaR using a one-year probability of default of 0.5% going forward, which is consistent with Solvency II principles and general industry practice. These calculations incorporate exposures to Old Mutual’s life insurance, property & casualty, banking and asset management businesses across regions. As such, diversification is allowed for between different risks within entities and across sectors and territories.
Market Consistent Embedded Value (MCEV)The adjusted Group MCEV per share decreased by 13.0p (6%) to 207.5p from December 2012, with 4,897 million shares in issue (2012: 4,893 million shares). This decline was due to adjusted operating MCEV earnings of 17.9p being more than offset by negative non-operating earnings and other movements of 30.9p, largely comprised of the translation effect of foreign exchange movements and the payment of dividends.
During the period Old Mutual owned on average 54.4% of Nedbank. At 31 December 2013, the market value of Nedbank included in our adjusted Group MCEV was £3.1 billion.
Within the adjusted operating MCEV earnings per share of 17.9p, non-covered business operating earnings increased by 1.5p to 7.9p, and now represents 44% of the total (2012: 42%).
The 1.5p increase in non-covered business operating earnings per share was largely due to lower finance costs following the debt reduction programme and the reduction in outstanding loan notes held by Old Mutual Bermuda. Nedbank’s higher earnings contribution in rand was largely offset by the impact of exchange rates.
Old Mutual plcAnnual Report and Accounts 2013
76
Covered business operating MCEV earnings per share increased by 1.0p to 10.0p as a result of an increase in Old Mutual Wealth covered earnings by 2.3p due to the non-recurrence of 2012 run-off costs for Austria and Germany and the higher value of new business as a result of lower acquisition costs. The earnings from Old Mutual Bermuda reduced by 1.4p mainly due to reduced gains from persistency experience and assumption changes after the significant run-off of the business in the period.
At December 2013, 62% of the adjusted Group MCEV, pre-debt and net other business, was in emerging market countries (2012: 64%), with 25% in European businesses (2012: 22%) and 13% in the US (2012: 15%).
Net asset value The reported net asset value per share has decreased by 8.1p to 137.7p (2012: 145.8p). This is mainly due to the impact of the depreciation of the rand of 18.2p and dividends paid in the year of 7.35p, partially offset by profit attributable to the parent of 14.4p.
Risk Management Risks and uncertaintiesA number of potential risks and uncertainties could have a material impact on the Group’s performance and cause actual results to differ materially from expected and historical results.
The Group’s overall risk profile and capital position remains stable despite difficult economic conditions and weakened global recovery. With this stable position, we have strategically positioned ourselves for growth, mainly through Old Mutual Wealth and expansion in Africa. In the short term we expect operational and execution risk to increase. We have accepted these risks in order to reduce longer-term strategic risk and are actively managing these risks.
Investment in risk management and governance over the past few years has positioned the Group well to comply with the new regulatory requirements under Solvency II and the equivalent developments in South Africa, and Basel III. We are confident that we are sufficiently capitalised on an economic capital basis to comply with the new requirements as currently proposed, although these are not yet finalised.
South Africa currently has substantial current account and budget deficits and historically low interest rates. The most significant external risks to earnings relate to the concentration of businesses in South Africa and the exposure to South African economic conditions and the impact thereof on our South African customer base, as well as the value of the Group’s earnings and assets when translated from rand to sterling. Our scenario testing involving a severe fall in the rand shows that the Group has sufficient capital and liquidity headroom to withstand such an event.
The increased pressure on South African consumers due to lower disposable income poses some risk to all our businesses in South Africa. Exposure to credit risk has increased slightly, but remains within appetite. Whilst the majority of lending activities are secured, Nedbank’s unsecured lending book reduced over 2013. Within Old Mutual Finance we experienced controlled growth off a low base, applying stringent affordability requirements and strict credit criteria.
In South Africa, the values of certain life insurance liabilities are sensitive to movements in long-term interest rates, which have been volatile over 2013. In response to this, the exposure to changes in the interest rate was hedged in 2013 and has been continued into 2014, subject to ongoing review in line with changes in economic conditions and the interest rate environment.
Old Mutual Bermuda risk exposure has reduced significantly, and represents less than 2% of the Group ECaR.
The current regulatory environment is continuously changing in all markets where we operate. Regulators across the globe continue to focus on the treatment of customers and both principles and best practice in this area are evolving. Our commitment to operating responsibly, with a strong focus on customer culture and values, positions us well to respond to this.
In South Africa, there is a move towards Group supervision and our risk management and governance structures and processes have been evolving for some time in anticipation of these developments. Although we are not a global systemically important financial institution, we are considered domestically important in South Africa by the regulators.
The Board believes that the Group has adequate resources to continue in operational existence for the foreseeable future. Accordingly, the Board continues to adopt the going concern basis for preparing accounts.
TaxTotal tax expense The effective tax rate (ETR) on AOP decreased slightly from 27% in 2012 to 26% in 2013. As 84% of the 2013 AOP tax charge relates to Emerging Markets and Nedbank, movements in the ETRs of these business units have a correspondingly large impact on the Group’s ETR. The decrease in ETR was largely a result of the abolition of South African secondary tax on companies (STC) during 2012 and an increased proportion of low taxed income in Africa, as well as the impact of the reduction of the UK tax rate on deferred tax liabilities.
Looking forward, and subject to market conditions and profit mix, we expect the ETR on AOP in future periods to range between 25% and 28%.
Income tax attributable to policyholder returnsIn accordance with accounting guidance, tax on policyholder investment returns is included in the Group’s IFRS tax charge rather than being offset against the related income. The impact is to increase Group IFRS profit before tax by £174 million in 2013 (2012: £75 million), with a corresponding increase to the tax charge. Of this £174 million, £112 million was attributable to Old Mutual Wealth (2012: £26 million), with the remaining £62 million relating to South Africa and Africa (excl. SA) (2012: £49 million).
FINANCIALREVIEWcontinued

77
Business review
Financial appendixSupplementary financial information (data tables) Summarised financial information
2013 2012 % Change
IFRS results Basic earnings per share1 15.0p 24.9p (40)%IFRS profit after tax attributable to equity holders of the parent (£m)1,2 705 1,172 (40)%MCEV results3
Adjusted Group MCEV (£bn) 10.2 10.8 (6)%Adjusted Group MCEV per share 207.5p 220.5p (6)%Adjusted operating Group MCEV earnings (post-tax and non-controlling interests) (£m) 867 776 12%Adjusted operating Group MCEV earnings per share 17.9p 15.4p 16%Return on Group MCEV 9.4% 8.0%
1 Basic earnings per share and IFRS profit after tax in 2012 included 12.3p and £564 million, respectively, relating to profit from discontinued operations following the sale of Nordic2 The comparative period has been restated as required following the adoption of the revised IAS 19 ‘Employee Benefits’3 MCEV in 2012 includes profit from discontinued operations of £564 million following the sale of Nordic
Group return on equity1
£m
2013 2012
AOP excluding accrued hybrid dividends – core operations2 890 841 Opening shareholders’ equity excluding hybrid capital – core operations2 6,566 5,835 Half-year shareholders’ equity excluding hybrid capital – core operations2 6,480 6,980 Closing shareholders’ equity excluding hybrid capital – core operations2 6,529 6,566 Average shareholders’ equity – core operations 6,525 6,460 Return on average equity2 13.6% 13.0%
1 RoE is calculated as core business IFRS AOP (post-tax) divided by average ordinary shareholders’ equity (ie. excluding the perpetual preferred callable securities) in core businesses2 Following the adoption of the revised IAS 19 ‘Employee Benefits’, the comparative RoE, AOP and average shareholders’ equity has been restated for 2012 to be lower by
£1 million and £19 million respectively
Group debt summary
2013 2012
Senior gearing (net of holding company cash) (4.0%) (3.0%)Total gearing (net of holding company cash) 6.5% 8.5% Book value of debt – MCEV basis (£m) 1,420 1,607 Book value of debt – IFRS basis (£m) 1,342 1,569 Total interest cover1 14.4 times 8.8 timesHard interest cover1 4.2 times 1.9 times
1 Total interest cover and hard interest cover ratios exclude non-core and discontinued operations
Adjusted Group MCEV per share
p
Adjusted Group MCEV per ordinary share at 31 December 20121,2 220.5 Covered business 10.0 Non-covered business 7.9
Adjusted Group operating MCEV earnings per ordinary share1 17.9 Economic variances and other earnings 6.3 Foreign exchange and other movements (24.9)Dividends paid to ordinary and preferred shareholders (7.9)Nedbank market value and foreign exchange movement (2.6)BEE and ESOP adjustments (1.0)Mark to market of debt (0.8)Non-operating MCEV earnings and other movements (30.9)
Adjusted Group MCEV per ordinary share at 31 December 20131 207.5
1 The number of shares used to calculate adjusted Group MCEV per share and adjusted operating Group MCEV earnings per share does not include preference shares2 The year-end 2012 Adjusted Group MCEV per share has been restated as required following the adoption of the revised IAS 19 ‘Employee Benefits’ and IFRS 10 ‘Consolidated
Financial Statements’. The impact of these changes was to increase Adjusted Group MCEV per share by 0.2p
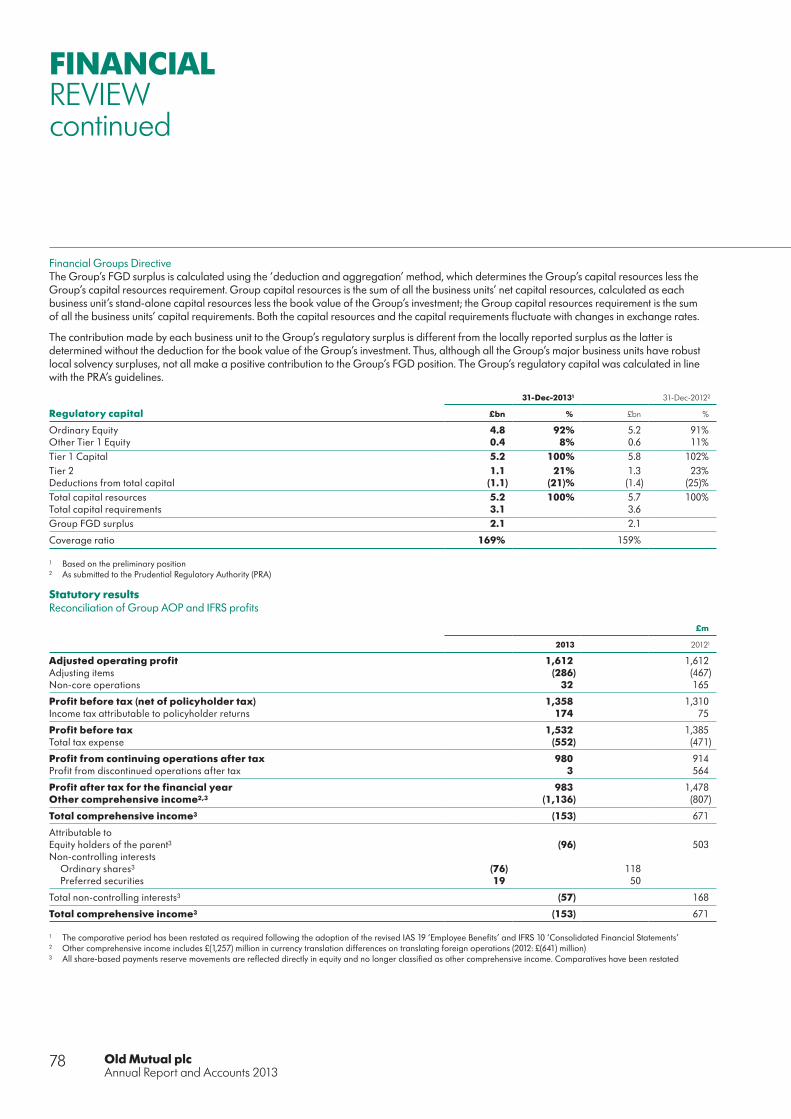
Old Mutual plcAnnual Report and Accounts 2013
78
Financial Groups DirectiveThe Group’s FGD surplus is calculated using the ‘deduction and aggregation’ method, which determines the Group’s capital resources less the Group’s capital resources requirement. Group capital resources is the sum of all the business units’ net capital resources, calculated as each business unit’s stand-alone capital resources less the book value of the Group’s investment; the Group capital resources requirement is the sum of all the business units’ capital requirements. Both the capital resources and the capital requirements fluctuate with changes in exchange rates.
The contribution made by each business unit to the Group’s regulatory surplus is different from the locally reported surplus as the latter is determined without the deduction for the book value of the Group’s investment. Thus, although all the Group’s major business units have robust local solvency surpluses, not all make a positive contribution to the Group’s FGD position. The Group’s regulatory capital was calculated in line with the PRA’s guidelines.
31-Dec-20131 31-Dec-20122
Regulatory capital £bn % £bn %
Ordinary Equity 4.8 92% 5.2 91%Other Tier 1 Equity 0.4 8% 0.6 11%Tier 1 Capital 5.2 100% 5.8 102%Tier 2 1.1 21% 1.3 23%Deductions from total capital (1.1) (21)% (1.4) (25)%Total capital resources 5.2 100% 5.7 100%Total capital requirements 3.1 3.6 Group FGD surplus 2.1 2.1
Coverage ratio 169% 159%
1 Based on the preliminary position2 As submitted to the Prudential Regulatory Authority (PRA)
Statutory resultsReconciliation of Group AOP and IFRS profits
£m
2013 20121
Adjusted operating profit 1,612 1,612 Adjusting items (286) (467)Non-core operations 32 165
Profit before tax (net of policyholder tax) 1,358 1,310 Income tax attributable to policyholder returns 174 75
Profit before tax 1,532 1,385 Total tax expense (552) (471)
Profit from continuing operations after tax 980 914 Profit from discontinued operations after tax 3 564
Profit after tax for the financial year 983 1,478 Other comprehensive income2,3 (1,136) (807)
Total comprehensive income3 (153) 671
Attributable toEquity holders of the parent3 (96) 503 Non-controlling interests
Ordinary shares3 (76) 118 Preferred securities 19 50
Total non-controlling interests3 (57) 168
Total comprehensive income3 (153) 671
1 The comparative period has been restated as required following the adoption of the revised IAS 19 ‘Employee Benefits’ and IFRS 10 ‘Consolidated Financial Statements’2 Other comprehensive income includes £(1,257) million in currency translation differences on translating foreign operations (2012: £(641) million)3 All share-based payments reserve movements are reflected directly in equity and no longer classified as other comprehensive income. Comparatives have been restated
FINANCIALREVIEWcontinued

79
Business review
Operational resultsThe detailed Business review is included from pages 52-71.
Emerging Markets
20132012 (constant
currency) Change
AOP (£m)1 590 527 12%NCCF (£bn) 1.6 1.1 0.5FUM (£bn) 48.1 41.6 16%Pre-tax FUM Operating Margin2 114 bps 118 bps (4) bps
1 100% of iWYZE is now recorded within Property & Casualty rather than Emerging Markets. Comparative information for 2012 has been restated2 Pre-tax FUM Operating Margin is calculated as pre-tax AOP divided by average FUM
Nedbank
20132012 (constant
currency) Change
AOP (£m)1 797 711 12%Net interest income (£m) 1,405 1,303 8%Non-interest revenue (£m) 1,282 1,147 12%Diluted Headline EPS 121.1p 105.3p 15%
1 The comparative period has been restated as required following the adoption of the revised IAS 19 ‘Employee Benefits’
Property & Casualty
20132012 (constant
currency) Change
AOP (£m)1 4 31 (88)%Underwriting Result (£m) (29) (9) (222)%Gross written premiums (£m) 749 643 17%Underwriting Ratio (4.9)% (1.7)% (320) bps
1 100% of iWYZE is now recorded within Property & Casualty rather than Emerging Markets. Comparative information for 2012 has been restated
Old Mutual Wealth
20132012 (constant
currency) Change
AOP (£m) 217 195 11%NCCF (£bn)1 2.3 2.0 0.3 FUM (£bn) 78.5 69.2 13%Pre-tax Revenue Operating Margin2 36% 33% 300 bps
1 From Q2 2012, OMAM UK has been reported within Old Mutual Wealth (OM Global Investors) rather than USAM. The comparatives for 2012 have not been restated2 Pre-tax Operating Margin is calculated as pre-tax AOP divided by Net Revenue
US Asset Management (continuing operations)1
20132012 (constant
currency) Change
AOP (£m) 111 96 15%NCCF (£bn) 10.4 0.9 9.5 FUM (£bn) 155.3 125.9 23%Pre-tax Revenue Operating Margin2,3 33% 32% 100 bps
1 Continuing operations exclude the financial impact of affiliates divested in 2012, although includes the results of Echo Point which was discontinued in Q4 2013 2 The comparative period has been restated as required following the adoption of the revised IFRS 10 ‘Consolidated Financial Statements’3 Pre-tax Revenue Operating Margin is calculated as pre-tax AOP before non-controlling interests divided by Total Revenue. Comparative revenue operating margin has been
restated following the adoption of IFRS 10 in respect of Heitman

GOVERNANCEIn this section, we look at our risk and capital management framework, who is on the Board and explain how we address governance matters.

81
Governance
Risk and Capital Management 82
Board of Directors 88
Introduction to the Directors’ Report by the Chairman 90
Approach to governance 91
How the Board operates 93
Directors’ share interests 96
Directors’ conflicts of interest 96
Board Committees 97
Attendance record 100
Auditors 100
Control environment and Group Internal Audit 100
Relations with shareholders and analysts 101
AGMs 103
Directors’ indemnities 103
Employment and gender diversity 103
Miscellaneous Directors’ Report matters 104
Disclosure of information to the auditors and governing law 105
Directors’ Remuneration Report 106

Old Mutual plcAnnual Report and Accounts 2013
82
RISK AND CAPITALMANAGEMENTOld Mutual has a well established and embedded risk and governance framework.
The risk and governance framework is set out in the Group Operating Model and is supported by economic capital tools and transparent processes for managing, monitoring and controlling risks. We will continue to refine structures and processes as necessary, but the overall governance structures are stable. These structures and processes, together with our strong balance sheet, provide a solid base to support our business as we continue to pursue our growth strategy over the next few years.
Investment in risk management and governance over the past few years has positioned the Group well to comply with the forthcoming regulatory requirements under Solvency II and the equivalent developments in South Africa, and Basel 3. We are confident that we are sufficiently capitalised on an economic capital basis to comply with the new requirements as currently proposed, although these are not yet finalised. With the delays in the starting date for Solvency II and the closer alignment in expected timing of the new South African regime, combined with changes to the Group’s risk profile as we have discontinued or are running-off certain higher capital risk businesses, we decided not to pursue the Group internal model regulatory pre-approval process at this stage. We continue to use our internal capital model for risk management purposes and maintain a good dialogue with both the UK and South African regulators in readiness for the other aspects of the new regimes.
Risk frameworks, governance and the Group’s internal capital model are overseen centrally but implemented by our businesses locally so that local requirements can be addressed appropriately. This is reinforced through senior Group executive representation on business unit regulatory boards, coupled with formal dual reporting for all key control functions. The Group structure has been simplified: with the exception of the Bermuda legacy business, all businesses are now grouped under five substantial business units, each of which cascade risk and governance requirements to their underlying operating segments in a manner which is consistent with the Group’s framework but adapted for local conditions.
Our risk strategy is inherent in our business strategy: to pursue risks within our core businesses of investment, savings, insurance and banking that we have the skills to manage and monitor and can adequately price. Within this overarching philosophy we seek to optimise capital efficiency, avoiding excessive risk concentrations and diversifying risk where possible. In this context we view risk concentration and diversification on a regional basis, looking separately at emerging markets (Africa, Latin America and Asia), the UK and Europe and the US. Each of the regions in which we operate and individual companies is sufficiently capitalised in its own right. The distribution and allocation of capital to our businesses in each region largely reflects the different risk profiles within those regions and the prevailing regulatory requirements. Even when applying significant economic stresses to our current capital, the Group remains adequately capitalised. We have also identified management actions that could be
Sue KeanSue KeanGroup Chief Risk OfficerGroup Chief Risk Officer

83
Governance
taken to remedy the Group’s capital or liquidity position in an extreme shock event where capital or liquidity levels may significantly breach our risk appetite limits for a sustained period.
We assess the Group’s risk profile through several different lenses, described later in this section. The medium-term risk strategy determined in 2010 was primarily influenced by the capital view of risk. Since then, our risk profile expressed in terms of capital has seen a reduction in market and credit spread risk, driven largely by the sale of US Life and the run-off of our business in Bermuda. Following disposals in the US and Nordic regions there has been an increase in the relative proportion of Group level foreign exchange risk, as a significant proportion of the business is now capitalised and run from South Africa. As our capital is largely located in the regions where our risks lie, the impact on the balance sheet is of the nature of an unrealised accounting translation risk. This impact is mostly relevant to the translation of rand earnings to sterling. The level of the rand is susceptible to changes in the level of foreign investment in South Africa and other factors affecting demand for the rand. This risk remains high given slowed economic growth globally, the current and capital account deficits South Africa is running, and uncertainty around how investors will continue to react as the US Federal Reserve further tapers its monetary stimulus programme. A substantial capital outflow could potentially trigger a decline in the rand, reducing our earnings as reported in sterling. We have modelled scenarios involving a severe rand drop and are comfortable that the Group has sufficient capital and liquidity headroom to withstand such events, if they were to occur.
During 2013 we moved into a period of growth, with a strong balance sheet position driven by our large and well-capitalised in-force insurance and banking businesses. As a result, earnings volatility and other business metrics now play an increasing role in the determination of our risk and business strategy. The Group’s risk profile has remained stable during 2013, with most risks increasing in line with business growth. We reviewed the medium-term risk strategy during the year, and while our underlying philosophy has remained unchanged, we have slightly increased our risk appetite for credit risk within emerging markets. Credit risk has a greater proportional impact on earnings at risk than it does on capital at risk.
We recognise that there could be a short-term increase in operational risk in the next few years whilst we execute the various strategic change initiatives. This increase has been accepted to reduce our longer term strategic risk, but continues to be closely monitored and managed. During 2013 we acquired stakes in businesses in Nigeria and Ghana and we are in the process of acquiring a distribution business in the UK, a stake in a micro-lending business in Kenya, and a stake in a bank in Mozambique. These businesses are small compared with our large in-force insurance and banking businesses and do not yet have a significant impact on our risk profile with reference to capital. For monitoring purposes, other metrics such as earnings and operational risk are more prominent at this stage.
Business risk and market risk remains as our two most significant risks. While they have remained relatively stable over the year, they are influenced by the economies in the key regions where we operate and the impact on the consumer in those countries, notably in South Africa where we have our largest retail base. We have maintained strong focus on the customer during the year, with activity coordinated at Group level and implemented through local customer champions, and have adapted our operational stance and product features to reflect the changing customer needs. This has also put us in a good position to respond to increased conduct of business regulation in the UK and South Africa.
Liability risk diversifies well against our other risks and we continue to seek to increase the proportion of this risk where appropriate. Our liability risk exposure, however, has not increased proportionately during the year and remains small outside the South African businesses. Our business plans include a number of actions to increase this exposure, but only where it meets our risk and return requirements. Old Mutual Bermuda now represents less than 2% of our economic capital requirement, and is no longer one of our top five Group risks.
During 2013 we began to measure risk culture, considering governance and tone from the top, understanding of risk, attitude to risk, control functions, quality of management information and remuneration structures. We see this as an important addition to our suite of risk exposure measures and processes given the importance of a proactive risk and control culture.
The following pages give more details of our current risk profile (please refer to our Principal Risks and Uncertainties section in this Annual Report for our topical risks). Due to the complexity of the modelling process involved, the economic risk exposure data in this report are as at 30 June 2013.
Sue Kean,Group Chief Risk Officer
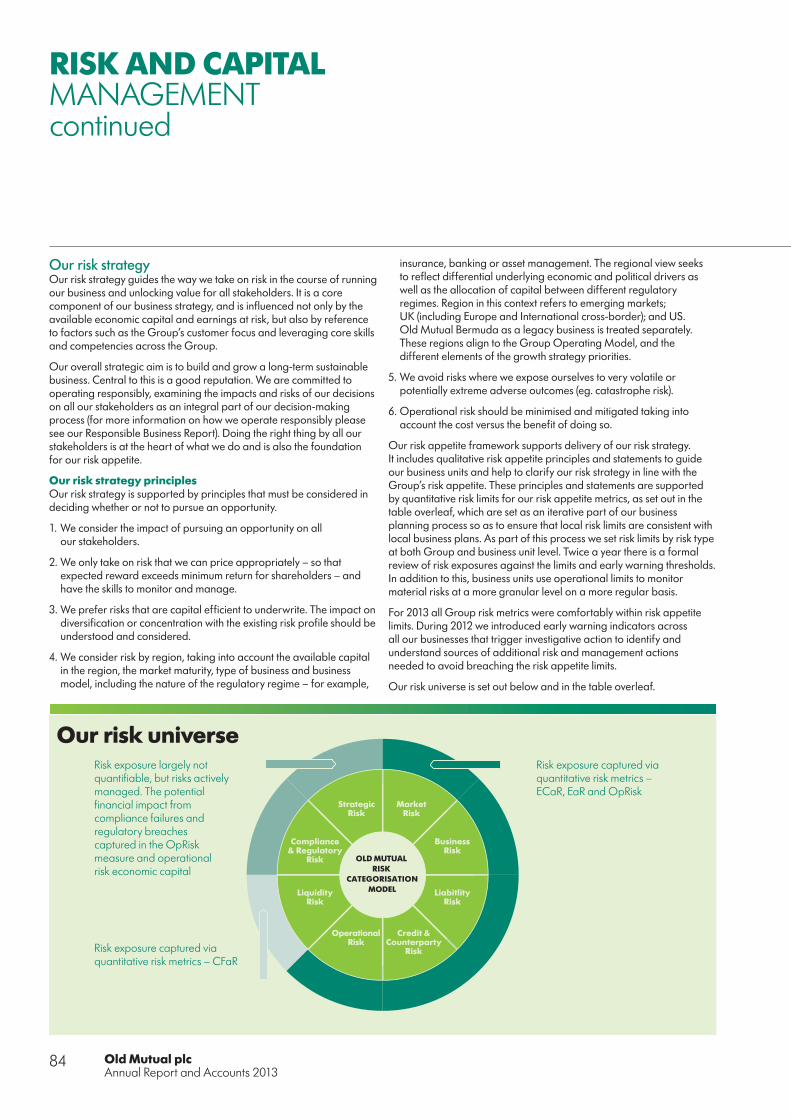
Old Mutual plcAnnual Report and Accounts 2013
84
RISK AND CAPITALMANAGEMENTcontinued
Our risk strategyOur risk strategy guides the way we take on risk in the course of running our business and unlocking value for all stakeholders. It is a core component of our business strategy, and is influenced not only by the available economic capital and earnings at risk, but also by reference to factors such as the Group’s customer focus and leveraging core skills and competencies across the Group.
Our overall strategic aim is to build and grow a long-term sustainable business. Central to this is a good reputation. We are committed to operating responsibly, examining the impacts and risks of our decisions on all our stakeholders as an integral part of our decision-making process (for more information on how we operate responsibly please see our Responsible Business Report). Doing the right thing by all our stakeholders is at the heart of what we do and is also the foundation for our risk appetite.
Our risk strategy principlesOur risk strategy is supported by principles that must be considered in deciding whether or not to pursue an opportunity.
1. We consider the impact of pursuing an opportunity on all our stakeholders.
2. We only take on risk that we can price appropriately – so that expected reward exceeds minimum return for shareholders – and have the skills to monitor and manage.
3. We prefer risks that are capital efficient to underwrite. The impact on diversification or concentration with the existing risk profile should be understood and considered.
4. We consider risk by region, taking into account the available capital in the region, the market maturity, type of business and business model, including the nature of the regulatory regime – for example,
insurance, banking or asset management. The regional view seeks to reflect differential underlying economic and political drivers as well as the allocation of capital between different regulatory regimes. Region in this context refers to emerging markets; UK (including Europe and International cross-border); and US. Old Mutual Bermuda as a legacy business is treated separately. These regions align to the Group Operating Model, and the different elements of the growth strategy priorities.
5. We avoid risks where we expose ourselves to very volatile or potentially extreme adverse outcomes (eg. catastrophe risk).
6. Operational risk should be minimised and mitigated taking into account the cost versus the benefit of doing so.
Our risk appetite framework supports delivery of our risk strategy. It includes qualitative risk appetite principles and statements to guide our business units and help to clarify our risk strategy in line with the Group’s risk appetite. These principles and statements are supported by quantitative risk limits for our risk appetite metrics, as set out in the table overleaf, which are set as an iterative part of our business planning process so as to ensure that local risk limits are consistent with local business plans. As part of this process we set risk limits by risk type at both Group and business unit level. Twice a year there is a formal review of risk exposures against the limits and early warning thresholds. In addition to this, business units use operational limits to monitor material risks at a more granular level on a more regular basis.
For 2013 all Group risk metrics were comfortably within risk appetite limits. During 2012 we introduced early warning indicators across all our businesses that trigger investigative action to identify and understand sources of additional risk and management actions needed to avoid breaching the risk appetite limits.
Our risk universe is set out below and in the table overleaf.
OLD MUTUAL RISK
CATEGORISATION MODEL
Market Risk
Business Risk
Liabitlity Risk
Credit & Counterparty
Risk
Operational Risk
Liquidity Risk
Compliance & Regulatory
Risk
Strategic Risk
Risk exposure captured via quantitative risk metrics – ECaR, EaR and OpRisk
Risk exposure largely not quantifiable, but risks actively managed. The potential financial impact from compliance failures and regulatory breaches captured in the OpRisk measure and operational risk economic capital
Risk exposure captured via quantitative risk metrics – CFaR
Our risk universe

85
Governance
Risk Risk description
Liability risk We assume liability risk by issuing insurance contracts under which we agree to compensate the policyholder or beneficiary if a specified uncertain future event affecting the policyholder occurs. This risk includes mortality and morbidity risk, as well as non-life risk from events such as fire or accident.
Market risk Market risk is the risk of a financial impact arising from the changes in values of financial assets or financial liabilities from changes in equity, bond and property prices, interest rates and foreign exchange rates. We separately consider currency translation risk, which relates to the translation of earnings and capital to our reporting currency.
Credit and counterparty risk This relates to the risk of credit defaults. It includes lending risk, where a borrower becomes unable to repay outstanding balances (for instance banking credit risk), as well as counterparty risk where an asset is not repaid in accordance with the terms of the contract. The risk of credit spreads changing is included under market risk.
Business risk The risk that business performance will be below projections as a result of negative variances in new business volumes and margins, and lapse, rebate and expense experience.
Liquidity risk The risk that liquid assets may not be available to pay obligations at a reasonable cost, when due.
Operational risk The risk arising from operational activities, for example a failure of a major systems, or losses incurred as a consequence of people and/or process failures, including external events.
Compliance and regulatory risk The risk that laws and regulations will be breached. Including risk of regulatory intervention resulting in sanctions being imposed or a temporary restriction on the business’ ability to operate and/or an additional regulatory capital charge. It also includes failure to adapt to regulatory change and business conduct risk.
Strategic risk The risk of failing to implement the business strategy and the management of associated changes to the business.
Measure Severity Explanation
Earnings at Risk (EaR) 1 in 10 The reduction in pre-tax IFRS adjusted operating profit (AOP) over a one-year forward-looking time horizon that should only be exceeded once in 10 years (90% confidence level).
EaR is an indicator of potential earnings volatility (shareholder measure).
Economic Capital at Risk (ECaR) 7 in 10,000 (1 in 200 from 2014 onwards)
The reduction in post-tax economic value (broadly defined as a market value balance sheet basis for insurance entities and IFRS equity for other companies) over a one-year forward-looking time horizon that should only be exceeded seven times in 10,000 years (99.93% confidence level that the event will not occur). During 2013, the confidence level for our internal measure was reviewed, and from 2014 onwards we will calculate our ECaR using a 1 in 200 year severity, which is more closely aligned to the emerging regulatory capital standard.
ECaR helps us to optimise risk-based decisions. The stress tests underlying ECaR allow us to monitor our exposures and deepen our understanding of where the business could further improve its capital allocation.
ECaR is similar to the ‘solvency capital requirement’ measure in Solvency II and has been calculated and used within the Group for more than five years.
It provides an internal view of required capital and risk profile (ie. relative risk exposures and directional interactions) to support strategy. The methodology allows for diversification both between different risks within entities and across sectors and territories.
Cash Flow at Risk (CFaR) 1 in 10 The reduction in the cash portion of earnings over a one-year forward-looking time horizon that should only be exceeded once in 10 years (90% confidence level).
Operational risk (OpRisk) 1 in 10 The reduction in pre-tax economic value due to once in 10 years unexpected operational loss events (90% confidence level).
* During 2014 a risk culture metric will be included
Our risk universe – risk descriptions
Risk appetite metrics

Old Mutual plcAnnual Report and Accounts 2013
86
RISK AND CAPITALMANAGEMENTcontinued
Risk profile of the Old Mutual Group by regionOld Mutual currently assesses and reports regulatory capital adequacy under the EU’s Financial Groups Directive (FGD). We have deferred our planned transition to managing regulatory capital adequacy on a Solvency II basis in line with the delayed implementation of the Solvency II schedule. Our FGD coverage ratio at December 2013 is comfortably above our target. For more information on our current FGD position, please refer to the Key Performance Indicators section in this Annual Report.
The Group’s risk profile is based on standalone economic capital at risk: the relative contribution of each risk is determined before allowing for the impact of diversification between risks.
The pie charts below set out our risk profile by region, with an indication of the relevant proportion of risk exposure in economic capital terms. The regional view is broadly aligned with our four strategic growth regions, with Africa, Latin America and Asia included within the profile of our South African businesses. Old Mutual Bermuda is included in the overall Group profile, but not shown separately in the regional view as this business is now in run-off and represents a relatively small proportion of our Group economic capital.
The risk profile in South Africa is well diversified, reflecting the diverse nature of our business in this region across life insurance, property and casualty and banking. This profile has remained largely stable over the year, with a slight increase in liability risk within Emerging Markets due to a strengthening in the basis for assessing longevity risk.
In Old Mutual Wealth, we are mainly exposed to market and business risk. The market risk arises primarily from asset-based fee risk, and the business risk is driven largely by expenses, mass lapse and rebate risk. The operational risk exposure increased during the year, reflecting the accepted short-term increase from delivery of significant change initiatives over the next two to three years, as well as refinement of the methodology for assessing the operational risk.
Risk exposures in the US region are concentrated in asset-based fee risk, which is part of market risk, and operational risk. This is reflective of the asset management nature of the business.
Movements in asset markets affect the fund-related management fees we earn from client portfolios. In our asset management businesses this was previously classified as business risk, but we have now reclassified it as market risk for consistency with the classification in our insurance businesses. The impact on our overall Group risk profile and South Africa risk profile is negligible, but for US Asset Management it results in all business risk being reclassified as market risk.
43%57%
6%
42%
4%
17%
5%
26%
28%
26%
6%
22%
15%
3%
Market
Credit and counterparty
Business
Liability
Operational
Currency translation
Old Mutual Wealth Emerging Markets, Nedbank and Property & CasualtyUS Asset Management
2%28%
68%
* The risk profile of the Group is based on standalone economic capital at risk, ie. the relative contribution of each risk is determined before allowing for the impact of diversification between risks, as at 30 June 2013
* Note that the South African businesses includes our exposure to Africa, Latin America and Asia
* Note the above excludes Old Mutual Bermuda which provides the remaining 2% of economic capital

87
Governance
The Group’s current overall risk profile is set out below. This allows for additional risks at Group level not included in the pie charts overleaf, most notably currency translation risk due to our significant surplus assets in South Africa.
Currency translation risk represents almost a quarter of our Group risk profile. This risk relates mainly to the translation of surplus capital from rand to pound and is a structural feature of our Group. As our capital is held where our risks are, the risk would only be realised if we were to require transfer of surplus capital between regions during periods of stress.
We will continue to enhance our economic capital and stress and scenario testing framework, and further embed these within our business during 2014.
Risk cultureCulture and values alignment across the Group is embedded through our Code of Conduct and our ACT NOW! Leadership Behaviours. The level of embedding and alignment across the Group is measured and monitored through our performance management system and annual group-wide culture survey.
Risk and control culture, which is a subset of the broader business culture, relates to how behaviours and judgements support a strong risk governance framework. During 2013 we began an initial approach to assess, measure and monitor risk culture. This involved a top-down assessment by the Group control functions, based on a series of 50 indicators covering a range of areas such as effectiveness of risk management, quality of management information, escalations, controls, tone from the top, governance and remuneration incentives. The framework has provided a basis for discussions with business unit executives on areas for future focus and improvement. The top-down analysis will be supplemented with a bottom-up assessment that will be included in our annual culture survey from 2014 onwards. We have also included a risk metric and risk appetite for risk culture in our risk management framework.
Risk culture and conduct is also receiving increased focus from a supervisory perspective and our focus on customer culture and values places us in a good position to respond to these developments.
The Group’s current topical risksThe table in the Principal Risks and Uncertainties section summarises the Group’s top five topical risks. Our top risk assessment considers the likelihood and severity of risks, where the severity assessment considers the financial, reputational, regulatory, people and legal impact of a risk.
These risks are closely monitored and overseen by Group, which gives regular updates to the Board and Executive Risk Committees. Our business is also impacted by a number of inherent risks – such as the exposure to market levels, which drives a significant proportion of our capital requirement. Although market risk is material, a large portion is from the inherent risk within our product offering, as we are exposed to the impact of the market movements on asset-based fees generated from client-selected investment.
11%
24%
14%
9%
22% 20%
Market
Credit and counterparty
Business
Liability
Operational
Currency translation
The Group’s risk profile is based on standalone economic capital at risk: ie. the relative contribution of each risk is determined before allowing for the impact of diversification between risks, as at 30 June 2013
OMG
100%

Old Mutual plcAnnual Report and Accounts 2013
88
BOARD OF DIRECTORS1 2 3 4 5 6
1. Patrick O’Sullivan (64) (Irish) M.Sc. (Econ), B.B.S., F.C.A. (Ireland) Chairman of the Board since January 2010. Also chairs the Nomination Committee
Prior relevant experienceVice Chairman of Zurich Financial Services from 2007 – 2009, where he had specific responsibility for its international businesses including those in South Africa. Prior to that, he had been CFO of the ZFS Group and CEO, General Insurance and Banking, of its UKISA division. He has also held positions at Bank of America, Goldman Sachs, Financial Guaranty Insurance Company (a subsidiary of GE Capital), Barclays/BZW and Eagle Star Insurance Company.
External positions heldChairman of the Shareholder Executive in the UK, Deputy Governor of the Bank of Ireland and Chairman of Equity Syndicate Management at Lloyd’s.
2. Julian Roberts (56) (British) B.A., F.C.A., M.C.T. Group Chief Executive
Please see details of the Group Executive Committee on pages 36-37 of this Report for further information.
3. Philip Broadley (53) (British) M.A., F.C.A. Group Finance Director
Please see details of the Group Executive Committee on pages 36-37 of this Report for further information.
6. Alan Gillespie (63) (British) CBE, B.A. Hons, M.A., Ph.D. Senior Independent Director since May 2011, having joined the Board as an independent non-executive director in November 2010. Also Chairman of the Remuneration Committee and a member of the Nomination Committee
Prior relevant experiencePartner at Goldman Sachs from 1990, with responsibility for corporate finance and mergers and acquisitions in the UK and Ireland. He jointly led the firm’s financial services practice in Europe and in 1996 established Goldman Sachs’ presence in South Africa. After retiring from Goldman Sachs in 1999, he became Chief Executive of the Commonwealth Development Corporation in the UK. From 2001 – 2008 he was Chairman of Ulster Bank, a subsidiary of Royal Bank of Scotland plc.
External positions heldSenior Independent Director of United Business Media plc and Chairman of the Economic & Social Research Council.
7. Danuta Gray (55) (British) B.Sc., M.B.A. Independent non-executive director since March 2013. Also a member of the Group Audit, Nomination and Remuneration Committees
Prior relevant experienceChairman of Telefónica O2 in Ireland until December 2012, having previously been its Chief Executive from 2001 – 2010, and she remains a member of the Advisory Board of Wayra, which is a part of Telefónica involved in new ventures. Prior to that, she was a Senior Vice President for BT Europe in Germany, where she gained experience in sales, marketing, customer service and technology and in leading and changing large businesses. She previously served for seven years on the board of Irish Life and Permanent plc and was also a director of Business in the Community.
External positions heldNon-executive director of Michael Page International plc and of Paddy Power PLC.
4. Mike Arnold (66) (British) B.Sc., F.I.A. Independent non-executive director since September 2009. Chairman of the Board Risk Committee and a member of the Group Audit Committee
Prior relevant experiencePrincipal Consulting Actuary and Head of Life practice at the consulting actuarial firm Milliman from 2002 – 2009. Prior to that, he had been the senior partner at the practice from 1995. He is a past Member of Council and Vice Chairman of the Institute of Actuaries, past Chairman of the International Association of Consulting Actuaries and past member of the Board of Actuarial Standards.
External positions heldNon-executive director of Financial Information Technology Limited and of Scottish Equitable Policyholders Trust Limited.
5. Zoe Cruz (59) (US) B.A, M.B.A. Independent non-executive director since January 2014. Also a member of the Board Risk and Remuneration Committees
Prior relevant experienceCo-President for Institutional Securities and Wealth Management at Morgan Stanley from 2005 – 2007, where she was responsible for running major revenue-generating businesses, including overseeing their securities risk management and information technology. From 2009 – 2012, she was involved in founding and running her own investment management firm, Voras Capital Management. Prior to becoming Co-President of Morgan Stanley, she had been its Global Head of Fixed Income, Commodities and Foreign Exchange from 2001 until 2005. She joined Morgan Stanley in 1982 and was the third founding member of the foreign exchange group.
External positions heldNone.

89
Governance
7 8 9 10 11 12
8. Adiba Ighodaro (50) (British)LL.B., ACCA Independent non-executive director since January 2014. Also a member of the Group Audit Committee
Prior relevant experienceJoined the Commonwealth Development Corporation (CDC) in 1991, first in London, and later in Lagos, with a remit to establish CDC’s Nigerian business. In 1995, her focus moved to the Caribbean as a Senior Investment Executive and Investment Manager, helping to obtain investment for and dispose of some of CDC’s interests in Africa and the Caribbean. Later she became CDC’s Country Manager for Nigeria. She also became Head of West Africa, with responsibility for building the investment business of Actis across the region. Actis was spun out of CDC in 2004, resulting in her role changing primarily to raising capital for Actis’s private equity energy and real estate funds (which have $5 billion of funds under management).
External positions heldPartner with Actis.
9. Reuel Khoza (64) (South African) Eng. D., M.A., LL.D. (h.c.) Non-executive director of the Company since January 2006 and Chairman of Nedbank Group since May 2006. Also a member of the Board Risk and Nomination Committees
Prior relevant experienceHis previous appointments include Chairmanships of Eskom Holdings Limited and Glaxo Wellcome SA and non-executive directorships of IBM SA, Vodacom, the JSE, JCI, Standard Bank Group and Liberty Life.
External positions heldChairman of Aka Capital, which is 25% owned by Old Mutual (South Africa). Non-executive director of Nampak Limited, Protea Hospitality Holdings Limited and Corobrik (Pty) Limited. Fellow and President of the Institute of Directors of South Africa.
10. Roger Marshall (65) (British) B.Sc. (Econ.), F.C.A. Independent non-executive director of the Company and Chairman of the Group Audit Committee since August 2010. Also a member of the Board Risk and Remuneration Committees
Prior relevant experienceFormer audit partner in PricewaterhouseCoopers, where he led the audit of a number of major groups, including Zurich Financial Services and Lloyds TSB.
External positions heldChairman of the Accounting Council, a Director of the Financial Reporting Council and a non-executive director of Genworth Financial’s European insurance companies.
11. Nkosana Moyo (62) (Zimbabwean) Ph.D., M.B.A. Independent non-executive director since September 2013. Also a member of the Group Audit and Remuneration Committees
Prior relevant experienceFounder and Executive Chairman of the Mandela Institute for Development Studies (MINDS). Vice President and Chief Operating Officer of the African Development Bank from 2009 – 2011. From 2004 – 2009 Managing Partner for the African Business of Actis Capital LLP. with responsibility for its African businesses. Associate Director of the International Finance Corporation of the World Bank, with responsibility for all SME operations in Africa, from 2001 – 2004. During 2000, he served as Minister of Industry and International Trade in the Cabinet of the Zimbabwean Government. He worked for Standard Chartered Bank from 1990 – 1995 as Managing Director of Standard Chartered Bank (Zimbabwe), and later as African Regional Head for Corporate Banking, based in London, with responsibility for operations in 14 African countries.
External positions heldMember of the boards of the Investment Climate Facility (ICF) and of the Africa Leadership Institute.
12. Nku Nyembezi-Heita (53) (South African) B.Sc., M.Sc., M.B.A. Independent non-executive director of the Company since March 2012. Also a member of the Board Risk and Nomination Committees
Prior relevant experienceNon-executive director of Old Mutual Life Assurance Company (South Africa) Limited from 2010 – 2012, a position she relinquished upon taking up her role at plc level. Former Chief Officer of Mergers & Acquisitions for the Vodacom Group and Chief Executive Officer of Alliance Capital. Chief Executive Officer of ArcelorMittal South Africa from 2008 until February 2014.
External positions heldIndependent non-executive Chairman designate of the JSE Limited.
NOTE: Further details of the directors and the basis upon which they are recommended for election or re-election at the Company’s Annual General Meeting on 15 May 2014 are contained in the Explanatory Notes in the AGM circular, which is available on the Company’s website.

Old Mutual plcAnnual Report and Accounts 2013
90
DIRECTORS’ REPORT ONCORPORATE GOVERNANCEAND OTHER MATTERS
I am pleased to introduce our Directors’ Report on Corporate Governance and Other Matters, in which, among other things, we describe the Company’s compliance with the UK Corporate Governance Code, explain how the Board and its main standing committees have operated during the past year, and describe how effective stewardship is exercised over the Group’s activities in the interests of shareholders and other stakeholders.
BoardSince last year’s report, we have recruited three new independent non-executive directors to the Board, Nkosana Moyo, Zoe Cruz and Adiba Ighodaro. Zoe’s extensive experience of international financial markets and asset management will provide us with additional insight into these important areas of the Group’s business, while Nkosana’s and Adiba’s deep knowledge of investing and operating in various countries in Africa will widen the Board’s ability to evaluate opportunities as we pursue our strategy of expanding further into new territories in Africa.
With these appointments, we now have a Board which reflects substantial diversity in terms of skills, experience and geography, while also fulfilling our commitment to gender diversity two years earlier than our original target.
We were sorry to say goodbye to Bongani Nqwababa in January 2014, when he left the Board after taking up another prestigious non-executive directorship in South Africa. We are grateful to him for his contribution to the Group over the past seven years.
During 2013, the Board devoted a significant amount of time to discussion of future strategic options for the Group, both in Africa and elsewhere. This included holding a Board meeting in Lagos, where we had a welcome opportunity to interact with our newly acquired operations there and also to hear about the other exciting opportunities that exist in Nigeria and other parts of West Africa. This commitment by the Board to getting to know the Group’s new businesses in Africa was reinforced by a Board meeting in Nairobi in Kenya during January 2014. Two of our other Board meetings were held in South Africa during 2013, enabling the Board to hear first-hand from our South African businesses’ management teams and to meet some of the emerging local talent, which was one of the priorities that we set for ourselves following last year’s Board effectiveness review.
A fuller report on the activities of the Board is contained in the report that follows.
Annual General MeetingOur AGM will be held in London on 15 May 2014 and will be webcast via our website as in prior years. As usual, there will be an opportunity for shareholders to submit questions beforehand to be dealt with at the meeting. Our shareholder circular relating to the AGM includes further details of these matters.
We remain committed to ensuring that external expectations about governance of the Group remain fulfilled in an efficient and proper manner in the long-term interests of shareholders and others.
Patrick O’Sullivan Chairman
Patrick O’SullivanPatrick O’SullivanPatrick O’SullivanPatrick O’SullivanChairmanChairman
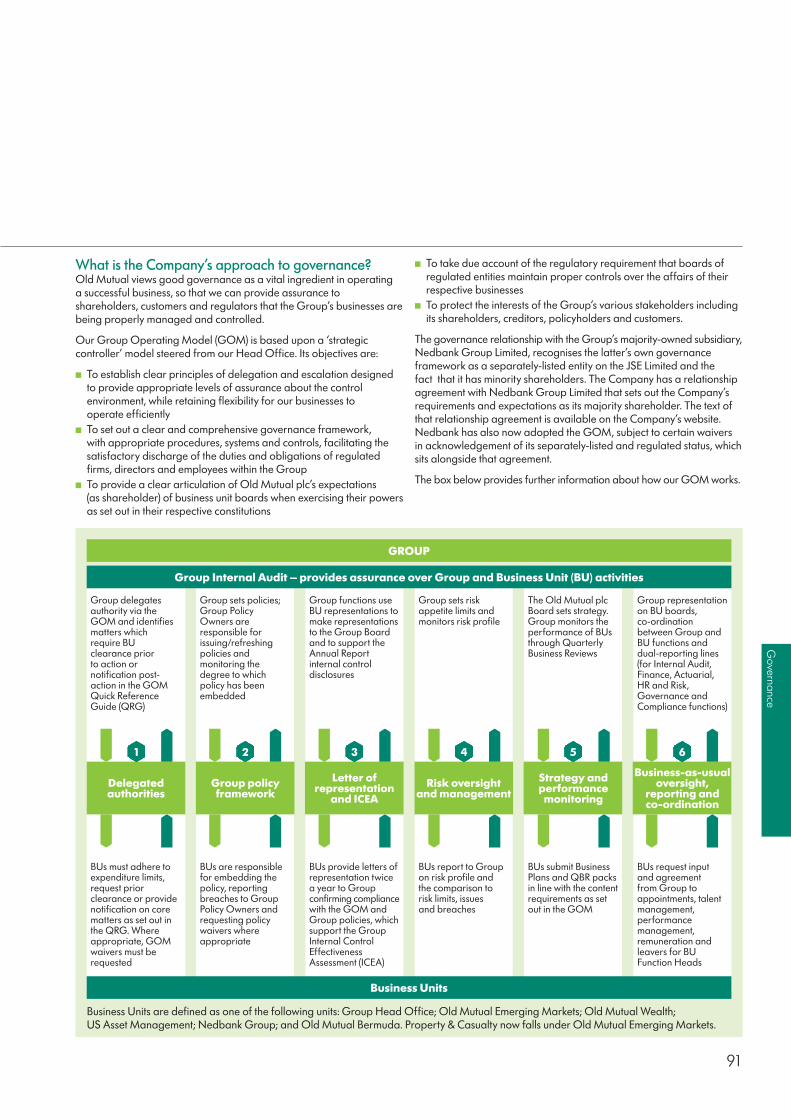
91
Governance
What is the Company’s approach to governance?Old Mutual views good governance as a vital ingredient in operating a successful business, so that we can provide assurance to shareholders, customers and regulators that the Group’s businesses are being properly managed and controlled.
Our Group Operating Model (GOM) is based upon a ‘strategic controller’ model steered from our Head Office. Its objectives are:
■ To establish clear principles of delegation and escalation designed to provide appropriate levels of assurance about the control environment, while retaining flexibility for our businesses to operate efficiently
■ To set out a clear and comprehensive governance framework, with appropriate procedures, systems and controls, facilitating the satisfactory discharge of the duties and obligations of regulated firms, directors and employees within the Group
■ To provide a clear articulation of Old Mutual plc’s expectations (as shareholder) of business unit boards when exercising their powers as set out in their respective constitutions
■ To take due account of the regulatory requirement that boards of regulated entities maintain proper controls over the affairs of their respective businesses
■ To protect the interests of the Group’s various stakeholders including its shareholders, creditors, policyholders and customers.
The governance relationship with the Group’s majority-owned subsidiary, Nedbank Group Limited, recognises the latter’s own governance framework as a separately-listed entity on the JSE Limited and the fact that it has minority shareholders. The Company has a relationship agreement with Nedbank Group Limited that sets out the Company’s requirements and expectations as its majority shareholder. The text of that relationship agreement is available on the Company’s website. Nedbank has also now adopted the GOM, subject to certain waivers in acknowledgement of its separately-listed and regulated status, which sits alongside that agreement.
The box below provides further information about how our GOM works.
GROUP
Group delegates authority via the GOM and identifies matters which require BU clearance prior to action or notification post- action in the GOM Quick Reference Guide (QRG)
Group representation on BU boards, co-ordination between Group and BU functions and dual-reporting lines (for Internal Audit, Finance, Actuarial, HR and Risk, Governance and Compliance functions)
Group sets risk appetite limits and monitors risk profile
The Old Mutual plc Board sets strategy. Group monitors the performance of BUs through Quarterly Business Reviews
Group functions use BU representations to make representations to the Group Board and to support the Annual Report internal control disclosures
Group sets policies; Group Policy Owners are responsible for issuing/refreshing policies and monitoring the degree to which policy has been embedded
Group Internal Audit – provides assurance over Group and Business Unit (BU) activities
BUs must adhere to expenditure limits, request prior clearance or provide notification on core matters as set out in the QRG. Where appropriate, GOM waivers must be requested
BUs request input and agreement from Group to appointments, talent management, performance management, remuneration and leavers for BU Function Heads
BUs report to Group on risk profile and the comparison to risk limits, issues and breaches
BUs submit Business Plans and QBR packs in line with the content requirements as set out in the GOM
BUs provide letters of representation twice a year to Group confirming compliance with the GOM and Group policies, which support the Group Internal Control Effectiveness Assessment (ICEA)
BUs are responsible for embedding the policy, reporting breaches to Group Policy Owners and requesting policy waivers where appropriate
Business Units
Business Units are defined as one of the following units: Group Head Office; Old Mutual Emerging Markets; Old Mutual Wealth; US Asset Management; Nedbank Group; and Old Mutual Bermuda. Property & Casualty now falls under Old Mutual Emerging Markets.
1
Delegatedauthorities
2
Group policyframework
3
Letter ofrepresentation
and ICEA
4
Risk oversight and management
5
Strategy andperformancemonitoring
6
Business-as-usualoversight,
reporting andco-ordination

Old Mutual plcAnnual Report and Accounts 2013
92
As the Company’s primary listing (now known in the UK as a premium listing) is on the London Stock Exchange, this report mainly addresses the matters covered by the UK Corporate Governance Code, but the Company also has regard to governance expectations in other territories where its shares are listed. The Group’s major South African public subsidiary companies are subject to applicable local governance expectations, including those contained in King III and, in the case of Nedbank Group Limited, the Listings Requirements of the JSE Limited.
Throughout the year ended 31 December 2013 and in the preparation of this Annual Report and these Accounts, the Company has complied with the main and supporting principles and provisions set out in the UK Corporate Governance Code as described in the following sections of this report. The Company’s compliance with UK Corporate Governance Code provisions and the statement relating to the going concern basis adopted in preparing the financial statements set out at the end of this section of this report, have been reviewed by the Company’s auditors, KPMG Audit Plc, in accordance with guidance published by the UK Auditing Practices Board.
Who serves on the Board and how does it operate?Old Mutual’s Board currently has 12 members, two of whom are executive and 10 of whom (including the Chairman) are non-executive. The following changes to the Board’s non-executive membership have taken place since the start of 2013:
■ Eva Castillo resigned as a director on 28 February 2013 ■ Danuta Gray joined the Board on 1 March 2013 ■ Russell Edey and Lars Otterbeck retired from the Board at the end of the AGM on 9 May 2013
■ Nkosana Moyo joined the Board on 1 September 2013 ■ Zoe Cruz and Adiba Ighodaro joined the Board and Bongani Nqwababa resigned as a director on 6 January 2014.
The table below sets out the Board’s continuing membership in more detail.
RoleName and nationality
Date of original appointment to the
Board
Date current
term endsCurrent
term as director
Non-executive director Reuel Khoza (SA) Jan 2006 Jan 2015 3rd (3rd year)Non-executive director Mike Arnold (UK) Sept 2009 Sept 2015 2ndChairman Patrick O’Sullivan (Irish) Jan 2010 Jan 2016 2ndNon-executive director Roger Marshall (UK) Aug 2010 Aug 2016 2ndSenior Independent Director Alan Gillespie (UK) Nov 2010 Nov 2016 2ndNon-executive director Nku Nyembezi-Heita (SA) March 2012 March 2015 1stNon-executive director Danuta Gray (UK) March 2013 March 2016 1stNon-executive director Nkosana Moyo (Zim) Sept 2013 Sept 2016 1stNon-executive director Zoe Cruz (US) Jan 2014 Jan 2017 1stNon-executive director Adiba Ighodaro (UK) Jan 2014 Jan 2017 1stGroup Chief Executive Julian Roberts (UK) Aug 2000Group Finance Director Philip Broadley (UK) Nov 2008
The Company announced on 13 December 2013 that Philip Broadley intended to step down as Group Finance Director during 2014. He has agreed to remain in his position until a suitable successor has been appointed. Although this may be after this year’s AGM, he will not stand for re-election at the AGM in light of his planned departure.
Various changes have been made to Board Committee memberships following the annual review of the composition of the Committees and in light of the recent changes to the Board described above. As a consequence, the memberships of the Board’s main standing Committees (further details of which are set out later in this report and in the Directors’ Remuneration Report) are now as follows:
Board Risk Committee: Mike Arnold (Chairman) Zoe Cruz Reuel Khoza Roger Marshall Nku Nyembezi-Heita
Group Audit Committee: Roger Marshall (Chairman) Mike Arnold Danuta Gray Adiba Ighodaro Nkosana Moyo
Nomination Committee: Patrick O’Sullivan (Chairman) Alan Gillespie Danuta Gray Reuel Khoza Nku Nyembezi-Heita Julian Roberts
Remuneration Committee: Alan Gillespie (Chairman) Zoe Cruz Danuta Gray Roger Marshall Nkosana Moyo
It has also been agreed that, after the 2014 AGM, Danuta Gray will step down from the Group Audit Committee and will succeed Alan Gillespie as Chairman of the Remuneration Committee. Mr Gillespie will still remain a member of that committee after ceasing to be its Chairman.
DIRECTORS’ REPORT ONCORPORATE GOVERNANCEAND OTHER MATTERS continued

93
Governance
What is the Board’s role and how does it operate?The Board’s role is to exercise stewardship of the Company within a framework of prudent and effective controls that enables risk to be assessed and managed. The Board sets the Company’s strategic aims, reviews whether the necessary financial and human resources are in place for it to meet its objectives and monitors management performance. It is kept informed about major developments affecting the Group through the Group Chief Executive’s and Group Finance’s monthly reports and holds regular strategy sessions at which high-level strategic matters are discussed. The GOM sets out matters that are specifically reserved for Board decision and protocols that govern escalation of issues to it and delegation of powers from it in a manner that is designed to ensure clarity about where responsibility for decision-making lies.
In accordance with the GOM, the Board has delegated its executive powers to the Group Chief Executive, with power to sub-delegate, and also to the Approvals Committee. In his co-ordination and stewardship of the Group, the Group Chief Executive is advised by the Group Executive Committee, a consultative management committee, whose current members are described elsewhere in this Annual Report. The Board has also delegated specific responsibilities for certain matters to Board committees. The principal Board committees have responsibility for Nomination, Remuneration, Group Audit and Board Risk matters, in line with their respective terms of reference. The Board receives reports from these committees on the subjects that they have covered. The matters addressed by the principal Board committees in 2013 are outlined under the heading “What are the standing Board Committees and how have they operated during the year?“ below and, for the Remuneration Committee, in the Directors’ Remuneration Report.
While the Board currently includes only two executive directors, all members of the Board have regular contact with the other senior executive management (including the most senior executives of the main business units of the Group) through their periodic participation in Board meetings, other briefing sessions by the senior executives, and Board visits to the locations where the Group’s main businesses are based. Paul Hanratty, the Group Operating Officer, is now a standing invitee to all Board meetings. The Board also receives minutes of the proceedings of the Group Executive Committee, which help to keep it informed about the discussions that are taking place between the Group Chief Executive and the heads of the Group’s main businesses and of Group central functions such as Risk, Strategy, Customer matters and Human Resources.
The executive element of the Board is balanced by an independent group of non-executive directors. The Board as a whole approves the strategic direction of the Group, scrutinises the performance of management in meeting agreed goals and objectives, and monitors the reporting of performance. Procedures are in place to enable Board members to satisfy themselves about the integrity of the Group’s financial information and to ensure that financial controls and systems of risk management are robust and sustainable. Non-executive directors on the Remuneration Committee are responsible for determining appropriate levels of remuneration for the executive directors, other members of the Group Executive Committee and certain other senior employees. Members of the Nomination Committee have a primary role in recommending the appointment and, where necessary, removal of executive directors.
Separately from the formal Board meeting schedule, the Chairman holds meetings with the other non-executive directors, without any executives being present, to provide a forum for any issues to be raised. He also conducts an annual one-to-one performance evaluation of each of the other non-executive directors, with any resulting action points being reported to the Nomination Committee.
Informal meetings among the non-executive directors, without the Chairman or any executive being present, are also facilitated by the Company. Among the activities carried out at such meetings is the annual review of the Chairman’s own performance under the aegis of the Senior Independent Director, who also obtains such input as he considers appropriate from the executive directors.
The assignment of responsibilities between the Chairman, Patrick O’Sullivan, and the Group Chief Executive, Julian Roberts, is documented so as to ensure that there is a clear division between the running of the Board and executive responsibility for running the Company’s business. The responsibilities of Patrick O’Sullivan as Chairman include leadership of the Board, ensuring its effectiveness in all aspects of its role and setting its agenda; ensuring that adequate time is available for discussion of all agenda items (in particular strategic issues), ensuring that the directors receive accurate, timely and clear information; ensuring effective communication with shareholders; promoting a culture of openness and debate by facilitating the effective contribution to the Board of non-executive directors in particular; and ensuring constructive relationships between the executive and non-executive directors.
In the absence of exceptional circumstances, non-executive directors (including the Chairman) serve a maximum of nine years in office. This maximum period of tenure operates on the basis of two three-year terms, followed by up to three further one-year terms. The renewal of non-executive directors’ engagements for successive terms is not automatic and the continued suitability of each non-executive director is assessed by the Nomination Committee before renewal of their appointment takes place.
What did the Board do during 2013?The Chairman’s introduction to this section describes some of the main matters that were addressed by the Board during the year. In addition to those and the regular updates on the Group’s results, the Group Chief Executive’s report on recent significant developments and major projects around the Group, and reports from Board committee chairmen, the following table sets out some more details of the Board’s other activities at its scheduled meetings during 2013.

Old Mutual plcAnnual Report and Accounts 2013
94
Date of meeting Location Principal topics covered
January 2013 OMSA’s and Nedbank’s offices in Sandton, Johannesburg
■ Presentation on strategy, including plans for the Group’s South African businesses to work more closely together
■ Presentation on the South African businesses’ compliance status with Black Economic Empowerment imperatives
■ Discussion on the unsecured lending environment in South Africa ■ Annual review and clearance of directors’ conflicts of interest ■ Feedback by the Senior Independent Director from the annual review of the Chairman ■ Presentation on the social responsibility activities of OMSA, including its Foundation, its Masisizane
Funds, its BEE trusts and other initiatives ■ Presentation by the Old Mutual Wealth team of the proposed outsourcing of various parts of its platform
infrastructure and on plans for its operations in continental Europe ■ Pre-year-end review of results and the Annual Report and Accounts for 2012 ■ Dinner with high potential employees from OMEM, Nedbank and Mutual & Federal.
February 2013 London ■ Update on strategic projects ■ Report on Group charitable expenditure ■ Review of the preliminary results for 2012 ■ Approval of the Annual Report and Accounts for 2012 ■ Recommendation of the final dividend for 2012 ■ Feedback from the 2012 Board effectiveness review.
May 2013 London ■ Approval of the Q1 Interim Management Statement ■ Feedback from the annual independent survey of investors’ views on the Group ■ Strategy update.
July 2013 Lagos, Nigeria ■ Presentation of the Group’s strategy for East and West Africa (see also the separate feature on this meeting below).
August 2013 London ■ Review of the interim results for 2013 ■ Presentations on various new potential strategic initiatives ■ Declaration of the interim dividend for 2013.
September 2013 London ■ Presentation on results of the Group’s culture survey for 2013 and Group values ■ Presentation on customer-centricity and the role of the Group Customer and Brand function ■ Update on various strategic initiatives ■ Approval for a proposed reduction in Group-level debt (executed during November).
November 2013 London and by telephone ■ Approval of the Q3 Interim Management Statement.
December 2013 OMSA’s and Nedbank’s offices in Cape Town
■ External presentation on progress made by South Africa during two decades of democracy ■ Presentations by OMSA, Old Mutual Investment Group. Nedbank and the Property & Casualty business
unit on their respective business and strategy plans for 2014 – 2016 ■ Review and approval of the draft Group business plan for 2014 – 2016 ■ Update on various strategic initiatives ■ Short briefings on financial education and customer engagement initiatives at OMEM and Nedbank,
including current advertising campaigns on television and radio; the joBerg2c mountain cycle event and Two Oceans Marathon sponsored by OMEM; the Nedbank Soccer Cup and Ke Yona team search; the Nedbank branch of the future; the 22/7 digital proposition; and Nedbank’s Social Media Listening Centre
■ Annual review of Board Committee memberships ■ Feedback from the Board’s participation in the Barrett Values Survey ■ Dinner with around 70 of the most senior executive management personnel from OMEM and the
Property & Casualty business unit.
DIRECTORS’ REPORT ONCORPORATE GOVERNANCEAND OTHER MATTERS continued

95
Governance
During the Board’s visit to Lagos in July 2013, the Board received presentations and participated in discussions on:
■ The macro-economic situation in Nigeria, as described by a local economist
■ Opportunities for the Group in the rest of Africa, particularly West and East Africa, as seen both from a Group strategy and local African perspective
■ Opportunities in Nigeria, as viewed by a leading international accountancy firm
■ Informal views about the country by a correspondent with the BBC who had returned to Nigeria after some years in the UK
■ Feedback by Sue Kean, the Chief Risk Officer, from a meeting she had with the Nigerian insurance regulator in Abuja.
On the evening of 2 July, the Board joined management of Old Mutual Nigeria at a social event attended by a large number of participants in the local financial services industry, which provided a very useful networking opportunity.
We were grateful to MTN, whose local Chairman and Group Executive team kindly met with two groups from the Board to provide an insight into the various challenges that their business had faced and overcome in establishing itself in Nigeria.
Commenting on the visit afterwards, Julian Roberts, Group Chief Executive, said: “Driving through Lagos, I was struck by the number of global consumer brands which have set up business there. This evidences an emerging middle class which is aspirational and has money to spend, and this group is the opportunity we want to capture in that market. I do believe it’s a great market for us to be in, although, clearly, it is going to take us quite a bit of time to build scale.”
How are people selected to join the Board?Plans for refreshing and renewing the Board’s composition are managed by the Nomination Committee so as to ensure that changes take place without undue disruption and that there is an appropriate balance of experience and length of service. This committee also considers, in making recommendations, the independence of candidates and their suitability and willingness to serve on other committees of the Board. The current Board composition is considered by the Nomination Committee to be suitable for the requirements of the Group’s business. However, such matters are kept under active review, having regard to scheduled retirements of non-executive directors and the Group’s future strategy. Further details are contained in the section of this report below dealing with the activities of the Nomination Committee during 2013.
The terms and conditions of engagement of each of the non-executive directors are available on the Company’s website. These include details of the expected time commitment involved (which each of the non-executive directors has accepted). Other significant commitments of potential appointees are considered by the Nomination Committee as part of the selection process and are disclosed to the Board when recommendation of an appointment is submitted. Non-executive directors are also required to inform the Board of any subsequent changes to such commitments, which must be pre-cleared with the Chairman if material.
Are the non-executive directors independent?Eight of the nine current non-executive directors other than the Chairman (Mike Arnold, Zoe Cruz, Alan Gillespie, Danuta Gray, Adiba Ighodaro, Roger Marshall, Nkosana Moyo and Nku Nyembezi-Heita) are considered by the Board to be independent within the criteria set out in the UK Corporate Governance Code, ie. they are independent in character and judgement and have no relationships or circumstances which are likely to affect, or could appear to affect, their judgement. The other non-executive director, Reuel Khoza, is not considered independent because of his chairmanship of the Group’s majority-owned subsidiary, Nedbank Group Limited, and the business relationships between Aka Capital, in which he owns a stake, and Nedbank.
Who is your Senior Independent Director?Alan Gillespie has been the Senior Independent Director since May 2011. The Senior Independent Director is available to shareholders if they have concerns that are unresolved after contact through the normal channels of the Chairman, Group Chief Executive or Group Finance Director or where such contact would not be appropriate. The Senior Independent Director’s contact details can be obtained from the Group Company Secretary: [email protected].
How is performance of the Board and its committees reviewed?A review of the performance of the Board (including its standing committees) is conducted on an annual basis. These reviews are now carried out by an external expert at least every three years in line with the UK Corporate Governance Code. The review is designed to address the balance of skills, experience, independence and knowledge of the Group’s businesses on the Board and its committees, the Board’s diversity (including gender), how the Board and its committees work together as a unit, and other factors relevant to their effectiveness.
The last externally-facilitated review took place through IDDAS in 2011. The review for 2013 was conducted through an online questionnaire whose contents were co-ordinated with the two previous years’ results so as to track progress against these; this was also supplemented by a series of thorough one-to-one interviews with each member of the Board carried out by the Group HR Director. The results were collated and reported back to a session of the Nomination Committee (which all other members of the Board also attended) at the end of January 2014. The Board Risk Committee also conducted a separate internally-facilitated review of its effectiveness during the year to evaluate its effectiveness as a relatively newly established committee.
The reviews concluded that:
■ The Board and its committees had operated satisfactorily during the year, with a generally appropriate mix of skills represented on each of them and good levels of information and discussion, well led by their respective chairmen
■ More time should be spent during 2014 on talent management and succession planning. Efforts should also be made to get to know subsidiary boards and committees better. Available Board and committee time should be marshalled in such a way as to make best use of it, and the Chairman should provide more detailed guidance on the Company’s expectations of non-executive directors outside Board meetings

Old Mutual plcAnnual Report and Accounts 2013
96
■ The separate review conducted by the Board Risk Committee concluded that additional tailored training was desirable in order to improve the engagement and contribution of all committee members.
Who will be standing for re-election at this year’s AGM?All of the continuing directors (except for Philip Broadley, who will be retiring from the Board as Group Finance Director during 2014) will stand for election or re-election at the 2014 AGM. The Board recommends that they each be elected or re-elected as directors at the AGM. Biographical details of all of the directors are contained in the Board of Directors section of this Annual Report and further details of the basis upon which the Board has assessed the performance, and recommends the election or re-election of the directors concerned are set out in the explanatory notes in the AGM circular.
Are directors required to hold shares in the Company and what are their current interests?The Remuneration Committee has established guidelines on shareholdings by executive directors of the Company. Under these, the Group Chief Executive is expected to build up a holding of shares in the Company equal in value to at least 200% of his annual base salary within five years of appointment; the equivalent figure for other executive directors is 150% of their annual base salary. Both Julian Roberts and Philip Broadley are currently fully compliant with these guidelines. The Board has considered whether to adopt a shareholding requirement for non-executive directors, but does not consider this to be appropriate.
Details of the directors’ interests (including interests of their connected persons) in the share capital of the Company and its quoted subsidiary, Nedbank Group Limited, at the beginning and end of the year under review are set out in the following tables, while their interests in share options and forfeitable shares awards are described in the section of the Directors’ Remuneration Report entitled ‘Directors’ shareholdings and share interests’. There have been no changes to any of the interests in the first table below between 31 December 2013 and 28 February 2014.
At 31 December 2013
Old Mutual plc Number
of ordinary shares of 113 ⁄7p
each
Nedbank Group Limited
Number of shares
Mike Arnold 11,134 –Philip Broadley 513,4341 –Alan Gillespie – –Danuta Gray – –Reuel Khoza – 14,774Roger Marshall 45,000 –Nkosana Moyo 10,000 –Nku Nyembezi-Heita – –Patrick O’Sullivan 91,319 –Julian Roberts 1,965,3971 –
Former director Bongani Nqwababa (resigned 6 January 2014) – –
Neither Zoe Cruz nor Adiba Ighodaro (who were appointed to the Board on 6 January 2014) had any interests in the Company’s or its listed subsidiaries’ shares at their date of appointment.
At 31 December 2012 (or date of appointment if later)
Old Mutual plcNumber of
ordinary shares of 113 ⁄7p each
Nedbank Group Limited
Number of shares
Mike Arnold 11,134 –Philip Broadley 513,4341 –Alan Gillespie – –Danuta Gray (appointed from 1 March 2013) – –Reuel Khoza – 14,774Roger Marshall 45,000 –Nkosana Moyo (appointed from 1 September 2013) 10,000 –Nku Nyembezi-Heita – –Patrick O’Sullivan 91,319Julian Roberts 1,385,8891 –
Former directorsEva Castillo (resigned on 28 February 2013) – –Russell Edey (retired on 9 May 2013) 21,875 2,604Lars Otterbeck (retired on 9 May 2013) – –Bongani Nqwababa (resigned on 6 January 2014) – –
1 These figures do not include rights to forfeitable shares that have not yet vested, which are described in the Directors’ Remuneration Report
How are directors’ conflicts of interest managed?Processes are in place for any potential conflicts of interest to be disclosed and for directors to avoid participation in any decisions where they may have any such conflict or potential conflict. The Company’s procedures for dealing with directors’ conflicts of interest continued to operate effectively during 2013.
No director had a material interest in any significant contract with the Company or any of its subsidiaries during the year. Additional details of various non-material transactions between the directors and the Group are reported on an aggregated basis, along with other transactions by senior managers of the Group, in Note H3 to the Accounts.
The executive directors are permitted to hold and retain, for their own benefit, fees from one external (non-Group) non-executive directorship (but not a chairmanship) of another listed company, subject to prior clearance by the Board and the directorship concerned not being in conflict or potential conflict with any of the Group’s businesses. Neither Julian Roberts nor Philip Broadley currently holds any external non-executive directorships of other publicly quoted companies.
DIRECTORS’ REPORT ONCORPORATE GOVERNANCEAND OTHER MATTERS continued
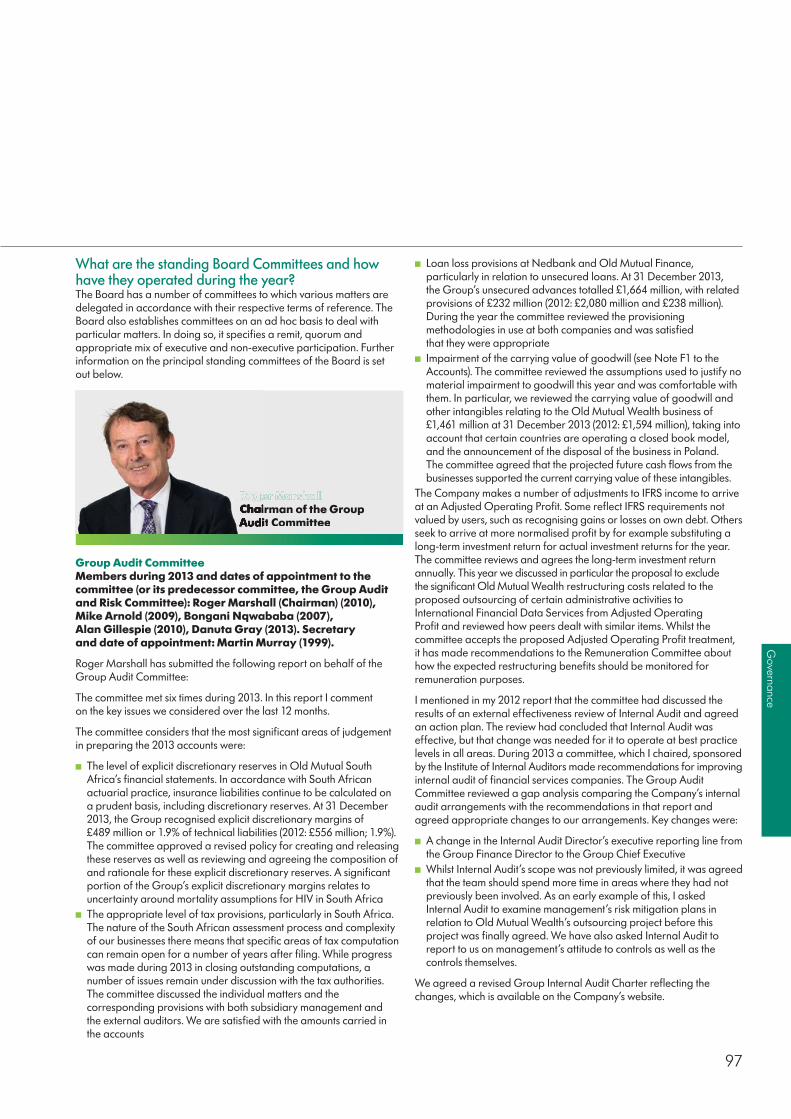
97
Governance
What are the standing Board Committees and how have they operated during the year?The Board has a number of committees to which various matters are delegated in accordance with their respective terms of reference. The Board also establishes committees on an ad hoc basis to deal with particular matters. In doing so, it specifies a remit, quorum and appropriate mix of executive and non-executive participation. Further information on the principal standing committees of the Board is set out below.
Roger MarshallRoger MarshallRoger MarshallRoger MarshallChairman of the Group Chairman of the Group AuditAudit Committee
Group Audit CommitteeMembers during 2013 and dates of appointment to the committee (or its predecessor committee, the Group Audit and Risk Committee): Roger Marshall (Chairman) (2010), Mike Arnold (2009), Bongani Nqwababa (2007), Alan Gillespie (2010), Danuta Gray (2013). Secretary and date of appointment: Martin Murray (1999).
Roger Marshall has submitted the following report on behalf of the Group Audit Committee:
The committee met six times during 2013. In this report I comment on the key issues we considered over the last 12 months.
The committee considers that the most significant areas of judgement in preparing the 2013 accounts were:
■ The level of explicit discretionary reserves in Old Mutual South Africa’s financial statements. In accordance with South African actuarial practice, insurance liabilities continue to be calculated on a prudent basis, including discretionary reserves. At 31 December 2013, the Group recognised explicit discretionary margins of £489 million or 1.9% of technical liabilities (2012: £556 million; 1.9%). The committee approved a revised policy for creating and releasing these reserves as well as reviewing and agreeing the composition of and rationale for these explicit discretionary reserves. A significant portion of the Group’s explicit discretionary margins relates to uncertainty around mortality assumptions for HIV in South Africa
■ The appropriate level of tax provisions, particularly in South Africa. The nature of the South African assessment process and complexity of our businesses there means that specific areas of tax computation can remain open for a number of years after filing. While progress was made during 2013 in closing outstanding computations, a number of issues remain under discussion with the tax authorities. The committee discussed the individual matters and the corresponding provisions with both subsidiary management and the external auditors. We are satisfied with the amounts carried in the accounts
■ Loan loss provisions at Nedbank and Old Mutual Finance, particularly in relation to unsecured loans. At 31 December 2013, the Group’s unsecured advances totalled £1,664 million, with related provisions of £232 million (2012: £2,080 million and £238 million). During the year the committee reviewed the provisioning methodologies in use at both companies and was satisfied that they were appropriate
■ Impairment of the carrying value of goodwill (see Note F1 to the Accounts). The committee reviewed the assumptions used to justify no material impairment to goodwill this year and was comfortable with them. In particular, we reviewed the carrying value of goodwill and other intangibles relating to the Old Mutual Wealth business of £1,461 million at 31 December 2013 (2012: £1,594 million), taking into account that certain countries are operating a closed book model, and the announcement of the disposal of the business in Poland. The committee agreed that the projected future cash flows from the businesses supported the current carrying value of these intangibles.
The Company makes a number of adjustments to IFRS income to arrive at an Adjusted Operating Profit. Some reflect IFRS requirements not valued by users, such as recognising gains or losses on own debt. Others seek to arrive at more normalised profit by for example substituting a long-term investment return for actual investment returns for the year. The committee reviews and agrees the long-term investment return annually. This year we discussed in particular the proposal to exclude the significant Old Mutual Wealth restructuring costs related to the proposed outsourcing of certain administrative activities to International Financial Data Services from Adjusted Operating Profit and reviewed how peers dealt with similar items. Whilst the committee accepts the proposed Adjusted Operating Profit treatment, it has made recommendations to the Remuneration Committee about how the expected restructuring benefits should be monitored for remuneration purposes.
I mentioned in my 2012 report that the committee had discussed the results of an external effectiveness review of Internal Audit and agreed an action plan. The review had concluded that Internal Audit was effective, but that change was needed for it to operate at best practice levels in all areas. During 2013 a committee, which I chaired, sponsored by the Institute of Internal Auditors made recommendations for improving internal audit of financial services companies. The Group Audit Committee reviewed a gap analysis comparing the Company’s internal audit arrangements with the recommendations in that report and agreed appropriate changes to our arrangements. Key changes were:
■ A change in the Internal Audit Director’s executive reporting line from the Group Finance Director to the Group Chief Executive
■ Whilst Internal Audit’s scope was not previously limited, it was agreed that the team should spend more time in areas where they had not previously been involved. As an early example of this, I asked Internal Audit to examine management’s risk mitigation plans in relation to Old Mutual Wealth’s outsourcing project before this project was finally agreed. We have also asked Internal Audit to report to us on management’s attitude to controls as well as the controls themselves.
We agreed a revised Group Internal Audit Charter reflecting the changes, which is available on the Company’s website.

Old Mutual plcAnnual Report and Accounts 2013
98
During 2013, we discussed the recommendations of the Financial Reporting Council (of which I am a director) for the external audit to be tendered. We also took into account UK Competition Commission regulation and pending European legislation, and increased market comment on the subject. Following these discussions, we have determined that it will be appropriate to conduct a tender of the Group’s audit engagement during 2014. The tender will be in respect of appointment to the role of Group auditor for the year ending 31 December 2016.
Initial analysis suggests that independence considerations and potential conflicts of interests will limit the number of firms which will be involved in the tender. The Group’s audit has not previously been tendered since the Company became a listed entity in 1999.
We are yet to finalise the criteria against which we will assess potential candidates, but these are likely to include:
■ Financial services experience and extent of in-house actuarial resource ■ Experience of listed and multiple-listed entity audits ■ Presence in the significant markets in which we operate ■ Proposed approach to the audit and expertise of the proposed team ■ Proposed fees.
We would welcome shareholder input on this matter, in particular on the proposed criteria, and this can be provided by contacting the Secretary to the committee, [email protected].
In the meantime, we reviewed the effectiveness of our current auditors, KPMG, during the year and continued to be satisfied with the quality of the audit. We routinely review the performance of the external auditors annually. The review in 2013 was conducted in advance of that year’s AGM and informed our recommendation to reappoint the incumbent. This review analysed critical competencies expected of our external auditors and was performed by the Internal Audit function. Interviews with, and the responses to questionnaires by, key finance personnel from Group and subsidiary entities and committee members are central to the assessment process. We have strict controls over the scope and amount of non-audit services provided by the audit firm (see “Who are the Group Auditors and how much are they paid?” below) and are satisfied that they remain independent.
I would be happy to discuss the contents of this report, and the activities of the committee, with individual shareholders.
Mike ArnoldMike ArnoldMike ArnoldMike ArnoldChairman of the Board Chairman of the Board Risk CommitteeRisk Committee
Board Risk CommitteeMembers during 2013 and years of appointment to the committee: Mike Arnold (Chairman) (2010), Philip Broadley (2010), Reuel Khoza (2010), Roger Marshall (2010), Nkosana Moyo (2013), Nku Nyembezi-Heita (2013). Other members: until February 2013, Eva Castillo; until May 2013, Lars Otterbeck. Secretary: Colin Campbell (2012).
Mike Arnold has submitted the following report on behalf of the Board Risk Committee:
The committee met six times during the year, of which two meetings were held in addition to the four meetings originally scheduled. The Chief Risk Officer and the Group Internal Audit Director attended each meeting and the Group Chief Actuary attended five of the meetings. The external auditors were invited to attend all of the meetings.
The committee received a report at each of its scheduled meetings during 2013 from the Chief Risk Officer in which any changes to the Group’s risk profile were identified and discussed. We also reviewed the risk appetite metrics operated by the Group and recommended to the Board some changes to the criteria to be used by the business units for their business planning over the three-year period 2014 to 2016.
During the year the committee devoted significant time to the risks involved in the outsourcing to International Financial Data Services (IFDS) of many of Old Mutual Wealth’s administrative functions, prior to the entry into the outsourcing arrangements in August 2013. One of the committee’s sessions to consider the proposed IFDS outsourcing was held jointly with the Group Audit Committee.
In addition, during our meetings in 2013, we focused on:
■ The Group’s Own Risk and Solvency Assessment (ORSA), under which the Group assesses its risks and compares them to the resources available, both in terms of regulatory solvency and the Group’s own capital and risk metrics. The annual production of the ORSA will be a regulatory requirement once the Solvency II Directive has been implemented
■ Assessments of the Group’s capital and solvency position ■ The content and suitability of the Group’s suite of risk policies and standards, and of the Group Operating Model
■ The residual financial risks of Old Mutual Bermuda ■ Regulatory risks arising as a result of business activities, in particular the Group’s regulatory environment and compliance status
■ Stress and scenario testing, focusing on particular economic and business scenarios and their potential impact on the Group’s finances.
DIRECTORS’ REPORT ONCORPORATE GOVERNANCEAND OTHER MATTERS continued
99
Governance
In addition to its regular meetings, the committee held a half-day workshop to enable a discussion to take place on a wide range of issues relating to risk management within the Group and several ‘deep-dive’ sessions, where the committee considered risk issues affecting specific business units in more detail. I also received updates between the scheduled meetings through my regular meetings with the Chief Risk Officer and the Group Chief Actuary.
In connection with the finalisation of the Group’s annual results, the committee produced a report for the Remuneration Committee commenting on management’s observance during the year of the risk appetite metrics agreed by the Board.
As mentioned earlier in this Governance report, the committee also undertook a review of its effectiveness including a review of, and the committee’s performance against, its terms of reference. The recommendations of the review, which included recommendations on the composition of the committee, relations with subsidiary committees, training and education, have either already been implemented or will be implemented during 2014.
During 2013, either Roger Marshall or I personally attended the risk and audit committees of each of the major subsidiaries of the Group and we have ongoing dialogue with the independent directors who chair those subsidiaries’ committees. I shall continue to attend these meetings in 2014 in order to remain close to any major risk issues that may arise during the coming year.
In 2014, in addition to the regular items on the committee agenda, the committee will continue with its programme of deep-dive sessions into individual business units and will be reviewing the Group’s proposed economic capital disclosures.
Nomination CommitteeMembers during 2013 and dates of appointment to the committee: Patrick O’Sullivan (Chairman) (2010), Mike Arnold (2010), Danuta Gray (2013), Alan Gillespie (2010), Reuel Khoza (2010), Roger Marshall (2010), Nkosana Moyo (2013), Bongani Nqwababa (2010), Nku Nyembezi-Heita (2013), Julian Roberts (2008). Other members during the year: Eva Castillo (2011 to February 2013) Russell Edey (2005 to May 2013), Lars Otterbeck (2010 to May 2013). Secretary and date of appointment: Martin Murray (1999).
The Nomination Committee makes recommendations to the Board in relation to the appointment of directors, the structure of the Board and membership of the Board’s main standing committees. It also reviews development and succession plans for the most senior executive management of the Group and certain appointments to the boards and standing committees of principal subsidiaries in line with the Group Operating Model. It is chaired by the Chairman of the Board, Patrick O’Sullivan, and a majority of its members are independent non-executive directors.
The committee seeks to ensure that its process for identifying candidates for recommendation to the Board as new directors is formal, rigorous and transparent. Vacancies generally arise in the context of either planned renewal of the Board, replacing directors who are due to retire, or adjusting the Board’s balance of knowledge, skills, independence or diversity. In identifying candidates, appropriate regard is paid to ensuring that they will have sufficient time available in the light of their other commitments to discharge their duties as directors of the Company.
During 2013, the committee focused on refreshing the non-executive director membership of the Board, seeking to achieve additional diversity in terms of geographical background, experience and gender, subject to any recommended candidates being aligned with the Group’s developing strategy and helping to complement the existing skills represented on the Board.
External search consultancies MWM Consulting and Russell Reynolds Associates were engaged and a rigorous process followed to draw up longlists of potential candidates, from which shortlists were subsequently approved by the committee. The final candidates emerging from these processes were then interviewed by as many members of the Board as possible before final recommendations were received and endorsed by the committee for submission to the Board for approval. Three new appointments of independent non-executive directors resulted from this, Nkosana Moyo in September 2013 and Zoe Cruz and Adiba Ighodaro in January 2014. As the Chairman has mentioned in his introductory remarks to this report, Zoe Cruz’s extensive experience of international financial markets and asset management are expected to provide the Board with additional insight into these important areas of the Group’s business, while Nkosana Moyo’s and Adiba Ighodaro’s deep knowledge of investing and operating in various countries in Africa will widen the Board’s ability to evaluate opportunities as the Group pursues its strategy of expanding further into new territories in Africa.
In relation to the use of MWM Consulting and Russell Reynolds Associates as search consultants, both firms were also used by members of the Group during 2013 in connection with searches for various senior executive positions. The committee is satisfied however, that these other engagements did not impair either firm’s objectivity or independence in researching and evaluating non-executive candidates for the Board.
In addition to its work on refreshing the Board, the committee also continued during the year to monitor succession plans for the executive directors and other members of the Group Executive Committee, significant developments affecting other senior executives and major subsidiary boards, talent management and diversity initiatives and progress against action items identified as part of the 2012 Board effectiveness review.
Remuneration CommitteeA full description of the membership and role of the Remuneration Committee and of its activities during 2013 is contained in the Directors’ Remuneration Report.
Other committeesThere are a number of executive committees which assist the Group Chief Executive with the day-to-day management of the Group. These include the Group Executive Committee mentioned earlier in this report, the Group Executive Risk Committee, whose responsibilities are described in the Risk and Capital Management report earlier in this document; and the Group Capital Management Committee, whose role is, among other things, to agree capital allocations within certain limits (or make recommendations to the Board regarding any allocations beyond such limits) and to approve the capital plan of the Group as part of the annual business-planning process.
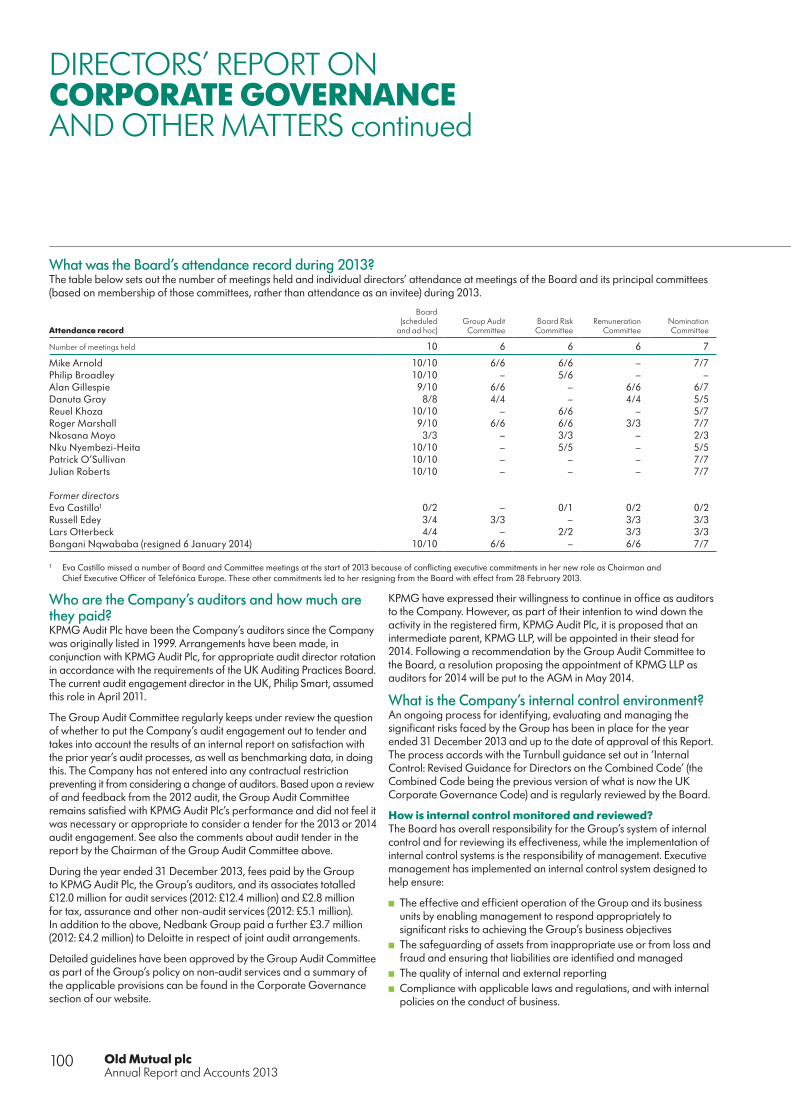
Old Mutual plcAnnual Report and Accounts 2013
100
What was the Board’s attendance record during 2013?The table below sets out the number of meetings held and individual directors’ attendance at meetings of the Board and its principal committees (based on membership of those committees, rather than attendance as an invitee) during 2013.
Attendance record
Board (scheduled
and ad hoc)Group Audit
CommitteeBoard RiskCommittee
Remuneration Committee
Nomination Committee
Number of meetings held 10 6 6 6 7
Mike Arnold 10/10 6/6 6/6 – 7/7Philip Broadley 10/10 – 5/6 – –Alan Gillespie 9/10 6/6 – 6/6 6/7Danuta Gray 8/8 4/4 – 4/4 5/5Reuel Khoza 10/10 – 6/6 – 5/7Roger Marshall 9/10 6/6 6/6 3/3 7/7Nkosana Moyo 3/3 – 3/3 – 2/3Nku Nyembezi-Heita 10/10 – 5/5 – 5/5Patrick O’Sullivan 10/10 – – – 7/7Julian Roberts 10/10 – – – 7/7
Former directorsEva Castillo1 0/2 – 0/1 0/2 0/2Russell Edey 3/4 3/3 – 3/3 3/3Lars Otterbeck 4/4 – 2/2 3/3 3/3Bongani Nqwababa (resigned 6 January 2014) 10/10 6/6 – 6/6 7/7
1 Eva Castillo missed a number of Board and Committee meetings at the start of 2013 because of conflicting executive commitments in her new role as Chairman and Chief Executive Officer of Telefónica Europe. These other commitments led to her resigning from the Board with effect from 28 February 2013.
Who are the Company’s auditors and how much are they paid?KPMG Audit Plc have been the Company’s auditors since the Company was originally listed in 1999. Arrangements have been made, in conjunction with KPMG Audit Plc, for appropriate audit director rotation in accordance with the requirements of the UK Auditing Practices Board. The current audit engagement director in the UK, Philip Smart, assumed this role in April 2011.
The Group Audit Committee regularly keeps under review the question of whether to put the Company’s audit engagement out to tender and takes into account the results of an internal report on satisfaction with the prior year’s audit processes, as well as benchmarking data, in doing this. The Company has not entered into any contractual restriction preventing it from considering a change of auditors. Based upon a review of and feedback from the 2012 audit, the Group Audit Committee remains satisfied with KPMG Audit Plc’s performance and did not feel it was necessary or appropriate to consider a tender for the 2013 or 2014 audit engagement. See also the comments about audit tender in the report by the Chairman of the Group Audit Committee above.
During the year ended 31 December 2013, fees paid by the Group to KPMG Audit Plc, the Group’s auditors, and its associates totalled £12.0 million for audit services (2012: £12.4 million) and £2.8 million for tax, assurance and other non-audit services (2012: £5.1 million). In addition to the above, Nedbank Group paid a further £3.7 million (2012: £4.2 million) to Deloitte in respect of joint audit arrangements.
Detailed guidelines have been approved by the Group Audit Committee as part of the Group’s policy on non-audit services and a summary of the applicable provisions can be found in the Corporate Governance section of our website.
KPMG have expressed their willingness to continue in office as auditors to the Company. However, as part of their intention to wind down the activity in the registered firm, KPMG Audit Plc, it is proposed that an intermediate parent, KPMG LLP, will be appointed in their stead for 2014. Following a recommendation by the Group Audit Committee to the Board, a resolution proposing the appointment of KPMG LLP as auditors for 2014 will be put to the AGM in May 2014.
What is the Company’s internal control environment?An ongoing process for identifying, evaluating and managing the significant risks faced by the Group has been in place for the year ended 31 December 2013 and up to the date of approval of this Report. The process accords with the Turnbull guidance set out in ‘Internal Control: Revised Guidance for Directors on the Combined Code’ (the Combined Code being the previous version of what is now the UK Corporate Governance Code) and is regularly reviewed by the Board.
How is internal control monitored and reviewed?The Board has overall responsibility for the Group’s system of internal control and for reviewing its effectiveness, while the implementation of internal control systems is the responsibility of management. Executive management has implemented an internal control system designed to help ensure:
■ The effective and efficient operation of the Group and its business units by enabling management to respond appropriately to significant risks to achieving the Group’s business objectives
■ The safeguarding of assets from inappropriate use or from loss and fraud and ensuring that liabilities are identified and managed
■ The quality of internal and external reporting ■ Compliance with applicable laws and regulations, and with internal policies on the conduct of business.
DIRECTORS’ REPORT ONCORPORATE GOVERNANCEAND OTHER MATTERS continued

101
Governance
The system of internal control is designed to manage, rather than eliminate, the risk of failure to achieve the Group’s business objectives, and can only provide reasonable, and not absolute, assurance against material misstatement or loss.
The Group’s actions to review the effectiveness of the system of internal control include:
■ An annual review of the risk assessment procedures, control environment considerations, information and communication and monitoring procedures at Group level and within each business unit. This review covers all material controls, including financial, operational and compliance controls and risk management systems
■ A certification process, under which all business units are required to confirm that they have undertaken risk management in accordance with the Group risk framework, that they have reviewed the effectiveness of the system of internal controls, that internal policies have been complied with, and that no significant risks or issues are known which have not been reported in accordance with policy
■ Regular reviews of the effectiveness of the system of internal control by the Group Audit Committee, which receives reports from Group Internal Audit. The committee also receives reports from the external auditors, which include details of significant internal control matters that they have identified during the course of their work.
These activities are in addition to the regular risk management activities which are performed on an ongoing basis (as described in more detail in the Risk and Capital Management section elsewhere in this document).
The certification process described above does not apply to certain joint ventures where the Group does not exercise full management control. In these cases, Old Mutual monitors the internal control environment and the potential impact on the Group through representation on the board of the entity concerned.
The Board reviewed the effectiveness of the system of internal control during and at the end of the year. Our annual internal control assessment has not highlighted any material failings. We remain committed to having a robust internal control environment across the Group.
What steps are you taking to monitor the quality of the Group’s financial controls?Since 2009, Old Mutual has implemented a group-wide framework of financial controls. This has been designed on the basis of the criteria described in ‘Internal Control – Integrated Framework’ issued by the Committee of Sponsoring Organizations of Treadway Commission. Management reports periodically on the effectiveness of the financial controls framework to the Group Audit Committee and also assessed its effectiveness at 31 December 2013, concluding that it was effective. This has assisted the Group Audit Committee and the Board in concluding that it can rely upon the operation of these controls as part of its review of internal control effectiveness referred to above.
What is the role of Group Internal Audit?Group Internal Audit (GIA) is responsible for providing independent, objective assurance on the adequacy and effectiveness of Old Mutual’s systems of governance, risk management and internal control to the Board and executive management and, in doing so, helps enhance the controls culture within the Group. The work of GIA is focused on the areas of greatest risk, both current and emerging, to Old Mutual as
determined by a comprehensive, risk-based planning process. The Group Audit Committee approves the annual internal audit plan and any subsequent material amendments to it and also satisfies itself that GIA has adequate resources to discharge its function (which the Board is able to confirm is the case for 2013 – 2014).
There are internal audit teams located in each of our major businesses. The heads of internal audit in the Group’s wholly-owned subsidiaries report directly to the Group Internal Audit Director (GIAD).
During 2013, the GIAD reported functionally to the Chairman of the Group Audit Committee and administratively to the Group Finance Director. His administrative reporting line changed to the Group Chief Executive with effect from 1 January 2014 in line with recommendations made in July 2013 by the Chartered Institute of Internal Auditors (CIIA) for more effective internal audit in UK financial services organisations.
The GIAD attends all meetings of the Group Audit Committee, and has unrestricted access to the Group Chief Executive and to the Chairman of the Board, as well as open invitations to attend any meetings of the business unit Audit Committees, the Board Risk Committee and the Group Executive Risk Committee.
Internal audit teams across Old Mutual use a single audit methodology which meets the standards set by the Institute of Internal Auditors. Issues raised by internal audit during the course of its work are discussed with management, who are responsible for implementing agreed actions to address the issues identified within an appropriate and agreed timeframe.
Formal reports are submitted by the GIAD to each meeting of the Group Audit Committee, summarising the results of internal audit activity, management’s progress in addressing issues and other significant matters.
An assessment of the effectiveness of GIA is carried out periodically by external advisers. The most recent assessment was carried out in the second half of 2012 and concluded that GIA was fit for purpose in meeting the current assurance needs of the Group. The Committee on Internal Audit Guidance for Financial Services, which is chaired by the Group Audit Committee Chairman of Old Mutual plc, published its final recommendations in July 2013. GIA has analysed current performance against each of the recommendations contained in the Guidance and has developed an action plan to be implemented during 2014 to close the gaps which the Group Audit Committee perceives need to be addressed.
How does the Company conduct its relations with shareholders and analysts?The Group places great importance on the quality and frequency of its direct communication with its retail shareholders, debt and equity institutional investors and sell-side analysts by means of a proactive Investor Relations (IR) programme. As a result of being both a listed entity and a major institutional investor allocating capital on behalf of clients and on its own account, the Group considers that it should lead by example and actively promote the success of the Group over the long term and be seen to be doing so across its operating markets.
The objective of the IR programme is to facilitate communication with the global investment community, in both the equity and debt asset classes, and to keep investors updated on the Group’s performance in accordance with the UK Listing, Prospectus and Disclosure and
Old Mutual plcAnnual Report and Accounts 2013
102
Transparency Rules. The IR team also participates in programmes to identify best international IR practice and to promote such practice actively to its investor base.
The Group has a small, dedicated IR team based in South Africa and London which runs the Group’s international IR programme. The team consists of experienced capital market professionals as well as finance professionals who have transferred from other parts of Old Mutual. The team works closely with the media relations, responsible business and public affairs teams of the Group and businesses units, and reports to the Director of External Communications. Old Mutual’s investor base is very diverse in terms of both investor style and geographic location and the Group has over 400,000 retail shareholders.
The focus of our IR strategy during 2013 has been particularly to highlight the Group’s plans for expansion across its emerging markets businesses, where it plans to deploy significant amounts of Group capital in the medium term. It has also allocated significant management resources in targeting international investors whose mandates have an investment philosophy and horizon that most closely aligns with the Group’s strategy. This is designed to lower the Group’s cost of capital and is consistent with the macro trends in investment markets whereby domestic-only mandates are moving increasingly global and sell-side coverage moving away from a domestic orientation only.
The Group continues to improve further its dialogue with investors and sell-side analysts, providing them with briefings and educational support, so as to enable them to obtain a better understanding of the Group’s operations. We increased our communication and engagement with the investment community, attending 14 investment conferences during the year, in the US, Europe and South Africa (11 in 2012). The Group conducted a number of investor presentations during the year for investors willing to travel to London, Cape Town and Johannesburg. The most extensive of these was a three-day session in Cape Town covering the Group’s emerging markets business. The event was attended by 130 people, including international investors and journalists, and covered banking, life and savings, property and casualty and asset management operations with presentations, panel sessions, videos and branch visits. The event was webcast live and a recording is available on the Group’s website together with videos covering the major country operations as well as an edited summary of the event.
During 2013, we continued to target smaller institutional investors and those who manage funds for high net worth retail clients and charities in both Europe and South Africa with a view to further diversifying the Company’s shareholder base.
The following are the major IR educational events that we have organised over the last two years:
May 2012 Presentation to investors and analysts on Old Mutual Asset Management
October 2012 Investor presentation on Old Mutual Wealth in London
October 2012 Investor field trip to South Africa
November 2012 OMEM roadshow in London
November 2012 Old Mutual Wealth roadshow (in South Africa)
April 2013 Briefing with SA Finance Minister, London
June 2013 Sell-side analyst meeting on economic capital calculations
December 2013 Three-day emerging markets businesses showcase in Cape Town, South Africa
The table below shows the five-year track record of improving the Group’s relationship with buy-side analysts and investors from around the world.
2013 2012 2011 2010 2009
Total number of events 273 284 265 225 207
Total with executives 208 197 203 152 185
During 2013, IR meetings were held with investors in the UK, South Africa, North America and continental Europe, involving 219 individual institutions. The majority of meetings involved the Group Chief Executive, the Group Finance Director or another member of the senior management team, although greater use was made of group meetings in order to improve efficiency and provide more institutions with access to management and also to increase the efficient use of management’s own time. Following an intense period of contact with sell-side analysts in 2012, we refined our approach to one of structured interaction. We have held regular sessions for senior management to meet with the sell-side analysts both in Europe and in South Africa.
Currently 17 sell-side analysts from Europe and South Africa actively publish research on the Company. Sell-side analysts are encouraged to cover the Company to provide their opinion to investors on the Group’s valuation, its performance and the business environment in which it operates, and also to make meaningful comparisons with peers. During the year, two new research analysts initiated coverage on the stock, one based in the UK and one with dual coverage from the UK and South Africa. We anticipate further sell-side coverage to be initiated during 2014 from global investment banks and brokerages.
The IR team also supported the execution of the Group’s corporate actions, including the acquisitions made in East and West Africa and the completion of the Group’s debt repayment programme.
DIRECTORS’ REPORT ONCORPORATE GOVERNANCEAND OTHER MATTERS continued
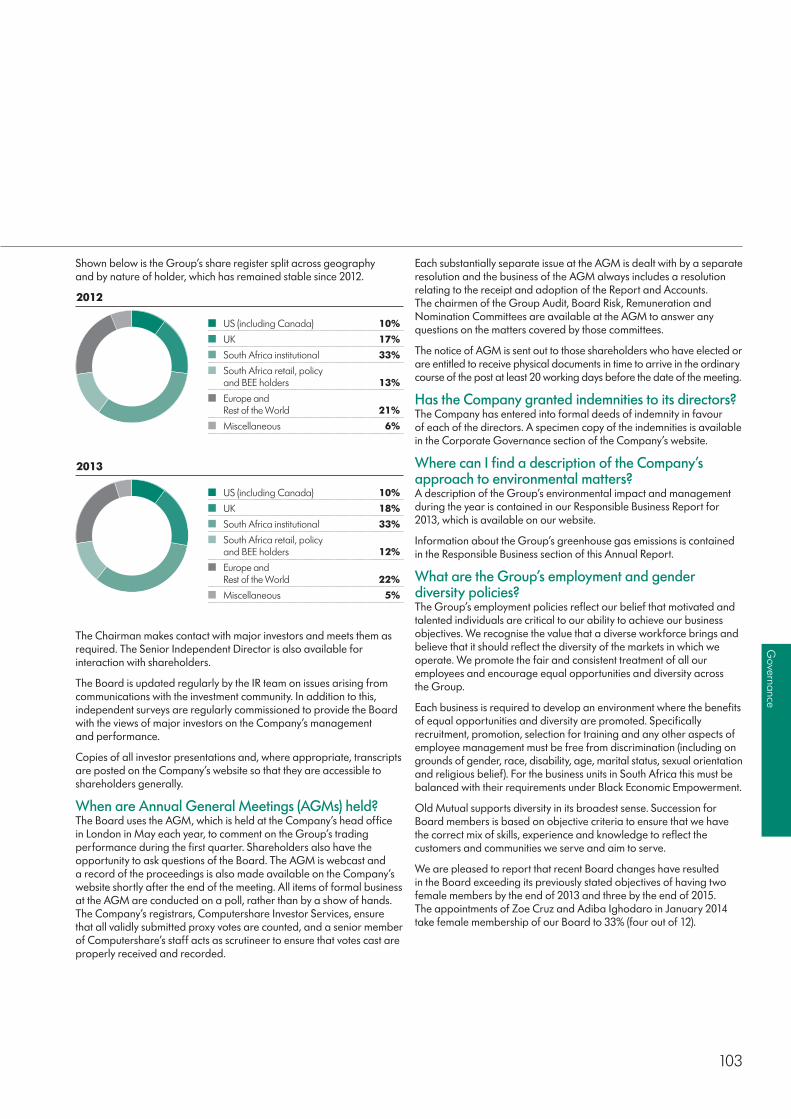
103
Governance
Shown below is the Group’s share register split across geography and by nature of holder, which has remained stable since 2012.
2012
US (including Canada) 10%
UK 17%
South Africa institutional 33%
South Africa retail, policy and BEE holders 13%
Europe andRest of the World 21%
Miscellaneous 6%
2013
US (including Canada) 10%
UK 18%
South Africa institutional 33%
South Africa retail, policy and BEE holders 12%
Europe andRest of the World 22%
Miscellaneous 5%
The Chairman makes contact with major investors and meets them as required. The Senior Independent Director is also available for interaction with shareholders.
The Board is updated regularly by the IR team on issues arising from communications with the investment community. In addition to this, independent surveys are regularly commissioned to provide the Board with the views of major investors on the Company’s management and performance.
Copies of all investor presentations and, where appropriate, transcripts are posted on the Company’s website so that they are accessible to shareholders generally.
When are Annual General Meetings (AGMs) held?The Board uses the AGM, which is held at the Company’s head office in London in May each year, to comment on the Group’s trading performance during the first quarter. Shareholders also have the opportunity to ask questions of the Board. The AGM is webcast and a record of the proceedings is also made available on the Company’s website shortly after the end of the meeting. All items of formal business at the AGM are conducted on a poll, rather than by a show of hands. The Company’s registrars, Computershare Investor Services, ensure that all validly submitted proxy votes are counted, and a senior member of Computershare’s staff acts as scrutineer to ensure that votes cast are properly received and recorded.
Each substantially separate issue at the AGM is dealt with by a separate resolution and the business of the AGM always includes a resolution relating to the receipt and adoption of the Report and Accounts. The chairmen of the Group Audit, Board Risk, Remuneration and Nomination Committees are available at the AGM to answer any questions on the matters covered by those committees.
The notice of AGM is sent out to those shareholders who have elected or are entitled to receive physical documents in time to arrive in the ordinary course of the post at least 20 working days before the date of the meeting.
Has the Company granted indemnities to its directors?The Company has entered into formal deeds of indemnity in favour of each of the directors. A specimen copy of the indemnities is available in the Corporate Governance section of the Company’s website.
Where can I find a description of the Company’s approach to environmental matters?A description of the Group’s environmental impact and management during the year is contained in our Responsible Business Report for 2013, which is available on our website.
Information about the Group’s greenhouse gas emissions is contained in the Responsible Business section of this Annual Report.
What are the Group’s employment and gender diversity policies?The Group’s employment policies reflect our belief that motivated and talented individuals are critical to our ability to achieve our business objectives. We recognise the value that a diverse workforce brings and believe that it should reflect the diversity of the markets in which we operate. We promote the fair and consistent treatment of all our employees and encourage equal opportunities and diversity across the Group.
Each business is required to develop an environment where the benefits of equal opportunities and diversity are promoted. Specifically recruitment, promotion, selection for training and any other aspects of employee management must be free from discrimination (including on grounds of gender, race, disability, age, marital status, sexual orientation and religious belief). For the business units in South Africa this must be balanced with their requirements under Black Economic Empowerment.
Old Mutual supports diversity in its broadest sense. Succession for Board members is based on objective criteria to ensure that we have the correct mix of skills, experience and knowledge to reflect the customers and communities we serve and aim to serve.
We are pleased to report that recent Board changes have resulted in the Board exceeding its previously stated objectives of having two female members by the end of 2013 and three by the end of 2015. The appointments of Zoe Cruz and Adiba Ighodaro in January 2014 take female membership of our Board to 33% (four out of 12).

Old Mutual plcAnnual Report and Accounts 2013
104
We have 9% female membership of the Group Executive Committee and 15% in our Key Roles (which comprise approximately the top 120 executive positions around the Group). The Key Roles figure represents an increase from 13% in 2012. It remains our aspiration to achieve a high level of diversity throughout our businesses and specifically to build a pipeline of female talent to improve our gender balance. To help us to achieve this, we will during 2014:
■ Launch an internal mentor programme where each Group Executive Committee member mentors a high potential woman
■ Continue to participate in the FTSE100 cross-company mentoring programme
■ Extend the Chairman- and Group Chief Executive-sponsored Women’s Network (which is an employee-led forum providing an opportunity for employees at all levels to share skills and experiences about achieving business success, as well as building an ‘in-house’ support structure) to all business units
■ Promote and fund attendance at women’s leadership programmes at premier business schools
■ Encourage our businesses to seek innovative ways to attract female talent.
To ensure we can monitor our success, we have established the following gender diversity goals for 2018 for our leadership groups:
2013 (Actual) 2018 (Target)
Board 33% (at Jan 2014) More than 30%Key Roles 15% 30%
In South Africa, OMSA and Nedbank have retained their Level 2 status under the B-BBEE as measured under the Financial Sector Code.
Did you make any political donations during 2013?The Group made no EU or other political donations during the year.
What final dividend is being recommended and what is your dividend policy?The Board is recommending a final dividend for 2013 of 6.0p per share (or its equivalent in other applicable currencies). This equates to 2.27 times IFRS AOP earnings cover. A scrip dividend alternative is not being made available in relation to this dividend and it will be settled entirely in cash.
Further information on the final dividend for 2013 is contained in the Shareholder Information section of this document.
For future dividends, the Board intends to pursue a progressive dividend policy consistent with our strategy, having regard to overall capital requirements, liquidity and profitability, and targeting a dividend cover of between 2 and 2.25 times IFRS AOP earnings. Interim dividends will continue to be set at about 30% of the prior year’s full ordinary dividend.
How many shares are in issue?The Company’s issued share capital at 31 December 2013 was £559,687,749.03 divided into 4,897,267,804 ordinary shares of 113⁄7 pence each (2012: £559,214,849.60 divided into 4,893,129,934 ordinary shares of 113⁄7 pence each). The total number of voting rights in the Company’s issued ordinary share capital at 31 December 2013 was also 4,897,267,804.
During 2013, 4,137,870 ordinary shares of 113⁄7 pence each were issued under employee share schemes at an average price of £0.827 each.
At 31 December 2013, shareholder authorities were in force enabling the Company to make market purchases of, and/or to purchase pursuant to contingent purchase contracts relating to each of the overseas exchanges on which the Company’s shares are listed, its own shares up to an aggregate of 489,334,000 shares. No shares were bought back by the Company during 2013 or during the period up to 28 February 2014.
In the period 1 January to 28 February 2014, 151,268 further shares were issued by the Company under its employee share schemes at an average price of £0.394 each. No shares were bought back during that period. As a result, the Company’s issued share capital at 28 February 2014 was £559,705,036.80 divided into 4,897,419,072 ordinary shares of 113⁄7 pence each. The total number of voting rights at that date was also 4,897,419,072.
How can I find out about the rights and obligations attaching to the Company’s shares?The rights and obligations attaching to the Company’s ordinary shares are those conventional for a publicly listed UK company, and a summary of them (along with certain other information relating to dividends, directors and amendments to the Company’s Articles of Association) is available in the Corporate Governance section of the Company’s website. The Company’s current Articles of Association are also available there.
Does the Company have any significant agreements involving change of control?The following significant agreement to which the Company is a party contains provisions entitling counterparties to exercise termination or other rights in the event of a change of control of the Company:
■ £1,200 million (subsequently reduced to £800 million) Revolving Credit Facility (the Facility) dated 21 April 2011 between the Company, various syndicate banks (the Banks) and Banc of America Securities Limited as agent (the Agent). If a person or group of persons acting in concert gains control of the Company, the Company must notify the Agent. The Agent and the Company will negotiate with a view to agreeing terms and conditions acceptable to the Company and all of the Banks for continuing the Facility. If such negotiations fail within 30 days of the original notification to the Agent by the Company, the Banks become entitled to declare any outstanding indebtedness repayable by giving notice to the Agent within 15 days of the 30-day period mentioned above. On receiving notice for payment from the Agent, the Company shall pay the outstanding sums within three business days to the relevant Bank(s).
DIRECTORS’ REPORT ONCORPORATE GOVERNANCEAND OTHER MATTERS continued
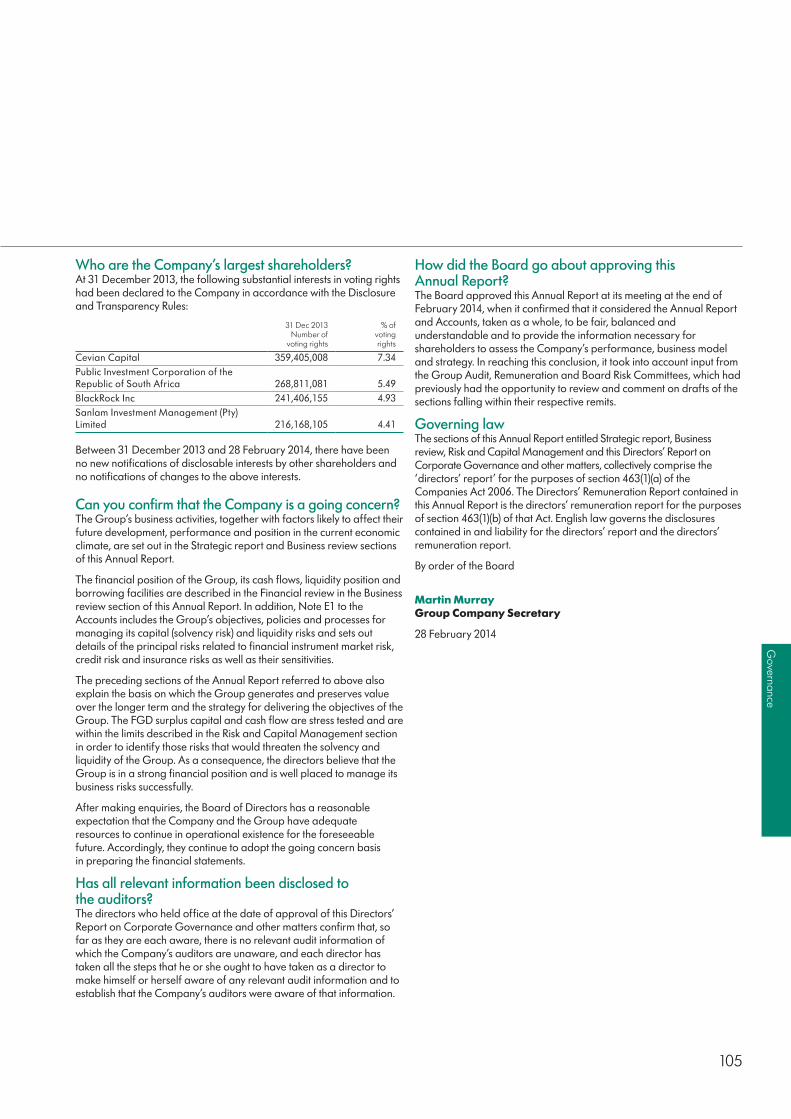
105
Governance
Who are the Company’s largest shareholders?At 31 December 2013, the following substantial interests in voting rights had been declared to the Company in accordance with the Disclosure and Transparency Rules:
31 Dec 2013 Number of
voting rights
% of voting rights
Cevian Capital 359,405,008 7.34Public Investment Corporation of the Republic of South Africa 268,811,081 5.49BlackRock Inc 241,406,155 4.93Sanlam Investment Management (Pty)Limited 216,168,105 4.41
Between 31 December 2013 and 28 February 2014, there have been no new notifications of disclosable interests by other shareholders and no notifications of changes to the above interests.
Can you confirm that the Company is a going concern?The Group’s business activities, together with factors likely to affect their future development, performance and position in the current economic climate, are set out in the Strategic report and Business review sections of this Annual Report.
The financial position of the Group, its cash flows, liquidity position and borrowing facilities are described in the Financial review in the Business review section of this Annual Report. In addition, Note E1 to the Accounts includes the Group’s objectives, policies and processes for managing its capital (solvency risk) and liquidity risks and sets out details of the principal risks related to financial instrument market risk, credit risk and insurance risks as well as their sensitivities.
The preceding sections of the Annual Report referred to above also explain the basis on which the Group generates and preserves value over the longer term and the strategy for delivering the objectives of the Group. The FGD surplus capital and cash flow are stress tested and are within the limits described in the Risk and Capital Management section in order to identify those risks that would threaten the solvency and liquidity of the Group. As a consequence, the directors believe that the Group is in a strong financial position and is well placed to manage its business risks successfully.
After making enquiries, the Board of Directors has a reasonable expectation that the Company and the Group have adequate resources to continue in operational existence for the foreseeable future. Accordingly, they continue to adopt the going concern basis in preparing the financial statements.
Has all relevant information been disclosed to the auditors?The directors who held office at the date of approval of this Directors’ Report on Corporate Governance and other matters confirm that, so far as they are each aware, there is no relevant audit information of which the Company’s auditors are unaware, and each director has taken all the steps that he or she ought to have taken as a director to make himself or herself aware of any relevant audit information and to establish that the Company’s auditors were aware of that information.
How did the Board go about approving this Annual Report?The Board approved this Annual Report at its meeting at the end of February 2014, when it confirmed that it considered the Annual Report and Accounts, taken as a whole, to be fair, balanced and understandable and to provide the information necessary for shareholders to assess the Company’s performance, business model and strategy. In reaching this conclusion, it took into account input from the Group Audit, Remuneration and Board Risk Committees, which had previously had the opportunity to review and comment on drafts of the sections falling within their respective remits.
Governing lawThe sections of this Annual Report entitled Strategic report, Business review, Risk and Capital Management and this Directors’ Report on Corporate Governance and other matters, collectively comprise the ‘directors’ report’ for the purposes of section 463(1)(a) of the Companies Act 2006. The Directors’ Remuneration Report contained in this Annual Report is the directors’ remuneration report for the purposes of section 463(1)(b) of that Act. English law governs the disclosures contained in and liability for the directors’ report and the directors’ remuneration report.
By order of the Board
Martin Murray Group Company Secretary
28 February 2014

Old Mutual plcAnnual Report and Accounts 2013
106
Summary
Annual statement ■ Annual Statement from the Chairman of the Remuneration Committee 107
Our remuneration at a glance ■ Summary of our strategic priorities 108 ■ Summary remuneration structure for 2014 108 ■ Performance against targets in 2013 108 ■ Single total figures of remuneration for 2013 108
Directors’ Remuneration Policy ■ Introduction 109 ■ Market benchmarks 109 ■ Balancing short- and long-term remuneration 109 ■ Directors’ Remuneration Policy table (Executive directors) 109 ■ Notes to the Directors’ Remuneration Policy table 112 ■ Consideration of employment conditions elsewhere in the Group 112 ■ Approach to remuneration in connection with recruitment 113 ■ Service agreements and payment for loss of office 113 ■ Illustrations of application of remuneration policy 115 ■ Directors’ Remuneration Policy table (Non-executive directors) 115 ■ Consideration of shareholder views 115
Annual Report on Remuneration ■ Market benchmarks 116 ■ Single total figures of remuneration for executive directors 116 ■ Additional requirements in respect of the single total figure table 117 ■ Single total figures of remuneration for non-executive directors 118 ■ Scheme interests awarded during 2013 119 ■ Payments to past directors 120 ■ Payments for loss of office 120 ■ Shares in trust and shareholder dilution 120 ■ Directors’ shareholdings and share interests 120 ■ Performance graphs 121 ■ Group Chief Executive’s remuneration over the last five years 121 ■ Percentage change in the remuneration of the Group Chief Executive 122 ■ Relative importance of spend on pay 122 ■ Implementation of remuneration policy in 2014 122 ■ Consideration by the directors of matters relating to directors’ remuneration 125 ■ Voting at General Meetings 125
DIRECTORS’REMUNERATION REPORTIn this section, we describe the Directors’ Remuneration Policy and how our directors were paid during 2013.

107
Governance
Alan GillespieAlan GillespieAlan GillespieAlan GillespieChairman of the Chairman of the Remuneration CommitteeRemuneration Committee
Annual statementFrom the Chairman of the Remuneration Committee
As required by The Enterprise and Regulatory Reform Act 2013 and The Large and Medium-sized Companies and Groups (Accounts and Reports) (Amendment) Regulations 2013, this Directors’ Remuneration Report is split into two parts:
■ The Directors’ Remuneration Policy sets out the proposed policy for the three years beginning on the date of the Company’s 2014 AGM, which is subject to a binding shareholder vote.
■ The Annual Report on Remuneration sets out the payments made and awards granted to the directors in 2013 and how the Company intends to implement the policy in 2014, which is subject to an advisory shareholder vote.
Our principles for executive payThe following general principles are applied by the Remuneration Committee (referred to in the rest of this report as the committee) in dealing with executive pay:
■ Remuneration must support the business drivers, corporate vision and strategic priorities of the Group and should align the interests of executives with those of shareholders
■ Remuneration must reinforce wider people-management practices, and only reward results which support the desired Group culture and values
■ Total remuneration should be sustainably affordable and competitively benchmarked in relation to performance attained within an agreed level of risk appetite
■ Incentives should align the interests of executives and shareholders by rewarding delivery of the chosen strategy and sustained performance against agreed financial goals
■ The determination and communication of all reward elements should be simple, clear and transparent.
In implementing these principles, the committee ensures that remuneration arrangements:
■ Attract, motivate and retain individuals of the exceptional calibre needed to lead the Group’s development
■ Focus attention on the main drivers of shareholder value by linking incentives to the attainment of clearly defined targets, while avoiding excessive risk
■ Take account of appropriate benchmarks, while recognising the risk of an upward ratchet of remuneration with no corresponding improvement in performance
■ Provide an opportunity for upper-quartile remuneration packages and short-term and long-term incentives for significant out-performance of the business plan
■ Grant a significant percentage of maximum potential reward in the form of share incentives, in order to align the executive directors’ interests closely with those of shareholders
■ Are implemented consistently across the Group by the Management Remuneration Committee (for executives immediately below Group Executive Committee level) and by local subsidiary companies.
Major issues and decisions taken by the committee in 2013 During 2013, the committee:
■ After consultation with shareholders, revised the performance measures for long-term incentive (LTI) awards granted in 2013
■ Reviewed the consistency of remuneration policy and practice across the Group and was satisfied that appropriate structures exist both at and below Board level to recognise and retain our top talent
■ Reviewed the policy for executive directors, for inclusion in this report, and agreed that no substantive changes to existing contractual and remuneration arrangements were required
■ Agreed a new LTI plan for Old Mutual Wealth in the UK, which provides a strong incentive for it to achieve stretching targets over the next five years
■ Exercised its discretion under the good leaver provisions of the share incentive plans in relation to Philip Broadley, and disclosed the remuneration to be paid to him when he leaves the Group later in 2014
■ Worked closely with the Group Human Resources Department and external advisers on new disclosure requirements in the Annual Report on Remuneration, which show:
— The single total figure of remuneration and additional information, scheme interests awarded during 2013, payments to past directors, payments for loss of office and directors’ shareholdings and share interests, which have been audited by KPMG Audit Plc as required. Their audit report is set out on page 129. The remainder of this report has not been audited.
— The Company has again performed well against its STI and LTI targets and consequently STI and LTI outcomes are above target.
Looking forwardWe are cognisant of shareholder and market concerns about executive pay and accordingly the Directors’ Remuneration Policy has been designed to maintain restraint by:
■ Restricting base pay increases to be in line with those of employees of the executive director’s home country
■ Retaining the current structure and maximum levels of incentive awards (150% of base pay for STI and 250% of base pay for LTI)
except for recruitment, where there is an increase in scope or responsibility of the role or for salary progression for a newly appointed director.
Alan GillespieChairman of the Remuneration Committee

Old Mutual plcAnnual Report and Accounts 2013
108
Our remuneration at a glanceSummary of our strategic prioritiesRemuneration supports the Group’s strategic priorities, which are set out in detail in the ‘Vision, Strategy and Values’ section of this Annual Report and are summarised below:
■ In South Africa – align OMSA, Nedbank and Mutual & Federal to become the leading and most trusted financial services group ■ In Africa – build an African financial services champion, while continuing to grow in other emerging markets ■ Old Mutual Wealth – transform to build the best retail investment business in the UK ■ US Asset Management – continue to improve and grow our multi-boutique asset management business ■ Responsible business – in each of our markets become the recognised financial services leader in responsible business
Summary remuneration structure for 2014
Element Summary description Maximum as % of base pay Change in 2014
Fixe
d
Base pay Linked to agreed market benchmarks – normal annual increases are kept in line with employees of the executive’s home country
Not applicable No change in policy – increase 2.5% – 2.8%
Benefits including pension-related benefits
Fixed allowance equal to 35% of base pay for pension and other elective benefits. Core insurance and other agreed benefits are also paid
Not applicable No change in policy
Varia
ble
STI Financial (Earnings per Share (EPS) in constant currency and Return on Equity (RoE)*) plus personal scorecard measures. 50% deferred into a share incentive award for a period of three years
150% of base pay No change in policy
LTI Financial (EPS growth in pence, EPS growth in cents and RoE), strategic measures plus a Total Shareholder Return (TSR) multiplier (50% FTSE100 index and 50% JSE ALSI). 50% vest after three years and 50% after four years
250% of base pay No change in policy
* In respect of incentive targets contained within this report, EPS and RoE are calculated on a post-tax AOP basis. The measures for STI and LTI for 2014 are set out in the Implementation of remuneration policy in 2014 section of this report
Performance against targets in 2013
STI – 2013 performance year
Metric Achieved as a percentage of the range
EPS in constant currency 91.2%RoE 73.1%
Threshold 0% Maximum 100%Average total 82.1%
Outcomes for LTI awards granted in 2011 (for the performance period 2011 – 2013)
Metric Achieved as a percentage of the range
LTS business performance 74.0%Total growth in Absolute TSR 94.3%
Threshold 20% Maximum 100%Average total 84.1%
Single total figures of remuneration for 2013
Executive directorBase pay
£000Taxable benefits
£000STI
£000LTI
£000
Pension-related benefits
£000
Items in the nature of
remuneration £000
Total£000
Julian Roberts 885 68 1,123 2,400 309 4 4,789Philip Broadley 590 45 766 1,430 206 3 3,040
DIRECTORS’REMUNERATION REPORTcontinued
109
Governance
Directors’ Remuneration PolicyIntroductionThe Directors’ Remuneration Policy described in this section is intended to apply for three years, beginning on the date of the Company’s AGM in 2014, subject to shareholder approval being obtained at that meeting. The policy will be displayed on the Company’s website while it remains in force.
The committee will consider the Directors’ Remuneration Policy annually, to ensure that it remains aligned with business needs and is appropriately positioned relative to the market. However, there is currently no intention to revise the policy and seek shareholder approval more frequently than every three years.
Market benchmarksWe benchmark total potential remuneration against remuneration packages paid by peer group companies. Two peer groups are used for this purpose, namely: (i) FTSE100 companies of a similar size by market capitalisation; and (ii) large European insurers. The peer groups are kept under review to take into account different companies that enter the market or those that change their size or the main characteristics of their business.
We also look at remuneration arrangements in other types of UK-based financial sector companies.
Balancing short- and long-term remunerationBased on our view of current market practice and our remuneration principles, we have established the remuneration policy set out in this report. Fixed annual elements, including base pay and benefits, recognise the status of our executives and ensure current and future market competitiveness. STI and LTI arrangements are designed to motivate and reward them for making the Company successful on a sustainable basis.
Executive directors are also expected to retain sufficient of the vested shares from LTI and deferred STI share incentive awards, over a five-year period from the time of their appointment, to meet their respective shareholding requirements. The shareholding linkage cements the relationship between the executive directors’ personal returns and those of the Company’s investors.
The committee has discretion to amend the weighting of STI and LTI measures from year to year, in order to ensure that the executive directors are incentivised to drive performance in line with the Company’s core strategic objectives.
Directors’ Remuneration Policy table (Executive directors)
How the element supports our strategic objectives Operation of the element
Maximum potential payout and payment at threshold
Performance measures used, weighting and time period applicable
Base pay
Recognises the role and the responsibility for delivery of strategy and results
■ Paid in 12 monthly instalments ■ Reviewed annually with any changes
becoming effective from 1 January.
■ Base pay is set in the range of peer benchmark groups. The maximum is the top of the range of large European insurers
■ Maximum annual increases will not normally exceed the average increase for the home country workforce. Larger increases may be awarded in certain circumstances, such as an increase in scope or responsibility of the role, or salary progression for a newly appointed director.
■ None
Benefits allowance for retirement provision and other elective benefits
Designed to provide appropriate, market-aligned benefits consistent with the role
■ The Company provides a benefit allowance to fund contributions to retirement funding arrangements and other elective benefits
■ Otherwise paid monthly in cash.
■ A fixed allowance of 35% of base pay. ■ None
Other benefits ■ Benefits common to employees of the home
employer, health assessments and the opportunity to participate in Sharesave
■ Travel from home to work, and travel for partners to certain Board meetings or corporate events of the Company and its major subsidiaries
■ For overseas appointments, flexibility to provide benefits in line with those of the executive’s home country and relocation costs for internal or external appointments of executive directors.
■ The cost of core insured benefits is determined by the insurance provider based on experience factors in the pool of employees covered and so may vary from year to year
■ The Company offers the opportunity to participate in a HMRC-approved Sharesave scheme
■ All other benefits are direct costs borne by the Company based on policy agreed by the committee
■ A summary of key items normally paid for on relocation is set out in the Approach to remuneration in connection with recruitment section of this report.
■ None
Old Mutual plcAnnual Report and Accounts 2013
110
How the element supports our strategic objectives Operation of the element
Maximum potential payout and payment at threshold
Performance measures used, weighting and time period applicable
Short-term incentive (STI)
Incentivises achievement of annually agreed business objectives and strategic priorities
■ Determined annually following the finalisation of annual results
■ 50% of the award vests immediately ■ 50% is deferred for a period of three
years into a share incentive award. Dividends are paid during the restricted period and malus applies to the shares held under award prior to vesting
■ The committee has the discretion to amend deferred STI awards under the rules of the plan, to adjust deferred STI awards in the event of any variation of the share capital of the Company, and to adjust or vest deferred STI awards on a demerger, special dividend or other similar event, which affects the market price of the shares to a material extent.
■ The maximum opportunity is 150% of base pay ■ Vesting against targets is 0% at threshold and 100%
at stretching targets, with interpolation between the points
■ The committee has discretion: — to amend, and/or set different performance
measures for material changes (such as a change in strategy, acquisition, divestment or market conditions), if it considers such amendments necessary to achieve the original purpose and any new measures are not materially less difficult to satisfy
— to adjust the outcome, if it is not aligned to the overall performance of the Company
■ Any use of the discretions would, where relevant, be explained in the Annual Report on Remuneration and may, as appropriate, be the subject of consultation with the Company’s major shareholders.
■ Annual measures include:Financial (minimum 50%):
— EPS in constant currency — RoE
Strategic and operational: — Measures of individual
performance (set out in the director’s personal scorecard)
■ The committee has discretion to vary the weighting of the performance measures over the life of the Directors’ Remuneration Policy
■ The committee has discretion to reduce STI outcomes based on assessment of risk exposures.
Long-term incentive (LTI)
Incentivises attainment of long-term objectives and strengthens the alignment of interests between executive directors and shareholders
■ Annual grants of share incentive awards or options over Old Mutual plc shares
■ Vesting is subject to the achievement of performance targets measured after a three-year period
■ Vesting occurs 50% after three years and 50% after four years. Malus applies to the shares held under option or award prior to vesting
■ The committee has discretion: — Before the grant of an award, to
decide that a participant shall be entitled to receive dividend equivalents
— to amend awards under the rules of the plan, to adjust awards in the event of any variation of the share capital of the Company, and to adjust or vest awards on a demerger, special dividend or other similar event which affects the market price of the shares to a material extent.
■ Maximum annual grants will not normally exceed a face value of 250% of base pay, inclusive of the maximum TSR adjuster being applied
■ In exceptional circumstances, or on recruitment, the committee may grant awards with a face value of up to 400% of base pay, inclusive of the maximum TSR adjuster being applied. This is in addition to the buying out of unvested awards from a previous employer
■ Vesting is 0% at threshold and 100% at stretching targets, with interpolation between the points
■ The committee has discretion: — to amend, and/or set different performance
measures for material changes (such as a change in strategy, acquisition, divestment or market conditions), if it considers such amendments necessary to achieve the original purpose and any new measures are not materially less difficult to satisfy
— to adjust the outcome, if it is not aligned to the overall performance of the Company
■ Any use of the discretions would, where relevant, be explained in the Annual Report on Remuneration and may, as appropriate, be the subject of consultation with the Company’s major shareholders.
■ Awards granted from 2013 onwards:
— Financial (60%) — Strategic (40%) — TSR multiplier against the
FTSE100 index (50%) and the JSE ALSI (50%)
■ Awards granted in 2012: — Cumulative growth over three
years in post tax AOP on a constant currency basis
— TSR multiplier against the FTSE100 index (50%) and the JSE ALSI (50%)
■ The committee has discretion to vary the weighting of performance measures over the life of the Directors’ Remuneration Policy.
Directors’ Remuneration Policy table (Executive directors) continued
DIRECTORS’REMUNERATION REPORTcontinued
111
Governance
How the element supports our strategic objectives Operation of the element
Maximum potential payout and payment at threshold
Performance measures used, weighting and time period applicable
Shareholding requirement
To strengthen alignment of interests between executive directors and shareholders
■ The minimum shareholding requirement as a percentage of base pay is to be achieved within five years of appointment to the role as follows:
— Group Chief Executive – 200% — Other executive directors – 150%
■ Unvested and vested but unexercised share awards or options are not taken into account in the calculation.
■ None ■ None
Provisions of previous policy that will continue to apply
Any commitment made before: (i) 27 June 2012; or (ii) the individual becoming an executive director of the Company; and any vesting of outstanding share incentive awards, will be honoured, even where it is not consistent with the policy prevailing at the time such commitment is fulfilled or such vesting occurs.
Malus provision
All LTI and deferred STI awards contain a malus provision, which gives the committee the power to reduce awards if the results on which they were based were misleading or materially incorrect or were subsequently found to have relied on poor risk management or material misrepresentation of performance.
Directors’ Remuneration Policy table (Executive directors) continued
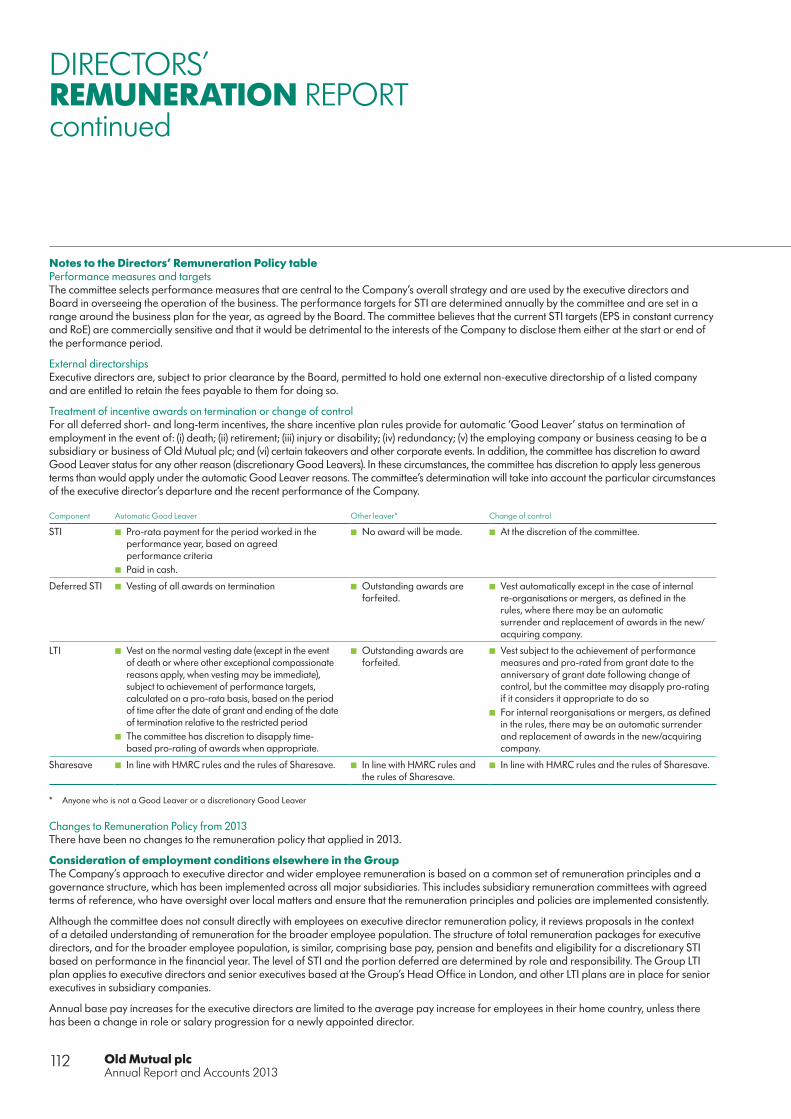
Old Mutual plcAnnual Report and Accounts 2013
112
Notes to the Directors’ Remuneration Policy table Performance measures and targetsThe committee selects performance measures that are central to the Company’s overall strategy and are used by the executive directors and Board in overseeing the operation of the business. The performance targets for STI are determined annually by the committee and are set in a range around the business plan for the year, as agreed by the Board. The committee believes that the current STI targets (EPS in constant currency and RoE) are commercially sensitive and that it would be detrimental to the interests of the Company to disclose them either at the start or end of the performance period.
External directorshipsExecutive directors are, subject to prior clearance by the Board, permitted to hold one external non-executive directorship of a listed company and are entitled to retain the fees payable to them for doing so.
Treatment of incentive awards on termination or change of controlFor all deferred short- and long-term incentives, the share incentive plan rules provide for automatic ‘Good Leaver’ status on termination of employment in the event of: (i) death; (ii) retirement; (iii) injury or disability; (iv) redundancy; (v) the employing company or business ceasing to be a subsidiary or business of Old Mutual plc; and (vi) certain takeovers and other corporate events. In addition, the committee has discretion to award Good Leaver status for any other reason (discretionary Good Leavers). In these circumstances, the committee has discretion to apply less generous terms than would apply under the automatic Good Leaver reasons. The committee’s determination will take into account the particular circumstances of the executive director’s departure and the recent performance of the Company.
Component Automatic Good Leaver Other leaver* Change of control
STI ■ Pro-rata payment for the period worked in the performance year, based on agreed performance criteria
■ Paid in cash.
■ No award will be made. ■ At the discretion of the committee.
Deferred STI ■ Vesting of all awards on termination ■ Outstanding awards are forfeited.
■ Vest automatically except in the case of internal re-organisations or mergers, as defined in the rules, where there may be an automatic surrender and replacement of awards in the new/acquiring company.
LTI ■ Vest on the normal vesting date (except in the event of death or where other exceptional compassionate reasons apply, when vesting may be immediate), subject to achievement of performance targets, calculated on a pro-rata basis, based on the period of time after the date of grant and ending of the date of termination relative to the restricted period
■ The committee has discretion to disapply time-based pro-rating of awards when appropriate.
■ Outstanding awards are forfeited.
■ Vest subject to the achievement of performance measures and pro-rated from grant date to the anniversary of grant date following change of control, but the committee may disapply pro-rating if it considers it appropriate to do so
■ For internal reorganisations or mergers, as defined in the rules, there may be an automatic surrender and replacement of awards in the new/acquiring company.
Sharesave ■ In line with HMRC rules and the rules of Sharesave. ■ In line with HMRC rules and the rules of Sharesave.
■ In line with HMRC rules and the rules of Sharesave.
* Anyone who is not a Good Leaver or a discretionary Good Leaver
Changes to Remuneration Policy from 2013 There have been no changes to the remuneration policy that applied in 2013.
Consideration of employment conditions elsewhere in the GroupThe Company’s approach to executive director and wider employee remuneration is based on a common set of remuneration principles and a governance structure, which has been implemented across all major subsidiaries. This includes subsidiary remuneration committees with agreed terms of reference, who have oversight over local matters and ensure that the remuneration principles and policies are implemented consistently.
Although the committee does not consult directly with employees on executive director remuneration policy, it reviews proposals in the context of a detailed understanding of remuneration for the broader employee population. The structure of total remuneration packages for executive directors, and for the broader employee population, is similar, comprising base pay, pension and benefits and eligibility for a discretionary STI based on performance in the financial year. The level of STI and the portion deferred are determined by role and responsibility. The Group LTI plan applies to executive directors and senior executives based at the Group’s Head Office in London, and other LTI plans are in place for senior executives in subsidiary companies.
Annual base pay increases for the executive directors are limited to the average pay increase for employees in their home country, unless there has been a change in role or salary progression for a newly appointed director.
DIRECTORS’REMUNERATION REPORTcontinued

113
Governance
Approach to remuneration in connection with recruitmentThe committee’s approach to remuneration in connection with recruitment is to pay no more than is necessary to attract appropriate candidates to the role. It should be noted that the Company operates in a specialised sector and many of its competitors for talent are from outside the UK. Remuneration terms for any new executive directors will be based on the approved remuneration policy and would include the same elements, and be subject to the same constraints, as those of the existing executive directors as shown below:
Element of remuneration Maximum percentage of base pay
Base pay
Benefit allowance (for retirement, elective benefits or in cash) 35%
Other benefits Dependent on circumstances and location
STI 150%
LTI 250% (400% in exceptional circumstances)
When it is necessary to ‘buy out’ an individual’s unvested awards from a previous employer, the committee will seek to match the expected value of the awards by granting awards that vest over a time frame similar to those given up, with a commensurate reduction in quantum where the new awards will be subject to performance conditions that are not as stretching as those applicable to the awards given up. Existing annual incentive given up may be bought out on an expected value basis or, at the discretion of the committee, through a guaranteed STI award for the first performance year only.
Where appropriate, the committee will agree reasonable costs of relocation in line with the Group’s mobility policy, which based on individual circumstances, provides for a settling-in allowance and costs incurred such as travel, shipping, immigration and tax advice, temporary housing, transaction costs on home sale/purchase, home/school search and school fees and, if in relation to a temporary assignment, tax equalisation and a housing allowance. All of these costs will be covered gross of tax incurred by the executive, where applicable.
Service agreements and payment for loss of officeExecutive directors’ service agreements are designed to provide an appropriate level of protection for the executive and the Company by: (i) setting out individual entitlements to elements of remuneration consistent with policy; (ii) summarising notice periods and compensation on termination of employment by the Company; and (iii) describing the obligations in relation to confidentiality, data protection, intellectual property and restraint on certain activities. Service agreements for the current executive directors are available on the Company’s website (www.oldmutual.com).
In the event that the employment of an executive director is terminated, any compensation payable will be determined in accordance with the terms of the service agreement between the Company and the executive director, as well as the rules of any incentive plans. The Company’s policy is to make payments in accordance with pre-established contractual arrangements, but with consideration of individual circumstances. These circumstances may include the reason for termination and, for deferred STI and LTI share incentive awards, some discretion in the determination of Good Leaver status for vesting of such awards. The policy in this respect is set out in the table below:
Standard provision Policy Details Other provisions in contract
Notice ■ Policy is to provide a maximum of 12 months’ notice.
■ In certain cases, executive directors will not be required to work their notice period and, depending on circumstance, may be put on ‘garden leave’ or granted pay in lieu of all or part of their notice period (PILON). PILON, including base pay, benefits and pension-related benefits, would normally be paid monthly and be subject to mitigation when alternative employment is secured but may also be paid as a lump sum
■ Executive directors are generally subject to annual re-election at the Company’s Annual General Meeting.
■ Current contractual terms were agreed prior to 27 June 2012 and, in the absence of certain conditions relating to ill-health or accident, provide both current executive directors with notice by the Company of 12 months and notice to the Company of 12 months by Julian Roberts and six months by Philip Broadley.
Treatment of STI awards
■ STI awards will be made to Good Leavers based on an overall assessment of corporate and personal performance and pro-rated for the period worked in the performance year of termination.
■ Paid in cash. ■ In the event of termination by the Company with PILON, or on garden leave, both Julian Roberts’ and Philip Broadley’s contracts (agreed prior to 27 June 2012), provide for payment of STI for the notice period. The value to be paid will be determined by the committee based on the terms set out in the contracts.
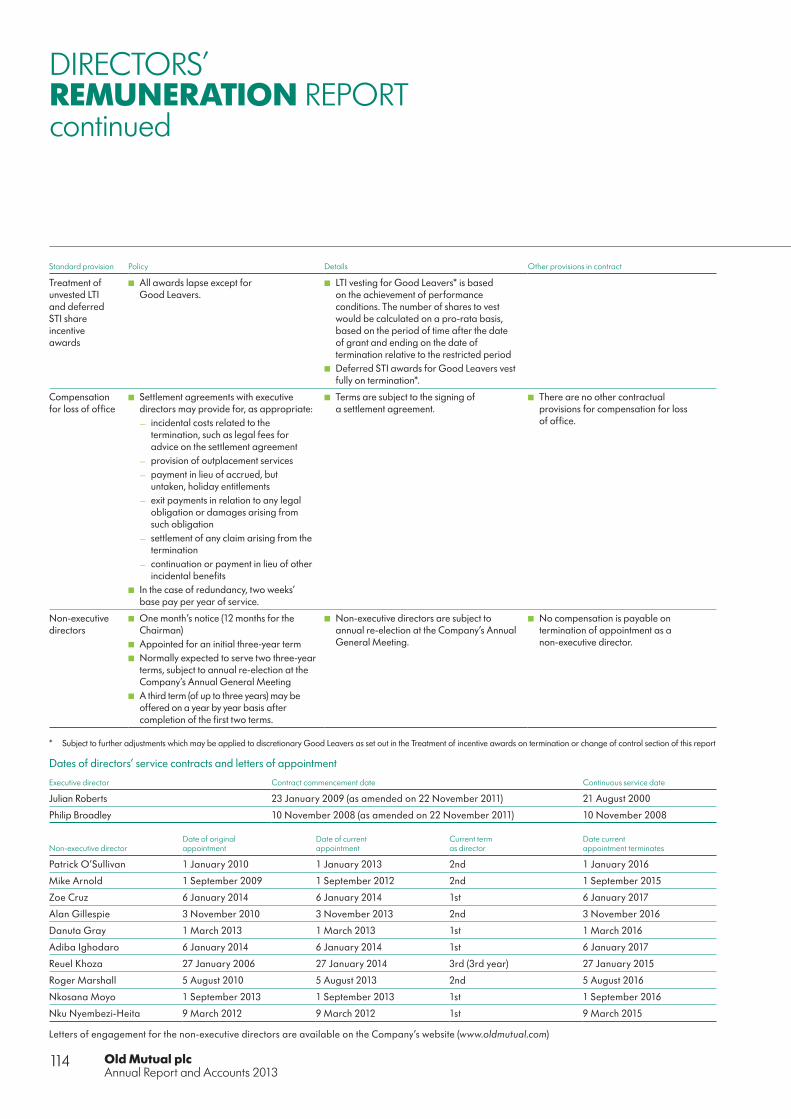
Old Mutual plcAnnual Report and Accounts 2013
114
Standard provision Policy Details Other provisions in contract
Treatment of unvested LTI and deferred STI share incentive awards
■ All awards lapse except for Good Leavers.
■ LTI vesting for Good Leavers* is based on the achievement of performance conditions. The number of shares to vest would be calculated on a pro-rata basis, based on the period of time after the date of grant and ending on the date of termination relative to the restricted period
■ Deferred STI awards for Good Leavers vest fully on termination*.
Compensation for loss of office
■ Settlement agreements with executive directors may provide for, as appropriate:
— incidental costs related to the termination, such as legal fees for advice on the settlement agreement
— provision of outplacement services — payment in lieu of accrued, but
untaken, holiday entitlements — exit payments in relation to any legal
obligation or damages arising from such obligation
— settlement of any claim arising from the termination
— continuation or payment in lieu of other incidental benefits
■ In the case of redundancy, two weeks’ base pay per year of service.
■ Terms are subject to the signing of a settlement agreement.
■ There are no other contractual provisions for compensation for loss of office.
Non-executive directors
■ One month’s notice (12 months for the Chairman)
■ Appointed for an initial three-year term ■ Normally expected to serve two three-year
terms, subject to annual re-election at the Company’s Annual General Meeting
■ A third term (of up to three years) may be offered on a year by year basis after completion of the first two terms.
■ Non-executive directors are subject to annual re-election at the Company’s Annual General Meeting.
■ No compensation is payable on termination of appointment as a non-executive director.
* Subject to further adjustments which may be applied to discretionary Good Leavers as set out in the Treatment of incentive awards on termination or change of control section of this report
Dates of directors’ service contracts and letters of appointment
Executive director Contract commencement date Continuous service date
Julian Roberts 23 January 2009 (as amended on 22 November 2011) 21 August 2000
Philip Broadley 10 November 2008 (as amended on 22 November 2011) 10 November 2008
Non-executive directorDate of original appointment
Date of current appointment
Current term as director
Date current appointment terminates
Patrick O’Sullivan 1 January 2010 1 January 2013 2nd 1 January 2016
Mike Arnold 1 September 2009 1 September 2012 2nd 1 September 2015
Zoe Cruz 6 January 2014 6 January 2014 1st 6 January 2017
Alan Gillespie 3 November 2010 3 November 2013 2nd 3 November 2016
Danuta Gray 1 March 2013 1 March 2013 1st 1 March 2016
Adiba Ighodaro 6 January 2014 6 January 2014 1st 6 January 2017
Reuel Khoza 27 January 2006 27 January 2014 3rd (3rd year) 27 January 2015
Roger Marshall 5 August 2010 5 August 2013 2nd 5 August 2016
Nkosana Moyo 1 September 2013 1 September 2013 1st 1 September 2016
Nku Nyembezi-Heita 9 March 2012 9 March 2012 1st 9 March 2015
Letters of engagement for the non-executive directors are available on the Company’s website (www.oldmutual.com)
DIRECTORS’REMUNERATION REPORTcontinued

115
Governance
Illustrations of application of remuneration policyThe chart below shows the potential value of the executive directors’ remuneration in three scenarios, which in respect of share incentive awards, do not reflect share price movements between the date of grant and the date of vesting. A significant proportion of the potential remuneration of the executive directors is variable and is therefore performance-related and at risk. 60% of total remuneration is variable when performance is ‘in line with expectations’, and 74% at ‘maximum’ award. An LTI award has been shown in respect of the Group Finance Director, in order to illustrate the full-year remuneration, however, no LTI award will be granted to Philip Broadley because of his planned departure from the Group during 2014.
£0
£1,000,000
£2,000,000
£3,000,000
£4,000,000
£5,000,000
£6,000,000 Long-term incentiveShort-term incentiveBase pay and benefits (including pension-related benefits)
Minimum1 In-line with
expectations2
Maximum3 Minimum1 In-line with
expectations2
Maximum3
Group Finance DirectorGroup Chief Executive
100% 40% 26%100% 40% 26%
25% 28%
28%25%
35%
46%
£1,300,677
£3,257,177
£4,940,677
£864,251
£2,165,001
£3,284,251
46%
35%
1 ‘Minimum’ pay is equal to base pay and benefit allowance for the current executive directors at 1 January 2014, plus the value of other benefits received in 20132 ‘In-line with expectations’ represents 60% of the maximum STI and 50% vesting of the LTI, plus the minimum pay figure3 ‘Maximum’ pay represents the maximum STI and 100% vesting of the LTI, plus the minimum pay figure
Directors’ Remuneration Policy table (Non-executive directors)
How the element supports our strategic objectives Operation of the elements (fees and benefits) Maximum potential payout
Performance measures used, weighting and time period applicable
To attract non-executive directors who have the broad range of experience and skills required to oversee the implementation of the strategy.
■ Fees for non-executive directors (other than the Chairman) are set by the Board and paid in 12 monthly instalments
■ The Chairman’s fees are set by the committee and paid in 12 monthly instalments
■ Travel for partners to a limited number of Board meetings or corporate events of the Company and its major subsidiaries.
■ Fees are set within the range of comparative board and committee fees, benchmarked against an appropriate group of FTSE100 companies. Average increases will not normally exceed the average increase for the UK workforce, except where:
— committee roles or responsibilities change significantly; or
— market fees in relation to certain roles change significantly
■ Non-executive directors may hold positions on the boards of subsidiary companies and are entitled to retain the fees payable to them for doing so.
■ Non-executive directors are not eligible to participate in performance-related incentive plans.
Consideration of shareholder viewsThe committee considers shareholder feedback in relation to the Directors’ Remuneration Report for the prior year at its first meeting following the AGM. This feedback, as well as any additional feedback received during any other meetings with shareholders, is then considered as part of the Company’s annual review of remuneration arrangements for the following year. Where any significant change is proposed, the Chairman of the committee will inform major shareholders in advance, and will offer a meeting to discuss these.
During 2013, the committee took into account feedback it received from investors in consultation, firstly in relation to the vesting outcome of the OMSIP that specifically dealt with the strategic initiatives undertaken by the Group for the period 2010 to 2012, and secondly on the new LTI performance measures introduced in 2013 which will continue in 2014.
In relation to the Directors’ Remuneration Policy, no significant changes are proposed and accordingly, no detailed consultation has been undertaken.
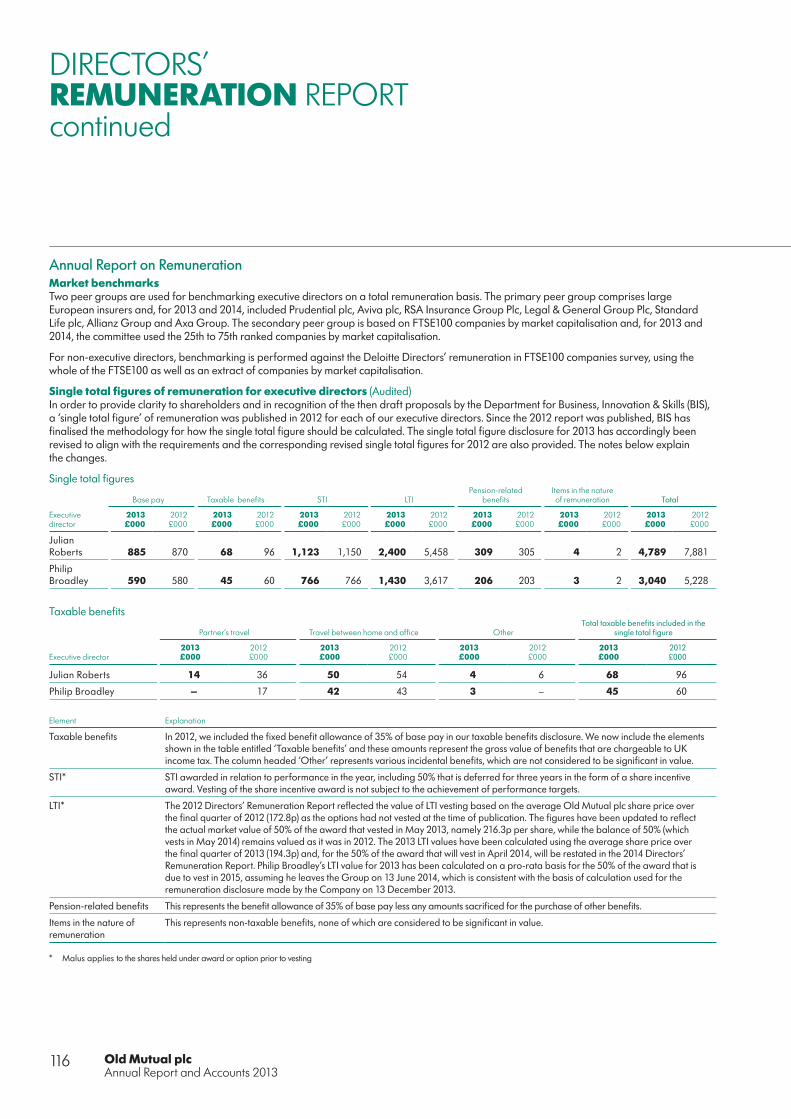
Old Mutual plcAnnual Report and Accounts 2013
116
Annual Report on RemunerationMarket benchmarks Two peer groups are used for benchmarking executive directors on a total remuneration basis. The primary peer group comprises large European insurers and, for 2013 and 2014, included Prudential plc, Aviva plc, RSA Insurance Group Plc, Legal & General Group Plc, Standard Life plc, Allianz Group and Axa Group. The secondary peer group is based on FTSE100 companies by market capitalisation and, for 2013 and 2014, the committee used the 25th to 75th ranked companies by market capitalisation.
For non-executive directors, benchmarking is performed against the Deloitte Directors’ remuneration in FTSE100 companies survey, using the whole of the FTSE100 as well as an extract of companies by market capitalisation.
Single total figures of remuneration for executive directors (Audited)In order to provide clarity to shareholders and in recognition of the then draft proposals by the Department for Business, Innovation & Skills (BIS), a ‘single total figure’ of remuneration was published in 2012 for each of our executive directors. Since the 2012 report was published, BIS has finalised the methodology for how the single total figure should be calculated. The single total figure disclosure for 2013 has accordingly been revised to align with the requirements and the corresponding revised single total figures for 2012 are also provided. The notes below explain the changes.
Single total figures
Base pay Taxable benefits STI LTIPension-related
benefitsItems in the nature of remuneration Total
Executive director
2013£000
2012£000
2013£000
2012£000
2013£000
2012£000
2013£000
2012£000
2013£000
2012£000
2013£000
2012£000
2013£000
2012£000
JulianRoberts 885 870 68 96 1,123 1,150 2,400 5,458 309 305 4 2 4,789 7,881
PhilipBroadley 590 580 45 60 766 766 1,430 3,617 206 203 3 2 3,040 5,228
Taxable benefits
Partner’s travel Travel between home and office OtherTotal taxable benefits included in the
single total figure
Executive director2013£000
2012£000
2013 £000
2012 £000
2013£000
2012£000
2013£000
2012£000
Julian Roberts 14 36 50 54 4 6 68 96
Philip Broadley – 17 42 43 3 – 45 60
Element Explanation
Taxable benefits In 2012, we included the fixed benefit allowance of 35% of base pay in our taxable benefits disclosure. We now include the elements shown in the table entitled ‘Taxable benefits’ and these amounts represent the gross value of benefits that are chargeable to UK income tax. The column headed ‘Other’ represents various incidental benefits, which are not considered to be significant in value.
STI* STI awarded in relation to performance in the year, including 50% that is deferred for three years in the form of a share incentive award. Vesting of the share incentive award is not subject to the achievement of performance targets.
LTI* The 2012 Directors’ Remuneration Report reflected the value of LTI vesting based on the average Old Mutual plc share price over the final quarter of 2012 (172.8p) as the options had not vested at the time of publication. The figures have been updated to reflect the actual market value of 50% of the award that vested in May 2013, namely 216.3p per share, while the balance of 50% (which vests in May 2014) remains valued as it was in 2012. The 2013 LTI values have been calculated using the average share price over the final quarter of 2013 (194.3p) and, for the 50% of the award that will vest in April 2014, will be restated in the 2014 Directors’ Remuneration Report. Philip Broadley’s LTI value for 2013 has been calculated on a pro-rata basis for the 50% of the award that is due to vest in 2015, assuming he leaves the Group on 13 June 2014, which is consistent with the basis of calculation used for the remuneration disclosure made by the Company on 13 December 2013.
Pension-related benefits This represents the benefit allowance of 35% of base pay less any amounts sacrificed for the purchase of other benefits.
Items in the nature of remuneration
This represents non-taxable benefits, none of which are considered to be significant in value.
* Malus applies to the shares held under award or option prior to vesting
DIRECTORS’REMUNERATION REPORTcontinued
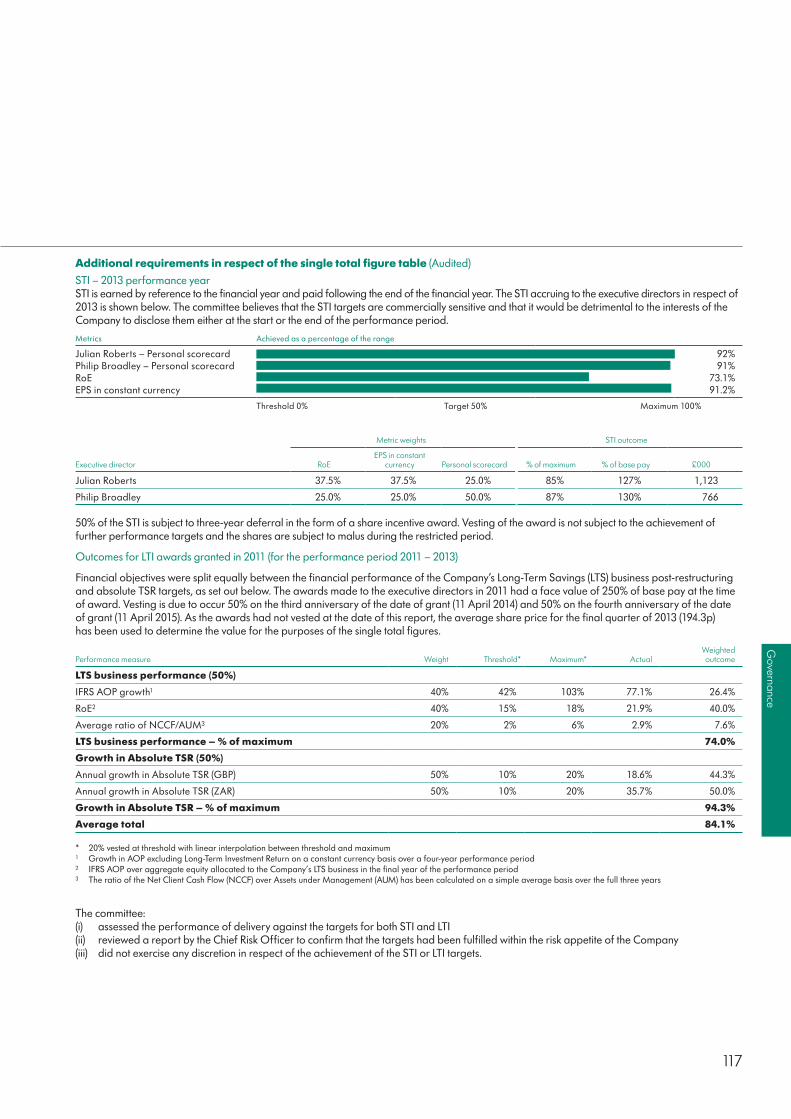
117
Governance
Additional requirements in respect of the single total figure table (Audited)
STI – 2013 performance yearSTI is earned by reference to the financial year and paid following the end of the financial year. The STI accruing to the executive directors in respect of 2013 is shown below. The committee believes that the STI targets are commercially sensitive and that it would be detrimental to the interests of the Company to disclose them either at the start or the end of the performance period.
Metrics Achieved as a percentage of the range
Julian Roberts – Personal scorecard 92%Philip Broadley – Personal scorecard 91%RoE 73.1%EPS in constant currency 91.2%
Threshold 0% Target 50% Maximum 100%
Metric weights STI outcome
Executive director RoEEPS in constant
currency Personal scorecard % of maximum % of base pay £000
Julian Roberts 37.5% 37.5% 25.0% 85% 127% 1,123
Philip Broadley 25.0% 25.0% 50.0% 87% 130% 766
50% of the STI is subject to three-year deferral in the form of a share incentive award. Vesting of the award is not subject to the achievement of further performance targets and the shares are subject to malus during the restricted period.
Outcomes for LTI awards granted in 2011 (for the performance period 2011 – 2013)
Financial objectives were split equally between the financial performance of the Company’s Long-Term Savings (LTS) business post-restructuring and absolute TSR targets, as set out below. The awards made to the executive directors in 2011 had a face value of 250% of base pay at the time of award. Vesting is due to occur 50% on the third anniversary of the date of grant (11 April 2014) and 50% on the fourth anniversary of the date of grant (11 April 2015). As the awards had not vested at the date of this report, the average share price for the final quarter of 2013 (194.3p) has been used to determine the value for the purposes of the single total figures.
Performance measure Weight Threshold* Maximum* ActualWeighted outcome
LTS business performance (50%)
IFRS AOP growth1 40% 42% 103% 77.1% 26.4%
RoE2 40% 15% 18% 21.9% 40.0%
Average ratio of NCCF/AUM3 20% 2% 6% 2.9% 7.6%
LTS business performance – % of maximum 74.0%
Growth in Absolute TSR (50%)
Annual growth in Absolute TSR (GBP) 50% 10% 20% 18.6% 44.3%
Annual growth in Absolute TSR (ZAR) 50% 10% 20% 35.7% 50.0%
Growth in Absolute TSR – % of maximum 94.3%
Average total 84.1%
* 20% vested at threshold with linear interpolation between threshold and maximum1 Growth in AOP excluding Long-Term Investment Return on a constant currency basis over a four-year performance period2 IFRS AOP over aggregate equity allocated to the Company’s LTS business in the final year of the performance period3 The ratio of the Net Client Cash Flow (NCCF) over Assets under Management (AUM) has been calculated on a simple average basis over the full three years
The committee: (i) assessed the performance of delivery against the targets for both STI and LTI(ii) reviewed a report by the Chief Risk Officer to confirm that the targets had been fulfilled within the risk appetite of the Company(iii) did not exercise any discretion in respect of the achievement of the STI or LTI targets.

Old Mutual plcAnnual Report and Accounts 2013
118
2011 LTI awards due to vest to the executive directors
Executive director
Shares under option
at grant
Achievement of performance
targets
Shares under option to vest in
2014
Shares under option to vest in
2015
Average Old Mutual plc share
price over Q4 2013
Value of share options to vest in
2014£000
Value of share options to vest in
2015£000
Total value of LTI as shown in
the single figure table£000
Julian Roberts 1,468,556 84.1% 617,528 617,528 194.3p 1,200 1,200 2,400
Philip Broadley 976,158 84.1% 410,474 325,626 194.3p 797 633 1,430
The 2013 LTI values have been calculated using the average share price over the final quarter of 2013 (194.3p) and, for the 50% of the award that will vest in April 2014, will be restated in the 2014 Directors’ Remuneration Report once the actual values on vesting are known. Philip Broadley’s vesting for 2015 has been calculated on a pro-rata basis, assuming he leaves the Group on 13 June 2014, which is consistent with the basis of calculation used for the remuneration disclosure made by the Company on 13 December 2013.
Single total figures of remuneration for non-executive directors (Audited)Non-executive directors do not participate in any of the Company’s incentive arrangements, nor do they receive any benefits, other than the provision of partner’s travel to certain agreed Board meetings or other corporate events of the Company and its major subsidiaries. The table below shows the single total figures for both 2012 and 2013 for the Chairman and the other non-executive directors:
Fees Taxable benefits Total
Non-executive director2013£000
2012£000
2013£000
2012£000
2013£000
2012£000
Patrick O’Sullivan 360 350 – – 360 350
Mike Arnold 95 93 – – 95 93
Alan Gillespie 99 84 – – 99 84
Danuta Gray 65 – – – 65 –
Reuel Khoza 3402 3652 – – 3402 3652
Roger Marshall 103 96 – – 103 96
Nkosana Moyo 23 – – – 23 –
Nku Nyembezi-Heita 66 45 – – 66 45
Former non-executive directors
Eva Castillo (Resigned February 2013) 13 72 – – 13 72
Russell Edey (Retired May 2013) 40 88 – – 40 88
Lars Otterbeck (Retired May 2013) 32 1523 24 – 34 1523
Bongani Nqwababa (Resigned January 2014) 78 74 – – 78 74
1 Neither the Chairman nor any of the other non-executive directors received any pension-related benefits, short- or long-term incentives or any other items in the nature of remuneration in 2012 or 2013
2 Includes fees of £272,000 (£299,000 in 2012) in respect of Nedbank Group Limited3 Includes fees of £80,000 in respect of Skandia Insurance Company Limited, SkandiaBanken and Skandia Liv4 Represents partner’s travel in 2013
DIRECTORS’REMUNERATION REPORTcontinued

119
Governance
Scheme interests awarded during 2013 (Audited)The following table shows LTI awards in the form of nil cost share options and deferred STI awards in the form of forfeitable shares awards, granted to the executive directors during 2013. The awards were all granted in accordance with the STI and LTI grant policies set out above and the number of shares under award or option was calculated using the middle market quotation (MMQ) of Old Mutual plc shares on the business day preceding the date of grant, namely 194.4p per share.
Date of grant Award type Basis of award
Shares held under option
or award
Face value at date of grant
£000
% receivable if minimum
performance is achieved Vesting date
The end of the period over which the performance
targets have to be fulfilled
Julian Roberts
8 April 2013 Nil cost share optionLTI(250% of base pay) 1,138,118 2,213 0%
50% – 8 April 201650% – 8 April 2017 31 December 2015
8 April 2013 Forfeitable shares awardDeferred STI(50% of STI) 295,874 575 100% 8 April 2016 N/A
Philip Broadley
8 April 2013 Nil cost share optionLTI(250% of base pay) 758,746 1,475 0%
50% – 8 April 201650% – 8 April 2017 31 December 2015
8 April 2013 Forfeitable shares awardDeferred STI(50% of STI) 197,138 383 100% 8 April 2016 N/A
LTI performance targets for 2013 awards
LTI Scorecard Threshold Target Maximum Weight
Fina
ncia
l EPS (p) (CAGR*) (post-tax) 5.0% 7.5% 10.0% 15.0%
EPS (c) (CAGR*) (post-tax) 5.0% 7.5% 10.0% 15.0%
RoE – (averaged over three years) 12.0% 13.5% 15.0% 30.0%
Stra
tegi
c ob
ject
ives
1. Emerging Markets – Africa expansion (excluding banking)
Customer growth in Africa (excluding SA) (CAGR*) 10.0% 15.0% 20.0% 10.0%
Profit (AOP) growth in Africa (excluding SA) (CAGR*) (pre-tax including LTIR) 10.0% 15.0% 20.0% 5.0%
2. Old Mutual Wealth
Profit (AOP) growth UK and International (CAGR*) (pre-tax) 10.0% 15.0% 20.0% 7.5%
3. Simplify/de-risk the Group
Group structural changes/key initiativesTargets disclosed at the end of the
three-year performance period 12.5%
4. Risk, governance, culture and reputation
Measures of risk, governance, culture and reputation Assessed against measures and qualitatively 5.0%
Total 100%
* Compound annual growth over the three-year performance period
TSR multiplier*A TSR multiplier will be used to adjust the weighted average outcome of the LTI scorecard in the table above, as follows. TSR will be averaged at the start (Q4 2012) and end (Q4 2015) of the three-year performance period. The awards for the executive directors, inclusive of this TSR multiplier, were equal in value to 250% of base pay at the date of award.
Relative TSR vs. index Multiplier
Threshold 4% or more below index 0.85
Target equal to index 1.00
Maximum 4% or more above index 1.15
* Relative TSR performance (calculated 50% against the FTSE100 index and 50% against the JSE ALSI) against the above ranges, with a multiplier being set on a linear basis between the points

Old Mutual plcAnnual Report and Accounts 2013
120
Payments to past directors (Audited)There were no payments to past directors during 2013.
Payments for loss of office (Audited)There were no payments for loss of office paid to directors during 2013.
Shares in trust and shareholder dilutionThere are currently 136,831,473 shares held in employee share ownership trusts (ESOTs) for the purposes of collaterising some of the obligations under the Group’s employee share incentive schemes. The strategy is to ensure that, with the exception of Black Economic Empowerment-related ESOTs, at least sufficient shares are held to satisfy restricted share/forfeitable shares awards. In calculating dilution limits, any awards that are satisfied by transfer of pre-existing issued shares (such as shares acquired by market purchase through ESOTs) and any shares comprised in any share option or share award that has lapsed or has been cash-settled are disregarded. At 31 December 2013, the Company had 2.07% of share capital available under the 5%-in-10-years limit applicable to discretionary share incentive schemes and 6.37% of share capital available under the 10%-in-10-years limit applicable to all share incentive schemes. The Company has complied with the limits at all times.
Directors’ shareholdings and share interests (Audited)Within a period of five years of appointment to the role, the Group Chief Executive is required to build up a holding of shares in the Company equal in value to 200% of base pay, and the equivalent figure for other executive directors is 150% of base pay. Unvested share awards or share options and vested but unexercised share options are excluded for the purposes of the calculations. There is no requirement for executive directors to hold shares or share interests in the Company once they have ceased employment with the Group.
The following table illustrates that both Julian Roberts and Philip Broadley met their respective requirements at 31 December 2013. Shares have been valued for these purposes at the year-end price, which was 189.1p per share. There have been no changes to the directors’ shareholdings between 31 December 2013 and 28 February 2014, however, 15.9% of the nil cost share options granted in 2011 lapsed due to the partial achievement of performance targets, as set out in the 2011 LTI awards due to vest to the executive directors section of this report.
Executive director
Share ownership requirement
(% of base pay)Number of shares
required to be held
Number of sharesowned outright
(including byconnected persons)
Share ownershiprequirement met
Vested butunexercised
share options
Forfeitableshares awards
not subject toperformance
targets1
Nil cost shareoptions subject to
performancetargets2
Sharesave share optionsnot subject toperformance
targets3
Julian Roberts 200% 936,013 1,965,397 Yes – 990,546 5,393,949 48,906
Philip Broadley4 150% 468,006 513,434 Yes – 642,844 3,587,453 –
1 Forfeitable shares awards are granted each year in relation to the deferred element of the STI. Julian Roberts and Philip Broadley hold awards granted on 11 April 2011 (with a market value per share at grant of 144.7p), 10 April 2012 (157.1p) and 8 April 2013 (194.4p). Awards vest on the third anniversary of the date of award
2 Nil cost share options are granted each year in relation to the LTI. Market value share options are no longer granted to executive directors. Julian Roberts and Philip Broadley hold nil cost share options granted on 13 May 2010 (with a market value per share at grant of 119p), 11 April 2011 (144.7p), 10 April 2012 (157.1p) and 8 April 2013 (194.4p). The total shares held under option include the unvested options granted under the OMSIP in 2010 and 2011, for which the performance targets were partially achieved. Vesting of the nil cost share options occurs 50% on the third anniversary and 50% on the fourth anniversary of the date of grant
3 Julian Roberts holds an HMRC-approved share option under the Old Mutual plc 2008 Sharesave Plan, originally granted on 9 April 2009 with an exercise price of 32p per share. The exercise price was determined at 20% below the average of the Company’s share price between 16 and 18 March 2009. This option will become exercisable on 1 June 2014
4 Philip Broadley will leave the Group during 2014 and, as announced on 13 December 2013: (i) his outstanding forfeitable shares awards will vest on their normal vesting dates; and (ii) his outstanding nil cost share options will be subject to pro-rating for the period employed during the restricted period and will, subject to the achievement of the performance targets, become exercisable for a period of 12 months commencing on the normal vesting dates, provided he has not taken up employment with a competitor without the express permission of the committee
Share options exercised during 2013The following table shows all share options exercised by the executive directors during 2013:
Executive director Type of option Date of grant Shares exercised Exercise dateShare price at
date of exerciseTaxable gain*
£000
Julian Roberts Nil cost 13 May 2010 1,402,805 13 May 2013 216.283p 3,034
Philip Broadley Nil cost 13 May 2010 929,571 13 May 2013 216.283p 2,011
* The full taxable value of the shares on the date of exercise is shown. However, Julian Roberts sold 981,964 shares and retained 420,841 shares. Philip Broadley sold all of the above shares
DIRECTORS’REMUNERATION REPORTcontinued

121
Governance
There are no share ownership requirements for the non-executive directors. Shares owned by the Chairman and the other non-executive directors holding office at 31 December 2013 (including holdings by connected persons) are shown below:
Non-executive director Old Mutual plc shares held at 31 December 2013
Patrick O’Sullivan 91,319
Mike Arnold 11,134
Alan Gillespie –
Danuta Gray –
Reuel Khoza –
Roger Marshall 45,000
Nkosana Moyo 10,000
Bongani Nqwababa (former director – resigned on 6 January 2014) –
Nku Nyembezi-Heita –
Neither Zoe Cruz nor Adiba Ighodaro (who were appointed to the Board on 6 January 2014) had any interests in the Company’s shares at their date of appointment. There have been no changes to the interests in shares of the non-executive directors between 31 December 2013 and 28 February 2014.
Performance graphsThe charts below show the Company’s five-year annual TSR performance against the FTSE100 index and JSE ALSI. These indices were selected because: (i) the Company is part of those indices; and (ii) due to the international structure and diversity of the Group’s businesses, the two broad market indices shown are the only relevant market comparators available.
The charts show the value of total shareholder return (assuming dividends reinvested) at each year-end from 31 December 2008 to 31 December 2013 on £100/R100 invested in Old Mutual plc shares compared with the total shareholder return (calculated on the same basis) on £100/R100 invested in the FTSE100 index and the JSE ALSI at the same dates.
0%
50%
100%
150%
200%
250%
300%
350%
400% Old Mutual (LSE)FTSE100
Old Mutual plc TSR performance:Five-year performance to 31 December 2013
31 Dec 2008
31 Dec2009
31 Dec2010
31 Dec2011
31 Dec2012
31 Dec2013
0%
50%
100%
150%
200%
250%
300%
350%
400%
450%
500%
Old Mutual plc TSR performance:Five-year performance to 31 December 2013
31 Dec 2008
31 Dec2009
31 Dec2010
31 Dec2011
31 Dec2012
31 Dec2013
Old Mutual (JSE)JSE ALSI
Source: Datastream
Group Chief Executive’s remuneration over the last five years
Julian Roberts2009£000
2010£000
2011£000
2012£000
2013£000
Single figure 2,163 2,447 8,521 7,881 4,789
STI payout against maximum opportunity 77% 98% 92% 88% 85%
LTI vesting against maximum opportunity 0% 0% 100% 80% 84%
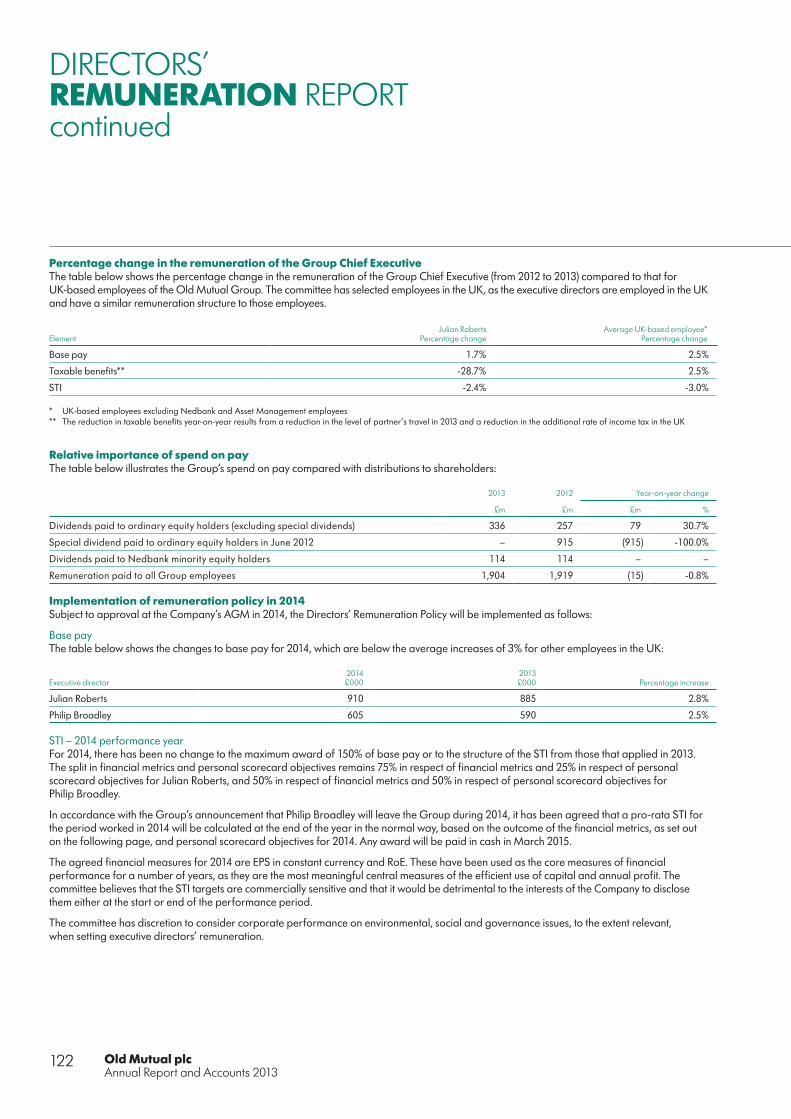
Old Mutual plcAnnual Report and Accounts 2013
122
Percentage change in the remuneration of the Group Chief ExecutiveThe table below shows the percentage change in the remuneration of the Group Chief Executive (from 2012 to 2013) compared to that for UK-based employees of the Old Mutual Group. The committee has selected employees in the UK, as the executive directors are employed in the UK and have a similar remuneration structure to those employees.
ElementJulian Roberts
Percentage changeAverage UK-based employee*
Percentage change
Base pay 1.7% 2.5%
Taxable benefits** -28.7% 2.5%
STI -2.4% -3.0%
* UK-based employees excluding Nedbank and Asset Management employees** The reduction in taxable benefits year-on-year results from a reduction in the level of partner’s travel in 2013 and a reduction in the additional rate of income tax in the UK
Relative importance of spend on payThe table below illustrates the Group’s spend on pay compared with distributions to shareholders:
2013 2012 Year-on-year change
£m £m £m %
Dividends paid to ordinary equity holders (excluding special dividends) 336 257 79 30.7%
Special dividend paid to ordinary equity holders in June 2012 – 915 (915) -100.0%
Dividends paid to Nedbank minority equity holders 114 114 – –
Remuneration paid to all Group employees 1,904 1,919 (15) -0.8%
Implementation of remuneration policy in 2014Subject to approval at the Company’s AGM in 2014, the Directors’ Remuneration Policy will be implemented as follows:
Base pay The table below shows the changes to base pay for 2014, which are below the average increases of 3% for other employees in the UK:
Executive director2014£000
2013 £000 Percentage increase
Julian Roberts 910 885 2.8%
Philip Broadley 605 590 2.5%
STI – 2014 performance yearFor 2014, there has been no change to the maximum award of 150% of base pay or to the structure of the STI from those that applied in 2013. The split in financial metrics and personal scorecard objectives remains 75% in respect of financial metrics and 25% in respect of personal scorecard objectives for Julian Roberts, and 50% in respect of financial metrics and 50% in respect of personal scorecard objectives for Philip Broadley.
In accordance with the Group’s announcement that Philip Broadley will leave the Group during 2014, it has been agreed that a pro-rata STI for the period worked in 2014 will be calculated at the end of the year in the normal way, based on the outcome of the financial metrics, as set out on the following page, and personal scorecard objectives for 2014. Any award will be paid in cash in March 2015.
The agreed financial measures for 2014 are EPS in constant currency and RoE. These have been used as the core measures of financial performance for a number of years, as they are the most meaningful central measures of the efficient use of capital and annual profit. The committee believes that the STI targets are commercially sensitive and that it would be detrimental to the interests of the Company to disclose them either at the start or end of the performance period.
The committee has discretion to consider corporate performance on environmental, social and governance issues, to the extent relevant, when setting executive directors’ remuneration.
DIRECTORS’REMUNERATION REPORTcontinued
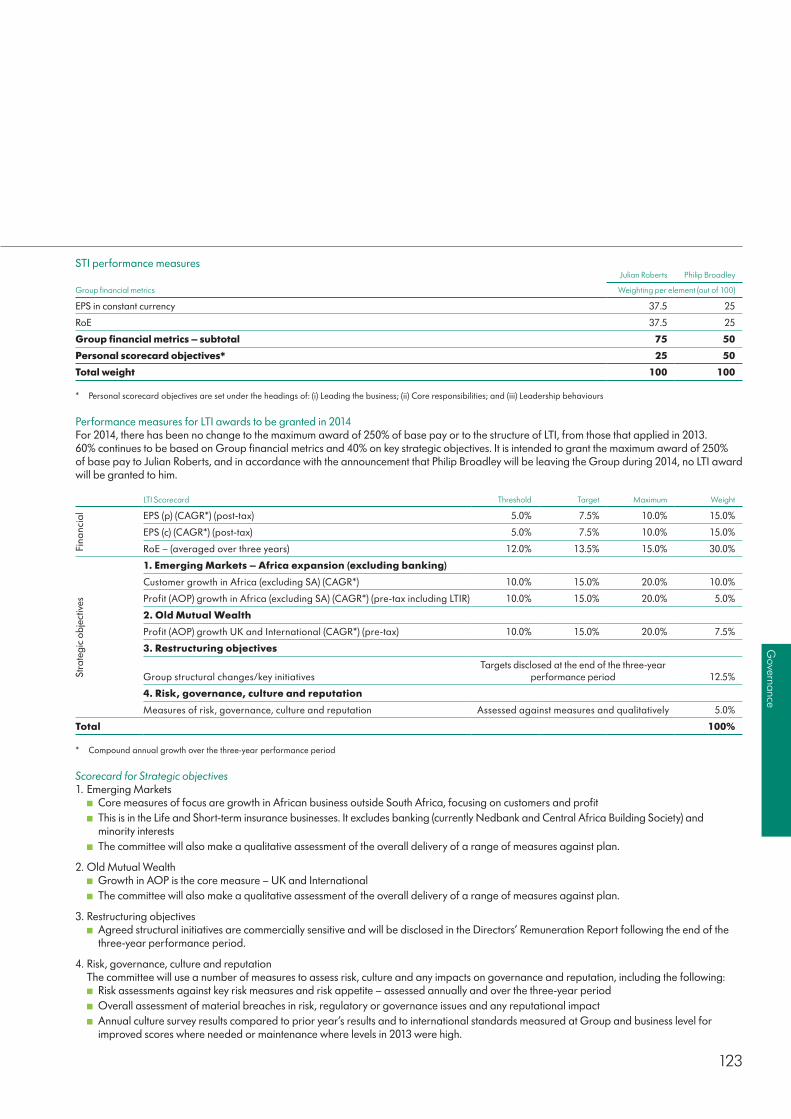
123
Governance
STI performance measuresJulian Roberts Philip Broadley
Group financial metrics Weighting per element (out of 100)
EPS in constant currency 37.5 25
RoE 37.5 25
Group financial metrics – subtotal 75 50
Personal scorecard objectives* 25 50
Total weight 100 100
* Personal scorecard objectives are set under the headings of: (i) Leading the business; (ii) Core responsibilities; and (iii) Leadership behaviours
Performance measures for LTI awards to be granted in 2014 For 2014, there has been no change to the maximum award of 250% of base pay or to the structure of LTI, from those that applied in 2013. 60% continues to be based on Group financial metrics and 40% on key strategic objectives. It is intended to grant the maximum award of 250% of base pay to Julian Roberts, and in accordance with the announcement that Philip Broadley will be leaving the Group during 2014, no LTI award will be granted to him.
LTI Scorecard Threshold Target Maximum Weight
Fina
ncia
l EPS (p) (CAGR*) (post-tax) 5.0% 7.5% 10.0% 15.0%
EPS (c) (CAGR*) (post-tax) 5.0% 7.5% 10.0% 15.0%
RoE – (averaged over three years) 12.0% 13.5% 15.0% 30.0%
Stra
tegi
c ob
ject
ives
1. Emerging Markets – Africa expansion (excluding banking)
Customer growth in Africa (excluding SA) (CAGR*) 10.0% 15.0% 20.0% 10.0%
Profit (AOP) growth in Africa (excluding SA) (CAGR*) (pre-tax including LTIR) 10.0% 15.0% 20.0% 5.0%
2. Old Mutual Wealth
Profit (AOP) growth UK and International (CAGR*) (pre-tax) 10.0% 15.0% 20.0% 7.5%
3. Restructuring objectives
Group structural changes/key initiativesTargets disclosed at the end of the three-year
performance period 12.5%
4. Risk, governance, culture and reputation
Measures of risk, governance, culture and reputation Assessed against measures and qualitatively 5.0%
Total 100%
* Compound annual growth over the three-year performance period
Scorecard for Strategic objectives1. Emerging Markets
■ Core measures of focus are growth in African business outside South Africa, focusing on customers and profit ■ This is in the Life and Short-term insurance businesses. It excludes banking (currently Nedbank and Central Africa Building Society) and minority interests
■ The committee will also make a qualitative assessment of the overall delivery of a range of measures against plan.
2. Old Mutual Wealth ■ Growth in AOP is the core measure – UK and International ■ The committee will also make a qualitative assessment of the overall delivery of a range of measures against plan.
3. Restructuring objectives ■ Agreed structural initiatives are commercially sensitive and will be disclosed in the Directors’ Remuneration Report following the end of the three-year performance period.
4. Risk, governance, culture and reputation The committee will use a number of measures to assess risk, culture and any impacts on governance and reputation, including the following:
■ Risk assessments against key risk measures and risk appetite – assessed annually and over the three-year period ■ Overall assessment of material breaches in risk, regulatory or governance issues and any reputational impact ■ Annual culture survey results compared to prior year’s results and to international standards measured at Group and business level for improved scores where needed or maintenance where levels in 2013 were high.

Old Mutual plcAnnual Report and Accounts 2013
124
The committee will apply its discretion in determining the final outcomes in relation to the 2014 LTI, and in this regard: ■ It will receive a report from the Chief Risk Officer to confirm that the performance of the Group has been achieved within the stated risk appetite. Where the risk appetite has been breached, the committee will have discretion to reduce the level of vesting accordingly
■ It will exercise its discretion to make adjustments where there is a significant negative impact on underlying financial performance which is not adequately reflected in AOP results (for example, where LTIR adjustments create any inconsistency between AOP and IFRS basic earnings).
Where the Group undergoes a significant change, such as a large disposal, acquisition or restructuring, the committee will review the targets to assess whether they need to be adjusted to reflect the change, or whether they should be replaced altogether.
TSR multiplier*A TSR multiplier will be used to adjust the weighted average outcome of the LTI scorecard in the table shown on the previous page, as follows. TSR will be averaged at the start (Q4 2013) and end (Q4 2016) of the three-year performance period.
Relative TSR vs. index Multiplier
Threshold 4% or more below index 0.85
Target equal to index 1.00
Maximum 4% or more above index 1.15
* Relative TSR performance (calculated 50% against the FTSE100 index and 50% against the JSE ALSI) against the above ranges, with a multiplier being set on a linear basis between the points. The award for Julian Roberts, inclusive of the maximum TSR multiplier above, will be equal to 250% of base pay at the date of award
Non-executive directors’ feesThe annual fees payable to the Chairman and to the other non-executive directors in 2013 and 2014, by role, are set out below:
Role2014£000
2013£000
Chairman 370 360
Senior Independent Director 15 10
Board fee 57 57
Chairman of the Board Risk Committee 30 25
Member of the Board Risk Committee 10 8
Chairman of the Group Audit Committee 30 30
Member of the Group Audit Committee 10 10
Member of the Nomination Committee 5 3
Chairman of the Remuneration Committee 30 25
Member of the Remuneration Committee 10 8
Average payment per non-executive director (excluding the Chairman) based on the Board and Board committee structure in place at 31 December 2013 and 6 January 2014 (the latter date being when various changes to the non-executive directors and Board committee memberships took effect) 84 83
Fees payable to Adiba Ighodaro are payable to Actis LLP rather than to her personally.
DIRECTORS’REMUNERATION REPORTcontinued

125
Governance
Consideration by the directors of matters relating to directors’ remunerationCommittee meetings and membersThe following, all of whom are or were at the relevant time independent non-executive directors of the Company, served as members of the committee during the year:
Non-executive director Position Period on the committeeMeetings attended
Meetings not attended
Alan Gillespie Chairman November 2010 to date (Chairman since May 2013) 6 –
Danuta Gray Member March 2013 to date 4 –
Roger Marshall Member May 2013 to date 3 –
Bongani Nqwababa Member April 2010 to January 2014 6 –
Russell Edey Chairman June 2007 to May 2013 (Chairman from May 2011 to May 2013) 3 –
Eva Castillo Member February 2011 to February 2013 – 2
Lars Otterbeck Member April 2010 to May 2013 3 –
Nkosana Moyo and Zoe Cruz were appointed to the committee on 1 January 2014 and 6 January 2014 respectively. Danuta Gray will replace Alan Gillespie as Chairman of the committee at the conclusion of the Company’s AGM on 15 May 2014.
The committee Chairman has access to and regular contact with the Group Human Resources Department independently of the executive directors. During 2013, the committee met six times. The Board accepted the recommendations made by the committee during the year without amendment. Paul Forsythe, Assistant Company Secretary, acted as Secretary to the committee.
Advisers to the committeeThe committee assesses the quality of the advice received from its independent adviser annually and has a policy to renew such appointment from year to year. As part of its annual assessment, the committee reviews whether the independent adviser is giving advice that is objective and independent. Following its review at the end of 2012, the committee renewed the appointment of Alan Judes as its independent adviser for 2013, through his consultancy Strategic Remuneration, and has also done so for the first six months of 2014, at which time a further review of the role of independent adviser will be undertaken once Danuta Gray has taken over from Alan Gillespie as Chairman of the committee. A copy of Alan Judes’ letter of engagement is on the Company’s website. Any work that the Company wishes Alan Judes to do on its behalf, rather than for the committee, is pre-cleared with the committee Chairman with a view to avoiding any conflicts of interest. No work was performed by Alan Judes for the Company, as distinct from the committee, during 2013.
Work undertaken by Alan Judes for the committee during 2013 included advising the committee in connection with the benchmarking of the total remuneration packages for the executive directors and other senior members of staff, the design of short-term and long-term incentive arrangements including arrangements for employees of subsidiary companies, updating the committee on corporate governance best practice and requirements for disclosure under newly enacted and promulgated legislation, advising in connection with the measurement of performance for incentive purposes and the valuation of incentive plans, and accompanying the Chairman of the committee to meetings with shareholder representatives to discuss remuneration strategy and performance measures. Fees paid to Strategic Remuneration are charged on a time basis and for 2013 were £120,000 excluding VAT (2012: £107,000 excluding VAT). Strategic Remuneration is a member of the Remuneration Consultants Group and adheres to that body’s Code of Conduct.
Don Schneider and Kevin Stacey of Group Human Resources assisted the committee during the year. Group Human Resources provided supporting materials for matters that came before the committee, including comparative data and justifications for proposed base pay, benefits, annual incentive plans, share awards and criteria for performance targets and appraisals against those targets. Patrick O’Sullivan, Julian Roberts and Sue Kean gave advice to the committee in assessing the performance of the Group Chief Executive, the Group Executive Committee and the assessment of risk respectively.
Voting at General MeetingsThe voting results at AGMs on our Directors’ Remuneration Reports over the previous two years were as follows:
Year of Report Date of AGM Votes for Votes for % Votes against Votes against %
Total votes cast (excluding
votes withheld) Votes withheld
2012 9 May 2013 2,933,771,399 97.94 61,752,305 2.06 2,995,523,704 123,524,253
2011 10 May 2012 2,846,756,024 90.01 315,798,433 9.99 3,162,554,457 10,273,283

FINANCIALSIn this section, we present the results of the Group and the Parent Company in accordance with International Financial Reporting Standards (IFRS). The IFRS results are also presented on an adjusted basis to reflect management’s view of the underlying long-term performance of the Group.
We also present the value of the Group on a Market Consistent Embedded Value basis (MCEV). MCEV is a valuation of ordinary shareholders’ interests in the long-term life insurance part of the business, also called covered business.

127
Financials
Statement of directors’ responsibilities in respect of the Annual Report and Accounts and the financial statements 128
Independent Auditor’s Report to the members of Old Mutual plc only 129
Consolidated income statement 132
Consolidated statement of comprehensive income 133
Reconciliation of adjusted operating profit to profit after tax 134
Consolidated statement of financial position 136
Consolidated statement of cash flows 137
Consolidated statement of changes in equity 138
Notes to the consolidated financial statements 142
A: Significant accounting policies 142
B: Segment information 148
C: Other key performance information 158
D: Other income statement notes 164
E: Financial assets and liabilities 169
F: Other statement of financial position notes 207
G: Interests in subsidiaries, associates and joint arrangements 219
H: Other notes 225
I: Discontinued operations and disposal groups held for sale 235
J: Changes in accounting policies 236
Financial statements of the Company 238
MCEV 247
Old Mutual plcAnnual Report and Accounts 2013
128
GROUP FINANCIAL STATEMENTSSTATEMENT OF DIRECTORS’ RESPONSIBILITIESin respect of the Annual Report and Accounts and the financial statements
The directors are responsible for preparing the Annual Report and Accounts and the Group and Parent Company financial statements in accordance with applicable law and regulations.
Company law requires the directors to prepare Group and Parent Company financial statements for each financial year. Under that law they are required to prepare the Group financial statements in accordance with International Financial Reporting Standards (IFRS) as adopted by the EU and applicable law and have elected to prepare the Parent Company financial statements on the same basis.
Under company law the directors must not approve the financial statements unless they are satisfied that they give a true and fair view of the state of affairs of the Group and Parent Company and of their profit or loss for that period. In preparing each of the Group and Parent Company financial statements, the directors are required to:
■ Select suitable accounting policies and then apply them consistently ■ Make judgements and estimates that are reasonable and prudent ■ State whether they have been prepared in accordance with IFRSs as adopted by the EU and ■ Prepare the financial statements on the going concern basis unless it is inappropriate to presume that the Group and the Parent Company will continue in business.
The directors are responsible for keeping adequate accounting records that are sufficient to show and explain the Parent Company’s transactions and disclose with reasonable accuracy at any time the financial position of the parent company and enable them to ensure that its financial statements comply with the Companies Act 2006. They have general responsibility for taking such steps as are reasonably open to them to safeguard the assets of the Group and to prevent and detect fraud and other irregularities.
Under applicable law and regulations, the directors are also responsible for preparing a Strategic Report, Directors’ Report, Directors’ Remuneration Report and Corporate Governance Statement that complies with that law and those regulations.
The directors are responsible for the maintenance and integrity of the corporate and financial information included on the Company’s website. Legislation in the UK governing the preparation and dissemination of financial statements may differ from legislation in other jurisdictions.
The directors confirm that to the best of their knowledge:
■ The financial statements, prepared in accordance with the applicable set of accounting standards, give a true and fair view of the assets, liabilities, financial position and profit or loss of the Company and the undertakings included in the consolidation taken as a whole; and
■ The Annual Report includes a fair review of the development and performance of the business and the position of Old Mutual plc and the undertakings included in the consolidation taken as a whole, together with a description of the principal risks and uncertainties that they face.
Julian Roberts Philip Broadley Group Chief Executive Group Finance Director
28 February 2014

129
Financials
GROUP FINANCIAL STATEMENTSINDEPENDENT AUDITOR’S REPORT TO THE MEMBERS OF OLD MUTUAL PLC ONLYFor year ended 31 December 2013
Opinions and conclusions arising from our audit1. Our opinion on the financial statements is unmodifiedWe have audited the financial statements of Old Mutual plc for the year ended 31 December 2013, which comprise the Consolidated Income Statement, the Consolidated Statement of Comprehensive Income, the Consolidated and Parent Company Statements of Financial Position, the Consolidated and Parent Company Cash Flow Statements, the Consolidated and Parent Company Statements of Changes in Equity and the related notes which include the reconciliation of adjusted operating profit to profit after tax.
In our opinion:
■ The financial statements give a true and fair view of the state of the Group’s and of the Parent Company’s affairs as at 31 December 2013 and of the Group’s profit for the year then ended
■ The Group financial statements have been properly prepared in accordance with International Financial Reporting Standards as adopted by the European Union (IFRSs as adopted by the EU)
■ The Parent Company financial statements have been properly prepared in accordance with IFRSs as adopted by the EU and as applied in accordance with the provisions of the Companies Act 2006, and
■ The financial statements have been prepared in accordance with the requirements of the Companies Act 2006 and, as regards the Group financial statements, Article 4 of the IAS Regulation.
2. Our assessment of risks of material misstatementIn arriving at our audit opinion above on the financial statements the risks of material misstatement that had the greatest effect on our audit were as follows:
■ Loans and advances (£33,386 million)Refer to page 97 (Audit Committee Report), pages 144 and 176 (accounting policy) and the disclosures in notes A3, E1, E2 and E3 to the financial statements
The risk:The Group’s loans and advances impairment assessment requires the exercise of judgement and the use of subjective assumptions. Due to the significance of loans and advances and the related estimation uncertainty, this is considered to be a key audit risk, both in respect of the mature, established clusters and the unsecured lending books within Nedbank, as well as the Emerging Markets exposure through a joint venture, Old Mutual Finance.
Our response:For all banking clusters, our procedures included, among others, testing the design, implementation and operating effectiveness of key controls in operation over the loan approval, administration and monitoring processes. We involved our own internal valuation specialists to assess each of the portfolio loan loss provisioning models employed by the Group and to compare the Group’s assumptions to externally available data in relation to key inputs such as historical default rates, recovery rates, collateral valuation, and economic growth rates. Specific focus was given to the Business banking, Corporate banking and Retail books, in response to increasing credit loss ratios during 2013. We also performed detailed testing over the specific provisions held against loans and advances, by reviewing latest correspondence and Credit Committee minutes, assessing collateral values and re-performing key calculations.
■ Policyholder liabilities (£81,141 million)Refer to page 97 (Audit Committee Report), pages 144 and 196 (accounting policy) and the disclosures in notes A3, E1, E2 and E8 to the financial statements
The risk:The main risk associated with policyholder liabilities is in respect of the insurance contracts within the life businesses; Emerging Markets and Old Mutual Wealth. Judgement is required over the variety of uncertain future outcomes, including the policy for creating and releasing discretionary reserves. Economic assumptions, such as investment return and associated discount rates, and operating assumptions, such as mortality and persistency, are the key inputs used to estimate the valuation of these long-term liabilities and the wide variety of uncertain future outcomes results in this being one of the key judgemental areas that our audit focused on.
Our response:Our procedures in this area included testing the design, implementation and operating effectiveness of key controls over the identification, measurement and management of the Group’s calculation of insurance liabilities and evaluation of the consistency of methodologies and the appropriateness of the assumptions used by the Group. We involved our own internal actuarial specialists to assist us in our challenge of the assumptions used and the process followed for setting and updating these assumptions, particularly around expense and mortality/morbidity assumptions. Our challenge was provided in the context of our own industry knowledge, external data and our views of experience to date, an understanding of which was enhanced through our attendance at the Group’s own Independent Review Committee meetings. In respect of the discretionary reserves held within the South African business we reviewed and challenged the Group’s use and application of the established policy, with reference to industry-wide practice and applicable accounting standards.

Old Mutual plcAnnual Report and Accounts 2013
130
Opinions and conclusions arising from our audit continued2. Our assessment of risks of material misstatement continued
■ Goodwill and intangibles (£2,835 million)Refer to page 97 (Audit Committee Report), page 207 (accounting policy) and the disclosures in note F1 to the financial statements
The risk:The determination of the recoverable amount of intangible assets (both acquired and internally generated) and goodwill is complex and typically requires a high level of judgement, taking into account the different economic environments in which the Group operates. We consider the greatest risk to be within Old Mutual Wealth.
Our response:The most significant judgements arise over the forecast cash flows and the discount rate applied in the value-in-use valuation models. Our procedures included, among others, challenging the cash flow forecasts and the corresponding assumptions applied by the Group in the consideration of potential impairment of intangible assets, based on our understanding of the relevant business and the industry and economic environment in which it operates. We compared forecasts to business plans and also previous forecasts to actual results to assess the performance of the business and the accuracy of forecasting and considered the appropriateness of the scenarios used, in the context of our wider business understanding. We involved our own valuation specialists to assist us in evaluating the assumptions and methodologies used by the Group, in particular those relating to the discount rates and in evaluating these assumptions with reference to independently derived inputs.
■ Taxation (£171 million – tax risk provision)Refer to page 97 (Audit Committee Report), page 145 (accounting policy) and the disclosures in notes D1 and F7 to the financial statements
The risk:Accruals for uncertain tax positions require the Group to make judgements and estimates in relation to tax exposures and in response to enquiries raised by the tax authorities. This is one of the key judgemental areas that our audit is concentrated on due to the Group operating in a number of different tax jurisdictions and the complexities of and developments in international tax legislation, particularly in relation to South Africa given the proportion of the Group’s income earned there.
Our response:In understanding the accruals held, we inspected the correspondence with the relevant tax authorities and associated advice and held discussions with relevant members of management. We involved our own local and international tax specialists to assist us in analysing the Group’s tax positions and challenged assumptions used to determine tax provisions based on our knowledge and experiences of the application of the international and local legislation by relevant authorities and courts.
For all of the risk areas set out above, we have assessed whether the Group’s disclosures about the sensitivity of the relevant financial statement items to changes in the respective key assumptions appropriately reflect the associated risks and comply with the requirements of relevant accounting standards.
3. Our application of materiality and an overview of the scope of our auditThe materiality for the Group financial statements as a whole was set at £80 million. This has been determined with reference to a benchmark of Group profit before taxation, which we consider to be one of the principal considerations for members of the Company in assessing the financial performance of the Group. Materiality represents 5.2% of Group profit before tax and 5.0% of Group Adjusted Operating Profit, the definition of which is set out within the primary statements and notes to the financial statements.
We agreed with the Group Audit Committee to report to it all corrected and uncorrected misstatements we identified through our audit with an individual value in excess of £4 million in addition to other audit misstatements below that threshold which we believe warranted reporting on qualitative grounds.
Audits for Group reporting purposes were performed at the key components, being Emerging Markets, Old Mutual Wealth, Nedbank, US Asset Management and Bermuda businesses, by separate component teams. These audits covered 94% of total revenues, 99% of profit before tax, and 95% of total Group assets.
The audits undertaken for Group reporting purposes at the significant reporting components of the Group were all performed to materiality levels set by the Group audit team, ranging from £32 million to £65 million. To support the audit instructions sent to our component teams, the Group audit team visited the teams in South Africa, the US, Bermuda and elsewhere in the UK for planning and risk assessment meetings and maintained regular communication with the auditors at these locations throughout the audit cycle to discuss work progress and identify matters of relevance to our audit of the Group financial statements. The Senior Statutory Auditor, in conjunction with other senior staff in the Group audit team, also regularly attends Audit Committee meetings held at the significant components to understand key risks and audit issues at a component level which may affect the Group financial statements.
GROUP FINANCIAL STATEMENTSINDEPENDENT AUDITOR’S REPORT TO THE MEMBERS OF OLD MUTUAL PLC ONLY continuedFor year ended 31 December 2013
131
Financials
4. Our opinion on other matters prescribed by the Companies Act 2006 is unmodifiedIn our opinion:
■ The elements of the Directors’ Remuneration Report subject to audit have been properly prepared in accordance with the Companies Act 2006, and
■ The information given in the Strategic Report and the Directors’ Report for the financial year for which the financial statements are prepared is consistent with the financial statements.
5. We have nothing to report in respect of the matters on which we are required to report by exception Under ISAs (UK and Ireland) we are required to report to you if, based on the knowledge we acquired during our audit, we have identified other information in the annual report that contains a material inconsistency with either that knowledge or the financial statements, a material misstatement of fact, or that is otherwise misleading.
In particular, we are required to report to you if:
■ We have identified material inconsistencies between the knowledge we acquired during our audit and the directors’ statement that they consider that the annual report and financial statements taken as a whole is fair, balanced and understandable and provides the information necessary for shareholders to assess the Group’s performance, business model and strategy or
■ The Audit Committee Report does not appropriately address matters communicated by us to the Audit Committee.
Under the Companies Act 2006 we are required to report to you if, in our opinion:
■ Adequate accounting records have not been kept by the Parent Company, or returns adequate for our audit have not been received from branches not visited by us or
■ The Parent Company financial statements and the part of the Directors’ Remuneration Report to be audited are not in agreement with the accounting records and returns or
■ Certain disclosures of directors’ remuneration specified by law are not made or ■ We have not received all the information and explanations we require for our audit.
Under the Listing Rules we are required to review:
■ The directors’ statement, set out on page 105, in relation to going concern and ■ The part of the Corporate Governance Statement relating to the Parent Company’s compliance with the nine provisions of the 2010 UK Corporate Governance Code specified for our review.
We have nothing to report in respect of the above responsibilities.
Scope of report and responsibilitiesAs explained more fully in the Statement of directors’ responsibilities set out on page 128, the directors are responsible for the preparation of the financial statements and for being satisfied that they give a true and fair view. A description of the scope of an audit of financial statements is provided on the Financial Reporting Council’s website at www.frc.org.uk/auditscopeukprivate. This report is made solely to the Company’s members as a body and is subject to important explanations and disclaimers regarding our responsibilities, published on our website at www.kpmg.com/uk/auditscopeukco2013a, which are incorporated into this report as if set out in full and should be read to provide an understanding of the purpose of this report, the work we have undertaken and the basis of our opinions.
Philip Smart (Senior Statutory Auditor) for and on behalf of KPMG Audit Plc, Statutory Auditor Chartered Accountants 15 Canada Square London E14 5GL
28 February 2014
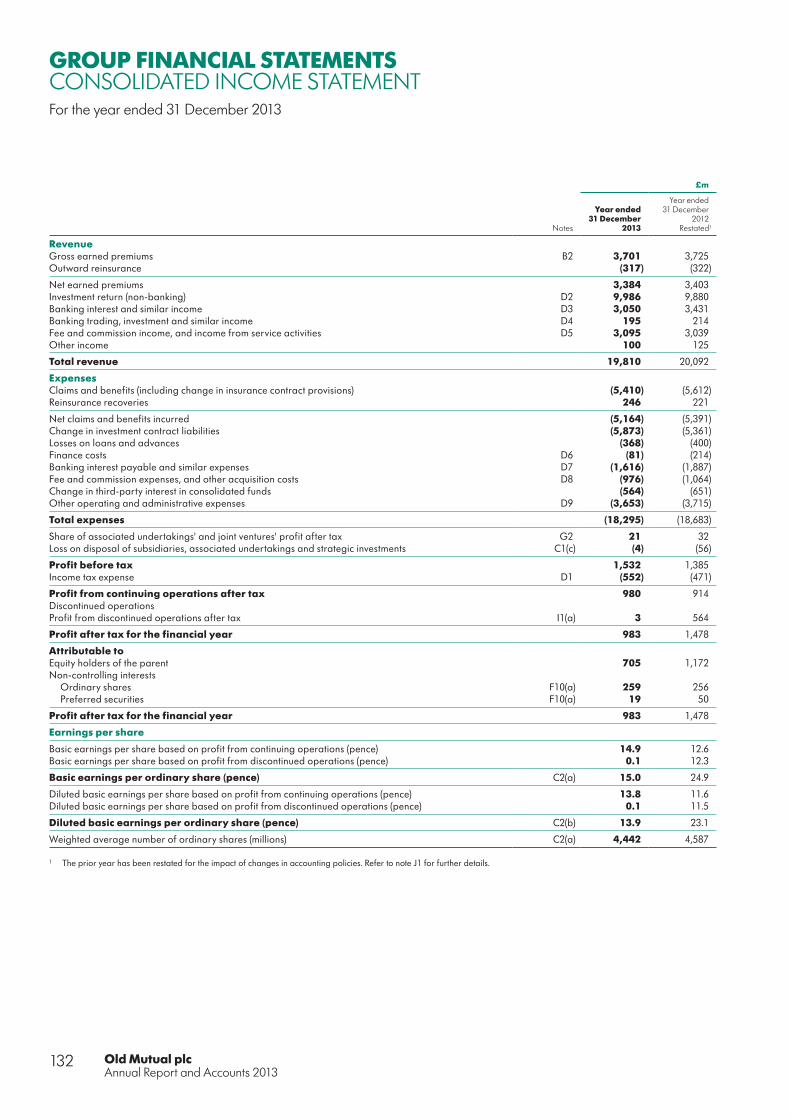
Old Mutual plcAnnual Report and Accounts 2013
132
GROUP FINANCIAL STATEMENTSCONSOLIDATED INCOME STATEMENTFor the year ended 31 December 2013
£m
Notes
Year ended 31 December
2013
Year ended 31 December
2012Restated1
RevenueGross earned premiums B2 3,701 3,725 Outward reinsurance (317) (322)
Net earned premiums 3,384 3,403 Investment return (non-banking) D2 9,986 9,880 Banking interest and similar income D3 3,050 3,431 Banking trading, investment and similar income D4 195 214 Fee and commission income, and income from service activities D5 3,095 3,039 Other income 100 125
Total revenue 19,810 20,092
ExpensesClaims and benefits (including change in insurance contract provisions) (5,410) (5,612)Reinsurance recoveries 246 221
Net claims and benefits incurred (5,164) (5,391)Change in investment contract liabilities (5,873) (5,361)Losses on loans and advances (368) (400)Finance costs D6 (81) (214)Banking interest payable and similar expenses D7 (1,616) (1,887)Fee and commission expenses, and other acquisition costs D8 (976) (1,064)Change in third-party interest in consolidated funds (564) (651)Other operating and administrative expenses D9 (3,653) (3,715)
Total expenses (18,295) (18,683)
Share of associated undertakings' and joint ventures' profit after tax G2 21 32 Loss on disposal of subsidiaries, associated undertakings and strategic investments C1(c) (4) (56)
Profit before tax 1,532 1,385 Income tax expense D1 (552) (471)
Profit from continuing operations after tax 980 914 Discontinued operationsProfit from discontinued operations after tax I1(a) 3 564
Profit after tax for the financial year 983 1,478
Attributable toEquity holders of the parent 705 1,172 Non-controlling interests
Ordinary shares F10(a) 259 256 Preferred securities F10(a) 19 50
Profit after tax for the financial year 983 1,478
Earnings per share
Basic earnings per share based on profit from continuing operations (pence) 14.9 12.6 Basic earnings per share based on profit from discontinued operations (pence) 0.1 12.3
Basic earnings per ordinary share (pence) C2(a) 15.0 24.9
Diluted basic earnings per share based on profit from continuing operations (pence) 13.8 11.6 Diluted basic earnings per share based on profit from discontinued operations (pence) 0.1 11.5
Diluted basic earnings per ordinary share (pence) C2(b) 13.9 23.1
Weighted average number of ordinary shares (millions) C2(a) 4,442 4,587
1 The prior year has been restated for the impact of changes in accounting policies. Refer to note J1 for further details.
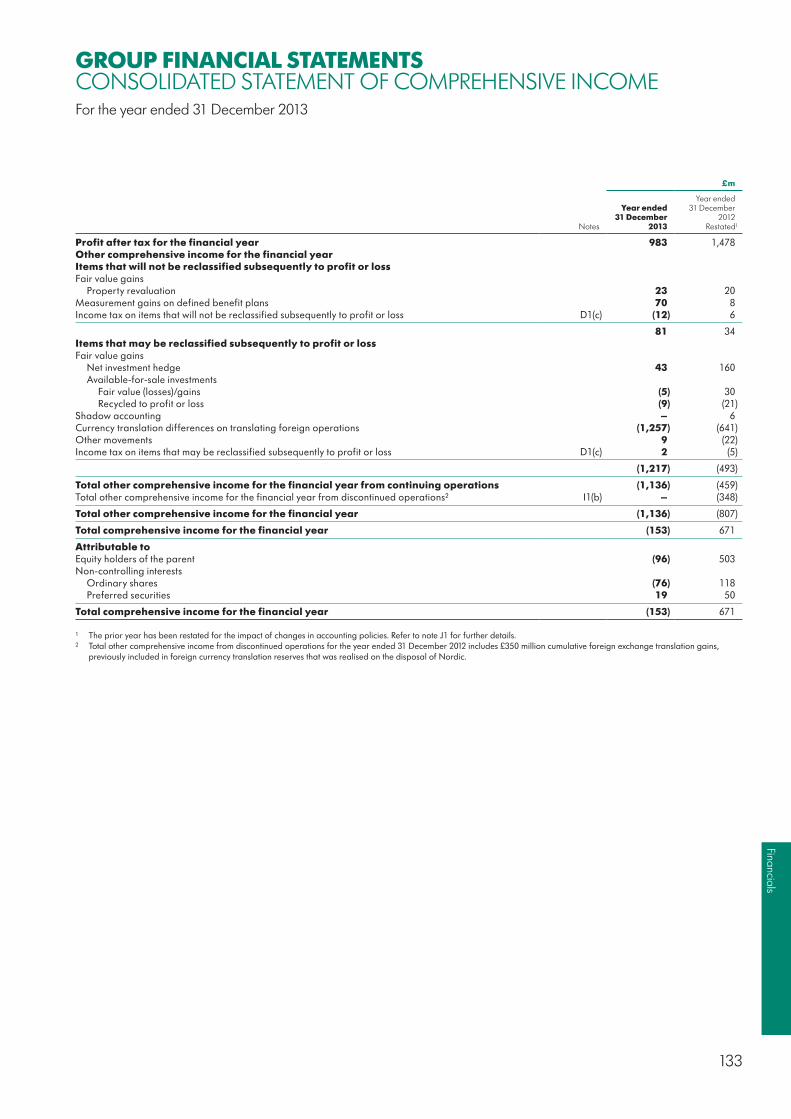
133
Financials
£m
Notes
Year ended 31 December
2013
Year ended 31 December
2012Restated1
Profit after tax for the financial year 983 1,478 Other comprehensive income for the financial yearItems that will not be reclassified subsequently to profit or lossFair value gains
Property revaluation 23 20 Measurement gains on defined benefit plans 70 8 Income tax on items that will not be reclassified subsequently to profit or loss D1(c) (12) 6
81 34Items that may be reclassified subsequently to profit or lossFair value gains
Net investment hedge 43 160 Available-for-sale investments
Fair value (losses)/gains (5) 30 Recycled to profit or loss (9) (21)
Shadow accounting – 6 Currency translation differences on translating foreign operations (1,257) (641)Other movements 9 (22)Income tax on items that may be reclassified subsequently to profit or loss D1(c) 2 (5)
(1,217) (493)
Total other comprehensive income for the financial year from continuing operations (1,136) (459)Total other comprehensive income for the financial year from discontinued operations² I1(b) – (348)
Total other comprehensive income for the financial year (1,136) (807)
Total comprehensive income for the financial year (153) 671
Attributable toEquity holders of the parent (96) 503 Non-controlling interests
Ordinary shares (76) 118 Preferred securities 19 50
Total comprehensive income for the financial year (153) 671
1 The prior year has been restated for the impact of changes in accounting policies. Refer to note J1 for further details.2 Total other comprehensive income from discontinued operations for the year ended 31 December 2012 includes £350 million cumulative foreign exchange translation gains,
previously included in foreign currency translation reserves that was realised on the disposal of Nordic.
GROUP FINANCIAL STATEMENTSCONSOLIDATED STATEMENT OF COMPREHENSIVE INCOMEFor the year ended 31 December 2013

Old Mutual plcAnnual Report and Accounts 2013
134
GROUP FINANCIAL STATEMENTSRECONCILIATION OF ADJUSTED OPERATING PROFIT TO PROFIT AFTER TAXFor the year ended 31 December 2013
£m
Notes
Year ended 31 December
2013
Year ended 31 December
2012Restated1
Core operationsEmerging Markets B3 590 611 Old Mutual Wealth B3 217 195 Property & Casualty B3 4 37 Nedbank B3 797 825 USAM B3 111 91
1,719 1,759 Finance costs B3 (92) (130)Long-term investment return on excess assets 43 54 Net interest payable to non-core operations (11) (18)Corporate costs (54) (54)Other net income 7 1
Adjusted operating profit before tax 1,612 1,612 Adjusting items C1(a) (286) (467)Non-core operations B3 32 165
Profit before tax (net of policyholder tax) 1,358 1,310 Income tax attributable to policyholder returns D1(d) 174 75
Profit before tax 1,532 1,385 Total tax expense D1(a) (552) (471)
Profit from continuing operations after tax 980 914 Profit from discontinued operations after tax I1(a) 3 564
Profit after tax for the financial year 983 1,478
Adjusted operating profit after tax attributable to ordinary equity holders of the parent
£m
Notes
Year ended 31 December
2013
Year ended 31 December
2012Restated1
Adjusted operating profit before tax B3 1,612 1,612 Tax on adjusted operating profit D1(d) (424) (440)
Adjusted operating profit after tax 1,188 1,172
Non-controlling interests – ordinary shares F10(a) (279) (281)Non-controlling interests – preferred securities F10(a) (19) (50)
Adjusted operating profit after tax attributable to ordinary equity holders of the parent B3 890 841
Adjusted weighted average number of shares (millions) C2(c) 4,836 4,818
Adjusted operating earnings per share (pence) C2(c) 18.4 17.5
1 The prior year has been restated for the impact of changes in accounting policies. Refer to note J1 for further details.
Basis of preparation of adjusted operating profitAdjusted operating profit (AOP) reflects the directors’ view of the underlying long-term performance of the Group. AOP is a measure of profitability which adjusts the standard IFRS profit measures for the specific items detailed in note C1 and, as such, it is a non-GAAP measure. This reconciliation explains the differences between adjusted operating profit and profit after tax as reported under IFRS.
135
Financials
For core life assurance and property & casualty businesses, AOP is based on a long-term investment return, including returns on investments held by life funds in Group equity and debt instruments, and is stated net of income tax attributable to policyholder returns. For all core businesses, AOP excludes goodwill impairment, the impact of accounting for intangibles acquired in a business combination and costs related to successful acquisitions, revaluations of put options related to long-term incentive schemes, profit/(loss) on acquisition/disposal of subsidiaries, associated undertakings and strategic investments, fair value profits/(losses) on certain Group debt movements and costs related to the fundamental restructuring of continuing businesses. AOP includes dividends declared to holders of perpetual preferred callable securities. Old Mutual Bermuda and Nordic are treated as non-core operations in the AOP disclosure, as such they are not included in AOP. Refer to note B1 for further information on the basis of segmentation.
Adjusted operating earnings per share is calculated on the same basis as AOP. It is stated after tax attributable to AOP and non-controlling interests. It excludes income attributable to Black Economic Empowerment trusts of listed subsidiaries. The calculation of the adjusted weighted average number of shares includes own shares held in policyholders’ funds and Black Economic Empowerment trusts.

Old Mutual plcAnnual Report and Accounts 2013
136
GROUP FINANCIAL STATEMENTSCONSOLIDATED STATEMENT OF FINANCIAL POSITIONAt 31 December 2013
£m
Notes
At 31 December
2013
At 31 December
2012Restated1
AssetsGoodwill and other intangible assets F1 2,835 3,056 Mandatory reserve deposits with central banks 759 921 Property, plant and equipment F2(a) 722 847 Investment property F2(b) 1,811 1,947 Deferred tax assets F7 303 345 Investments in associated undertakings and joint ventures G2 168 152 Deferred acquisition costs F3 1,211 1,288 Reinsurers’ share of policyholder liabilities E8 1,875 1,406 Loans and advances E3 33,386 38,495 Investments and securities E4 88,417 88,513 Current tax receivable 128 103 Trade, other receivables and other assets F4 2,583 3,006 Derivative financial instruments E6 1,259 1,780 Cash and cash equivalents 4,869 5,061 Non-current assets held for sale 5 42
Total assets 140,331 146,962
LiabilitiesLong-term business policyholder liabilities E8 81,141 80,188 General insurance liabilities E8 332 346 Third-party interests in consolidated funds 5,478 6,116 Borrowed funds E9 2,629 3,050 Provisions and accruals F5 236 265 Deferred revenue F6 628 689 Deferred tax liabilities F7 491 404 Current tax payable 237 287 Trade, other payables and other liabilities F8 4,274 4,940 Amounts owed to bank depositors E10 34,370 39,499 Derivative financial instruments E6 1,478 1,402 Non-current liabilities held for sale – 3
Total liabilities 131,294 137,189
Net assets 9,037 9,773
Shareholders’ equityEquity attributable to equity holders of the parent F9 7,270 7,816
Non-controlling interestsOrdinary shares F10(b) 1,502 1,684 Preferred securities F10(b) 265 273
Total non-controlling interests 1,767 1,957
Total equity 9,037 9,773
1 The prior year has been restated for the impact of changes in accounting policies. Refer to note J1 for further details.
The consolidated financial statements on pages 132 to 237 were approved by the Board of directors on 28 February 2014.
Julian Roberts Philip Broadley Group Chief Executive Group Finance Director

137
Financials
GROUP FINANCIAL STATEMENTSCONSOLIDATED STATEMENT OF CASH FLOWSFor the year ended 31 December 2013
£m
Year ended 31 December
2013
Year ended 31 December
2012Restated1
Cash flows from operating activitiesProfit before tax 1,532 1,385 Non-cash movements in profit before tax 1,423 249 Changes in working capital 447 1,039 Taxation paid (458) (295)
Net cash inflow from operating activities 2,944 2,378 Cash flows from investing activitiesNet acquisitions of investments and securities (1,658) (1,449)Acquisition of investment properties (47) (55)Proceeds from disposal of investment properties 22 67 Acquisition of property, plant and equipment (113) (120)Proceeds from disposal of property, plant and equipment 6 7 Acquisition of intangible assets (86) (72)Acquisition of interests in subsidiaries, associated undertakings and strategic investments (119) (23)Disposal of interests in subsidiaries, associated undertakings and strategic investments 8 1,883
Net cash (outflow)/inflow from investing activities (1,987) 238 Cash flows from financing activitiesDividends paid to
Ordinary equity holders of the Company (336) (1,172)Non-controlling interests and preferred security interests (183) (211)
Dividends received from associated undertakings 13 7 Interest paid (excluding banking interest paid) (51) (85)Proceeds from issue of ordinary shares (including by subsidiaries to non-controlling interests) 11 35 Net disposal of treasury shares 55 19 Issue of subordinated and other debt 586 290 Subordinated and other debt repaid (578) (1,293)
Net cash outflow from financing activities (483) (2,410)Net increase in cash and cash equivalents 474 206 Net decrease in cash and cash equivalents – discontinued operations – (129)Effects of exchange rate changes on cash and cash equivalents (828) (380)Cash and cash equivalents at beginning of the year 5,982 6,285
Cash and cash equivalents at end of the year 5,628 5,982 Consisting ofCash and cash equivalents 4,869 5,061 Mandatory reserve deposits with central banks 759 921
Total 5,628 5,982
1 The prior year has been restated for the impact of changes in accounting policies. Refer to note J1 for further details.
Cash flows presented in this statement include all cash flows relating to policyholders’ funds.
Except for mandatory reserve deposits with central banks of £759 million (2012: £921 million) and cash and cash equivalents subject to consolidation of funds of £1,667 million (2012: £1,893 million), management do not consider that there are any material amounts of cash and cash equivalents which are not available for use in the Group’s day-to-day operations. Mandatory reserve deposits are, however, included in cash and cash equivalents for the purposes of the statement of cash flows in line with market practice in South Africa.

Old Mutual plcAnnual Report and Accounts 2013
138
GROUP FINANCIAL STATEMENTSCONSOLIDATED STATEMENT OF CHANGES IN EQUITYFor the year ended 31 December 2013
Millions £m
Year ended 31 December 2013 Notes
Number of shares
issued and fully paid
Share capital
Share premium
Merger reserve
Available- for-sale reserve
Property revaluation
reserve
Share-based payments
reserveOther
reserves
Foreign currency
translation reserve
Retained earnings
Perpetual preferred
callable securities
Attributable to equity
holders of the parent
Total non-
controlling interests
Total equity
Shareholders’ equity at beginning of the year 4,892 559 835 1,717 65 144 268 33 (378) 3,908 682 7,833 1,965 9,798 Impact of changes in accounting policies J1 – – – – – – – – – (17) – (17) (8) (25)
Restated shareholders’ equity at beginning of the year 4,892 559 835 1,717 65 144 268 33 (378) 3,891 682 7,816 1,957 9,773 Profit after tax for the financial year – – – – – – – – – 668 37 705 278 983 Other comprehensive incomeItems that will not be reclassified subsequently to profit
or lossFair value gains
Property revaluation – – – – – 17 – – – – – 17 6 23 Measurement gains on defined benefit plans – – – – – – – – – 52 – 52 18 70
Income tax on items that will not be reclassified subsequently to profit or loss D1(c) – – – – – – – – – (14) 10 (4) (8) (12)
17 – – – 38 10 65 16 81 Items that may be reclassified subsequently to profit or lossFair value gains/(losses)
Net investment hedge – – – – – – – – 43 – – 43 – 43 Available-for-sale investments
Fair value losses – – – – (6) – – – – – – (6) 1 (5)Recycled to profit or loss – – – – (9) – – – – – – (9) – (9)
Currency translation differences on translating foreign operations – – – – – – – – (899) – – (899) (358) (1,257)Other movements – – – – – – – 4 – (1) – 3 6 9 Income tax on items that may be reclassified subsequently to profit
or loss D1(c) – – – – 2 – – – – – – 2 – 2
Total comprehensive income for the financial year – – – – (13) 17 – 4 (856) 705 47 (96) (57) (153)Dividends for the year C3 – – – – – – – – – (336) (47) (383) (136) (519)Equity share-based payment transactions – – – – – – 48 – – 13 – 61 (17) 44 Other movements in share capital 5 1 10 – – – – – – 55 – 66 3 69 Preferred securities purchased – – – – – – – – – (21) (156) (177) – (177)Change in participation in subsidiaries – – – – – – – – – (17) – (17) 17 –
Transactions with shareholders 5 1 10 – – – 48 – – (306) (203) (450) (133) (583)
Shareholders’ equity at end of the year 4,897 560 845 1,717 52 161 316 37 (1,234) 4,290 526 7,270 1,767 9,037
Retained earnings were reduced in respect of own shares held in policyholder’s funds, ESOP trusts, Black Economic Empowerment trusts and other undertakings at 31 December 2013 by £428 million (2012: £489 million).
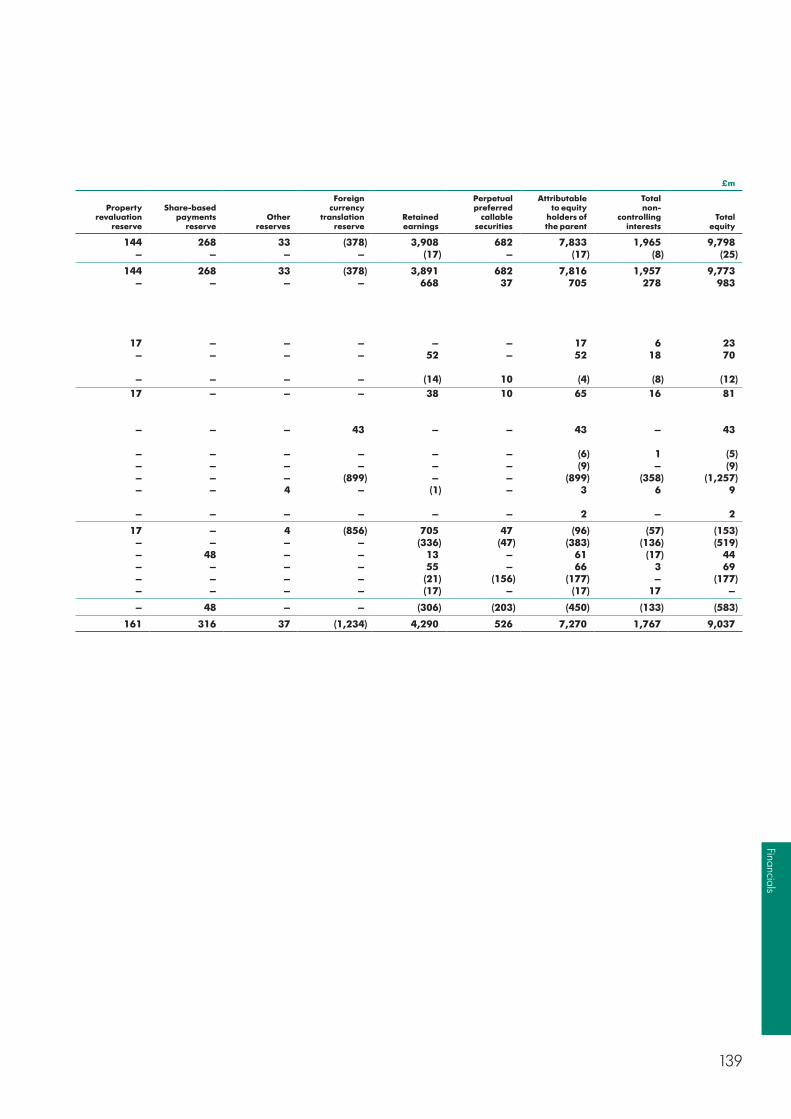
139
Financials
Millions £m
Year ended 31 December 2013 Notes
Number of shares
issued and fully paid
Share capital
Share premium
Merger reserve
Available- for-sale reserve
Property revaluation
reserve
Share-based payments
reserveOther
reserves
Foreign currency
translation reserve
Retained earnings
Perpetual preferred
callable securities
Attributable to equity
holders of the parent
Total non-
controlling interests
Total equity
Shareholders’ equity at beginning of the year 4,892 559 835 1,717 65 144 268 33 (378) 3,908 682 7,833 1,965 9,798 Impact of changes in accounting policies J1 – – – – – – – – – (17) – (17) (8) (25)
Restated shareholders’ equity at beginning of the year 4,892 559 835 1,717 65 144 268 33 (378) 3,891 682 7,816 1,957 9,773 Profit after tax for the financial year – – – – – – – – – 668 37 705 278 983 Other comprehensive incomeItems that will not be reclassified subsequently to profit
or lossFair value gains
Property revaluation – – – – – 17 – – – – – 17 6 23 Measurement gains on defined benefit plans – – – – – – – – – 52 – 52 18 70
Income tax on items that will not be reclassified subsequently to profit or loss D1(c) – – – – – – – – – (14) 10 (4) (8) (12)
17 – – – 38 10 65 16 81 Items that may be reclassified subsequently to profit or lossFair value gains/(losses)
Net investment hedge – – – – – – – – 43 – – 43 – 43 Available-for-sale investments
Fair value losses – – – – (6) – – – – – – (6) 1 (5)Recycled to profit or loss – – – – (9) – – – – – – (9) – (9)
Currency translation differences on translating foreign operations – – – – – – – – (899) – – (899) (358) (1,257)Other movements – – – – – – – 4 – (1) – 3 6 9 Income tax on items that may be reclassified subsequently to profit
or loss D1(c) – – – – 2 – – – – – – 2 – 2
Total comprehensive income for the financial year – – – – (13) 17 – 4 (856) 705 47 (96) (57) (153)Dividends for the year C3 – – – – – – – – – (336) (47) (383) (136) (519)Equity share-based payment transactions – – – – – – 48 – – 13 – 61 (17) 44 Other movements in share capital 5 1 10 – – – – – – 55 – 66 3 69 Preferred securities purchased – – – – – – – – – (21) (156) (177) – (177)Change in participation in subsidiaries – – – – – – – – – (17) – (17) 17 –
Transactions with shareholders 5 1 10 – – – 48 – – (306) (203) (450) (133) (583)
Shareholders’ equity at end of the year 4,897 560 845 1,717 52 161 316 37 (1,234) 4,290 526 7,270 1,767 9,037
Retained earnings were reduced in respect of own shares held in policyholder’s funds, ESOP trusts, Black Economic Empowerment trusts and other undertakings at 31 December 2013 by £428 million (2012: £489 million).

Old Mutual plcAnnual Report and Accounts 2013
140
GROUP FINANCIAL STATEMENTSCONSOLIDATED STATEMENT OF CHANGES IN EQUITYFor the year ended 31 December 2013
Millions £m
Year ended 31 December 2012 Restated1 Notes
Number of shares
issued and fully paid
Share capital
Share premium
Merger reserve
Available- for-sale reserve
Property revaluation
reserve
Share-based payments
reserveOther
reserves
Foreign currency
translation reserve
Retained earnings
Perpetual preferred
callable securities
Attributable to equity
holders of the parent
Total non-
controlling interests
Total equity
Shareholders’ equity at beginning of the year 5,801 580 805 2,532 53 124 230 5 301 3,170 688 8,488 2,370 10,858 Impact of changes in accounting policies J1 – – – – – – – – – (20) – (20) – (20)
Restated shareholders’ equity at beginning of the year 5,801 580 805 2,532 53 124 230 5 301 3,150 688 8,468 2,370 10,838 Profit after tax for the financial year – – – – – – – – – 1,140 32 1,172 306 1,478 Other comprehensive incomeItems that will not be reclassified subsequently to profit
or lossFair value gains
Property revaluation – – – – – 19 – – – – – 19 1 20 Measurement gain on defined benefit plans – – – – – – – – – 8 – 8 – 8
Income tax on items that will not be reclassified subsequently to profit or loss D1(c) – – – – – – – – – (4) 10 6 – 6
– – – – – 19 – – – 4 10 33 1 34 Items that may be reclassified subsequently to profit or lossFair value gains/(losses)
Net investment hedge – – – – – – – – 160 – – 160 – 160 Available-for-sale investments
Fair value gains – – – – 33 – – – – – – 33 1 34 Recycled to profit or loss – – – – (21) – – – – – – (21) – (21)
Exchange differences recycled to profit or loss – – – – – – – – (350) – – (350) – (350)Shadow accounting – – – – 6 – – – – – – 6 – 6 Currency translation differences on translating foreign operations – – – – – – – – (489) – – (489) (150) (639)Other movements – – – – – 1 – 4 – (40) – (35) 10 (25)Income tax on items that may be reclassified subsequently to profit
or loss D1(c) – – – – (6) – – – – – – (6) – (6)
Total comprehensive income for the financial year – – – – 12 20 – 4 (679) 1,104 42 503 168 671 Dividends for the year C3 – – – – – – – – – (1,172) (42) (1,214) (169) (1,383)Equity share-based payment transactions – – – – – – 38 – – – – 38 13 51 Other movements in share capital 27 3 30 – – – – – – 7 – 40 – 40 Cancellation of treasury shares (239) (24) – – – – – 24 – – – – – –Share consolidation (697) – – – – – – – – – – – – –Preferred securities purchased – – – – – – – – – (13) (6) (19) (445) (464)Merger reserve realised in the year – – – (815) – – – – – 815 – – – –Change in participation in subsidiaries – – – – – – – – – – – – 20 20
Transactions with shareholders (909) (21) 30 (815) – – 38 24 – (363) (48) (1,155) (581) (1,736)
Shareholders’ equity at end of the year 4,892 559 835 1,717 65 144 268 33 (378) 3,891 682 7,816 1,957 9,773
1 The prior year has been restated for the impact of changes in accounting policies. Refer to note J1 for further details.
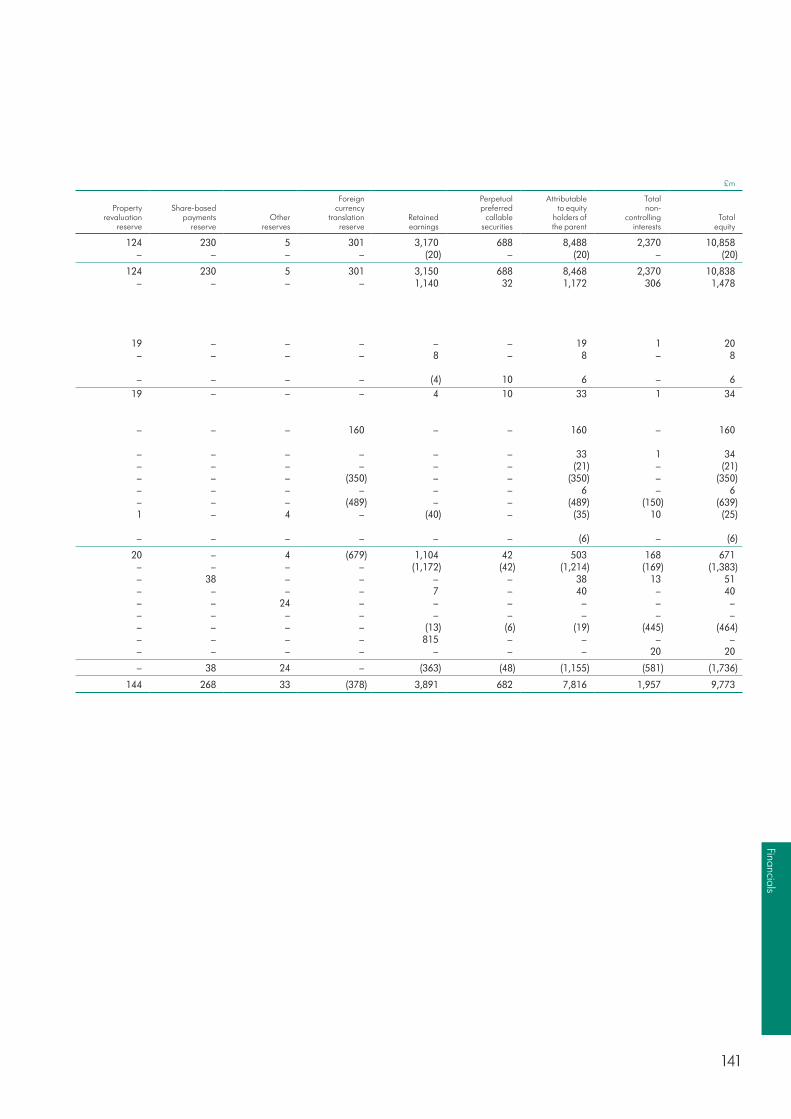
141
Financials
Millions £m
Year ended 31 December 2012 Restated1 Notes
Number of shares
issued and fully paid
Share capital
Share premium
Merger reserve
Available- for-sale reserve
Property revaluation
reserve
Share-based payments
reserveOther
reserves
Foreign currency
translation reserve
Retained earnings
Perpetual preferred
callable securities
Attributable to equity
holders of the parent
Total non-
controlling interests
Total equity
Shareholders’ equity at beginning of the year 5,801 580 805 2,532 53 124 230 5 301 3,170 688 8,488 2,370 10,858 Impact of changes in accounting policies J1 – – – – – – – – – (20) – (20) – (20)
Restated shareholders’ equity at beginning of the year 5,801 580 805 2,532 53 124 230 5 301 3,150 688 8,468 2,370 10,838 Profit after tax for the financial year – – – – – – – – – 1,140 32 1,172 306 1,478 Other comprehensive incomeItems that will not be reclassified subsequently to profit
or lossFair value gains
Property revaluation – – – – – 19 – – – – – 19 1 20 Measurement gain on defined benefit plans – – – – – – – – – 8 – 8 – 8
Income tax on items that will not be reclassified subsequently to profit or loss D1(c) – – – – – – – – – (4) 10 6 – 6
– – – – – 19 – – – 4 10 33 1 34 Items that may be reclassified subsequently to profit or lossFair value gains/(losses)
Net investment hedge – – – – – – – – 160 – – 160 – 160 Available-for-sale investments
Fair value gains – – – – 33 – – – – – – 33 1 34 Recycled to profit or loss – – – – (21) – – – – – – (21) – (21)
Exchange differences recycled to profit or loss – – – – – – – – (350) – – (350) – (350)Shadow accounting – – – – 6 – – – – – – 6 – 6 Currency translation differences on translating foreign operations – – – – – – – – (489) – – (489) (150) (639)Other movements – – – – – 1 – 4 – (40) – (35) 10 (25)Income tax on items that may be reclassified subsequently to profit
or loss D1(c) – – – – (6) – – – – – – (6) – (6)
Total comprehensive income for the financial year – – – – 12 20 – 4 (679) 1,104 42 503 168 671 Dividends for the year C3 – – – – – – – – – (1,172) (42) (1,214) (169) (1,383)Equity share-based payment transactions – – – – – – 38 – – – – 38 13 51 Other movements in share capital 27 3 30 – – – – – – 7 – 40 – 40 Cancellation of treasury shares (239) (24) – – – – – 24 – – – – – –Share consolidation (697) – – – – – – – – – – – – –Preferred securities purchased – – – – – – – – – (13) (6) (19) (445) (464)Merger reserve realised in the year – – – (815) – – – – – 815 – – – –Change in participation in subsidiaries – – – – – – – – – – – – 20 20
Transactions with shareholders (909) (21) 30 (815) – – 38 24 – (363) (48) (1,155) (581) (1,736)
Shareholders’ equity at end of the year 4,892 559 835 1,717 65 144 268 33 (378) 3,891 682 7,816 1,957 9,773
1 The prior year has been restated for the impact of changes in accounting policies. Refer to note J1 for further details.
Old Mutual plcAnnual Report and Accounts 2013
142
GROUP FINANCIAL STATEMENTSNOTES TO THE CONSOLIDATED FINANCIAL STATEMENTSFor the year ended 31 December 2013
A: Significant accounting policies
A1: Basis of preparation
Statement of complianceOld Mutual plc (the Company) is a company incorporated in England and Wales.
The Group financial statements consolidate those of the Company and its subsidiaries (together referred to as the ‘Group’) and equity account the Group’s interest in associates and joint ventures (other than those held by life assurance funds which are accounted for as investments). The Parent Company financial statements present information about the Company as a separate entity and not about the Group.
Both the Parent Company financial statements and the Group financial statements have been prepared and approved by the directors in accordance with IFRS as adopted by the EU. On publishing the Parent Company financial statements here together with the Group financial statements, the Company is taking advantage of the exemption in section 408 of the Companies Act 2006 not to present its individual income statement and related notes that form a part of these approved financial statements.
The accounting policies adopted by the Company and Group, unless otherwise stated, have been applied consistently to all periods presented in these consolidated financial statements.
The financial statements are prepared on the historical cost basis except that the following assets and liabilities are stated at their fair value: derivative financial instruments, financial assets and liabilities designated as fair value through profit or loss or as available-for-sale, owner-occupied property and investment property. Non-current assets and disposal groups held for sale are stated at the lower of the previous carrying amount and the fair value less costs to sell.
The Parent Company financial statements are prepared in accordance with these accounting policies, other than for investments in subsidiary undertakings and associates, which are stated at cost less impairments (see note E1(m)), in accordance with IAS 27.
The Company and Group financial statements have been prepared on the going concern basis which the directors believe to be appropriate having taken into consideration the points as set out in the Directors’ Report in the section headed Going concern.
Judgements made by the directors in the applications of these accounting policies that have a significant effect on the financial statements, and estimates with a significant risk of material adjustment in the next year, are discussed in note A3.
Translation of foreign operationsThe assets and liabilities of foreign operations are translated from their respective functional currencies into the Group’s presentation currency using the year-end exchange rates, and their income and expenses using the average exchange rates. Other than in respect of cumulative translation gains and losses up to 1 January 2004, cumulative unrealised gains or losses resulting from translation of functional currencies to the presentation currency are included as a separate component of shareholders’ equity. To the extent that these gains and losses are effectively hedged, the cumulative effect of such gains and losses arising on the hedging instruments are also included in that component of shareholders’ equity. Upon the disposal of subsidiaries the cumulative amount of exchange differences deferred in shareholders’ equity, net of attributable amounts in relation to net investments, is recognised in profit or loss. Cumulative translation gains and losses up to 1 January 2004, being the effective date of the Group’s conversion to IFRS, were reset to zero.
The principal exchange rates used to translate the operating results, assets and liabilities of key foreign business segments to pounds sterling are:
Year ended 31 December 2013 Year ended 31 December 2012
Income statement
(average rate)
Statement of financial
position (closing rate)
Income statement
(average rate)
Statement of financial
position (closing rate)
Rand 15.0959 17.4284 13.0123 13.7696 US dollars 1.5650 1.6566 1.5850 1.6242 Euro 1.1782 1.2014 1.2326 1.2307
Developments during 2013Other than changes arising from new accounting developments as mentioned in note A5, the Group has not made any changes to the accounting policies during the year. Disclosures about the impact of future standards can be found in note A6.
These financial statements describe the material accounting policies and those which involve significant judgement, optionality in application and are material to the Group’s overall financial statements. As such items which are immaterial or duplicated elsewhere in the Annual Report and Accounts have been removed from these financial statements.
A detailed list of the Group’s accounting policies can be found at www.oldmutual.com. The contents of the website are not subject to audit.

143
Financials
A2: Significant corporate activity and business changes during the year
Acquisitions effective during the yearLife assurance in Nigeria On 22 February 2012, the Group announced that it had made an offer to acquire a majority stake in Oceanic Life, the life assurance operations of Ecobank Transitional Incorporated. The Group consolidated the financial results of Oceanic Life with effect from 1 January 2013.
General insurance in Nigeria In December 2013 the Group completed its acquisition of the majority stake in the general insurance business of Oceanic General, the general insurance operations of Ecobank Transitional Incorporated. The balance sheet has been included in the Group consolidated statement of financial position as at 31 December 2013.
Life assurance in Ghana On 3 June 2013, the Group announced that it would expand its African presence through the acquisition of a majority stake in Provident Life Assurance Company Limited. The Group consolidated the financial results of Provident Life with effect from 12 September 2013.
Platform and distribution business in Uruguay On 19 November 2012, the Group announced that it had acquired a majority stake in AIVA Holding Group S.A., a business platform and distribution business based in Uruguay and spanning the Latin American region. The Group consolidated the financial results with effect from 19 November 2012.
Refer to note H8 for further information on the Group’s acquisitions during the year.
The Group is currently progressing the following transactionsLending in Kenya On 3 July 2013, the Group announced that it is to enter into a strategic partnership with Faulu Kenya DTM LTD through the acquisition of a controlling stake in the business. The completion of this transaction is subject to the conclusion of the relevant closing conditions.
Lending in MozambiqueOn 3 May 2013, the Group announced that Nedbank had entered into an agreement to acquire an initial 36.4% shareholding of Banco Unico, SA, located in Mozambique and to increase the stake to a majority shareholding over time. The completion of this transaction is subject to certain conditions precedent being met.
Skandia PolandOn 12 November 2013, the Group announced that terms have been agreed to sell Skandia Poland, part of Old Mutual Wealth. The transaction is subject to regulatory approvals and is expected to be completed during 2014.
The Group has completed the following intra-Group transfers during 2013Transfer of Latin American business to Old Mutual South AfricaThe Financial Services Board has approved the acquisition of Skandia Europe and Latin America Holdings Limited by Old Mutual South Africa from Old Mutual plc and the transaction was completed on 12 July 2013. This resulted in a remittance of £120 million to Old Mutual plc.
Transfer of Old Mutual Guodian Life Insurance Company Limited (Guodian) to Old Mutual Life Assurance Company (South Africa) Limited (OMLACSA)Legal ownership of the Guodian business, the Group’s Chinese joint venture, was transferred to OMLACSA during the year in order to align legal ownership and management structures. Guodian was previously owned by the Skandia Insurance Company Limited (SICL), which was sold as part of the sale of the Nordic businesses in 2012. The transfer of Guodian from SICL had been subject to regulatory approval. Upon transfer OMLACSA paid consideration of £44 million, which was ultimately remitted to Old Mutual plc. The results of the Guodian business were reported in the Emerging Markets segmental result in both of the years ended 31 December 2012 and 2013.
Financing activitiesRepayment of Group debtOn 19 November 2013, the Group repurchased £75 million of its £348 million Tier 1 preferred callable securities and €121 million of its €495 million Upper Tier 2 preferred callable securities via a Modified Dutch Auction tender. At 31 December 2013, £273 million Tier 1 and €374 million Upper Tier 2 preferred callable securities remained outstanding. For the year ended 31 December 2013, the Group recognised a loss of £21 million directly in equity, as these securities are classified as equity instruments for accounting purposes.
A total $14 million of the outstanding $16 million secured senior debt was repaid in two tranches on 1 November 2013 and 15 December 2013.
New debt issued by NedbankDuring the year, Nedbank issued R3.0 billion new-style, fully loss-absorbent, Basel lll compliant, Tier 2 subordinated-debt capital to replace the R2.1 billion of Basel II Tier 2 capital that matured in September 2013 and December 2013.
Repatriation of Old Mutual Bermuda capitalIn July 2013, Old Mutual Bermuda received formal written approval from the Bermuda Monitory Authority (BMA) to repatriate $450 million via cancellation of OM Group (UK) Limited loan notes. In December 2013, the BMA approved an additional repatriation of $100 million via cancellation of further loan notes.

Old Mutual plcAnnual Report and Accounts 2013
144
GROUP FINANCIAL STATEMENTSNOTES TO THE CONSOLIDATED FINANCIAL STATEMENTSFor the year ended 31 December 2013
A: Significant accounting policies continued
A3: Critical accounting estimates and judgements
In the preparation of these financial statements, the Group is required to make estimates and judgements that affect items reported in the consolidated income statement, statement of financial position, other primary statements and related supporting notes.
Critical accounting estimates and judgements are those which involve the most complex or subjective judgements or assessments. Where applicable the Group applies estimation and assumption setting techniques that are aligned with relevant actuarial and accounting guidance based on knowledge of the current situation. This requires assumptions and predictions of future events and actions. The only change to critical accounting estimates that the Group applied during the year ended 31 December 2013 has been in respect of consolidation of certain entities in accordance with the requirements of IFRS 10. There have been no other significant methodology changes to the critical accounting estimates and judgements that the Group applied at 31 December 2012. The significant accounting policies are described in the relevant notes.
The key areas of the Group’s business that typically require such estimates and the relevant accounting policies and notes are as follows:
Area Policy note More detail
Financial assets and liabilities E1 E4Life assurance contract provisions E8 E8Deferred acquisition costs E8 F3Intangible assets and goodwill F1 F1Consolidation A3(d) G3Tax A3(c) D1/F7
Specific areas that have required closer attention in respect of the estimates and judgements during the year ended 31 December 2013 are explained in more detail below:
(a) Loans and advances
Provisions for impairment of loans and advancesThe majority of loans and advances are in respect of Nedbank, which assesses its loan portfolios for impairment at each financial reporting date. Nedbank actively manages its exposure to loans and advances through robust credit approval processes. The credit loss ratio at year ended 31 December 2013 was 1.06% (2012: 1.05%). The impairment for performing loans is calculated on a portfolio basis, based on historical loss experience, adjusted for national and industry specific economic conditions and other indicators present at the reporting date that correlate with defaults on the portfolio. These include early arrears and other indicators of potential default, such as changes in macro-economic conditions and legislation affecting credit recovery. These annual loss ratios are applied to loan balances in the portfolio and scaled to the estimated loss emergence period.
For portfolios which comprise large numbers of small homogeneous assets with similar risk characteristics where credit scoring techniques are generally used, statistical techniques are used to calculate impairment allowances on the portfolio, based on historical recovery rates and assumed emergence periods. There are a number of models in use, each tailored to a product, line of business or client category. Judgement and knowledge are needed in selecting the statistical methods to use when the models are developed or revised.
For wholesale (larger) exposures, impairment allowances are calculated on an individual basis and all relevant considerations that have a bearing on the expected future cash flows are taken into account. The level of impairment allowance is the difference between the value of the discounted expected future cash flows and its carrying amount. Subjective judgements are made in the calculations of future cash flows and change with time as new information becomes available or as strategies evolve, resulting in frequent revisions to the impairment provision as individual decisions are taken.
Further detail is provided in note E3.
(b) Policyholder liabilities
Emerging Markets discretionary reservesTechnical provisions in South Africa are derived as the aggregate of:
■ Best estimate liabilities, with assumptions allowing for the best estimate of future experience and a market-consistent valuation of financial options and guarantees
■ Compulsory margins, prescribed in the South African professional actuarial guidance note (SAP 104) as explicit changes to actuarial assumptions that increase the level of technical provisions held, and
■ Discretionary margins, permitted by SAP 104, to allow for the uncertainty inherent in estimates of future experience after considering available options of managing that experience over time, or to defer the release of profits consistent with policy design or company practice.
Discretionary margins are held as either implicit or explicit margins. Explicit discretionary margins are derived as conscious changes to assumptions used to project future experience to increase technical provisions. Implicit discretionary margins arise where the method used to calculate overall technical provisions results in liabilities that are greater than the sum of best estimate liabilities and compulsory margins.

145
Financials
Explicit discretionary margins of £489 million (1.9% of total technical provisions) were held at 31 December 2013. This consisted largely of:
■ Margins held for Mass Foundation Cluster protection business, which allow for the uncertainty related to the future progression of the AIDS pandemic in South Africa, as well as future lapse experience and future investment returns, and to ensure that profit is released appropriately over the term of the policies
■ Margins to allow for the uncertainty inherent in the assumptions used to value financial options and guarantees, implied volatility assumptions in particular, which are difficult to hedge due to the short-term nature of the equity option market in South Africa
■ Margins on non-profit annuities, due to the inability to fully match assets to liabilities as a result of the limited availability of long-dated bonds, and to provide for longevity risk, and
■ A margin set up in 2013 to allow for the uncertainty inherent in future economic assumptions used to calculate, mainly protection product liabilities, in the Retail Affluent business. Although interest rate hedging is used to manage interest rate risk on these products, the volatility of bond yields in South Africa means that it is difficult to maintain appropriate hedging positions without incurring significant trading costs. The discretionary margin therefore caters for the residual uncertainty present after allowing for the hedge programme that is in place.
Emerging Markets Financial Soundness Valuation discount rateThe calculation of the Group’s South African life assurance contract liabilities is sensitive to the discount rate used to value the liabilities. The methodology applied by the Group requires discount rates to be set according to the South African professional guidance note (SAP 104). In line with these principles, the reference rate is selected as the Bond Exchange of South Africa (BESA) par bond 10-year yield.
The reference rate was relatively volatile over 2013, ranging from 6.2% to 8.5% during the year ended 31 December 2013 (2012: 6.9% to 8.2%). At 31 December 2013 the reference discount rate was 8.1% (2012: 6.9%). The volatile interest rate environment had a much smaller impact on the operating profit for the South African life assurance businesses in 2013, given the management actions taken over 2013 to mitigate these impacts. These included the continuance of the hedging program put in place during the second half of 2012, the establishment of discretionary margins to allow for the uncertainty in respect of interest rate volatility in Retail Affluent, and changes to the annual premium and cover increase policy on Mass Foundation Cluster funeral products.
The Group estimates that a 1% reduction in the reference discount rate will result in an increase in policyholder liabilities of £6 million (2012: £39 million), allowing for the impact of the hedging program. The 2013 impact is significantly lower than 2012 mainly, due to the management actions taken to reduce the impact of changing discount rates on operating profit, as well as the depreciation of the Rand which reduced the impact in Sterling terms.
Further disclosure of the policyholder sensitivity to interest rates is provided in note E8(g).
Old Mutual Bermuda guaranteesSince the closure of Old Mutual Bermuda to new business in March 2009, management’s key priorities have been to de-risk the business, manage the risk and solvency position and preserve shareholder value. The run-off of the book and hedging of the guarantees significantly reduces the Group’s risk exposure. The active contracts for which reserves are held are deferred and fixed index annuity investments and variable annuity products, which include guaranteed minimum accumulation benefits (GMAB) and guaranteed minimum death benefits (GMDB). The key risk to the Group relates to the 120% of the initial deposit (or, if elected, the highest anniversary account value) on the 10th anniversary which will commence in 2017. The Group has implemented a hedging strategy to protect against markets rising above the 120% guarantee and then subsequently falling, which would reset some guarantees above 120%, with account values at a lower level. This reduces the uncertainty and volatility of capital exposure and cash flows arising from the highest anniversary value guarantees. The remaining 120% of premium guarantee, relating to equity and foreign exchange downside risks, for the 10-year obligations are being managed by the dynamic hedge programme. There are no significant risks to the Group associated with GMDB and management continues to operate strong oversight over the business.
During 2013 the business continued to experience high rates of surrender activity which can be attributed to the variable annuity UGO (Universal Guarantee Option) GMAB policyholders passing through a top-up process on the fifth anniversary following product inception. This process was completed in 2013. The reduced size of the book has meant that the associated GMAB reserves have reduced from $229 million at 31 December 2012 to $84 million at 31 December 2013.
(c) TaxIncome tax on the profit or loss for the year comprises current and deferred tax. Income tax is recognised in profit or loss except to the extent that it relates to items recognised directly in other comprehensive income, in which case it is recognised in other comprehensive income.
The Group is regularly in discussion with the respective tax authorities in each of the jurisdictions where the Group is active. The Group applies its judgement to determine if a provision for future tax uncertainties should be recognised based on detailed reviews of any potential exposure to tax authorities and the assessment of the most probable outcome of the tax uncertainty. As these provisions are based on estimates and rely on judgements made by the Group, the actual amount of future taxes paid by the Group could be different to the amounts provided.

Old Mutual plcAnnual Report and Accounts 2013
146
GROUP FINANCIAL STATEMENTSNOTES TO THE CONSOLIDATED FINANCIAL STATEMENTSFor the year ended 31 December 2013
A: Significant accounting policies continued
A3: Critical accounting estimates and judgements continued
(d) Consolidation set of standardsThe Group has applied the following key judgements in the application of the requirements of the consolidation set of standards (IFRS 10 ‘Consolidated Financial Statements’ and IFRS 11 ‘Joint Arrangements’):
Consolidation of investment funds and securitisation vehicles The Group acts as a fund manager to a number of investment funds. In determining whether the Group controls such a fund, it will focus on an assessment of the aggregate economic interests of the Group (comprising any carried interests and expected management fees) and the investor’s rights to remove the fund manager. The Group assesses, on an annual basis, such interests to determine if the fund will be consolidated. See note G3(b) for disclosures in respect of the investment funds in which the Group has an interest.
The Group has sponsored certain asset backed financing (securitisation) vehicles under its securitisation programme which are run according to pre-determined criteria that are part of the initial design of the vehicles. The Group is exposed to variability of returns from the vehicles through its holding of junior debt securities in the vehicles. It has concluded that it controls these vehicles and therefore has consolidated these asset backed financing vehicles.
Structured entitiesThe Group is required to make judgements on what constitutes a structured entity. Accounting standards define a structured entity as an entity designed so that its activities are not governed by way of voting rights. In assessing whether the Group has power over such investees in which it has an interest, the Group considers factors such as the purpose and design of the investee, its practical ability to direct the relevant activities of the investee, the nature of its relationship with the investee and the size of its exposure to the variability of returns of the investee. The Group has evaluated all exposures and has concluded that all investments in investment funds and securitisation vehicles represent investments in structured entities.
A4: Liquidity analysis of the statement of financial position
The Group’s statement of financial position is in order of liquidity as is permitted by IAS 1 ‘Presentation of Financial Statements’. In order to satisfy the requirements of IAS 1, the following analysis is given to describe how the statement of financial position lines are categorised between current and non-current balances, applying the principles laid out in IAS 1.
The following statement of financial position captions are generally classified as current – cash and cash equivalents, non-current assets held for sale, client indebtedness for acceptances, current tax receivable, third-party interests in the consolidation of funds, current tax payable, liabilities under acceptances and non-current liabilities held for sale. The following balances are generally classified as non-current – goodwill and other intangible assets, mandatory reserve deposits with central banks, property, plant and equipment, investment property, deferred tax assets, investments in associated undertakings and jointly controlled operations, deferred acquisition costs, deposits held with reinsurers, provisions, deferred revenue and deferred tax liabilities.
The following balances include both current and non-current portions – reinsurers’ shares of life assurance and general insurance business policyholder liabilities, loans and advances, investments and securities, other assets, derivative financial assets and liabilities, life assurance and general insurance policyholder liabilities, borrowed funds, amounts owed to bank depositors and other liabilities. The split between the current and non-current portions for these assets and liabilities is given either by way of a footnote to the relevant note to the accounts or by way of a maturity analysis (in respect of major financial liability captions).
A5: Standards, amendments to standards, and interpretations adopted in the 2013 annual financial statements
The following standards, amendments to standards and interpretations, which are relevant to the Group, have been adopted in these financial statements:
■ Amendments to IFRS 7 ‘Financial Instruments: Disclosures’ require that the Group discloses additional information to evaluate the actual or potential effect of netting arrangements relating to financial assets and financial liabilities in the statement of financial position
■ IFRS 10 ‘Consolidated Financial Statements’, IFRS 11 ‘Joint Arrangements’, and IFRS 12 ‘Disclosures of interests in other entities’. These standards all relate to how the Group accounts for its interests in subsidiaries and joint ventures, together with new disclosures regarding these investments. The revised accounting policy is described in the detailed accounting policies. The Group continually assesses those entities which require consolidation
■ IFRS 13 ‘Fair Value Measurement’ is a new standard clarifying the principles on the determination of fair value and containing a comprehensive disclosure framework. The standard defines fair value as the price that would be received to sell an asset or paid to transfer a liability in an orderly transaction between market participants at the measurement date. The standard does not require the recognition of any assets or liabilities at fair value other than those prescribed by other standards
147
Financials
■ Amendments to IAS 1 ‘Presentation of Items of Other Comprehensive Income’ require that an entity present separately the items of OCI that may be reclassified to profit or loss in the future from those that would never be reclassified to profit or loss. This amendment affected presentation only and had no impact on the shareholders’ equity or profit
■ Amendments to IAS 19 ‘Defined Benefit Plans’; specifically for defined benefit plans. The key amendments are: — the corridor method has been removed and all actuarial gains and losses are required to be recognised in OCI rather in profit or loss. Expected returns on plan assets are no longer recognised in profit or loss. Instead, interest is recognised on the net defined benefit liability or asset in profit or loss, calculated using the discount rate used to measure the defined benefit obligation
— past service costs arising from plan amendments or curtailment are now recognised in profit or loss at the earlier of when the amendment occurs or when the related restructuring or termination costs are recognised. The option to amortise such cost over future years has also been eliminated
■ Amendments to IAS 36 ‘Impairment of Assets’ which, among other minor amendments, eliminates certain disclosure requirements. The adoption of this amendment did not have an effect on the financial statements
■ The adoption of the above standards has been according to the effective date published by the International Accounting Standards Board, which for IFRS 10, 11, 12 and 13 is earlier than required by the EU.
The impact of the adoption of these standards can be found in J1.
A6: Future standards, amendments to standards and interpretations not early-adopted in the 2013 annual financial statements
At the date of authorisation of these financial statements, the following standards, amendments to standards, and interpretations, which are relevant to the Group, have been issued by the International Accounting Standards Board.
IFRS 9 Financial instrumentsThe IASB has issued components of IFRS 9 ‘Financial Instruments’, which is the first step in its project to replace IAS 39 ‘Financial instruments: Recognition and Measurement’ in its entirety. The project has three main phases:
■ Phase I: Classification and measurement of financial instruments ■ Phase II: Amortised cost and impairment of financial assets, and ■ Phase III: Hedge accounting.
IFRS 9, as currently issued, includes requirements for the classification and measurement, derecognition and hedge accounting for financial assets and liabilities and additional disclosure requirements. The main changes from IAS 39 are:
■ Financial assets are to be classified and measured based on the business model for managing the financial asset and the cash flow characteristics of the financial asset, either at fair value or amortised cost
■ A financial asset or liability that would otherwise be at amortised cost may only be designated at fair value through profit or loss if such a designation reduces an accounting mismatch
■ For financial liabilities designated as fair value through profit or loss a further requirement is that all changes in the fair value of financial liabilities attributable to credit risk be transferred to ‘Other Comprehensive Income’ with no recycling through profit or loss on disposal
■ A hedge accounting model that establishes a principles based approach that is more aligned to an entity’s risk management model.
The current effective date for IFRS 9 is 1 January 2018. However, the IASB adopted a phased approach for the release of IFRS 9, with complex rules for the early adoption of portions of the standard.
The implementation of IFRS 9 is anticipated to have a significant impact on the preparation of the Group’s financial statements. The adoption of the standard will have the biggest impact on Emerging Markets and Nedbank.
Other standardsThe following amendments to the IASB standards which are effective for the Group on 1 January 2014 are unlikely to have a material impact on the Group’s financial statements:
■ Offsetting Financial Assets and Financial Liabilities (Amendments to IAS 32) ■ Investment Entities (Amendments to IFRS 10, IFRS 12 and IAS 27) ■ Novation of Derivatives and Continuation of Hedge Accounting (Amendments to IAS 39) ■ Amendments as a result of the annual improvements projects ■ Recognition of levies imposed by a government (IFRIC 21).

Old Mutual plcAnnual Report and Accounts 2013
148
GROUP FINANCIAL STATEMENTSNOTES TO THE CONSOLIDATED FINANCIAL STATEMENTSFor the year ended 31 December 2013
B: Segment information
B1: Basis of segmentation
The Group’s segmental results are analysed and reported on a basis consistent with the way that management and the Board of directors assesses performance and allocates resources. Information is presented to the Board on a consolidated basis in pounds sterling (the presentation currency) and in the functional currency of each business.
Adjusted operating profit is one of the key measures reported to the Group’s management and Board of directors for their consideration in the allocation of resources to and the review of performance of the segments. The Group utilises additional measures to assess the performance of each of the segments, depending on the business line, this typically includes net client cash flows, funds under management, gross earned premiums, underwriting results, net interest income and non-interest revenue and credit losses.
A reconciliation between the segment revenues and expenses and the Group’s revenues and expenses is shown in note B3. Consistent with internal reporting, assets, liabilities, revenues and expenses that are not directly attributable to a particular segment are allocated between segments where appropriate and where there is a reasonable basis for doing so. The Group accounts for inter-segment revenues and transfers as if the transactions were with third parties at current market prices. Given the nature of the operations, there are no major trading activities between the segments.
The revenues generated in each reported segment can be seen in the analysis of profits and losses in note B3. The segmental information in notes B3 and B4, reflects the adjusted and IFRS measures of profit and loss and the assets and liabilities for each operating segment as provided to management and the Board of directors. There are no differences between the measurement of the assets and liabilities reflected in the primary statements and that reported for the segments.
There are four primary business activities from which the Group generates revenues. These are life assurance (premium income), asset management business (fee and commission income), banking (banking interest receivable) and general insurance (premium income). The principal lines of business from which each operating segment derives its revenues are as follows:
Core operationsEmerging Markets – life assurance and asset managementOld Mutual Wealth – life assurance and asset managementProperty & Casualty – general insuranceNedbank – banking and asset managementUS Asset Management – asset management
Non-core operationsOld Mutual Bermuda – life assurance
Segment presentationIn the 2012 Annual Report and Accounts, the Group announced that, with effect from 1 January 2013, all of the Group’s Property & Casualty activities would be reported as a single segment. Consequently, the Mutual & Federal segment has been renamed as Property & Casualty. This segment includes Mutual & Federal, 100% of iWyze, previously reported as a 50% joint venture between Emerging Markets and Mutual & Federal, and the general insurance businesses in Namibia and Botswana. The name change has been applied to all reporting periods. Comparative information for the year ended 31 December 2012 has been restated accordingly.
In addition to the above, the Long-Term Savings aggregation has been removed from the adjusted operating profit statement, segmental information and in the statement of financial position in notes B3 and B4 of the annual financial statements. The Long-Term Savings segment was a sub total of the Emerging Markets and Old Mutual Wealth segments which the Group previously elected to disclose. This presentational change has been applied to all reporting periods.
The Group’s reported segments are now Emerging Markets, Old Mutual Wealth, Property & Casualty, Nedbank and US Asset Management (USAM). The Other segment includes Group head office. Old Mutual Bermuda is the principal component of the non-core operations. For all reporting periods, Old Mutual Bermuda is classified as a continuing operation in the IFRS income statement, but as non-core in determining the Group’s adjusted operating profit.
The Group continues to incur costs related to the sale of its Nordic business in 2012. These costs largely relate to the transition of IT information and support services that were previously provided by the Nordic business to the wider Group, back to the Group. These costs are included in the expenses related to the discontinued operations in the annual financial statements for the year ended 31 December 2013. Further information on the results of discontinued operations is provided in note I1. The Nordic business has been classified as a discontinued operation in the IFRS consolidated income statement and its results as non-core in determining the Group’s adjusted operating profit.
All other businesses have been classified as continuing operations for all reporting periods.

149
Financials
B2: Gross earned premiums and deposits to investment contracts
£m
Year ended 31 December 2013Emerging
MarketsOld Mutual
WealthProperty &
Casualty Total
Life assurance – insurance contracts 1,616 336 – 1,952 Life assurance – investment contracts with discretionary participation features 1,025 – – 1,025 General insurance – – 724 724
Gross earned premiums 2,641 336 724 3,701
Life assurance – other investment contracts recognised as deposits 2,015 5,889 – 7,904
£m
Year ended 31 December 2012Emerging
MarketsOld Mutual
WealthProperty &
Casualty Total
Life assurance – insurance contracts 1,673 362 – 2,035 Life assurance – investment contracts with discretionary participation features 970 – – 970 General insurance – – 720 720
Gross earned premiums 2,643 362 720 3,725
Life assurance – other investment contracts recognised as deposits 2,022 5,699 – 7,721

Old Mutual plcAnnual Report and Accounts 2013
150
GROUP FINANCIAL STATEMENTSNOTES TO THE CONSOLIDATED FINANCIAL STATEMENTSFor the year ended 31 December 2013
B: Segment information continued
B3: Adjusted operating profit statement – segment information for the year ended 31 December 2013
£m
NotesEmerging
MarketsOld Mutual
WealthProperty &
Casualty Nedbank USAM OtherConsolidation
adjustments
Adjusted operating
profit
Adjusting items
(note C1)
Discontinued and non-core
operations1
IFRS Income
statement
RevenueGross earned premiums B2 2,641 336 724 – – – – 3,701 – – 3,701 Outward reinsurance (80) (87) (150) – – – – (317) – – (317)
Net earned premiums 2,561 249 574 – – – – 3,384 – – 3,384 Investment return (non-banking) D2 5,153 4,159 31 – – 68 634 10,045 (94) 35 9,986 Banking interest and similar income D3 – – – 3,050 – – – 3,050 – – 3,050 Banking trading, investment and similar income D4 – – – 195 – – – 195 – – 195 Fee and commission income, and income from service activities D5 527 1,173 25 1,048 381 – 8 3,162 (67) – 3,095 Other income 39 21 – 31 3 (2) 2 94 – 6 100 Inter-segment revenues 61 1 14 11 – 8 (106) (11) – 11 –
Total revenue 8,341 5,603 644 4,335 384 74 538 19,919 (161) 52 19,810
ExpensesClaims and benefits (including change in insurance contract provisions) (4,505) (347) (556) – – – – (5,408) – (2) (5,410)Reinsurance recoveries 79 45 122 – – – – 246 – – 246
Net claims and benefits incurred (4,426) (302) (434) – – – – (5,162) – (2) (5,164)Change in investment contract liabilities (1,952) (3,921) – – – – – (5,873) – – (5,873)Losses on loans and advances – – – (368) – – – (368) – – (368)Finance costs (including interest and similar expenses) D6 – – – – – (92) – (92) 11 – (81)Banking interest payable and similar expenses D7 – – – (1,616) – – – (1,616) – – (1,616)Fee and commission expenses, and other acquisition costs D8 (228) (622) (113) (12) (4) – (70) (1,049) 78 (5) (976)Change in third-party interest in consolidated funds – – – – – – (564) (564) – – (564)Other operating and administrative expenses D9 (1,088) (408) (77) (1,495) (274) (78) (10) (3,430) (210) (13) (3,653)Income tax attributable to policyholder returns (62) (112) – – – – – (174) 174 – – Inter-segment expenses (6) (21) (19) (49) – (11) 106 – – – –
Total expenses (7,762) (5,386) (643) (3,540) (278) (181) (538) (18,328) 53 (20) (18,295)
Share of associated undertakings' and joint ventures' profit after tax G2 11 – 3 2 5 – – 21 – – 21 Loss on disposal of subsidiaries, associated undertakings and strategic investments C1(c) – – – – – – – – (4) – (4)
Adjusted operating profit/(loss) before tax and non-controlling interests 590 217 4 797 111 (107) – 1,612 (112) 32 1,532 Income tax expense D1 (155) (40) – (200) (27) (2) – (424) (128) – (552)Non-controlling interests (11) – (5) (282) – – – (298) 20 – (278)
Adjusted operating profit/(loss) after tax and non-controlling interests 424 177 (1) 315 84 (109) – 890 (220) 32 702 Adjusting items net of tax and non-controlling interests C1(a) (74) (139) (10) 12 (30) 21 – (220) 220 – –
Profit/(loss) after tax from continuing operations 350 38 (11) 327 54 (88) – 670 – 32 702 Profit from discontinued operations after tax I1 – – – – – – – – – 3 3
Profit/(loss) after tax attributable to equity holders of the parent 350 38 (11) 327 54 (88) – 670 – 35 705
1 Non-core operations relate to Old Mutual Bermuda. Old Mutual Bermuda profit after tax for the year ended 31 December 2013 was £32 million. Non-core operations also include a net gain of £3 million divestment cost and additional proceeds received in relation to the Nordic business sold in 2012. Further information on discontinued operations is provided in note I1.
Of the total revenues, excluding intercompany revenues, £4,947 million was generated in the UK (2012: £4,318 million), £864 million in the rest of Europe (2012: £1,196 million), £13,446 million in Southern Africa (2012: £13,966 million), £439 million in United States (2012: £529 million) and £114 million relates to other operating segments (2012: £83 million).

151
Financials
B: Segment information continued
B3: Adjusted operating profit statement – segment information for the year ended 31 December 2013
£m
NotesEmerging
MarketsOld Mutual
WealthProperty &
Casualty Nedbank USAM OtherConsolidation
adjustments
Adjusted operating
profit
Adjusting items
(note C1)
Discontinued and non-core
operations1
IFRS Income
statement
RevenueGross earned premiums B2 2,641 336 724 – – – – 3,701 – – 3,701 Outward reinsurance (80) (87) (150) – – – – (317) – – (317)
Net earned premiums 2,561 249 574 – – – – 3,384 – – 3,384 Investment return (non-banking) D2 5,153 4,159 31 – – 68 634 10,045 (94) 35 9,986 Banking interest and similar income D3 – – – 3,050 – – – 3,050 – – 3,050 Banking trading, investment and similar income D4 – – – 195 – – – 195 – – 195 Fee and commission income, and income from service activities D5 527 1,173 25 1,048 381 – 8 3,162 (67) – 3,095 Other income 39 21 – 31 3 (2) 2 94 – 6 100 Inter-segment revenues 61 1 14 11 – 8 (106) (11) – 11 –
Total revenue 8,341 5,603 644 4,335 384 74 538 19,919 (161) 52 19,810
ExpensesClaims and benefits (including change in insurance contract provisions) (4,505) (347) (556) – – – – (5,408) – (2) (5,410)Reinsurance recoveries 79 45 122 – – – – 246 – – 246
Net claims and benefits incurred (4,426) (302) (434) – – – – (5,162) – (2) (5,164)Change in investment contract liabilities (1,952) (3,921) – – – – – (5,873) – – (5,873)Losses on loans and advances – – – (368) – – – (368) – – (368)Finance costs (including interest and similar expenses) D6 – – – – – (92) – (92) 11 – (81)Banking interest payable and similar expenses D7 – – – (1,616) – – – (1,616) – – (1,616)Fee and commission expenses, and other acquisition costs D8 (228) (622) (113) (12) (4) – (70) (1,049) 78 (5) (976)Change in third-party interest in consolidated funds – – – – – – (564) (564) – – (564)Other operating and administrative expenses D9 (1,088) (408) (77) (1,495) (274) (78) (10) (3,430) (210) (13) (3,653)Income tax attributable to policyholder returns (62) (112) – – – – – (174) 174 – – Inter-segment expenses (6) (21) (19) (49) – (11) 106 – – – –
Total expenses (7,762) (5,386) (643) (3,540) (278) (181) (538) (18,328) 53 (20) (18,295)
Share of associated undertakings' and joint ventures' profit after tax G2 11 – 3 2 5 – – 21 – – 21 Loss on disposal of subsidiaries, associated undertakings and strategic investments C1(c) – – – – – – – – (4) – (4)
Adjusted operating profit/(loss) before tax and non-controlling interests 590 217 4 797 111 (107) – 1,612 (112) 32 1,532 Income tax expense D1 (155) (40) – (200) (27) (2) – (424) (128) – (552)Non-controlling interests (11) – (5) (282) – – – (298) 20 – (278)
Adjusted operating profit/(loss) after tax and non-controlling interests 424 177 (1) 315 84 (109) – 890 (220) 32 702 Adjusting items net of tax and non-controlling interests C1(a) (74) (139) (10) 12 (30) 21 – (220) 220 – –
Profit/(loss) after tax from continuing operations 350 38 (11) 327 54 (88) – 670 – 32 702 Profit from discontinued operations after tax I1 – – – – – – – – – 3 3
Profit/(loss) after tax attributable to equity holders of the parent 350 38 (11) 327 54 (88) – 670 – 35 705
1 Non-core operations relate to Old Mutual Bermuda. Old Mutual Bermuda profit after tax for the year ended 31 December 2013 was £32 million. Non-core operations also include a net gain of £3 million divestment cost and additional proceeds received in relation to the Nordic business sold in 2012. Further information on discontinued operations is provided in note I1.
Of the total revenues, excluding intercompany revenues, £4,947 million was generated in the UK (2012: £4,318 million), £864 million in the rest of Europe (2012: £1,196 million), £13,446 million in Southern Africa (2012: £13,966 million), £439 million in United States (2012: £529 million) and £114 million relates to other operating segments (2012: £83 million).
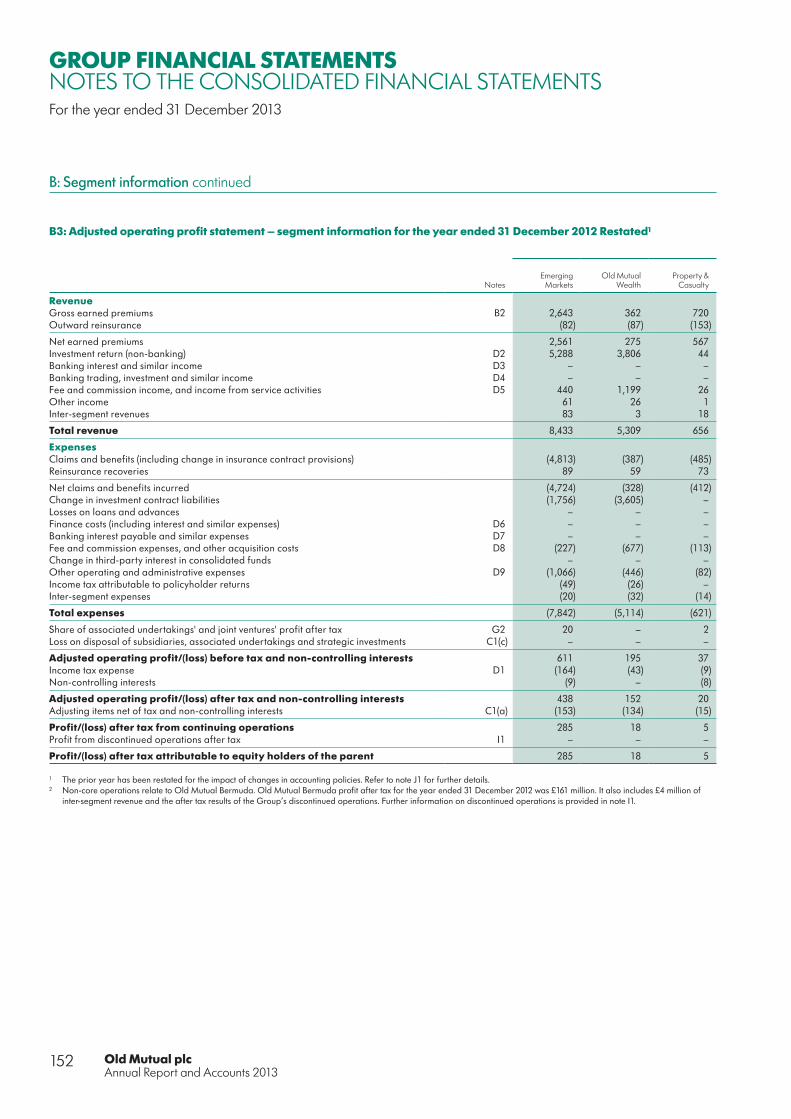
Old Mutual plcAnnual Report and Accounts 2013
152
GROUP FINANCIAL STATEMENTSNOTES TO THE CONSOLIDATED FINANCIAL STATEMENTSFor the year ended 31 December 2013
B: Segment information continued
B3: Adjusted operating profit statement – segment information for the year ended 31 December 2012 Restated1
£m
NotesEmerging
MarketsOld Mutual
WealthProperty &
Casualty Nedbank USAM OtherConsolidation
adjustments
Adjusted operating
profit
Adjusting items
(note C1)
Discontinued and non-core
operations2
IFRS Income
statement
RevenueGross earned premiums B2 2,643 362 720 – – – – 3,725 – – 3,725 Outward reinsurance (82) (87) (153) – – – – (322) – – (322)
Net earned premiums 2,561 275 567 – – – – 3,403 – – 3,403 Investment return (non-banking) D2 5,288 3,806 44 – 1 75 722 9,936 (191) 135 9,880 Banking interest and similar income D3 – – – 3,431 – – – 3,431 – – 3,431 Banking trading, investment and similar income D4 – – – 214 – – – 214 – – 214 Fee and commission income, and income from service activities D5 440 1,199 26 1,084 360 – 6 3,115 (76) – 3,039 Other income 61 26 1 23 1 – (1) 111 – 14 125 Inter-segment revenues 83 3 18 21 – 7 (156) (24) – 24 –
Total revenue 8,433 5,309 656 4,773 362 82 571 20,186 (267) 173 20,092
ExpensesClaims and benefits (including change in insurance contract provisions) (4,813) (387) (485) – – – – (5,685) – 73 (5,612)Reinsurance recoveries 89 59 73 – – – – 221 – – 221
Net claims and benefits incurred (4,724) (328) (412) – – – – (5,464) – 73 (5,391)Change in investment contract liabilities (1,756) (3,605) – – – – – (5,361) – – (5,361)Losses on loans and advances – – – (400) – – – (400) – – (400)Finance costs (including interest and similar expenses) D6 – – – – – (130) – (130) (84) – (214)Banking interest payable and similar expenses D7 – – – (1,886) – – – (1,886) (1) – (1,887)Fee and commission expenses, and other acquisition costs D8 (227) (677) (113) – (5) – (67) (1,089) 88 (63) (1,064)Change in third-party interest in consolidated funds – – – – – – (651) (651) – – (651)Other operating and administrative expenses D9 (1,066) (446) (82) (1,604) (276) (67) (9) (3,550) (147) (18) (3,715)Income tax attributable to policyholder returns (49) (26) – – – – – (75) 75 – – Inter-segment expenses (20) (32) (14) (58) – (32) 156 – – – –
Total expenses (7,842) (5,114) (621) (3,948) (281) (229) (571) (18,606) (69) (8) (18,683)
Share of associated undertakings' and joint ventures' profit after tax G2 20 – 2 – 10 – – 32 – – 32 Loss on disposal of subsidiaries, associated undertakings and strategic investments C1(c) – – – – – – – – (56) – (56)
Adjusted operating profit/(loss) before tax and non-controlling interests 611 195 37 825 91 (147) – 1,612 (392) 165 1,385 Income tax expense D1 (164) (43) (9) (221) (15) 12 – (440) (31) – (471)Non-controlling interests (9) – (8) (287) – (27) – (331) 25 – (306)
Adjusted operating profit/(loss) after tax and non-controlling interests 438 152 20 317 76 (162) – 841 (398) 165 608 Adjusting items net of tax and non-controlling interests C1(a) (153) (134) (15) 16 (10) (102) – (398) 398 – –
Profit/(loss) after tax from continuing operations 285 18 5 333 66 (264) – 443 – 165 608 Profit from discontinued operations after tax I1 – – – – – – – – – 564 564
Profit/(loss) after tax attributable to equity holders of the parent 285 18 5 333 66 (264) – 443 – 729 1,172
1 The prior year has been restated for the impact of changes in accounting policies. Refer to note J1 for further details.2 Non-core operations relate to Old Mutual Bermuda. Old Mutual Bermuda profit after tax for the year ended 31 December 2012 was £161 million. It also includes £4 million of
inter-segment revenue and the after tax results of the Group’s discontinued operations. Further information on discontinued operations is provided in note I1.

153
Financials
B: Segment information continued
B3: Adjusted operating profit statement – segment information for the year ended 31 December 2012 Restated1
£m
NotesEmerging
MarketsOld Mutual
WealthProperty &
Casualty Nedbank USAM OtherConsolidation
adjustments
Adjusted operating
profit
Adjusting items
(note C1)
Discontinued and non-core
operations2
IFRS Income
statement
RevenueGross earned premiums B2 2,643 362 720 – – – – 3,725 – – 3,725 Outward reinsurance (82) (87) (153) – – – – (322) – – (322)
Net earned premiums 2,561 275 567 – – – – 3,403 – – 3,403 Investment return (non-banking) D2 5,288 3,806 44 – 1 75 722 9,936 (191) 135 9,880 Banking interest and similar income D3 – – – 3,431 – – – 3,431 – – 3,431 Banking trading, investment and similar income D4 – – – 214 – – – 214 – – 214 Fee and commission income, and income from service activities D5 440 1,199 26 1,084 360 – 6 3,115 (76) – 3,039 Other income 61 26 1 23 1 – (1) 111 – 14 125 Inter-segment revenues 83 3 18 21 – 7 (156) (24) – 24 –
Total revenue 8,433 5,309 656 4,773 362 82 571 20,186 (267) 173 20,092
ExpensesClaims and benefits (including change in insurance contract provisions) (4,813) (387) (485) – – – – (5,685) – 73 (5,612)Reinsurance recoveries 89 59 73 – – – – 221 – – 221
Net claims and benefits incurred (4,724) (328) (412) – – – – (5,464) – 73 (5,391)Change in investment contract liabilities (1,756) (3,605) – – – – – (5,361) – – (5,361)Losses on loans and advances – – – (400) – – – (400) – – (400)Finance costs (including interest and similar expenses) D6 – – – – – (130) – (130) (84) – (214)Banking interest payable and similar expenses D7 – – – (1,886) – – – (1,886) (1) – (1,887)Fee and commission expenses, and other acquisition costs D8 (227) (677) (113) – (5) – (67) (1,089) 88 (63) (1,064)Change in third-party interest in consolidated funds – – – – – – (651) (651) – – (651)Other operating and administrative expenses D9 (1,066) (446) (82) (1,604) (276) (67) (9) (3,550) (147) (18) (3,715)Income tax attributable to policyholder returns (49) (26) – – – – – (75) 75 – – Inter-segment expenses (20) (32) (14) (58) – (32) 156 – – – –
Total expenses (7,842) (5,114) (621) (3,948) (281) (229) (571) (18,606) (69) (8) (18,683)
Share of associated undertakings' and joint ventures' profit after tax G2 20 – 2 – 10 – – 32 – – 32 Loss on disposal of subsidiaries, associated undertakings and strategic investments C1(c) – – – – – – – – (56) – (56)
Adjusted operating profit/(loss) before tax and non-controlling interests 611 195 37 825 91 (147) – 1,612 (392) 165 1,385 Income tax expense D1 (164) (43) (9) (221) (15) 12 – (440) (31) – (471)Non-controlling interests (9) – (8) (287) – (27) – (331) 25 – (306)
Adjusted operating profit/(loss) after tax and non-controlling interests 438 152 20 317 76 (162) – 841 (398) 165 608 Adjusting items net of tax and non-controlling interests C1(a) (153) (134) (15) 16 (10) (102) – (398) 398 – –
Profit/(loss) after tax from continuing operations 285 18 5 333 66 (264) – 443 – 165 608 Profit from discontinued operations after tax I1 – – – – – – – – – 564 564
Profit/(loss) after tax attributable to equity holders of the parent 285 18 5 333 66 (264) – 443 – 729 1,172
1 The prior year has been restated for the impact of changes in accounting policies. Refer to note J1 for further details.2 Non-core operations relate to Old Mutual Bermuda. Old Mutual Bermuda profit after tax for the year ended 31 December 2012 was £161 million. It also includes £4 million of
inter-segment revenue and the after tax results of the Group’s discontinued operations. Further information on discontinued operations is provided in note I1.
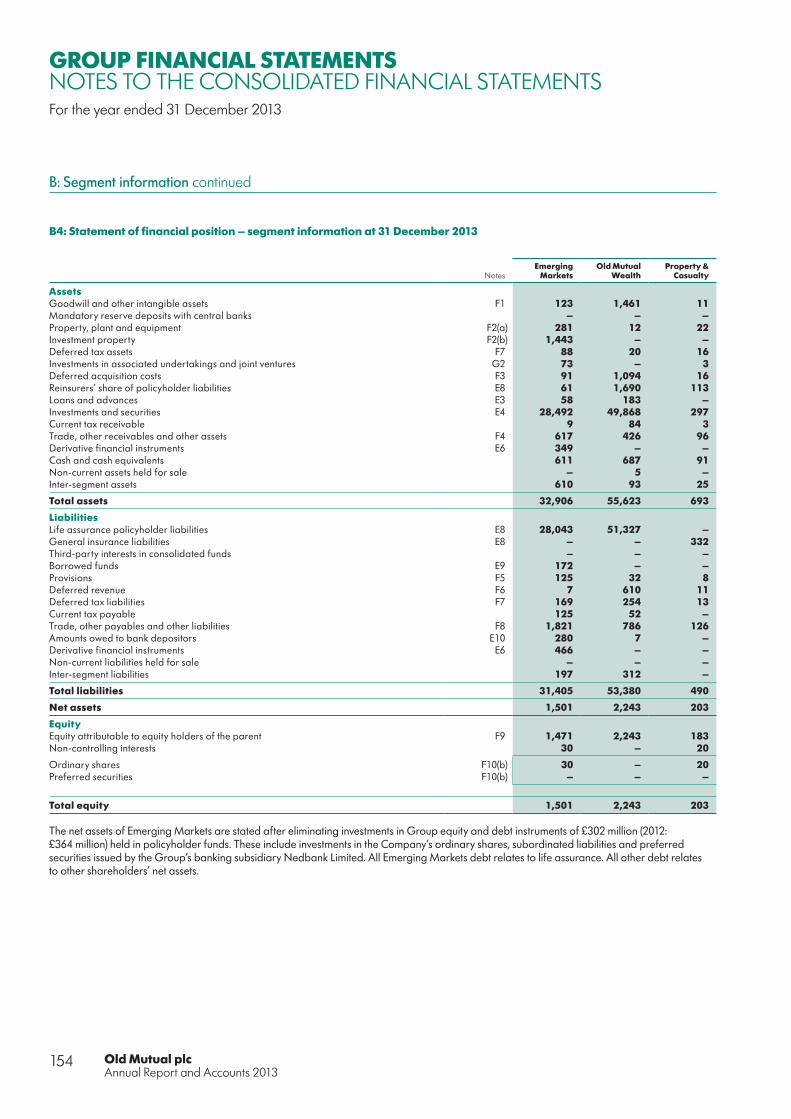
Old Mutual plcAnnual Report and Accounts 2013
154
GROUP FINANCIAL STATEMENTSNOTES TO THE CONSOLIDATED FINANCIAL STATEMENTSFor the year ended 31 December 2013
B: Segment information continued
B4: Statement of financial position – segment information at 31 December 2013
£m
NotesEmerging
MarketsOld Mutual
WealthProperty &
Casualty Nedbank USAM OtherConsolidation
adjustmentsNon-core
operations Total
AssetsGoodwill and other intangible assets F1 123 1,461 11 446 794 – – – 2,835 Mandatory reserve deposits with central banks – – – 759 – – – – 759 Property, plant and equipment F2(a) 281 12 22 391 15 1 – – 722 Investment property F2(b) 1,443 – – 11 – – 357 – 1,811 Deferred tax assets F7 88 20 16 11 167 – – 1 303 Investments in associated undertakings and joint ventures G2 73 – 3 63 19 10 – – 168 Deferred acquisition costs F3 91 1,094 16 – 10 – – – 1,211 Reinsurers’ share of policyholder liabilities E8 61 1,690 113 11 – – – – 1,875 Loans and advances E3 58 183 – 33,145 – – – – 33,386 Investments and securities E4 28,492 49,868 297 5,387 33 378 3,502 460 88,417 Current tax receivable 9 84 3 32 – – – – 128 Trade, other receivables and other assets F4 617 426 96 585 113 43 351 352 2,583 Derivative financial instruments E6 349 – – 791 – 62 49 8 1,259 Cash and cash equivalents 611 687 91 1,196 117 457 1,667 43 4,869 Non-current assets held for sale – 5 – – – – – – 5 Inter-segment assets 610 93 25 77 21 976 (2,083) 281 –
Total assets 32,906 55,623 693 42,905 1,289 1,927 3,843 1,145 140,331
LiabilitiesLife assurance policyholder liabilities E8 28,043 51,327 – 852 – – – 919 81,141 General insurance liabilities E8 – – 332 – – – – – 332 Third-party interests in consolidated funds – – – – – – 5,478 – 5,478 Borrowed funds E9 172 – – 1,813 2 642 – – 2,629 Provisions F5 125 32 8 40 2 29 – – 236 Deferred revenue F6 7 610 11 – – – – – 628 Deferred tax liabilities F7 169 254 13 34 – 21 – – 491 Current tax payable 125 52 – 17 3 40 – – 237 Trade, other payables and other liabilities F8 1,821 786 126 832 248 40 412 9 4,274 Amounts owed to bank depositors E10 280 7 – 34,083 – – – – 34,370 Derivative financial instruments E6 466 – – 974 – – 36 2 1,478 Non-current liabilities held for sale – – – – – – – – – Inter-segment liabilities 197 312 – 567 487 520 (2,083) – –
Total liabilities 31,405 53,380 490 39,212 742 1,292 3,843 930 131,294
Net assets 1,501 2,243 203 3,693 547 635 – 215 9,037
EquityEquity attributable to equity holders of the parent F9 1,471 2,243 183 1,976 547 635 – 215 7,270 Non-controlling interests 30 – 20 1,717 – – – – 1,767
Ordinary shares F10(b) 30 – 20 1,452 – – – – 1,502 Preferred securities F10(b) – – – 265 – – – – 265
Total equity 1,501 2,243 203 3,693 547 635 – 215 9,037
The net assets of Emerging Markets are stated after eliminating investments in Group equity and debt instruments of £302 million (2012: £364 million) held in policyholder funds. These include investments in the Company’s ordinary shares, subordinated liabilities and preferred securities issued by the Group’s banking subsidiary Nedbank Limited. All Emerging Markets debt relates to life assurance. All other debt relates to other shareholders’ net assets.

155
Financials
B: Segment information continued
B4: Statement of financial position – segment information at 31 December 2013
£m
NotesEmerging
MarketsOld Mutual
WealthProperty &
Casualty Nedbank USAM OtherConsolidation
adjustmentsNon-core
operations Total
AssetsGoodwill and other intangible assets F1 123 1,461 11 446 794 – – – 2,835 Mandatory reserve deposits with central banks – – – 759 – – – – 759 Property, plant and equipment F2(a) 281 12 22 391 15 1 – – 722 Investment property F2(b) 1,443 – – 11 – – 357 – 1,811 Deferred tax assets F7 88 20 16 11 167 – – 1 303 Investments in associated undertakings and joint ventures G2 73 – 3 63 19 10 – – 168 Deferred acquisition costs F3 91 1,094 16 – 10 – – – 1,211 Reinsurers’ share of policyholder liabilities E8 61 1,690 113 11 – – – – 1,875 Loans and advances E3 58 183 – 33,145 – – – – 33,386 Investments and securities E4 28,492 49,868 297 5,387 33 378 3,502 460 88,417 Current tax receivable 9 84 3 32 – – – – 128 Trade, other receivables and other assets F4 617 426 96 585 113 43 351 352 2,583 Derivative financial instruments E6 349 – – 791 – 62 49 8 1,259 Cash and cash equivalents 611 687 91 1,196 117 457 1,667 43 4,869 Non-current assets held for sale – 5 – – – – – – 5 Inter-segment assets 610 93 25 77 21 976 (2,083) 281 –
Total assets 32,906 55,623 693 42,905 1,289 1,927 3,843 1,145 140,331
LiabilitiesLife assurance policyholder liabilities E8 28,043 51,327 – 852 – – – 919 81,141 General insurance liabilities E8 – – 332 – – – – – 332 Third-party interests in consolidated funds – – – – – – 5,478 – 5,478 Borrowed funds E9 172 – – 1,813 2 642 – – 2,629 Provisions F5 125 32 8 40 2 29 – – 236 Deferred revenue F6 7 610 11 – – – – – 628 Deferred tax liabilities F7 169 254 13 34 – 21 – – 491 Current tax payable 125 52 – 17 3 40 – – 237 Trade, other payables and other liabilities F8 1,821 786 126 832 248 40 412 9 4,274 Amounts owed to bank depositors E10 280 7 – 34,083 – – – – 34,370 Derivative financial instruments E6 466 – – 974 – – 36 2 1,478 Non-current liabilities held for sale – – – – – – – – – Inter-segment liabilities 197 312 – 567 487 520 (2,083) – –
Total liabilities 31,405 53,380 490 39,212 742 1,292 3,843 930 131,294
Net assets 1,501 2,243 203 3,693 547 635 – 215 9,037
EquityEquity attributable to equity holders of the parent F9 1,471 2,243 183 1,976 547 635 – 215 7,270 Non-controlling interests 30 – 20 1,717 – – – – 1,767
Ordinary shares F10(b) 30 – 20 1,452 – – – – 1,502 Preferred securities F10(b) – – – 265 – – – – 265
Total equity 1,501 2,243 203 3,693 547 635 – 215 9,037
The net assets of Emerging Markets are stated after eliminating investments in Group equity and debt instruments of £302 million (2012: £364 million) held in policyholder funds. These include investments in the Company’s ordinary shares, subordinated liabilities and preferred securities issued by the Group’s banking subsidiary Nedbank Limited. All Emerging Markets debt relates to life assurance. All other debt relates to other shareholders’ net assets.
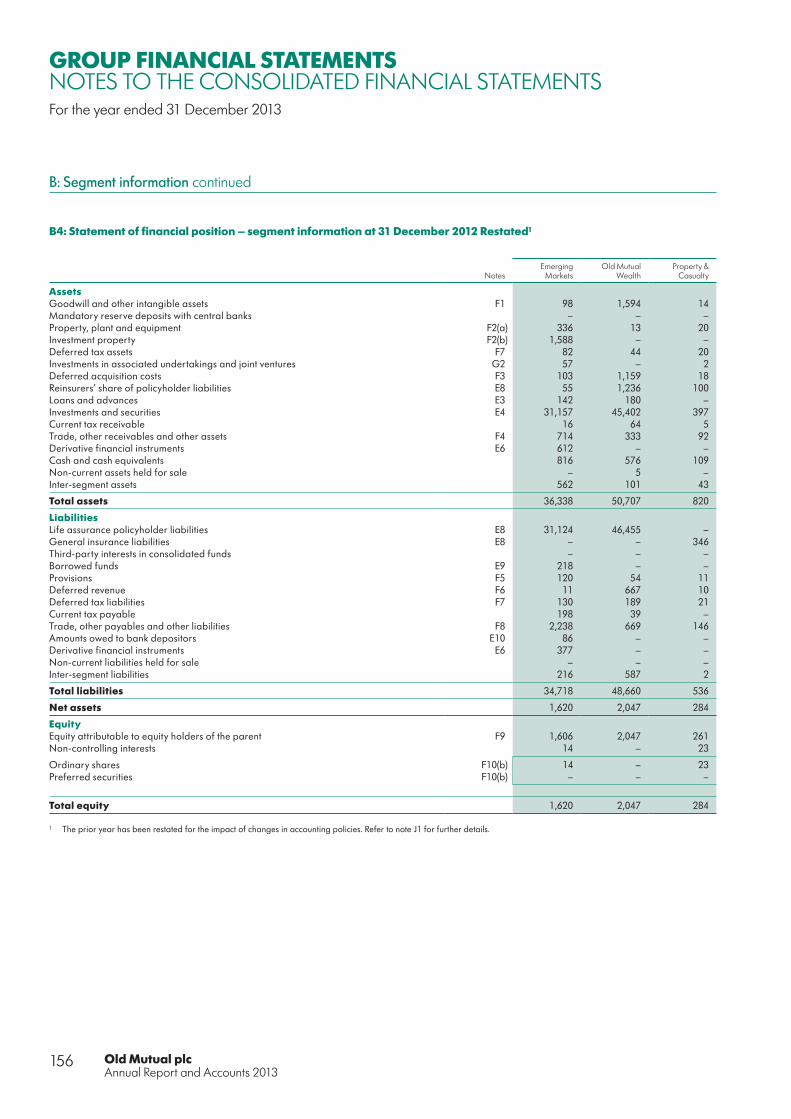
Old Mutual plcAnnual Report and Accounts 2013
156
GROUP FINANCIAL STATEMENTSNOTES TO THE CONSOLIDATED FINANCIAL STATEMENTSFor the year ended 31 December 2013
B: Segment information continued
B4: Statement of financial position – segment information at 31 December 2012 Restated1
£m
NotesEmerging
MarketsOld Mutual
WealthProperty &
Casualty Nedbank USAM OtherConsolidation
adjustmentsNon-core
operations Total
AssetsGoodwill and other intangible assets F1 98 1,594 14 534 816 – – – 3,056 Mandatory reserve deposits with central banks – – – 921 – – – – 921 Property, plant and equipment F2(a) 336 13 20 465 12 1 – – 847 Investment property F2(b) 1,588 – – 15 – – 344 – 1,947 Deferred tax assets F7 82 44 20 34 162 2 – 1 345 Investments in associated undertakings and joint ventures G2 57 – 2 49 18 26 – – 152 Deferred acquisition costs F3 103 1,159 18 – 8 – – – 1,288 Reinsurers’ share of policyholder liabilities E8 55 1,236 100 15 – – – – 1,406 Loans and advances E3 142 180 – 38,173 – – – – 38,495 Investments and securities E4 31,157 45,402 397 6,303 37 368 3,897 952 88,513 Current tax receivable 16 64 5 18 – – – – 103 Trade, other receivables and other assets F4 714 333 92 733 105 62 372 595 3,006 Derivative financial instruments E6 612 – – 1,003 – 97 50 18 1,780 Cash and cash equivalents 816 576 109 1,049 115 379 1,892 125 5,061 Non-current assets held for sale – 5 – 37 – – – – 42 Inter-segment assets 562 101 43 111 21 1,366 (2,877) 673 –
Total assets 36,338 50,707 820 49,460 1,294 2,301 3,678 2,364 146,962
LiabilitiesLife assurance policyholder liabilities E8 31,124 46,455 – 907 – – – 1,702 80,188 General insurance liabilities E8 – – 346 – – – – – 346 Third-party interests in consolidated funds – – – – – – 6,116 – 6,116 Borrowed funds E9 218 – – 2,163 10 659 – – 3,050 Provisions F5 120 54 11 49 1 30 – – 265 Deferred revenue F6 11 667 10 1 – – – – 689 Deferred tax liabilities F7 130 189 21 40 – 24 – – 404 Current tax payable 198 39 – 9 6 34 – 1 287 Trade, other payables and other liabilities F8 2,238 669 146 1,122 193 80 400 92 4,940 Amounts owed to bank depositors E10 86 – – 39,413 – – – – 39,499 Derivative financial instruments E6 377 – – 977 – 8 39 1 1,402 Non-current liabilities held for sale – – – 3 – – – – 3 Inter-segment liabilities 216 587 2 596 554 922 (2,877) – –
Total liabilities 34,718 48,660 536 45,280 764 1,757 3,678 1,796 137,189
Net assets 1,620 2,047 284 4,180 530 544 – 568 9,773
EquityEquity attributable to equity holders of the parent F9 1,606 2,047 261 2,283 507 544 – 568 7,816 Non-controlling interests 14 – 23 1,897 23 – – – 1,957
Ordinary shares F10(b) 14 – 23 1,624 23 – – – 1,684 Preferred securities F10(b) – – – 273 – – – – 273
Total equity 1,620 2,047 284 4,180 530 544 – 568 9,773
1 The prior year has been restated for the impact of changes in accounting policies. Refer to note J1 for further details.

157
Financials
B: Segment information continued
B4: Statement of financial position – segment information at 31 December 2012 Restated1
£m
NotesEmerging
MarketsOld Mutual
WealthProperty &
Casualty Nedbank USAM OtherConsolidation
adjustmentsNon-core
operations Total
AssetsGoodwill and other intangible assets F1 98 1,594 14 534 816 – – – 3,056 Mandatory reserve deposits with central banks – – – 921 – – – – 921 Property, plant and equipment F2(a) 336 13 20 465 12 1 – – 847 Investment property F2(b) 1,588 – – 15 – – 344 – 1,947 Deferred tax assets F7 82 44 20 34 162 2 – 1 345 Investments in associated undertakings and joint ventures G2 57 – 2 49 18 26 – – 152 Deferred acquisition costs F3 103 1,159 18 – 8 – – – 1,288 Reinsurers’ share of policyholder liabilities E8 55 1,236 100 15 – – – – 1,406 Loans and advances E3 142 180 – 38,173 – – – – 38,495 Investments and securities E4 31,157 45,402 397 6,303 37 368 3,897 952 88,513 Current tax receivable 16 64 5 18 – – – – 103 Trade, other receivables and other assets F4 714 333 92 733 105 62 372 595 3,006 Derivative financial instruments E6 612 – – 1,003 – 97 50 18 1,780 Cash and cash equivalents 816 576 109 1,049 115 379 1,892 125 5,061 Non-current assets held for sale – 5 – 37 – – – – 42 Inter-segment assets 562 101 43 111 21 1,366 (2,877) 673 –
Total assets 36,338 50,707 820 49,460 1,294 2,301 3,678 2,364 146,962
LiabilitiesLife assurance policyholder liabilities E8 31,124 46,455 – 907 – – – 1,702 80,188 General insurance liabilities E8 – – 346 – – – – – 346 Third-party interests in consolidated funds – – – – – – 6,116 – 6,116 Borrowed funds E9 218 – – 2,163 10 659 – – 3,050 Provisions F5 120 54 11 49 1 30 – – 265 Deferred revenue F6 11 667 10 1 – – – – 689 Deferred tax liabilities F7 130 189 21 40 – 24 – – 404 Current tax payable 198 39 – 9 6 34 – 1 287 Trade, other payables and other liabilities F8 2,238 669 146 1,122 193 80 400 92 4,940 Amounts owed to bank depositors E10 86 – – 39,413 – – – – 39,499 Derivative financial instruments E6 377 – – 977 – 8 39 1 1,402 Non-current liabilities held for sale – – – 3 – – – – 3 Inter-segment liabilities 216 587 2 596 554 922 (2,877) – –
Total liabilities 34,718 48,660 536 45,280 764 1,757 3,678 1,796 137,189
Net assets 1,620 2,047 284 4,180 530 544 – 568 9,773
EquityEquity attributable to equity holders of the parent F9 1,606 2,047 261 2,283 507 544 – 568 7,816 Non-controlling interests 14 – 23 1,897 23 – – – 1,957
Ordinary shares F10(b) 14 – 23 1,624 23 – – – 1,684 Preferred securities F10(b) – – – 273 – – – – 273
Total equity 1,620 2,047 284 4,180 530 544 – 568 9,773
1 The prior year has been restated for the impact of changes in accounting policies. Refer to note J1 for further details.

Old Mutual plcAnnual Report and Accounts 2013
158
GROUP FINANCIAL STATEMENTSNOTES TO THE CONSOLIDATED FINANCIAL STATEMENTSFor the year ended 31 December 2013
C: Other key performance information
C1: Operating profit adjusting items
(a) Summary of adjusting items for determination of AOPIn determining the AOP of the Group for core operations, certain adjustments are made to profit before tax to reflect the directors’ view of the underlying long-term performance of the Group. The following table shows an analysis of those adjustments from AOP to profit before and after tax.
£m
Notes
Year ended 31 December
2013
Year ended 31 December
2012
Income/(expense)Goodwill impairment and impact of acquisition accounting C1(b) (141) (123)Loss on disposal of subsidiaries, associated undertakings and strategic investments C1(c) (4) (56)Short-term fluctuations in investment return C1(d) 6 (78)Investment return adjustment for Group equity and debt instruments held in life funds C1(e) (100) (113)Dividends declared to holders of perpetual preferred callable securities C1(f) 42 42 US Asset Management equity plans C1(g) (38) (13)Credit-related fair value losses on Group debt instruments C1(h) (31) (126)Restructuring costs C1(i) (20) –
Total adjusting items (286) (467)Tax on adjusting items D1(d) 46 44 Non-controlling interest in adjusting items 20 25
Total adjusting items after tax and non-controlling interests (220) (398)
(b) Goodwill impairment and impact of acquisition accountingWhen applying acquisition accounting, deferred acquisition costs and deferred revenues existing at the point of acquisition are not recognised under IFRS. These are reversed in the acquisition statement of financial position and replaced by goodwill, other intangible assets and the value of the acquired present value of in-force business (acquired PVIF). In determining AOP, the Group recognises deferred revenue and acquisition costs and deferred revenue in relation to policies sold by acquired businesses pre-acquisition. The Group excludes the impairment of goodwill and the amortisation and impairment of acquired other intangibles and acquired PVIF and the movements in certain acquisition date provisions. Costs incurred on successful acquisitions are also excluded from AOP. If the intangible assets recognised as a result of a business combination are subsequently impaired, this is excluded from AOP. The effect of these adjustments to determine AOP are summarised below:
£m
Year ended 31 December 2013Emerging
MarketsOld Mutual
Wealth USAM Total
Amortisation of acquired PVIF – (76) – (76)Amortisation of acquired deferred costs and revenue – 11 – 11 Amortisation of other acquired intangible assets (2) (46) – (48)Impairment of goodwill and other intangible assets (8) (20) – (28)
(10) (131) – (141)
£m
Year ended 31 December 2012Emerging
MarketsOld Mutual
Wealth USAM Total
Amortisation of acquired PVIF – (84) – (84)Amortisation of acquired deferred costs and revenue – 12 – 12 Amortisation of other acquired intangible assets (2) (48) (1) (51)Impairment of goodwill and other intangible assets – – – –
(2) (120) (1) (123)

159
Financials
(c) Loss on disposal of subsidiaries, associated undertakings and strategic investmentsLoss on disposal of subsidiaries, associated undertakings and strategic investments is analysed below:
£m
Year ended 31 December
2013
Year ended 31 December
2012
USAM (4) (16)Emerging Markets – (15)Old Mutual Wealth – (25)
Loss on disposal of subsidiaries, associated undertakings and strategic investments (4) (56)
USAMOn 2 January 2013, USAM completed the sale of five of its affiliates incurring a loss of £1 million.
On 11 October 2013, USAM committed to a plan to cease the operations of Echo Point. The incremental cost of £3 million associated with discontinuing the entity was recognised in full during October 2013.
On 13 April 2012, USAM disposed of Old Mutual Capital Inc, a subsidiary, at a profit of £12 million. On 15 May 2012, USAM disposed of Dwight Asset Management Company LLC, a fixed income affiliate, at a profit of £7 million. On 11 October 2012, the Group announced that it had finalised agreements to sell five USAM affiliates at a loss of £32 million. A £3 million loss was also recognised during the year ended 31 December 2012 in relation to disposals of other USAM subsidiaries in previous periods.
Emerging MarketsOn 20 November 2012, the Emerging Markets segment recognised a profit of £3 million on the acquisition of a strategic investment Curo Fund Services (Pty) Ltd. Also during the year ended 31 December 2012, the Group incurred expenses of £18 million as initial costs regarding Zimbabwean Indigenisation and Black Economic Empowerment Schemes. These costs were directly related to the acquisition of the Zimbabwean business.
Old Mutual WealthOn 31 August 2012, Old Mutual Wealth completed the sale of its Finnish branch at a loss of £27 million. A profit of £2 million was recognised on the sale of Skandia Services AG (Switzerland) on 30 June 2012.
(d) Short-term fluctuations in investment returnProfit before tax, as disclosed in the consolidated IFRS income statement, includes actual investment returns earned on the shareholder assets of the Group’s life assurance and general insurance businesses. AOP is stated after recalculating shareholder asset investment returns based on a long-term investment return rate. The difference between the actual and the long-term investment returns is referred to as the short-term fluctuation in investment return.
Long-term rates of return are based on achieved rates of return appropriate to the underlying asset base, adjusted for current inflation expectations, default assumptions, costs of investment management and consensus economic investment forecasts. The underlying rates are principally derived with reference to 10-year government bond rates, cash and money market rates and an explicit equity risk premium for South African businesses. The rates set out below reflect the apportionment of underlying investments in cash deposits, money market instruments and equity assets. Long-term rates of return are reviewed frequently by the Board, usually annually, for appropriateness. The review of the long-term rates of return seeks to ensure that the returns credited to AOP are consistent with the actual returns expected to be earned over the long-term.
For Emerging Markets, the return is applied to an average value of investible shareholders’ assets, adjusted for net fund flows. For Old Mutual Wealth, the return is applied to average investible assets. For Property & Casualty, the return is an average value of investible assets supporting shareholders’ funds and insurance liabilities, adjusted for net fund flows.
%
Long-term investment rates
Year ended 31 December
2013
Year ended 31 December
2012
Emerging Markets 8.0 9.0 Old Mutual Wealth 1.0 1.5-2.0Property & Casualty 7.4 8.6

Old Mutual plcAnnual Report and Accounts 2013
160
GROUP FINANCIAL STATEMENTSNOTES TO THE CONSOLIDATED FINANCIAL STATEMENTSFor the year ended 31 December 2013
C: Other key performance information continued
C1: Operating profit adjusting items continued
(d) Short-term fluctuations in investment return continued
Analysis of short-term fluctuations in investment return
£m
Year ended 31 December 2013Emerging
MarketsOld Mutual
Wealth1Property &
Casualty Other Total
Actual shareholder investment return 135 22 25 34 216 Less: Long-term investment return 106 30 31 43 210
Short-term fluctuations in investment return 29 (8) (6) (9) 6
£m
Year ended 31 December 2012Emerging
MarketsOld Mutual
Wealth1Property &
Casualty Other Total
Actual shareholder investment return 81 65 34 34 214 Less: Long-term investment return 124 67 47 54 292
Short-term fluctuations in investment return (43) (2) (13) (20) (78)
1 Old Mutual Wealth long-term investment return includes £25 million (2012: £59 million) transitional adjustments to restate the effects of policyholder tax in arriving at AOP.
(e) Investment return adjustment for Group equity and debt instruments held in policyholder fundsAOP includes investment returns on policyholder investments in Group equity and debt instruments held by the Group’s life funds. These include investments in the Company’s ordinary shares and the subordinated liabilities and ordinary shares issued by Nedbank. These investment returns are eliminated within the consolidated income statement in arriving at profit before tax in the IFRS income statement, but are included in AOP. During the year ended 31 December 2013, the investment return adjustment increased AOP by £100 million (2012: increase of £113 million).
(f) Dividends declared to holders of perpetual preferred callable securitiesDividends declared to the holders of the Group’s perpetual preferred callable securities on an AOP basis were £42 million for the year ended 31 December 2013 (2012: £42 million). These are recognised in finance costs on an accruals basis for the purpose of determining AOP. In accordance with IFRS the total cash distribution of £47 million (2012: £42 million) is recognised directly in equity. This distribution included £5 million accrued interest paid in respect of securities accepted for repurchase.
(g) US Asset Management equity plansUS Asset Management has a number of long-term incentive arrangements with senior employees in its asset management affiliates.
The Group has issued put options in equities in the affiliates to senior employees as part of its US affiliate incentive schemes. The impact of revaluing these instruments is recognised in accordance with IFRS, but excluded from AOP. At 31 December 2013, these instruments were revalued, the impact of which was a loss of £38 million (2012: loss of £13 million).
(h) Credit-related fair value gains and losses on Group debt instrumentsThe widening of credit spread is related to the Group’s debt instruments and causes the market value of these instruments to decrease, resulting in gains being recognised in the consolidated income statement. Conversely, if the credit spread narrows and the market value of debt instruments rises then losses are recognised in the consolidated income statement. In the directors’ view, such movements are not reflective of the underlying performance of the Group and will reverse over time and they have therefore been excluded from AOP. For the year ended 31 December 2013 a net loss of £31 million was recognised (2012: loss of £55 million).
On 1 August 2012, the Group redeemed £388 million of the £500 million senior bond due in 2016 at a cash consideration of £459 million. The £71 million excess over the nominal value reflected the market value of the instrument prior to redemption.
(i) Old Mutual Wealth restructuring expenditureThe Old Mutual Wealth business embarked on a significant change project to fundamentally restructure the way in which its UK platform business operates. Over the next two to three years, it will migrate certain elements of service provision to International Financial Data Services (IFDS). Costs related to decommissioning of existing technology and service provision and the migration of service to IFDS will be excluded from AOP.
These costs will comprise payments to IFDS and directly attributable internal project costs and totalled £20 million in 2013.

161
Financials
C2: Earnings and earnings per share
The Group calculates earnings per share (EPS) on several different bases. IFRS requires the calculation of basic and diluted EPS. Adjusted operating EPS reflects earnings per share consistent with the Group’s alternative profit measure. JSE Limited (JSE) listing requirements also require the Group to calculate headline EPS. The Group’s EPS on these different bases are summarised below:
Pence
Source of guidance Notes
Year ended 31 December
2013
Year ended 31 December
2012Restated
Basic earnings per share1 IFRS C2(a) 15.0 24.9 Diluted basic earnings per share1 IFRS C2(b) 13.9 23.1 Adjusted operating earnings per share1 Group policy C2(c) 18.4 17.5 Headline earnings per share (Gross of tax)2 JSE Listing Requirements C2(d) 15.6 13.5 Headline earnings per share (Net of tax)2 JSE Listing Requirements C2(d) 15.2 13.8 Diluted headline earnings per share (Gross of tax)2 JSE Listing Requirements C2(d) 14.6 12.7 Diluted headline earnings per share (Net of tax)2 JSE Listing Requirements C2(d) 14.3 12.9
1 Restatement for the impact of changes in policies did not result in changes to basic, diluted basic and adjusted operating earnings per share for the year ended 31 December 2012.2 The prior year has been restated for the impact of changes in accounting policies. Refer to note J1 for further details.
(a) Basic earnings per shareBasic earnings per share is calculated by dividing the profit for the financial year attributable to ordinary equity shareholders by the weighted average number of ordinary shares in issue during the year excluding own shares held in policyholder funds, ESOP trusts, Black Economic Empowerment trusts and other related undertakings.
The table below reconciles the profit attributable to equity holders of the parent to profit attributable to ordinary equity holders:
£m
Year ended 31 December
2013
Year ended 31 December
2012Restated1
Profit for the financial year attributable to equity holders of the parent from continuing operations 702 608 Profit for the financial year attributable to equity holders of the parent from discontinued operations 3 564
Profit for the financial year attributable to equity holders of the parent 705 1,172 Dividends paid to holders of perpetual preferred callable securities, net of tax credits (37) (32)
Profit attributable to ordinary equity holders 668 1,140
1 The prior year has been restated for the impact of changes in accounting policies. Refer to note J1 for further details.
Total dividends paid to holders of perpetual preferred callable securities of £37 million for the year ended 31 December 2013 (2012: £32 million) are stated net of tax credits of £10 million (2012: £10 million).
The table below summarises the calculation of the weighted average number of ordinary shares for the purposes of calculating basic earnings per share:
Millions
Year ended 31 December
2013
Year ended 31 December
2012
Weighted average number of ordinary shares in issue 4,897 5,096 Shares held in charitable foundations (6) (6)Shares held in ESOP trusts (55) (61)
Adjusted weighted average number of ordinary shares 4,836 5,029 Shares held in life funds (155) (181)Shares held in Black Economic Empowerment trusts (239) (261)
Weighted average number of ordinary shares used to calculate basic earnings per share 4,442 4,587
Basic earnings per ordinary share (pence)¹ 15.0 24.9
1 Restatement for the impact of changes in policies did not result in changes to basic earnings per share for the year ended 31 December 2012.
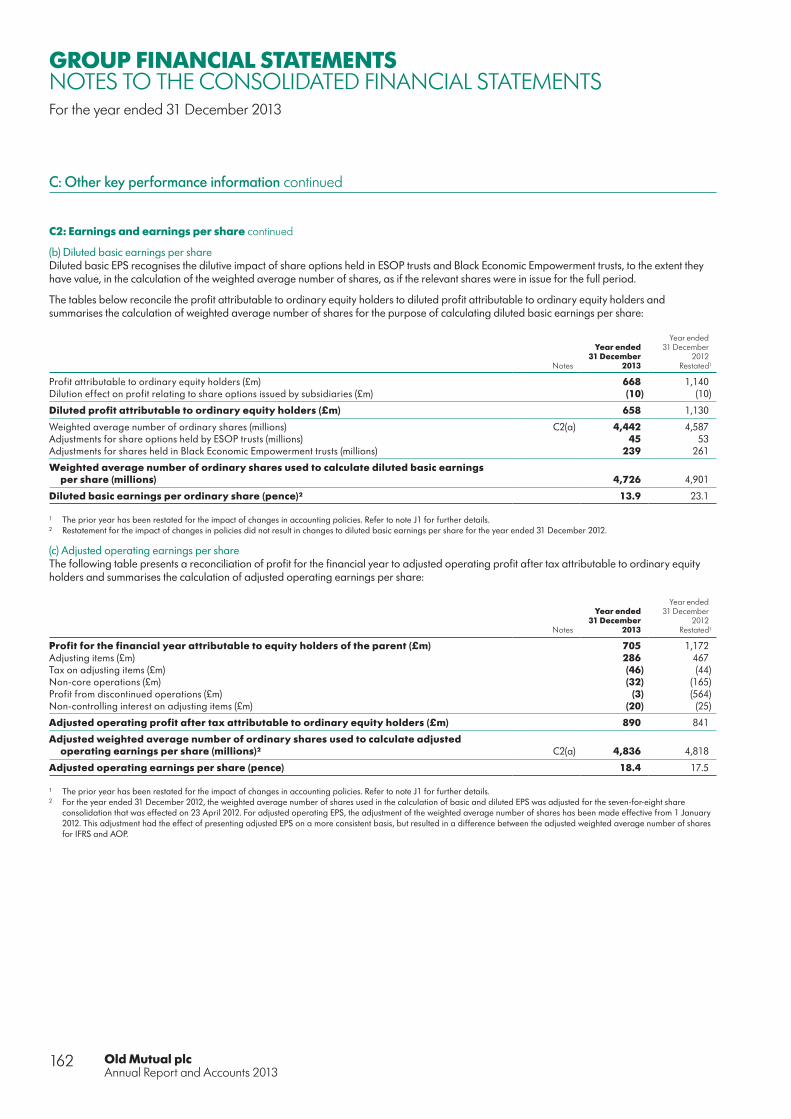
Old Mutual plcAnnual Report and Accounts 2013
162
GROUP FINANCIAL STATEMENTSNOTES TO THE CONSOLIDATED FINANCIAL STATEMENTSFor the year ended 31 December 2013
C: Other key performance information continued
C2: Earnings and earnings per share continued
(b) Diluted basic earnings per shareDiluted basic EPS recognises the dilutive impact of share options held in ESOP trusts and Black Economic Empowerment trusts, to the extent they have value, in the calculation of the weighted average number of shares, as if the relevant shares were in issue for the full period.
The tables below reconcile the profit attributable to ordinary equity holders to diluted profit attributable to ordinary equity holders and summarises the calculation of weighted average number of shares for the purpose of calculating diluted basic earnings per share:
Notes
Year ended 31 December
2013
Year ended 31 December
2012Restated1
Profit attributable to ordinary equity holders (£m) 668 1,140 Dilution effect on profit relating to share options issued by subsidiaries (£m) (10) (10)
Diluted profit attributable to ordinary equity holders (£m) 658 1,130
Weighted average number of ordinary shares (millions) C2(a) 4,442 4,587 Adjustments for share options held by ESOP trusts (millions) 45 53 Adjustments for shares held in Black Economic Empowerment trusts (millions) 239 261
Weighted average number of ordinary shares used to calculate diluted basic earnings per share (millions) 4,726 4,901
Diluted basic earnings per ordinary share (pence)² 13.9 23.1
1 The prior year has been restated for the impact of changes in accounting policies. Refer to note J1 for further details.2 Restatement for the impact of changes in policies did not result in changes to diluted basic earnings per share for the year ended 31 December 2012.
(c) Adjusted operating earnings per shareThe following table presents a reconciliation of profit for the financial year to adjusted operating profit after tax attributable to ordinary equity holders and summarises the calculation of adjusted operating earnings per share:
Notes
Year ended 31 December
2013
Year ended 31 December
2012Restated1
Profit for the financial year attributable to equity holders of the parent (£m) 705 1,172 Adjusting items (£m) 286 467 Tax on adjusting items (£m) (46) (44)Non-core operations (£m) (32) (165)Profit from discontinued operations (£m) (3) (564)Non-controlling interest on adjusting items (£m) (20) (25)
Adjusted operating profit after tax attributable to ordinary equity holders (£m) 890 841
Adjusted weighted average number of ordinary shares used to calculate adjusted operating earnings per share (millions)² C2(a) 4,836 4,818
Adjusted operating earnings per share (pence) 18.4 17.5
1 The prior year has been restated for the impact of changes in accounting policies. Refer to note J1 for further details.2 For the year ended 31 December 2012, the weighted average number of shares used in the calculation of basic and diluted EPS was adjusted for the seven-for-eight share
consolidation that was effected on 23 April 2012. For adjusted operating EPS, the adjustment of the weighted average number of shares has been made effective from 1 January 2012. This adjustment had the effect of presenting adjusted EPS on a more consistent basis, but resulted in a difference between the adjusted weighted average number of shares for IFRS and AOP.

163
Financials
(d) Headline earnings per shareThe Group is required to calculate headline earnings per share (HEPS) in accordance with the JSE Limited (JSE) Listing Requirements, determined by reference to the South African Institute of Chartered Accountants’ circular 02/2013 (Revised) ‘Headline Earnings’. The table below sets out a reconciliation of basic EPS and HEPS in accordance with that circular. Disclosure of HEPS is not a requirement of IFRS, but it is a commonly used measure of earnings in South Africa.
The table below reconciles the profit for the financial year attributable to equity holders of the parent to headline earnings and summarises the calculation of basic and diluted HEPS:
£m
Year ended 31 December 2013
Year ended 31 December 2012
Restated1
Notes Gross Net Gross Net
Profit for the financial year attributable to equity holders of the parent 705 705 1,172 1,172
Dividends paid to holders of perpetual preferred callable securities (37) (37) (32) (32)
Profit attributable to ordinary equity holders 668 668 1,140 1,140 Adjustments:Impairments of goodwill and intangible assets 28 28 35 35 Loss/(profit) on disposal of subsidiaries, associated undertakings and
strategic investments 4 (12) (183) (173)Realised gains (net of impairments) on available-for-sale financial assets (8) (8) (21) (21)Exchange differences realised on disposal – – (350) (350)
Headline earnings 692 676 621 631
Weighted average number of ordinary shares C2(a) 4,442 4,442 4,587 4,587
Diluted weighted average number of ordinary shares C2(b) 4,726 4,726 4,901 4,901
Headline earnings per share (pence) 15.6 15.2 13.5 13.8
Diluted headline earnings per share (pence) 14.6 14.3 12.7 12.9
1 The prior year has been restated for the impact of changes in accounting policies. Refer to note J1 for further details. Impairment of intangible assets is now excluded from the determination of HEPS.
C3: Dividends
£m
Year ended 31 December
2013
Year ended 31 December
2012
2011 Final dividend paid – 3.5p per 10p share – 178 2012 Special dividend – 18.0p per 10p share – 915 2012 Interim dividend paid – 1.75p per 113⁄7p share – 79 2012 Final dividend paid – 5.25p per 113⁄7p share 238 – 2013 Interim dividend paid – 2.10p per 113⁄7p share 98 –
Dividends to ordinary equity holders 336 1,172 Dividends paid to holders of perpetual preferred callable securities 47 42
Dividend payments for the period 383 1,214
Final and interim dividends paid to ordinary equity holders are calculated using the number of shares in issue at the record date less own shares held in ESOP trusts, life funds of Group entities, Black Economic Empowerment trusts and related undertakings.
As a consequence of the exchange control arrangements in place in certain African territories, dividends to ordinary equity holders on the branch registers of those countries (or, in the case of Namibia, the Namibian section of the principal register) are settled through Dividend Access Trusts established for that purpose.
A final dividend of 6.0 pence (or its equivalent in other applicable currencies) per ordinary share in the Company has been recommended by the directors. The final dividend will be paid on 30 May 2014 to shareholders on the register at the close of business on 14 April 2014 for the Malawi register, 16 April 2014 for the South African, Zimbabwe and Namibian registers and 22 April 2014 for the UK register. The dividend will absorb an estimated £275 million of shareholders’ funds. The Company is not planning to offer a scrip dividend alternative.
In March and November 2013, £22 million and £25 million respectively, were declared and paid to holders of perpetual preferred callable securities (March 2012: £22 million, November 2012: £20 million).
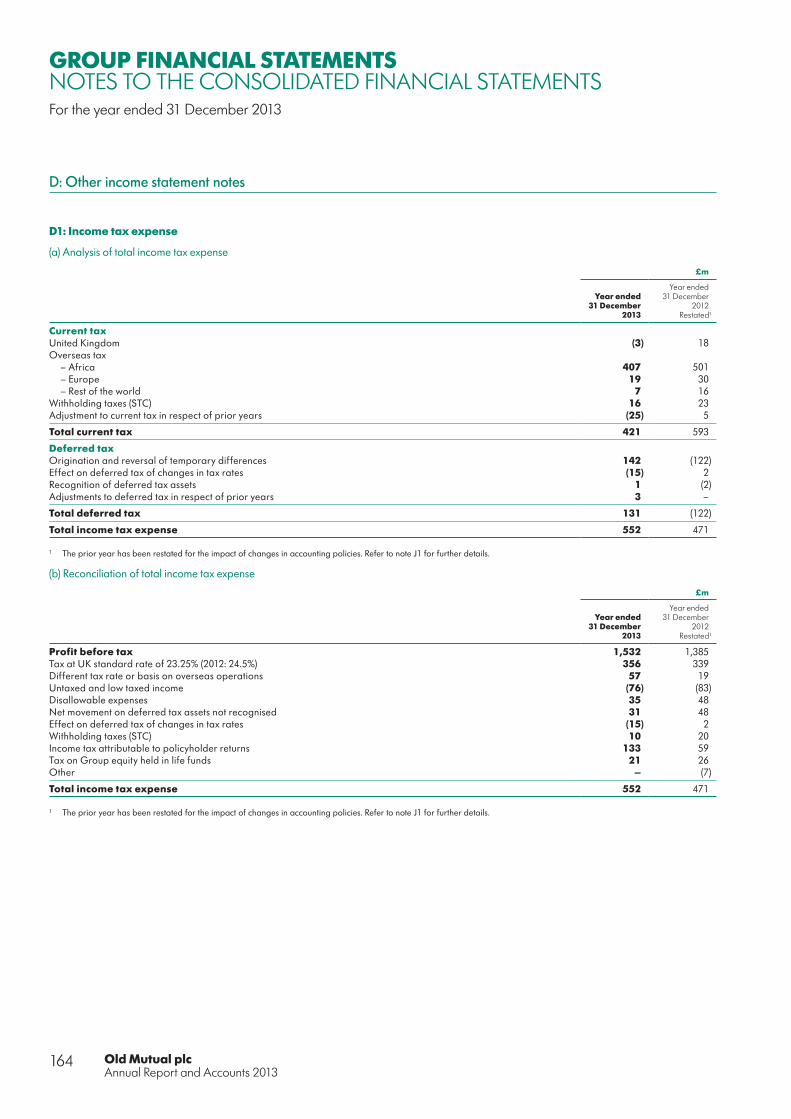
Old Mutual plcAnnual Report and Accounts 2013
164
GROUP FINANCIAL STATEMENTSNOTES TO THE CONSOLIDATED FINANCIAL STATEMENTSFor the year ended 31 December 2013
D: Other income statement notes
D1: Income tax expense
(a) Analysis of total income tax expense
£m
Year ended 31 December
2013
Year ended 31 December
2012Restated1
Current taxUnited Kingdom (3) 18 Overseas tax
– Africa 407 501 – Europe 19 30 – Rest of the world 7 16
Withholding taxes (STC) 16 23 Adjustment to current tax in respect of prior years (25) 5
Total current tax 421 593
Deferred taxOrigination and reversal of temporary differences 142 (122)Effect on deferred tax of changes in tax rates (15) 2 Recognition of deferred tax assets 1 (2)Adjustments to deferred tax in respect of prior years 3 –
Total deferred tax 131 (122)
Total income tax expense 552 471
1 The prior year has been restated for the impact of changes in accounting policies. Refer to note J1 for further details.
(b) Reconciliation of total income tax expense
£m
Year ended 31 December
2013
Year ended 31 December
2012Restated1
Profit before tax 1,532 1,385 Tax at UK standard rate of 23.25% (2012: 24.5%) 356 339 Different tax rate or basis on overseas operations 57 19 Untaxed and low taxed income (76) (83)Disallowable expenses 35 48 Net movement on deferred tax assets not recognised 31 48 Effect on deferred tax of changes in tax rates (15) 2 Withholding taxes (STC) 10 20 Income tax attributable to policyholder returns 133 59 Tax on Group equity held in life funds 21 26 Other – (7)
Total income tax expense 552 471
1 The prior year has been restated for the impact of changes in accounting policies. Refer to note J1 for further details.

165
Financials
(c) Income tax relating to components of other comprehensive income
£m
Year ended 31 December
2013
Year ended 31 December
2012Restated1
Preferred perpetual callable securities (10) (10)Measurement gains on defined benefit plans 22 4
Income tax on items that will not be reclassified subsequently to profit or loss 12 (6)Income tax on items that may be reclassified subsequently to profit or loss (2) 5
Income tax expense/(credit) – continuing operations 10 (1)Income tax expense on fair value movements – discontinued operations – 1
Income tax expense relating to components of other comprehensive income 10 –
1 The prior year has been restated for the impact of changes in accounting policies. Refer to note J1 for further details.
(d) Reconciliation of income tax expense in the IFRS income statement to income tax on adjusted operating profit
£m
Year ended 31 December
2013
Year ended 31 December
2012Restated1
Income tax expense 552 471 Tax on adjusting itemsGoodwill impairment and impact of acquisition accounting 26 51 Profit/(loss) on disposal of subsidiaries, associates and strategic investments 16 (10)Short-term fluctuations in investment return (2) 7 Tax on dividends declared to holders of perpetual preferred callable securities recognised in equity (10) (10)US Asset Management equity plans 11 6 Restructuring costs 5 –
Total tax on adjusting items 46 44 Income tax attributable to policyholders returns (174) (75)
Income tax on adjusted operating profit 424 440
1 The prior year has been restated for the impact of changes in accounting policies. Refer to note J1 for further details.
D2: Investment return (non-banking)
£m
Year ended 31 December
2013
Year ended 31 December
2012Restated1
Interest and similar income Loans and advances 48 35 Investments and securities 1,012 1,002 Cash and cash equivalents 121 82
Total interest and similar income 1,181 1,119 Dividend income – investments and securities 390 577 Fair value gains and losses recognised in income 8,161 7,941 Rental income from investment properties 152 176 Investment property gains on revaluation 103 75 Foreign currency losses (1) (8)
Total amounts recognised in profit or loss 9,986 9,880
Total interest income for assets not at fair value through profit or loss 12 35
The fair value gains and losses shown above are analysed according to their IAS 39 categorisations as follows:Held-for-trading (including derivatives) (25) (107)Designated at fair value through profit or loss 8,143 8,029 Available-for-sale financial assets 14 19
8,132 7,941
1 The prior year has been restated for the impact of changes in accounting policies. Refer to note J1 for further details.
Fair value gains and losses on available-for-sale financial assets for the year of £14 million (2012: £19 million) relate to gains realised on the sale of debt securities held by the Group’s Old Mutual Bermuda business.

Old Mutual plcAnnual Report and Accounts 2013
166
GROUP FINANCIAL STATEMENTSNOTES TO THE CONSOLIDATED FINANCIAL STATEMENTSFor the year ended 31 December 2013
D: Other income statement notes continued
D3: Banking interest and similar income
£m
Year ended 31 December
2013
Year ended 31 December
2012
Loans and advances 2,703 3,041
Mortgage loans 1,187 1,392 Finance lease and instalment debtors 514 560 Credit cards 98 101 Overdrafts 84 99 Term loans and other 820 889
Investments and securities 347 390
Government and government-guaranteed securities 236 258 Other debt securities, preference shares and debentures 111 132
Total interest and similar income 3,050 3,431
Total interest income for assets not at fair value through profit or loss 2,536 2,948 Total interest income on impaired financial assets 65 86
D4: Banking trading, investment and similar income
£m
Year ended 31 December
2013
Year ended 31 December
2012
Dividend income – investments and securities 3 8 Rental income from investment property 5 9 Net exchange and other non-interest income/(expenses) 17 (1)Net trading income 170 198
Total banking trading, investment and similar income 195 214
The fair value gains and losses included above are analysed according to their IAS 39 categorisations as follows:Held-for-trading (including derivatives) (145) (87)Designated at fair value through profit or loss 147 68
2 (19)
Realised fair value gains/(losses) included in the above 2 (19)
D5: Fee and commission income, and income from service activities
£m
Year ended 31 December 2013Life and savings
Asset management Banking
General insurance Total
Fee and commission income 902 1,126 934 28 2,990 Transaction and performance fees – 20 – – 20 Change in deferred revenue 49 38 1 (3) 85
951 1,184 935 25 3,095
£m
Year ended 31 December 2012 Restated1Life and savings
Asset management Banking
General insurance Total
Fee and commission income 924 1,047 977 27 2,975 Transaction and performance fees – 42 – – 42 Change in deferred revenue 12 10 1 (1) 22
936 1,099 978 26 3,039
1 The prior year has been restated for the impact of changes in accounting policies. Refer to note J1 for further details.
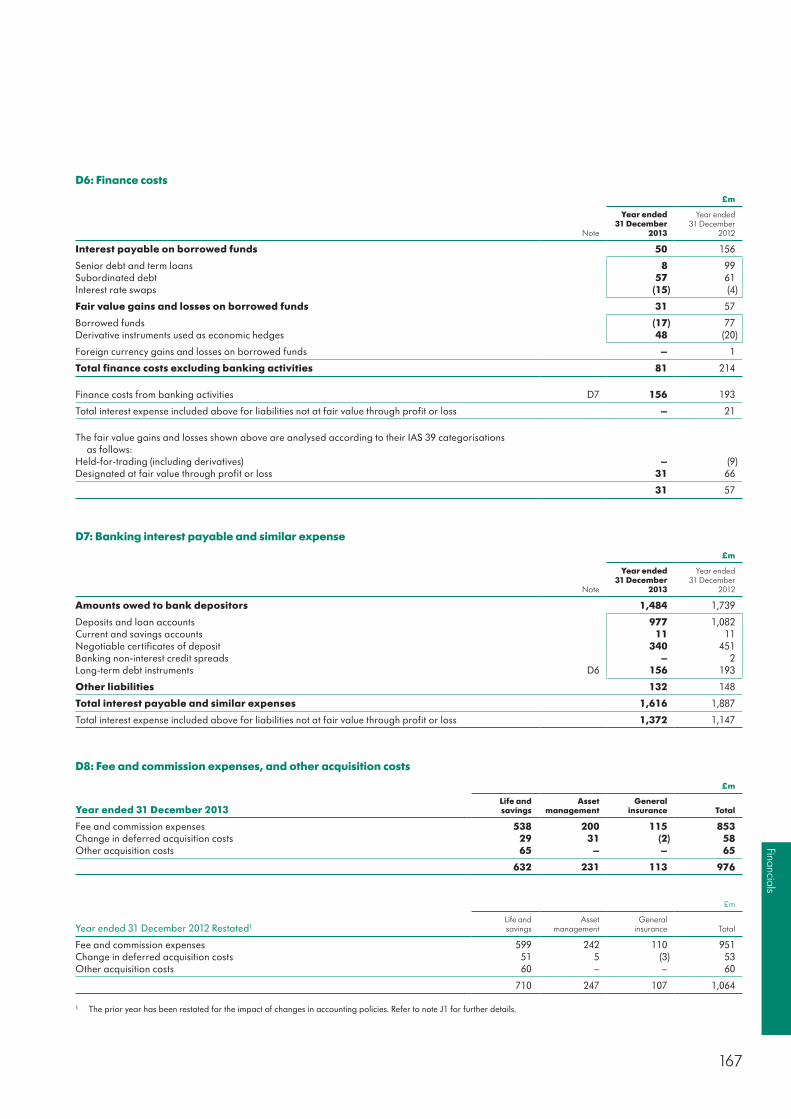
167
Financials
D6: Finance costs
£m
Note
Year ended 31 December
2013
Year ended 31 December
2012
Interest payable on borrowed funds 50 156
Senior debt and term loans 8 99 Subordinated debt 57 61 Interest rate swaps (15) (4)
Fair value gains and losses on borrowed funds 31 57
Borrowed funds (17) 77 Derivative instruments used as economic hedges 48 (20)
Foreign currency gains and losses on borrowed funds – 1
Total finance costs excluding banking activities 81 214
Finance costs from banking activities D7 156 193
Total interest expense included above for liabilities not at fair value through profit or loss – 21
The fair value gains and losses shown above are analysed according to their IAS 39 categorisations as follows:
Held-for-trading (including derivatives) – (9)Designated at fair value through profit or loss 31 66
31 57
D7: Banking interest payable and similar expense
£m
Note
Year ended 31 December
2013
Year ended 31 December
2012
Amounts owed to bank depositors 1,484 1,739
Deposits and loan accounts 977 1,082 Current and savings accounts 11 11 Negotiable certificates of deposit 340 451 Banking non-interest credit spreads – 2 Long-term debt instruments D6 156 193
Other liabilities 132 148
Total interest payable and similar expenses 1,616 1,887
Total interest expense included above for liabilities not at fair value through profit or loss 1,372 1,147
D8: Fee and commission expenses, and other acquisition costs
£m
Year ended 31 December 2013Life and savings
Asset management
General insurance Total
Fee and commission expenses 538 200 115 853 Change in deferred acquisition costs 29 31 (2) 58 Other acquisition costs 65 – – 65
632 231 113 976
£m
Year ended 31 December 2012 Restated1Life and savings
Asset management
General insurance Total
Fee and commission expenses 599 242 110 951 Change in deferred acquisition costs 51 5 (3) 53 Other acquisition costs 60 – – 60
710 247 107 1,064
1 The prior year has been restated for the impact of changes in accounting policies. Refer to note J1 for further details.

Old Mutual plcAnnual Report and Accounts 2013
168
GROUP FINANCIAL STATEMENTSNOTES TO THE CONSOLIDATED FINANCIAL STATEMENTSFor the year ended 31 December 2013
D: Other income statement notes continued
D9: Other operating and administrative expenses
(a) Other operating and administrative expenses include:
£m
Note
Year ended 31 December
2013
Year ended 31 December
2012
Staff costs D9(b) 1,904 1,919 Depreciation F2(a) 88 101 Software costs 10 9 Operating lease rentals 95 98 Amortisation of PVIF and other acquired intangibles F1(f) 173 188 Impairment of goodwill and other intangible assets C1(b)/F1(f) 28 (35)
Included within the profit from discontinued operations is an additional amortisation of intangibles charge of £nil (2012: £15 million)
Operating lease payments principally represent rentals payable by the Group for the rental of buildings and equipment.
(b) Staff costs
£m
Note
Year ended 31 December
2013
Year ended 31 December
2012
Wages and salaries 1,184 1,216 Social security costs 31 31 Retirement obligations
Defined contribution plans 88 97 Defined benefit plans 1 (4)Other retirement benefits 10 12
Bonus and incentive remuneration 373 351 Share-based payments
Cash settled H2(f) 40 64 Equity settled H2(f) 59 14
Other 118 138
1,904 1,919
Number
Year ended 31 December
2013
Year ended 31 December
2012Restated1
The average number of persons employed by the Group was:Emerging Markets 19,782 19,593 Old Mutual Wealth 2,886 3,122 Nedbank 29,799 28,767 Property & Casualty 2,864 2,371 USAM 1,249 1,225 Other 206 179 Non-core operations (Old Mutual Bermuda) 26 37
56,812 55,294
1 The prior year has been restated to reflect a consistent definition of an employed person within the Group.

169
Financials
(c) Fees to Group’s auditorsIncluded in other operating expenses and loss from discontinued operations are fees paid to the Group’s auditors. These can be categorised as follows:
£m
Year ended 31 December
2013
Year ended 31 December
2012
Fees for audit servicesGroup 1.3 1.2 Subsidiaries 10.5 11.0 Pension schemes 0.2 0.2
Total audit fees 12.0 12.4
Fees for non-audit servicesAudit-related assurance 0.7 2.4 Taxation compliance 1.6 1.5 Taxation advisory – 0.1 Corporate finance transactions 0.2 0.6 Other non-audit services 0.3 0.5
Total non-audit services 2.8 5.1
Total Group auditors’ remuneration 14.8 17.5
In addition to the above, fees of £3.7 million (2012: £4.2 million) were payable to other auditors in respect of joint audit arrangements of Nedbank, the Group’s banking subsidiary in South Africa.
E: Financial assets and liabilities
E1: Group statement of financial position
The Group is exposed to financial risk through its financial assets (investments and loans), financial liabilities (investment contracts, customer deposits and borrowings), reinsurance assets and insurance liabilities. The key focus of financial risk management for the Group is ensuring that the proceeds from its financial assets are sufficient to fund the obligations arising from its insurance and banking operations. The most important components of financial risk are credit risk, market risk (arising from changes in equity, bond prices, interest and foreign exchange rates), and liquidity risk.
(a) Recognition and derecognitionA financial asset or liability is recognised when, and only when, the Group becomes a party to the contractual provisions of the financial instrument.
The Group derecognises a financial asset when, and only when:
■ The contractual rights to the cash flows arising from the financial assets have expired or been forfeited by the Group or ■ It transfers the financial asset including substantially all the risks and rewards of ownership of the asset or ■ It transfers the financial asset and neither transfers nor retains substantially all the risks and rewards of ownership and does not retain control.
A financial liability is derecognised when and only when the liability is extinguished, that is when the obligation specified in the contract is discharged, assigned, cancelled or has expired.
The difference between the carrying amount of a financial liability (or part thereof) extinguished or transferred to another party and consideration received, including any non-cash assets transferred or liabilities assumed, is recognised in profit or loss.
All purchases and sales of financial assets that require delivery within the timeframe established by regulation or market convention (‘regular way’ purchases and sales) are recognised at trade date, which is the date that the Group commits to purchase or sell the asset. Loans and receivables are recognised (at fair value plus attributable transaction costs) when cash is advanced to borrowers.
(b) Initial measurementFinancial instruments are initially recognised at fair value plus, in the case of a financial asset or financial liability not at fair value through profit or loss, transaction costs that are directly attributable to the acquisition or issue of the financial asset or financial liability.
(c) Derivative financial instrumentsDerivative financial instruments are recognised in the statement of financial position at fair value. Fair values are obtained from quoted market prices, discounted cash flow models and option pricing models as appropriate. All derivatives are carried as assets when their fair value is positive and as liabilities when their fair value is negative.
Changes in the fair value of derivatives not designated as hedges for hedge accounting purposes are included in investment income or finance costs as appropriate.

Old Mutual plcAnnual Report and Accounts 2013
170
GROUP FINANCIAL STATEMENTSNOTES TO THE CONSOLIDATED FINANCIAL STATEMENTSFor the year ended 31 December 2013
E: Financial assets and liabilities continued
E1: Group statement of financial position continued
(d) Hedge accountingQualifying hedging instruments must either be derivative financial instruments or non-derivative financial instruments used to hedge the risk of changes in foreign currency exchange rates, changes in fair value or changes in cash flows. Changes in the value of the financial instrument should be expected to offset changes in the fair value or cash flows of the underlying hedged item.
The Group designates certain qualifying hedging instruments as either (1) a hedge of the exposure to changes in fair value of a recognised asset or liability or an unrecognised firm commitment (fair value hedge) or (2) a hedge of a future cash flow attributable to a recognised asset or liability, or a forecasted transaction, and could affect profit or loss (cash flow hedge) or, (3) a hedge of a net investment in a foreign operation. Hedge accounting is used for qualifying hedging instruments designated in this way provided certain criteria are met.
The Group’s criteria in accordance with reporting standards for a qualifying hedging instrument to be accounted for as a hedge include:
■ Upfront formal documentation of the hedging instrument, hedged item or transaction, risk management objective and strategy, the nature of the risk being hedged and the effectiveness measurement methodology that will be applied is prepared before hedge accounting is adopted
■ The hedge is documented showing that it is expected to be highly effective in offsetting the changes in the fair value or cash flows attributable to the hedged risk, consistent with the risk management and strategy detailed in the upfront hedge documentation
■ The effectiveness of the hedge can be reliably measured ■ The hedge is assessed and determined to have been highly effective on an ongoing basis ■ For cash flow hedges of a forecast transaction, an assessment that it is highly probable that the hedged transaction will occur and will carry profit or loss risk. Changes in the fair value of derivatives that are designated and qualify as fair value hedges and that prove to be highly effective in relation to hedged risk, are recorded in profit or loss, along with the corresponding change in fair value of the hedged asset or liability that is attributable to that specific hedged risk.
Changes in the fair value of derivatives that are designated and qualify as fair value hedges and that prove to be highly effective in relation to hedged risk, are recorded in profit or loss, along with the corresponding change in fair value of the hedged asset or liability that is attributable to that specific hedged risk.
Changes in the fair value of derivatives that are designated and qualify as cash flow hedges or hedges of a net investment in a foreign operation, and that prove to be highly effective in relation to the hedged risk, are recognised in other comprehensive income. Any ineffective portion of changes in the fair value of the derivative is recognised in profit or loss.
If the hedge no longer meets the criteria for hedge accounting, hedge accounting is discontinued prospectively. For fair value hedge accounting, any previous adjustment to the carrying amount of a hedged interest-bearing financial instrument carried at amortised cost (as a result of previous hedge accounting), is amortised in profit or loss from the date hedge accounting ceases, to the maturity date of the financial instrument, based on the effective interest method.
For hedges of a net investment in a foreign operation, any cumulative gains or losses in equity are recognised in profit or loss on disposal of the foreign operation.
(e) Embedded derivativesCertain derivatives embedded in financial and non-financial instruments, such as the conversion option in a convertible bond, are treated as separate derivatives and recognised as such on a stand alone basis, when their risks and characteristics are not closely related to those of the host contract and the host contract is not carried at fair value with unrealised gains and losses reported in profit or loss. If it is not possible to determine the fair value of the embedded derivative, the entire hybrid instrument is categorised as fair value through profit or loss and measured at fair value.
(f) Offsetting financial instruments and related incomeFinancial assets and liabilities are offset and the net amount reported in the statement of financial position only when there is a legally enforceable right to set off and there is intention to settle on a net basis, or to realise the asset and settle the liability simultaneously.
Income and expense items are offset only to the extent that their related instruments have been offset in the statement of financial position, with the exception of those relating to hedges, which are disclosed in accordance with profit or loss effect of the hedged item.
(g) Interest income and expenseInterest income and expense in relation to financial instruments carried at amortised cost or held as available-for-sale are recognised in profit or loss using the effective interest method, taking into account the expected timing and amount of cash flows. Interest income and expense include the amortisation of any discount or premium or other differences between the initial carrying amount of an interest-bearing instrument and its amount at maturity calculated on an effective interest basis.
Interest income and expense on financial instruments carried at fair value through profit or loss are presented as part of interest income or expense.
171
Financials
(h) Non-interest revenueNon-interest revenue in respect of financial instruments principally comprises fees and commission and other operating income. These are accounted for as set out below.
Fees and commission incomeLoan origination fees, for loans that are probable of being drawn down, are deferred (together with related direct costs) and recognised as an adjustment to the effective yield on the loan. Fees and commission arising from negotiating, or participating in the negotiation of a transaction for a third party, such as the acquisition of loans, shares or other securities or the purchase or sale of businesses, are recognised on completion of the underlying transaction.
OtherRevenue other than interest, fees and commission (including fees and insurance premiums), which includes exchange and securities trading income, dividends from investments and net gains on the sale of banking assets, is recognised in profit or loss when the amount of revenue from the transaction or service can be measured reliably and it is probable that the economic benefits of the transaction or service will flow to the Group.
(i) Financial assetsNon-derivative financial assets are recorded as held-for-trading, designated as fair value through profit or loss, loans and receivables, held-to-maturity or available-for-sale. An analysis of the Group’s statement of financial position, showing the categorisation of financial assets, together with financial liabilities is set out in note E1(o).
(j) Classification of financial instrumentsHeld-for-trading financial assetsHeld-for-trading financial assets are those that were either acquired for generating a profit from short-term fluctuations in price or dealer’s margin, or are securities included in a portfolio in which a pattern of short-term profit taking exists, or are derivatives that are not designated as effective hedging instruments.
Financial assets designated as fair value through profit or lossFinancial assets that the Group has elected to designate as fair value through profit or loss are those where the treatment either eliminates or significantly reduces a measurement or recognition inconsistency that would otherwise arise when using a different measurement basis (for instance with respect to financial assets supporting insurance contract provisions) or are managed, evaluated and reported using a fair value basis (for instance financial assets supporting shareholders’ funds).
All financial assets carried at fair value through profit or loss, whether held-for-trading or designated, are initially recognised at fair value and subsequently remeasured at fair value based on bid prices quoted in active markets. If such price information is not available for these instruments, the Group uses other valuation techniques, including internal models, to measure these instruments. These techniques use market observable inputs where available, derived from similar assets and liabilities in similar and active markets, from recent transaction prices for comparable items or from other observable market data. For positions where observable reference data are not available for some or all parameters, the Group estimates the non-market observable inputs used in its valuation models. Where discounted cash flow techniques are used, estimated future cash flows are based on management’s best estimates and the discount rate used is a market-related rate at the reporting date for an instrument with similar terms and conditions.
Fair values of certain financial instruments, such as over-the-counter (OTC) derivative instruments, are determined using pricing models that consider, among other factors, contractual and market prices, correlations, yield curves, credit spreads and volatility factors.
Realised and unrealised fair value gains and losses on all financial assets carried at fair value through profit or loss are included in investment return (non-banking) or in banking trading, investment and similar income as appropriate.
Interest earned whilst holding financial assets at fair value through profit or loss is reported within Investment return (non-banking) or banking interest and similar income, as appropriate. Dividends receivable are included separately in dividend income, within Investment return (non-banking) or banking trading, investment and similar income, when a dividend is declared.
Loans and receivablesLoans and receivables are non-derivative financial assets with fixed or determinable payments that are not quoted in an active market, other than those classified by the Group as fair value through profit or loss or available-for-sale. Loans and receivables are carried at amortised cost less any impairment write-downs. Third-party expenses such as legal fees incurred in securing a loan are treated as part of the cost of the transaction.
Held-to-maturity financial assetsFinancial assets with fixed maturity dates which are quoted in an active market and where management has both the intent and the ability to hold the asset to maturity are classified as held-to-maturity. These assets are carried at amortised cost less any impairment write-downs. Interest earned on held-to-maturity financial assets is reported within investment return (non-banking) or banking interest and similar income, as appropriate.

Old Mutual plcAnnual Report and Accounts 2013
172
GROUP FINANCIAL STATEMENTSNOTES TO THE CONSOLIDATED FINANCIAL STATEMENTSFor the year ended 31 December 2013
E: Financial assets and liabilities continued
E1: Group statement of financial position continued
(j) Classification of financial instruments continued
Available-for-sale financial assetsFinancial assets intended to be held for an indefinite period of time, which may be sold in response to needs for liquidity or changes in interest rates, exchange rates or equity prices other than those designated fair value through profit or loss or as loans and receivables, are classified as available-for-sale. Management determines the appropriate classification of its investments at the time of the purchase.
Available-for-sale financial assets are measured at fair value based on bid prices quoted in active markets. If such prices are unavailable or determined to be unreliable, the fair value of the financial asset is estimated using pricing models or discounted cash flow techniques. Where discounted cash flow techniques are used, estimated future cash flows are based on management’s best estimates and the discount rate used is a market-related rate at the reporting date for an instrument with similar terms and conditions. Where pricing models are used, inputs are based on observable market data where available at the reporting date.
Unrealised gains and losses arising from changes in the fair value of available-for-sale financial assets are recognised in other comprehensive income. When available-for-sale financial assets are disposed the related accumulated fair value adjustments are included in profit or loss as gains and losses from available-for-sale financial assets. When available-for-sale assets are impaired the resulting loss is shown separately in profit or loss as an impairment charge.
Interest earned on available-for-sale financial assets is reported within Investment return (non-banking) or banking interest and similar income, as appropriate. Dividends receivable are included separately in dividend income, within Investment return (non-banking) or banking trading, investment and similar income, as appropriate when a dividend is declared.
Financial liabilities (other than investment contracts and derivatives)Non-derivative financial liabilities, including borrowed funds, amounts owed to depositors and liabilities under acceptances, are recorded as held-for-trading, designated as fair value through profit or loss or as financial liabilities at amortised cost.
Liabilities that the Group has elected to designate as fair value through profit or loss are those where the treatment either eliminates or significantly reduces a measurement or recognition inconsistency that would otherwise arise when using a different measurement basis or the financial liabilities managed, evaluated and reported using a fair value basis.
For financial liabilities recorded at fair value and which contain a demand feature, the fair value of the liability is not less than the amount payable on demand, discounted from the first date that the amount could be required to be paid.
Financial liabilities categorised at amortised cost are recognised initially at fair value, which is normally represented by the transaction price, less directly attributable transaction costs. Subsequent to initial recognition these financial liabilities are stated at amortised cost with any difference between cost and redemption value being recognised in profit or loss over the period of the borrowings on an effective interest basis.
Equity classified conversion options included within financial liabilities are recorded separately in shareholders’ equity. The Group does not recognise any change in the value of this option in subsequent periods. The remaining obligation to make future payments of principal and interest to bondholders is calculated using a market interest rate for an equivalent non-convertible bond and is presented on the amortised cost basis in other borrowed funds until extinguished on conversion or maturity of the bonds.
If the Group purchases its own debt, it is removed from the statement of financial position and the difference between the carrying amount of a liability and the consideration paid is included in other income.
(k) Reclassifications of financial assetsA non-derivative financial asset that would have met the definition of loans and receivables at initial recognition that was required to be categorised as held-for-trading (on the basis that it was held for the purpose of selling or repurchasing in the near term) may under exceptional circumstances be reclassified out of the fair value through profit or loss category if the Group intends and is able to hold the financial asset for the foreseeable future or until maturity. If a financial asset is so reclassified, it is reclassified at its fair value on the date of reclassification. Any gain or loss already recognised in profit or loss is not reversed. The fair value at the date of reclassification becomes its new cost or amortised cost, as applicable.
Other non-derivative financial assets that were required to be categorised as held-for-trading at initial recognition may be reclassified out of the fair value through profit or loss category in rare circumstances. If a financial asset is so reclassified, it is reclassified at its fair value on the date of reclassification. Any gain or loss already recognised in profit or loss is not reversed. Measurement of the asset after reclassification depends on the subsequent categorisation.

173
Financials
A non-derivative financial asset that would have met the definition of loans and receivables at initial recognition that was designated as available-for-sale may under exceptional circumstances be reclassified out of the available-for-sale category to the loans and receivables category if it meets the loans and receivables definition at the date of reclassification and if the Group intends and is able to hold the financial asset for the foreseeable future or until maturity. If a financial asset is so reclassified, it is reclassified at its fair value on the date of reclassification. The fair value at the date of reclassification becomes its new cost or amortised cost, as applicable. In the case of a financial asset with a fixed maturity, the gain or loss already recognised in the available-for-sale reserve in equity is amortised to profit or loss over the remaining life using the effective interest method together with any difference between the new amortised cost and the maturity amount. In the case of a financial asset that does not have a fixed maturity, the gain or loss already recognised in the available-for-sale reserve in equity is recognised in profit or loss when the financial asset is sold or otherwise disposed.
(l) Sale and repurchase agreements and lending of securitiesSecurities sold subject to linked repurchase agreements are retained in the financial statements as appropriate when considering the de-recognition criteria contained within IAS 39. The securities that are retained in the financial statements are reflected as trading or investment securities and the counterparty liability is included in amounts owed to other depositors, deposits from other banks, or other money market deposits, as appropriate. Securities purchased under agreements to resell at a pre-determined price are recorded as loans and advances to other banks or customers as appropriate. The difference between the sale and repurchase price is treated as interest and accrued over the lives of agreements using the effective interest method.
Securities lent to counterparties are retained in the financial statements and any interest earned recognised in profit or loss using the effective interest method.
Securities borrowed are not recognised in the financial statements, unless these are sold to third parties, in which case the purchase and sale are recorded with the gain or loss included in trading income. The obligation to return them is recorded at fair value as a trading liability.
(m) Parent Company investments in subsidiary undertakings and associatesParent Company investments in subsidiary undertakings and associates are recorded at cost. Impairments of Parent Company investments in subsidiary undertakings and associates are accounted for in the same way as impairments of other non-financial assets.
(n) Impairments of financial assetsIndicators of impairmentA provision for impairment is established if there is objective evidence that the Group will not be able to recover all amounts relating to the financial asset. Observable data that could come to the attention of the Group that could lead to a provision for impairment to be made include:
■ Significant financial difficulty of the counterparty ■ A breach of contract, such as a default or delinquency in interest or principal payments ■ The Group, for economic or legal reasons relating to the counterparty’s financial difficulty, grants to the counterparty a concession that the Group would not otherwise consider
■ It becoming probable that the counterparty will enter bankruptcy or other financial reorganisation ■ Observable data indicating that there is a measurable decrease in the estimated future cash flows from a group of assets since the initial recognition of those assets, although the decrease cannot yet be identified with the individual financial assets, including:
— adverse changes in the payment status of counterparties in the group of financial assets; or — national or local economic conditions that correlate with defaults on the assets in the group of financial assets.
In addition, for an available-for-sale financial asset, a significant or prolonged decline in the fair value below its cost is also objective evidence of impairment.
Financial assets at amortised costThe amount of the impairment of a financial asset held at amortised cost is the difference between the carrying amount and the recoverable amount, being the value of expected cash flows, including amounts recoverable from guarantees and collateral, discounted based on the effective interest rate at initial recognition. In estimating future expected cash flows the Group looks at the contractual cash flows of the assets and adjusts these contractual cash flows for historical loss experience of assets with similar credit risks, with this adjusted to reflect any additional conditions that are expected to arise or to account for those which no longer exist. This is done to predict inherent losses which exist in the asset as at the reporting date but have not been reported.
The impairment provision also covers losses where there is objective evidence that losses are present in components of the loan portfolio at the reporting date, but these components have not yet been specifically identified. When a loan is uncollectable, it is written off against the related impairment provision.
If the amount of impairment subsequently decreases due to an event occurring after the write-down, the release of the impairment provision is credited to profit or loss. Impairment reversals are limited to what the carrying amount would have been, had no impairment losses been recognised.
Interest income on impaired loans and receivables is recognised on the impaired amount using the original effective interest rate before the impairment.
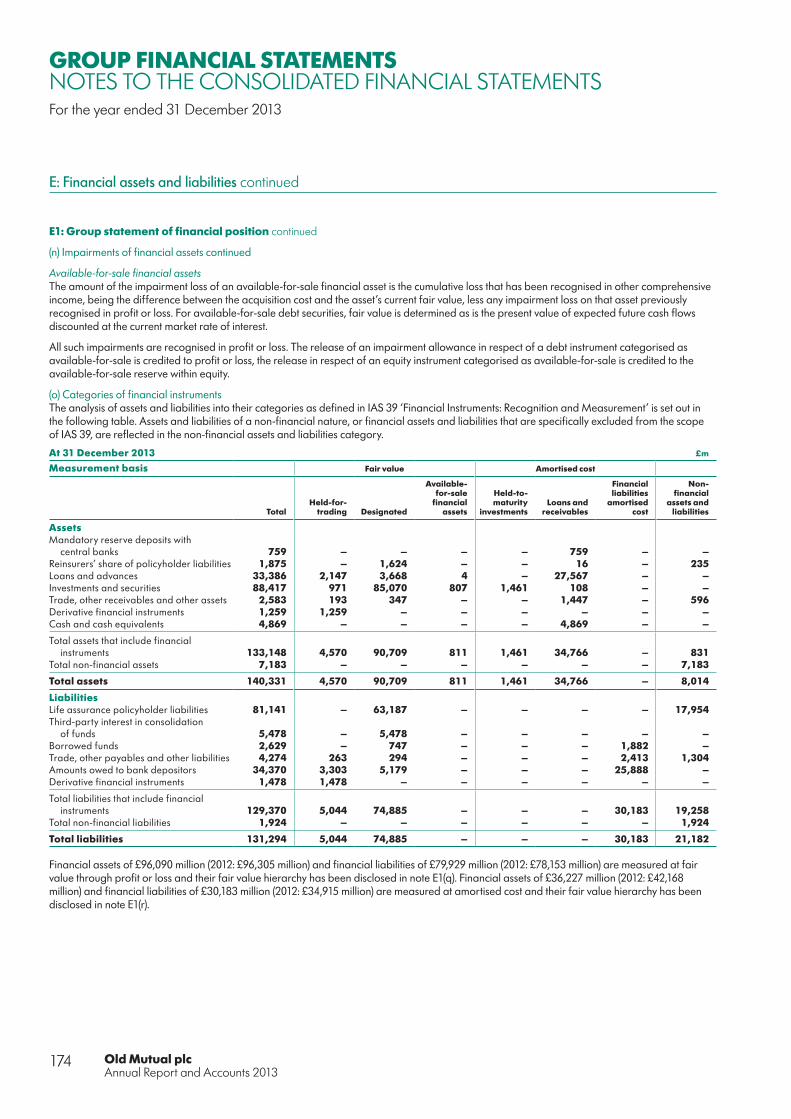
Old Mutual plcAnnual Report and Accounts 2013
174
GROUP FINANCIAL STATEMENTSNOTES TO THE CONSOLIDATED FINANCIAL STATEMENTSFor the year ended 31 December 2013
E: Financial assets and liabilities continued
E1: Group statement of financial position continued
(n) Impairments of financial assets continued
Available-for-sale financial assetsThe amount of the impairment loss of an available-for-sale financial asset is the cumulative loss that has been recognised in other comprehensive income, being the difference between the acquisition cost and the asset’s current fair value, less any impairment loss on that asset previously recognised in profit or loss. For available-for-sale debt securities, fair value is determined as is the present value of expected future cash flows discounted at the current market rate of interest.
All such impairments are recognised in profit or loss. The release of an impairment allowance in respect of a debt instrument categorised as available-for-sale is credited to profit or loss, the release in respect of an equity instrument categorised as available-for-sale is credited to the available-for-sale reserve within equity.
(o) Categories of financial instrumentsThe analysis of assets and liabilities into their categories as defined in IAS 39 ‘Financial Instruments: Recognition and Measurement’ is set out in the following table. Assets and liabilities of a non-financial nature, or financial assets and liabilities that are specifically excluded from the scope of IAS 39, are reflected in the non-financial assets and liabilities category.
At 31 December 2013 £m
Measurement basis Fair value Amortised cost
TotalHeld-for-
trading Designated
Available-for-sale
financial assets
Held-to-maturity
investmentsLoans and
receivables
Financial liabilities
amortised cost
Non-financial
assets and liabilities
AssetsMandatory reserve deposits with
central banks 759 – – – – 759 – – Reinsurers’ share of policyholder liabilities 1,875 – 1,624 – – 16 – 235 Loans and advances 33,386 2,147 3,668 4 – 27,567 – – Investments and securities 88,417 971 85,070 807 1,461 108 – – Trade, other receivables and other assets 2,583 193 347 – – 1,447 – 596 Derivative financial instruments 1,259 1,259 – – – – – – Cash and cash equivalents 4,869 – – – – 4,869 – –
Total assets that include financial instruments 133,148 4,570 90,709 811 1,461 34,766 – 831
Total non-financial assets 7,183 – – – – – – 7,183
Total assets 140,331 4,570 90,709 811 1,461 34,766 – 8,014
LiabilitiesLife assurance policyholder liabilities 81,141 – 63,187 – – – – 17,954 Third-party interest in consolidation
of funds 5,478 – 5,478 – – – – – Borrowed funds 2,629 – 747 – – – 1,882 – Trade, other payables and other liabilities 4,274 263 294 – – – 2,413 1,304 Amounts owed to bank depositors 34,370 3,303 5,179 – – – 25,888 – Derivative financial instruments 1,478 1,478 – – – – – –
Total liabilities that include financial instruments 129,370 5,044 74,885 – – – 30,183 19,258
Total non-financial liabilities 1,924 – – – – – – 1,924
Total liabilities 131,294 5,044 74,885 – – – 30,183 21,182
Financial assets of £96,090 million (2012: £96,305 million) and financial liabilities of £79,929 million (2012: £78,153 million) are measured at fair value through profit or loss and their fair value hierarchy has been disclosed in note E1(q). Financial assets of £36,227 million (2012: £42,168 million) and financial liabilities of £30,183 million (2012: £34,915 million) are measured at amortised cost and their fair value hierarchy has been disclosed in note E1(r).

175
Financials
At 31 December 2012 £m
Measurement basis Fair value Amortised cost
TotalHeld-for-
trading Designated
Available- for-sale
financial assets
Held-to-maturity
investmentsLoans and
receivables
Financial liabilities
amortised cost
Non- financial
assets and liabilities
AssetsMandatory reserve deposits with
central banks 921 – – – – 921 – – Reinsurers’ share of policyholder liabilities 1,406 – 1,164 – – 21 – 221 Loans and advances 38,495 2,158 4,068 3 – 32,266 – – Investments and securities 88,513 1,184 84,192 899 1,809 429 – – Trade, other receivables and other assets 3,006 275 582 – – 1,661 – 488 Derivative financial instruments – assets 1,780 1,780 – – – – – – Cash and cash equivalents 5,061 – – – – 5,061 – –
Total assets that include financial instruments 139,182 5,397 90,006 902 1,809 40,359 – 709
Total non-financial assets 7,780 – – – – – – 7,780
Total assets 146,962 5,397 90,006 902 1,809 40,359 – 8,489
LiabilitiesLife assurance policyholder liabilities 80,188 – 59,092 – – 201 – 20,895 Third-party interest in consolidation
of funds 6,116 – 6,116 – – – – – Borrowed funds 3,050 – 919 – – – 2,131 – Trade, other payables and other liabilities 4,940 463 373 – – – 3,073 1,031 Amounts owed to bank depositors 39,499 4,060 5,728 – – – 29,711 – Derivative financial instruments – liabilities 1,402 1,402 – – – – – –
Total liabilities that include financial instruments 135,195 5,925 72,228 – – 201 34,915 21,926
Total non-financial liabilities 1,994 – – – – – – 1,994
Total liabilities 137,189 5,925 72,228 – – 201 34,915 23,920

Old Mutual plcAnnual Report and Accounts 2013
176
GROUP FINANCIAL STATEMENTSNOTES TO THE CONSOLIDATED FINANCIAL STATEMENTSFor the year ended 31 December 2013
E: Financial assets and liabilities continued
E1: Group statement of financial position continued
(p) Fair values of financial assets and liabilities
(i) Determination of fair valueAll financial instruments, regardless of their IAS 39 categorisation, are initially recorded at fair value. The fair value of a financial instrument on initial recognition is normally the transaction price, that is, the fair value of the consideration given or received. In certain circumstances, however, the initial fair value may be based on other observable current market transactions in the same instrument, without modification or repackaging, or on a valuation technique whose variables include only observable data.
Subsequent to initial recognition, the fair values of financial instruments measured at fair value that are quoted in active markets are based on bid prices for assets, which in certain circumstances includes using quotations from independent third parties such as brokers and pricing services, and offer prices for liabilities. When quoted prices are not available, fair values are determined by using valuation techniques that refer as far as possible to observable market data. These include comparison with similar instruments where market observable prices exist, discounted cash flow analysis, option pricing models and other valuation techniques commonly used by market participants. A number of factors such as bid-offer spread, credit profile, servicing costs and model uncertainty are taken into account, as appropriate, when values are calculated using a valuation technique. Changes in the assumptions used in such valuations could impact the reported value of such instruments. All derivative instruments are measured at fair value.
In general none of the carrying amounts of financial assets and liabilities carried at amortised cost have a fair value significantly different to their carrying amounts. Such assets and liabilities primarily comprise variable-rate financial assets and liabilities that re-price as interest rates change, short-term deposits or current assets.
All financial assets and liabilities that are measured at amortised cost are initially recognised at fair value plus transaction costs.
Loans and advancesLoans and advances include mortgage loans, other asset-based loans, including collateralised debt obligations, and other secured and unsecured loans.
In the absence of an observable market for these instruments, the fair value is determined by using internally developed models that are specific to the instrument and that incorporate all available observable inputs. These models involve discounting the contractual cash flows by using a credit-adjusted zero-coupon rate.
Investments and securitiesInvestments and securities include government and government-guaranteed securities, listed and unlisted debt securities, preference shares and debentures, listed and unlisted equity securities, listed and unlisted pooled investments (see below), short-term funds and securities treated as investments and certain other securities.
Pooled investments represent the Group’s holdings of shares/units in open-ended investment companies, unit trusts, mutual funds and similar investment vehicles. Pooled investments are stated at fair value. The fair values of pooled investments are based on widely published prices that are regularly updated or models based on the market prices of investments held in the underlying pooled investment funds.
Amounts owed to bank depositorsThe fair values of amounts owed to bank depositors corresponds with the carrying amount shown in the statement of financial position, which generally reflects the amount payable on demand.
Borrowed fundsThe fair values of amounts included in borrowed funds are based on quoted market prices at the reporting date where applicable, or by reference to quoted prices of similar instruments.
Other financial assets and liabilitiesThe fair values of other financial assets and liabilities (which comprise cash and cash equivalents, cash with central banks, other assets and liabilities) are reasonably approximated by the carrying amounts reflected in the statement of financial position as they are short-term in nature or re-price to current market rates frequently.
177
Financials
(ii) Fair value hierarchyFair values are determined according to the following hierarchy:
■ Level 1 – quoted market prices: financial assets and liabilities with quoted prices for identical instruments in active markets. Instruments classified as Level 1 generally comprise listed equity securities, government securities and other listed debt securities and similar instruments, actively traded pooled investments, certain quoted derivative assets and liabilities, listed borrowed funds and investment contract liabilities linked to Level 1 pooled investments and other assets
■ Level 2 – valuation techniques using observable inputs: financial assets and liabilities with quoted prices for similar instruments in active markets or quoted prices for identical or similar instruments in inactive markets and financial assets and liabilities valued using models where all significant inputs are observable. Instruments classified as Level 2 generally comprise unlisted equity and debt securities where the valuation is based on models involving no significant unobservable data. Certain inputs, such as discount rates and credit spreads may be unobservable but these inputs do not have a significant impact on the fair value of the instrument. This includes certain loans and advances, certain privately placed debt instruments, third-party interests in consolidated funds and amounts owed to bank depositors
■ Level 3 – valuation techniques using significant unobservable inputs: financial assets and liabilities valued using valuation techniques where one or more significant inputs are unobservable. Instruments classified as Level 3 generally comprise unlisted equity and securities with significant unobservable inputs, securities where the market is not considered sufficiently active, including certain inactive pooled investments, and derivatives embedded in certain portfolios of insurance contracts where the derivative is not closely related to the host contract and the valuation contains significant unobservable inputs
■ The Group deems a transfer to have occurred between Level 1 and Level 2 when an active, traded primary market ceases to exist for that financial instrument.
The best evidence of fair value is a quoted price in an active market. In the event that the market for a financial asset or liability is not active, or quoted prices cannot be obtained without undue effort, another valuation technique is used.
The judgement as to whether a market is active may include, for example, consideration of factors such as the magnitude and frequency of trading activity, the availability of prices and the size of bid/offer spreads. In inactive markets, obtaining assurance that the transaction price provides evidence of fair value or determining the adjustments to transaction prices that are necessary to measure the fair value of the asset or liability requires additional work during the valuation process.
The majority of valuation techniques employ only observable data and so the reliability of the fair value measurement is high. However, certain financial assets and liabilities are valued on the basis of valuation techniques that feature one or more significant inputs that are unobservable and, for them, the derivation of fair value is more judgemental. A financial asset or liability in its entirety is classified as valued using significant unobservable inputs if a significant proportion of that asset or liability’s carrying amount is driven by unobservable inputs.
In this context, ‘unobservable’ means that there is little or no current market data available for which to determine the price at which an arm’s length transaction would be likely to occur. It generally does not mean that there is no market data available at all upon which to base a determination of fair value. Furthermore, in some cases the majority of the fair value derived from a valuation technique with significant unobservable data may be attributable to observable inputs. Consequently, the effect of uncertainty in determining unobservable inputs will generally be restricted to uncertainty about the overall fair value of the asset or liability being measured. Details of the Group’s valuation techniques can be found in note E1(q) (iii). There have been no significant changes to the valuation techniques applied.

Old Mutual plcAnnual Report and Accounts 2013
178
GROUP FINANCIAL STATEMENTSNOTES TO THE CONSOLIDATED FINANCIAL STATEMENTSFor the year ended 31 December 2013
E: Financial assets and liabilities continued
E1: Group statement of financial position continued
(q) Disclosure of financial assets and liabilities measured at fair value
(i) Financial assets and liabilities measured at fair value, classified according to fair value hierarchy:
The table below presents the Group’s financial assets and liabilities that are measured at fair value in the consolidated statement of financial position according to their IAS 39 classification, as set out in note E1(o), and in terms of the fair value hierarchy as required by IFRS 7 ‘Financial Instruments: Disclosures’.
£m
At 31 December 2013 Total Level 1 Level 2 Level 3
Financial assets measured at fair valueHeld-for-trading (fair value through profit or loss) 4,570 493 4,066 11
Loans and advances 2,147 – 2,147 – Investments and securities 971 295 673 3 Other financial assets 193 193 – – Derivative financial instruments – assets 1,259 5 1,246 8
Designated (fair value through profit or loss) 90,709 76,822 12,177 1,710
Reinsurers’ share of policyholder liabilities 1,624 1,624 – – Loans and advances 3,668 1 3,665 2 Investments and securities 85,070 74,850 8,512 1,708 Other financial assets 347 347 – –
Available-for-sale financial assets 811 348 461 2
Loans and advances 4 4 – – Investments and securities 807 344 461 2
Total assets measured at fair value 96,090 77,663 16,704 1,723
Financial liabilities measured at fair valueHeld-for-trading (fair value through profit or loss) 5,044 265 4,779 –
Other liabilities 263 256 7 – Amounts owed to bank depositors 3,303 – 3,303 – Derivative financial instruments – liabilities 1,478 9 1,469 –
Designated (fair value through profit or loss) 74,885 48,237 25,716 932
Life assurance policyholder liabilities 63,187 47,538 14,717 932 Third-party interests in consolidated funds 5,478 – 5,478 – Borrowed funds 747 663 84 – Other liabilities 294 36 258 – Amounts owed to bank depositors 5,179 – 5,179 –
Total liabilities measured at fair value 79,929 48,502 30,495 932

179
Financials
£m
At 31 December 2012 Total Level 1 Level 2 Level 3
Financial assets measured at fair valueHeld-for-trading (fair value through profit or loss) 5,397 639 4,754 4
Loans and advances 2,158 – 2,158 – Investments and securities 1,184 361 819 4 Other financial assets 275 275 – – Derivative financial instruments – assets 1,780 3 1,777 –
Designated (fair value through profit or loss) 90,006 68,060 20,815 1,131
Reinsurers’ share of policyholder liabilities 1,164 1,164 – –Loans and advances 4,068 2 4,057 9 Investments and securities 84,192 66,339 16,731 1,122 Other financial assets 582 555 27 –
Available-for-sale financial assets 902 335 565 2
Loans and advances 3 3 – –Investments and securities 899 332 565 2
Total assets measured at fair value 96,305 69,034 26,134 1,137
Financial liabilities measured at fair valueHeld-for-trading (fair value through profit or loss) 5,925 462 5,463 –
Other liabilities 463 459 4 – Amounts owed to bank depositors 4,060 – 4,060 – Derivative financial instruments – liabilities 1,402 3 1,399 –
Designated (fair value through profit or loss) 72,228 42,788 28,960 480
Life assurance policyholder liabilities 59,092 41,879 16,733 480 Third-party interests in consolidated funds 6,116 – 6,116 – Borrowed funds 919 906 13 – Other liabilities 373 3 370 – Amounts owed to bank depositors 5,728 – 5,728 –
Total liabilities measured at fair value 78,153 43,250 34,423 480

Old Mutual plcAnnual Report and Accounts 2013
180
GROUP FINANCIAL STATEMENTSNOTES TO THE CONSOLIDATED FINANCIAL STATEMENTSFor the year ended 31 December 2013
E: Financial assets and liabilities continued
E1: Group statement of financial position continued
(q) Fair value disclosure for financial assets and liabilities measured at fair value continued
(ii) Level 3 fair value hierarchy disclosure
The table below reconciles the opening balances of financial assets and liabilities measured in terms of Level 3 fair value hierarchy to the closing balance at the end of the year:
£m
Year ended 31 December 2013
Held-for-trading –
Investments and securities
Held-for-trading –
Derivatives
Designated fair value
through profit or loss – Loans and advances
Designated fair value
through profit or loss –
Investments and securities
Available- for-sale –
Investments and securities Total
Level 3 financial assetsAt beginning of the year 4 – 9 1,122 2 1,137 Total net gains recognised in profit or loss 1 – – 65 – 66 Purchases and issues – 9 – 290 – 299 Sales and settlements (1) – (6) (77) – (84)Transfers in – – – 464 – 464 Transfers out – – – (21) – (21)Foreign exchange and other (1) (1) (1) (135) – (138)
Total Level 3 financial assets 3 8 2 1,708 2 1,723
Gains relating to assets held at 31 December 2013 recognised in:– profit or loss – – – 55 – 55
£m
Year ended 31 December 2013
Designated fair value
through profit or loss – Life
assurance policyholder
liabilities (investment
contracts) Total
Level 3 financial liabilitiesAt beginning of the year 480 480 Gains recognised in profit or loss (8) (8)Purchases and issues 106 106 Sales and settlements (114) (114)Transfers in 464 464 Transfers out – –Foreign exchange and other 4 4
Total Level 3 financial liabilities 932 932
Gains relating to liabilities held at 31 December 2013 recognised in:– profit or loss (12) (12)
During the year, £464 million of investment and securities was transferred from Level 2 to Level 3 in terms of the fair value hierarchy. This relates to Old Mutual Wealth investments in illiquid property investment funds. Observable inputs which can be utilised to value these funds are not readily available. These investment funds back policyholder liabilities (investment contracts) for which there is a corresponding £464 million Level 3 of the fair value hierarchy. The backing of liabilities by assets means that the Group is not exposed to any profit or loss arising on the realisation of these investment funds.
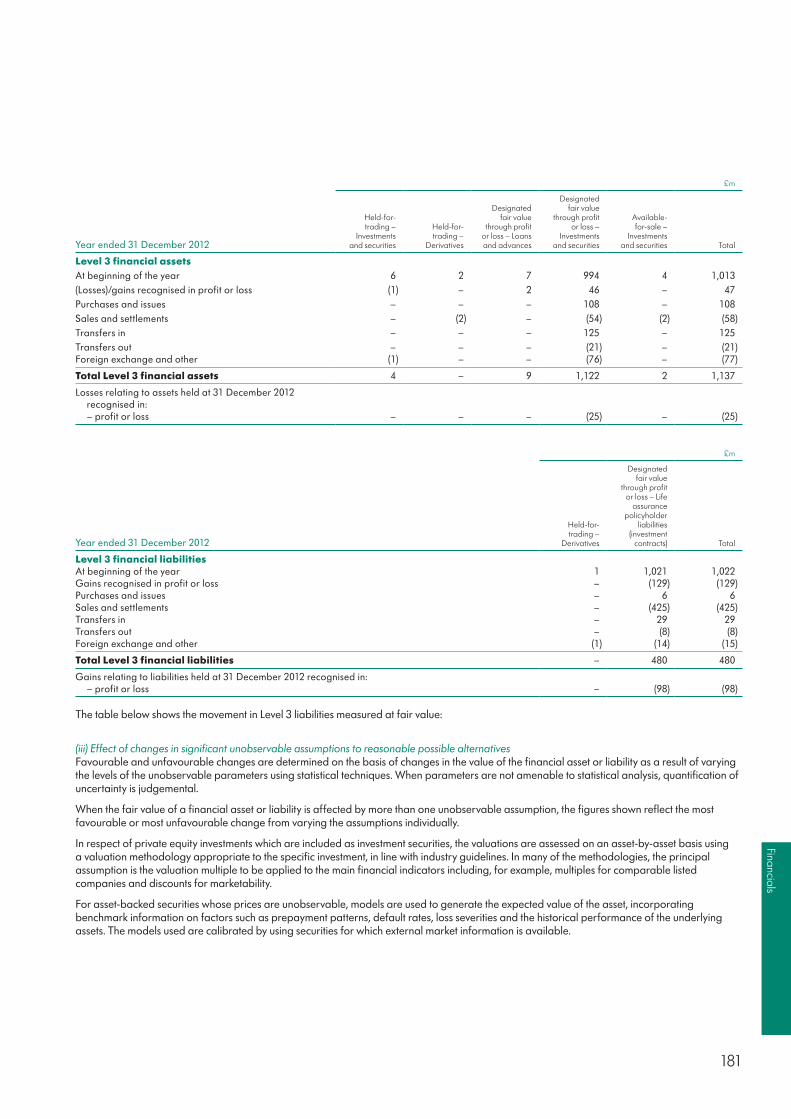
181
Financials
£m
Year ended 31 December 2012
Held-for- trading –
Investments and securities
Held-for- trading –
Derivatives
Designated fair value
through profit or loss – Loans and advances
Designated fair value
through profit or loss –
Investments and securities
Available- for-sale –
Investments and securities Total
Level 3 financial assetsAt beginning of the year 6 2 7 994 4 1,013 (Losses)/gains recognised in profit or loss (1) – 2 46 – 47 Purchases and issues – – – 108 – 108 Sales and settlements – (2) – (54) (2) (58)Transfers in – – – 125 – 125Transfers out – – – (21) – (21)Foreign exchange and other (1) – – (76) – (77)
Total Level 3 financial assets 4 – 9 1,122 2 1,137
Losses relating to assets held at 31 December 2012 recognised in:– profit or loss – – – (25) – (25)
£m
Year ended 31 December 2012
Held-for- trading –
Derivatives
Designated fair value
through profit or loss – Life
assurance policyholder
liabilities (investment
contracts) Total
Level 3 financial liabilitiesAt beginning of the year 1 1,021 1,022 Gains recognised in profit or loss – (129) (129)Purchases and issues – 6 6 Sales and settlements – (425) (425)Transfers in – 29 29 Transfers out – (8) (8)Foreign exchange and other (1) (14) (15)
Total Level 3 financial liabilities – 480 480
Gains relating to liabilities held at 31 December 2012 recognised in:– profit or loss – (98) (98)
The table below shows the movement in Level 3 liabilities measured at fair value:
(iii) Effect of changes in significant unobservable assumptions to reasonable possible alternativesFavourable and unfavourable changes are determined on the basis of changes in the value of the financial asset or liability as a result of varying the levels of the unobservable parameters using statistical techniques. When parameters are not amenable to statistical analysis, quantification of uncertainty is judgemental.
When the fair value of a financial asset or liability is affected by more than one unobservable assumption, the figures shown reflect the most favourable or most unfavourable change from varying the assumptions individually.
In respect of private equity investments which are included as investment securities, the valuations are assessed on an asset-by-asset basis using a valuation methodology appropriate to the specific investment, in line with industry guidelines. In many of the methodologies, the principal assumption is the valuation multiple to be applied to the main financial indicators including, for example, multiples for comparable listed companies and discounts for marketability.
For asset-backed securities whose prices are unobservable, models are used to generate the expected value of the asset, incorporating benchmark information on factors such as prepayment patterns, default rates, loss severities and the historical performance of the underlying assets. The models used are calibrated by using securities for which external market information is available.
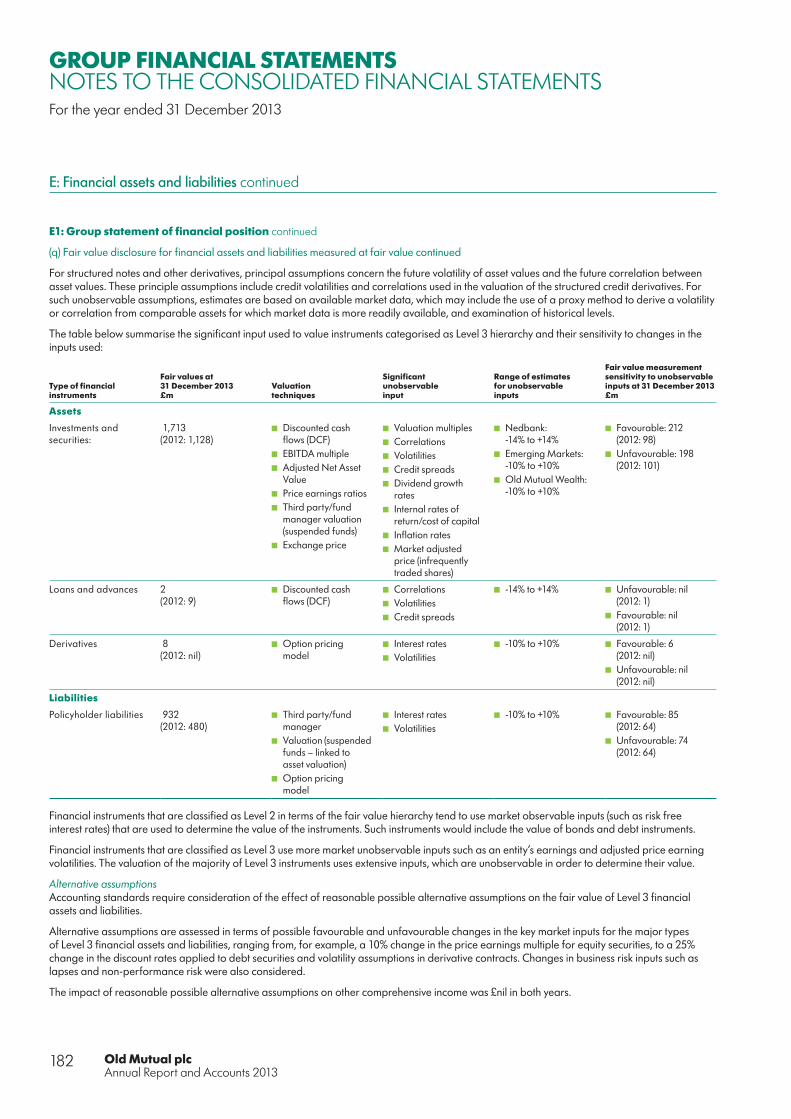
Old Mutual plcAnnual Report and Accounts 2013
182
GROUP FINANCIAL STATEMENTSNOTES TO THE CONSOLIDATED FINANCIAL STATEMENTSFor the year ended 31 December 2013
E: Financial assets and liabilities continued
E1: Group statement of financial position continued
(q) Fair value disclosure for financial assets and liabilities measured at fair value continued
For structured notes and other derivatives, principal assumptions concern the future volatility of asset values and the future correlation between asset values. These principle assumptions include credit volatilities and correlations used in the valuation of the structured credit derivatives. For such unobservable assumptions, estimates are based on available market data, which may include the use of a proxy method to derive a volatility or correlation from comparable assets for which market data is more readily available, and examination of historical levels.
The table below summarise the significant input used to value instruments categorised as Level 3 hierarchy and their sensitivity to changes in the inputs used:
Type of financial instruments
Fair values at 31 December 2013 £m
Valuation techniques
Significant unobservable input
Range of estimates for unobservable inputs
Fair value measurement sensitivity to unobservable inputs at 31 December 2013 £m
Assets
Investments and securities:
1,713 (2012: 1,128)
■ Discounted cash flows (DCF)
■ EBITDA multiple ■ Adjusted Net Asset
Value ■ Price earnings ratios ■ Third party/fund
manager valuation (suspended funds)
■ Exchange price
■ Valuation multiples ■ Correlations ■ Volatilities ■ Credit spreads ■ Dividend growth
rates ■ Internal rates of
return/cost of capital ■ Inflation rates ■ Market adjusted
price (infrequently traded shares)
■ Nedbank: -14% to +14%
■ Emerging Markets: -10% to +10%
■ Old Mutual Wealth: -10% to +10%
■ Favourable: 212 (2012: 98)
■ Unfavourable: 198 (2012: 101)
Loans and advances 2(2012: 9)
■ Discounted cash flows (DCF)
■ Correlations ■ Volatilities ■ Credit spreads
■ -14% to +14% ■ Unfavourable: nil (2012: 1)
■ Favourable: nil (2012: 1)
Derivatives 8 (2012: nil)
■ Option pricing model
■ Interest rates ■ Volatilities
■ -10% to +10% ■ Favourable: 6 (2012: nil)
■ Unfavourable: nil (2012: nil)
Liabilities
Policyholder liabilities 932 (2012: 480)
■ Third party/fund manager
■ Valuation (suspended funds – linked to asset valuation)
■ Option pricing model
■ Interest rates ■ Volatilities
■ -10% to +10% ■ Favourable: 85 (2012: 64)
■ Unfavourable: 74 (2012: 64)
Financial instruments that are classified as Level 2 in terms of the fair value hierarchy tend to use market observable inputs (such as risk free interest rates) that are used to determine the value of the instruments. Such instruments would include the value of bonds and debt instruments.
Financial instruments that are classified as Level 3 use more market unobservable inputs such as an entity’s earnings and adjusted price earning volatilities. The valuation of the majority of Level 3 instruments uses extensive inputs, which are unobservable in order to determine their value.
Alternative assumptionsAccounting standards require consideration of the effect of reasonable possible alternative assumptions on the fair value of Level 3 financial assets and liabilities.
Alternative assumptions are assessed in terms of possible favourable and unfavourable changes in the key market inputs for the major types of Level 3 financial assets and liabilities, ranging from, for example, a 10% change in the price earnings multiple for equity securities, to a 25% change in the discount rates applied to debt securities and volatility assumptions in derivative contracts. Changes in business risk inputs such as lapses and non-performance risk were also considered.
The impact of reasonable possible alternative assumptions on other comprehensive income was £nil in both years.

183
Financials
(iv) Financial instruments designated as fair value through profit or lossCertain items in the Group’s statement of financial position that would otherwise be categorised as loans and receivables under IAS 39 have been designated as fair value through profit or loss. Information relating to the change in fair value of these items as it relates to credit risk is shown in the table below:
£m
At 31 December 2013 At 31 December 2012
Change in fair value due to change in credit risk
Maximum exposure to
credit risk
Currentfinancial
year Cumulative
Maximum exposure to
credit risk
Currentfinancial
year Cumulative
Loans and advances 3,434 1 – 4,068 (2) (2)Investments and securities 6,547 7 (2) 7,404 3 (11)Other financial assets 19 8 – 24 – –
10,000 16 (2) 11,496 1 (13)
Certain items in the Group’s statement of financial position that would otherwise be categorised as financial liabilities at amortised cost under IAS 39 have been designated as fair value through profit or loss. Information relating to the change in fair value of these items as it relates to credit risk is shown in the table below:
£m
At 31 December 2013 At 31 December 2012
Change in fair value due to change in credit risk Fair value
Currentfinancial
year Cumulative
Contractualmaturityamount Fair value
Currentfinancial
year Cumulative
Contractualmaturityamount
Borrowed funds 747 32 87 709 956 57 (12) 887 Amounts owed to bank depositors 5,179 (1) (4) 5,177 5,728 2 (4) 5,718
5,926 31 83 5,886 6,684 59 (16) 6,605
The fair values of other categories of financial liabilities designated as fair value through profit or loss do not change significantly in respect of credit risk.
The change in fair value due to change in credit risk shown above is determined as the amount of the change in fair value of the instrument that is not attributable to changes in market conditions that give rise to market risk. For loans and receivables that have been designated as at fair value through profit or loss, individual credit spreads are determined at inception as the difference between the benchmark interest rate and the interest rate charged to the client. Subsequent changes in the benchmark interest rate and the credit spread give rise to changes in fair value of the financial instrument. Loans and advances are reviewed for observable changes in credit risk, and the credit spread is adjusted at subsequent dates if there has been an observable change in credit risk relating to a particular loan or advance. No credit derivatives are used to hedge the credit risk on any of the financial assets designated at fair value through profit or loss. The change in fair value due to credit risk of financial liabilities designated at fair value through profit or loss has been determined as the difference between fair values determined using a liability curve (adjusted for credit) and a risk-free liability curve. This difference is cross-checked to market-related data on credit spreads, where available.

Old Mutual plcAnnual Report and Accounts 2013
184
GROUP FINANCIAL STATEMENTSNOTES TO THE CONSOLIDATED FINANCIAL STATEMENTSFor the year ended 31 December 2013
E: Financial assets and liabilities continued
E1: Group statement of financial position continued
(r) Fair value hierarchy for assets and liabilities not measured at fair valueThe following table presents the fair value hierarchy for assets and liabilities, which are recognised at other than fair value, but for which fair value is provided.
Fair value is not the value ascribed to a financial asset or liability by management but is representative of what the market would be willing to pay for an asset or to settle or transfer the liability.
£m
At 31 December 2013Total carrying
amount Fair value Level 1 Level 2 Level 3
AssetsMandatory reserve deposits with central banks 759 759 759 – – Reinsurers’ share of policyholder liabilities 16 16 – – 16 Loans and advances 27,567 27,567 – – 27,567 Investments and securities 1,569 1,569 1,569 – – Trade, other receivables and other assets 1,447 1,447 – – 1,447 Cash and cash equivalents 4,869 4,869 4,869 – –
36,227 36,227 7,197 – 29,030
LiabilitiesBorrowed funds 1,882 1,903 1,901 2 – Trade, other payables and other liabilities 2,413 2,413 – – 2,413 Amounts owed to bank depositors 25,888 25,888 – – 25,888
30,183 30,204 1,901 2 28,301
£m
At 31 December 2012Total carrying
amount Fair value Level 1 Level 2 Level 3
Assets Mandatory reserve deposits with central banks 921 921 921 – – Reinsurers’ share of policyholder liabilities 21 21 – – 21 Loans and advances 32,266 32,266 – – 32,266 Investments and securities 2,238 2,238 2,238 – – Trade, other receivables and other assets 1,661 1,661 – – 1,661 Cash and cash equivalents 5,061 5,061 5,061 – –
42,168 42,168 8,220 – 33,948
Liabilities Borrowed funds 2,131 2,171 2,171 – – Trade, other payables and other liabilities 3,073 3,073 – – 3,073 Amounts owed to bank depositors 29,711 29,711 – – 29,711
34,915 34,955 2,171 – 32,784
The fair value of plant and equipment approximates the carrying value of £192 million (2012: £218 million) and is categorised as Level 3.
The fair value of investment in associated undertakings and joint ventures that is not categorised as designated at fair value through profit or loss approximates the carrying value of £103 million (2012: £91 million). Of this, £10 million (2012: £26 million) has been categorised as Level 2 and £93 million (2012: £65 million) as Level 3.
The fair value of life assurance policyholder liabilities that are not categorised as designated at fair value through profit or loss is equal to the carrying value of £17,954 million (2012: £21,096 million) and is categorised as Level 3.
(s) Non-recurring assets and liabilities at fair valueNon-recurring assets and liabilities recognised at fair value arise from assets and liabilities which have been acquired as a result of a business combination. The assets and liabilities are valued based on expected future cash flows which will be received from the assets or paid to settle the liability which have been discounted at an appropriate rate. The majority of assets and liabilities acquired in business combinations are classified as Level 3. Properties classified as held for sale are classified as Level 3. The total non-recurring assets and liabilities classified as Level 3 amounts to £86 million (2012: £48 million).
185
Financials
(t) Risks
Market risk(i) OverviewMarket risk is the risk of a financial impact arising from the changes in values of financial assets or financial liabilities from changes in equity, bond and property prices, interest rates and foreign exchange rates. Market risk arises differently across the Group’s businesses depending on the types of financial assets and liabilities held.
Each of the Group’s business units has an established set of policies, principles and governance processes to manage market risk within their individual businesses and in accordance with their local regulatory requirements. A monitoring process established at a Group level overlies these individual approaches to the management of market risk.
The impacts of changes in market risk are monitored and managed through the business units’ own regulatory processes, with reference to the Group’s economic capital processes, and by other means. The sensitivity of the Group’s earnings, capital position and embedded value is monitored through the Group’s embedded value and economical capital reporting processes.
(ii) Insurance operationsFor the Group’s insurance operations, equity, property, volatility and interest rate risk exposure are quantified in accordance with the Group’s risk-based capital practices, which require sufficient capital to be held in excess of the statutory minimum. Additional detail is provided in the Risk and Capital Management section.
In South Africa, the stock selection and investment analysis process is supported by a well-developed research function. For fixed annuities, market risks are managed where possible by investing in fixed interest securities with a duration closely corresponding to those liabilities. Market risk on policies that include specific guarantees and where shareholders carry the investment risk principally reside in the South African guaranteed non-profit annuity book, which is closely matched with gilts and semi-gilts. Other non-profit policies are also suitably matched based upon comprehensive investment guidelines. Market risk on with-profit policies with guarantees is managed through appropriate asset-liability matching, which includes hedging, as per the PPFM (Principles and Practices of Financial Management).
In Old Mutual Wealth’s unit-linked assurance operations, policyholders carry the full market risk, with the only risk to the Group being asset-based fee risk from charges on policyholder funds. In respect of Old Mutual Wealth’s shareholders’ funds, market risk is addressed in Old Mutual Wealth’s investment policy, which provides for very limited opportunity for entities to invest their shareholder capital in equities and other volatile assets.
Within Old Mutual Wealth’s Europe heritage business the Group has exposure to market risks arising from guarantees in the traditional life insurance business. Typically the policyholder is guaranteed a certain return regardless of the asset return achieved during the term of the policy. The Group’s exposure to these guarantees is small and the risks are closely monitored and mitigated by applying asset and liability management techniques, ensuring that the proceeds from sale of assets are sufficient to meet the obligations to policyholders.
For the variable annuity business in Old Mutual Bermuda, market risk to shareholders arises from offering policyholder guaranteed returns. In addition, these guarantees are US dollar denominated and a significant portion of the underlying assets invested in by Old Mutual Bermuda’s clients are exposed to currencies other than US dollar. The market and currency risk is dynamically managed, with the overall exposures to changes in markets monitored closely so that timely actions can be taken to re-establish hedging as required.
Sensitivities to adverse impacts of changes in market prices arising in the Group’s insurance operations are set out in the Old Mutual audited Market Consistent Embedded Value supplementary basis information section of the Annual Report and Accounts on pages 247 to 275.
(iii) Banking operationsThe principal market risks arising in the Group’s banking operations arise from:
■ Trading risk in Nedbank Capital and ■ Banking book interest rate risk from repricing and/or maturity mismatches between on- and off-balance sheet components in all banking businesses.
A comprehensive market risk framework is used to ensure that market risks are understood and managed. Governance structures are in place to achieve effective independent monitoring and management of market risk.

Old Mutual plcAnnual Report and Accounts 2013
186
GROUP FINANCIAL STATEMENTSNOTES TO THE CONSOLIDATED FINANCIAL STATEMENTSFor the year ended 31 December 2013
E: Financial assets and liabilities continued
E1: Group statement of financial position continued
(t) Risks continuedTrading riskMarket risk exposures from trading activities at Nedbank Capital are measured using Value-at-Risk (VaR), supplemented by sensitivity analysis and stress-scenario analysis, and limit structures are set accordingly.
The VaR risk measure for Nedbank estimates the potential loss in pre-tax profit over a given holding period for a specified confidence level. The VaR methodology is a statistically defined, probability-based approach that takes into account market volatilities as well as risk diversification by recognising offsetting positions and correlations between products and markets. Risks can be measured consistently across all markets and products, and risk measures can be aggregated to arrive at a single risk number. The one-day 99% VaR number used by Nedbank represents the overnight loss that has less than 1% chance of occurring under normal market conditions. By its nature, VaR is only a single measure and cannot be relied upon on its own as a means of measuring and managing risk.
£m
Average Minimum Maximum Year-end
At 31 December 2013 2012 2013 2012 2013 2012 2013 2012
Historical VaR (one-day, 99%) by risk typeForeign exchange 0.1 0.3 0.0 0.1 0.5 1.1 0.1 0.1 Interest rate 0.3 0.6 0.1 0.3 0.6 1.1 0.6 0.4 Equity product 0.1 0.3 0.0 0.1 0.3 0.9 0.1 0.2 Other 0.2 0.3 0.1 0.1 0.4 0.5 0.2 0.3 Diversification (0.3) (0.5) – – – – (0.3) (0.4)
Total VaR exposure 0.4 1.1 0.2 0.5 0.7 2.4 0.6 0.6
Banking book interest rate riskBanking book interest rate risk at Nedbank arises because:
■ The bank writes a large amount of prime-linked assets and raises fewer prime-linked deposits ■ Funding is prudently raised across the curve at fixed-term deposit rates that re-price only on maturity ■ Short-term demand-funding products re-price to different short-end base rates ■ Certain ambiguous maturity accounts are non-rate-sensitive ■ The bank has a mismatch in net non-rate-sensitive balances, including shareholders’ funds that do not re-price for interest rate changes.
Nedbank uses standard analytical techniques to measure interest rate sensitivity within its banking book. This includes static re-price gap analysis and a point-in-time interest income stress testing for parallel interest rate moves over a forward-looking 12-month period. At 31 December 2013 the sensitivity of the banking book to a 1% instantaneous reduction in interest rates would have led to a reduction in net interest income and equity of £54 million (2012: £59 million).
The table below shows the re-pricing profile of Nedbank’s banking book:£m
At 31 December 2013Up to 3 months
3 to 6 months
6 months to 1 year
1 to 5 years
Over 5 years
Trading and non-rate Total
Interest rate re-pricing gapTotal assets 29,940 1,099 450 2,632 1,065 7,825 43,011 Total liabilities and shareholders’ funds (26,479) (2,025) (1,602) (989) (224) (11,692) (43,011)Interest rate hedging activities (497) 1,572 1,035 (1,418) (692) – –
Repricing profile 2,964 646 (117) 225 149 (3,867) –Cumulative repricing profile 2,964 3,610 3,493 3,718 3,867 – –Expressed as a % of total assets 6.9% 8.4% 8.1% 8.6% 9.0% – –
£m
At 31 December 2012Up to 3 months
3 to 6 months
6 months to 1 year
1 to 5 years
Over 5 years
Trading and non-rate Total
Interest rate re-pricing gapTotal assets 33,489 1,156 1,316 3,358 1,366 8,914 49,599 Total liabilities and shareholders’ funds (30,353) (1,971) (1,643) (1,275) (177) (14,180) (49,599) Interest rate hedging activities 425 1,593 959 (2,057) (920) – –
Repricing profile 3,561 778 632 26 269 (5,266) –Cumulative repricing profile 3,561 4,339 4,971 4,997 5,266 – –Expressed as a % of total assets 7.2% 8.7% 10.0% 10.1% 10.6% – –
The analysis indicates that the maturity profile of financial assets is broadly matched to the financial liabilities due to derivative hedging activities. This means that in the event of increasing interest rates, net interest income will remain stable in the short-term.

187
Financials
(u) Currency translation riskThe Group is exposed, from an earnings and capital management perspective, to movements in exchange rates from reducing the sterling value of assets and earnings denominated in foreign currencies. The functional currencies of the Group’s principal overseas operations are South African rand, US dollar and euro. The Group reduces this risk through the use of currency swaps, currency borrowings and forward foreign exchange contracts. Suck risk mitigation techniques are reflected in the currency analysis that follows.
The tables below show the Group’s statement of financial position by major currency:
£m
At 31 December 2013 ZAR POUNDS USD EUR SEK Other Total
AssetsMandatory reserve deposits with central banks 747 – 1 – – 11 759 Reinsurers’ share of policyholder liabilities 160 1,680 1 5 – 29 1,875 Loans and advances 30,312 369 1,716 284 16 689 33,386 Investments and securities 29,548 34,462 10,708 9,908 1,460 2,331 88,417 Trade, other receivables and other assets 1,425 424 507 146 13 68 2,583 Derivative financial instruments – assets 1,126 75 45 4 3 6 1,259 Cash and cash equivalents 2,511 1,271 408 412 5 262 4,869
Total financial assets 65,829 38,281 13,386 10,759 1,497 3,396 133,148 Total non-financial assets 2,570 2,140 1,361 753 – 359 7,183
Total assets 68,399 40,421 14,747 11,512 1,497 3,755 140,331
LiabilitiesLife assurance policyholder liabilities 27,211 34,253 6,022 9,639 1,459 2,557 81,141 Third-party interest in consolidation of funds 3,154 2,274 25 25 – – 5,478 Borrowed funds 1,985 642 2 – – – 2,629 Trade, other payables and other liabilities 2,720 803 342 131 12 266 4,274 Amounts owed to bank depositors 31,218 611 1,535 249 3 754 34,370 Derivative financial instruments – liabilities 1,301 22 149 – 3 3 1,478
Total financial liabilities 67,589 38,605 8,075 10,044 1,477 3,580 129,370 Total non-financial liabilities 777 592 55 354 – 146 1,924
Total liabilities 68,366 39,197 8,130 10,398 1,477 3,726 131,294
£m
At 31 December 2012 ZAR POUNDS USD EUR SEK Other Total
AssetsMandatory reserve deposits with central banks 906 – 2 – – 13 921 Reinsurers’ share of policyholder liabilities 147 1,229 – 3 – 27 1,406 Loans and advances 35,572 365 1,495 298 24 741 38,495 Investments and securities 33,115 31,937 10,748 8,707 1,426 2,580 88,513 Trade, other receivables and other assets 1,728 324 742 131 13 68 3,006 Derivative financial instruments – assets 1,609 107 49 6 – 9 1,780 Cash and cash equivalents 2,840 1,224 499 258 1 239 5,061
Total financial assets 75,917 35,186 13,535 9,403 1,464 3,677 139,182 Total non-financial assets 3,018 2,283 1,336 799 1 343 7,780
Total assets 78,935 37,469 14,871 10,202 1,465 4,020 146,962
LiabilitiesLife assurance policyholder liabilities 30,506 30,761 6,486 8,504 1,410 2,521 80,188 Third-party interest in consolidation of funds 3,549 2,505 11 51 – – 6,116 Borrowed funds 2,381 659 10 – – – 3,050 Trade, other payables and other liabilities 3,368 615 476 158 12 311 4,940 Amounts owed to bank depositors 36,704 534 1,136 280 8 837 39,499 Derivative financial instruments – liabilities 1,367 7 27 – – 1 1,402
Total financial liabilities 77,875 35,081 8,146 8,993 1,430 3,670 135,195 Total non-financial liabilities 856 610 40 348 – 140 1,994
Total liabilities 78,731 35,691 8,186 9,341 1,430 3,810 137,189
The exposure to currency risk on policyholder funds is included under market risk as discussed above.
The derivative instruments are stated at their fair value and not their notional amounts. Therefore, this table does not necessarily reflect the results of risk management activities undertaken by the Group.
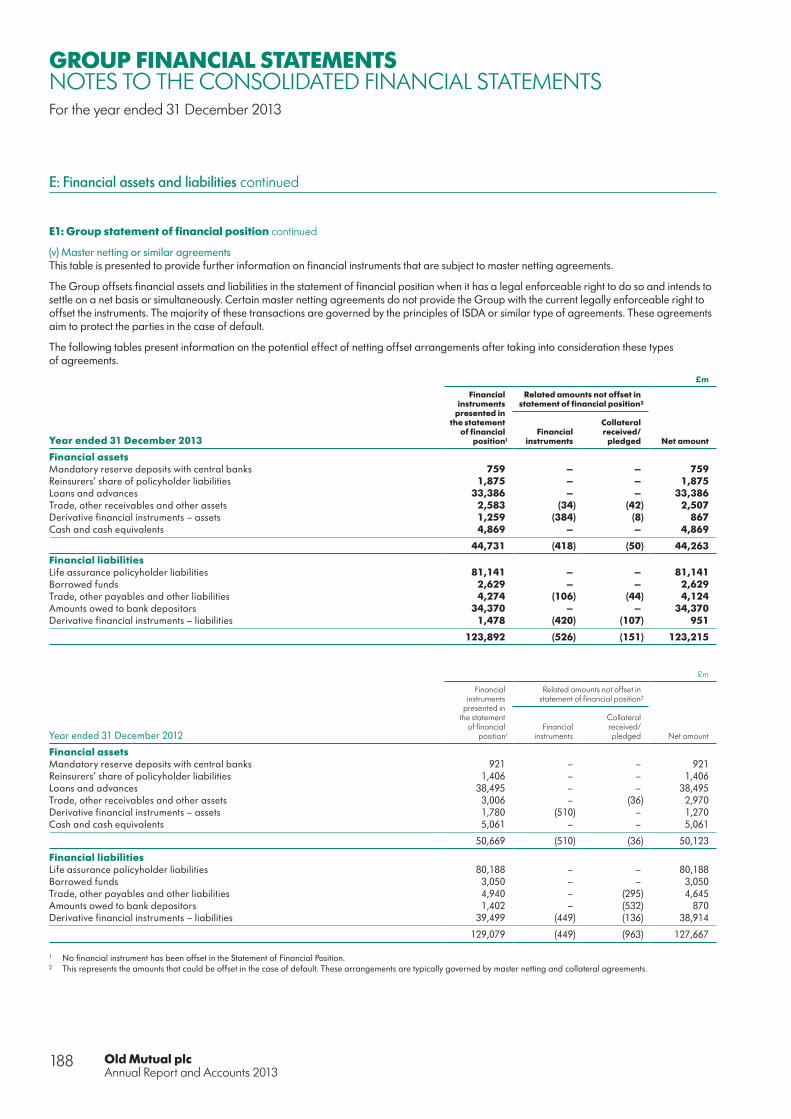
Old Mutual plcAnnual Report and Accounts 2013
188
GROUP FINANCIAL STATEMENTSNOTES TO THE CONSOLIDATED FINANCIAL STATEMENTSFor the year ended 31 December 2013
E: Financial assets and liabilities continued
E1: Group statement of financial position continued
(v) Master netting or similar agreementsThis table is presented to provide further information on financial instruments that are subject to master netting agreements.
The Group offsets financial assets and liabilities in the statement of financial position when it has a legal enforceable right to do so and intends to settle on a net basis or simultaneously. Certain master netting agreements do not provide the Group with the current legally enforceable right to offset the instruments. The majority of these transactions are governed by the principles of ISDA or similar type of agreements. These agreements aim to protect the parties in the case of default.
The following tables present information on the potential effect of netting offset arrangements after taking into consideration these types of agreements.
£m
Financial instruments
presented in the statement
of financial position1
Related amounts not offset in statement of financial position2
Net amountYear ended 31 December 2013Financial
instruments
Collateral received/
pledged
Financial assetsMandatory reserve deposits with central banks 759 – – 759 Reinsurers’ share of policyholder liabilities 1,875 – – 1,875 Loans and advances 33,386 – – 33,386 Trade, other receivables and other assets 2,583 (34) (42) 2,507 Derivative financial instruments – assets 1,259 (384) (8) 867 Cash and cash equivalents 4,869 – – 4,869
44,731 (418) (50) 44,263 Financial liabilitiesLife assurance policyholder liabilities 81,141 – – 81,141 Borrowed funds 2,629 – – 2,629 Trade, other payables and other liabilities 4,274 (106) (44) 4,124 Amounts owed to bank depositors 34,370 – – 34,370 Derivative financial instruments – liabilities 1,478 (420) (107) 951
123,892 (526) (151) 123,215
£m
Financial instruments
presented in the statement
of financial position1
Related amounts not offset instatement of financial position2
Year ended 31 December 2012Financial
instruments
Collateral received/pledged Net amount
Financial assetsMandatory reserve deposits with central banks 921 – – 921 Reinsurers’ share of policyholder liabilities 1,406 – – 1,406 Loans and advances 38,495 – – 38,495 Trade, other receivables and other assets 3,006 – (36) 2,970 Derivative financial instruments – assets 1,780 (510) – 1,270 Cash and cash equivalents 5,061 – – 5,061
50,669 (510) (36) 50,123
Financial liabilitiesLife assurance policyholder liabilities 80,188 – – 80,188 Borrowed funds 3,050 – – 3,050 Trade, other payables and other liabilities 4,940 – (295) 4,645 Amounts owed to bank depositors 1,402 – (532) 870 Derivative financial instruments – liabilities 39,499 (449) (136) 38,914
129,079 (449) (963) 127,667
1 No financial instrument has been offset in the Statement of Financial Position. 2 This represents the amounts that could be offset in the case of default. These arrangements are typically governed by master netting and collateral agreements.

189
Financials
(w) Capital managementThe Group actively manages its capital with a focus on capital efficiency and effective risk management. The capital objectives are to maintain the Group’s ability to continue as a going concern while supporting the optimisation of return relative to the risks. The Group ensures that it can meet its expected capital and financing needs at all times having regard to the Group’s business plans, forecasts and strategic initiatives. The Group’s overall capital risk appetite is set with reference to the requirements of the relevant stakeholders and seeks to:
■ Maintain sufficient, but not excessive, financial strength to support stakeholder requirements ■ Optimise debt to equity structure to enhance shareholder returns ■ Retain financial flexibility by maintaining liquidity including unutilised committed credit lines.
The primary sources of capital used by the Group are equity shareholders’ funds, preference shares, subordinated debt and borrowings. Alternative resources are utilised where appropriate. Targets are established in relation to regulatory solvency, ratings, liquidity and dividend capacity and are a key tool in managing capital in accordance with our risk appetite and the requirements of our various stakeholders.
The individual companies in the Group are subject to regulatory capital requirements at an individual level. In addition the Group as a whole is subject to the solvency requirements of the Financial Groups Directive (FGD) as implemented by the Prudential Regulation Authority (PRA). Further detail as to the Group’s regulatory capital surplus and that of subsidiaries is provided in the Annual Report and Accounts. As at the date of issue of these financial statements the unaudited proforma surplus was estimated to be £2.1 billion (2012: £2.0 billion). The FGD position will be submitted to the PRA by 30 April 2014.
It is critical that the Group’s capital management policies are aligned with the Group’s overall strategy, business plans and risk appetite. The Group’s Capital Management Committee (GCMC) reviews the capital structure regularly. Further detail on the Capital Management of the Group is included in the Risk and Capital Management section of the Annual Report and Accounts.
E2: Credit risk
Overall exposure to credit riskThe Group is exposed to banking credit risk from lending and other financing activities, through its exposure to Nedbank. Nedbank’s lending portfolio forms a substantial part of the Group’s loans and advances, as analysed in Note E3. Credit risk represents the most significant risk type facing Nedbank, accounting for 60% of its economic capital requirements. Nedbank’s credit risk profile is managed in terms of its credit risk management framework, which encompasses comprehensive credit risk policy, mandate (limits) and governance structures, and is approved by the Nedbank Board.
The Group has adopted a policy of only dealing with creditworthy counterparties and obtaining sufficient collateral where appropriate, as a means of mitigating the financial loss from defaults. The Group’s exposure and the credit rating of its counterparties are continuously monitored and the aggregate value of transactions concluded is spread amongst approved counterparties.
The Group does not have significant credit exposure to any single counterparty or any group of counterparties having similar characteristics. The credit risk on liquid funds, derivative financial instruments and portfolios of debt and similar securities is limited because the counterparties are banks with high credit ratings assigned by international credit rating agencies and limits are placed on exposures to below investment-grade holdings.
The Group is also exposed to the risk of credit defaults and movements in credit spreads from our insurance businesses. This includes counterparty default risk, which arises mainly from lending activities, and reinsurance and hedging arrangements.
Other than the above, the Group has other limited credit risk exposures in respect of amounts due from policyholders, intermediaries and reinsurers. Credit risk exposure from our property and casualty business is small and none of the life assurance operations cedes significant risk through reinsurance. Loans to policyholders are secured on the surrender value of the relevant policies.

Old Mutual plcAnnual Report and Accounts 2013
190
GROUP FINANCIAL STATEMENTSNOTES TO THE CONSOLIDATED FINANCIAL STATEMENTSFor the year ended 31 December 2013
E: Financial assets and liabilities continued
E2: Credit risk continued
The table below represents the Group’s maximum exposure to credit risk, without taking into account the value of any collateral obtained. The total credit exposure also includes potential exposure arising from financial guarantees given by the Group and undrawn loan commitments, which are not yet reflected in the Group’s statement of financial position.
£m
At 31 December
2013
At 31 December
2012Restated1
Mandatory reserve deposits with central banks 759 921 Reinsurers’ share of policyholder liabilities 1,875 1,406 Loans and advances 33,386 38,495 Investments and securities 18,539 20,444
Government and government-guaranteed securities 6,235 6,723 Other debt securities, preference shares and debentures 9,217 10,713 Short-term funds and securities treated as investments 2,565 2,892 Other 522 116
Other assets 2,248 2,581 Derivative financial instruments – assets 1,259 1,780 Cash and cash equivalents 4,869 5,061 Financial guarantees and other credit-related contingent liabilities 2,576 3,255 Loan commitments and other credit-related commitments 5,128 5,532 Non-current assets held for sale 5 42
70,644 79,517
1 The prior year has been restated for the impact of changes in accounting policies. Refer to note J1 for further details.
(i) Financial collateral The Group takes financial collateral to support exposures in its banking and securities and lending activities. Collateral held includes cash and debt securities. Cash collateral is included as part of cash equivalents.
These transactions are entered into under terms and conditions that are standard industry practice to securities borrowing and lending activities.
(ii) Non-financial collateral The Group takes other physical collateral to recover outstanding lending exposures in the event of the borrower being unable or unwilling to fulfil its obligations. This includes mortgage over property (both residential and commercial), and liens over business assets (including, but not limited to plant, vehicles, aircraft, inventories and trade debtors) and guarantees from parties other than the borrower.
Should a counterparty be unable to settle its obligations, the Group takes possession of collateral as full or part settlement of such amounts. In general, the Group seeks to dispose of such property and other assets that are not readily convertible into cash as soon as the market for the relevant asset permits.
A further analysis of credit risk is provided in notes E3, E4, E5 and F4.

191
Financials
E3: Loans and advances
(a) Summary
£m
At 31 December
2013
At 31 December
2012
Home loans 7,813 9,899 Commercial mortgages 6,102 7,098 Properties in possession 44 42 Credit cards 656 727 Overdrafts 863 994 Policyholder loans 241 249 Other loans to clients 4,989 4,945 Preference shares and debentures 1,089 1,231 Net finance leases and instalment debtors 4,879 5,503
Gross investment 6,095 5,761 Unearned finance charges (1,216) (258)
Factoring accounts 275 324 Trade, other bills and bankers’ acceptances 2 2 Term loans 5,596 6,417 Remittances in transit 14 14 Deposits placed under reverse purchase agreements 1,480 1,840
Gross loans and advances 34,043 39,285 Provisions for impairment
Specific provisions (428) (541)Portfolio provision (229) (249)
Total net loans and advances 33,386 38,495
Non-performing loans included above had a book value less impairment provisions of £573 million (2012: £859 million).
Of the loans and advances shown above, £10,845 million (2012: £13,038 million) is receivable within one year of the reporting date and is regarded as current. £22,541 million (2012: £25,457 million) is regarded as non-current, based on the maturity profile of the assets.
Of the gross loans and advances shown above, £33,802 million (2012: £38,963 million) relates to balances held by the Group’s banking operations.
The table below gives an age analysis of loans and advances representing primarily the exposures of the Group’s banking operations:
£m
At 31 December
2013
At 31 December
20121
Neither past due nor impaired 31,935 36,762 Past due but not impaired 1,106 1,123
Past due but less than 1 month 595 647 Past due, greater than 1 month but less than 3 months 502 442 Past due, greater than 3 months but less than 6 months 7 7 Past due more than 1 year 2 27
Impaired loans and advances individually impaired 1,002 1,400
Gross loans and advances 34,043 39,285 Provisions for impairment (657) (790)
Total net loans and advances 33,386 38,495
1 The prior year has been restated to align with the Group’s risk management policies and to better align with industry practice.

Old Mutual plcAnnual Report and Accounts 2013
192
GROUP FINANCIAL STATEMENTSNOTES TO THE CONSOLIDATED FINANCIAL STATEMENTSFor the year ended 31 December 2013
E: Financial assets and liabilities continued
E3: Loans and advances continued
(a) Summary continued
The neither past due nor impaired loans and advances can be further analysed by credit rating as follows:£m
At 31 December 2013 At 31 December 20121
Investment grade
Sub-investment
grade Not rated TotalInvestment
grade
Sub- investment
grade Not rated Total
Home loans 1,034 5,570 404 7,008 1,408 6,745 395 8,548 Commercial mortgages 2,095 3,609 179 5,883 2,595 4,362 86 7,043 Credit cards 76 483 1 560 25 597 – 622 Overdrafts 219 474 61 754 168 625 102 895 Policyholder loans 195 – 27 222 173 – 48 221 Other loans to clients 3,267 1,542 150 4,959 3,299 1,565 98 4,962 Preference shares and debentures 908 169 12 1,089 1,020 185 26 1,231 Net finance leases and instalment debtors 285 4,070 100 4,455 269 4,685 133 5,087 Factoring accounts 16 242 – 258 11 306 – 317 Trade, other bills and bankers’
acceptances 2 – 1 3 – 1 1 2 Term loans 3,451 1,757 43 5,251 4,043 1,886 51 5,980 Remittances in transit – – 13 13 7 2 5 14 Deposits placed under reverse purchase
agreements 1,231 249 – 1,480 1,831 9 – 1,840
Gross loans and advances 12,779 18,165 991 31,935 14,849 20,968 945 36,762
1 The prior year has been restated to align with the Group’s risk management policies and to better align with industry practice.
The rating scale of the loans and advances is based on local equivalent rating scales and not international scales.
Collateral is held as security against certain loans and advances detailed above, with this principally consisting of cash, properties and letters of credit.
Movements in provisions for impairment of loans and advances are analysed as follows:£m
At 31 December 2013 At 31 December 2012
Specific impairment
Portfolio impairment
Total impairment
Specific impairment
Portfolio impairment
Total impairment
Balance at beginning of the year 541 249 790 696 219 915 Profit or loss charge 391 36 427 414 52 466 Recoveries of amounts previously written off (59) – (59) (66) – (66)Amounts written off against the provision (373) (33) (406) (514) – (514)Foreign exchange and other movements (72) (23) (95) 11 (22) (11)
Balance at end of the year 428 229 657 541 249 790
The majority of loans and advances are in respect of Nedbank. Loans and advances increased 9.9%, in local currency terms, with good momentum from wholesale banking and growth of 2.5% from Retail in a tough consumer environment. Nedbank impairments increased by 7.0% whilst the credit loss ratio at 1.06% was similar to 2012 (1.05%). Further detail on Nedbank is available at www.nedbankgroup.co.za.
During the year under review, the Group recognised collateral of £44 million (2012: £42 million) in the statement of financial position. These amounts are being included in the loans and advances above as properties in possession.
(b) Finance lease and instalment debtors£m
Minimum lease payments receivable
Present value of minimum lease payments receivable
Amounts receivable under finance leases – At 31 December 2013 2012 2013 2012
Within one year 1,616 766 1,294 665 In the second to fifth years inclusive 4,213 3,632 3,373 3,476 After five years 266 1,363 212 1,362
6,095 5,761 4,879 5,503 Less: unearned finance income (1,216) (258) – –
Present value of minimum lease payments receivable 4,879 5,503 4,879 5,503
The accumulated allowance for uncollectable minimum lease payments receivable is £116 million (2012: £158 million).
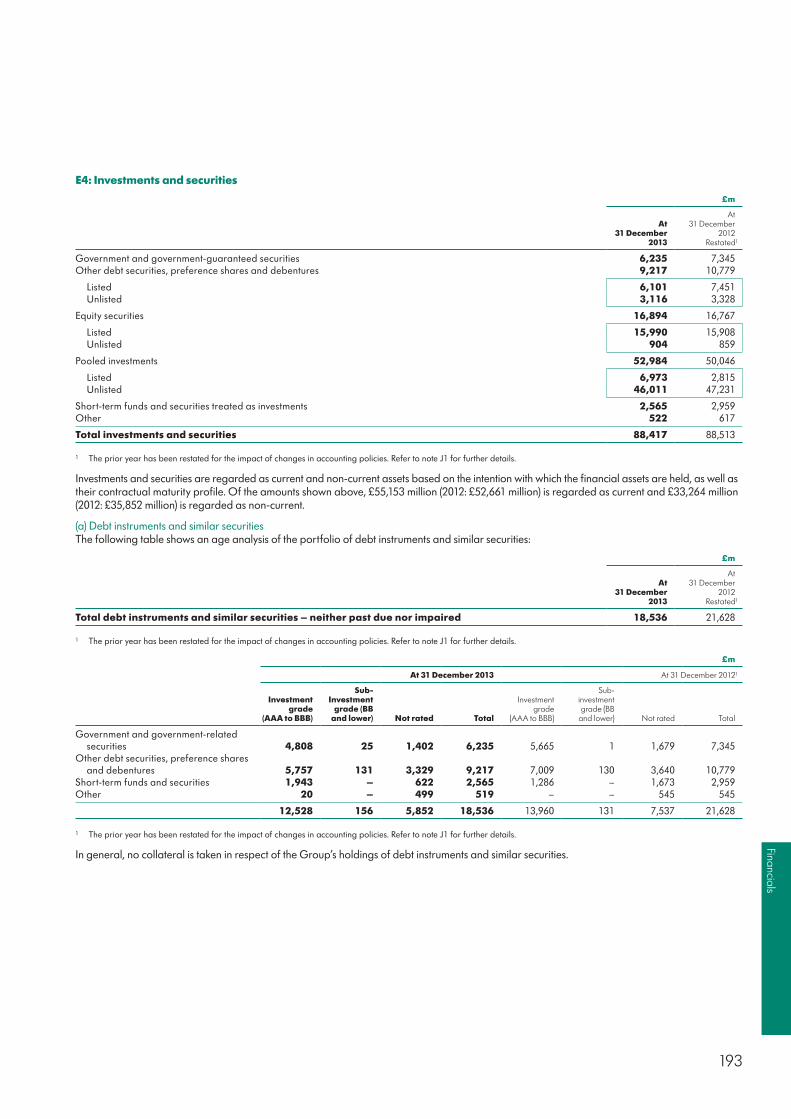
193
Financials
E4: Investments and securities
£m
At 31 December
2013
At 31 December
2012Restated1
Government and government-guaranteed securities 6,235 7,345 Other debt securities, preference shares and debentures 9,217 10,779
Listed 6,101 7,451 Unlisted 3,116 3,328
Equity securities 16,894 16,767
Listed 15,990 15,908 Unlisted 904 859
Pooled investments 52,984 50,046
Listed 6,973 2,815 Unlisted 46,011 47,231
Short-term funds and securities treated as investments 2,565 2,959 Other 522 617
Total investments and securities 88,417 88,513
1 The prior year has been restated for the impact of changes in accounting policies. Refer to note J1 for further details.
Investments and securities are regarded as current and non-current assets based on the intention with which the financial assets are held, as well as their contractual maturity profile. Of the amounts shown above, £55,153 million (2012: £52,661 million) is regarded as current and £33,264 million (2012: £35,852 million) is regarded as non-current.
(a) Debt instruments and similar securitiesThe following table shows an age analysis of the portfolio of debt instruments and similar securities:
£m
At 31 December
2013
At 31 December
2012Restated1
Total debt instruments and similar securities – neither past due nor impaired 18,536 21,628
1 The prior year has been restated for the impact of changes in accounting policies. Refer to note J1 for further details.
£m
At 31 December 2013 At 31 December 20121
Investment grade
(AAA to BBB)
Sub-Investment
grade (BB and lower) Not rated Total
Investment grade
(AAA to BBB)
Sub-investment grade (BB
and lower) Not rated Total
Government and government-related securities 4,808 25 1,402 6,235 5,665 1 1,679 7,345
Other debt securities, preference shares and debentures 5,757 131 3,329 9,217 7,009 130 3,640 10,779
Short-term funds and securities 1,943 – 622 2,565 1,286 – 1,673 2,959 Other 20 – 499 519 – – 545 545
12,528 156 5,852 18,536 13,960 131 7,537 21,628
1 The prior year has been restated for the impact of changes in accounting policies. Refer to note J1 for further details.
In general, no collateral is taken in respect of the Group’s holdings of debt instruments and similar securities.

Old Mutual plcAnnual Report and Accounts 2013
194
GROUP FINANCIAL STATEMENTSNOTES TO THE CONSOLIDATED FINANCIAL STATEMENTSFor the year ended 31 December 2013
E: Financial assets and liabilities continued
E5: Securities lending
The Group participates in securities lending where securities holdings are lent to third parties. The loaned securities are not derecognised from the Group’s consolidated statement of financial position but are retained within the relevant investment classification. Collateral is held in respect of the loaned securities.
The table below represents the amounts lent and the related collateral received:
£m
At 31 December
2013
At 31 December
2012
Amounts lent under securities lendingEquity 452 460 Debt securities 155 433
607 893
Amounts received as collateral for securities lendingCash 630 883 Debt securities 17 85
647 968
The cash collateral has been recognised in the statement of financial position with a corresponding liability to return the collateral included in other liabilities. Of the collateral included in the table above, £647 million (2012: £968 million) can be sold or repledged and £nil (2012: £nil) has been sold or repledged.
At 31 December 2013, the Group has provided £203 million (2012: £150 million) in debt securities collateral under repurchase arrangements.
At 31 December 2013 and 31 December 2012, the Group has not provided any cash collateral for security lending arrangements.
E6: Derivative financial instruments – assets and liabilities
The Group utilises derivative instruments for both hedging and non-hedging purposes. The derivative instruments become in-the-money or out-of-the-money as a result of fluctuations in market interest rates, foreign exchange rates or asset prices relative to their terms. The aggregate contractual or notional amount of derivative financial instruments on hand, the extent to which instruments are in-the-money or out-of-the-money and, therefore, the aggregate fair values of derivative financial assets and liabilities can fluctuate significantly from time to time.
The Group undertakes transactions involving derivative financial instruments with other financial institutions. Management has established limits commensurate with the credit quality of the institutions with whom it deals and manages the resulting exposures such that a default by any individual counterparty is unlikely to have a materially adverse impact on the Group.
The following tables provide a detailed breakdown of the Group’s derivative financial instruments outstanding at year-end. These instruments allow the Group and its customers to transfer, modify or reduce their credit, equity market, foreign exchange and interest rate risks.
£m
Derivative financial instruments
Assets Liabilities
At 31 December 2013 2012 2013 2012
Equity derivatives 46 54 41 41 Exchange rate contracts 286 248 287 93 Interest rate contracts 810 1,414 1,050 1,217 Credit derivatives 68 13 63 11 Other derivatives 49 51 37 40
Total 1,259 1,780 1,478 1,402
The undiscounted contractual maturities of the cash flows of the derivative liabilities held are as follows:
£m
Derivative financial liabilitiesCarrying
amountLess than 3 months
More than 3 months less than 1 year
Between 1 and
5 years
More than
5 years
No contractual
maturity date Total
At 31 December 2013 1,478 5 165 403 1,757 – 2,330
At 31 December 2012 1,402 74 296 607 522 – 1,499
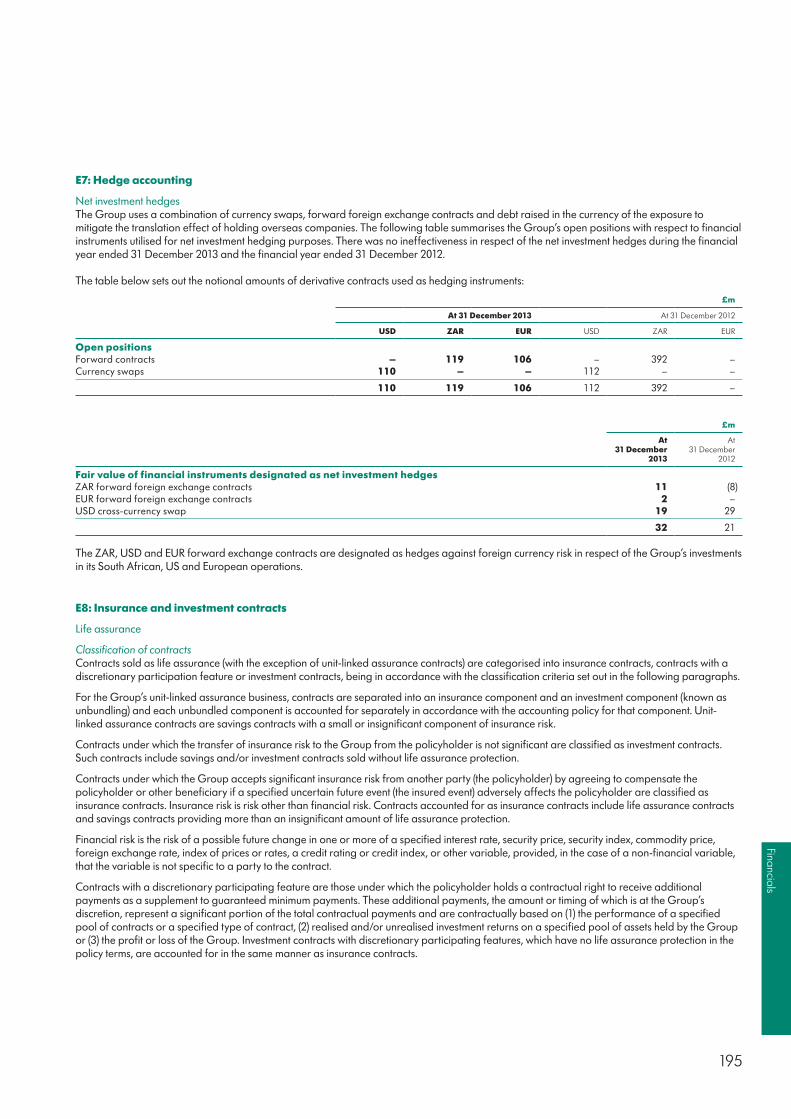
195
Financials
E7: Hedge accounting
Net investment hedgesThe Group uses a combination of currency swaps, forward foreign exchange contracts and debt raised in the currency of the exposure to mitigate the translation effect of holding overseas companies. The following table summarises the Group’s open positions with respect to financial instruments utilised for net investment hedging purposes. There was no ineffectiveness in respect of the net investment hedges during the financial year ended 31 December 2013 and the financial year ended 31 December 2012.
The table below sets out the notional amounts of derivative contracts used as hedging instruments:
£m
At 31 December 2013 At 31 December 2012
USD ZAR EUR USD ZAR EUR
Open positionsForward contracts – 119 106 – 392 –Currency swaps 110 – – 112 – –
110 119 106 112 392 –
£m
At 31 December
2013
At 31 December
2012
Fair value of financial instruments designated as net investment hedgesZAR forward foreign exchange contracts 11 (8)EUR forward foreign exchange contracts 2 –USD cross-currency swap 19 29
32 21
The ZAR, USD and EUR forward exchange contracts are designated as hedges against foreign currency risk in respect of the Group’s investments in its South African, US and European operations.
E8: Insurance and investment contracts
Life assurance
Classification of contractsContracts sold as life assurance (with the exception of unit-linked assurance contracts) are categorised into insurance contracts, contracts with a discretionary participation feature or investment contracts, being in accordance with the classification criteria set out in the following paragraphs.
For the Group’s unit-linked assurance business, contracts are separated into an insurance component and an investment component (known as unbundling) and each unbundled component is accounted for separately in accordance with the accounting policy for that component. Unit-linked assurance contracts are savings contracts with a small or insignificant component of insurance risk.
Contracts under which the transfer of insurance risk to the Group from the policyholder is not significant are classified as investment contracts. Such contracts include savings and/or investment contracts sold without life assurance protection.
Contracts under which the Group accepts significant insurance risk from another party (the policyholder) by agreeing to compensate the policyholder or other beneficiary if a specified uncertain future event (the insured event) adversely affects the policyholder are classified as insurance contracts. Insurance risk is risk other than financial risk. Contracts accounted for as insurance contracts include life assurance contracts and savings contracts providing more than an insignificant amount of life assurance protection.
Financial risk is the risk of a possible future change in one or more of a specified interest rate, security price, security index, commodity price, foreign exchange rate, index of prices or rates, a credit rating or credit index, or other variable, provided, in the case of a non-financial variable, that the variable is not specific to a party to the contract.
Contracts with a discretionary participating feature are those under which the policyholder holds a contractual right to receive additional payments as a supplement to guaranteed minimum payments. These additional payments, the amount or timing of which is at the Group’s discretion, represent a significant portion of the total contractual payments and are contractually based on (1) the performance of a specified pool of contracts or a specified type of contract, (2) realised and/or unrealised investment returns on a specified pool of assets held by the Group or (3) the profit or loss of the Group. Investment contracts with discretionary participating features, which have no life assurance protection in the policy terms, are accounted for in the same manner as insurance contracts.
Old Mutual plcAnnual Report and Accounts 2013
196
GROUP FINANCIAL STATEMENTSNOTES TO THE CONSOLIDATED FINANCIAL STATEMENTSFor the year ended 31 December 2013
E: Financial assets and liabilities continued
E8: Insurance and investment contracts continued
Life assurance continued
Premiums on life assurance Premiums and annuity considerations receivable under insurance contracts and investment contracts with a discretionary participating feature are stated gross of commission and exclude taxes and levies. Premiums in respect of linked insurance contracts are recognised when the liability is established. Premiums in respect of other insurance contracts and investment contracts with a discretionary participating feature are recognised when due for payment.
Outward reinsurance premiums are recognised when due for payment.
Amounts received under investment contracts other than those with a discretionary participating feature and unit-linked assurance contracts are recorded as deposits and credited directly to investment contract liabilities.
Revenue on investment management service contractsFees charged for investment management services provided in conjunction with an investment contract are recognised as revenue as the services are provided. Initial fees, which exceed the level of recurring fees and relate to the future provision of services are deferred and amortised over the anticipated period in which services will be provided. Fees charged for investment management service contracts by asset management businesses are also recognised on this basis.
Claims paid on life assuranceClaims paid under insurance contracts and investment contracts with a discretionary participating feature include maturities, annuities, surrenders, death and disability payments.
Maturity and annuity claims are recorded as they fall due for payment. Death and disability claims and surrenders are accounted for when notified.
Reinsurance recoveries are accounted for in the same period as the related claim.
Amounts paid under investment contracts other than those with a discretionary participating feature and unit-linked assurance contracts are recorded as deductions from investment contract liabilities. Insurance contract provisionsInsurance contract provisions for African businesses have been computed using a gross premium valuation method. Provisions in respect of African business have been made in accordance with the Financial Soundness Valuation basis as set out in the guidelines issued by the Actuarial Society of South Africa in Standard of Actuarial Practice (SAP) 104 (2012). Under this guideline, provisions are valued using realistic expectations of future experience, with margins for prudence and deferral of profit emergence.
Provisions for investment contracts with a discretionary participating feature are also computed using the gross premium valuation method in accordance with the Financial Soundness Valuation basis. Surplus allocated to policyholders but not yet distributed related to these contracts is included as part of life assurance policyholder liabilities.
Reserves on immediate annuities and guaranteed payments are computed on the prospective deposit method, which produces reserves equal to the present value of future benefit payments.
For other territories, the valuation bases adopted are in accordance with local actuarial practices and methodologies.
Derivatives embedded in an insurance contract are not separated and measured at fair value if the embedded derivative itself qualifies for recognition as an insurance contract. In this case the entire contract is measured as described above.
The Group performs liability adequacy testing at a business unit level on its insurance liabilities to ensure that the carrying amount of its liabilities (less related deferred acquisition costs and intangible assets) is sufficient in view of estimated future cash flows. When performing the liability adequacy test, the Group discounts all contractual cash flows and compares this amount to the carrying value of the liability at discount rates appropriate to the business in question. Where a shortfall is identified, an additional provision is made.
The provision estimation techniques and assumptions are periodically reviewed, with any changes in estimates reflected in profit or loss as they occur.
Whilst the directors consider that the gross insurance contract provisions and the related reinsurance recoveries are fairly stated on the basis of the information currently available to them, the ultimate liability will vary as a result of subsequent information and events and may result in significant adjustments to the amount provided.
In respect of the South Africa life assurance, shadow accounting is applied to insurance contract provisions where the underlying measurement of the policyholder liability depends directly on the value of owner-occupied property and the unrealised gains and losses on such property, which are recognised in other comprehensive income. The shadow accounting adjustment to insurance contract provisions is recognised in other comprehensive income to the extent that the unrealised gains or losses on owner-occupied property backing insurance contract provisions are also recognised directly in other comprehensive income.
Financial guarantee contracts are recognised as insurance contracts. Liability adequacy testing is performed to ensure that the carrying amount

197
Financials
of the liability for financial guarantee contracts is sufficient.
Investment contract liabilitiesInvestment contract liabilities in respect of the Group’s non-linked business are recorded at amortised cost unless they are designated at fair value through profit or loss in order to eliminate or significantly reduce a measurement or recognition inconsistency, for example where the corresponding assets are recorded at fair value through profit or loss.
Investment contract liabilities in respect of the Group’s linked business are recorded at fair value. For such liabilities, including the deposit component of unbundled unit-linked assurance contracts, fair value is calculated as the account balance, which is the value of the units allocated to the policyholder, based on the bid price of the assets in the underlying fund (adjusted for tax).
Investment contract liabilities measured at fair value are subject to a ‘deposit floor’ such that the liability established cannot be less than the amount repayable on demand.
Acquisition costsAcquisition costs for insurance contracts comprise all direct and indirect costs arising from the sale of insurance contracts.
As the gross premium valuation method used in African territories to determine insurance contract provisions makes implicit allowance for the deferral of acquisition costs, no explicit deferred acquisition cost asset is recognised in the statement of financial position for the contracts issued in these areas.
Deferral of costs on insurance business in other territories is limited to the extent that they are deemed recoverable from available future margins.
Costs incurred in acquiring investment management service contractsIncremental costs that are directly attributable to securing an investment management service contract are recognised as an asset if they can be identified separately and measured reliably and it is probable that they will be recovered. Deferred acquisition costs represent the contractual right to benefit from providing investment management services and are amortised as the related revenue is recognised. Costs attributable to investment management service contracts in the asset management businesses are also recognised on this basis.
General insuranceContracts under which the Group accepts significant insurance risk from another party and are not classified as life insurance are classified as general insurance. All classes of general insurance business are accounted for on an annual basis.
Premiums in general insurancePremiums stated gross of commissions exclude taxes and levies and are accounted for in the period in which the risk commences. The proportion of the premiums written relating to periods of risk after the reporting date is carried forward to subsequent accounting periods as unearned premiums, so that earned premiums relate to risks carried during the accounting period.
Outward reinsurance premiums are accounted for in the same accounting period as the premiums for the related direct insurance.
Claims on general insuranceClaims incurred comprise the settlement and handling costs of paid and outstanding claims arising during the year and adjustments to prior year claim provisions. Outstanding claims comprise claims incurred up to, but not paid, at the end of the accounting period, whether reported or not.
Outstanding claims do not include any provision for possible future claims where the claims arise under contracts not in existence at the reporting date.
The Group performs liability adequacy testing at a business unit level on its claim liabilities to ensure that the carrying amount of its liabilities (less related deferred acquisition costs and the unearned premium reserve) is sufficient in view of estimated future cash flows.
Whilst the directors consider that the gross provisions for claims and the related reinsurance recoveries are fairly stated on the basis of the information currently available to them, the ultimate liability will vary as a result of subsequent information and events and may result in significant adjustments to the amount provided. Adjustments to the amounts of claims provisions established in prior years are reflected in the financial statements for the period in which the adjustments are made and disclosed separately if material. The methods used and estimates made are reviewed regularly.
Acquisition costs on general insuranceAcquisition costs, which represent commission and other related expenses, are deferred and amortised over the period in which the related premiums are earned.
ReinsuranceThe Group cedes reinsurance in the normal course of business for the purpose of limiting its net loss potential through the diversification of its risks. Assets, liabilities and income and expense arising from ceded reinsurance contracts are presented separately from the related assets, liabilities, income and expense from the related insurance contracts because the reinsurance arrangements do not relieve the Group from its direct obligations to its policyholders.
Only rights under contracts that give rise to a significant transfer of insurance risk are accounted for as reinsurance assets. Rights under contracts that do not transfer significant insurance risk are accounted for as financial instruments.

Old Mutual plcAnnual Report and Accounts 2013
198
GROUP FINANCIAL STATEMENTSNOTES TO THE CONSOLIDATED FINANCIAL STATEMENTSFor the year ended 31 December 2013
E: Financial assets and liabilities continued
E8: Insurance and investment contracts continued
Reinsurance premiums for ceded reinsurance are recognised as an expense on a basis that is consistent with the recognition basis for the premiums on the related insurance contracts. For general insurance business, reinsurance premiums are expensed over the period that the reinsurance cover is provided based on the expected pattern of the reinsured risks. The unexpensed portion of ceded reinsurance premiums is included in reinsurance assets.
The net amounts paid to a reinsurer at the inception of a contract may be less than the reinsurance assets recognised by the Group in respect of its rights under such contracts. Any difference between the premium due to the reinsurer and the reinsurance asset recognised is included in profit or loss in the period in which the reinsurance premium is due.
The amounts recognised as reinsurance assets are measured on a basis that is consistent with the measurement of the provisions held in respect of the related insurance contracts. Reinsurance assets include recoveries due from reinsurance companies in respect of claims paid.
Reinsurance assets are assessed for impairment at each reporting date. An asset is deemed impaired if there is objective evidence, as a result of an event that occurred after its initial recognition, that the Group may not recover all amounts due and that the event has a reliably measurable impact on the amounts that the Group will receive from the reinsurer.
(a) Policyholder liabilities
The Group’s insurance and investment contracts are analysed as follows:
£m
At 31 December 2013 At 31 December 2012
Gross Reinsurance Net Gross Reinsurance Net
Life assurance policyholder liabilitiesInsurance contracts 11,953 (119) 11,834 14,457 (129) 14,328 Investment contracts
Unit-linked investment contracts and similar contracts 60,769 (1,620) 59,149 56,886 (1,159) 55,727 Other investment contracts 786 – 786 937 – 937 Discretionary participating investment contracts 7,460 – 7,460 7,710 – 7,710
Outstanding claims 173 (22) 151 198 (19) 179
81,141 (1,761) 79,380 80,188 (1,307) 78,881
General insurance liabilitiesClaims incurred but not reported 49 (7) 42 42 (3) 39 Unearned premiums 92 (49) 43 99 (45) 54 Outstanding claims 191 (58) 133 205 (51) 154
332 (114) 218 346 (99) 247
Total policyholder liabilities 81,473 (1,875) 79,598 80,534 (1,406) 79,128
Of the £1,875 million (2012: £1,406 million) included in reinsurer’s share of life assurance policyholder and general insurance liabilities is an amount of £1,774 million (2012: £1,314 million) which is classified as current, the remainder being non-current.
(b) Insurance contracts
Movements in the amounts outstanding in respect of life assurance policyholder liabilities, other than outstanding claims, are set out below:
£m
At 31 December 2013 At 31 December 2012
Gross Reinsurance Net Gross Reinsurance Net
Balance at beginning of the year 14,457 (129) 14,328 15,587 (94) 15,493 IncomePremium income 2,126 (70) 2,056 2,251 (73) 2,178 Investment income 1,402 – 1,402 1,988 – 1,988 Other income 5 – 5 5 – 5 ExpensesClaims and policy benefits (2,674) 60 (2,614) (3,522) 60 (3,462)Operating expenses (509) – (509) (550) 1 (549)Currency translation (gain)/loss (2,415) 17 (2,398) (1,197) 6 (1,191)Other charges and transfers (57) 12 (45) 278 (13) 265 Taxation (16) – (16) (21) – (21)Transfer to operating profit (366) (9) (375) (362) (16) (378)
Balance at end of the year 11,953 (119) 11,834 14,457 (129) 14,328

199
Financials
(c) Unit-linked investment contracts and similar contracts, and other investment contracts
£m
At 31 December
2013
At 31 December
2012
Balance at beginning of the year 57,823 53,060 New contributions received 8,452 8,142 Maturities (518) (428)Withdrawals and surrenders (7,044) (6,684)Fair value movements 5,670 5,180 Foreign exchange and other movements (2,828) (1,447)
Balance at end of the year 61,555 57,823
(d) Discretionary participating investment contracts
£m
At 31 December
2013
At 31 December
2012
Balance at beginning of the year 7,710 7,475 IncomePremium income 1,025 970 Investment income 1,599 1,291 ExpensesClaims and policy benefits (901) (1,000)Operating expenses (80) (172)Other charges and transfers (61) (31)Taxation (11) (12)Currency translation gain (1,733) (728)Transfer to operating profit (88) (83)
Balance at end of the year 7,460 7,710
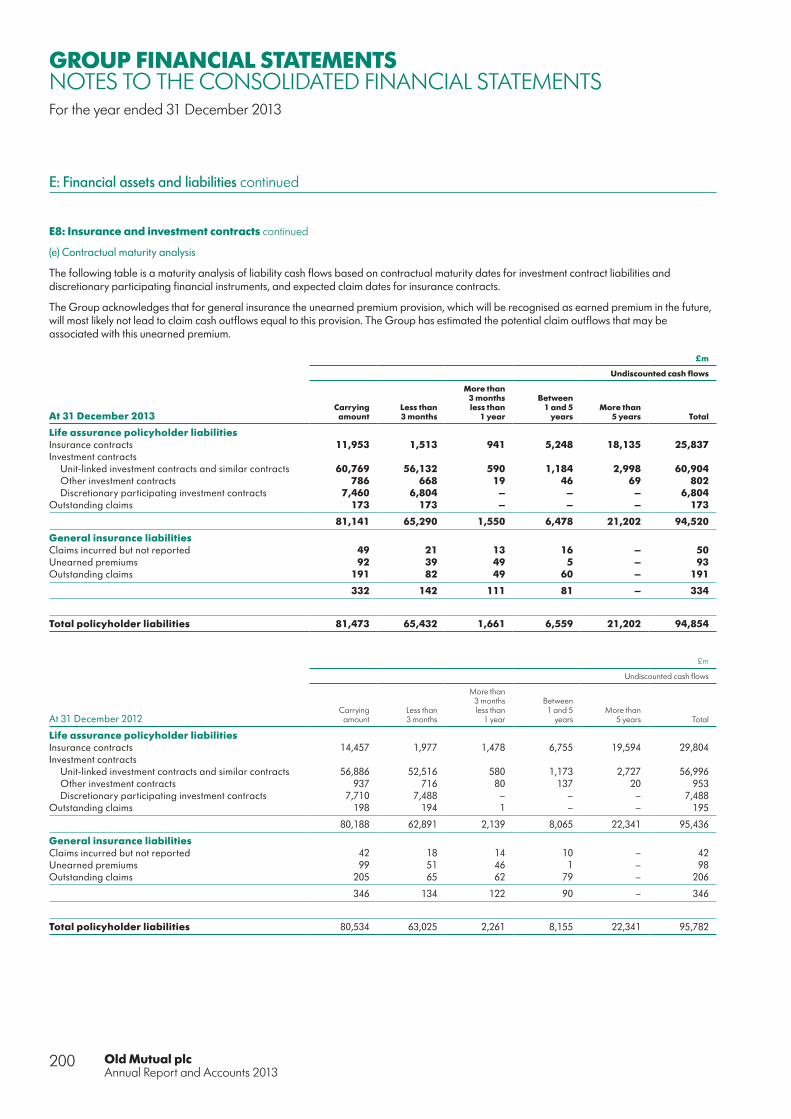
Old Mutual plcAnnual Report and Accounts 2013
200
GROUP FINANCIAL STATEMENTSNOTES TO THE CONSOLIDATED FINANCIAL STATEMENTSFor the year ended 31 December 2013
E: Financial assets and liabilities continued
E8: Insurance and investment contracts continued
(e) Contractual maturity analysis
The following table is a maturity analysis of liability cash flows based on contractual maturity dates for investment contract liabilities and discretionary participating financial instruments, and expected claim dates for insurance contracts.
The Group acknowledges that for general insurance the unearned premium provision, which will be recognised as earned premium in the future, will most likely not lead to claim cash outflows equal to this provision. The Group has estimated the potential claim outflows that may be associated with this unearned premium.
£m
Undiscounted cash flows
At 31 December 2013Carrying
amountLess than 3 months
More than 3 months less than
1 year
Between 1 and 5
yearsMore than
5 years Total
Life assurance policyholder liabilitiesInsurance contracts 11,953 1,513 941 5,248 18,135 25,837 Investment contracts
Unit-linked investment contracts and similar contracts 60,769 56,132 590 1,184 2,998 60,904 Other investment contracts 786 668 19 46 69 802 Discretionary participating investment contracts 7,460 6,804 – – – 6,804
Outstanding claims 173 173 – – – 173
81,141 65,290 1,550 6,478 21,202 94,520
General insurance liabilitiesClaims incurred but not reported 49 21 13 16 – 50 Unearned premiums 92 39 49 5 – 93 Outstanding claims 191 82 49 60 – 191
332 142 111 81 – 334
Total policyholder liabilities 81,473 65,432 1,661 6,559 21,202 94,854
£m
Undiscounted cash flows
At 31 December 2012Carrying
amountLess than 3 months
More than 3 months less than
1 year
Between 1 and 5
yearsMore than
5 years Total
Life assurance policyholder liabilitiesInsurance contracts 14,457 1,977 1,478 6,755 19,594 29,804 Investment contracts
Unit-linked investment contracts and similar contracts 56,886 52,516 580 1,173 2,727 56,996 Other investment contracts 937 716 80 137 20 953 Discretionary participating investment contracts 7,710 7,488 – – – 7,488
Outstanding claims 198 194 1 – – 195
80,188 62,891 2,139 8,065 22,341 95,436
General insurance liabilitiesClaims incurred but not reported 42 18 14 10 – 42 Unearned premiums 99 51 46 1 – 98 Outstanding claims 205 65 62 79 – 206
346 134 122 90 – 346
Total policyholder liabilities 80,534 63,025 2,261 8,155 22,341 95,782
201
Financials
(f) Insurance riskThe Group assumes insurance risk by issuing insurance contracts, under which the Group agrees to compensate the policyholder or other beneficiary if a specified uncertain future event (the insured event) affecting the policyholder occurs. Insurance risk includes mortality and morbidity risk in the case of life assurance or risk of loss (from fire, accident, or other source) in the case of general insurance.
Insurance risk arises through exposure to unfavourable claims experience on life assurance, critical illness and other protection business and exposure to unfavourable operating experience in respect of factors such as persistency levels and management expenses. Uncertainty in persistency, expenses and mortality and morbidity claim rates, relative to the actuarial assumptions made in the pricing process, may prevent the Group from achieving its profit objectives.
For accounting purposes insurance risk is defined as risk other than financial risk. Contracts issued by the Group may include both insurance and financial risk; contracts with significant insurance risk are classified as insurance contracts, while contracts with no or insignificant insurance risk are classified as investment contracts.
The Group has developed a risk policy which sets out the practices which are used to manage insurance risk and the management information and stress testing requirements. The policy is cascaded to all entities across the Group who each have their own risk policy suite aligned to the Group. As well as management of persistency, expense and claims experience, the risk policy sets requirements and standards on matters such as underwriting and claims management practices and the use of reinsurance to mitigate insurance risk.
The insurance risk profile and experience is closely monitored to ensure that the exposure remains acceptable.
The financial impact of insurance risk events is examined through stress tests carried out within the MCEV and IFRS sensitivities, ICA and Economic Capital assessment.
Mortality and morbidity Mortality and morbidity risk is the risk that death, critical illness and disability claims are higher than expected and recovery rates on disability are lower than expected. Possible causes are new and unexpected epidemics and widespread changes in lifestyle such as eating, smoking and exercise habits. Higher than expected claims levels will reduce expected emerging profits. For contracts where the insured risk is survival, the most significant factor that is likely to adversely impact the claims experience is continued improvement in medical science and social conditions that increase longevity.
For unit-linked contracts, a risk charge is applied to meet the expected cost of the insured benefit (in excess of the unit value). This risk charge can be altered in the event of significant changes in the expectation for future claims experience, subject to ‘Treating Customers Fairly’ principles.
The operations manage mortality and morbidity risks through its underwriting policy and external reinsurance arrangements where its policy is to retain certain types of insurance risks within specified maximum single event loss limits. Exposures above accepted limits are transferred to reinsurance counterparties.
PersistencyPersistency risk is the risk of higher than expected policyholder surrenders, transfers or premium cessation on contracts, leading to a reduction in financial profit.
In order to limit this risk to an acceptable level, products (including charging and commission structures) are designed to limit the risk of direct financial loss on surrender, subject to ‘Treating Customers Fairly’ principles.
Persistency statistics are monitored monthly and a detailed persistency analysis at a product level is carried out on an annual basis. Management actions may be triggered if statistics show significant adverse movement or emerging trends in experience.
Expenses Expense risk is the risk that actual expenses and expense inflation exceed expected levels. This may result in emerging profit falling below the Group’s profit objectives.
Expense levels are monitored quarterly against budgets and forecasts. An activity-based costing process is used to allocate costs relating to processes and activities to individual product lines.
Some products’ structures include maintenance charges. These charges are reviewed annually in light of changes in maintenance expense levels. This review may result in changes in charge levels, subject to ‘Treating Customers Fairly’ principles.
TaxTax risk is the risk that insufficient tax is collected from the policyholders because the projected taxation basis for basic life assurance business is incorrect, resulting in contracts being incorrectly priced.
Tax risk also represents potential changes in the interpretation or application of prevailing tax legislation as paid by either policyholders or shareholders, resulting in higher taxes reducing profitability or increasing shareholder tax burdens. The taxation position of the operations is projected annually and tax changes will result in changes to new business pricing models as part of the annual control cycle. High-risk issues and emerging trends are reported internally on a quarterly basis.
(g) Sensitivity analysis – life assuranceChanges in key assumptions used to value insurance contracts would result in increases or decreases to the insurance contract provisions recorded, with impact on profit/(loss) and/or shareholders’ equity. The effect of a change in assumption is mitigated by the offset (partial or full) to the bonus stabilisation reserve in the case of smoothed bonus products in South Africa.

Old Mutual plcAnnual Report and Accounts 2013
202
GROUP FINANCIAL STATEMENTSNOTES TO THE CONSOLIDATED FINANCIAL STATEMENTSFor the year ended 31 December 2013
E: Financial assets and liabilities continued
E8: Insurance and investment contracts continued
(g) Sensitivity analysis – life assurance continuedThe net increase or decrease to insurance contract provisions recorded at 31 December 2013 has been estimated as follows:
% £m £m £m
Assumption ChangeEmerging
MarketsOld Mutual
WealthOld Mutual
Bermuda
Mortality and morbidity rates – assurance 10 256 2 –Mortality rates – annuities (10) 42 – –Discontinuance rates 10 (7) (1) 3 Expenses (maintenance) 10 52 3 –
Emerging MarketsThe changes in insurance contract liabilities shown are calculated using the specified increase or decrease to the rates, with no change in charges paid by policyholders.
The insurance contract liabilities recorded for the Emerging Market business are also impacted by the valuation discount rate assumed. Lowering this rate by 1% (with a corresponding reduction in the valuation inflation rate assumption) would result in a net increase to the insurance contract liabilities, and decrease to profit, of £6 million (2012: £39 million). This impact is calculated with no change in charges paid by policyholders. The 2013 impact is lower than the 2012 impact due to further management actions taken to reduce the impact of changing interest rates on operating profit.
It should be noted that where the assets and liabilities of a product are closely matched (eg. non-profit annuity business) or where the impact of a lower valuation discount rate is hedged or partially hedged, the net effect has been shown since the asset movement fully or partially offsets the liability movement.
Old Mutual WealthThe changes in insurance contract liabilities shown are calculated independently using the specified increase or decrease to the rates, with no change in premiums paid by policyholders. The assumption changes have no impact on the linked UK business.
Whole of Life is the main product group affected by the lapse assumption change. This is because the policies have the longest duration and represent close to 89% of the reserve. The main product groups impacted by the expense, mortality and morbidity sensitivities are Whole of Life and Accelerated Critical Illness.
In the Old Mutual Wealth business, non-linked liabilities are well matched by gilts so that the net impact of a valuation interest rate change taking asset and liability movement into account is negligible.
Old Mutual BermudaLapses and partial withdrawals have the largest impact where increased activity reduces the guarantee portion of the business since less death and living benefit exposure is expected in the future. Mortality plays a much smaller part in Bermuda since all the business is accumulation/savings type business. Increased deaths do accelerate payment of guaranteed minimum death benefits but there is a comparable release of reserve on the maturity guarantee providing an offset (about 78% of the variable annuity business has both death/living benefits).
(h) Sensitivity analysis – general insuranceAn increase of 10% in the average cost of claims would require the recognition of an additional loss of £49 million (2012: £40 million) net of reinsurance. Similarly, an increase of 10% in the ultimate number of claims would result in an additional loss of £49 million (2012: £40 million) net of reinsurance.
The majority of the Property & Casualty contracts are classified as ‘short-tailed’, meaning that most claims are settled within a year after the loss date. This contrasts with ‘long-tailed’ classes where the claims take longer to materialise and settle. For Property & Casualty, long-tailed business broadly comprises of accident & health, engineering, guarantee, liability and transportation classes. In total the long-tail business comprises less than 10 per cent of an average year’s claim costs.
(i) Reinsurance assets – credit riskNone of the Group’s reinsurance assets are either past due or impaired. Of the reinsurance assets shown in the statement of financial position, all are considered investment grade with the exception of £73 million of unrated exposures (2012: £134 million). Collateral is not taken against reinsurance assets or deposits held with reinsurers other than in limited circumstances.

203
Financials
E9: Borrowed funds
£m
Notes
Group excluding Nedbank Nedbank
At31 December
2013Group
Group excluding Nedbank Nedbank
At31 December
2012Group
Senior debt securities and term loans 113 1,151 1,264 122 1,363 1,485
Floating rate notes E9(a) – 673 673 – 849 849 Fixed rate notes E9(b) 113 478 591 122 514 636
Mortgage-backed securities E9(d) – 65 65 – 131 131 Subordinated debt securities (net of Group holdings) E9(e) 703 597 1,300 765 669 1,434
Borrowed funds 816 1,813 2,629 887 2,163 3,050
Other instruments treated as equity for accounting purposes
€374 million perpetual preferred callable securities1 253 334 £273 million perpetual preferred callable securities2 273 348
Total: Book value 1,342 1,569
Nominal value of the above 1,370 1,590
1 The €374 million perpetual callable security was previously €495 million, with €121 million being acquired via a Modified Dutch Auction tender on 19 November 2013.2 The £273 million perpetual callable security was previously £348 million, with £75 million being acquired via a Modified Dutch Auction tender on 19 November 2013.
The table below is a maturity analysis of the liability cash flows based on contractual maturity dates for borrowed funds. Maturity analysis is undiscounted and based on year-end exchange rates.
£m
Group excluding Nedbank Nedbank
At31 December
2013Group
Group excluding Nedbank Nedbank
At31 December
2012Group
Less than 1 year 98 385 483 110 522 632 Greater than 1 year and less than 5 years 751 1,727 2,478 907 1,820 2,727 Greater than 5 years 1,099 236 1,335 1,311 314 1,625
Total 1,948 2,348 4,296 2,328 2,656 4,984
Contractual maturity tables include all the data available for both years as at 31 December 2013.
Senior debt securities and term loans
(a) Floating rate notes
£m
Maturity date
At 31 December
2013
At 31 December
2012
Nedbank – Floating rate unsecured senior debtR98 million at inflation linked (3.80% real yield) Repaid – 8 R1,750 million at inflation linked (3.90% real yield) Repaid – 151 R1,552 million at JIBAR + 1.48% Repaid – 114 R988 million at JIBAR + 1.05% March 2014 50 71 R500 million at JIBAR + 1.00% April 2014 26 33 R1,075 million at JIBAR + 0.94% October 2014 62 79 R1,297 million at JIBAR + 1.00% February 2015 75 95 R1,027 million at JIBAR + 1.75% April 2015 60 76 R250 million at JIBAR + 1.00% August 2015 14 18 R1,044 million at JIBAR + 2.20% September 2015 61 76 R677 million at JIBAR + 1.25% March 2016 39 49 R3,056 million at JIBAR + 0.8% July 2016 176 –R694 million at JIBAR + 0.75% November 2016 40 –R405 million at JIBAR + 1.30% February 2017 23 30 R786 million at JIBAR + 1.30% August 2017 42 43 R80 million at JIBAR + 2.15% April 2020 5 6
Total floating rate notes 673 849
All floating rate notes are non-qualifying for the purposes of regulatory tiers of capital.

Old Mutual plcAnnual Report and Accounts 2013
204
GROUP FINANCIAL STATEMENTSNOTES TO THE CONSOLIDATED FINANCIAL STATEMENTSFor the year ended 31 December 2013
E: Financial assets and liabilities continued
E9: Borrowed funds continued
(b) Fixed rate notes (net of Group holdings)
£m
Maturity date
At 31 December
2013
At 31 December
2012
Nedbank – Fixed rate unsecured senior debtR450 million at 8.39% March 2014 26 33 R478 million at 9.68% April 2015 28 35 R3,244 million at 10.55% September 2015 192 242 R1,137 million at 9.36% March 2016 67 85 R151 million at 6.91% July 2016 9 –R1,273 million at 11.39% September 2019 80 102 R1,888 million at 8.92% November 2020 109 –R660 million at zero coupon October 2024 14 17
525 514 Less: fixed rate notes held by other Group companies (47) –Banking fixed rate unsecured senior debt (net of Group holdings) 478 514
Group excluding Nedbank $2 million secured senior debt at 5.23%1 August 2014 1 10 £112 million eurobond at 7.125% October 2016 112 112
113 122
Total fixed rate notes 591 636
All fixed rate notes are non-qualifying for the purpose of regulatory tiers of capital.1 $14 million of the $16 million senior bond was repaid, with repayment of $12 million on 1 November 2013 and $2 million on 15 December 2013.
(c) Revolving credit facilities and irrevocable letters of creditFollowing an internal review of Group funding requirements, the Group reduced its revolving credit facility by £400 million in August 2013. The Group now has access to a £800 million (2012: £1,200 million) five-year multi-currency revolving credit facility which matures in April 2016. At 31 December 2013 and 31 December 2012, none of this facility was drawn and there were no irrevocable letters of credit in issue against this facility.
(d) Mortgage-backed securities (net of Group holdings)
£m
Tier Maturity date
At 31 December
2013
At 31 December
2012
NedbankR480 million (class A1) at JIBAR + 1.10% Tier 2 25 October 2039 13 32 R336 million (class A2) at JIBAR + 1.25% Tier 2 25 October 2039 20 25 R900 million (class A3) at JIBAR + 1.54% Tier 2 25 October 2039 52 66 R110 million (class B) at JIBAR + 1.90% Tier 2 25 October 2039 6 8
91 131 Less: Mortgage backed securities held by other Group companies (26) –
Total mortgage-backed securities 65 131

205
Financials
(e) Subordinated debt securities (net of Group holdings)
£m
Tier First call date Maturity date
At 31 December
2013
At 31 December
2012
NedbankR300 million at JIBAR + 2.50% Tier 2 Repaid Repaid – 11 R1,800 million at 9.84% Tier 2 Repaid Repaid – 137 R1,265 million at JIBAR + 4.75% Non-core Tier 1 November 2018 November 2018 74 93 R487 million at 15.05% Non-core Tier 1 November 2018 November 2018 32 43 R1,700 million at 8.90% Tier 2 February 2014 February 2019 101 132 R1,000 million at 10.54% Tier 2 September 2015 September 2020 62 81 $100 million at 3 month USD LIBOR Tier 2 Secondary March 2017 March 2022 60 62 R2,000 million at JIBAR + 0.47% Tier 2 July 2017 July 2022 116 146 R1,800 million at JIBAR + 2.75% Tier 2 July 2018 July 2023 105 –R1,200 million at JIBAR + 2.55% Tier 2 November 2018 November 2023 69 –
619 705 Less: Banking subordinated debt securities held by other
Group companies (22) (36)
Banking subordinated securities (net of Group holdings) 597 669 Group excluding NedbankR3,000 million at 8.92% until October 2015 and
3 month JIBAR + 1.59% thereafter Lower Tier 2 October 2015 October 2020 172 218 £500 million at 8.00%1 Lower Tier 2 – June 2021 531 547
703 765
Total subordinated debt securities 1,300 1,434
1 The principal and coupon on the bond were initially swapped into floating rate Swedish kronor, at 3 month STIBOR plus 5.46%. Following the Nordic sale, £375 million of the coupon is now swapped into floating rate sterling at 6 month GBP LIBOR plus 4.15% and £125 million of principal and coupon is swapped into US dollars at 6 month USD LIBOR plus 5.49%.
E10: Amounts owed to bank depositors
£m
At 31 December 2013Carrying
amountLess than 3 months
More than 3 months less than
1 year
Between 1 and 5
yearsMore than
5 years Total
Current accounts 3,376 3,374 – 2 – 3,376 Savings deposits 1,579 1,578 – 1 – 1,579 Other deposits and loan accounts 23,694 17,402 3,388 2,993 304 24,087 Negotiable certificates of deposit 5,018 1,276 2,829 1,279 5 5,389 Deposits received under repurchase agreements 703 704 – – – 704
Amounts owed to bank depositors 34,370 24,334 6,217 4,275 309 35,135
£m
At 31 December 2012 Carrying amountLess than 3 months
More than 3 months less than
1 year
Between 1 and 5
yearsMore than
5 years Total
Current accounts 4,055 4,056 – – – 4,056 Savings deposits 1,348 1,348 – – – 1,348 Other deposits and loan accounts 27,309 19,789 3,694 3,816 299 27,598 Negotiable certificates of deposit 5,584 1,671 4,397 – – 6,068 Deposits received under repurchase agreements 1,203 1,203 – – – 1,203
Amounts owed to bank depositors 39,499 28,067 8,091 3,816 299 40,273

Old Mutual plcAnnual Report and Accounts 2013
206
GROUP FINANCIAL STATEMENTSNOTES TO THE CONSOLIDATED FINANCIAL STATEMENTSFor the year ended 31 December 2013
E: Financial assets and liabilities continued
E11: Liquidity
Liquidity risk is the risk that cash may not be available to pay obligations when due at a reasonable cost. Ultimate responsibility for liquidity risk management rests with the Board of directors, which has built an appropriate liquidity risk management framework for the management of the Group’s short-, medium- and long-term funding and liquidity management requirements. The Group manages liquidity by maintaining adequate reserves and banking facilities, continuously monitoring forecast and actual cash flows, and matching the maturity profiles of financial assets and liabilities. Individual businesses separately maintain and manage their local liquidity requirements according to their business needs, within the overall liquidity framework established by Old Mutual plc.
The Group continues to meet Group and individual entity capital requirements, and day-to-day liquidity needs through the Group’s available cash resources and, if necessary, available credit facilities. Given the nature of the Group’s investments and securities, liquid resources are generally speaking readily available, as the Group holds large portfolios of highly marketable securities, for example listed bonds, actively traded pooled investments, equities and cash and cash equivalents. Whilst most of the Group’s policyholder and banking liabilities are generally repayable on demand, the Group’s expectation is that policyholders and banking depositors will only require funds on an ongoing basis. Cash resources and other liquid assets are maintained in the event of a need for additional liquidity. Information on the nature of the investments and securities held is given in note E4. The Group’s existing revolving credit facility of £800 million (2012: £1,200 million) does not mature until April 2016 (2012: April 2016). Details, together with information on the Group’s borrowed funds, are given in note E9.
The key information reviewed by the Group’s Executive Directors and Executive Committee, together with the Group’s Capital Management Committee, is a detailed management report on the Group’s and holding company’s current and planned capital and liquidity position together with summary information on the current and planned liquidity positions of the Group’s operating segments. Forecasts are updated regularly based on new information received and also as part of the Group’s annual business planning cycle. The Group and holding company’s liquidity and capital position and forecast are presented to the Old Mutual plc Board of directors on a regular basis.
Group operating segments are required, both in terms of their local requirements and in accordance with direction from the holding company, to establish their own processes for managing their liquidity and capital needs and these are subject to review by their local oversight functions, with representation from the Group.
Further information on liquidity and holding company cash flow is contained in other sections of this Annual Report and Accounts.
The Group does not have material liquidity exposure to special purpose entities or investment funds.
The contractual maturities of the Group’s financial liabilities are set out in notes E6, E8, E9 and E10 to the Group financial statements.
207
Financials
F: Other statement of financial position notes
F1: Goodwill and other intangible assets
(a) Goodwill and goodwill impairmentGoodwill arising on the acquisition of a subsidiary undertaking is recognised as an asset at the date that control is achieved (the acquisition date). Goodwill is measured as the excess of the fair value of the consideration transferred, the amount of any non-controlling interest in the acquiree and the fair value of the acquirer’s previously-held equity interest in the acquiree (if any) over the net of the acquisition date amounts of the identifiable assets acquired and the liabilities assumed. If the Group’s interest in the net fair value of the acquiree’s identifiable net assets exceeds the sum of the consideration transferred, the amount of any non-controlling interest in the acquiree and the fair value of the acquirer’s previously-held equity interest (if any), this excess is recognised immediately in profit or loss as a bargain purchase gain.
Goodwill is not amortised, but is reviewed for impairment at least once annually. Any impairment loss is recognised immediately in profit or loss and is not subsequently reversed.
On loss of control of a subsidiary undertaking, any attributable goodwill is included in the determination of any profit or loss on disposal. On disposal of a business, where goodwill on acquisition is allocated to the entire cash-generating units (CGU), goodwill is allocated to the disposal on a relative basis.
Goodwill is allocated to one or more CGUs, being the smallest identifiable group of assets that generates cash inflows that are largely independent of the cash inflows from other assets or group of assets. The directors annually test for impairment of each CGU or group of CGUs containing goodwill and intangible assets with indefinite useful lives, at a level that is no larger than that of the Group’s identified operating segments for the purposes of segment reporting. An impairment loss is recognised whenever the carrying amount of an asset or its CGU or group of CGUs exceeds its recoverable amount, which is the higher of its fair value less costs to sell and its value in use. Impairment losses relating to goodwill are not reversed.
(b) Present value of acquired in-force for insurance and investment contract businessThe present value of acquired in-force for insurance and investment contract business is capitalised in the consolidated statement of financial position as an intangible asset.
The capitalised value is the present value of cash flows anticipated in the future from the relevant book of insurance and investment contract policies acquired at the date of the acquisition. This is calculated by performing a cash flow projection of the associated life assurance fund and book of in-force policies in order to estimate future after tax profits attributable to shareholders. The valuation is based on actuarial principles taking into account future premium income, mortality, disease and surrender probabilities, together with future costs and investment returns on the assets supporting the fund. These profits are discounted at a rate of return allowing for the risk of uncertainty of the future cash flows. The key assumptions impacting the valuation are discount rate, future investment returns and the rate at which policies discontinue.
The asset is amortised over the expected profit recognition period on a systematic basis over the anticipated lives of the related contracts.
The amortisation charge is stated net of any unwind in the discount rate used to calculate the asset.
The recoverable amount of the asset is re-calculated at each reporting date and any impairment losses recognised accordingly.
(c) Other intangible assets acquired as part of a business combinationContractual banking and asset management customer relationships, relationships with distribution channels and similar intangible assets, acquired as a part of a business combination, are capitalised at their fair value, represented by the estimated net present value of the future cash flows from the relevant relationships acquired at the date of acquisition.
Brands and similar items acquired as part of a business combination are capitalised at their fair value based on a ‘relief from royalty’ valuation methodology.
Subsequent to initial recognition such acquired intangible assets are amortised on a straight-line basis over their estimated useful lives as set out below:
■ Distribution channels 10 years ■ Customer relationships 10 years ■ Brand 15 – 20 years
The estimated useful life is re-evaluated on a regular basis.
(d) Internally developed softwareInternally developed software is amortised over its estimated useful life, where applicable. Such assets are stated at cost less accumulated amortisation and impairment losses. Software is recognised in the statement of financial position if, and only if, it is probable that the relevant future economic benefits attributable to the software will flow to the Group and its cost can be measured reliably.
Costs incurred in the research phase are expensed whereas costs incurred in the development phase are capitalised subject to meeting specific criteria, set out in the relevant accounting guidance. The main criteria being that future economic benefits can be identified as a result of the development expenditure. Amortisation is charged to profit or loss on a straight-line basis over the estimated useful lives of the relevant software, which range between two and five years.

Old Mutual plcAnnual Report and Accounts 2013
208
GROUP FINANCIAL STATEMENTSNOTES TO THE CONSOLIDATED FINANCIAL STATEMENTSFor the year ended 31 December 2013
F: Other statement of financial position notes continued
F1: Goodwill and other intangible assets continued
(e) Subsequent expenditureSubsequent expenditure on capitalised intangible assets is capitalised only when it increases the future economic benefits embodied in the specific asset to which it relates. All other expenditure is expensed as incurred.
For properties reclassified during the year from property, plant and equipment to investment properties, any revaluation gain arising is initially recognised in profit or loss to the extent that impairment losses were previously recognised. Any residual excess is taken to the revaluation reserve. Revaluation deficits are recognised in the revaluation reserve to the extent of previously recognised gains and any residual deficit is accounted for in profit or loss.
Investment properties that are reclassified to owner-occupied property are revalued at the date of transfer, with any difference being taken to profit or loss.
(f) Analysis of goodwill and other intangibles
£m
Goodwill
Present value of acquired in-force
business development costs
Software development costs
Other intangible
assets Total
At 31 December 2013 2012 2013 2012 2013 2012 2013 2012 2013 2012
CostBalance at beginning of the year 2,729 2,882 1,453 1,476 684 699 565 580 5,431 5,637 Acquisitions through business combinations 30 1 – – – – – – 30 1 Additions – – – – 84 72 2 – 86 72 Disposals or retirements – (28) – – (5) (27) (35) – (40) (55)Transfer to non-current assets held for sale – – – – – – – (6) – (6)Foreign exchange and other movements (118) (126) 11 (23) (133) (60) 6 (9) (234) (218)
Balance at end of the year 2,641 2,729 1,464 1,453 630 684 538 565 5,273 5,431
Amortisation and impairment lossesBalance at beginning of the year (611) (665) (866) (804) (480) (492) (418) (318) (2,375) (2,279)Amortisation charge for the year – – (76) (84) (49) (53) (48) (51) (173) (188)Impairment losses (8) – – – – – (20) (35) (28) (35)Disposals or retirements – – – – 6 27 33 – 39 27 Foreign exchange and other movements 21 54 (4) 22 86 38 (4) (14) 99 100
Accumulated amortisation and impairment losses at end of the year (598) (611) (946) (866) (437) (480) (457) (418) (2,438) (2,375)
Carrying amountBalance at beginning of the year 2,118 2,217 587 672 204 207 147 262 3,056 3,358
Balance at end of the year 2,043 2,118 518 587 193 204 81 147 2,835 3,056
The acquisitions through business combinations comprises £30 million (2012: £nil) in respect of acquisitions made by Emerging Markets. Refer to note H8 for further information.
The present value of acquired in-force business at the year-end of £518 million (2012: £587 million) relates to the Skandia business acquired during 2006, which is due to be amortised over a further seven to twelve years.
Of the other intangible assets, £69 million (2012: £130 million) relates to distribution channels associated with the Skandia business, which have a remaining period of amortisation of two years.
(g) Allocation of goodwill to cash generating unitsThe carrying amount of goodwill accords with the operating segmentation shown in note B and primarily relates to the cash generating units (CGUs) of Emerging Markets, Old Mutual Wealth, Nedbank and US Asset Management.
£m
At 31 December
2013
At 31 December
2012
Emerging Markets 98 86 Old Mutual Wealth 864 859 Nedbank 285 355 US Asset Management 793 814 Other 3 4
Goodwill, net of impairment losses 2,043 2,118
209
Financials
F1: Goodwill and other intangible assets
(h) Annual impairment testing of goodwillIn accordance with the requirements of IAS 36 ‘Impairment of Assets’, goodwill is tested annually for impairment for each CGU, by comparing the carrying amount of each CGU to its recoverable amount, being the higher of that CGU’s value-in-use or fair value less costs to sell. An impairment charge is recognised when the recoverable amount is less than the carrying value.
Emerging Markets and Old Mutual WealthEmerging Markets and Old Mutual Wealth CGUs generate revenues through their life assurance and asset management businesses.
The value-in-use calculations for the life assurance operations are determined using the reported embedded value methodology plus a discounted cash flow calculation for the value of new business. The value of new business represents the present value of future profits from expected new business. Embedded value represents the shareholders’ interest in the life assurance business and is calculated in accordance with MCEV principles. The methodology and significant assumptions underlying the determination of embedded value is disclosed in the supplementary information shown on pages 255 to 263. The differences between the key assumptions applied in the current year and in the prior year are disclosed on page 266.
The cash flows attributable to the value of new business are determined with reference to latest approved three-year business plans. Projections beyond the plan period are extrapolated using an inflation based growth assumption.
The value-in-use calculations for the asset management operations are similarly determined based on discounted cash flow models derived from the latest approved three-year business plans. An additional two years of projections beyond the plan period are extrapolated using inflation based growth rates.
The cash flows are discounted at economic profit rates applicable to each individual CGU. The key assumptions used in the value-in-use calculations for the Emerging Markets and Old Mutual Wealth CGUs are as follows:
■ The growth rate – The rate used is an inflation-based growth assumption, which varies by CGU and is based on external market factors particular to that CGU. Emerging Markets applied the growth rate of 9.7% (2012: 9.6%) to both its life assurance business and asset management business in Mexico and Colombia. Old Mutual Wealth applied a weighted average calculation to determine the growth rate of 2.1% (2012: 2.2%)
■ The discount rate – The applied rate used the relevant 10-year government bond rate as a starting point, which was adjusted for an equity market risk premium and other relevant risk adjustments, which were determined using market valuation models and other observable references. Rates applied were 13.3% (2012: 13.2%) for Emerging Markets and 9.6% (2012: 9.3%) for Old Mutual Wealth.
The directors are satisfied that any reasonable change in the assumptions would not cause the recoverable amounts of the Emerging Markets and Old Mutual Wealth CGUs to fall below their carrying amounts.
Nedbank The impairment test in respect of the Nedbank CGU has been performed by comparing the CGU’s net carrying amount to its estimated value-in-use. The value-in-use has been determined using a discounted cash flow methodology. The key assumptions used in the value-in-use calculation are the discount rate and growth rate, which are based on market factors relevant to that CGU. A 5.0% (2012: 5.5%) growth rate was applied to extrapolate cash flows for an additional two years beyond the three-year business plan period. A terminal value, using the same growth rate, is added for the value of cash flows beyond five years. The discount rate applied was approximately 12.0% (2012: 11.2%). The directors are satisfied that a reasonable change in assumptions would not cause the recoverable amount of the goodwill to fall below the carrying amount.
US Asset ManagementThe impairment test in respect of the USAM CGU has been performed by comparing the CGU’s net carrying amount to its value-in-use determined using a discounted cash flow methodology. The key assumptions used in the value-in-use calculations for USAM are as follows:
■ The three-year business plan plus two further years have growth rate assumptions based on management’s expectation of performance over this period. A terminal value, using a long-term growth rate of 4.0% (2012: 4.0%) is added for the value of cash flows beyond five years. The assumed long-term growth rate was determined with reference to nominal historical gross domestic product (GDP) growth and the outlook for nominal GDP growth for the US
■ The risk-adjusted discount rate applied was 12.0% (2012: 12.0%).
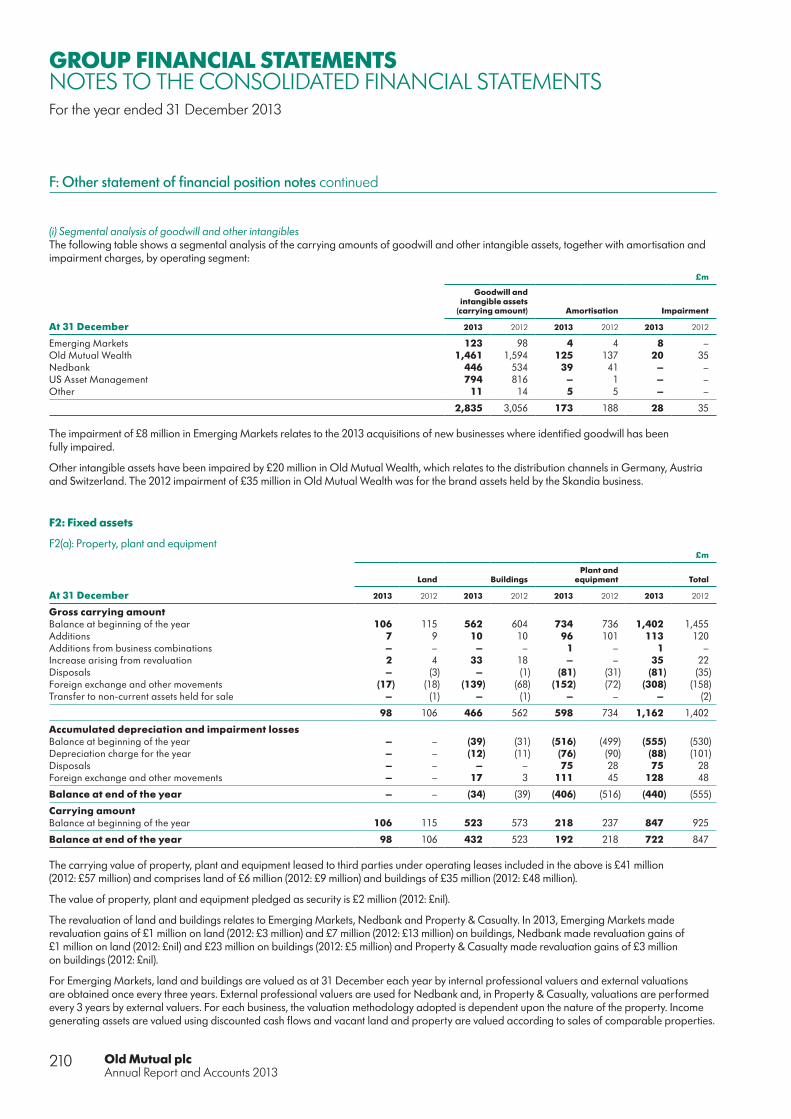
Old Mutual plcAnnual Report and Accounts 2013
210
GROUP FINANCIAL STATEMENTSNOTES TO THE CONSOLIDATED FINANCIAL STATEMENTSFor the year ended 31 December 2013
F: Other statement of financial position notes continued
(i) Segmental analysis of goodwill and other intangiblesThe following table shows a segmental analysis of the carrying amounts of goodwill and other intangible assets, together with amortisation and impairment charges, by operating segment:
£m
Goodwill and intangible assets
(carrying amount) Amortisation Impairment
At 31 December 2013 2012 2013 2012 2013 2012
Emerging Markets 123 98 4 4 8 –Old Mutual Wealth 1,461 1,594 125 137 20 35 Nedbank 446 534 39 41 – –US Asset Management 794 816 – 1 – –Other 11 14 5 5 – –
2,835 3,056 173 188 28 35
The impairment of £8 million in Emerging Markets relates to the 2013 acquisitions of new businesses where identified goodwill has been fully impaired.
Other intangible assets have been impaired by £20 million in Old Mutual Wealth, which relates to the distribution channels in Germany, Austria and Switzerland. The 2012 impairment of £35 million in Old Mutual Wealth was for the brand assets held by the Skandia business.
F2: Fixed assets
F2(a): Property, plant and equipment£m
Land BuildingsPlant and
equipment Total
At 31 December 2013 2012 2013 2012 2013 2012 2013 2012
Gross carrying amountBalance at beginning of the year 106 115 562 604 734 736 1,402 1,455 Additions 7 9 10 10 96 101 113 120 Additions from business combinations – – – – 1 – 1 –Increase arising from revaluation 2 4 33 18 – – 35 22 Disposals – (3) – (1) (81) (31) (81) (35)Foreign exchange and other movements (17) (18) (139) (68) (152) (72) (308) (158)Transfer to non-current assets held for sale – (1) – (1) – – – (2)
98 106 466 562 598 734 1,162 1,402
Accumulated depreciation and impairment lossesBalance at beginning of the year – – (39) (31) (516) (499) (555) (530)Depreciation charge for the year – – (12) (11) (76) (90) (88) (101)Disposals – – – – 75 28 75 28 Foreign exchange and other movements – – 17 3 111 45 128 48
Balance at end of the year – – (34) (39) (406) (516) (440) (555)
Carrying amountBalance at beginning of the year 106 115 523 573 218 237 847 925
Balance at end of the year 98 106 432 523 192 218 722 847
The carrying value of property, plant and equipment leased to third parties under operating leases included in the above is £41 million (2012: £57 million) and comprises land of £6 million (2012: £9 million) and buildings of £35 million (2012: £48 million).
The value of property, plant and equipment pledged as security is £2 million (2012: £nil).
The revaluation of land and buildings relates to Emerging Markets, Nedbank and Property & Casualty. In 2013, Emerging Markets made revaluation gains of £1 million on land (2012: £3 million) and £7 million (2012: £13 million) on buildings, Nedbank made revaluation gains of £1 million on land (2012: £nil) and £23 million on buildings (2012: £5 million) and Property & Casualty made revaluation gains of £3 million on buildings (2012: £nil).
For Emerging Markets, land and buildings are valued as at 31 December each year by internal professional valuers and external valuations are obtained once every three years. External professional valuers are used for Nedbank and, in Property & Casualty, valuations are performed every 3 years by external valuers. For each business, the valuation methodology adopted is dependent upon the nature of the property. Income generating assets are valued using discounted cash flows and vacant land and property are valued according to sales of comparable properties.

211
Financials
The carrying value that would have been recognised had the land and buildings been carried under the cost model would be £24 million (2012: £32 million) and £175 million (2012: £233 million) respectively for Emerging Markets, £16 million (2012: £20 million) and £112 million (2012: £136 million) for Nedbank respectively and, for Property & Casualty, a carrying value of £5 million would have been recognised for buildings (2012: £5 million).
F2(b): Investment property
£m
Year ended 31 December
2013
Year ended 31 December
2012
Balance at beginning of the year 1,947 2,064 Additions 47 55 Additions from business combinations 10 –Disposals (22) (67)Net gain from fair value adjustments 107 84 Foreign exchange and other movements (278) (158)Transfer to non-current assets held for sale – (31)
Balance at end of the year 1,811 1,947
The additions of £47 million (2012: £55 million) and the net gain from fair value adjustments of £107 million (2012: £84 million) are both related to Emerging Markets.
The fair value of investment property (freehold) leased to third parties under operating leases is as follows:
£m
Year ended 31 December
2013
Year ended 31 December
2012
Freehold 1,779 1,921 Leasehold 32 26
1,811 1,947
Rental income from investment property 157 185 Direct operating expense arising from investment property that generated rental income (24) (28)
133 157
The carrying amount of investment property is the fair value of the property as determined by a registered independent valuer at least every three years, and annually by locally qualified staff, having an appropriate recognised professional qualification and recent experience in the location and category of the property being valued. Fair values are determined having regard to recent market transactions for similar properties in the same location as the Group’s investment property. The Group’s current lease arrangements, which are entered into on an arm’s length basis and which are comparable to those for similar properties in the same location, are taken into account.
Of the total investment property of £1,811 million (2012: £1,947 million), £1,455 million (2012: £1,604 million) is attributable to Africa and £356 million (2012: £343 million) to Europe.
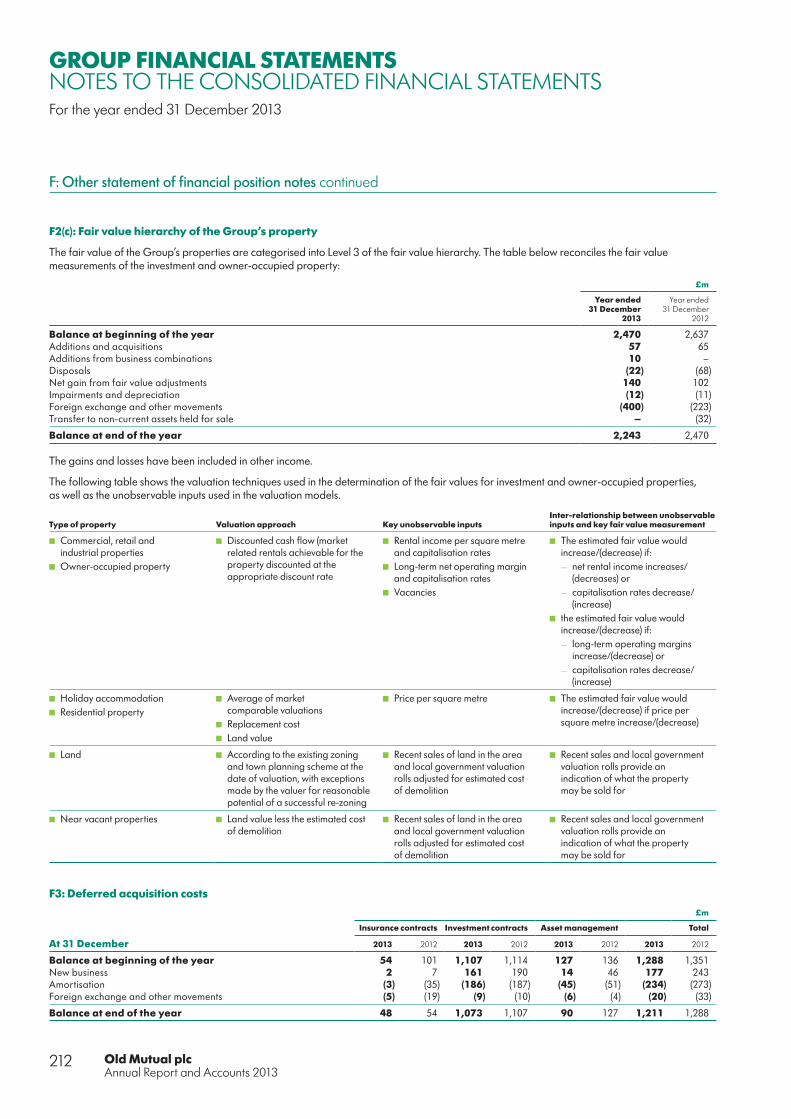
Old Mutual plcAnnual Report and Accounts 2013
212
GROUP FINANCIAL STATEMENTSNOTES TO THE CONSOLIDATED FINANCIAL STATEMENTSFor the year ended 31 December 2013
F: Other statement of financial position notes continued
F2(c): Fair value hierarchy of the Group’s property
The fair value of the Group’s properties are categorised into Level 3 of the fair value hierarchy. The table below reconciles the fair value measurements of the investment and owner-occupied property:
£m
Year ended 31 December
2013
Year ended 31 December
2012
Balance at beginning of the year 2,470 2,637 Additions and acquisitions 57 65 Additions from business combinations 10 –Disposals (22) (68)Net gain from fair value adjustments 140 102 Impairments and depreciation (12) (11)Foreign exchange and other movements (400) (223)Transfer to non-current assets held for sale – (32)
Balance at end of the year 2,243 2,470
The gains and losses have been included in other income.
The following table shows the valuation techniques used in the determination of the fair values for investment and owner-occupied properties, as well as the unobservable inputs used in the valuation models.
Type of property Valuation approach Key unobservable inputsInter-relationship between unobservable inputs and key fair value measurement
■ Commercial, retail and industrial properties
■ Owner-occupied property
■ Discounted cash flow (market related rentals achievable for the property discounted at the appropriate discount rate
■ Rental income per square metre and capitalisation rates
■ Long-term net operating margin and capitalisation rates
■ Vacancies
■ The estimated fair value would increase/(decrease) if:
— net rental income increases/(decreases) or
— capitalisation rates decrease/(increase)
■ the estimated fair value would increase/(decrease) if:
— long-term operating margins increase/(decrease) or
— capitalisation rates decrease/(increase)
■ Holiday accommodation ■ Residential property
■ Average of market comparable valuations
■ Replacement cost ■ Land value
■ Price per square metre ■ The estimated fair value would increase/(decrease) if price per square metre increase/(decrease)
■ Land ■ According to the existing zoning and town planning scheme at the date of valuation, with exceptions made by the valuer for reasonable potential of a successful re-zoning
■ Recent sales of land in the area and local government valuation rolls adjusted for estimated cost of demolition
■ Recent sales and local government valuation rolls provide an indication of what the property may be sold for
■ Near vacant properties ■ Land value less the estimated cost of demolition
■ Recent sales of land in the area and local government valuation rolls adjusted for estimated cost of demolition
■ Recent sales and local government valuation rolls provide an indication of what the property may be sold for
F3: Deferred acquisition costs
£m
Insurance contracts Investment contracts Asset management Total
At 31 December 2013 2012 2013 2012 2013 2012 2013 2012
Balance at beginning of the year 54 101 1,107 1,114 127 136 1,288 1,351 New business 2 7 161 190 14 46 177 243 Amortisation (3) (35) (186) (187) (45) (51) (234) (273)Foreign exchange and other movements (5) (19) (9) (10) (6) (4) (20) (33)
Balance at end of the year 48 54 1,073 1,107 90 127 1,211 1,288

213
Financials
F4: Trade, other receivables and other assets
£m
Notes
At 31 December
2013
At 31 December
2012Restated1
Debtors arising from direct insurance operationsAmounts owed by policyholders 95 94 Amounts owed by intermediaries 56 67 Other 77 79
228 240 Debtors arising from reinsurance operations 30 35 Outstanding settlements 475 404 Reinsurance treaties 319 545 Post-employment benefits H1 119 76 Other receivables 707 717 Accrued interest and rent 281 326 Trading securities and spot positions 187 275 Prepayments and accrued income 75 115 Other assets 162 273
Total trade, other receivables and other assets 2,583 3,006
1 The prior year has been restated for the impact of changes in accounting policies. Refer to note J1 for further details.
Based on the maturity profile of the above assets, £1,469 million (2012: £1,527 million) is regarded as current and £1,114 million (2012: £1,479 million) as non-current. No significant balances are past due or impaired.
F5: Provisions and accruals
£m
Year ended 31 December 2013Client
compensation
Liability for long-service
leave RestructuringProvision for
donations Other Total
Balance at beginning of the year 22 49 37 78 79 265 Unused amounts reversed (3) – (3) – (1) (7)Charge to profit or loss 2 25 13 – 1 41 Utilised during the year (9) (22) (13) – (6) (50)Foreign exchange and other movements 2 (11) (7) (9) 12 (13)
Balance at end of the year 14 41 27 69 85 236
£m
Year ended 31 December 2012 Restated1Client
compensation
Liability for long-service
leave RestructuringProvision for
donations Other Total
Balance at beginning of the year 43 47 37 78 62 267 Unused amounts reversed – – (1) – (4) (5)Charge to profit or loss 7 30 7 – 15 59 Utilised during the year (22) (26) (14) 7 (9) (64)Foreign exchange and other movements (6) (2) 8 (7) 15 8
Balance at end of the year 22 49 37 78 79 265
1 The prior year has been restated for the impact of changes in accounting policies. Refer to note J1 for further details.

Old Mutual plcAnnual Report and Accounts 2013
214
GROUP FINANCIAL STATEMENTSNOTES TO THE CONSOLIDATED FINANCIAL STATEMENTSFor the year ended 31 December 2013
F: Other statement of financial position notes continued
F5: Provisions and accruals continued
Provisions and accruals in relation to client compensation were £14 million (2012: £22 million), primarily relating to ongoing resolution of claims related to mis-selling of guarantee contracts in Old Mutual Wealth. £1 million (2012: £nil million) is estimated to be payable after more than one year.
The liability for long-service leave of £41 million (2012: £49 million) relates to staff payments for employees, the majority of which is estimated to be payable in less than one year. This liability has been calculated based on the number of days due to an employee and the compensation earned.
Provisions and accruals in relation to restructuring were £27 million (2012: £37 million), primarily in respect of ongoing restructuring of the Old Mutual Wealth business. The restructuring provision is expected to be utilised within the next three years.
The provision for donations is held by Emerging Markets in respect of commitments made by the South African business to the future funding of charitable donations. The funds were made available on the closure of the Group’s unclaimed shares trusts which were set up as part of the demutualisation in 1999 and closed in 2006. £69 million (2012: £78 million) is estimated to be payable after more than one year due to the long-term nature of the agreements in place.
Other provisions and accruals include provisions for long-term staff benefits and costs associated with legal and regulatory uncertainties.
Where material, provisions and accruals are discounted at discount rates specific to the risks inherent in the liability. The timing and final amounts of payments in respect of some of the provisions, particularly those in respect of litigation claims and similar actions against the Group, are uncertain and could result in adjustments to the amounts recorded. Of the total provisions recorded above, £195 million (2012: £129 million) is estimated to be payable after more than one year.
F6: Deferred revenue
£m
Long-term business Asset management Property & Casualty Total
Year ended 31 December 2013 2012 2013 2012 2013 2012 2013 2012
Balance at beginning of the year 586 590 93 102 10 9 689 701 Fees and commission income deferred 31 67 – 34 3 1 34 102 Amortisation (61) (64) (35) (41) – – (96) (105)Foreign exchange and other movements 4 (7) (1) (2) (2) – 1 (9)
Balance at end of the year 560 586 57 93 11 10 628 689
F7: Deferred tax assets and liabilities
Deferred income taxes are calculated on all temporary differences at the tax rate applicable to the jurisdiction in which the timing differences arise.
(a) Deferred tax assetsThe movement on the deferred tax assets account is as follows:
£m
Year ended 31 December 2013At beginning
of the year
Income statement
(charge)/ credit
Charged to equity
Acquisition/disposal of
subsidiaries
Foreign exchange and other
movementsAt end
of the year
Insurance funds – – – – – –Tax losses carried forward 121 (34) – – – 87 Accelerated capital allowances 1 1 – – – 2 Other temporary differences 317 1 – – (23) 295 Policyholders tax 68 14 – – (16) 66 Deferred fee income 153 (22) – – 3 134 Netted against liabilities (315) 17 – – 17 (281)
345 (23) – – (19) 303

215
Financials
£m
Year ended 31 December 2012 Restated1At beginning
of the year
Income statement (charge)/
creditCharged to equity
Acquisition/disposal of
subsidiaries1
Foreign exchange and other
movementsAt end
of the year
Insurance funds (1) 1 – – – –Tax losses carried forward 164 (31) – – (12) 121 Accelerated capital allowances 1 – – – – 1 Other temporary differences 129 25 2 1 160 317 Policyholders tax 61 14 – – (7) 68 Deferred fee income 166 (24) – – 11 153 Netted against liabilities (176) 16 (1) – (154) (315)
344 1 1 1 (2) 345
1 The prior period has been restated for the impact of changes in accounting policies. Refer to note J1 for further details.
Deferred tax assets are recognised for tax losses carried forward only to the extent that realisation of the related tax benefit is probable, being where on the basis of all available evidence it is considered more likely than not that there will be suitable taxable profits against which the reversal of the deferred tax asset can be deducted. The amounts for which no deferred tax asset has been recognised comprise:
£m
At 31 December 2013 At 31 December 2012
Gross amount Tax Gross amount Tax
Unrelieved tax lossesExpiring in less than a year 39 4 40 3 Expiring in the second to fifth years inclusive 172 11 160 11 Expiring after five years 2,127 377 1,515 323
2,338 392 1,715 337 Accelerated capital allowances 158 31 139 33 Other timing differences 489 103 612 103
2,985 526 2,466 473
(b) Deferred tax liabilitiesThe movement on the deferred tax liabilities account is as follows:
£m
Year ended 31 December 2013At beginning
of the year
Income statement
(credit)/ charge
Credited to equity
Acquisition/disposal of
subsidiaries
Foreign exchange and other
movementsAt end
of the year
Accelerated tax depreciation 43 13 – – (7) 49 Deferred acquisition costs 158 (12) – – 5 151 Leasing 1 – – – – 1 Present value of acquired in-force business 118 (21) – – 2 99 Other acquired intangibles 20 (9) – – 1 12 Available-for-sale securities 7 – (1) – – 6 Other temporary differences 212 (29) 18 – (49) 152 Capital gains tax 64 114 3 – 6 187 Fee income receivable 44 (11) – – 1 34 Policyholder tax 52 46 – – (17) 81 Netted against assets (315) 17 – – 17 (281)
404 108 20 – (41) 491

Old Mutual plcAnnual Report and Accounts 2013
216
GROUP FINANCIAL STATEMENTSNOTES TO THE CONSOLIDATED FINANCIAL STATEMENTSFor the year ended 31 December 2013
F: Other statement of financial position notes continued
F7: Deferred tax assets and liabilities continued
(b) Deferred tax liabilities continued£m
Year ended 31 December 2012 Restated1At beginning
of the year
Income statement
(credit)/ charge
Credited to equity
Acquisition/disposal of
subsidiaries1
Foreign exchange and other
movementsAt end
of the year
Accelerated tax depreciation 22 12 – – 9 43 Deferred acquisition costs 170 (21) – – 9 158 Leasing 37 (23) – – (13) 1 Present value of acquired in-force business 137 (38) – – 19 118 Other acquired intangibles 37 (11) – (6) – 20 Available-for-sale securities 3 – 4 – – 7 Other temporary differences 51 (12) 2 – 171 212 Capital gains tax 80 15 – – (31) 64 Fee income receivable 36 (7) – – 15 44 Policyholder tax 112 (54) – – (6) 52 Netted against assets (176) 16 (1) – (154) (315)
509 (123) 5 (6) 19 404
1 The prior year has been restated for the impact of changes in accounting policies. Refer to note J1 for further details.
As the Group is able to control the reversal of temporary differences in respect of investments in subsidiaries and branches and it is probable that these temporary differences will not reverse in the foreseeable future, there is no need to provide for the associated deferred tax liabilities. The aggregate amount of temporary differences on which further tax might be due if these temporary differences reversed is estimated at £2.7 billion (2012: £2.7 billion).
F8: Trade, other payables and other liabilities
£m
Note
At 31 December
2013
At 31 December
2012Restated1
Amounts payable on direct insurance businessFunds held under reinsurance business ceded 175 151 Amounts owed to policyholders 419 562 Amounts owed to intermediaries 61 89 Other direct insurance operation creditors 11 65
666 867 Accounts payable on reinsurance business 35 28 Accruals and deferred income 333 373 Post-employment benefits H1 64 92 Share-based payments – cash-settled scheme liabilities 91 56 Short trading securities, spot positions and other 256 456 Trade creditors 480 544 Outstanding settlements 642 583 Total securities sold under agreements to repurchase 204 146 Obligations in relation to collateral holdings 558 831 Other liabilities 945 964
4,274 4,940
1 The prior year has been restated for the impact of changes in accounting policies. Refer to note J1 for further details.
Included in the amounts shown above are £3,687 million (2012: £3,865 million) that are regarded as current, with the remainder regarded as non-current.

217
Financials
F9: Equity
(a) Share capital
£m
At 31 December
2013
At 31 December
2012
Issued ordinary shares of 113⁄ 7p (2012: 113⁄ 7p) 560 559
(b) Perpetual preferred callable securitiesIn addition to the Group’s senior and subordinated debt, the Group has issued two separate tranches of perpetual preferred callable securities with a total carrying value of £526 million at 31 December 2013 (2012: £682 million). In accordance with IFRS accounting standards these instruments are classified as equity and disclosed within equity shareholders’ funds.
£273 million (2012: £348 million) Tier 1 perpetual notes. These are unsecured and subordinated to the claims of senior creditors and the holders of any priority preference shares. For an initial period to 24 March 2020 interest is payable at a fixed rate of 6.4% per annum annually in arrears. From 24 March 2020, interest is reset semi-annually at 2.2% per annum above the sterling inter-bank offer rate for six month sterling deposits and is payable semi-annually in arrears. Coupon payments may be deferred at the Group’s discretion. The perpetual preferred callable securities are redeemable at the discretion of the Group at their principal amount from 24 March 2020. £350 million of these bonds were issued In November 2005 with £2 million repurchased in December 2012 via an open market repurchase and a further £75 million repurchased in November 2013 via a Modified Dutch Auction tender.
€374 million (£253 million) (2012: €495 million (£334 million) Upper Tier 2 perpetual notes. These are unsecured and subordinated to the claims of senior creditors and the holders of any priority preference shares. For an initial period to 4 November 2015 the notes pay interest at a fixed rate of 5.0% per annum annually in arrears. After this date the interest is reset semi-annually at 2.63% per annum above six month EURIBOR and is payable semi-annually in arrears. Coupon payments may be deferred at the Group’s discretion. The perpetual preferred callable securities are redeemable at the discretion of the Group at their principal amount from 4 November 2015. €500 million of these bonds were issued In November 2005 with €5 million repurchased in December 2012 via an open market repurchase and a further €121 million repurchased in November 2013 via a Modified Dutch Auction tender.
F10: Non-controlling interests
(a) Profit or loss(i) Ordinary sharesThe non-controlling interests share of profit for the financial year has been calculated on the basis of the Group’s effective ownership of the subsidiaries in which it does not own 100% of the ordinary equity. The principal subsidiaries where a non-controlling interest exists is the Group’s banking business in South Africa, Nedbank. For the year ended 31 December 2013 the non-controlling interests attributable to ordinary shares was £259 million (2012: £256 million).
(ii) Preferred securities
£m
At31 December
2013
At31 December
2012
NedbankR3,583 million non-cumulative preference shares 19 23
Group excluding Nedbank$750 million cumulative preferred securities1 – 27
Non-controlling interests – preferred securities 19 50
1 On 24 September 2012, the Group repaid the $750 million cumulative preference securities at their nominal value.

Old Mutual plcAnnual Report and Accounts 2013
218
GROUP FINANCIAL STATEMENTSNOTES TO THE CONSOLIDATED FINANCIAL STATEMENTSFor the year ended 31 December 2013
F: Other statement of financial position notes continued
F10: Non-controlling interests continued
(a) Profit or loss continued(iii) Non-controlling interests – adjusted operating profitThe following table reconciles non-controlling interests’ share of profit for the financial year to non-controlling interests’ share of adjusted operating profit:
£m
Reconciliation of non-controlling interests’ share of profit for the financial year
Year ended 31 December
2013
Year ended 31 December
2012Restated1
The non-controlling interests share is analysed as follows:Non-controlling interests – ordinary shares 259 256 Income attributable to Black Economic Empowerment trusts 20 25
Non-controlling interests’ share of adjusted operating profit 279 281
1 The prior year has been restated for the impact of changes in accounting policies. Refer to note J1 for further details.
The Group uses revised weighted average effective ownership interests when calculating the non-controllable interest applicable to the adjusted operating profit of its Southern African businesses. These reflect the legal ownership of the businesses following the implementation for Black Economic Empowerment (BEE) schemes in 2005. In accordance with IFRS accounting rules the shares issued for BEE purposes are deemed to be, in substance, options. Therefore the effective ownership interest of the minorities reflected in arriving at profit after tax in the consolidated income statement is lower than that applied in arriving at adjusted operating profit after tax. In 2013 the increase in adjusted operating profit attributable to non-controlling interests as a result of this was £20 million (2012: £25 million).
(b) Statement of financial position(i) Ordinary shares
£m
Reconciliation of movements in non-controlling interests
At 31 December
2013
At 31 December
2012Resated1
Balance at beginning of the year 1,684 1,652 Non-controlling interests’ share of profit 259 256 Non-controlling interests’ share of dividends paid (117) (119)Net disposal of interests 20 20 Foreign exchange and other movements (344) (125)
Balance at end of the year 1,502 1,684
1 The prior year has been restated for the impact of changes in accounting policies. Refer to note J1 for further details.
(ii) Preferred securities (net of Group holdings)
£m
At 31 December
2013
At 31 December
2012
NedbankR3,583 million non-cumulative preference shares1 265 273
Total in issue at 31 December 265 273
Preferred securities at 31 December 2013 are held at historic value of consideration received less unamortised issue costs and are stated net of securities held by Group companies.1 3,583 million R10 preference shares issued by Nedbank Limited (Nedbank), the Group’s banking subsidiary. These shares are non-redeemable and non-cumulative and pay a
cash dividend equivalent to 75% of the prime overdraft interest rate of Nedbank. Preference shareholders are only entitled to vote during periods when a dividend or any part of it remains unpaid after the due date for payment or when resolutions are proposed that directly affect any rights attaching to the shares or the rights of the holders. Preference shareholders will be entitled to receive their dividends in priority to any payment of dividends made in respect of any other class of Nedbank’s shares.
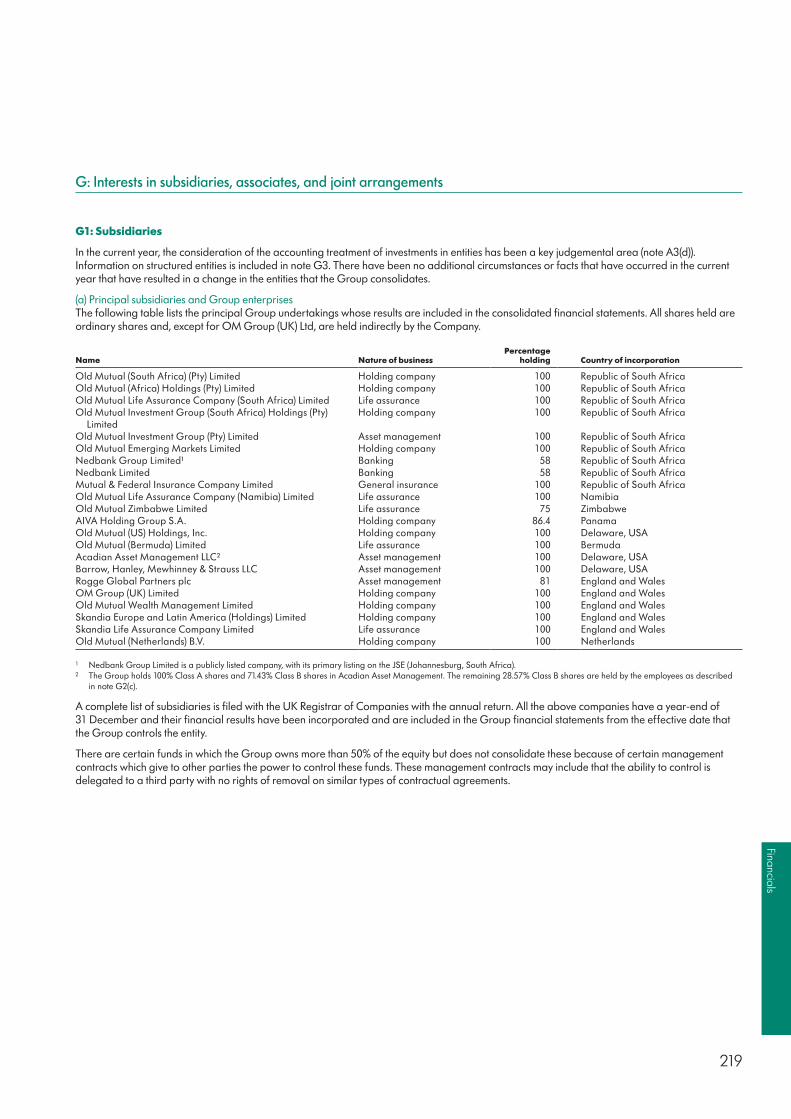
219
Financials
G: Interests in subsidiaries, associates, and joint arrangements
G1: Subsidiaries
In the current year, the consideration of the accounting treatment of investments in entities has been a key judgemental area (note A3(d)). Information on structured entities is included in note G3. There have been no additional circumstances or facts that have occurred in the current year that have resulted in a change in the entities that the Group consolidates.
(a) Principal subsidiaries and Group enterprisesThe following table lists the principal Group undertakings whose results are included in the consolidated financial statements. All shares held are ordinary shares and, except for OM Group (UK) Ltd, are held indirectly by the Company.
Name Nature of businessPercentage
holding Country of incorporation
Old Mutual (South Africa) (Pty) Limited Holding company 100 Republic of South AfricaOld Mutual (Africa) Holdings (Pty) Limited Holding company 100 Republic of South AfricaOld Mutual Life Assurance Company (South Africa) Limited Life assurance 100 Republic of South AfricaOld Mutual Investment Group (South Africa) Holdings (Pty)
LimitedHolding company 100 Republic of South Africa
Old Mutual Investment Group (Pty) Limited Asset management 100 Republic of South AfricaOld Mutual Emerging Markets Limited Holding company 100 Republic of South AfricaNedbank Group Limited¹ Banking 58 Republic of South AfricaNedbank Limited Banking 58 Republic of South AfricaMutual & Federal Insurance Company Limited General insurance 100 Republic of South AfricaOld Mutual Life Assurance Company (Namibia) Limited Life assurance 100 NamibiaOld Mutual Zimbabwe Limited Life assurance 75 ZimbabweAIVA Holding Group S.A. Holding company 86.4 PanamaOld Mutual (US) Holdings, Inc. Holding company 100 Delaware, USAOld Mutual (Bermuda) Limited Life assurance 100 BermudaAcadian Asset Management LLC² Asset management 100 Delaware, USABarrow, Hanley, Mewhinney & Strauss LLC Asset management 100 Delaware, USARogge Global Partners plc Asset management 81 England and WalesOM Group (UK) Limited Holding company 100 England and WalesOld Mutual Wealth Management Limited Holding company 100 England and WalesSkandia Europe and Latin America (Holdings) Limited Holding company 100 England and WalesSkandia Life Assurance Company Limited Life assurance 100 England and WalesOld Mutual (Netherlands) B.V. Holding company 100 Netherlands
1 Nedbank Group Limited is a publicly listed company, with its primary listing on the JSE (Johannesburg, South Africa).2 The Group holds 100% Class A shares and 71.43% Class B shares in Acadian Asset Management. The remaining 28.57% Class B shares are held by the employees as described
in note G2(c).
A complete list of subsidiaries is filed with the UK Registrar of Companies with the annual return. All the above companies have a year-end of 31 December and their financial results have been incorporated and are included in the Group financial statements from the effective date that the Group controls the entity.
There are certain funds in which the Group owns more than 50% of the equity but does not consolidate these because of certain management contracts which give to other parties the power to control these funds. These management contracts may include that the ability to control is delegated to a third party with no rights of removal on similar types of contractual agreements.
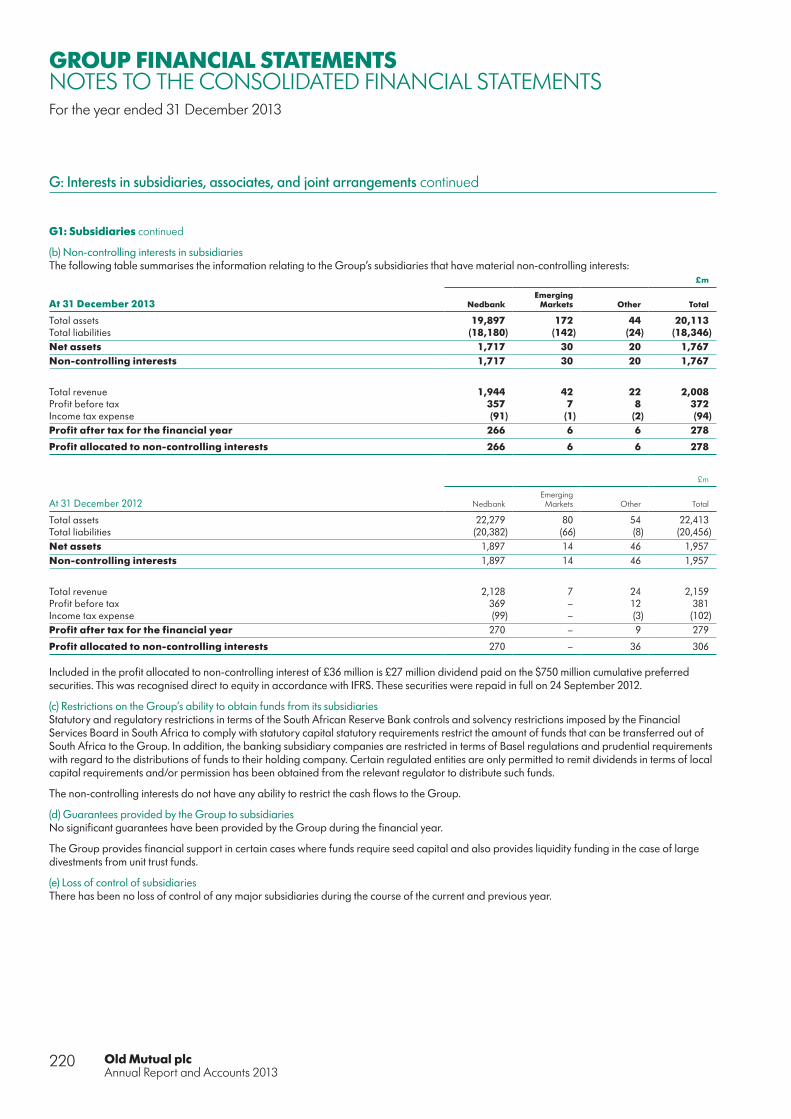
Old Mutual plcAnnual Report and Accounts 2013
220
GROUP FINANCIAL STATEMENTSNOTES TO THE CONSOLIDATED FINANCIAL STATEMENTSFor the year ended 31 December 2013
G: Interests in subsidiaries, associates, and joint arrangements continued
G1: Subsidiaries continued
(b) Non-controlling interests in subsidiariesThe following table summarises the information relating to the Group’s subsidiaries that have material non-controlling interests:
£m
At 31 December 2013 NedbankEmerging
Markets Other Total
Total assets 19,897 172 44 20,113 Total liabilities (18,180) (142) (24) (18,346)Net assets 1,717 30 20 1,767 Non-controlling interests 1,717 30 20 1,767
Total revenue 1,944 42 22 2,008 Profit before tax 357 7 8 372 Income tax expense (91) (1) (2) (94)Profit after tax for the financial year 266 6 6 278
Profit allocated to non-controlling interests 266 6 6 278
£m
At 31 December 2012 NedbankEmerging
Markets Other Total
Total assets 22,279 80 54 22,413 Total liabilities (20,382) (66) (8) (20,456)Net assets 1,897 14 46 1,957 Non-controlling interests 1,897 14 46 1,957
Total revenue 2,128 7 24 2,159 Profit before tax 369 – 12 381 Income tax expense (99) – (3) (102)Profit after tax for the financial year 270 – 9 279
Profit allocated to non-controlling interests 270 – 36 306
Included in the profit allocated to non-controlling interest of £36 million is £27 million dividend paid on the $750 million cumulative preferred securities. This was recognised direct to equity in accordance with IFRS. These securities were repaid in full on 24 September 2012.
(c) Restrictions on the Group’s ability to obtain funds from its subsidiariesStatutory and regulatory restrictions in terms of the South African Reserve Bank controls and solvency restrictions imposed by the Financial Services Board in South Africa to comply with statutory capital statutory requirements restrict the amount of funds that can be transferred out of South Africa to the Group. In addition, the banking subsidiary companies are restricted in terms of Basel regulations and prudential requirements with regard to the distributions of funds to their holding company. Certain regulated entities are only permitted to remit dividends in terms of local capital requirements and/or permission has been obtained from the relevant regulator to distribute such funds.
The non-controlling interests do not have any ability to restrict the cash flows to the Group.
(d) Guarantees provided by the Group to subsidiaries No significant guarantees have been provided by the Group during the financial year.
The Group provides financial support in certain cases where funds require seed capital and also provides liquidity funding in the case of large divestments from unit trust funds.
(e) Loss of control of subsidiaries There has been no loss of control of any major subsidiaries during the course of the current and previous year.

221
Financials
G2: Investments in associated undertakings and joint ventures
(a) Investments in associated undertakings and joint venturesThe Group’s investments in associated undertakings and joint ventures accounted for under the equity and fair value method are as follows:
£m
At 31 December 2013 Type of BusinessPercentage
interest held Carrying valueGroup share of
profit/(loss)Basis of
accounting
Masingita Property Investment Holdings (Pty) Ltd (A)1 Property development 35% 5 – Fair valueS.B.V. Services (Pty) Ltd (A)1 Financial services 23% 5 1 Equity methodSouth African Bankers Services Company (A)1 Financial services 25% 7 1 Equity methodOdyssey Developments (Pty) Ltd (A)1 Property development 49% 5 – Fair valueOld Mutual Finance (Pty) Ltd (J)1 Lending 50% 21 9 Equity methodCuro Fund Services (J)1 Asset Management 50% 6 – Equity methodAfrican Infrastructure Investment Managers (Pty) Ltd (J)1 Asset Management 50% 2 (4) Equity methodHeitman LLC (J)2 Asset Management 50% 17 3 Equity methodKotak Mahindra Old Mutual Life Insurance Ltd (A)3 Life Insurance 26% 34 8 Equity methodOld Mutual-Guodian Life Insurance Company Ltd (J)4 Life Insurance 50% 28 (6) Equity methodAll other associated undertakings 38 9
168 21
£m
At 31 December 2012 Restated5 Type of BusinessPercentage
interest held Carrying valueGroup share of
profit/(loss)Basis of
accounting
Billion Property Developments (Pty) Ltd (A)1 Property development 20% 10 – Fair valueOdyssey Developments (Pty) Ltd (A)1 Property development 49% 7 – Fair valueOld Mutual Finance (Pty) Ltd (J)1 Lending 50% 14 8 Equity methodCuro Fund Services (J)1 Asset Management 50% 8 3 Equity methodAfrican Infrastructure Investment Managers (Pty) Ltd (J)1 Asset Management 50% 6 6 Equity methodHeitman LLC (J)2 Asset Management 50% 15 8 Equity methodKotak Mahindra Old Mutual Life Insurance Ltd (A)3 Life Insurance 26% 26 5 Equity methodOld Mutual-Guodian Life Insurance Company Ltd (J)4 Life Insurance 50% 18 (5) Equity methodAll other associated undertakings 48 7
152 32
Key: (J) – joint arrangements; (A) – associate investmentCountry of operation:1 Republic of South Africa2 USA3 India4 China5 The prior year has been restated for the impact of changes in accounting policies. Refer to note J1 for further details.
All of the joint ventures are strategic in the Group’s underlying operating model.
(b) Aggregate financial information of investments in associated undertakings and joint venturesThe aggregate financial information for all investments in associated undertakings and joint ventures is as follows:
£m
Year ended 31 December
2013
Year ended 31 December
2012 Restated¹
Total assets 2,803 2,116 Total liabilities (2,412) (1,882)Total revenues 798 524 Net profit after tax 21 32
1 The prior year has been restated for the impact of changes in accounting policies. Refer to note J1 for further details.

Old Mutual plcAnnual Report and Accounts 2013
222
GROUP FINANCIAL STATEMENTSNOTES TO THE CONSOLIDATED FINANCIAL STATEMENTSFor the year ended 31 December 2013
G: Interests in subsidiaries, associates, and joint arrangements continued
G2: Investments in associated undertakings and joint ventures continued
(c) Aggregate Group investment in associated undertakings and joint venturesThe aggregate amounts for the Group’s investment in associated undertakings and joint ventures are as follows:
£m
Year ended 31 December
2013
Year ended 31 December
2012Restated1
Balance at beginning of the year 152 111 Net additions of investment in associated undertakings and joint ventures 61 28 Share of profit after tax 21 32 Dividends paid (13) (7)Foreign exchange and other movements (53) (12)
Balance at end of the year 168 152
The Group has no significant investments in which it owns less than 20% of the ordinary share capital that it accounts for using the equity method.1 The prior year has been restated for the impact of changes in accounting policies. Refer to note J1 for further details.
(d) Restriction on the Group’s ability to obtain funds from its associate undertakings and joint arrangementsStatutory and regulatory restrictions in terms of the South African Reserve Bank controls and solvency restrictions imposed by the Financial Service Board in South Africa to comply with statutory capital statutory requirements restrict the amount of funds that can be transferred out of the country to the Group. In addition, the banking subsidiary companies are restricted in terms of Basel regulations and prudential requirements with regard to the distributions of funds to their holding company. Certain regulated entities are only permitted to remit dividends in terms of local capital requirements and/or permission has been obtained from the relevant regulator to distribute such funds’.
No significant guarantees were provided were provided by the Group during the financial year.
(e) Contingent liabilities and commitmentsAt 31 December 2013 and 31 December 2012, the Group had no significant contingent liabilities or commitments relating to investments in associated undertakings and joint ventures.
(f) Other Group holdingsThe above does not include companies whereby the Group has a holding of more than 20%, but does not have significant influence over these companies by virtue of the Group not having any direct involvement in decision making or the other owners possessing veto rights.

223
Financials
G3: Structured entities
(a) Group’s involvement in structured entitiesThe table below summarises the types of structured entities in which the Group holds an interest:Type of structured entity Nature Purpose Interest held by the Group
■ Securitisation vehicles for loans and advances
■ Finance the Group’s own assets through the issue of notes to investors
■ Generate: — Funding for the Group’s
lending activities — Margin through sale of assets
to investors — Fees for loan servicing
■ Investment in senior notes issued by the vehicles
■ Investment funds ■ Manage client funds through the investment in assets
■ Generate fees from managing assets on behalf of third-party investors
■ Investments in units issued by the fund
■ Securitisation vehicles for third-party receivables
■ Finance third-party receivables and are financed through loans from third-party note holders and bank borrowing
■ Generate fees from arranging the structure. Interest income may be earned on the notes held by the Group
■ None
■ Security vehicles ■ Hold and realise assets as a result of the default of a client.
■ These entities seek to protect the collateral of the Group on the default of a loan
■ Interest will be in proportion of the lending
■ Clients investment entities ■ Hold client investment assets. ■ Generates various sources of income for the Group
■ None
■ Black Economic Empowerment (BEE) funding
■ Fund the acquisition of shares by a BEE partner
■ Generates interest on the funding provided
■ None
As at 31 December 2013, the Group held £47.5 million in investment funds which is included in investment and securities.
(b) Consolidation considerations for structured entitiesIn structured entities voting rights are not the predominant factor in deciding who controls the entity but rather the Group’s exposure to the variability of returns from these entities. The Group acts as fund manager to a number of investment funds. Determining whether the Group controls such an investment fund usually focuses on the assessment of decision making rights as fund manager, the investor’s rights to remove the fund manager and the aggregate economic interests of the Group in the fund in the form of interest held and exposure to variable returns.
In most instances the Group’s decision-making authority, in capacity as fund manager, with regard to these funds is regarded to be well-defined. Discretion is exercised when decisions regarding the relevant activities of these funds are being made. For funds managed by the Group where the investors have the right to remove the Group as fund manager without cause, the fees earned by the Group are considered to be market related. These agreements include only terms, conditions or amounts that are customarily present in arrangements for similar services and level of skills negotiated on an arm’s length basis. The Group has concluded that it acts as agent on behalf of the investors in all instances.
The Group is considered to be acting as principal where Old Mutual is the fund manager and is able to make the investment decisions on behalf of the unit holders earn a variable fee and there are no kick out rights that would remove the Group as fund manager.
This is considered to be a critical accounting judgment and is discussed in A3(d). There have been no changes in facts or circumstances which have changed the Group’s conclusion on the consolidation of funds.
The Group has not provided any non-contractual support to any consolidated or unconsolidated structured entities. The Group has committed to providing certain liquidity facilities for certain securitisation vehicles.
(c) Securitisation vehicles consolidated in the Group’s statement of financial positionNedbank SecuritisationsThe Group through Nedbank uses securitisation primarily as a funding diversification tool and to add flexibility in mitigating structural liquidity risk. Nedbank currently has three active securitisation transactions:
■ Synthesis Funding Limited (Synthesis), an asset- backed commercial paper (ABCP) programme launched in 2004 ■ GreenHouse Funding (Pty) Limited, Series 1 (GreenHouse), a residential mortgage-backed securitisation programme launched in December 2007 restructured in November 2012 and
■ Precinct Funding 1 (RF) Limited (Precinct), a commercial mortgage-backed securitisation programme launched in 2014.
These vehicles are the full extent of the Group’s current securitisation exposure.

Old Mutual plcAnnual Report and Accounts 2013
224
GROUP FINANCIAL STATEMENTSNOTES TO THE CONSOLIDATED FINANCIAL STATEMENTSFor the year ended 31 December 2013
G: Interests in subsidiaries, associates, and joint arrangements continued
G3: Structured entities continued
(c) Securitisation vehicles consolidated in the Group’s statement of financial position continuedThe following table shows the carrying amount of securitised assets, stated at the amount of the Group’s continuing involvement where appropriate, together with the associated liabilities, for each category of asset in the statement of financial position1:
Carrying amount of assets Associated liabilities
At 31 December 2013 2012 2013 2012
Loans and advances to customers Residential mortgage loans2 101 96 114 161 Commercial mortgage loans 112 – 146 –
Other financial assetsCorporate and bank paper 138 155 – –Other securities 154 189 – –Commercial paper – – 292 345
Total 505 440 552 506
This table presents the gross balances within the securitisation schemes and does not reflect any elimination of intercompany and cash balances held by the various securitisation vehicles.1 The value of any derivative instruments taken out to hedge any financial asset or liability is adjusted against such instrument in this disclosure.2 The balance at year ended 31 December 2013 represents residential mortgages ceded to GreenHouse. It excludes funds of approximately £46 million held in a warehouse facility
available for transfer once the remaining acquired residential mortgages have been ceded.

225
Financials
H: Other notes
H1: Post-employment benefits
The Group operates a number of pension schemes around the world. These schemes have been designed and are administered in accordance with local conditions and practices in the countries concerned and include both defined contribution and defined benefit schemes. The assets of these schemes are held in separate trustee-administered funds. Pension costs and contributions relating to defined benefit schemes are assessed in accordance with the advice of qualified actuaries. Actuarial advice confirms that the current level of contributions payable to each pension scheme, together with existing assets, are adequate to secure members’ benefits over the remaining service lives of participating employees. The schemes are reviewed at least on a triennial basis or in accordance with local practice and regulations. In the intervening years, the actuary reviews the continuing appropriateness of the assumptions applied. The actuarial assumptions used to calculate the projected benefit obligations of the Group’s pension schemes vary according to the economic conditions of the countries in which they operate.
(a) Liability for defined benefit obligations
£m
Pension plansRestated1
Other post-retirement benefit schemes
Restated1
Year ended 31 December 2013 2012 2013 2012
Changes in projected benefit obligationProjected benefit obligation at beginning of the year 567 546 221 245 Benefits earned during the year 5 5 6 7 Interest cost on benefit obligation 31 34 15 19 Measurement (gains)/losses (13) 41 (10) (23)Benefits paid (25) (25) (7) (8)Foreign exchange and other movements (75) (34) (36) (19)
Projected benefit obligation at end of the year 490 567 189 221
Change in plan assetsPlan assets at fair value at beginning of the year 606 594 173 178 Actual return on plan assets 78 67 18 17 Company contributions 8 9 – (1)Employee contributions 1 1 – –Benefits paid (25) (25) (7) (8)Foreign exchange and other movements (95) (40) (22) (13)
Plan assets at fair value at end of the year 573 606 162 173
Net asset/(liability) recognised in statement of financial positionFunded status of plan 83 39 (27) (48)Unrecognised assets (1) (7) – –
Net amount recognised in statement of financial position 82 32 (27) (48)
Disclosed as follows:– Within trade, other receivables and assets 97 59 22 17 – Within trade, other payables and other liabilities (15) (27) (49) (65)
82 32 (27) (48)
1 The prior year has been restated for the impact of changes in accounting policies. Refer to note J1 for further details.
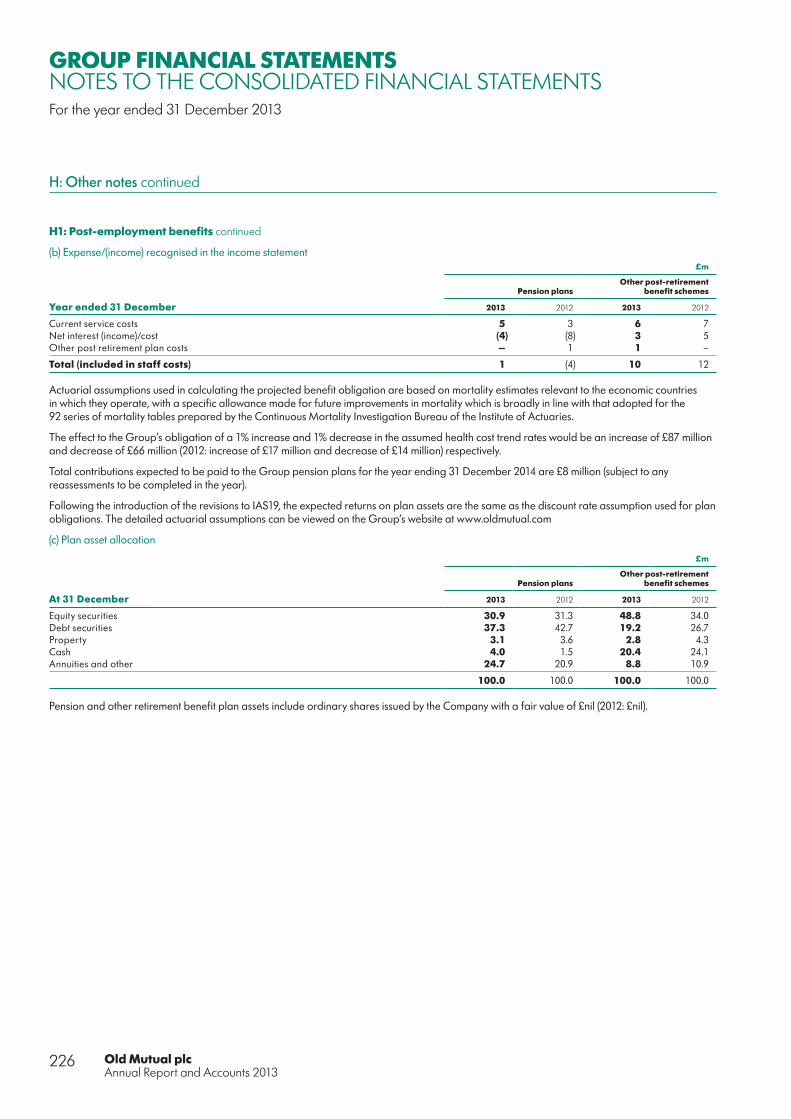
Old Mutual plcAnnual Report and Accounts 2013
226
GROUP FINANCIAL STATEMENTSNOTES TO THE CONSOLIDATED FINANCIAL STATEMENTSFor the year ended 31 December 2013
H: Other notes continued
H1: Post-employment benefits continued
(b) Expense/(income) recognised in the income statement£m
Pension plansOther post-retirement
benefit schemes
Year ended 31 December 2013 2012 2013 2012
Current service costs 5 3 6 7 Net interest (income)/cost (4) (8) 3 5 Other post retirement plan costs – 1 1 –
Total (included in staff costs) 1 (4) 10 12
Actuarial assumptions used in calculating the projected benefit obligation are based on mortality estimates relevant to the economic countries in which they operate, with a specific allowance made for future improvements in mortality which is broadly in line with that adopted for the 92 series of mortality tables prepared by the Continuous Mortality Investigation Bureau of the Institute of Actuaries.
The effect to the Group’s obligation of a 1% increase and 1% decrease in the assumed health cost trend rates would be an increase of £87 million and decrease of £66 million (2012: increase of £17 million and decrease of £14 million) respectively.
Total contributions expected to be paid to the Group pension plans for the year ending 31 December 2014 are £8 million (subject to any reassessments to be completed in the year).
Following the introduction of the revisions to IAS19, the expected returns on plan assets are the same as the discount rate assumption used for plan obligations. The detailed actuarial assumptions can be viewed on the Group’s website at www.oldmutual.com
(c) Plan asset allocation
£m
Pension plansOther post-retirement
benefit schemes
At 31 December 2013 2012 2013 2012
Equity securities 30.9 31.3 48.8 34.0 Debt securities 37.3 42.7 19.2 26.7 Property 3.1 3.6 2.8 4.3 Cash 4.0 1.5 20.4 24.1 Annuities and other 24.7 20.9 8.8 10.9
100.0 100.0 100.0 100.0
Pension and other retirement benefit plan assets include ordinary shares issued by the Company with a fair value of £nil (2012: £nil).

227
Financials
H2: Share-based payments
(a) Reconciliation of movements in options
During the year ended 31 December 2013, the Group had a number of share-based payment arrangements. The movement in the options outstanding under these arrangements during the year is detailed below:
Year ended 31 December 2013 Year ended 31 December 2012
Options over shares in Old Mutual plc (London Stock Exchange)Number of
options
Weighted average exercise
priceNumber of
options
Weighted average exercise
price
Outstanding at beginning of the year 18,131,593 £0.72 52,061,951 £0.53Granted during the year 1,602,254 £1.63 3,471,696 £1.28Forfeited during the year (757,309) £1.06 (212) £0.90Exercised during the year (4,558,629) £0.77 (35,910,754) £0.51Expired during the year (52,178) £1.08 (1,491,088) £0.62
Outstanding at end of the year 14,365,731 £0.79 18,131,593 £0.72
Exercisable at 31 December 1,534,854 £0.71 2,030,072 £0.57
The options outstanding at 31 December 2013 have an exercise price in the range of £0.35 to 1.63 (2012: £0.35 to £1.31) and a weighted average remaining contractual life of 0.5 years (2012: 0.8 years). The weighted average share price at date of exercise for options exercised during the year was £1.99 (2012: £1.54).
Year ended 31 December 2013 Year ended 31 December 2012
Options over shares in Old Mutual plc (Johannesburg Stock Exchange)Number of
options
Weighted average exercise
priceNumber of
options
Weighted average exercise
price
Outstanding at beginning of the year 33,951,884 R13.67 64,825,574 R11.30Forfeited during the year (853,157) R14.83 (2,730,167) R12.69Exercised during the year (13,410,557) R12.88 (25,955,199) R8.25Expired during the year (188,573) R9.57 (2,188,324) R9.12
Outstanding at end of the year 19,499,597 R14.14 33,951,884 R13.67
Exercisable at 31 December 6,031,192 R11.07 5,714,061 R8.17
The options outstanding at 31 December 2013 have an exercise price in the range of R7.45 to R15.80 (2012: R6.55 to R15.80) and a weighted average remaining contractual life of 2.9 years (2012: 3.6 years). The weighted average share price at date of exercise for options exercised during the year was R28.54 (2012: R19.70).
Year ended 31 December 2013 Year ended 31 December 2012
Options over shares in Nedbank Group LtdNumber of
options
Weighted average exercise
priceNumber of
options
Weighted average exercise
price
Outstanding at beginning of the year 12,842,067 R156.12 14,036,842 R149.94Granted during the year 125,291 R189.90 456,467 R167.15Forfeited during the year (312,208) R116.32 (402,035) R119.79Exercised during the year (1,018,097) R106.99 (1,097,859) R103.74Expired during the year (3,713) R110.98 (151,348) R95.35
Outstanding at end of the year 11,633,340 R161.64 12,842,067 R156.12
Exercisable at 31 December 347,913 R120.30 397,776 R124.99
The options outstanding at 31 December 2013 have an exercise price in the range of R113.93 to R282.58 (2012: R112.49 to R282.58) and a weighted average remaining contractual life of 2.1 years (2012: 3.0 years). The weighted average share price at date of exercise for options exercised during the year was R192.24 (2012: R175.65).
The fair value of services received in return for share options granted are measured by reference to the fair value of share options granted. The estimate of the fair value of share options granted is measured using a Black-Scholes option pricing model.
Share options are granted under a service and non-market based performance condition. Such conditions are not taken into account in the grant date fair value measurement of the share options granted. There are no market conditions associated with the share option grants.
The grant date for the UK and South African plan awards is deemed to be 1 January in the year prior to the date of issue. As such the Group is required to estimate, at the reporting date, the number and fair value of the options that will be granted in the following year. The fair value of awards expected to be granted in 2014, which will have an IFRS 2 grant date of 1 January 2013, is shown separately below. The grant date for all other awards is the award issue date.

Old Mutual plcAnnual Report and Accounts 2013
228
GROUP FINANCIAL STATEMENTSNOTES TO THE CONSOLIDATED FINANCIAL STATEMENTSFor the year ended 31 December 2013
H: Other notes continued
H2: Share-based payments continued
(c) Share-based payment arrangements relating to US Asset ManagementDuring the year ended 31 December 2013, US Asset Management had the following share-based payment arrangements:
Acadian Asset Management (AAM)Class B equity interests in AAM acquired by employees during 2007 entitled the participating employees to 28.57% of the earnings of AAM in excess of $120 million and to a liquidation preference proportionate to their shareholding. In consideration for the equity acquired, the participating employees agreed to forego a portion of existing long-term incentive payments owed. The difference between the carrying amount of this consideration and the fair value of the interest acquired was treated as share-based compensation expense in 2007. Fair value was determined based on the discounted projected future cash flows of AAM.
Effective 1 April 2011, certain terms of the plan were modified to provide for greater participation by Class B interest holders in Acadian’s profits and cash distributions. In addition, provisions were added to provide greater liquidity and transferability for the holders of Class B interests. The plan has since included a feature whereby participating employees may sell their equity back to OMAM based on a multiple of prior 12 month earnings above a Class A equity holders’ minimum preference amount, subject to certain restrictions. The surrender-date fair value of the Class B interests prior to these modifications amounted to $7.2 million and this amount was reclassified from non-controlling interests to cash-settled share-based payments liabilities as a result of the liquidity features added. The excess of the fair value of the modified award over its pre-modification fair value was $21.1 million and was accounted for as incremental cash-settled share-based payments compensation expense and liability. As the implementation of the modifications were subject to a two-year vesting period, the incremental cash-settled share-based payments compensation expense and subsequent revaluations of the liability each period to its fair value, along with the reclassification of the $7.2 million pre-modification fair value of the award from non-controlling interests as a liability, was recognized rateably over that period commencing 1 April 2011. The remaining $35.3 million of the initial fair value of the equity-settled plan that was surrendered by Class B interest holders was transferred to controlling interest equity at the conclusion of the vesting period.
IPO Incentive PlanDuring 2011, a stock-based compensation plan was implemented for certain key employees of US Asset Management in connection with the stated intention of exploring a potential initial public offering (IPO) of the business. The plan is designed to reward participants for achievement of strategic objectives and metrics and value creation over the period of exploring an initial public offering. The awards will consist of a mix of cash, payable in the first quarter of 2014, and a deferred award (in Old Mutual plc shares or shadow shares), which will be granted during the second quarter of 2014, and vest rateably over 3 years from that date. The awards are currently accounted for as a share-based payment liability, with an aggregate value of $6.8 million at 31 December 2013 (2012: $3.3 million). At grant date, any portion payable in forfeitable shares of Old Mutual plc will be reclassified to the share-based payments reserve. The expense recognised during 2013 in relation to this plan was $3.7 million (2012: $2.3 million), with $0.2 million paid out in relation to terminated participants.
OMAM Affiliate Equity PlansEquity granted during the year to employees of firms participating in the OMAM Affiliate Equity Plans vests three to five years from the date of grant, conditional upon continued employment over this period. Equity purchased vested immediately. Grant date fair value and fair value used for reassessment was determined based on a multiple of prior year earnings. Under the terms of the arrangements, participating employees may sell their equity back to Old Mutual (which acts as a buyer of last resort) at a fixed multiple of prior year earnings, subject to certain restrictions. Accordingly, the schemes are accounted for as cash-settled share-based payments, despite the fact the initial purchase and/or grants of equity are settled in equity instruments.
Instruments granted and purchased during the yearAffiliate share
purchasesAffiliate share
grants
Affiliate shares forfeited/
bought back
Totalnon-controlling
interest in affiliate
Percentage of affiliate equity 2013 0.03% 1.87% (0.50)% 1.40%2012 0.01% 1.97% (0.23)% 1.75%
Fair value of instruments¹ 2013 – $10.9m – –2012 – $11.5m – $11.5m
1 Represents fair value in excess of consideration granted for affiliate share purchases.
US Asset Management annual bonus awardsThe OMAM Affiliate Equity Plans are incorporated into annual bonus awards of employees at participating firms, which are to be settled partly in cash and partly in equity. The level of bonus is contingent upon current year financial and individual performance and therefore, the vesting period for bonus equity to be granted during 2014 in respect of the 2013 financial year has been determined to commence from 1 January 2013.
It is anticipated that instruments with a fair value of $15.0 million (2012: $11.1 million and 2011: $15.8 million) will be granted during 2014 to firms participating in the OMAM Affiliate Equity Plans based on 2013 financial performance.

229
Financials
(d) Forfeitable/Restricted share grants
The following summarises the fair value of forfeitable/restricted shares granted by the Group during the year:
Instruments granted and purchased during the year Number granted
Weighted average
fair value
Shares in Old Mutual plc (London Stock Exchange) 2013 9,933,597 £1.952012 12,351,453 £1.57
Shares in Old Mutual plc (Johannesburg Stock Exchange) 2013 16,585,998 R27.712012 22,703,982 R19.35
Shares in Nedbank Ltd 2013 4,206,027 R185.092012 4,467,742 R158.11
The share price at measurement date was used to determine the fair value of the restricted shares. Expected dividends were not incorporated into the measurement of fair value where the holder of the restricted share is entitled to dividends throughout the vesting period.
(e) Annual bonus awardsThe UK and South Africa Plan Awards give rise to annual bonus awards. The level of annual bonus awards is contingent upon the satisfactory completion of individual and company performance targets, measured over the financial year prior to the date the employees receive the award. The accounting grant date for the South African and UK annual bonus plans (other than the new joiner and newly qualified grants) has therefore been determined as 1 January in the year prior to the date of issue of the grants.
The Group anticipates awards under the South African scheme of 9,331,684 restricted shares (2012: 9,337,461). The restricted shares have been valued using a share price of R32.79 (2012: R24.49).
The Group estimate of the total fair value of the annual bonus expected to be paid in the form of options and forfeitable shares is outlined below. The fair value is determined by making an estimate of the level of bonus to be paid out following the attainment of personal and company performance conditions.
Year ended 31 December 2013 Year ended 31 December 2012
Total fair value, £m
Vestingperiod
Total fair value, £m
Vestingperiod
UK plans 13 4.2 years 15 4.2 years
(f) Financial impact
£m
Year ended 31 December
2013
Year ended 31 December
2012
Expense arising from equity-settled share and share-option plans 59 14 Expense arising from cash-settled share and share-option plans 40 64
99 78
Closing balance of liability for cash settled share awards 91 56

Old Mutual plcAnnual Report and Accounts 2013
230
GROUP FINANCIAL STATEMENTSNOTES TO THE CONSOLIDATED FINANCIAL STATEMENTSFor the year ended 31 December 2013
H: Other notes continued
H3: Related parties
The Group provides certain pension fund, insurance, banking and financial services to related parties. These are conducted on an arm’s length basis and are not material to the Group’s results.
(a) Transactions with key management personnel, remuneration and other compensationKey management personnel are those persons having authority and responsibility for planning, directing and controlling the activities of the Group, directly or indirectly, including any director (whether executive or otherwise) of the Group. Details of the compensation paid to the Board of directors as well as their shareholdings in the Company are disclosed in the Remuneration Report on pages 106 to 125.
(b) Key management personnel remuneration and other compensation
Year ended 31 December 2013 Year ended 31 December 2012
Number of personnel Value £000s
Number of personnel Value £000s
Directors’ fees 12 1,313 10 1,418 Remuneration 25,301 24,140
Cash remuneration 13 4,944 18 5,837 Short-term employee benefits 13 9,700 18 6,779 Long-term employee benefits 13 373 18 781 Share-based payments 11 10,284 13 10,743
26,614 25,558
Year ended 31 December 2013 Year ended 31 December 20121
Share optionsNumber of personnel
Number of options/shares
’000sNumber of personnel
Number of options/shares
‘000s
Outstanding at beginning of the year 6 1,770 11 11,482 Leavers 2 (178) – –New appointments 1 9 1 697 Granted during the year – 26 Exercised during the year (498) (8,340)Lapsed during the year – (2,095)
Outstanding at end of the year 5 1,103 6 1,770
Year ended 31 December 2013 Year ended 31 December 20121
Restricted sharesNumber of personnel
Number of options/shares
‘000sNumber of personnel
Number of options/shares
‘000s
Outstanding at beginning of the year 14 22,557 14 21,644 Leavers 5 (2,121) – –New appointments 1 576 4 2,041 Granted during the year 5,439 5,896 Exercised during the year (1,505) (1,398)Vested during the year (4,451) (4,617)Effect of share consolidation – (1,009)
Outstanding at end of the year 10 20,495 14 22,557
1 Certain share scheme information has been restated based on additional information received from key management personnel.
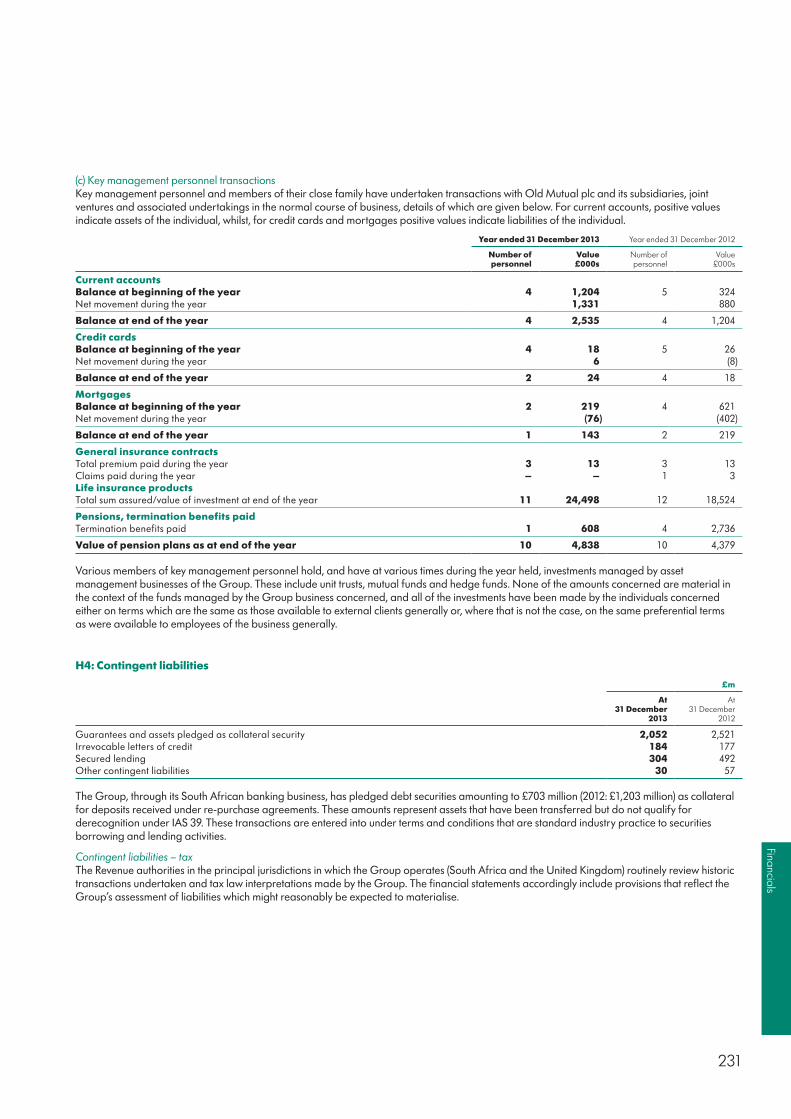
231
Financials
(c) Key management personnel transactionsKey management personnel and members of their close family have undertaken transactions with Old Mutual plc and its subsidiaries, joint ventures and associated undertakings in the normal course of business, details of which are given below. For current accounts, positive values indicate assets of the individual, whilst, for credit cards and mortgages positive values indicate liabilities of the individual.
Year ended 31 December 2013 Year ended 31 December 2012
Number of personnel
Value£000s
Number of personnel
Value£000s
Current accountsBalance at beginning of the year 4 1,204 5 324 Net movement during the year 1,331 880
Balance at end of the year 4 2,535 4 1,204
Credit cardsBalance at beginning of the year 4 18 5 26 Net movement during the year 6 (8)
Balance at end of the year 2 24 4 18
MortgagesBalance at beginning of the year 2 219 4 621 Net movement during the year (76) (402)
Balance at end of the year 1 143 2 219
General insurance contracts Total premium paid during the year 3 13 3 13 Claims paid during the year – – 1 3 Life insurance productsTotal sum assured/value of investment at end of the year 11 24,498 12 18,524
Pensions, termination benefits paid Termination benefits paid 1 608 4 2,736
Value of pension plans as at end of the year 10 4,838 10 4,379
Various members of key management personnel hold, and have at various times during the year held, investments managed by asset management businesses of the Group. These include unit trusts, mutual funds and hedge funds. None of the amounts concerned are material in the context of the funds managed by the Group business concerned, and all of the investments have been made by the individuals concerned either on terms which are the same as those available to external clients generally or, where that is not the case, on the same preferential terms as were available to employees of the business generally.
H4: Contingent liabilities
£m
At 31 December
2013
At 31 December
2012
Guarantees and assets pledged as collateral security 2,052 2,521 Irrevocable letters of credit 184 177 Secured lending 304 492 Other contingent liabilities 30 57
The Group, through its South African banking business, has pledged debt securities amounting to £703 million (2012: £1,203 million) as collateral for deposits received under re-purchase agreements. These amounts represent assets that have been transferred but do not qualify for derecognition under IAS 39. These transactions are entered into under terms and conditions that are standard industry practice to securities borrowing and lending activities.
Contingent liabilities – taxThe Revenue authorities in the principal jurisdictions in which the Group operates (South Africa and the United Kingdom) routinely review historic transactions undertaken and tax law interpretations made by the Group. The financial statements accordingly include provisions that reflect the Group’s assessment of liabilities which might reasonably be expected to materialise.

Old Mutual plcAnnual Report and Accounts 2013
232
GROUP FINANCIAL STATEMENTSNOTES TO THE CONSOLIDATED FINANCIAL STATEMENTSFor the year ended 31 December 2013
H: Other notes continued
H4: Contingent liabilities continued
Nedbank litigationThere are a number of legal or potential claims against Nedbank and its subsidiary companies, the outcome of which cannot at present be foreseen. As previously disclosed, the largest of these potential actions are claims in the High Court against Nedbank by certain shareholders in Pinnacle Point Group Ltd, alleging that Nedbank had a legal duty of care to them arising from a share swap transaction. In 2013, two of these claims of R147 million and of R802 million were dismissed by the North Gauteng High Court. The only claim remaining is for R355 million.
Originally these shareholders and others lodged proceedings with the Securities Regulation Panel (SRP) for an order declaring that an affected transaction took place. The SRP ruled that no affected transaction took place. The last remaining claimant brought an application to the South Gauteng High Court for the review of the SRP ruling. This application was dismissed with costs on 15 November 2013. The applicant filed a notice to apply for leave to appeal this judgment, which Nedbank will oppose.
During 2011, further actions were instituted against Nedbank Ltd by other stakeholders for R210 million and by Absa Bank Limited for R773 million. In both these actions Nedbank have filed exceptions against the claims.
Nedbank Ltd and its legal advisers remain of the opinion that the remaining claims are ambitious, and that the remaining claimants will have great difficulty succeeding.
Consumer protectionOld Mutual is committed to supporting its customers in meeting their lifetime goals and treating customers fairly is central to how our businesses operate. We routinely engage with customers and regulators to ensure that we meet this commitment, but there is the risk of regulatory intervention across various jurisdictions, giving rise to the potential for customer redress which can result in retrospective changes to policyholder benefits, penalties or fines. Where this occurs, the Group makes financial provision for the related costs.
H5: Commitments
Capital commitmentsThe Group’s capital commitments are detailed in the table below. The Group’s management is confident that future net revenues and funding will be sufficient to cover these commitments.
£m
At 31 December
2013
At 31 December
2012
Investment property 85 63 Property, plant and equipment 52 50
Commitments to extend credit to customersThe following table presents the contractual amounts of the Group’s financial instruments not included in the statement of financial position that commit it to extend credit to customers.
£m
At 31 December
2013
At 31 December
2012
Original term to maturity of one year or less 2,139 2,199 Original term to maturity of more than one year 1,413 1,569 Other commitments, note issuance facilities and revolving underwriting facilities 1,709 1,898
Assets are pledged as collateral under repurchase agreements with other banks and for security deposits relating to local futures, options and stock exchange memberships. Mandatory reserve deposits are also held with local Central Banks in accordance with statutory requirements. These deposits are not available to finance the Group’s day-to-day operations.
Commitments under the Group’s operating lease arrangements are described in note H6.
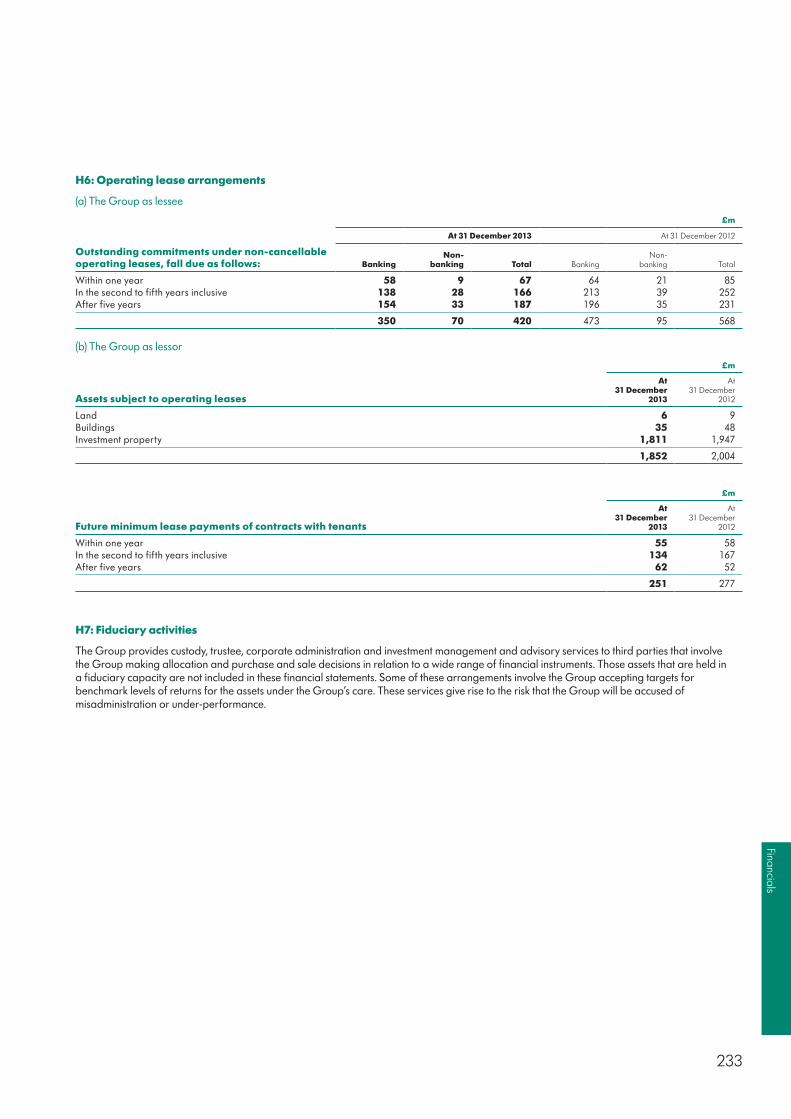
233
Financials
H6: Operating lease arrangements
(a) The Group as lessee
£m
At 31 December 2013 At 31 December 2012
Outstanding commitments under non-cancellable operating leases, fall due as follows: Banking
Non- banking Total Banking
Non- banking Total
Within one year 58 9 67 64 21 85 In the second to fifth years inclusive 138 28 166 213 39 252 After five years 154 33 187 196 35 231
350 70 420 473 95 568
(b) The Group as lessor
£m
Assets subject to operating leases
At 31 December
2013
At 31 December
2012
Land 6 9 Buildings 35 48 Investment property 1,811 1,947
1,852 2,004
£m
Future minimum lease payments of contracts with tenants
At 31 December
2013
At 31 December
2012
Within one year 55 58 In the second to fifth years inclusive 134 167 After five years 62 52
251 277
H7: Fiduciary activities
The Group provides custody, trustee, corporate administration and investment management and advisory services to third parties that involve the Group making allocation and purchase and sale decisions in relation to a wide range of financial instruments. Those assets that are held in a fiduciary capacity are not included in these financial statements. Some of these arrangements involve the Group accepting targets for benchmark levels of returns for the assets under the Group’s care. These services give rise to the risk that the Group will be accused of misadministration or under-performance.
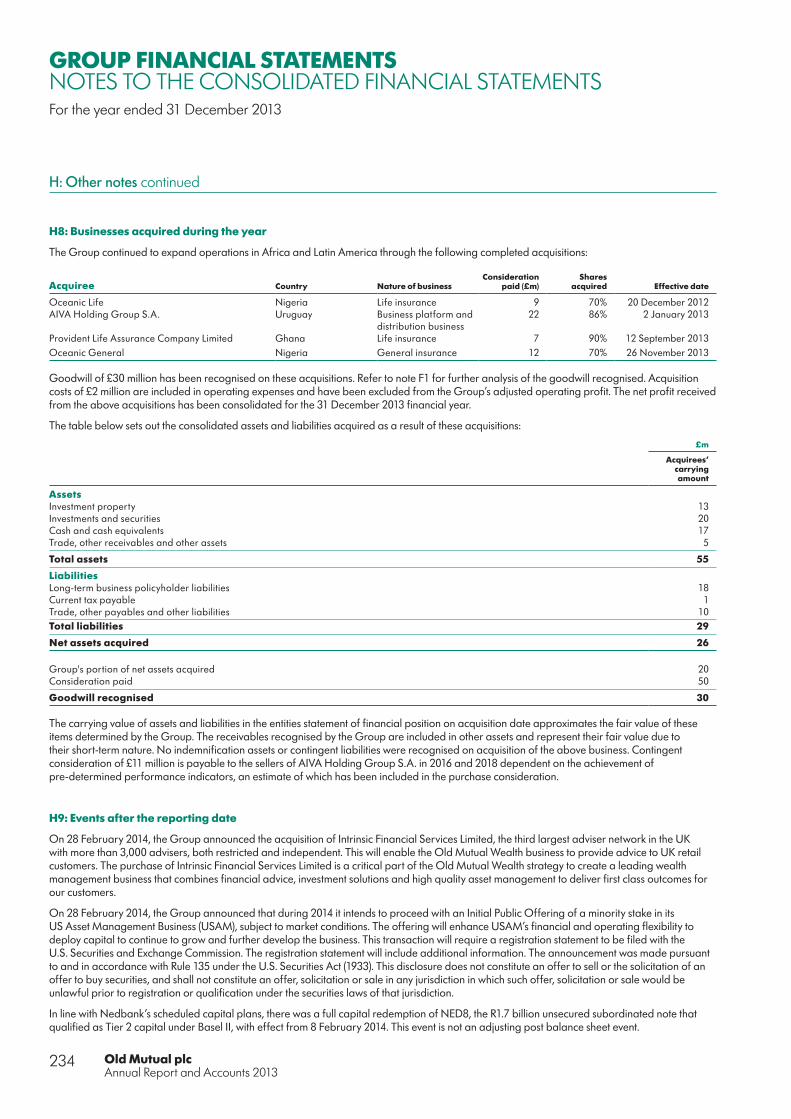
Old Mutual plcAnnual Report and Accounts 2013
234
GROUP FINANCIAL STATEMENTSNOTES TO THE CONSOLIDATED FINANCIAL STATEMENTSFor the year ended 31 December 2013
H: Other notes continued
H8: Businesses acquired during the year
The Group continued to expand operations in Africa and Latin America through the following completed acquisitions:
Acquiree Country Nature of businessConsideration
paid (£m)Shares
acquired Effective date
Oceanic Life Nigeria Life insurance 9 70% 20 December 2012AIVA Holding Group S.A. Uruguay Business platform and
distribution business22 86% 2 January 2013
Provident Life Assurance Company Limited Ghana Life insurance 7 90% 12 September 2013Oceanic General Nigeria General insurance 12 70% 26 November 2013
Goodwill of £30 million has been recognised on these acquisitions. Refer to note F1 for further analysis of the goodwill recognised. Acquisition costs of £2 million are included in operating expenses and have been excluded from the Group’s adjusted operating profit. The net profit received from the above acquisitions has been consolidated for the 31 December 2013 financial year.
The table below sets out the consolidated assets and liabilities acquired as a result of these acquisitions:
£m
Acquirees’ carrying amount
AssetsInvestment property 13 Investments and securities 20 Cash and cash equivalents 17 Trade, other receivables and other assets 5
Total assets 55
LiabilitiesLong-term business policyholder liabilities 18 Current tax payable 1 Trade, other payables and other liabilities 10 Total liabilities 29
Net assets acquired 26
Group's portion of net assets acquired 20 Consideration paid 50
Goodwill recognised 30
The carrying value of assets and liabilities in the entities statement of financial position on acquisition date approximates the fair value of these items determined by the Group. The receivables recognised by the Group are included in other assets and represent their fair value due to their short-term nature. No indemnification assets or contingent liabilities were recognised on acquisition of the above business. Contingent consideration of £11 million is payable to the sellers of AIVA Holding Group S.A. in 2016 and 2018 dependent on the achievement of pre-determined performance indicators, an estimate of which has been included in the purchase consideration.
H9: Events after the reporting date
On 28 February 2014, the Group announced the acquisition of Intrinsic Financial Services Limited, the third largest adviser network in the UK with more than 3,000 advisers, both restricted and independent. This will enable the Old Mutual Wealth business to provide advice to UK retail customers. The purchase of Intrinsic Financial Services Limited is a critical part of the Old Mutual Wealth strategy to create a leading wealth management business that combines financial advice, investment solutions and high quality asset management to deliver first class outcomes for our customers.
On 28 February 2014, the Group announced that during 2014 it intends to proceed with an Initial Public Offering of a minority stake in its US Asset Management Business (USAM), subject to market conditions. The offering will enhance USAM’s financial and operating flexibility to deploy capital to continue to grow and further develop the business. This transaction will require a registration statement to be filed with the U.S. Securities and Exchange Commission. The registration statement will include additional information. The announcement was made pursuant to and in accordance with Rule 135 under the U.S. Securities Act (1933). This disclosure does not constitute an offer to sell or the solicitation of an offer to buy securities, and shall not constitute an offer, solicitation or sale in any jurisdiction in which such offer, solicitation or sale would be unlawful prior to registration or qualification under the securities laws of that jurisdiction.
In line with Nedbank’s scheduled capital plans, there was a full capital redemption of NED8, the R1.7 billion unsecured subordinated note that qualified as Tier 2 capital under Basel II, with effect from 8 February 2014. This event is not an adjusting post balance sheet event.

235
Financials
I: Discontinued operations and disposal groups held for sale
I1: Discontinued operations
Discontinued operations relate to the results of the Group’s Swedish, Danish and Norwegian life businesses, collectively Nordic. The disposal of Nordic was completed on 21 March 2012 following shareholder and regulatory approval and was reported up until that date. The Group continues to incur costs that are directly related to the sale of Nordic. These costs relate to the transition of IT and other services, previously provided by Nordic to the wider Group, back to the Group. These costs are included in the expenses related to the discontinued operations. The profit on disposal of discontinued operations for the year ending 31 December 2013 was recognised following the finalisation of the transfer of Old Mutual Guodian Life Assurance Company Ltd, the Group’s Chinese joint venture, from Nordic to Old Mutual Life Assurance Company (South Africa) Limited. This transaction was included in the Nordic sale agreement and was subject to regulatory approval which was obtained in June 2013.
(a) Income statement from discontinued operations (Nordic)
£m
Year ended 31 December
2013
Year ended 31 December
2012
Revenue – 842 Expenses (26) (866)
Loss before tax from discontinued operations – trading activities (26) (24)Profit on disposal 27 239 Realised available-for-sale investment gains and exchange differences on disposal – 350
Profit before tax from discontinued operations 1 565 Income tax credit/(charge) 2 (1)
Profit after tax from discontinued operations 3 564
(b) Statement of comprehensive income from discontinued operations (Nordic)
£m
Year ended 31 December
2013
Year ended 31 December
2012
Profit from discontinued operations after tax 3 564 Other comprehensive income for the financial yearFair value gains – 4 Exchange differences realised on disposal – (350)Currency translation differences/exchange differences on translating foreign operations – 2 Other movements – (3)Aggregate tax on transfers from equity – (1)
Total other comprehensive loss from discontinued operations – (348)
Total comprehensive income for the financial year from discontinued operations 3 216
Attributable toEquity holders of the parent 3 216
(c) Net cash flows from discontinued operations (Nordic)
£m
Year ended 31 December
2013
Year ended 31 December
2012
Operating activities – (8)Investing activities – (121)
Net cash flows from discontinued operations – (129)

Old Mutual plcAnnual Report and Accounts 2013
236
GROUP FINANCIAL STATEMENTSNOTES TO THE CONSOLIDATED FINANCIAL STATEMENTSFor the year ended 31 December 2013
I: Discontinued operations and disposal groups held for sale continued
I2: Contingent liabilities in respect of the disposal of US Life
Following its disposal in April 2011 of US Life to the Harbinger Group (Harbinger), the Group has retained certain residual commitments and contingent liabilities relating to that business. These arise from sale warranties and indemnities that are typical in transactions of this nature, including in respect of certain litigation (including class actions) and regulatory enforcement actions arising from events that occurred before completion of the sale. The residual commitments are in effect for varying periods of time.
The sale agreement contemplated that Harbinger would establish certain internal reinsurance arrangements after completion, which were subject to regulatory approval. If such regulatory approval was not forthcoming, there was potential for a reduction in the purchase price of US Life of up to a maximum of $50 million. In July 2012, Harbinger filed a lawsuit against the Group, claiming payment of a purchase price adjustment of $50 million. The Group has filed its defence and is vigorously defending this claim. In view of the ongoing uncertainty and the Group’s current assessment of this claim, the Group has not raised a provision against this exposure.
J: Changes in accounting policies
J1: Accounting policies adopted for the year ended 31 December 2013
Several new accounting standards are applicable to the Group for the year ended 31 December 2013, with restatement of the comparative information for the year ended 31 December 2012 and of the opening statement of financial position as at 1 January 2012, as required.
The standards that were relevant and have required restatement include IAS 1 ‘Presentation of Financial Statements’, IAS 19 (Revised 2011) ‘Employee Benefits’, IFRS 10 ‘Consolidated Financial Statements’ and IFRS 11 ‘Joint Arrangements’.
Three other standards and amendments have also been applied for the first time in 2013 but these are disclosure standards and have not required a restatement of the statement of financial position. These include IFRS 7 ‘Financial Instruments: Disclosures (Amended 2011), IFRS 12 ‘Disclosure of Interest in Other Entities’ and IFRS 13 ‘Fair Value Measurement’ and IAS 36 (Amended) ‘Impairment of Assets’. Refer to note A5 for further information.
IFRS 11 ‘Joint Arrangements’ replaces IAS 31 ‘Interests in Joint Ventures’ and SIC-13 ‘Jointly Controlled Entities’ and removes the option to account for joint arrangements using proportionate consolidation. Jointly controlled entities that meet the definition of a joint arrangement under IFRS 11 ‘Joint Arrangements’ must now be accounted for using the equity method. This did not have a material impact on the Group’s statement of financial position.
The following standards adopted by the Group had an impact on the financial statements:
Amendments to IAS 1 ‘Presentation of Items of Other Comprehensive Income’The amendments to IAS 1 ’Presentation of Items of Other Comprehensive Income’ require that an entity present separately the items of other comprehensive income (OCI) that may be reclassified to profit or loss in the future, from those that will never be reclassified to profit or loss. The amendment affected presentation only and had no impact on the shareholders’ equity or profit.
IAS 19 ‘Employee Benefits’ (Revised 2011)The Group has adopted IAS 19 ‘Employee Benefits’ (Revised 2011) with a date of initial application of 1 January 2013.
The key amendments are:
■ The corridor method has been removed and all actuarial gains and losses are required to be recognised in OCI rather than in profit or loss. Expected returns on plan assets are no longer recognised in profit or loss. Instead, interest is recognised on the net defined benefit liability or asset in profit or loss, calculated using the discount rate used to measure the defined benefit obligation
■ Past service costs arising from plan amendments or curtailment are now recognised in profit or loss at the earlier of when the amendment occurs or when the related restructuring or termination cost is recognised. The option to amortise such cost over future years has also been eliminated
■ Administration costs, other than costs of managing plan assets, are recognised in the profit and loss when the service is provided.
The change in accounting policy has been applied retrospectively and, as a result, the comparative information for the year ended 31 December 2012 has been restated accordingly.
The major impact of the adoption of the standard was an increase in operating and administrative expenses and a net increase in OCI. The overall impact on the Group was a decrease in equity, an increase in the assets and an increase in the liabilities of the Group. The standard affects the accounting for certain defined pension schemes in Emerging Markets, Nedbank and Old Mutual plc.
The transitional adjustment, applied to the opening statement of financial position as at 1 January 2013, had an effect of decreasing equity by £17 million, increasing total assets by £81 million and increasing total liabilities by £98 million.
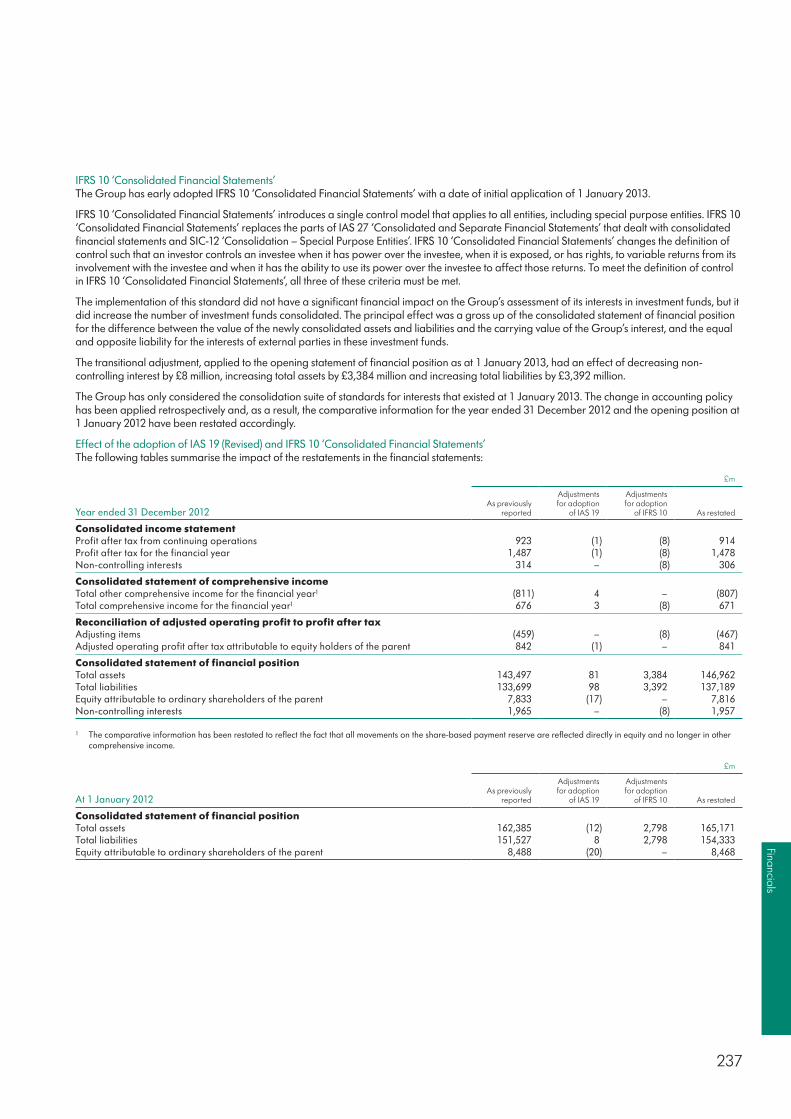
237
Financials
IFRS 10 ‘Consolidated Financial Statements’The Group has early adopted IFRS 10 ‘Consolidated Financial Statements’ with a date of initial application of 1 January 2013.
IFRS 10 ‘Consolidated Financial Statements’ introduces a single control model that applies to all entities, including special purpose entities. IFRS 10 ‘Consolidated Financial Statements’ replaces the parts of IAS 27 ‘Consolidated and Separate Financial Statements’ that dealt with consolidated financial statements and SIC-12 ‘Consolidation – Special Purpose Entities’. IFRS 10 ‘Consolidated Financial Statements’ changes the definition of control such that an investor controls an investee when it has power over the investee, when it is exposed, or has rights, to variable returns from its involvement with the investee and when it has the ability to use its power over the investee to affect those returns. To meet the definition of control in IFRS 10 ‘Consolidated Financial Statements’, all three of these criteria must be met.
The implementation of this standard did not have a significant financial impact on the Group’s assessment of its interests in investment funds, but it did increase the number of investment funds consolidated. The principal effect was a gross up of the consolidated statement of financial position for the difference between the value of the newly consolidated assets and liabilities and the carrying value of the Group’s interest, and the equal and opposite liability for the interests of external parties in these investment funds.
The transitional adjustment, applied to the opening statement of financial position as at 1 January 2013, had an effect of decreasing non-controlling interest by £8 million, increasing total assets by £3,384 million and increasing total liabilities by £3,392 million.
The Group has only considered the consolidation suite of standards for interests that existed at 1 January 2013. The change in accounting policy has been applied retrospectively and, as a result, the comparative information for the year ended 31 December 2012 and the opening position at 1 January 2012 have been restated accordingly.
Effect of the adoption of IAS 19 (Revised) and IFRS 10 ‘Consolidated Financial Statements’The following tables summarise the impact of the restatements in the financial statements:
£m
Year ended 31 December 2012As previously
reported
Adjustments for adoption
of IAS 19
Adjustments for adoption
of IFRS 10 As restated
Consolidated income statementProfit after tax from continuing operations 923 (1) (8) 914 Profit after tax for the financial year 1,487 (1) (8) 1,478 Non-controlling interests 314 – (8) 306
Consolidated statement of comprehensive incomeTotal other comprehensive income for the financial year1 (811) 4 – (807)Total comprehensive income for the financial year1 676 3 (8) 671
Reconciliation of adjusted operating profit to profit after taxAdjusting items (459) – (8) (467)Adjusted operating profit after tax attributable to equity holders of the parent 842 (1) – 841
Consolidated statement of financial positionTotal assets 143,497 81 3,384 146,962 Total liabilities 133,699 98 3,392 137,189 Equity attributable to ordinary shareholders of the parent 7,833 (17) – 7,816 Non-controlling interests 1,965 – (8) 1,957
1 The comparative information has been restated to reflect the fact that all movements on the share-based payment reserve are reflected directly in equity and no longer in other comprehensive income.
£m
At 1 January 2012As previously
reported
Adjustments for adoption
of IAS 19
Adjustments for adoption
of IFRS 10 As restated
Consolidated statement of financial positionTotal assets 162,385 (12) 2,798 165,171 Total liabilities 151,527 8 2,798 154,333 Equity attributable to ordinary shareholders of the parent 8,488 (20) – 8,468

Old Mutual plcAnnual Report and Accounts 2013
238
£m
Notes
At 31 December
2013
Restated At
31 December 2012
AssetsInvestments in Group subsidiaries 8 5,760 8,151 Non-current assets held for sale 13 – 128 Investments and securities 10 153 167 Investments in associated undertakings and joint ventures 9 26 26 Trade, other receivables and other assets 4 4,263 2,235 Derivative financial instruments – assets 2 62 96 Cash and cash equivalents 391 313
Total assets 10,655 11,116
LiabilitiesBorrowed funds 3 643 659 Provisions 6 2 8 Trade, other payables and other liabilities 5 4,299 4,376 Derivative financial instruments – liabilities 2 – 8
Total liabilities 4,944 5,051
Net assets 5,711 6,065
EquityEquity attributable to equity holders of the parent 5,711 6,065
Total equity 5,711 6,065
The Company’s financial statements on pages 238 to 246 were approved by the Board of Directors on 28 February 2014.
Julian Roberts Philip Broadley Group Chief Executive Group Finance Director
FINANCIAL STATEMENTS OF THE COMPANYCOMPANY STATEMENT OF FINANCIAL POSITIONAt 31 December 2013

239
Financials
FINANCIAL STATEMENTS OF THE COMPANYCOMPANY STATEMENT OF CASH FLOWSFor the year ended 31 December 2013
£m
Notes
Year ended 31 December
2013
Year ended 31 December
2012
Profit before tax 15 454 Fair value movement on derivatives and borrowed funds 11 149 Foreign exchange movement on assets and liabilities (2) (11)
Non-cash movements in profit before tax 9 138 Other operating assets and liabilities 274 (236)
Changes in working capital 274 (236)
Net cash inflow from operating activities 298 356 Acquisition of interests in subsidiaries, associates and strategic investments – (515)Disposal of interests in subsidiaries, associates and joint ventures 158 2,084 Other investing cash flows 16 (162)
Net cash outflow from investing activities 174 1,407
External interest received 38 43 External interest paid (65) (89)Intercompany interest paid (149) (28)Dividends paid to:
Ordinary shareholders of the Company (162) (554)Equity minority interests and preferred shares (47) (42)
Net proceeds from issue of ordinary shares 11 33 Net purchase of treasury shares (14) (19)Other debt repaid (156) (640)Loan financing received from/(paid) to Group companies 150 (595)
Net cash inflow from financing activities (394) (1,891)
Net increase/(decrease) in cash and cash equivalents 78 (128)
Cash and cash equivalents at beginning of the period 313 441
Cash and cash equivalents at end of the year 391 313

Old Mutual plcAnnual Report and Accounts 2013
240
Millions £m
Year ended 31 December 2013
Number of shares
issued and fully paid
Share capital
Share premium
Other reserves
Retainedearnings1
Perpetual preferred
callable securities Total
Shareholders equity of the Company at beginning of the year 4,892 559 835 1,815 2,174 682 6,065
Profit for the year – – – – 15 47 62 Items that will not be reclassified subsequently
to profit and lossActuarial gain on defined benefit plan – – – – 3 – 3
Total comprehensive income for the year – – – – 18 47 65 Dividends for the year – – – – (209) (47) (256)Preferred securities purchased – – – – (35) (156) (191)Other movements in share capital and share-based
payment reserve 4 1 10 – – – 11 Fair value of equity settled share options – – – 17 – – 17
Shareholders equity of the Company at end of the year 4,896 560 845 1,832 1,948 526 5,711
Millions £m
Year ended 31 December 2012
Number of shares
issued and fully paid
Share capital
Share premium
Other Reserves
Retainedearnings1
Perpetual preferred
callable securities Total
Shareholders equity of the Company at beginning of the year 5,801 580 805 2,591 1,493 688 6,157
Impact of changes in accounting policies – – – – 1 – 1
Shareholders equity of the Company at beginning of the year – restated 5,801 580 805 2,591 1,494 688 6,158
Profit for the year – – – – 480 42 522
Total comprehensive income for the year – – – – 480 42 522 Dividends for the year – – – – (596) (42) (638)Merger reserve realised – – – (815) 815 – – Net purchase of treasury shares (239) (24) – 24 (19) – (19)Preferred securities purchased – – – – – (6) (6)Share consolidation (697) – – – – – – Other movements in share capital and share-based
payment reserve 27 3 30 – – – 33 Fair value of equity settled share options – – – 15 – – 15
Shareholders equity of the Company at end of the year 4,892 559 835 1,815 2,174 682 6,065
1 Included within retained earnings of £1,948 million (2012: £2,174 million) are distributable reserves of £1,928 million (2012: £2,137 million).
£m
Other reserves
At 31 December
2013
At 31 December
2012
Merger reserve 1,717 1,717 Share-based payment reserve 92 74 Cancellation of treasury shares 24 24
Attributable to equity holders of Company at end of the year 1,833 1,815
FINANCIAL STATEMENTS OF THE COMPANYCOMPANY STATEMENT OF CHANGES IN EQUITYFor the year ended 31 December 2013
241
Financials
1 Financial assets and liabilities
Company statement of financial positionThe Company is principally involved in the management of its investments in subsidiaries, with its risks considered to be consistent with those in the operations themselves. Full details of the financial risks are provided in the consolidated financial statements, note E1. The most important components of financial risk for the Company are interest rate risk, currency risk, liquidity risk and credit risk. These risks arise from open positions in interest rate, currency and equity products, all of which are exposed to general and specific market movements.
(a) Categories of financial instrumentsThe financial instruments of the Company consist of derivative assets and liabilities, both of which are treated as held-for-trading, other assets and cash and cash equivalents which are treated as loan and receivables, borrowed funds of which £531 million is designated as fair value through the income statement and £112 million at amortised cost (2012: £547 million and £112 million respectively) and other liabilities which are also measured at amortised cost. Of the financial assets and liabilities measured at fair value through the income statement, the hierarchy classification (as detailed in the Group financial statements, note E1(p)) of derivative assets and liabilities is level 2 and borrowed funds level 1.
(b) Capital risk managementOld Mutual plc is the holding company of the Group and is responsible for the raising and allocation of capital in line with the Group’s capital management policies set out in note E1 to the consolidated financial statements and for ensuring the operational funding and regulatory capital needs of the holding company and its subsidiaries are met at all times.
(c) Currency riskThe Company is exposed to effects of fluctuations in the prevailing foreign currency exchange rates on its financial position and cash flows through the impact that currency movements have on its derivatives. The principal foreign currency risk arises from the fact that the Company’s functional currency is GBP, whereas the functional currency of its principal operations is South African rand, US dollar and Euro. The exposure of the Group to currency risk is disclosed in the Group consolidated financial statements, note E1(s). The Company hedges some of this currency translation risk through currency swaps, currency borrowings and forward foreign exchange rate contracts. Exchange rate exposures are managed within approved policy parameters utilising forward exchange contracts and currency swap agreements. A 10% deterioration in the values of the major currencies the Company is exposed to in relation to GBP would result in a decrease in the Company’s equity holders’ funds of £63 million (2012: increase of £31 million).
(d) Credit riskThe Company is principally exposed to credit risk through its derivative asset positions, investment and securities, holdings of cash and cash equivalents and the ability of its subsidiaries to repay amounts due to the Company, which it holds to back shareholder liabilities. The exposure of the Group to credit risk is disclosed in the consolidated financial statements, note E2. Credit risk is managed by placing limits on exposures to any single counterparty, or groups of counterparties and to geographical and industry segments. Credit risk is monitored with reference to established credit rating agencies with limits placed on exposure to below investment grade holdings or the financial position of companies within the Group. Of the Company’s financial assets bearing credit risk, derivative assets, investments and securities, bonds and cash and cash equivalents are rated as investment grade (being AAA to BBB for Standard & Poor’s or an equivalent). The other financial assets bearing credit risk are not rated.
(e) Interest rate riskInterest rate risk is the risk that fluctuating interest rates will unfavourably affect the Company’s earnings and the value of its assets, liabilities and capital.
The Company employs currency and interest rate swap transactions to mitigate against the impact of changes in the fair values of its borrowed funds. Details of the arrangements in place are shown in the Group Financial Statements note E7 (Hedge accounting).
(f) Liquidity riskLiquidity risk is the risk that cash may not be available to pay obligations when due at a reasonable cost. Ultimate responsibility for liquidity risk management rests with the Board of Directors, which has built an appropriate liquidity risk management framework for the management of the Company’s short-, medium- and long-term funding and liquidity management requirements. The Company has net current assets of £429 million (2012: £460 million), all of which represent liabilities to other Group companies. The Company manages liquidity risk by maintaining adequate reserves, banking facilities and continuously monitoring forecast and actual cash flows of both the Company and its subsidiaries.
The key information reviewed by the Company’s executive directors and Executive Committee, together with the Capital Management Committee, is a detailed management report on the Company’s current and planned capital and liquidity position. Forecasts are updated regularly based on when new information is received, and as part of the annual business planning cycle. The Company’s liquidity and capital position and forecast is presented to the Company’s Board of Directors on a regular basis.
Further information on liquidity and the Company’s cash flows is contained in other sections of this Annual Report, for example the business review and Group Finance Director’s statement.
FINANCIAL STATEMENTS OF THE COMPANYNOTES TO THE COMPANY FINANCIAL STATEMENTSFor the year ended 31 December 2013
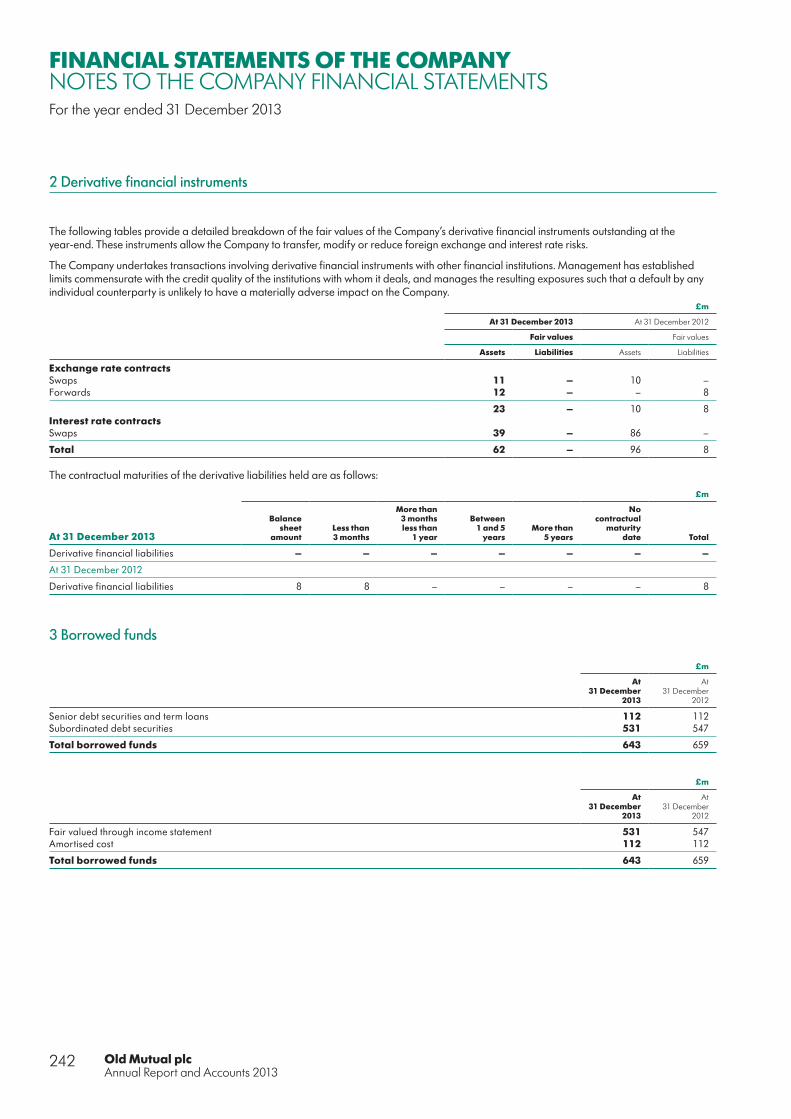
Old Mutual plcAnnual Report and Accounts 2013
242
FINANCIAL STATEMENTS OF THE COMPANYNOTES TO THE COMPANY FINANCIAL STATEMENTSFor the year ended 31 December 2013
2 Derivative financial instruments
The following tables provide a detailed breakdown of the fair values of the Company’s derivative financial instruments outstanding at the year-end. These instruments allow the Company to transfer, modify or reduce foreign exchange and interest rate risks.
The Company undertakes transactions involving derivative financial instruments with other financial institutions. Management has established limits commensurate with the credit quality of the institutions with whom it deals, and manages the resulting exposures such that a default by any individual counterparty is unlikely to have a materially adverse impact on the Company.
£m
At 31 December 2013 At 31 December 2012
Fair values Fair values
Assets Liabilities Assets Liabilities
Exchange rate contractsSwaps 11 – 10 –Forwards 12 – – 8
23 – 10 8 Interest rate contractsSwaps 39 – 86 –
Total 62 – 96 8
The contractual maturities of the derivative liabilities held are as follows:
£m
At 31 December 2013
Balance sheet
amountLess than 3 months
More than 3 monthsless than
1 year
Between1 and 5
yearsMore than
5 years
Nocontractual
maturitydate Total
Derivative financial liabilities – – – – – – –
At 31 December 2012
Derivative financial liabilities 8 8 – – – – 8
3 Borrowed funds
£m
At 31 December
2013
At 31 December
2012
Senior debt securities and term loans 112 112 Subordinated debt securities 531 547
Total borrowed funds 643 659
£m
At 31 December
2013
At 31 December
2012
Fair valued through income statement 531 547 Amortised cost 112 112
Total borrowed funds 643 659

243
Financials
The table below is a maturity analysis of liability cash flows based on contractual maturity dates for borrowed funds. Maturity analysis is undiscounted and based on year-end exchange rates. In addition to the contractual cash flows detailed below, the Company is obligated to make interest payments on borrowed funds, details of which are in the Group consolidated financial statements in note E9.
£m
At 31 December
2013
At 31 December
2012
Greater than 1 year and less than 5 years 112 112 Greater than 5 years 500 500
Borrowed funds 612 612
Additional details of these borrowings and undrawn facilities are included in Group consolidated financial statements in note E9.
4 Other assets
£m
At 31 December
2013
At 31 December
2012
Other receivables 12 27 Corporation tax receivable 3 7 Accrued interest and rent 3 4 Other prepayments and accrued income 3 4 Amounts owed by Group undertakings
Amounts falling due within one year 231 524 Amounts falling due after one year 4,011 1,669
Total other assets 4,263 2,235
5 Other liabilities
£m
At 31 December
2013
At 31 December
2012
Accruals and deferred income 19 20 Corporation Tax 15 –Amounts owed to Group undertakings:
Amounts falling due within one year 396 654 Amounts falling due after one year 3,869 3,702
Total other liabilities 4,299 4,376
6 Provisions
£m
Note
At 31 December
2013
At 31 December
2012Restated1
Post-employment benefits 7 2 8
Total provisions 2 8
1 The prior year has been restated for changes in accounting policies. Refer to note J1 in the Group consolidated financial statements for further information.

Old Mutual plcAnnual Report and Accounts 2013
244
FINANCIAL STATEMENTS OF THE COMPANYNOTES TO THE COMPANY FINANCIAL STATEMENTSFor the year ended 31 December 2013
7 Post-employment benefits
The Company holds a provision in respect of the Old Mutual Staff Pension Fund Defined Benefit pension scheme, which provides benefits based on final pensionable pay for members within the Group. The assets of the scheme are held in separate trustee administered funds. Pension costs and contributions relating to the scheme are assessed in accordance with the advice of qualified actuaries. Actuarial advice confirms that the current level of contributions payable to the scheme, together with existing assets, are adequate to secure members’ benefits over the remaining lives of participating employees. The scheme is reviewed on a triennial basis. In the intervening years the actuary reviews the continuing appropriateness of the assumptions applied. During the year two employees (2012: two) were directly employed by the Company. The costs for these directors and ex-directors are disclosed within the Remuneration Report on pages 106 to 125.
£m
Pension plans
Liability for defined benefit obligations
Year to31 December
2013
Restated Year to
31 December 2012
Change in projected benefit obligationProjected benefit obligation at beginning of the year 68 65 Interest cost on benefit obligation 3 3 Benefits paid (1) (1)Measurement (gains)/losses (2) 1
Projected benefit obligation at end of the year 68 68
Change in plan assetsPlan assets at fair value at beginning of the year 60 55 Actual return on plan assets 3 3 Benefits paid (1) (2)Company contributions 4 4
Plan assets at fair value at end of the year 66 60
Net liability recognised in balance sheetFunded status of plan 2 8 Net amount recognised in balance sheet 2 8
Expense recognised in the income statement (1) (1)
Actuarial assumptions used in calculating the projected benefit obligation are based on relevant mortality estimates, with a specific allowance made for future improvements in mortality which is broadly in line with that adopted for the 92 series of mortality tables prepared by the Continuous Mortality Investigation Bureau of the Institute of Actuaries. The expected returns on plan assets have been determined on the basis of long-term expectations, the carrying value of the assets and the market conditions at the balance sheet date specific to the relevant locations. The detailed actuarial assumptions can viewed on the Group’s website at www.oldmutual.com
%
Pension plans
Plan asset allocation
At31 December
2013
At31 December
2012
Equity securities 46 40 Debt Securities 52 58 Other investments 2 2

245
Financials
8 Principal subsidiaries
£m
At 31 December
2013
At 31 December
2012
Balance at beginning of the year 8,151 7,805 Acquisitions – 515 Additions 17 2,220 Disposal (2,370) (160)Impairments (39) (2,101)Transfer to non-current assets held for sale – (128)
Balance at end of the year 5,760 8,151
On 3 June 2013, the Company sold 978,597 shares in its investment in Old Mutual Wealth Management Limited to Old Mutual Wealth JSOP Trust No 1 for £11 million.
On 26 June 2013, the Company sold its entire investments in OMF (IOM) Limited and Old Mutual Holdings (Bahamas) Limited for £1,844 million and £515 million respectively to OM Group (UK) Limited.
During 2013, the Company impaired its investment in Skandia UK Limited and Old Mutual Reassurance (Ireland) Limited by £29 million and £10 million respectively.
Included within additions is the Company’s investment in subsidiary undertakings in respect of movements on the share based payments (£17 million).
The principal subsidiary undertakings of the Company are as follows:
At 31 December 2013Country of
incorporation Class of shares % interest held
OM Group (UK) Ltd England & Wales Ordinary 100 Old Mutual Wealth Management Ltd England & Wales Ordinary 100 Old Mutual Europe GMBH England & Wales Ordinary 100 Old Mutual PLC Brands AB Sweden Ordinary 100
A complete list of subsidiaries is filed with the UK Registrar of Companies with the annual return. All the above companies have a year-end of 31 December.
9 Investments in associated undertakings
The Company holds the following interest in associated undertakings:
£m
Country of operation
% interest held
At 31 December
2013
At 31 December
2012
Kotak Mahindra Old Mutual Life Insurance Limited India 26 26 26

Old Mutual plcAnnual Report and Accounts 2013
246
FINANCIAL STATEMENTS OF THE COMPANYNOTES TO THE COMPANY FINANCIAL STATEMENTSFor the year ended 31 December 2013
10 Investments and securities
£m
At31 December
2013
At31 December
2012
Government and government-guaranteed securities 55 167 Other debt securities, preference shares and debentures 98 –
Total investments and securities 153 167
The government and government-guaranteed securities above are all rated AAA. The intention is to hold these investments to maturity.
Other debt securities, preference shares and debentures are all rated AAA to BBB. The intention is to hold these investments to maturity.
11 Contingent Liabilities
In February 2008, the Company issued a guarantee to a third party over a subsidiary’s (Old Mutual Bermuda Limited) obligations under the reinsurance contracts relating to the offshore investment products sold by a third party. The maximum payment under this guarantee is $250 million. This guarantee is accounted for as an insurance contract and payments will only arise should Old Mutual Bermuda be unable to meet its obligations under the relevant reinsurance contracts as they fall due.
12 Related parties
Old Mutual plc enters into transactions with its subsidiaries in the normal course of business. These are principally related to funding of the Group’s businesses and head office functions. Details of loans, including balances due from/to the Company accounts are set out below. Disclosures in respect of the key management personnel of the Company are included in note H3 of the Group consolidated financial statements.
There are no transactions entered into by the Company with associated undertakings.
£m
At31 December
2013
At31 December
2012
Balances due from subsidiaries 4,242 2,190 Balances due to subsidiaries (4,264) (4,355)Balances due from other related parties – Fairbairn Trust Company Limited 2 2
Income statement information
Year ended 31 December 2013 Year ended 31 December 2012
At 31 December 2013Interest
paid
Ordinary dividends
received
Other amounts
paidInterest
paid
Ordinary dividends received
Other amounts
paid
Subsidiaries (31) 147 (99) (99) 2,8731 (76)
1 Dividends received during the prior year included £1,844 million from Skandia (UK) Limited, being the payment of a dividend specie of its investment in OMF (IOM) to the Company.
13 Non-current assets held for sale
In the prior year, the Company entered into a contract to sell Skandia Europe Latin and America Holdings to Old Mutual (South Africa) (Proprietary) Limited. The agreed consideration was R1,784,000,000. The sale was completed on 3 July 2013.
247
Financials
MCEVINDEX TO MCEVFor the year ended 31 December 2013
Adjusted Group MCEV by line of business 250
Adjusted operating Group MCEV statement of earnings 251
Adjusted operating Group earnings per share 252
Group MCEV statement of earnings 253
Notes to the MCEV basis supplementary information
A: MCEV policies 256
B: Segment information 264
C: Other key performance information 271
D: Sensitivity tests 274

Old Mutual plcAnnual Report and Accounts 2013
248
MCEVSTATEMENT OF DIRECTORS’ RESPONSIBILITIESIn relation to the Market Consistent Embedded Value basis supplementary information
The directors of Old Mutual plc have chosen to prepare supplementary information on a Market Consistent Embedded Value (MCEV) basis.
Old Mutual’s methodology adopts the Market Consistent Embedded Value Principles (Copyright © Stichting CFO Forum Foundation 2008) issued in June 2008 and updated in October 2009 by the CFO Forum (‘the Principles’), as well as the interim transitional guidance for embedded value reporting in advance of the effective date of Solvency II provided in September 2011 and September 2012, as the basis for the methodology.
The Principles have been materially complied with in the preparation of MCEV information for Emerging Markets and Old Mutual Wealth businesses at 31 December 2013. As a result of the consolidation of IFRS and MCEV reporting processes for Old Mutual Bermuda, MCEV information for Old Mutual Bermuda has been prepared using IFRS results prepared in accordance with the primary financial statements; apart from variable annuity guarantee liabilities, which have been restated to reflect a best estimate valuation consistent with the MCEV Principles. The detailed methodology and assumptions made in presenting this supplementary information are set out in notes A2 and A3.
In preparing the MCEV supplementary information, the directors have:
■ Prepared the supplementary information in accordance with the methodology described above and the basis of preparation as set out on page 254
■ Identified and described the business covered by the MCEV methodology ■ Applied the MCEV methodology consistently to the Emerging Markets and Old Mutual Wealth businesses ■ Determined assumptions on a market consistent basis and operating assumptions on a best estimate entity specific basis, having regard to past, current and expected future experience and to any relevant external data, and then applied them consistently
■ Where relevant, made estimates that are reasonable and consistent.
Julian Roberts Philip Broadley Group Chief Executive Group Finance Director
28 February 2014 28 February 2014
249
Financials
MCEVINDEPENDENT AUDITORS’ REPORTTo Old Mutual plc on the Market Consistent Embedded Value basis supplementary information
We have audited the Market Consistent Embedded Value (MCEV) basis supplementary information (‘the supplementary information’) of Old Mutual plc (‘the Company’) for the year ended 31 December 2013 set out on pages 250 to 275. The financial reporting framework that has been applied in the preparation of the supplementary information is the Market Consistent Embedded Value Principles issued in October 2009 by the European CFO Forum (‘the MCEV Principles’) using the methodology and assumptions set out on pages 254 to 263 for the Emerging Markets and Old Mutual Wealth businesses at 31 December 2013 . The supplementary information should be read in conjunction with the Group financial statements which are on pages 132 to 237.
This report is made solely to the Company in accordance with the terms of our engagement. Our audit work has been undertaken so that we might state to the Company those matters we have been engaged to state in this report and for no other purpose. To the fullest extent permitted by law, we do not accept or assume responsibility to anyone other than the Company for our audit work, for this report, or for the opinions we have formed.
Respective responsibilities of directors and auditorsAs explained more fully in the Directors’ Responsibilities Statement set out on page 248, the directors have accepted responsibility for the preparation of the supplementary information on an MCEV basis in accordance with the MCEV Principles.
Our responsibility is to audit, and express an opinion on, the supplementary information in accordance with the terms of our engagement and having regard to International Standards on Auditing (UK and Ireland). Those standards require us to comply with the Auditing Practices Board’s Ethical Standards for Auditors.
Scope of the audit of the supplementary informationAn audit involves obtaining evidence about the amounts and disclosures in the supplementary information sufficient to give reasonable assurance that the supplementary information is free from material misstatement, whether caused by fraud or error. This includes an assessment of: whether the accounting policies are appropriate to the Group’s circumstances and have been consistently applied and adequately disclosed; and the reasonableness of significant accounting estimates made by the directors. In view of the purpose for which the supplementary information has been prepared, however, we did not assess the overall presentation of the supplementary information which would have been required if we were to express an audit opinion under International Standards on Auditing (UK and Ireland).
In addition we read all the financial and non-financial information in the Old Mutual plc Annual Report to identify material inconsistencies with the audited supplementary information. If we become aware of any apparent material misstatements or inconsistencies we consider the implications for our report.
Opinion on the supplementary informationIn our opinion, the MCEV basis supplementary information of the Company for the year ended 31 December 2013 has been properly prepared, in all material respects, in accordance with the MCEV Principles using the methodology and assumptions set out on page 254.
Philip Smart for and on behalf of KPMG Audit Plc, Statutory Auditor Chartered Accountants 15 Canada Square London E14 5GL
28 February 2014
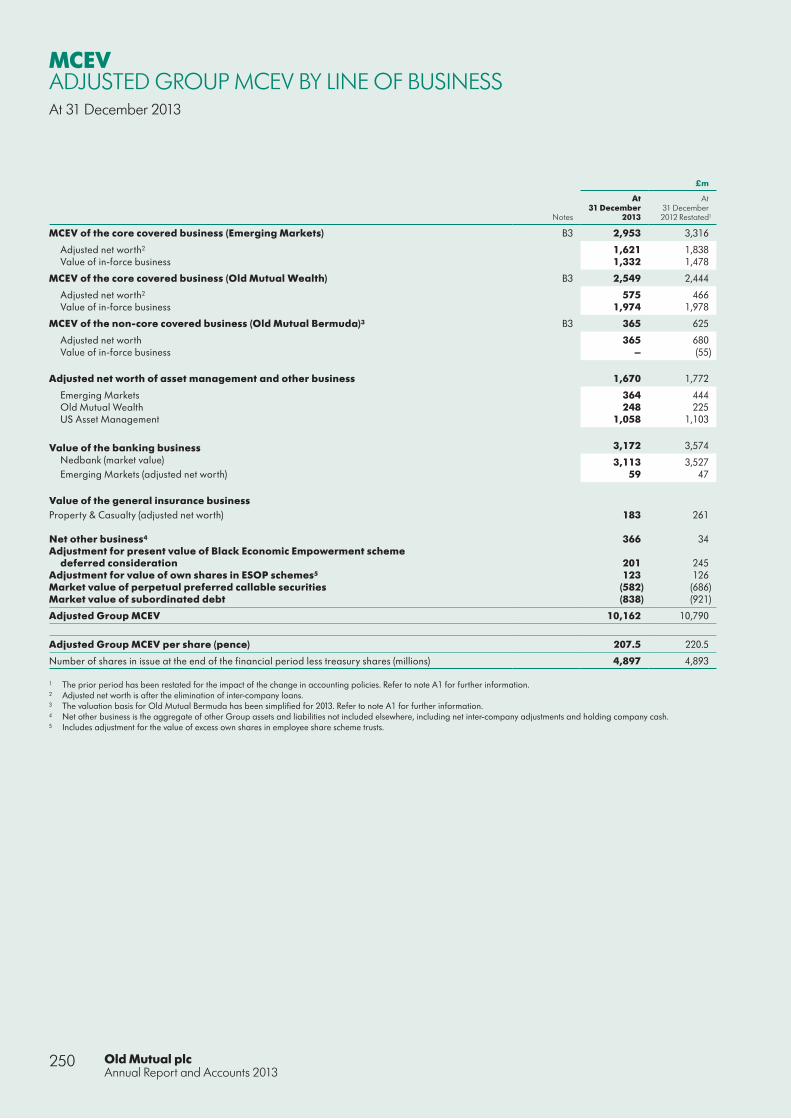
Old Mutual plcAnnual Report and Accounts 2013
250
MCEVADJUSTED GROUP MCEV BY LINE OF BUSINESSAt 31 December 2013
£m
Notes
At 31 December
2013
At 31 December2012 Restated1
MCEV of the core covered business (Emerging Markets) B3 2,953 3,316
Adjusted net worth2 1,621 1,838 Value of in-force business 1,332 1,478
MCEV of the core covered business (Old Mutual Wealth) B3 2,549 2,444
Adjusted net worth2 575 466 Value of in-force business 1,974 1,978
MCEV of the non-core covered business (Old Mutual Bermuda)3 B3 365 625
Adjusted net worth 365 680 Value of in-force business – (55)
Adjusted net worth of asset management and other business 1,670 1,772
Emerging Markets 364 444 Old Mutual Wealth 248 225 US Asset Management 1,058 1,103
Value of the banking business 3,172 3,574 Nedbank (market value) 3,113 3,527 Emerging Markets (adjusted net worth) 59 47
Value of the general insurance businessProperty & Casualty (adjusted net worth) 183 261
Net other business4 366 34 Adjustment for present value of Black Economic Empowerment scheme
deferred consideration 201 245 Adjustment for value of own shares in ESOP schemes5 123 126 Market value of perpetual preferred callable securities (582) (686)Market value of subordinated debt (838) (921)
Adjusted Group MCEV 10,162 10,790
Adjusted Group MCEV per share (pence) 207.5 220.5
Number of shares in issue at the end of the financial period less treasury shares (millions) 4,897 4,893
1 The prior period has been restated for the impact of the change in accounting policies. Refer to note A1 for further information.2 Adjusted net worth is after the elimination of inter-company loans.3 The valuation basis for Old Mutual Bermuda has been simplified for 2013. Refer to note A1 for further information.4 Net other business is the aggregate of other Group assets and liabilities not included elsewhere, including net inter-company adjustments and holding company cash.5 Includes adjustment for the value of excess own shares in employee share scheme trusts.
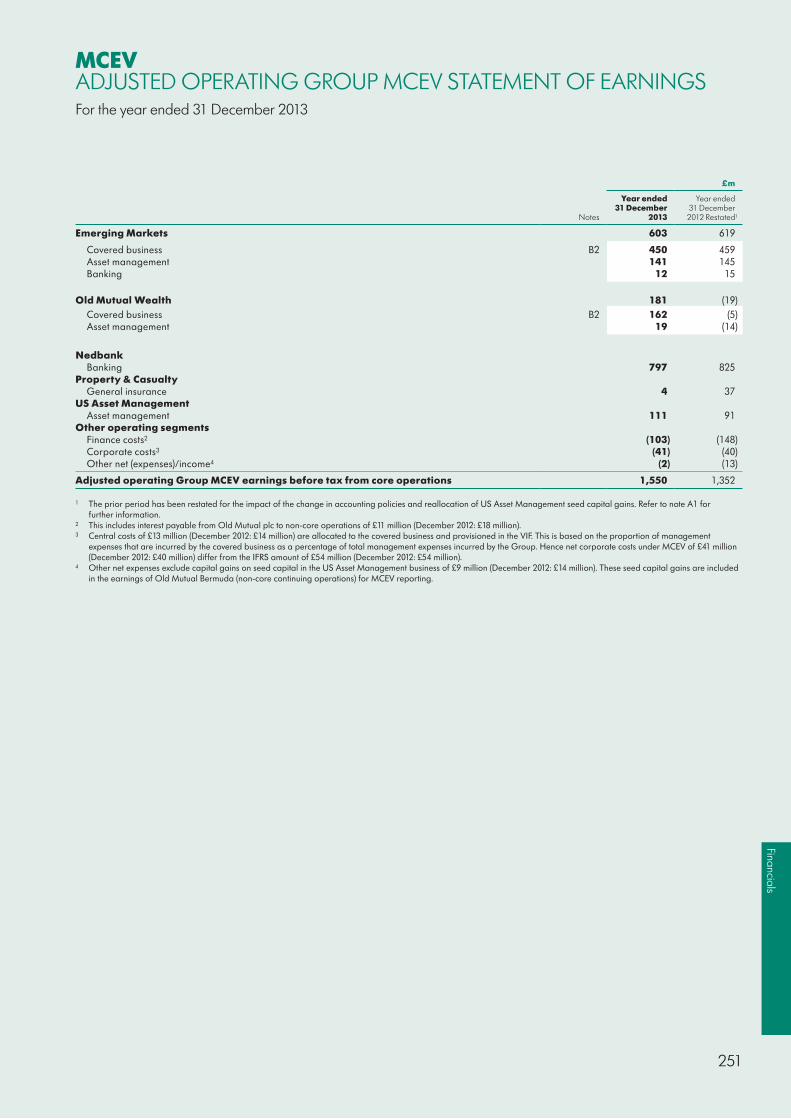
251
Financials
MCEVADJUSTED OPERATING GROUP MCEV STATEMENT OF EARNINGSFor the year ended 31 December 2013
£m
Notes
Year ended 31 December
2013
Year ended 31 December2012 Restated1
Emerging Markets 603 619
Covered business B2 450 459 Asset management 141 145 Banking 12 15
Old Mutual Wealth 181 (19) Covered business B2 162 (5)Asset management 19 (14)
NedbankBanking 797 825
Property & CasualtyGeneral insurance 4 37
US Asset ManagementAsset management 111 91
Other operating segmentsFinance costs2 (103) (148)Corporate costs3 (41) (40)Other net (expenses)/income4 (2) (13)
Adjusted operating Group MCEV earnings before tax from core operations 1,550 1,352
1 The prior period has been restated for the impact of the change in accounting policies and reallocation of US Asset Management seed capital gains. Refer to note A1 for further information.
2 This includes interest payable from Old Mutual plc to non-core operations of £11 million (December 2012: £18 million). 3 Central costs of £13 million (December 2012: £14 million) are allocated to the covered business and provisioned in the VIF. This is based on the proportion of management
expenses that are incurred by the covered business as a percentage of total management expenses incurred by the Group. Hence net corporate costs under MCEV of £41 million (December 2012: £40 million) differ from the IFRS amount of £54 million (December 2012: £54 million).
4 Other net expenses exclude capital gains on seed capital in the US Asset Management business of £9 million (December 2012: £14 million). These seed capital gains are included in the earnings of Old Mutual Bermuda (non-core continuing operations) for MCEV reporting.

Old Mutual plcAnnual Report and Accounts 2013
252
MCEVADJUSTED OPERATING GROUP MCEV EARNINGS PER SHAREFor the year ended 31 December 2013
£m
Year ended 31 December 2013 Notes
Core continuing operations
Non-core continuing operations
Discontinued operations2 Total
Adjusted operating Group MCEV earnings before tax 1,550 31 – 1,581
Covered business B2 612 31 – 643 Other business 938 – – 938
Tax on adjusted operating Group MCEV earnings (423) 1 – (422)
Covered business B2 (161) 1 – (160)Other business (262) – – (262)
Adjusted operating Group MCEV earnings after tax 1,127 32 – 1,159
Non-controlling interestsOrdinary shares (273) – – (273)Preferred securities (19) – – (19)
Adjusted operating MCEV earnings after tax attributable to equity holders1 835 32 – 867
Adjusted operating Group MCEV earnings per share 17.3 0.6 – 17.9
Adjusted weighted average number of shares (millions) 4,836
£m
Year ended 31 December 2012 Restated3 Notes
Core continuing operations
Non-core continuing operations
Discontinuedoperations2 Total
Adjusted operating Group MCEV earnings before tax 1,352 99 28 1,479
Covered business B2 454 99 18 571 Other business 898 – 10 908
Tax on adjusted operating Group MCEV earnings (373) – (3) (376)
Covered business B2 (118) – – (118)Other business (255) – (3) (258)
Adjusted operating Group MCEV earnings after tax 979 99 25 1,103
Non-controlling interestsOrdinary shares (277) – – (277)Preferred securities (50) – – (50)
Adjusted operating MCEV earnings after tax attributable to equity holders1 652 99 25 776
Adjusted operating Group MCEV earnings per share 12.9 2.0 0.5 15.4
Adjusted weighted average number of shares (millions) 5,029
1 Adjusted operating Group MCEV earnings excludes income attributable to Black Economic Empowerment trusts of listed subsidiaries. The calculation of the adjusted weighted average number of shares includes own shares held in policyholders’ funds and Black Economic Empowerment trusts.
2 Discontinued operations include earnings from previously owned Nordic business.3 The prior period has been restated for the impact of the change in accounting policies and reallocation of US Asset Management seed capital gains. Refer to note A1 for
further information.

253
Financials
MCEVGROUP MARKET CONSISTENT EMBEDDED VALUE STATEMENT OF EARNINGSFor the year ended 31 December 2013
£m
Notes
Year ended 31 December
2013
Year ended 31 December
2012 Restated1
Adjusted operating Group MCEV earnings before tax from core continuing operations 1,550 1,352 Adjusted operating Group MCEV earnings before tax from OM Bermuda non-core operations 31 99
Adjusted operating Group MCEV earnings before tax from continuing operations2 1,581 1,451 Adjusting items from continuing operations C2 389 492
Total Group MCEV earnings before tax from continuing operations 1,970 1,943 Income tax attributable to shareholders (528) (490)
Total Group MCEV earnings after tax from continuing operations 1,442 1,453 Total Group MCEV earnings after tax from discontinued operations 3 600
Total Group MCEV earnings after tax for the financial period 1,445 2,053
Total Group MCEV earnings for the financial period attributable to:
Equity holders of the parent 1,170 1,747
Non-controlling interestsOrdinary shares 256 256 Preferred securities 19 50
Total Group MCEV earnings after tax for the financial period 1,445 2,053
Basic total Group MCEV earnings per ordinary share (pence) 25.5 36.6
Weighted average number of shares (millions) 4,597 4,768
1 The prior period has been restated for the impact of the change in accounting policies and reallocation of US Asset Management seed capital gains. Refer to note A1 for further information.
2 Refer to note A2 for the definition of adjusted operating Group MCEV earnings.

Old Mutual plcAnnual Report and Accounts 2013
254
MCEVNOTES TO THE MCEV BASIS SUPPLEMENTARY INFORMATIONFor the year ended 31 December 2013
A: MCEV policies
A1: Basis of preparation
The Market Consistent Embedded Value methodology (MCEV) adopts the Market Consistent Embedded Value Principles (Copyright © Stichting CFO Forum Foundation 2008) issued in June 2008 and updated in October 2009 by the CFO Forum (the Principles) as the basis for the methodology used in preparing the supplementary information.
The CFO Forum released interim transitional guidance in September 2012 confirming that there was no requirement to make allowance for Solvency II in subsequent MCEV disclosures.
The Principles have been materially complied with in the preparation of MCEV information for Emerging Markets and Old Mutual Wealth businesses at 31 December 2013. The detailed methodology and assumptions made in presenting this supplementary information are set out in notes A2 and A3.
Throughout the supplementary information the following terminology is used to distinguish between the terms MCEV, Group MCEV and adjusted Group MCEV:
■ MCEV is a measure of the consolidated value of shareholders’ interests in the covered business and consists of the sum of the shareholders’ adjusted net worth in respect of the covered business and the value of the in-force covered business.
■ Group MCEV is a measure of the consolidated value of shareholders’ interests in covered and non-covered business. Non-covered business is valued at the IFRS net asset value detailed in the primary IFRS financial statements adjusted to eliminate inter-company loans and a deduction for certain non-controlling interests in Emerging Markets.
■ The adjusted Group MCEV which is a measure used by management to assess the shareholders’ interest in the value of the Group, includes the impact of marking all debt to market value, the market value of the Group’s listed banking subsidiary, marking the value of deferred consideration due in respect of Black Economic Empowerment arrangements in South Africa (the BEE schemes) to market, as well as including the market value of excess own shares held in Employee Share Ownership Plan (ESOP) schemes.
(a) Changes in basis of preparationOld Mutual Bermuda valuation basis changeFor the current period, the valuation basis for Old Mutual Bermuda has been simplified from a full bottom-up MCEV calculation to an adjusted IFRS basis. The revised approach uses the IFRS net asset value calculated in accordance with the primary IFRS financial statements, with variable annuity guarantee liabilities restated to reflect a best estimate valuation consistent with MCEV principles.
The main effect of this change is the removal of items previously included in the value of in-force business, apart from expected variable annuity guarantee losses, which are now included in ANW. Items no longer included in the MCEV calculation as a result of not calculating the value of in-force business include the cost of non-hedgeable risk, frictional costs and future annuity contract fee income, net of expenses.
This simplification is part of the consolidation of reporting processes for Old Mutual Bermuda following a significant run-off of the book (given surrenders of variable annuities post the five-year top-up anniversaries) and management actions taken to de-risk the business. As a result, Old Mutual Bermuda’s value-in-force has become less significant to the Group from a valuation and risk perspective. Earnings calculated on the adjusted IFRS basis are expected to be similar to bottom-up calculated MCEV earnings.
As a result of this change a simplified analysis of earnings approach has been adopted, with all earnings recorded under other operating experience variances, apart from variable annuity guarantee performance (net of hedge performance) and seed capital gains and losses, which are recorded in economic variances.
Comparative information has not been restated to reflect the valuation basis change.
Emerging Markets valuation basis for certain African entitiesThe covered business within certain African entities (Zimbabwe, Kenya, Malawi, Swaziland and Nigeria) has been included on an MCEV basis for 2013 year-end reporting. Simplified approaches have been used where appropriate to the size of the business, or where insufficient market data is available to perform full bottom up MCEV calculations. Previously these entities were included in covered business on a basis consistent with the primary IFRS financial statements.
Comparative information has not been restated to reflect this valuation change.
(b) Restatement of comparative informationIAS 19 (Employee Benefits) and IFRS 10 (Consolidated Financial Statements) restatementsThe Group has adopted IAS 19 (Employee Benefits) and IFRS 10 (Consolidated Financial Statements) with a date of initial application of 1 January 2013. Further information on the key amendments to these statements are detailed in note J1 in the primary Group IFRS financial statements.
The change in accounting policies has been applied retrospectively and as a result, the comparative information for the year ended 31 December 2012 has been restated accordingly.
255
Financials
US Asset Management seed capital gainsThe US Asset Management seed capital forms part of the adjusted net worth of Old Mutual Bermuda for MCEV reporting purposes following the transfer of ownership in July 2012. Seed capital gains of £9 million (December 2012: £14 million) are recorded in economic variances in MCEV reporting and are therefore excluded from operating MCEV earnings. This differs from the approach for IFRS reporting where seed capital gains are included in adjusted operating profit.
The December 2012 operating MCEV earnings have been restated to reflect this treatment.
A2: Methodology
(a) IntroductionMCEV represents the present value of shareholders’ interests in the earnings that are distributable from assets allocated to the in-force covered business after sufficient and appropriate allowances for the aggregate risks in the covered business. It is measured in a way that is consistent with the value that would normally be placed on the cash flows generated by these assets and liabilities in a deep and liquid market. MCEV is therefore a risk-adjusted measure to the extent that financial risk is reflected through the use of market consistent techniques in the valuation of both assets and distributable earnings and a transparent explicit allowance is made for non-financial risks.
The MCEV consists of the sum of the following components:
■ Adjusted net worth (ANW), which excludes acquired intangibles and goodwill, consisting of: — free surplus allocated to the covered business — required capital to support the covered business
■ Value of in-force covered business (VIF).
The adjusted net worth is the market value of shareholders’ assets held in respect of the covered business after allowance for the liabilities which are determined by local regulatory reserving requirements.
MCEV is calculated net of non-controlling shareholder interests and excludes the value of future new business.
(b) CoverageCovered business includes, where material, any contracts that are regarded by local insurance supervisors as long-term life assurance business, and other business, where material, directly related to such long-term life assurance business where the profits are included in the IFRS long-term business profits in the primary financial statements. For the life businesses in entities where the covered business is not material, the treatment within this supplementary information is the same as in the primary IFRS financial statements (ie. expected future profits for this business are not capitalised for MCEV reporting purposes).
Some types of business are legally written by a life company, but under IFRS are classified as asset management because ‘long-term business’ only serves as a wrapper. This business is excluded from covered business, for example:
■ New institutional investment platform pensions business written in the United Kingdom as it is more appropriately classified as unit trust business ■ Individual unit trusts and some group market-linked business written by the asset management companies in South Africa through the life company as profits from this business arise in the asset management and asset administration companies.
The treatment within this supplementary information of non-covered business is the same as in the primary financial statements, except for the recognition of certain non-controlling interests in Zimbabwe. The adjusted Group MCEV includes the impact of marking all debt to market value, the market value of the Group’s listed banking subsidiary, marking the value of deferred consideration due in respect of Black Economic Empowerment arrangements in South Africa (the BEE schemes) to market, as well as including the market value of excess own shares held in ESOP schemes.
(c) Free surplusFree surplus is the market value of any assets allocated to, but not required to support, the in-force covered business. It is determined as the market value of any excess assets attributed to the covered business but not backing the regulatory liabilities, less the required capital to support the covered business.

Old Mutual plcAnnual Report and Accounts 2013
256
A: MCEV policies continued
A2: Methodology continued
(d) Required capitalRequired capital is the market value of assets that is attributed to support the covered business, over and above that required to back statutory liabilities for covered business, whose distribution to shareholders is restricted. The following capital measures are considered in determining the required capital held for covered business so that it reflects the level of capital considered by the directors to be appropriate to manage the business:
■ Economic capital ■ Regulatory capital (ie. the level of solvency capital which the local regulators require) ■ Capital required by rating agencies in order to maintain the desired credit rating ■ Any other required capital definition to meet internal management objectives.
Economic capital for the covered business is based upon Old Mutual’s internal assessment of risks inherent in the underlying business. It measures capital requirements on a basis consistent with a 99.5% confidence level over a one-year time horizon. The confidence level has been changed from 99.93% to 99.5% for Group economic capital calculations at 31 December 2013 to ensure consistency with Solvency II principles and general industry practice.
For Emerging Markets and Old Mutual Wealth, required capital determined with reference to internal management objectives is the most onerous and is the capital measure used for the determination of required capital for MCEV reporting. The required capital in respect of OMLAC(SA)’s covered business is partially covered by the market value of the Group’s investments in banking in South Africa. On consolidation this investment is shown separately.
For Old Mutual Bermuda, regulatory required capital is the most onerous capital measure, and continues to be the case despite the reduction in the Bermuda Monetary Authority (BMA) regulatory capital requirements applicable at 31 December 2013.
In September 2013, the BMA approved a reduction in capital resource requirements from £433 million ($703 million) to £252 million ($418 million). The capital requirement will be kept constant to that approved by the BMA until there is notification of a revised capital requirement after the filing of the 2013 annual return.
The table below shows the level of required capital expressed as a percentage of the minimum local regulatory capital requirements.
£m
At 31 December 2013 At 31 December 2012
Notes
Required capital
(a)
Regulatory capital
(b)Ratio (a/b)
Required capital
(a)
Regulatory capital
(b)Ratio (a/b)
Emerging Markets B3 1,113 802 1.4 1,312 923 1.4 Old Mutual Wealth1 B3 326 228 1.4 294 212 1.4 Old Mutual Bermuda B3 252 252 1.0 433 433 1.0
Total 1,691 1,282 1.3 2,039 1,568 1.3
1 Local regulators for many of the Old Mutual Wealth countries allow intangible assets to be included as part of admissible regulatory capital. In such cases the required capital reported for MCEV is net of these items, although each of the countries continues to be sufficiently capitalised on the local solvency basis. Skandia Leben in Germany is permitted under local regulations to include the unallocated policyholder profit sharing liability as admissible capital.
(e) Value of in-force (VIF) covered businessUnder the MCEV methodology, VIF consists of the following components:
■ Present value of future profits (PVFP) from in-force covered business, less ■ Time value of financial options and guarantees, less ■ Frictional costs of required capital, less ■ Cost of residual non-hedgeable risks (CNHR).
Projected liabilities and cash flows are calculated net of outward risk reinsurance with allowance for default risk of reinsurance counterparties where material.
MCEVNOTES TO THE MCEV BASIS SUPPLEMENTARY INFORMATIONFor the year ended 31 December 2013
257
Financials
(f) Present value of future profitsThe PVFP is calculated as the discounted value of future distributable earnings (taking account of local statutory reserving requirements) that are expected to emerge from the in-force covered business, including the value of contractual renewal of in-force business, on a best estimate basis where assumed earned rates of return and discount rates are equal to the risk free reference rates. This is also known as a deterministic certainty equivalent valuation of future distributable earnings, and is described in more detail in note A3. Any limitations on distribution of such earnings due to statutory or internal capital requirements are taken into account separately in the calculation of frictional costs of required capital.
PVFP captures the intrinsic value of financial options and guarantees on in-force covered business which are not included in the local statutory reserves forming part of ANW, but excludes any additional allowance for the time value of financial options and guarantees.
(g) Financial options and guaranteesAllowance is made in the determination of MCEV for the potential impact of variability of investment returns (ie. asymmetric impact) on future shareholder cash flows of policyholder financial options and guarantees within the in-force covered business.
The time value of financial options and guarantees describes that part of the value of financial options and guarantees that arises from the variability of future investment returns on assets to the extent that it is not already included in the local statutory reserves.
The calculation of the value of financial options and guarantees (including the allowance in ANW and VIF components of MCEV) is based on market consistent stochastic modelling techniques where the actual assets held at the valuation date are used as the starting point for the valuation of such financial options and guarantees. Projected future cash flows are valued using economic assumptions such that they are valued in line with the price of similar cash flows that are traded in the capital markets. Closed form solutions are also applied in Europe provided the nature of any guarantees is not complex.
The value of financial options and guarantees also includes allowance for potential burn-through costs on participating business, ie. the extent to which shareholders are unable to recover a loan made to participating funds to meet either regulatory or internal capital management requirements, or the extent to which reserves are inadequate to meet benefit payments during periods of severely adverse experience.
In the generated economic scenarios, allowance is made, where appropriate, for the effect of dynamic management and/or policyholder actions in different circumstances:
■ Management has some discretion in managing the exposure to financial options and guarantees, particularly within participating business. Such dynamic management actions are reflected in the valuation of financial options and guarantees provided that such discretion:
— is consistent with established and justifiable practice taking into account policyholders’ reasonable expectations (eg. with due consideration of the Principles and Practices of Financial Management (PPFM), in the South African business)
— is subject to any contractual guarantees and regulatory or legal constraints — has been passed through an appropriate approval process by the local Executive team and the Board, where applicable
■ Assumptions that depend on the market performance (such as bonus rates) are set relative to the risk free reference rates (subject to contractual guarantees) and assuming that all market participants are subjected to the same market conditions
■ Where credible evidence exists that persistency rates are linked to economic scenarios, allowance is made for dynamic policyholder behaviour in response to changes in economic conditions
■ Modelled dynamic management and policyholders’ actions include the following: — changes in future bonus rates subject to contractual guarantees, including removing all or part of previously declared non-vested balances where circumstances warrant such action
— dynamic lapse rates for the Bermuda business, and dynamic guaranteed annuity option take-up rates for the South African business driven by changes in economic conditions and management actions
— changes in the surrender values.
In determining the value of financial options and guarantees, an appropriate number of simulations are run to ensure that a reasonable degree of convergence of results has been obtained.
Emerging MarketsThe financial options and guarantees mainly relate to the guaranteed portion of smoothed bonus business, maturity guarantees and guaranteed annuity options.
As required by the applicable Actuarial Society of South Africa practice note, the value of the financial options and guarantees included in the statutory reserves in the South African businesses has been valued using a risk-neutral market consistent asset model, and is referred to as the ‘Investment Guarantee Reserve’ (IGR). As the value of financial options and guarantees is held in local statutory reserves that form part of ANW, no further allowance is needed for the time value of financial options and guarantees.
The IGR includes an explicit discretionary margin to allow for the sensitivity of the reserve to market movements, including interest rates, equity levels and the volatility implicit in the pricing of derivative instruments in these markets. The value of future anticipated releases of the discretionary margin is included in the VIF.
Old Mutual WealthThe financial options and guarantees mainly relate to guaranteed annuity options on German deferred annuity contracts and minimum investment return guarantees on French unit-linked investment products. The time value of financial options and guarantees has reduced significantly over 2013 as a result of modelling changes made in Germany. The majority of the value of financial options and guarantees for Old Mutual Wealth is held in local statutory reserves that form part of ANW.

Old Mutual plcAnnual Report and Accounts 2013
258
A: MCEV policies continued
A2: Methodology continued
BermudaThe financial options and guarantees mainly relate to the guaranteed minimum accumulation benefits on variable annuity contracts. Reserves for financial options and guarantees, calculated on a best estimate valuation basis consistent with MCEV principles, are included in ANW.
(h) Frictional costs of required capitalFrom the shareholders’ perspective there is a cost due to restrictions on the distribution of required capital that is locked in entities within the Group. Where material, an allowance has been made for the frictional costs in respect of the taxation on investment return (income and capital gains) and investment costs on the assets backing the required capital for covered business. The allowance for taxation is based on the taxation rates applicable to investment earnings on assets backing the required capital.
The run-off pattern of the required capital is projected on an approximate basis over the lifetime of the underlying risks in line with drivers of the capital requirement. The same drivers are used to split the total required capital between existing business and new business.
The allowance for frictional costs is independent of the allowance for the cost of residual non-hedgeable risks as described below.
(i) Cost of residual non-hedgeable risks (CNHR)Sufficient allowance for the majority of financial risks has been made in the PVFP and the time value of financial options and guarantees using techniques that are similar to the type of approaches used in capital markets. In addition, the modelling of some non-hedgeable non-financial risks is incorporated as part of the calculation of the PVFP (eg. to the extent that expected operational losses are incorporated in the maintenance expense assumptions) or the time value of financial options and guarantees (eg. dynamic policyholder behaviour such as the interaction of the investment scenario and the persistency rates). Residual non-financial risks include, for example, liability risks such as mortality, longevity and morbidity risks; business risks such as persistency, expense and reinsurance credit risks; and operational risk.
For 31 December 2012, information reported for Old Mutual Bermuda, in addition to the allowance for residual non-hedgeable risks, CNHR includes an allowance for hedge ineffectiveness risk and credit spread risk, which are not modelled in the PVFP or TVOG calculations. In 2013, Old Mutual Bermuda moved from a bottom-up MCEV calculation basis to an adjusted IFRS basis with the CNHR no longer calculated.
For 31 December 2013, information reported for Old Mutual Zimbabwe, the CNHR includes an allowance for financial as well as non-financial risks to allow for financial risks that are not allowed for in the PVFP due to insufficient market data.
An allowance is made in the CNHR to reflect uncertainty in the best estimate of shareholder cash flows as a result of both symmetric and asymmetric non-hedgeable risks since these risks cannot be hedged in deep and liquid capital markets and are managed, inter alia, by holding risk capital. With the exception of operational risk, most residual non-hedgeable risks for the Group as a whole have a symmetric impact on shareholder value, ie. commensurate upside and downside impacts.
The CNHR is calculated using a cost of capital approach, ie. it is determined as the present value of capital charges for all future non-hedgeable risk capital requirements until the liabilities have run off. The capital charge in each year is the product of the projected expected non-hedgeable risk capital held after allowance for some diversification benefits and the cost of capital charge. The cost of capital charge therefore represents the return above the risk free reference rates that the market is deemed to demand for providing this capital.
The residual non-hedgeable risk capital measure is determined using an internal capital model based on appropriate shock scenarios consistent with a 99.5% confidence level over a one-year time horizon, and is calculated using the same methodology used to determine economic capital. The internal capital model makes allowance for certain management actions, such as reductions in bonus rates, where deemed appropriate. The residual non-hedgeable risk capital makes an allowance for non-linearities between hedgeable and non-hedgeable risks.
The following treatment is applied for diversification benefits in determining the residual non-hedgeable risk capital at a business unit level:
■ Diversification benefits within the non-hedgeable risks of the covered business are recognised ■ No diversification benefits are recognised between hedgeable and non-hedgeable risks of the covered business ■ No diversification benefits are recognised between covered and non-covered business.
A cost of capital charge of 2.0% (2012: 2.0%) has been applied to residual symmetric and asymmetric non-hedgeable capital at a business unit level over the life of the contracts. This rate is derived by considering a market based view of required return on equity for the covered business, and then deducting risk free investment returns, frictional costs and an allowance for franchise value. This translates into an equivalent cost of capital rate of approximately 2.4% (2012: 2.4%) being applied to the diversified capital required in respect of such non-hedgeable risks for Emerging Markets and Old Mutual Wealth as a combined group (no CNHR is calculated for Old Mutual Bermuda under the new valuation approach).
MCEVNOTES TO THE MCEV BASIS SUPPLEMENTARY INFORMATIONFor the year ended 31 December 2013
259
Financials
(j) Participating businessFor participating business in Emerging Markets, the method of valuation makes assumptions about future bonus rates and the determination of profit allocation between policyholders and shareholders. These assumptions are made on a basis consistent with other projection assumptions, especially the projected future risk free investment returns, established Company practice (with due consideration of the PPFM for South African business), past external communication, any payout smoothing strategy, local market practice, regulatory/contractual restrictions and bonus participation rules.
Where current benefit levels are higher than can be supported by the existing fund assets together with projected investment returns, a downward ‘glide path’ in benefit levels is projected so that the policyholder fund would be exhausted on payment of the last benefit.
(k) Valuation of assets and treatment of unrealised lossesThe market values of assets, where quoted in deep and liquid markets, are based on the bid price on the reporting date. Unquoted assets are valued according to IFRS and marked to model. Further information on the valuation of assets can be found in note E1 in the notes to the Consolidated Financial Statements.
No smoothing of market values or unrealised gains/losses is applied in determining the market value of assets.
(l) Asset mixThe value of financial options and guarantees and PVFP (where relevant) are calculated with reference to assets that are projected using the actual asset allocation of the policyholder funds at the reporting date. However, if the current asset mix is materially different to the long-term strategic asset allocation as a result of market movements, projected assets are assumed to revert to the long-term strategic asset allocation in the short- to medium-term as appropriate.
(m) Consolidation adjustmentsThe MCEV result split by business unit takes account of both sides of any loan arrangements between Group companies, with the Group effect included in net other business.
(n) Look through principlePVFP and value of new business cash flow projections apply a look through approach. They include the profits/losses of owned service companies, eg. distribution and administration entities, related to the management of the covered business. Any profit margins that are included in investment management fees payable by the life assurance companies to the asset management subsidiaries have not been included in the value of in-force business or the value of new business on the grounds of materiality.
(o) TaxationIn valuing shareholders’ cash flows, allowance is made in the cash flow projections for taxes in the relevant jurisdiction affecting the covered business. Tax assumptions are based on best estimate assumptions, applying current local corporate tax legislation and practice together with known future changes and taking credit for any deferred tax assets.
The value of deferred tax assets is partly recognised in the MCEV. Typically those tax assets are expected to be utilised in future by being offset against expected tax liabilities that are generated on expected profits emerging from in-force business. MCEV may therefore understate the true economic value of such deferred tax assets because it does not allow for future new business sales which could affect the utilisation of such assets.
United Kingdom:The Emergency Budget that was held in June 2010 set in motion a series of reductions to the UK’s mainstream corporation tax rate. The impact of the corporation tax rate reducing from 23% down to 21%, applicable from April 2014 and the reduction to 20%, applicable from April 2015, have improved the Old Mutual Wealth MCEV position by £18 million.
South Africa:The Taxation Laws Amendment Bill was released in October 2013, effecting changes to the tax relief in respect of sales, administration and indirect expenses attributable to income incurred in individual and corporate policyholder funds (effective from 1 January 2013). This had the effect of increasing the expense relief ratio, which improved expense experience variances in 2013. Further changes to taxation laws are anticipated in 2014 which are expected to have an adverse effect on post-tax earnings. However no changes have been made to MCEV assumptions at 31 December 2013 to reflect these recent or anticipated changes until these changes are more certain.
(p) Value of debtSenior and subordinated debt securities are marked to market value for MCEV. For IFRS reporting, debt is valued at either book value or fair value.
The IFRS value of total debt is £1,345 million (2012: £1,570 million) and the MCEV value is £1,420 million (2012: £1,607 million).
Where either the principal or the coupon of the debt security has been swapped into an alternate currency, the fair value of these derivative instruments of £50 million (2012: £96 million) has not been included in the value of debt; however, it is included in the Net Other Business value of £366 million (2012: £34 million) (Adjusted Group MCEV by line of business). Further information relating to the debt securities can be found in Note E9 in the Notes to the Consolidated Financial Statements.
Old Mutual plcAnnual Report and Accounts 2013
260
A: MCEV policies continued
A2: Methodology continued
(q) New business and renewalsThe market consistent value of new business (VNB) measures the value of the future profits expected to emerge from all new business sold, and in certain cases from premium increases to existing contracts, during the reporting period after allowance for the time value of financial options and guarantees, frictional costs and the cost of residual non-hedgeable risks associated with writing the new business.
VNB includes contractual renewal of premiums and recurring single premiums, where the level of premium is pre-defined and is reasonably predictable, and changes to existing contracts where these are not variations allowed for in the PVFP. Non-contractual increments are treated similarly where the volume of such increments is reasonably predictable or likely (eg. where premiums are expected to increase in line with salary or price inflation).
Any variations in premiums on renewal of in-force business from that previously anticipated including deviations in non-contractual increases, deviations in recurrent single premiums and re-pricing of premiums for in-force business are treated as experience variances or economic variances on in-force business and not as new business.
The key principles applied in calculating VNB are noted below.
■ Economic assumptions at the start of the reporting period are used, except for OMLAC(SA)’s non-profit annuities products where point of sale assumptions are used that are consistent with the pricing basis
■ Demographic and operating assumptions at the end of the reporting period are used ■ VNB is calculated at point of sale and rolled forward to the end of the reporting period ■ Generally a stand-alone approach is used unless a marginal approach would better reflect the additional value to shareholders created through the activity of writing new business
■ Expense allowances include all acquisition expenses, including any acquisition expense overruns. Strategic business development expenses are excluded
■ VNB is calculated net of tax, reinsurance and non-controlling interests ■ Economic and operating variances are not attributed to VNB.
PVNBP is calculated at point of sale using premiums before reinsurance and applying a valuation approach that is consistent with the calculation of VNB.
(r) Analysis of MCEV earningsAn analysis of MCEV earnings provides a reconciliation of the MCEV for covered business at the beginning of the reporting period and the MCEV for covered business at the end of the reporting period. The analysis is completed on a post-tax basis after the deduction of minority interests.
Operating MCEV earnings are generated by the value of new business sold during the reporting period, the expected existing business contribution, operating experience variances, operating assumption changes and other operating variances:
■ The value of new business includes the impact of new business strain on free surplus that arises, amongst other things, from the impact of initial expenses and additional required capital that is held in respect of such new business
■ The expected existing business contribution is determined by projecting both actual assets and actual liabilities (including assets backing the free surplus and required capital) from the start of the reporting period to the end of the reporting period using expected real-world earned rates of return. The expected existing business contribution is presented in two components:
— Expected earnings on free surplus and required capital and the expected change in VIF assuming that the assets earn the beginning of period risk free reference rates as well as the deterministic release of the time value of options and guarantees, frictional costs and CNHR; and
— Additional expected earnings on free surplus and required capital and the additional expected change in VIF as a result of real-world expected earned rates of return on assets in excess of beginning of period risk free reference rates
■ Transfers from VIF and required capital to free surplus includes the release of required capital and modelled profits from VIF into free surplus in respect of business that was in-force at the beginning of the reporting period. These transfers do not change the overall MCEV.
■ Operating experience variances reflect the impact of deviations of the actual operational experience during the reporting period from the expected operational experience. It is analysed before operating assumption changes, ie. such variances are assessed against opening operating assumptions, and reflects the total impact of in-force and new business variances
— Development costs are reported separately from other expense experience variances in the MCEV analysis and reflect the cost of projects related to the development of new and existing business, infrastructure and systems, from which we expect to earn higher profits (either through increased sales or lower expenses) in future.
MCEVNOTES TO THE MCEV BASIS SUPPLEMENTARY INFORMATIONFor the year ended 31 December 2013
261
Financials
■ Operating assumption changes incorporate the impact of changes to operating assumptions from those assumed at the beginning of the reporting period to those assumed at the end of the reporting period. As VNB is calculated using operating assumptions at the end of the reporting period, this impact only relates to the value of in-force business at the end of the reporting period that was also in-force at the beginning of the reporting period
■ Other operating variances include model improvements, changes in methodology and the impact of certain management actions, such as a change in the asset allocation backing required capital
■ Total MCEV earnings also includes economic variances and other non-operating variances:
— Economic variances incorporate the impact of changes in economic assumptions from the beginning of the reporting period to the end of the reporting period (eg. different opening and closing interest rates and equity volatility) as well as the impact on earnings resulting from actual returns on assets being different to the expected returns on those assets as reflected in the expected existing business contribution, it therefore also includes the impact of economic variances in the reporting period on projected future earnings
— Other non-operating variances include the impact of regulatory driven changes, the impact of changes to modelled taxation and certain costs to ensure consistency of treatment with IFRS adjusted operating profit.
An analysis of MCEV earnings requires non-operating closing adjustments. These mainly include exchange rate movements and capital transfers such as those in respect of payment of dividends and acquiring/divesting businesses.
Return on MCEV for covered business is calculated as the operating MCEV earnings after tax divided by opening MCEV in business unit reporting currency, except for core covered business and total covered business where the calculations are performed in sterling.
The anticipated expected existing business contribution for the 12 months following the year ended 31 December 2013 (at the reference rate as well as in excess of the reference rate) is provided to assist users of the MCEV supplementary information in forecasting operating MCEV earnings. For comparability against current year earnings, the average exchange rates over 2013 are used. Therefore the expected existing business contribution for the financial year ending 31 December 2014 ultimately reflected in the 2014 financial statements may differ from these results.
(s) Group MCEV presentationThe presentation of Group MCEV consists of the covered business under the MCEV methodology and the non-covered business valued as the unadjusted IFRS net asset value, with the exception of US Asset Management that is valued at IFRS NAV allowing for the value of the loan note held with Old Mutual plc. A mark to market adjustment is therefore not performed for external borrowings and other non-covered business items not already reported on a mark to market basis under IFRS.
(t) Adjusted operating Group MCEV earningsFor all businesses, adjusted operating MCEV earnings excludes goodwill impairment, the impact of acquisition accounting, option revaluations related to long-term incentive schemes, the impact of closure of unclaimed shares trusts, profit/(loss) on acquisition/disposal of subsidiaries, associated undertakings and strategic investments, dividends declared to holders of perpetual preferred callable securities, and fair value (profits)/losses on certain Group debt instruments.
For long-term business and general insurance businesses, adjusted operating Group MCEV earnings are based on long-term and short-term investment returns respectively, include investment returns on life fund investments in Group equity and debt instruments, and are stated net of income tax attributable to policyholder returns. For the US Asset Management business it includes compensation costs in respect of certain long-term incentive schemes defined as non-controlling interests in accordance with IFRS.
A3: Assumptions
Non-economic assumptions The appropriate non-economic projection assumptions for future experience including mortality, persistency and expense assumptions are determined using best estimate assumptions of each component of future cash flows, are specific to the entity concerned and have regard to past, current and expected future experience where sufficient evidence exists (eg. longevity improvements and AIDS-related claims) as derived from both entity-specific and industry data where deemed appropriate. Material assumptions are actively reviewed by means of detailed experience investigations and updated, as deemed appropriate.
These assumptions are based on the covered business being part of a going concern. Although favourable changes in maintenance expenses, such as productivity improvements, are generally not included beyond what has been achieved by the end of the reporting period. Maintenance expense assumptions determined for certain businesses in Old Mutual Wealth do make some considerations for future cost reductions:
■ Expense assumptions for run-off businesses consider cost reductions in future in line with management actions that would be taken as in-force volumes decrease
■ Expense assumptions for the UK Legacy business reflect anticipated cost reductions arising from the outsourcing of the administration function for this business.

Old Mutual plcAnnual Report and Accounts 2013
262
A: MCEV policies continued
A3: Assumptions continued
The management expenses attributable to life assurance business have been analysed between expenses relating to the acquisition of new business, maintenance of in-force business (including investment management expenses) and development projects.
■ All expected maintenance expense overruns affecting the covered business are allowed for in the calculations ■ The MCEV makes provision for future development costs and one-off expenses relating to covered businesses that are known with sufficient certainty, based on three year business plans. The provision is reduced to the extent that projects have associated benefits that are directly quantifiable and are considered to emerge within a reasonable timeframe (eg. over the business plan period)
■ In line with legislation in Germany, a specified proportion of miscellaneous profits are shared with policyholders. The revenue on in-force business can be reduced by various expense items incurred in any year
■ Unallocated Group holding company expenses have been included to the extent that they are allocated to the covered business. The table below shows the future expenses attributable to the long-term business. The allocation of these expenses is based on the proportion that the management expenses incurred by the covered businesses bears to the total management expenses incurred by the Group.
%
Proportion of Group holding company expenses attributable to long-term business
At31 December
2013
At31 December
2012
Emerging Markets 17 18 Old Mutual Wealth 8 9 Old Mutual Bermuda1 n/a n/a
Total 25 27
1 Based on materiality, no Group holding expenses are allocated to Old Mutual Bermuda.
Economic assumptionsAn active basis is applied to set pre-tax investment and economic assumptions to reflect the economic conditions prevailing on the reporting date. Economic assumptions are set consistently, eg. future bonus rates are set at levels consistent with the investment return assumptions.
Under a market consistent valuation, economic assumptions are determined such that projected cash flows are valued in line with the prices of similar cash flows that are traded on the capital markets. In practice for the PVFP calculation, a certainty equivalent method is used which assumes that actual assets held earn risk free reference rates (including any liquidity adjustment), before tax and investment management expenses, and all the cash flows are discounted using risk free reference rates (including any liquidity adjustment) which are gross of tax and investment management expenses. The deterministic certainty equivalent method is a valuation technique that ensures consistency with current market prices and over time the expectation is that risk premiums will still be earned on assets such as equities and corporate bonds.
Due to the lack of available market data for Old Mutual Zimbabwe, weighted average investment return forecasts are used to determine appropriate economic assumptions.
(a) Risk free reference rates and inflationThe risk free reference rates, reinvestment rates and discount rates are determined with reference to the swap yield curve that is appropriate to the currency of the cash flows.
■ For Europe the swap yield curve is obtained from Bloomberg ■ For Bermuda the swap yield curve is sourced from a third party market consistent asset model that is used to generate the economic scenarios that are required to determine the value of financial options and guarantees
■ For Emerging Markets the swap yield curve is sourced internally (using market data provided by the Bond Exchange of South Africa) and it is checked for reasonability relative to the Bloomberg swap yield curve.
At 31 December 2013, no adjustments have been made to swap yields to allow for liquidity premiums or credit risk premiums, apart from a liquidity premium adjustment to OMLAC(SA)’s immediate annuity and fixed bond businesses. A liquidity premium adjustment is applied to OMLAC(SA)’s fixed bond business as OMLAC(SA) holds a portfolio of non-government bonds which have a market yield in excess of the risk free rate and the duration of the asset portfolio and the liability duration are a good match (meaning the asset portfolio is held to maturity). Cash flows on this product are predictable and the Company has adequate liquidity to withstand a substantial increase in lapses at all durations without having to sell bonds which further strengthens the case for applying a liquidity premium.
It is the directors’ view that a proportion of non-government bond spreads at 31 December 2013 is attributable to a liquidity premium rather than only to credit and default allowances and that returns in excess of swap rates can be achieved, rather than entire spreads being lost to worsening default experience. For OMLAC(SA)’s immediate annuity business the currency, credit quality and duration of the actual bond portfolios were considered and adjusted risk free reference rates were derived at 31 December 2013 by adding 50 bps (2012: 50 bps) of liquidity premium for this business to the swap rates used for setting investment return and discounting assumptions. For OMLAC(SA)’s fixed bond products 40 bps
MCEVNOTES TO THE MCEV BASIS SUPPLEMENTARY INFORMATIONFor the year ended 31 December 2013

263
Financials
(2012: 45 bps) of liquidity premium was added to the swap rates. These adjustments reflect the liquidity premium component in non-government bond spreads over swap rates that is expected to be earned on the portfolios. In deriving the liquidity premia at 31 December 2013, we compared the yields of similar durations on South African government bonds and bonds issues by state-owned enterprises.
At those durations where swap yields are not available, eg. due to lack of a sufficiently liquid or deep swap market, the swap curve is extended using appropriate interpolation or extrapolation techniques.
The risk free reference spot yield curve has been derived from mid swap rates at the reporting date. Expense inflation rates have been derived by comparing real rates of return against nominal risk free rates for each territory, with adjustments for higher business unit specific inflation where applicable. The risk free reference spot yields (excluding any applicable liquidity adjustments) at various terms for each of the significant regions are provided in the table that follows.
Risk free reference spot yields (excluding any applicable liquidity adjustments)
%
GBP EUR USD ZAR
At 31 December 20131 year 0.7 0.4 0.3 5.7 5 years 2.2 1.3 1.8 7.7 10 years 3.1 2.2 3.3 8.8 20 years 3.6 2.9 4.1 9.7
At 31 December 20121 year 0.7 0.3 0.3 5.1 5 years 1.0 0.8 0.9 6.0 10 years 1.9 1.6 1.9 7.1 20 years 2.9 2.2 2.8 7.5
(b) Volatilities and correlationsWhere cash flows contain financial options and guarantees that do not move linearly with market movements, asset cash flows are projected and all cash flows are discounted using risk-neutral stochastic models. These models project the assets and liabilities using a distribution of asset returns where all asset types, on average, earn the same risk free reference rates.
Apart from the risk free reference spot yields specified above, other key economic assumptions for the calibration of economic scenarios include the implied volatilities for each asset class and correlations of investment returns between different asset classes. For Old Mutual Bermuda, implied volatilities and correlations are determined for each global equity and bond index modelled.
The volatility assumptions for the calibration of economic scenarios that are used in the stochastic models are, where possible, based on those implied from appropriate derivative prices (such as equity options or swaptions in respect of guarantees that are dependent on changes in equity markets and interest rates respectively) as observed on the valuation date. However, historic implied and historic observed volatilities of the underlying instruments and expert opinion are considered where there are concerns over the depth or liquidity of the market. Where strict adherence to the above is not possible, for example where markets only exist at short durations such as the swaption market in South Africa, interpolation or extrapolation techniques, and where appropriate, historical data are used to derive volatility assumptions for the full term structure of the liabilities. Correlation assumptions between asset classes that are used in stochastic models are based on an assessment of historic relationships. Where historic data is used in setting volatility or correlation assumptions, a suitable time period is considered for analysing historic data including consideration of the appropriateness of historical data where economic conditions were materially different to current conditions.
(c) Exchange ratesAll MCEV figures are calculated in local currency and translated to sterling using the appropriate exchange rates as detailed in note A1 of the Group financial statements.
(d) Expected asset returns in excess of the risk free reference ratesThe expected asset returns in excess of the risk free reference rates have no bearing on the calculated MCEV other than the calculation of the expected existing business contribution in the analysis of MCEV earnings. Real-world economic assumptions are determined with reference to one-year forward risk free reference rates applicable to the currency of the liabilities at the start of the reporting period. All other economic assumptions, eg. future bonus rates, are set at levels consistent with the real-world investment return assumptions.
Equity and property risk premiums incorporate both historical relationships and the directors’ view of future projected returns in each region over the analysis period. Pre-tax real-world economic assumptions are determined as follows (unchanged from prior period):
■ The equity risk premium is 3.7% for Africa and 3% for Europe ■ The cash return equals the one-year risk free reference rate for all regions ■ The property risk premium is 1.5% in Africa and 2% in Europe ■ Returns on corporate bonds reference actual yields from assets held ■ No risk premium is assumed for Old Mutual Bermuda’s Variable Annuity policyholder asset portfolios.
According to the simplified analysis of earnings approach, earnings for the Old Mutual Bermuda business no longer reflect an expected return component.

Old Mutual plcAnnual Report and Accounts 2013
264
B: Segment information
B1: Components of Group MCEV and Adjusted Group MCEV
£m
Notes
At31 December
2013
At31 December
2012
Adjusted net worth attributable to ordinary equity holders of the parent 5,450 5,774 Equity 7,270 7,816 Adjustment to IFRS net asset value C4 (1,294) (1,360)Adjustment to remove perpetual preferred callable securities (526) (682)
Value of in-force business B3 3,306 3,401
Present value of future profits 3,752 3,946 Additional time value of financial options and guarantees (2) (53)Frictional costs (222) (221)Cost of residual non-hedgeable risks (222) (271)
Group MCEV 8,756 9,175
Adjustments to bring Group investments to market valueAdjustment to bring listed subsidiary (Nedbank) to market value 1,157 1,281 Adjustment for value of own shares in ESOP schemes1 123 126 Adjustment for present value of Black Economic Empowerment scheme deferred consideration 201 245 Adjustment to bring external debt to market value (75) (37)
Adjusted Group MCEV 10,162 10,790
Group MCEV value per share (pence) 178.8 187.5
Adjusted Group MCEV per share (pence) 207.5 220.5
Number of shares in issue at the end of the financial period less treasury shares (millions) 4,897 4,893
Return on Group MCEV (RoEV) per annum from core operations 9.1% 6.7%Return on Group MCEV (RoEV) per annum from continuing non-core operations 0.3% 1.0%Return on Group MCEV (RoEV) per annum from discontinued operations 0.0% 0.3%Return on Group MCEV (RoEV)2 per annum 9.4% 8.0%
1 Includes adjustment for value of excess own shares in employee share scheme trusts. The movement in value between 31 December 2012 and 31 December 2013 is the net effect of the increase in the Old Mutual plc share price, the reduction in excess own shares following employee share grants during the period and the reduction in overall shares held due to exercises of rights to take delivery of, or net settle, share grants during the financial period.
2 The RoEV is calculated as the adjusted operating Group MCEV earnings after tax and non-controlling interests of £867 million (December 2012: £776 million) divided by the opening Group MCEV.
MCEVNOTES TO THE MCEV BASIS SUPPLEMENTARY INFORMATIONFor the year ended 31 December 2013

265
Financials
B2: Adjusted operating MCEV earnings for the covered business
£m
Year ended 31 December 2013
Total covered
business
Core covered
businessEmerging
MarketsOld Mutual
Wealth
Non-core covered
business
Discontinued covered
business1
Adjusted operating Group MCEV earnings before tax 643 612 450 162 31 –
Tax on adjusted operating Group MCEV earnings (160) (161) (122) (39) 1 –
Adjusted operating Group MCEV earnings after tax 483 451 328 123 32 –
£m
Year ended 31 December 2012
Total covered business
Core covered business
Emerging Markets
Old Mutual Wealth
Non-core covered business
Discontinued coveredbusiness1
Adjusted operating Group MCEV earnings before tax 571 454 459 (5) 99 18
Tax on adjusted operating Group MCEV earnings (118) (118) (131) 13 – –
Adjusted operating Group MCEV earnings after tax 453 336 328 8 99 18
1 Discontinued covered business includes earnings from previously owned Nordic business.
B3: Components of MCEV of the covered business
£m
At 31 December 2013
Total covered
business
Core covered
businessEmerging
Markets1Old Mutual
Wealth
Non-core covered
business2
Adjusted net worth 2,561 2,196 1,621 575 365
Free surplus 870 757 508 249 113 Required capital 1,691 1,439 1,113 326 252
Value of in-force 3,306 3,306 1,332 1,974 –
Present value of future profits 3,752 3,752 1,660 2,092 – Additional time value of financial options and guarantees3 (2) (2) – (2) – Frictional costs (222) (222) (206) (16) – Cost of residual non-hedgeable risks (222) (222) (122) (100) –
MCEV 5,867 5,502 2,953 2,549 365
£m
At 31 December 2012
Total covered business
Core covered business
EmergingMarkets1
Old Mutual Wealth
Non-core coveredbusiness2
Adjusted net worth 2,984 2,304 1,838 466 680
Free surplus 945 698 526 172 247 Required capital 2,039 1,606 1,312 294 433
Value of in-force 3,401 3,456 1,478 1,978 (55)
Present value of future profits 3,946 3,950 1,828 2,122 (4)Additional time value of financial options and guarantees3 (53) (14) – (14) (39)Frictional costs (221) (220) (207) (13) (1)Cost of residual non-hedgeable risks (271) (260) (143) (117) (11)
MCEV 6,385 5,760 3,316 2,444 625
1 The required capital in respect of Emerging Markets is partially covered by the market value of the Group’s investments in banking in South Africa. On consolidation these investments are shown separately.
2 For 2013, the valuation basis for Old Mutual Bermuda has been simplified from a full bottom-up MCEV calculation to an adjusted IFRS basis and the valuation therefore does not include a value of in-force component.
3 The time value of options and guarantees is fully reflected in reserves held as part of ANW in Emerging Markets and Old Mutual Bermuda, and is mostly covered by reserves held in Old Mutual Wealth. The significant reduction in the time value of options and guarantees in Old Mutual Wealth in 2013 is due to modelling changes.

Old Mutual plcAnnual Report and Accounts 2013
266
B: Segment information continued
B4: Analysis of covered business MCEV earnings (after tax)
£m
Year ended 31 December 2013 Year ended 31 December 2012
Total covered businessFree
surplusRequired
capital
Adjusted net
worthValue of in-force MCEV
Free surplus
Required capital
Adjusted net worth
Value of in-force MCEV
Opening MCEV 945 2,039 2,984 3,401 6,385 685 1,996 2,681 4,536 7,217 New business value (261) 148 (113) 325 212 (293) 163 (130) 327 197 Expected existing business contribution
(reference rate) 23 50 73 126 199 20 71 91 156 247 Expected existing business contribution
(in excess of reference rate) 6 10 16 38 54 3 29 32 49 81 Transfers from VIF and required capital
to free surplus 666 (170) 496 (496) – 695 (216) 479 (479) – Experience variances (47) 38 (9) 14 5 (14) 17 3 6 9 Assumption changes 6 (5) 1 (39) (38) 34 (7) 27 7 34 Other operating variance (26) 5 (21) 72 51 (26) 18 (8) (107) (115)
Operating MCEV earnings 367 76 443 40 483 419 75 494 (41) 453 Economic variances 197 21 218 157 375 258 3 261 259 520 Other non-operating variance 154 (178) (24) (30) (54) (284) 240 (44) (3) (47)
Total MCEV earnings 718 (81) 637 167 804 393 318 711 215 926 Closing adjustments (793) (267) (1,060) (262) (1,322) (133) (275) (408) (1,350) (1,758)
Capital and dividend flows (658) 7 (651) – (651) 41 (3) 38 1 39 Foreign exchange variance (105) (274) (379) (320) (699) (54) (145) (199) (139) (338)MCEV of sold business 15 – 15 – 15 (120) (127) (247) (1,212) (1,459)Other1 (45) – (45) 58 13 – – – – –
Closing MCEV 870 1,691 2,561 3,306 5,867 945 2,039 2,984 3,401 6,385
Return on MCEV (RoEV)2 per annum 7.6% 6.3%
1 Other includes the change in valuation basis in Old Mutual Bermuda, the inclusion of certain African entities (Zimbabwe, Kenya, Malawi, Swaziland and Nigeria) on an MCEV basis and an adjustment to allow for non-controlling interests in Zimbabwe.
2 Return on MCEV for total covered business is calculated as the operating MCEV earnings after tax divided by opening MCEV in sterling.
£m
Year ended 31 December 2013 Year ended 31 December 2012
Adjusted net worth
Value of in-force MCEV
Adjusted net worth
Value of in-force MCEV
Experience Variances (9) 14 5 3 6 9
Persistency (13) 15 2 51 10 61 Risk 38 5 43 52 – 52 Expenses (24) 1 (23) (48) 12 (36)Development costs (51) 1 (50) (43) (1) (44)Other 41 (8) 33 (9) (15) (24)
Assumption changes 1 (39) (38) 27 7 34
Persistency (16) (3) (19) 12 (25) (13)Risk 5 – 5 13 37 50 Expenses 18 (12) 6 12 12 24 Development costs – (18) (18) – (15) (15)Other (6) (6) (12) (10) (2) (12)
£m
Year ended 31 December 2014
Free surplus
Required capital
Adjusted net worth
Value of in-force MCEV
Expected existing business contribution (reference rate) 30 61 91 144 235
Expected existing business contribution (in excess of reference rate) 5 10 15 43 58
MCEVNOTES TO THE MCEV BASIS SUPPLEMENTARY INFORMATIONFor the year ended 31 December 2013

267
Financials
B5: Analysis per business unit
£m
Year ended 31 December 2013
Total covered
business
Core covered
businessEmerging
MarketsOld Mutual
Wealth
Non-core covered
business1
Discontinued covered
business2
Opening MCEV 6,385 5,760 3,316 2,444 625 –New business value 212 212 136 76 – –Expected existing business contribution (reference rate) 199 199 169 30 – –Expected existing business contribution (in excess of
reference rate) 54 54 30 24 – –Experience variances 5 (27) 1 (28) 32 –Assumption changes (38) (38) (12) (26) – –Other operating variance 51 51 4 47 – –
Operating MCEV earnings 483 451 328 123 32 –Economic variances 375 355 241 114 20 –Other non-operating variance (54) (54) (8) (46) – –
Total MCEV earnings 804 752 561 191 52 –Closing adjustments (1,322) (1,010) (924) (86) (312) –
Capital and dividend flows (651) (300) (187) (113) (351) –Foreign exchange variance (699) (701) (713) 12 2 –MCEV of acquired/sold business 15 15 – 15 – –Other3 13 (24) (24) – 37 –
Closing MCEV 5,867 5,502 2,953 2,549 365 –
Return on MCEV (RoEV)4 per annum 7.6% 7.8% 11.0% 5.0% 4.9% –
Transfers from VIF and required capital to free surplus
£m
Year ended 31 December 2013
Total covered
business
Core covered
businessEmerging
MarketsOld Mutual
Wealth
Non-core covered
business1
Discontinued covered
business2
Transfer from value of in-force (496) (496) (189) (307) – –Transfer from required capital (170) (170) (130) (40) – –Transfer to free surplus 666 666 319 347 – –
£m
Year ended 31 December 2013
Total covered
business
Core covered
businessEmerging
MarketsOld Mutual
Wealth
Non-core covered
business1
Discontinued covered
business2
Experience variances 5 (27) 1 (28) 32 –
Persistency 2 2 (9) 11 – –Risk 43 43 40 3 – –Expenses (23) (23) (17) (6) – –Development costs (50) (50) (16) (34) – –Other 33 1 3 (2) 32 –
Assumption changes (38) (38) (12) (26) – –Persistency (19) (19) (25) 6 – –Risk 5 5 3 2 – –Expenses 6 6 25 (19) – –Development costs (18) (18) (15) (3) – –Other (12) (12) – (12) – –
1 A simplified analysis of earnings approach has been adopted for Old Mutual Bermuda according to the new adjusted IFRS valuation approach.2 Discontinued covered business relates to MCEV information for the previously owned Nordic business.3 Other includes the change in valuation basis in Old Mutual Bermuda, the inclusion of certain African entities (Zimbabwe, Kenya, Malawi, Swaziland and Nigeria) on an MCEV
basis and an adjustment to allow for non-controlling interests in Zimbabwe.4 Return on MCEV is calculated as the operating MCEV earnings after tax divided by opening MCEV. This is calculated in local currency, apart from total covered and core covered
business, which are calculated in sterling. For Emerging Markets for 2013, this has been calculated after adjusting the opening balance for the inclusion of certain African entities (as above) on an MCEV basis and an adjustment to allow for non-controlling interests in Zimbabwe.

Old Mutual plcAnnual Report and Accounts 2013
268
B: Segment information continued
B5: Analysis per business unit continued
£m
Year ended 31 December 2012
Total covered business
Core covered business
Emerging Markets
Old MutualWealth
Non-core covered business
Discontinued coveredbusiness1
Opening MCEV 7,217 5,718 3,172 2,546 66 1,433 New business value 197 197 135 62 – –Expected existing business contribution (reference rate) 247 239 193 46 8 – Expected existing business contribution (in excess of
reference rate) 81 55 32 23 26 –Experience variances 9 (48) (29) (19) 39 18 Assumption changes 34 5 34 (29) 29 –Other operating variance (115) (112) (37) (75) (3) –
Operating MCEV earnings 453 336 328 8 99 18 Economic variances 520 403 281 122 117 –Other non-operating variance (47) (29) (26) (3) – (18)
Total MCEV earnings 926 710 583 127 216 –Closing adjustments (1,758) (668) (439) (229) 343 (1,433)
Capital and dividend flows 39 (321) (132) (189) 360 –Foreign exchange variance (338) (322) (307) (15) (17) 1 MCEV of acquired/sold business (1,459) (25) – (25) – (1,434)
Closing MCEV 6,385 5,760 3,316 2,444 625 –
Return on MCEV (RoEV)2 per annum 6.3% 5.9% 10.7% 0.3% 154.0% 1.3%
Transfers from VIF and required capital to free surplus
£m
Year ended 31 December 2012
Total covered business
Core covered business
Emerging Markets
Old MutualWealth
Non-core covered business
Discontinued coveredbusiness1
Transfer from value of in-force (479) (540) (220) (320) 61 –Transfer from required capital (216) (190) (153) (37) (26) –Transfer to free surplus 695 730 373 357 (35) –
£m
Year ended 31 December 2012
Total covered business
Core covered business
Emerging Markets
Old MutualWealth
Non-core covered business
Discontinued coveredbusiness1
Experience variances 9 (48) (29) (19) 39 18
Persistency 61 22 (1) 23 39 –Risk 52 52 46 6 – –Expenses (36) (38) (16) (22) 2 –Development costs (44) (44) (25) (19) – –Other (24) (40) (33) (7) (2) 18
Assumption changes 34 5 34 (29) 29 –
Persistency (13) (32) (6) (26) 19 –Risk 50 50 49 1 – –Expenses 24 4 6 (2) 20 –Development costs (15) (15) (15) – – –Other (12) (2) – (2) (10) –
1 Discontinued covered business relates to MCEV information for the previously owned Nordic business.2 Return on MCEV is calculated as the operating MCEV earnings after tax divided by opening MCEV. This is calculated in local currency, apart from total covered and core covered
business, which are calculated in sterling.
MCEVNOTES TO THE MCEV BASIS SUPPLEMENTARY INFORMATIONFor the year ended 31 December 2013
269
Financials
Results highlights
Core covered business ■ Favourable market performance led to positive economic variances of £241 million in Emerging Markets and £114 million in Old Mutual Wealth
■ Experience variances include development costs of £50 million. These costs reflect the cost of projects related to the development of new and existing business, infrastructure and systems. Excluding these costs, experience variances are a positive £23 million for the year
■ The depreciation of the rand against sterling over 2013 has led to reduced earnings from Emerging Markets in sterling and foreign exchange translation losses in MCEV closing adjustments.
Emerging MarketsNew business: VNB increased by 16% (in rand) compared to 2012 mainly due to higher sales volumes in Mass Foundation Cluster, increased single premium savings sales in Retail Affluent and annuity sales in Corporate Segment. Margins were however reduced by unfavourable operating assumption changes implemented at the end of 2013 (including the strengthening of persistency assumptions in Mass Foundation Cluster and an expense allocation change in Mexico).
Experience variances: Experience variances are a positive £17 million after excluding the development costs of £16 million. Positive mortality experience on protection business was partially offset by negative expense variances and worsening persistency experience on the Mass Foundation Cluster protection business. Positive expense variances in South African business units were more than offset by negative expense variances arising from central costs and costs in other emerging markets businesses (particularly in the Mexican business and those African businesses which are still sub-scale).
Operating assumption changes: Assumption changes include the strengthening of persistency assumptions used for Mass Foundation Cluster products (including distinguishing between debit order and stop order persistency) and an increased provision for development expenditure. These impacts are partially offset by the lowering of per-policy maintenance expense assumptions in Mass Foundation Cluster following the significant growth in the size of this business and the achievement of unit cost efficiencies.
Other operating variances: This includes various modelling changes and management actions. The most significant impacts relate to the effect of changes to the modelling of annual premium and cover increases on Mass Foundation Cluster funeral products and an improvement in the methodology used to value capital preservation options sold with Retail Affluent in-payment annuity products. These effects were largely offsetting.
Economic variances: Economic variances are mainly due to favourable investment performance on policyholder and shareholder funds, which include growth in local equity markets, particularly in South Africa, Zimbabwe and Malawi, and increased returns from assets invested in overseas markets due to the depreciation of the rand.
Other non-operating variances: Negative non-operating variances in 2013 include the impact of refinements to the way in which shareholder tax is reflected in MCEV models.
Closing adjustments: Significant net transfer items relate to the purchase of the Latin American businesses and the purchase of additional African operations in Ghana and Nigeria, as well as net dividends paid (after allowing for dividends received from Nedbank and the Property & Casualty business). In addition, the significant negative foreign exchange variance has resulted from the depreciation of the rand against sterling over 2013.
Old Mutual WealthNew business: VNB increased by 23% compared to 2012, largely due to lower acquisition costs following a number of cost saving measures implemented at the end of 2012. This impact was partially offset by a shift in UK Platform sales to products on less profitable charging structures. Overall sales for Old Mutual Wealth have declined slightly, with lower volumes from closed businesses mostly offset by improved sales volumes from Core and Manage for Value (Open) businesses.
Expected existing business contribution: The reduction in the expected existing business contribution compared to 2012 is mainly a result of lower risk-free yields at the start of 2013 used to calculate the expected investment return. In addition, the sale of Finland in 2012 has reduced the value of expected transfers in 2013.
Experience variances: Experience variances are a positive £6 million after excluding development costs of £34 million (including Wealth Interactive, Digital and the second phase of the Retail Distribution Review systems project). Positive persistency experience in the International business and positive mortality experience on protection products in Switzerland and Germany were partially offset by expense over-runs in the International business.
Operating assumption changes: Assumption changes are largely driven by the strengthening of per-policy maintenance expense assumptions in the International business and the reduction in assumed switching fee income in the International business (recorded in ‘other’). Persistency assumption changes are driven by the lightening of persistency assumptions on the UK Legacy unit-linked business, partially offset by the impact of anticipated transfers to lower margin charging structures on the UK Platform.
Other operating variances: The positive impact is mainly due to modelling changes implemented in the valuation of the German business. Other operating variances also include largely offsetting effects from the reduction in the CNHR due to improvements made to the assumed run off of risk capital and refinements to the pattern of assumed expenses in Germany as the business runs off.

Old Mutual plcAnnual Report and Accounts 2013
270
B: Segment information continued
B5: Analysis per business unit continued
Economic variances: Favourable economic variances were mainly due to investment gains on policyholder funds, which include favourable UK equity market performance, partially offset by the adverse impact of higher yields on the value of in-force business.
Other non-operating variances: Negative non-operating variances include the impact of changes in regulatory conditions of £24 million in Germany and £14 million in Switzerland, as well as costs related to the Nordic divestment of £13 million and the outsourcing of administration in the UK business of £10 million. These impacts are partially offset by the effect of reducing the UK shareholder tax rate from 23% to 20%.
Closing adjustments: Net transfers consist largely of the payment of dividends to Old Mutual plc. In addition, net transfers include capital contributions made to the UK Platform asset management business. MCEV of acquired/sold business consists of the release of a tax provision related to the sale of the Finnish business.
Non-core covered business (Old Mutual Bermuda)As a result of the change to a simplified analysis of earnings approach, all earnings are recorded under other operating experience variances, apart from variable annuity guarantee performance (net of hedge performance) and seed capital gains and losses, which are recorded in economic variances.
Experience variances: Positive experience is largely driven by favourable variable annuity persistency experience of £9 million and assumption changes of £10 million following the five year anniversary top-up period. In addition, there have been positive contributions from spread income on OM Group (UK) Limited loan notes of £7 million (net of interest credited to fixed annuity business), and an excess of fee income over operating and commission expenses of £4 million.
Economic variances: Favourable economic variances are largely due to positive variable annuity guarantee performance of £14 million (net of hedge experience) driven by the rise in US interest rates. In addition, economic variances include unrealised gains on seed capital investments of £7 million.
Closing adjustments: Capital and dividend flows are made up of the repatriation of £351 million of capital resources via the cancellation of OM Group (UK) Limited loan notes. Other closing adjustments consist of the valuation basis change from a bottom-up MCEV calculation basis to an adjusted IFRS basis of £37 million.
MCEVNOTES TO THE MCEV BASIS SUPPLEMENTARY INFORMATIONFor the year ended 31 December 2013

271
Financials
C: Other supporting information
C1: Value of new business (after tax)
The tables below set out the regional analysis of the value of new business (VNB) after tax. New business profitability is measured by both the ratio of the VNB to the present value of new business premiums (PVNBP) as well as to the annual premium equivalent (APE), and shown under PVNBP margin and APE margin below. APE is calculated as recurring premiums plus 10% of single premiums. Old Mutual Bermuda is excluded from the tables below as it is closed to new business.
£m
Year ended 31 December 2013
Annualised recurring
premiumsSingle
premiums PVNBP
PVNBPcapitalisation
factors1 APE VNBPVNBP margin APE margin
Core covered business 466 6,470 8,965 5.4 1,113 212 2.4% 19%
Emerging Markets2 355 1,513 3,409 5.3 507 136 4.0% 27%Old Mutual Wealth 111 4,957 5,556 5.4 606 76 1.4% 13%
Total covered business 466 6,470 8,965 5.4 1,113 212 2.4% 19%
£m
Year ended 31 December 2012
Annualised recurring
premiumsSingle
premiums PVNBP
PVNBPcapitalisation
factors1 APE VNBPVNBP margin APE margin
Core covered business 517 5,953 8,665 5.2 1,112 197 2.3% 18%
Emerging Markets3 370 1,321 3,331 5.4 502 135 4.1% 27%Old Mutual Wealth 147 4,632 5,334 4.8 610 62 1.2% 10%
Total covered business 517 5,953 8,665 5.2 1,112 197 2.3% 18%
1 The PVNBP capitalisation factors are calculated as follows: (PVNBP – single premiums)/annualised recurring premiums.2 New business figures for Africa excl. SA (net of minority interests), other than Namibia, are included under Emerging Markets for the first time in 2013. This includes new business
annualised recurring premiums of £15 million, single premiums of £49 million, APE of £20 million and VNB of £2 million in respect of the life business in Zimbabwe, Malawi, Kenya, Swaziland and Nigeria. 2012 information has not been restated to reflect this change.
3 New business figures for Africa excl. SA (gross of minority interests), other than Namibia, were not included in the 2012 information reported above as no value of new business and PVNBP calculations were reported for these businesses in 2012. The amounts for 2012, in respect of the life business in Zimbabwe, Malawi, Kenya, Swaziland and Nigeria are new business single premiums of £37 million, annualised recurring premiums of £17 million, and APE of £21 million.
Additional new business written in the GroupThe value of some of the new individual unit trust linked retirement annuities and pension fund asset management business written by the Emerging Markets long-term business of £1,011 million (2012: £1,093 million) is excluded from VNB above as the profits in this business arise in the asset management business. The value of new business also excludes premium increases arising from indexation arrangements in respect of existing business, as these are already included in the value of in-force business.
Additionally, new business single premiums of £202 million, annualised recurring premiums of £33 million, and APE of £53 million, in respect of the life business in India and China have been excluded from 2013 information above, as no value of new business and PVNBP calculations have been performed for these businesses.

Old Mutual plcAnnual Report and Accounts 2013
272
C: Other supporting information continued
C2: Adjustments applied in determining total Group MCEV earnings before tax£m
Year ended 31 December 2013 Year ended 31 December 2012
Covered business
MCEV
Non-covered
business IFRS
Total Group MCEV
Covered business
MCEV
Non-covered business
IFRS
Total Group MCEV
Income/(expense)Goodwill impairment and amortisation of non-covered
business acquired intangible assets and impact of acquisition accounting – (10) (10) – (7) (7)
Economic variances 513 (6) 507 657 (11) 646 Other non-operating variances (57) – (57) (56) – (56)Loss on disposal of subsidiaries, associated undertakings
and strategic investments – (4) (4) – (12) (12)Other Group adjustments related to Nordic disposal (13) 14 1 (14) 615 601 Restructuring costs (10) (10) (20) – – – Dividends declared to holders of perpetual preferred
callable securities – 42 42 – 42 42 Premium paid on early repayment of senior debt – – – – (71) (71)US Asset Management equity plans – (38) (38) – (13) (13)Fair value (losses)/gains on Group debt instruments – (31) (31) – (57) (57)
Adjusting items 433 (43) 390 587 486 1,073
Adjusting items from continuing operations 446 (57) 389 605 (113) 492 Adjusting items from discontinued operations (13) 14 1 (18) 599 581
Total MCEV adjusting items 433 (43) 390 587 486 1,073
C3: Other movements in IFRS net equity impacting Group MCEV£m
Year ended 31 December 2013 Year ended 31 December 2012
Covered business
MCEV
Non-covered
business IFRS
Total Group MCEV
Covered business
MCEV
Non-covered business
IFRS
Total Group MCEV
Fair value movements – 17 17 – (328) (328)Net investment hedge – 43 43 – 160 160 Currency translation differences/exchange differences on
translating foreign operations (699) (688) (1,387) (338) (677) (1,015)Aggregate tax effects of items taken directly to or
transferred from equity – 10 10 – 9 9 Other movements1 15 – 15 (1,444) 1,449 5
Net income recognised directly into equity (684) (618) (1,302) (1,782) 613 (1,169)Capital and dividend flows for the year2 (651) 268 (383) 24 (1,238) (1,214)Other3 13 (10) 3 – – – Net sale of treasury shares – 55 55 – 8 8 Premium on preferred securities purchased – (21) (21) – – – Other shares issued – 11 11 – 33 33 Change in share-based payment reserve – 48 48 – 62 62
Other movements in net equity (1,322) (267) (1,589) (1,758) (522) (2,280)
1 December 2012 includes the sale of the Finnish branch in Old Mutual Wealth, the impact of the IAS 19 restatement and the transfer of the Nordic covered MCEV balance on disposal.
2 December 2013 capital and dividend flows from the covered business includes the repatriation of funds from Old Mutual Bermuda to Old Mutual plc of £351 million. December 2012 capital and dividend flows from the covered business include the purchase of the businesses in Africa by Emerging Markets from Old Mutual plc and the capital injection of £360 million into Old Mutual Bermuda. The special dividend of £915 million, paid in 2012, is included in non-covered business.
3 Other for covered business includes the change in valuation basis in Old Mutual Bermuda, the inclusion of certain African entities (Zimbabwe, Kenya, Malawi, Swaziland and Nigeria) on an MCEV basis and an adjustment to allow for non-controlling interests in Zimbabwe.
MCEVNOTES TO THE MCEV BASIS SUPPLEMENTARY INFORMATIONFor the year ended 31 December 2013
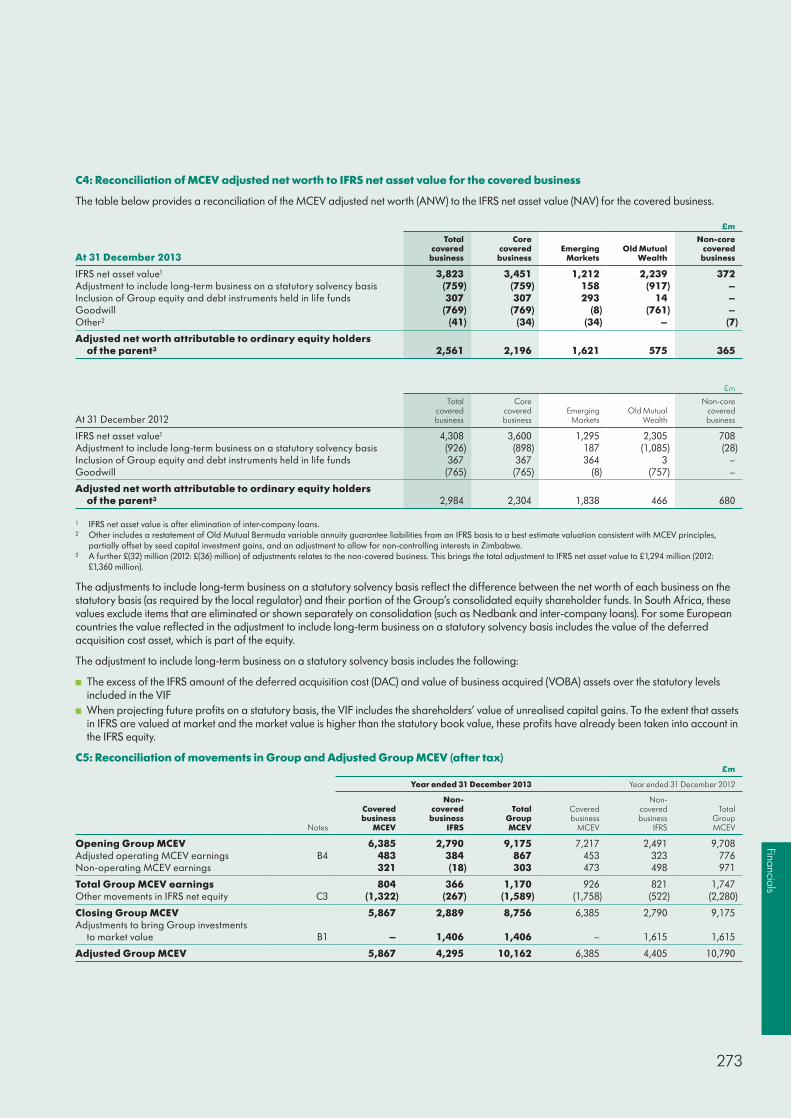
273
Financials
C4: Reconciliation of MCEV adjusted net worth to IFRS net asset value for the covered business
The table below provides a reconciliation of the MCEV adjusted net worth (ANW) to the IFRS net asset value (NAV) for the covered business.
£m
At 31 December 2013
Total covered
business
Core covered
businessEmerging
MarketsOld Mutual
Wealth
Non-core covered
business
IFRS net asset value1 3,823 3,451 1,212 2,239 372 Adjustment to include long-term business on a statutory solvency basis (759) (759) 158 (917) – Inclusion of Group equity and debt instruments held in life funds 307 307 293 14 – Goodwill (769) (769) (8) (761) – Other2 (41) (34) (34) – (7)
Adjusted net worth attributable to ordinary equity holders of the parent3 2,561 2,196 1,621 575 365
£m
At 31 December 2012
Total covered business
Core covered business
Emerging Markets
Old Mutual Wealth
Non-core covered business
IFRS net asset value1 4,308 3,600 1,295 2,305 708 Adjustment to include long-term business on a statutory solvency basis (926) (898) 187 (1,085) (28)Inclusion of Group equity and debt instruments held in life funds 367 367 364 3 – Goodwill (765) (765) (8) (757) –
Adjusted net worth attributable to ordinary equity holders of the parent3 2,984 2,304 1,838 466 680
1 IFRS net asset value is after elimination of inter-company loans.2 Other includes a restatement of Old Mutual Bermuda variable annuity guarantee liabilities from an IFRS basis to a best estimate valuation consistent with MCEV principles,
partially offset by seed capital investment gains, and an adjustment to allow for non-controlling interests in Zimbabwe.3 A further £(32) million (2012: £(36) million) of adjustments relates to the non-covered business. This brings the total adjustment to IFRS net asset value to £1,294 million (2012:
£1,360 million).
The adjustments to include long-term business on a statutory solvency basis reflect the difference between the net worth of each business on the statutory basis (as required by the local regulator) and their portion of the Group’s consolidated equity shareholder funds. In South Africa, these values exclude items that are eliminated or shown separately on consolidation (such as Nedbank and inter-company loans). For some European countries the value reflected in the adjustment to include long-term business on a statutory solvency basis includes the value of the deferred acquisition cost asset, which is part of the equity.
The adjustment to include long-term business on a statutory solvency basis includes the following:
■ The excess of the IFRS amount of the deferred acquisition cost (DAC) and value of business acquired (VOBA) assets over the statutory levels included in the VIF
■ When projecting future profits on a statutory basis, the VIF includes the shareholders’ value of unrealised capital gains. To the extent that assets in IFRS are valued at market and the market value is higher than the statutory book value, these profits have already been taken into account in the IFRS equity.
C5: Reconciliation of movements in Group and Adjusted Group MCEV (after tax)£m
Year ended 31 December 2013 Year ended 31 December 2012
Notes
Covered business
MCEV
Non-covered
business IFRS
Total Group MCEV
Covered business
MCEV
Non-covered business
IFRS
Total Group MCEV
Opening Group MCEV 6,385 2,790 9,175 7,217 2,491 9,708 Adjusted operating MCEV earnings B4 483 384 867 453 323 776 Non-operating MCEV earnings 321 (18) 303 473 498 971
Total Group MCEV earnings 804 366 1,170 926 821 1,747 Other movements in IFRS net equity C3 (1,322) (267) (1,589) (1,758) (522) (2,280)
Closing Group MCEV 5,867 2,889 8,756 6,385 2,790 9,175 Adjustments to bring Group investments
to market value B1 – 1,406 1,406 – 1,615 1,615
Adjusted Group MCEV 5,867 4,295 10,162 6,385 4,405 10,790
Old Mutual plcAnnual Report and Accounts 2013
274
D1: Sensitivity tests
The table below shows the sensitivity of the MCEV, value of in-force business at 31 December 2013 and the value of new business for the year ended 31 December 2013 to the following:
■ Economic assumptions 100 bps increase/decrease: Increasing/decreasing all pre-tax investment and economic assumptions (projected investment returns and inflation) by 100 bps, with credited rates and discount rates changing commensurately
■ Equity/property market value 10% increase/decrease: Equity and property market value increasing/decreasing by 10%, with all pre-tax investment and economic assumptions unchanged
■ 10 bps increase of liquidity spreads: Recognising the present value of an additional 10 bps of liquidity spreads assumed on corporate bonds over the lifetime of the liabilities, with credited rates and discount rates changing commensurately
■ 50 bps contraction on corporate bond spreads
■ 25% increase in equity/property and swaption implied volatilities: 25% multiplicative increase in implied volatilities
■ 10% decrease in discontinuance rates/10% decrease in maintenance expense: Maintenance expense levels decreasing by 10%, with no corresponding decrease in policy charges
■ 5% decrease in mortality/morbidity rates: Mortality and morbidity assumptions for assurances decreasing by 5%, with no corresponding decrease in policy charges
■ 5% decrease in annuitant mortality assumption: Mortality assumption for annuities decreasing by 5%, with no corresponding increase in policy charges
■ VNB 10% increase in acquisition expenses: For value of new business, acquisition expenses other than commission and commission related expenses increasing by 10%, with no corresponding increase in policy charges
■ VNB on closing economic assumptions: Value of new business calculated on economic assumptions at the end of the reporting period
■ Minimum capital requirement: Required capital equal to the minimum statutory requirement
■ NHR capital diversification: Residual non-hedgeable risk capital reduced to incorporate diversification benefits between hedgeable and non-hedgeable risks for covered business
■ 99.93% confidence level NHR capital: Economic capital for residual non-hedgeable risks calculated assuming a 99.93% confidence level.
For each sensitivity illustrated, all other assumptions have been left unchanged except where they are directly affected by the revised conditions. Sensitivity scenarios therefore include consistent changes in cash flows directly affected by the changed assumption(s), for example future bonus participation in changed economic scenarios.
In some jurisdictions the reserving basis that underlies shareholder distributable cash flows is dynamic, and in theory some sensitivities could change not only future experience but also reserving levels. Modelling of dynamic reserves is extremely complex and the effect on value is second-order. Therefore, in performing the sensitivities, reserving bases have been kept constant for non-linked business (including non-linked reserves for linked business) whilst only varying future experience assumptions with similar considerations applying to required capital. However, the sensitivities for South Africa in respect of an increase/decrease of all pre-tax investment and economic assumptions, an increase/decrease in equity and property market values and increases in equity, property and swaption implied volatilities allow for the change in the time value of financial options and guarantees that form part of the Investment Guarantee Reserves (IGR).
The sensitivities for an increase/decrease in all pre-tax investment and economic assumptions (with credited rates and discount rates changing commensurately) are calculated in line with a parallel shift in risk free reference spot rates rather than risk free reference forward rates. However, the 1% reduction is limited so that it does not lead to negative risk free reference rates.
VNB sensitivities assume that the scenario arises immediately after point of sale of the contract. Therefore no allowance is made for the ability to re-price any contracts in the sensitivity scenarios, apart from the mortality sensitivities for the South African business where allowance is made for changes in the pricing basis for products with reviewable premiums.
MCEVNOTES TO THE MCEV BASIS SUPPLEMENTARY INFORMATIONFor the year ended 31 December 2013

275
Financials
D1: Sensitivity tests continued
Sensitivity tests: MCEV£m
At 31 December 2013 At 31 December 2012
MCEV
Value of in-force
businessValue of
new business MCEV
Value of in-force
businessValue of
new business
Central assumptions 5,867 3,306 212 6,365 3,401 197 MCEV, VIF & VNB given changes in:
Economic assumption 100 bps increase 5,739 3,188 199 6,253 3,285 180 Economic assumption 100 bps decrease 5,990 3,412 222 6,471 3,505 215 Equity/property market value 10% increase 6,030 3,418 219 6,647 3,632 206 Equity/property market value 10% decrease 5,629 3,122 206 6,169 3,248 192 10 bps increase of liquidity spreads 5,873 3,312 213 6,374 3,410 198 50 bps contraction on corporate bond spreads 5,879 3,306 212 6,380 3,402 197 25% increase in equity/property implied volatilities 5,790 3,236 212 6,311 3,358 197 25% increase in swaption implied volatilities 5,854 3,293 212 6,353 3,389 197 10% decrease in discontinuance rates 6,031 3,473 251 6,519 3,568 237 10% decrease in maintenance expense 6,043 3,482 229 6,580 3,616 216 5% decrease in mortality/morbidity rates 5,976 3,415 227 6,495 3,531 214 5% decrease in annuitant mortality assumption 5,863 3,302 211 6,358 3,394 197 VNB 10% increase in acquisition expenses n/a n/a 197 n/a n/a 180 VNB on closing economic assumptions n/a n/a 206 n/a n/a 205 Minimum capital requirement 5,920 3,359 217 6,421 3,457 202 NHR capital diversification 5,893 3,332 215 6,408 3,444 201 99.93% confidence level NHR capital 5,822 3,261 207 6,306 3,342 192

Old Mutual plcAnnual Report and Accounts 2013
276
SHAREHOLDERINFORMATION
Listings and shares in issueThe Company’s shares are listed on the London, Malawi, Namibian and Zimbabwe Stock Exchanges and on the JSE Limited (JSE). The primary listing, which is known as a premium listing, is on the London Stock Exchange and the other listings are all secondary listings. The Company’s secondary listing on the Stockholm Stock Exchange ended in September 2007, but the Company’s shares may still be traded on the Xternal list of the Nordic Exchange in Stockholm. The ISIN number of the Company’s ordinary shares of 113⁄7p each is GB00B77J0862 and the SEDOL is B77J086. The 113⁄7p nominal value of the Company’s shares reflects the 7-for-8 share consolidation that took place in April 2012.
The high and low closing prices of the Company’s shares on the two main markets on which they were listed during 2013 and 2012 were as follows:
High2013 Low High
2012 Low
London Stock Exchange 221.6p 170.8p 179.6p 137.8pJSE R33.89 R24.49 R24.87 R17.53
At 31 December 2013, the Company had over 480,000 underlying shareholders. Many of our retail shareholders hold their shares through the Company-sponsored nominee arrangements described in the footnote to the second table below. In more detail, the geographical analysis and shareholder profile of the Company’s share register at 31 December 2013 were as follows:
Register Total shares % of wholeNumber
of holders
UK 2,350,459,978 47.99 10,378South Africa 2,475,347,425 50.55 28,433Zimbabwe 54,734,804 1.12 29,614Namibia 12,111,359 0.25 524Malawi 4,614,238 0.09 4,533
Total 4,897,267,804 100 73,482
Source: Computershare Investor Services
Size of holding Total shares % of wholeNumber
of holders
1-1,000 19,884,155 0.41 63,5801,001-10,000 21,766,250 0.45 8,35610,001-100,000 29,030,960 0.59 968100,001-250,000 29,082,485 0.59 182250,001+ 4,797,503,954 97.96 396
Total 4,897,267,804 100 73,482
Source: Computershare Investor Services
NoteThe registered shareholdings on the South African branch register included PLC Nominees (Pty) Limited, which held a total of 2,154,895,994 shares, including 268,909,840 shares held for the Company’s sponsored nominee, Old Mutual (South Africa) Nominees (Pty) Limited, for the benefit of 396,158 underlying beneficial owners. The registered shareholdings on the Zimbabwe branch register included Old Mutual Zimbabwe Nominees (Pvt) Limited, which held a total of 680,963 shares as nominee for 3,477 underlying beneficial owners. The registered shareholdings on the Namibian section of the principal register included Old Mutual (Namibia) Nominees (Pty) Limited, which held a total of 5,388,826 shares as nominee for 6,772 underlying beneficial owners. The registered shareholdings on the Malawi branch register included Old Mutual (Blantyre) Nominees Limited, which held a total of 55,179 shares as nominee for 136 underlying beneficial owners.
277
RegistrarsThe Company’s share register is administered by Computershare Investor Services in conjunction with local representatives in various jurisdictions. The following are the relevant contact details:
UK Computershare Investor Services PLCThe PavilionsBridgwater RoadBristol BS99 6ZZTel: +44 (0)870 707 1212Website: www.investorcentre.co.uk/contactus
South Africa Computershare Investor Services Pty Ltd70 Marshall Street, Johannesburg 2001(PO Box 61051, Marshalltown 2107)Tel: 0861 100 940 or +27 (0)11 870 8211email: [email protected]
MalawiNational Bank of MalawiBusiness Centre and Office ComplexFinancial Management Services DepartmentNo 7 Henderson StreetCnr Hannover Avenue & Henderson StreetBlantyre(PO Box 1438, Blantyre, Malawi)email: [email protected]: +265 182 0622/0054
NamibiaTransfer Secretaries (Pty) Limited4 Robert Mugabe Avenue, Windhoek(PO Box 2401, Windhoek)Tel: +264 (0)61 227647Fax: +264 (0)61 248531email: [email protected]
ZimbabweCorpserve Share Transfer Secretaries2nd Floor, ZB CentreCnr First Street/Kwame Nkrumah AvenueHarare(PO Box 2208, Harare, Zimbabwe)Tel: +263 (0)4 751559/61Fax: +263 (0)4 752629email: [email protected]
Share-dealing servicesDetails of various share-dealing services in the UK, South Africa and Namibia that are available through the Company’s share registrars, Computershare Investor Services, can be found in the Shareholder Information section of the Company’s website.
StrateAll transactions in the Company’s shares on the JSE are required to be settled electronically through Strate, and share certificates are no longer good for delivery in respect of such transactions. Shareholders who have any enquiries about the effect of Strate on their holdings in the Company should contact Computershare Investor Services in Johannesburg on 0861 100 940 or +27 (0)11 870 8211.
Electronic communications and electronic proxy appointmentThe Company wrote to shareholders on its South African branch register and on the principal and Namibian sections of its UK register in November 2012 to inform them that it was moving to e-comms as the default form of communication, in line with provisions in the UK Companies Act 2006 and the Company’s Articles of Association. Shareholders who wished to continue to receive physical copies of shareholder communications, rather than accessing these from the Company’s website, were required to notify the Company’s registrars of their election to do so by 4 January 2013. A similar process has been followed, with different applicable dates, for new shareholders who have bought shares since November 2012. For the time being, these arrangements have not been extended to apply to shareholders on the Malawi and Zimbabwe branch registers, but the Company plans to keep the possibility of doing so under review.
If you are currently still receiving documents by post, but would like to receive future communications from the Company by email, please log on to our website, www.oldmutual.com, select ‘Investor Relations’, then ‘Shareholder Centre’, then click on ‘Electronic Communications’ and follow the instructions for registration of your details. In order to register, you will need your Shareholder Reference Number, which can be found on the payment advice notice or tax voucher accompanying your last dividend payment or notification. Before you register, you will be asked to agree to the Terms and Conditions for Electronic Communications with Shareholders. It is important that you read these Terms and Conditions carefully, as they set out the basis on which electronic communications will be sent to you. Any election to receive documents electronically will generally remain in force until you contact the Company’s Registrars (via the online address set out earlier in this section of the Report or otherwise) to terminate or change such election.
Electronic proxy appointment is available for this year’s Annual General Meeting. This enables proxy votes to be submitted electronically, as an alternative to filling out and posting a form of proxy. Further details are set out on the form of proxy.
Final dividend for the year ended 31 December 2013 and timetable for paymentThe Board is recommending a final dividend (the ‘Final Dividend’) for the year ended 31 December 2013 of 6.0p per share, which will be paid on 30 May 2014, subject to being approved by shareholders at the Company’s 2014 Annual General Meeting. Shareholders on the South African, Zimbabwe and Malawi branch registers and the Namibian section of the principal register will be paid their local currency cash equivalents of the Final Dividend under dividend access trust or similar arrangements established in each country. Shareholders who hold their shares through Euroclear Sweden AB, the Swedish nominee, will be paid the cash equivalent of the Final Dividend in Swedish kronor. Local currency cash equivalents of the Final Dividend for all five territories will be determined by the Company using exchange rates prevailing at the close of business on 10 April 2014 and will be announced by the Company on 11 April 2014.
A scrip dividend alternative is not being made available in relation to the Final Dividend.
Old Mutual plcAnnual Report and Accounts 2013
278
The full timetable for the Final Dividend is set out below.
Currency conversion date Thursday, 10 April 2014
Exchange rates announced Friday, 11 April 2014
Last day to trade cum dividend for shareholders on the branch register in Malawi Monday, 14 April 2014
Ex-dividend date for shareholders on the branch register in Malawi Tuesday, 15 April 2014
Last day to trade cum dividend for shareholders on the branch registers in South Africa and Zimbabwe and on the Namibian section of the principal register Wednesday, 16 April 2014
Ex-dividend date for shareholders on the branch registers in South Africa and Zimbabwe and on the Namibian section of the principal register Thursday, 17 April 2014
Trading suspended between registersopening of business on
Thursday, 17 April 2014
Last day to trade cum dividend for shareholders on the UK register Tuesday, 22 April 2014
Ex-dividend date for shareholders on the UK register Wednesday, 23 April 2014
Record date (all locations)close of business on
Friday, 25 April 2014
Trading between registers (except South Africa) recommences
opening of business on Monday, 28 April 2014
Trading between registers (South Africa) recommences
opening of business on Tuesday, 29 April 2014
Annual General Meeting Thursday, 15 May 2014
Final Dividend Payment Date Friday, 30 May 2014
Share certificates for shareholders on the South African register may not be dematerialised or rematerialised between 17 and 25 April 2014, both dates inclusive, and transfers between the registers may not take place during that period.
Financial calendar for the rest of 2014The Company’s financial calendar for the rest of 2014 is as follows:
Annual General Meeting and First Quarter Interim Management Statement 15 May 2014
Interim results 7 August 2014
Interim dividend payment date 31 October 2014
Third Quarter Interim Management Statement 5 November 2014
Final results for 2014 27 February 2015
SHAREHOLDERINFORMATION continued

279
NOTES

Old Mutual plcAnnual Report and Accounts 2013
280
NOTES

Forward-looking statementsThis Report contains certain forward-looking statements with respect to Old Mutual plc’s and its subsidiaries’ plans and expectations relating to their financial condition, performance and results. By their nature, forward-looking statements involve risk and uncertainty because they relate to future events and circumstances that are beyond Old Mutual plc’s control, including, among other things, UK domestic and general economic and business conditions, market-related risks such as fluctuations in interest rates and exchange rates, policies and actions of regulatory authorities, the impact of competition, inflation, deflation, the timing and impact of other uncertainties or of future acquisitions or combinations within relevant industries, as well as the impact of tax and other legislation and regulations in territories where Old Mutual plc or its subsidiaries operate.
As a result, Old Mutual plc’s or its subsidiaries’ actual future financial condition, performance and results may differ materially from the plans and expectations set forth in such forward-looking statements. Old Mutual plc undertakes no obligation to update any forward-looking statements contained in this Report or any other forward-looking statements that it may make.
AcknowledgementsDesigned and produced by MerchantCantos www.merchantcantos.com
Printed by Park Communications on FSC® certified paper.
Park is EMAS certified company and its Environmental Management System is certified to ISO 14001.
100% of the inks used are vegetable oil based, 95% of press chemicals are recycled for further use and, on average 99% of any waste associated with this production will be recycled.
This document is printed on Amadeus 100 Silk and Amadeus 75 Matt, papers containing recycled and virgin fibre sourced from a well-managed, responsible forests certified by the FSC®. The pulp used in this product is bleached using an elemental chlorine free (ECF) process.

Old Mutual plc Registered in England and Wales No. 3591559 and as an external company in each of South Africa (No. 1999/004855/10), Malawi (No. 5282), Namibia (No. F/3591559) and Zimbabwe (No. E1/99)
Registered Office: 5th Floor Millennium Bridge House 2 Lambeth Hill London EC4V 4GG
www.oldmutual.com