Download - 06 PERT.pdf

1
Handling Uncertainty in Time
Project Networks
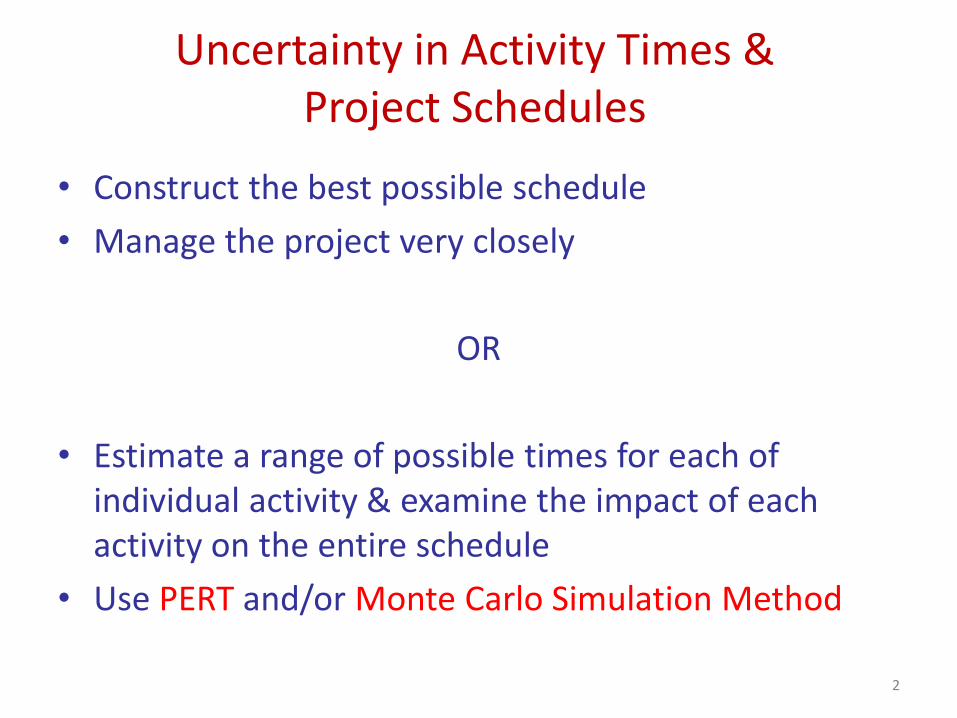
Uncertainty in Activity Times & Project Schedules
• Construct the best possible schedule
• Manage the project very closely
OR
• Estimate a range of possible times for each of individual activity & examine the impact of each activity on the entire schedule
• Use PERT and/or Monte Carlo Simulation Method
2

3
Program Evaluation and Review Technique (PERT)
PERT
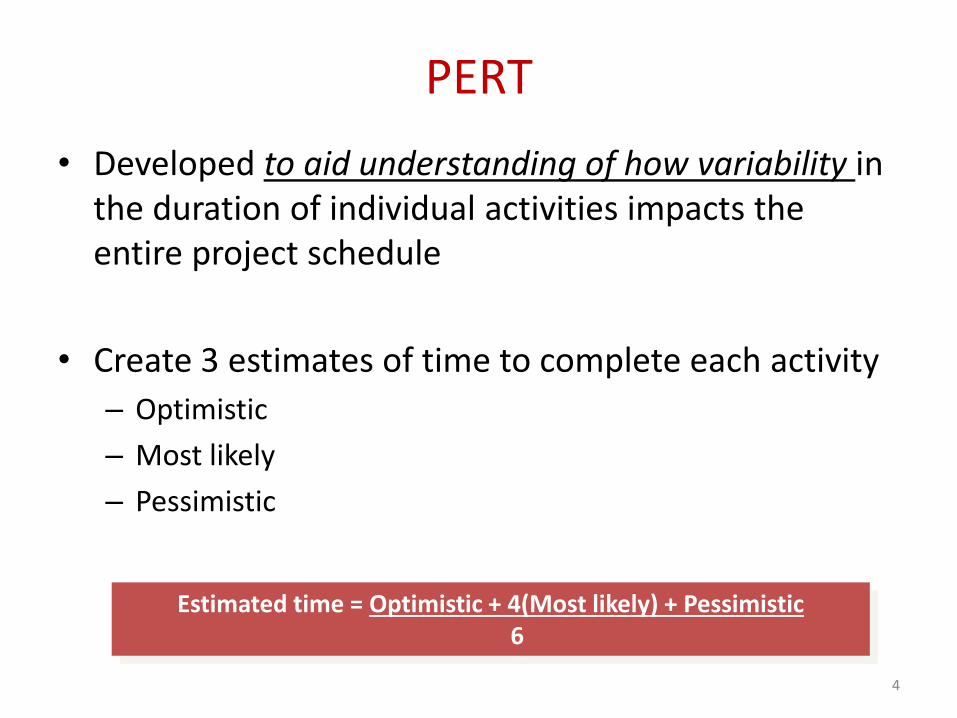
• Developed to aid understanding of how variability in the duration of individual activities impacts the entire project schedule
• Create 3 estimates of time to complete each activity
– Optimistic
– Most likely
– Pessimistic
Estimated time = Optimistic + 4(Most likely) + Pessimistic6
4

General Foundry Example of PERT
• General Foundry, Inc. has long been trying to avoid the expense of installing air pollution control equipment.
• The local environmental protection group has recently given the foundry 16 weeks to install a complex air filter system on its main smokestack.
• General Foundry was warned that it will be forced to close unless the device is installed in the allotted period.
• They want to make sure that installation of the filtering system progresses smoothly and on time.
ACTIVITY DESCRIPTIONIMMEDIATE PREDECESSORS
A Build internal components —
B Modify roof and floor —
C Construct collection stack A
D Pour concrete and install frame B
E Build high-temperature burner C
F Install control system C
G Install air pollution device D, E
H Inspect and test F, G
Activities and immediate predecessors for General Foundry
5

General Foundry Example of PERT
Network for General Foundry
A
Build Internal Components
H
Inspect and Test
E
Build Burner
C
Construct Collection Stack
Start
F
Install Control System
Finish
G
Install Pollution Device
D
Pour Concrete and Install Frame
B
Modify Roof and Floor
6
Start node and end nodes are added to avoid dangler paths

Activity Times
• In some situations, activity times are known with certainty
• CPM assigns just one time estimate to each activity and this is used to find the critical path
• In many projects there is uncertainty about activity times
• PERT employs a probability distribution based on three time estimates for each activity
• A weighted average of these estimates is used for the time estimate and this is used to determine the critical path
7

Activity Times
The time estimates in PERT are
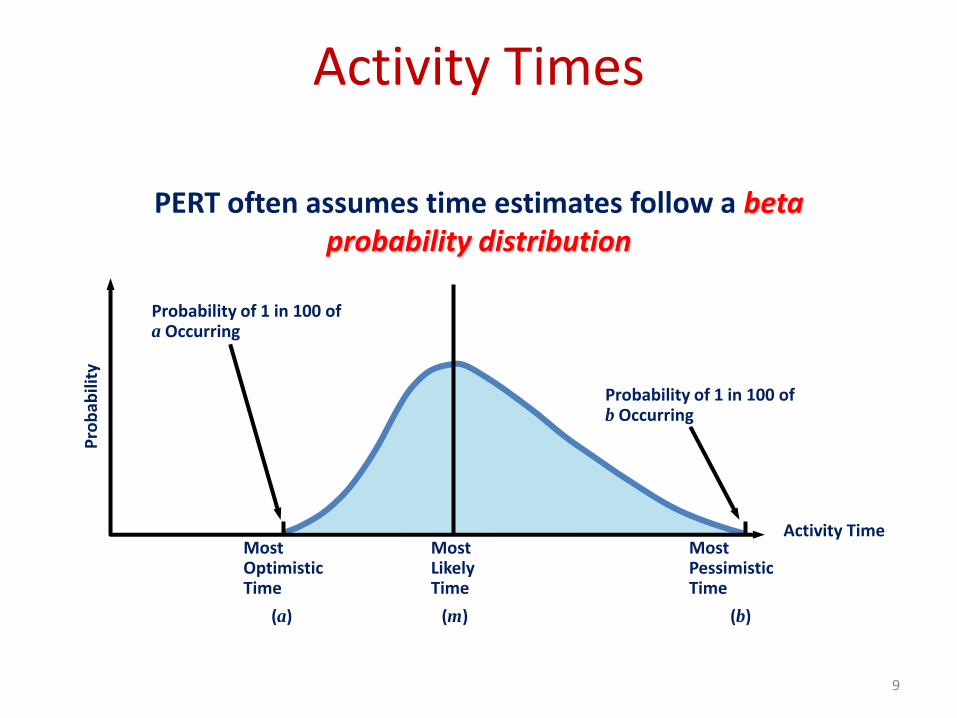
Optimistic time (a) = time an activity will take if everything goes as well as possible. There should be only a small probability (say, 1/100) of this occurring.
Pessimistic time (b) = time an activity would take assuming very unfavorable conditions. There should also be only a small probability that the activity will really take this long.
Most likely time (m) = most realistic time estimate to complete the activity
8
Activity Times
PERT often assumes time estimates follow a beta probability distribution
Probability of 1 in 100 of a Occurring
Probability of 1 in 100 of b Occurring
Pro
bab
ility
Activity TimeMost Likely Time
(m)
Most Optimistic Time
(a)
Most Pessimistic Time
(b)
9

Activity Times
To find the expected activity time (t), the beta distribution weights the estimates as follows
6
4 bmat
To compute the dispersion or variance of activity completion time, we use the formula
2
6Variance
ab
This formula is based on the statistical concept that from one end of the beta distribution to the other are 6 standard deviation (+/- 3 s.d. from the mean). Because (b-a) is 6 s.d., the one s.d. is (b-a)/6. Thus the variance is [(b-a)/6]^2
10

Activity Times
Time estimates (weeks) for General Foundry
ACTIVITYOPTIMISTIC, a
MOST PROBABLE, m
PESSIMISTIC, b
EXPECTED TIME, t = [(a + 4m + b)/6]
VARIANCE, [(b – a)/6]2
A 1 2 3 2 4/36
B 2 3 4 3 4/36
C 1 2 3 2 4/36
D 2 4 6 4 16/36
E 1 4 7 4 36/36
F 1 2 9 3 64/36
G 3 4 11 5 64/36
H 1 2 3 2 4/36
25
11
Total expected time is 25 if the activities are carried out sequence.

How to Find the Critical Path
• We accept the expected completion time for each task as the actual time for now
• The total of 25 weeks in previous Table does not take into account the obvious fact that some of the tasks could be taking place at the same time
• To find out how long the project will take we perform the critical path analysis for the network
• The critical path is the longest path through the network
12

How to Find the Critical Path
General Foundry’s network with expected activity times
A 2 C 2
H 2E 4
B 3 D 4 G 5
F 3
Start Finish
13

How to Find the Critical PathTo find the critical path, need to determine the following
quantities for each activity in the network
1. Earliest start time (ES): the earliest time an activity can begin without violation of immediate predecessor requirements
2. Earliest finish time (EF): the earliest time at which an activity can end
3. Latest start time (LS): the latest time an activity can begin without delaying the entire project
4. Latest finish time (LF): the latest time an activity can end without delaying the entire project
14
Use Two-Pass method to find ES, EF, LS and LF as described in the CPM

How to Find the Critical Path
A 2
0 2
0 2
C 2
2 4
2 4
H 2
13 15
13 15
E 4
4 8
4 8
B 3
0 3
1 4
D 4
3 7
4 8
G 5
8 13
8 13
F 3
4 7
10 13
Start Finish
15
ACTIVITY t
ES EF
LS LF

How to Find the Critical Path
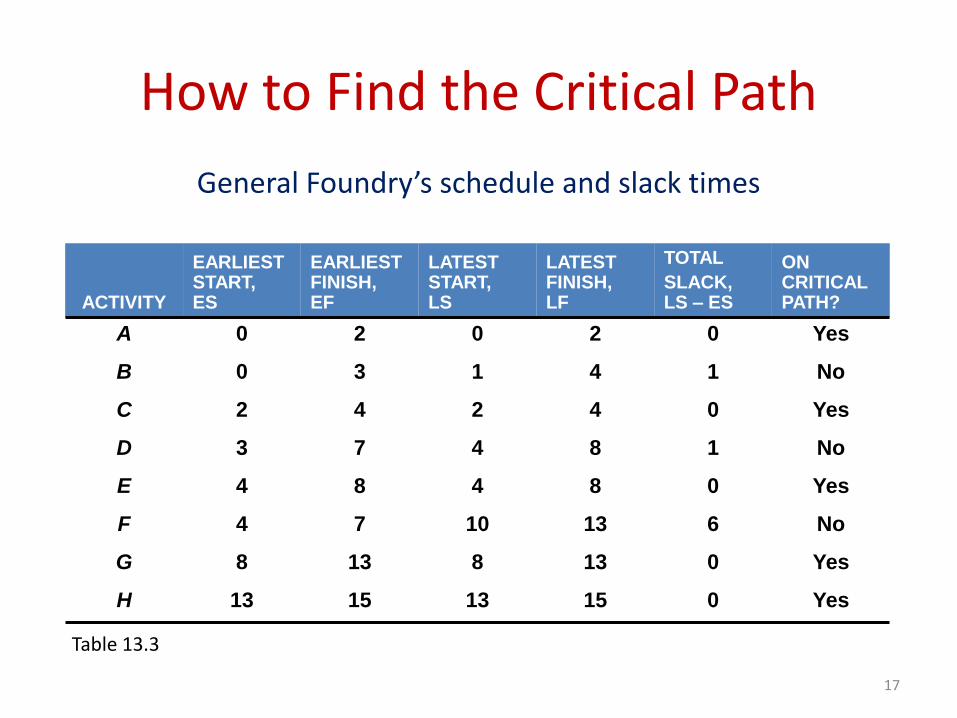
• Once ES, LS, EF, and LF have been determined, it is a simple matter to find the amount of total slack time (also called as total float) that each activity has
• Total Slack = LS – ES, or Total Slack = LF – EF
• From Table, we see activities A, C, E, G, and H have no slack time
• These are called critical activities and they are said to be on the critical path
• The total project completion time is 15 weeks
Total Slack is the length of the time an activity can be delayed without delaying the whole project
16
How to Find the Critical Path
General Foundry’s schedule and slack times
ACTIVITY
EARLIEST START, ES
EARLIEST FINISH, EF
LATEST START, LS
LATEST FINISH, LF
TOTAL
SLACK, LS – ES
ON CRITICAL PATH?
A 0 2 0 2 0 Yes
B 0 3 1 4 1 No
C 2 4 2 4 0 Yes
D 3 7 4 8 1 No
E 4 8 4 8 0 Yes
F 4 7 10 13 6 No
G 8 13 8 13 0 Yes
H 13 15 13 15 0 Yes
Table 13.3
17

How to Find the Critical PathGeneral Foundry’s critical path
A 2
0 2
0 2
C 2
2 4
2 4
H 2
13 15
13 15
E 4
4 8
4 8
B 3
0 3
1 4
D 4
3 7
4 8
G 5
8 13
8 13
F 3
4 7
10 13
Start Finish
18
TS=0 FS=0 TS=0 FS=0 TS=6 FS=6
TS=1 FS=0 TS=1 FS=1 TS=0 FS=0
TS=0 FS=0TS=0 FS=0
Free slack (or Free Float) - Free slack is unique. It is the amount of time an activity can be delayed without delaying ES of any of immediately following
(successor) activity. Normally, Free Slack <= Total Slack.
TS = Total SlackFS = Free Slack

Probability of Project Completion
• The critical path analysis helped determine the expected project completion time of 15 weeks
• But variation in activities on the critical path can affect overall project completion, and this is a major concern
• If the project is not complete in 16 weeks, the foundry will have to close
• PERT uses the variance of critical path activities to help determine the variance of the overall project
Project variance = ∑ variances of activities on the critical path
19

Probability of Project Completion
From Table 13.2 we know that
ACTIVITY VARIANCE
A 4/36
B 4/36
C 4/36
D 16/36
E 36/36
F 64/36
G 64/36
H 4/36
Hence, the project variance (critical activities) is
Project variance = 4/36 + 4/36 + 36/36 + 64/36 + 4/36 = 112/36 = 3.111
20

Probability of Project Completion
We know the standard deviation is just the square root of the variance, so
varianceProject deviation standardProject T
weeks1.76113 .
21

Probability of Project Completion
Probability distribution for project completion times
Standard Deviation = 1.76 Weeks
(Expected Completion Time)
15 Weeks
Figure 13.7
2 Assumptions: We assume activity times are independent and total project completion time is normally distributed
22

Probability of Project Completion
The standard normal equation can be applied as follows
T
Z
completion of date Expecteddate Due
570 weeks1.76
weeks15 weeks16.
From Normal prob. Table, we find the probability of 0.71566 associated with this Z value
That means there is a 71.6% probability this project can be completed in 16 weeks or less
23

Probability of Project Completion
Probability of General Foundry meeting the 16-week deadline
0.57 Standard Deviations
Time15
Weeks16Weeks
Expected Time is 15 Weeks
Probability(T ≤ 16 Weeks)is 71.6%
You should be aware that noncritical activities also has variability. In fact a different critical path can evolve because of the probabilistic situation. This may cause probabilistic estimate to be unreliable. In such a situation, it is better to use simulation to determine probabilities. 24
What PERT Was Able to Provide
• PERT has been able to provide the project manager with several valuable pieces of information
• The project’s expected completion date is 15 weeks
• There is a 71.6% chance that the equipment will be in place within the 16-week deadline
• Five activities (A, C, E, G, H) are on the critical path
• Three activities (B, D, F) are not critical but have some slack time built in
• A detailed schedule of activity starting and ending dates has been made available
25

26
Self Practice Problem:

27

28
Backup


