
1
393SYS 393SYS Airport Engineering Airport Engineering
PracticePractice
Lecture 1Lecture 1Fundamentals of Fundamentals of
MaintenanceMaintenance
2
Airport Engineering Practices
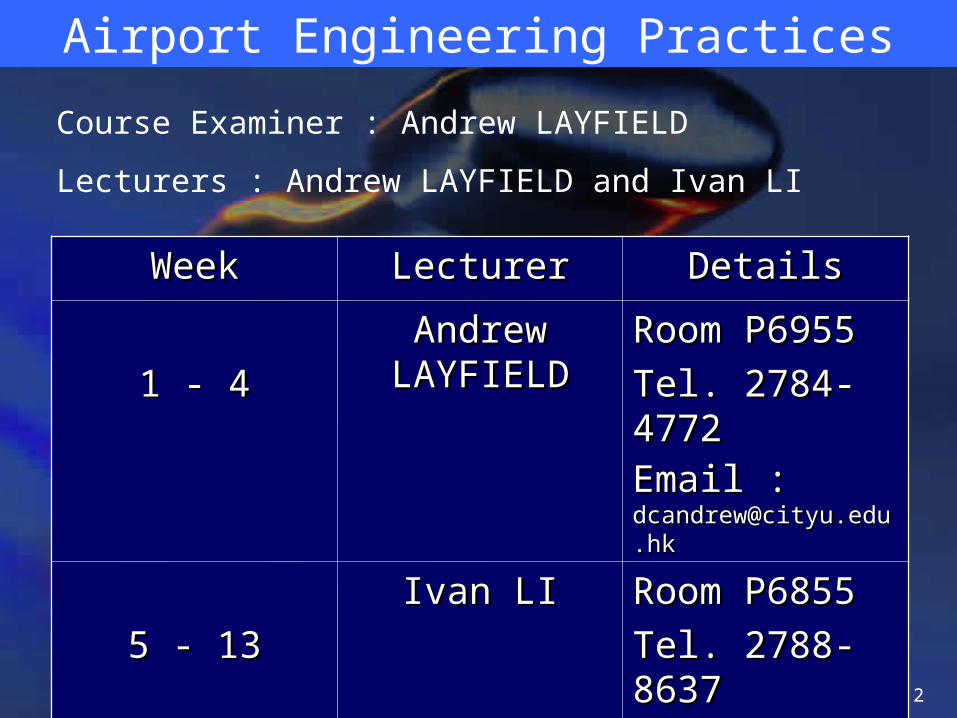
WeekWeek LecturerLecturer DetailsDetails
1 - 41 - 4Andrew Andrew
LAYFIELDLAYFIELDRoom P6955Room P6955
Tel. 2784-Tel. 2784-47724772Email : Email : [email protected]@cityu.edu.hkhk
5 - 135 - 13Ivan LIIvan LI Room P6855Room P6855
Tel. 2788-Tel. 2788-86378637Email : Email : [email protected]@cityu.edu.hk
Course Examiner : Andrew LAYFIELD
Lecturers : Andrew LAYFIELD and Ivan LI
3
Airport Engineering Practices
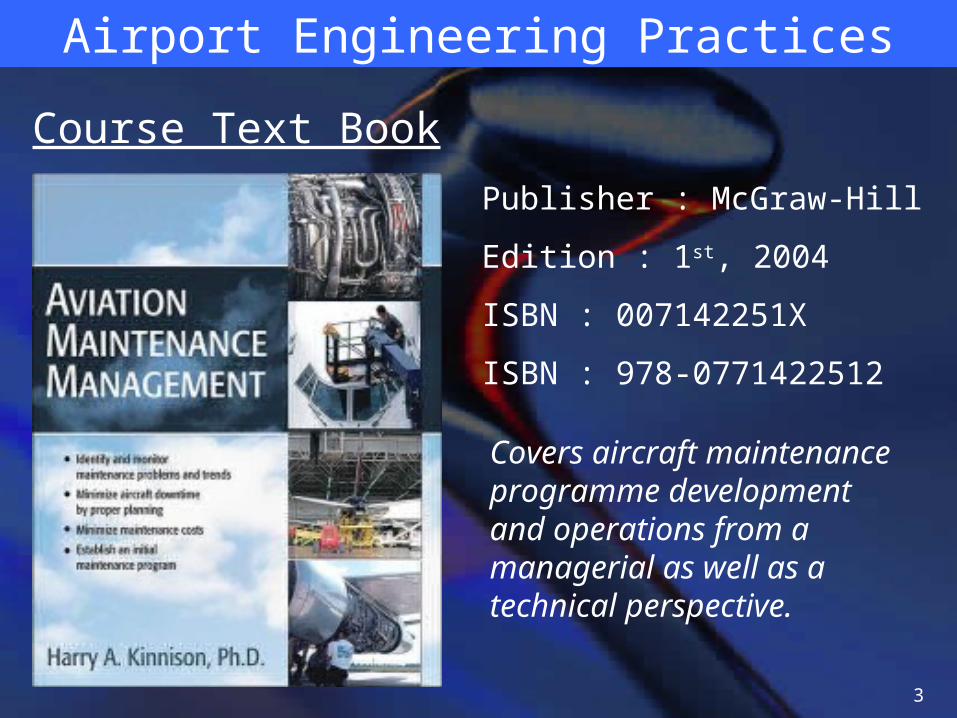
Course Text Book
Publisher : McGraw-Hill
Edition : 1st, 2004
ISBN : 007142251X
ISBN : 978-0771422512
Covers aircraft maintenance programme development and operations from a managerial as well as a technical perspective.
4
Airport Engineering Practices
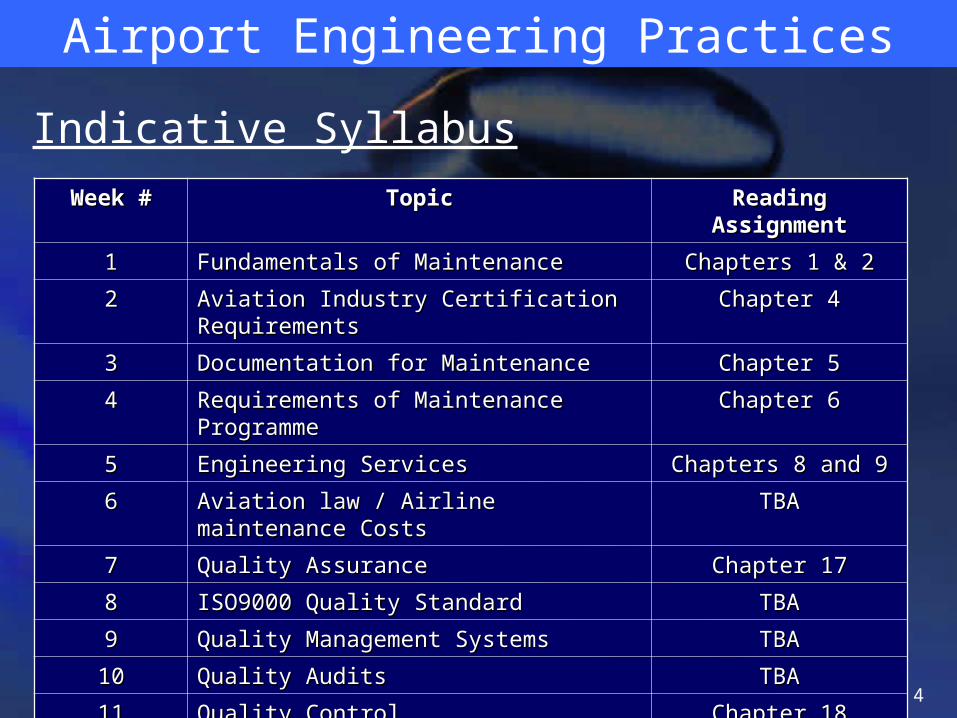
Indicative Syllabus
Week #Week # TopicTopic Reading Reading AssignmentAssignment
11 Fundamentals of MaintenanceFundamentals of Maintenance Chapters 1 & 2Chapters 1 & 2
22 Aviation Industry Certification Aviation Industry Certification RequirementsRequirements
Chapter 4Chapter 4
33 Documentation for Maintenance Documentation for Maintenance Chapter 5Chapter 5
44 Requirements of Maintenance Requirements of Maintenance ProgrammeProgramme
Chapter 6Chapter 6
55 Engineering ServicesEngineering Services Chapters 8 and 9Chapters 8 and 9
66 Aviation law / Airline maintenance Aviation law / Airline maintenance CostsCosts
TBATBA
77 Quality AssuranceQuality Assurance Chapter 17Chapter 17
88 ISO9000 Quality StandardISO9000 Quality Standard TBATBA
99 Quality Management SystemsQuality Management Systems TBATBA
1010 Quality AuditsQuality Audits TBATBA
1111 Quality ControlQuality Control Chapter 18Chapter 18
1212 Statistical Quality Control Tools & Statistical Quality Control Tools & TechniquesTechniques
TBATBA
1313 ReliabilityReliability Chapters 19 & n3Chapters 19 & n3
5
Airport Engineering Practices
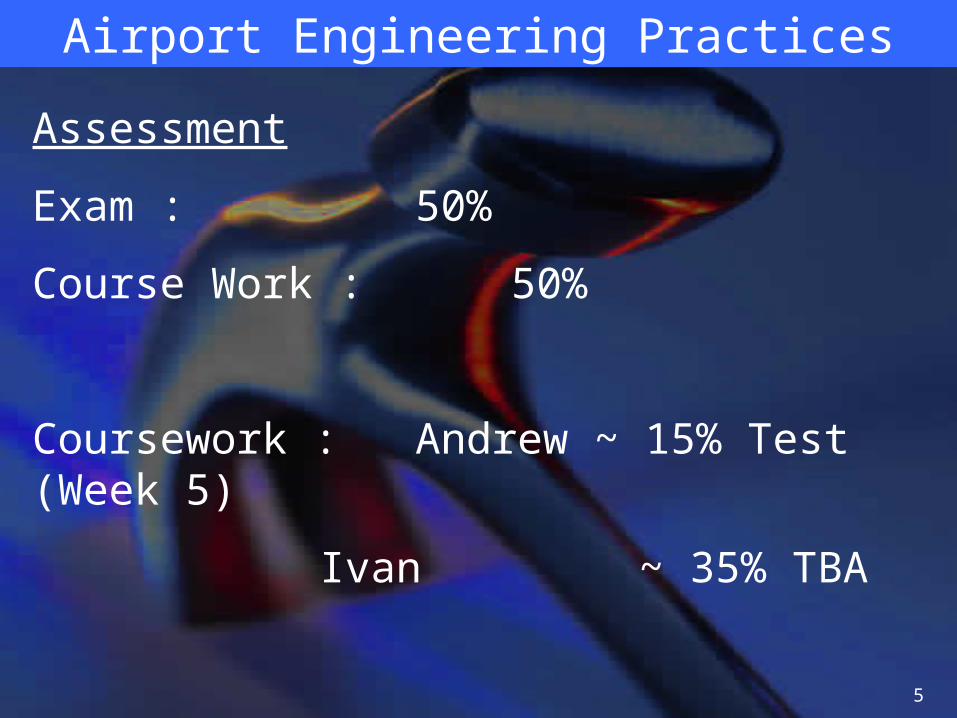
Assessment
Exam : 50%
Course Work : 50%
Coursework : Andrew ~ 15% Test (Week 5)
Ivan ~ 35% TBA
6
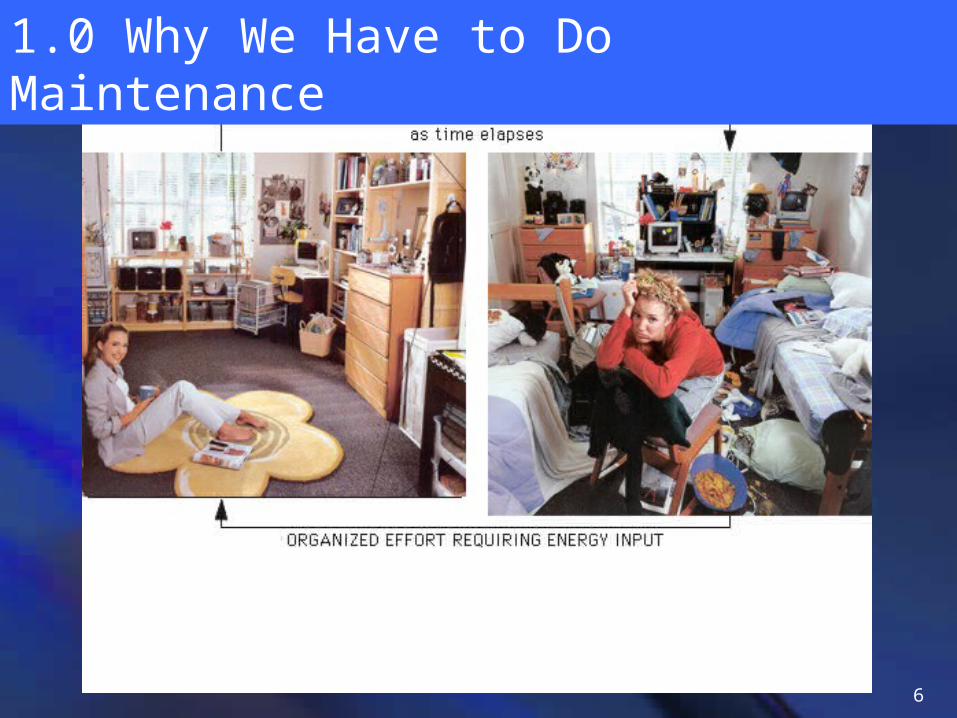
1.0 Why We Have to Do Maintenance
7
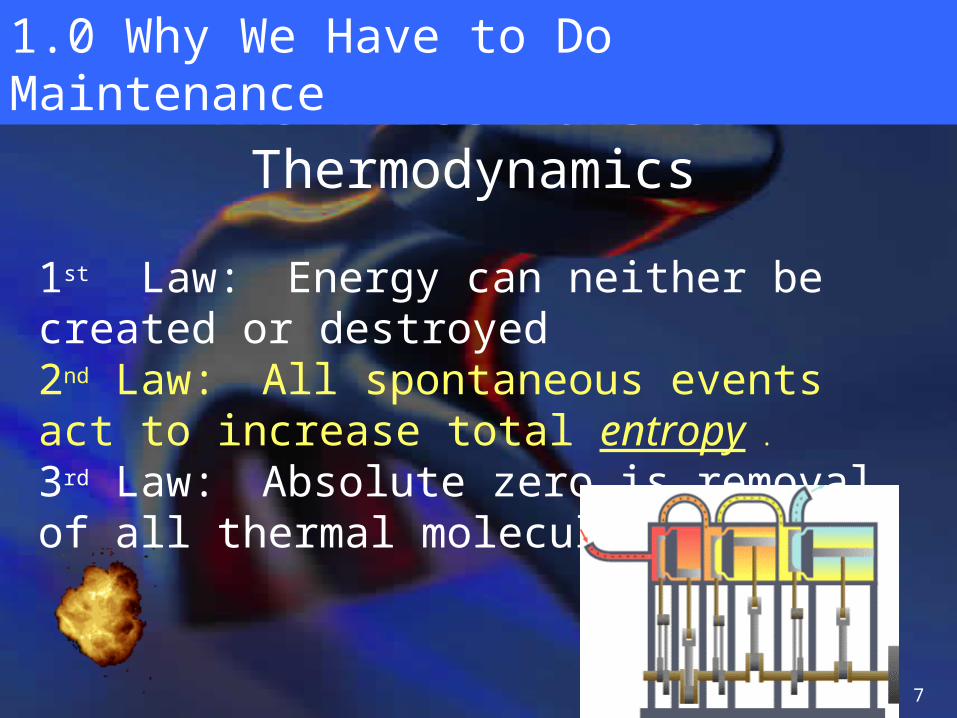
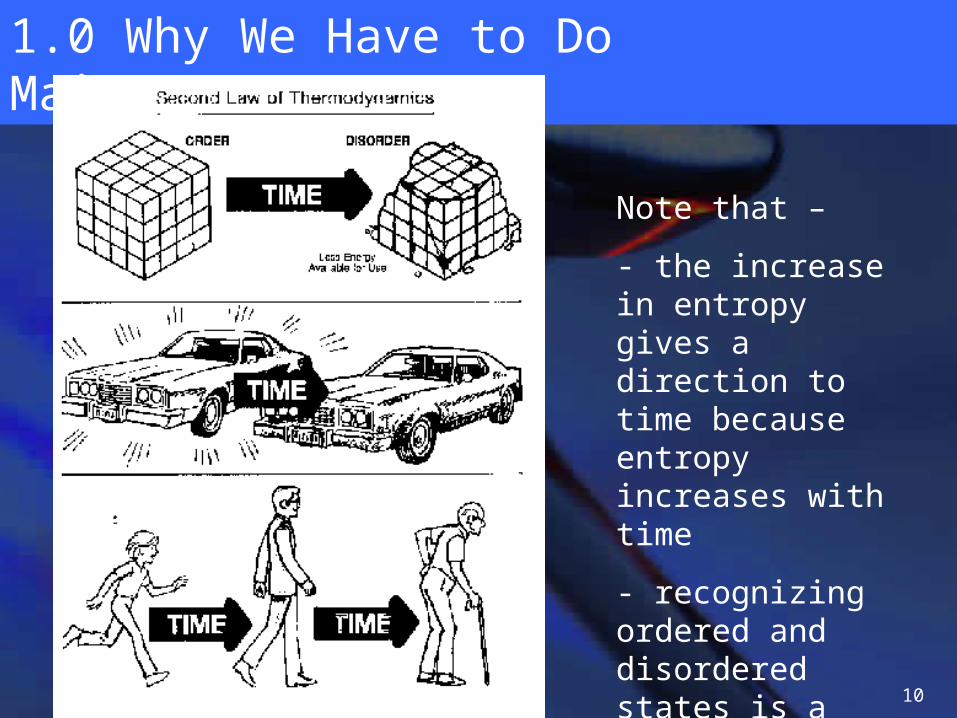
The Three Laws of Thermodynamics
1st Law: Energy can neither be created or destroyed
2nd Law: All spontaneous events act to increase total entropy .
3rd Law: Absolute zero is removal of all thermal molecular motion
1.0 Why We Have to Do Maintenance
8
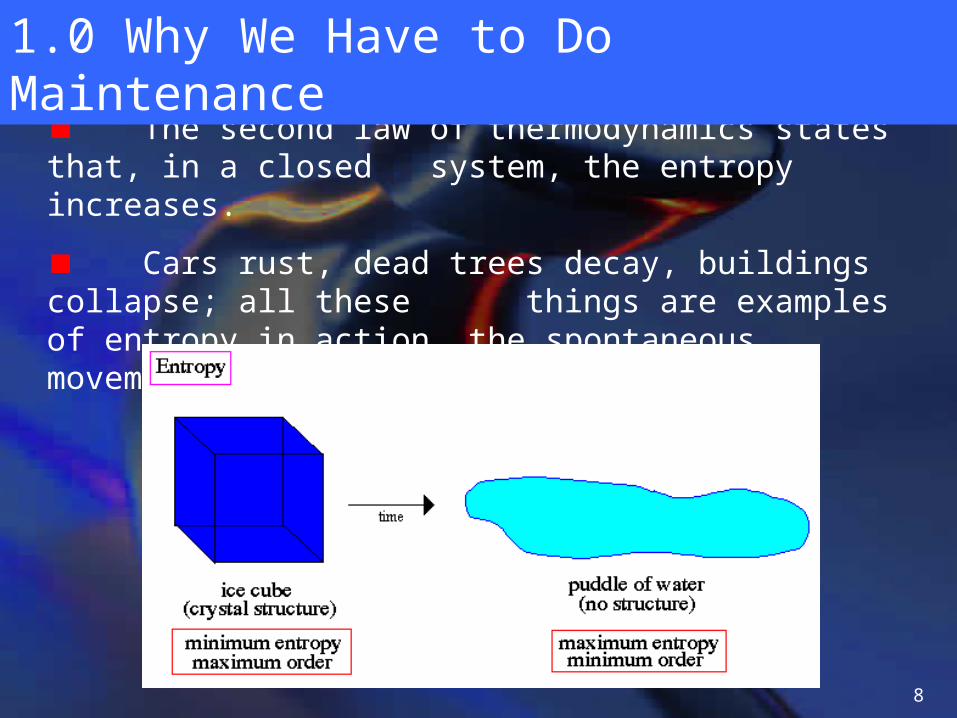
The second law of thermodynamics states that, in a closed system, the entropy increases.
Cars rust, dead trees decay, buildings collapse; all these things are examples of entropy in action, the spontaneous movement from order to disorder.
1.0 Why We Have to Do Maintenance
9
1.0 Why We Have to Do Maintenance
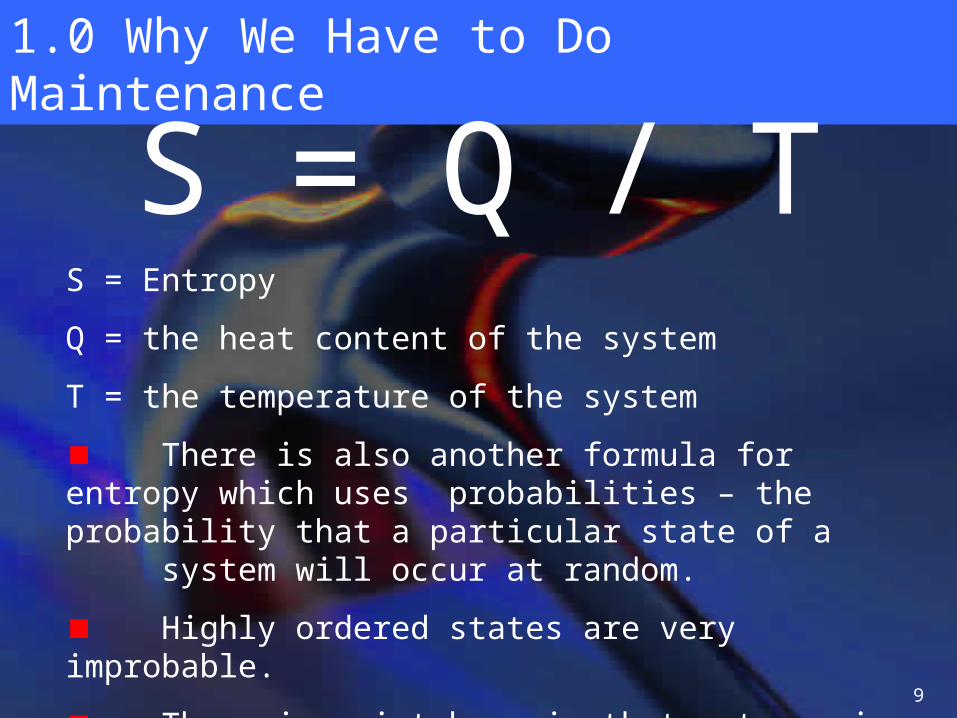
S = Q / TS = Entropy
Q = the heat content of the system
T = the temperature of the system
There is also another formula for entropy which uses probabilities – the probability that a particular state of a system will occur at random.
Highly ordered states are very improbable.
The main point here is that entropy is something that can be quantified !
10
1.0 Why We Have to Do Maintenance
Note that –
- the increase in entropy gives a direction to time because entropy increases with time
- recognizing ordered and disordered states is a function of human consciousness.

11
1.0 Why We Have to Do Maintenance
Aircraft systems degrade
with time – they
wear out !
Their entropy
increases.

12
1.0 Why We Have to Do Maintenance
Perfect systems can be designed on paper but perfect systems cannot be built in the real world.
A design engineer may be limited from making the perfect design by –
imperfections in the natural world
technology
ability
economics
Very often there is just not enough money to build a (nearly) perfect system.
The Role of the Engineer
13
1.0 Why We Have to Do Maintenance
However, the designer is obliged to build the best system possible within the constraints which exist.
A project manager for a new aircraft will be responsible for the project budget.
He will ask his design manager, “how much will it cost to build this ?”
The design manager might say $120M.
The project manager, however, might be limited to a budget of $100M for the production cost of each of the new
aircraft.
In this case, the design manager must redesign the new aeroplane so it can be built for $100M.

14
1.0 Why We Have to Do Maintenance
That usually means – reduced tolerances, cheaper materials, and, consequently, more entropy.
More entropy in the design will mean more maintenance is required.
The design engineer’s main problem is then to minimize (not eliminate) the entropy of the system he or she is designing
while staying within the required constraints.
15
1.0 Why We Have to Do Maintenance
Entropy exists in every system and the entropy of a system is always increasing.
This means not only that a real system which starts off being new will have some entropy already built into it, but that the entropy will increase with time.
Some components or systems will deteriorate from use, or even lack of use.
Misuse by an operator may cause some deterioration.
Therefore, while the engineer’s job is to minimize the entropy of a system during design, the mechanics job is to fight the continual increase in the entropy of a system during its lifetime.
The Role of the Mechanic
16
1.0 Why We Have to Do Maintenance
100%
ENTROPY
PERFECTION
TIME
NATURAL DECAY OF SYSTEM
(Increasing Entropy)
ATTAINABLE LEVEL OF PERFECTION
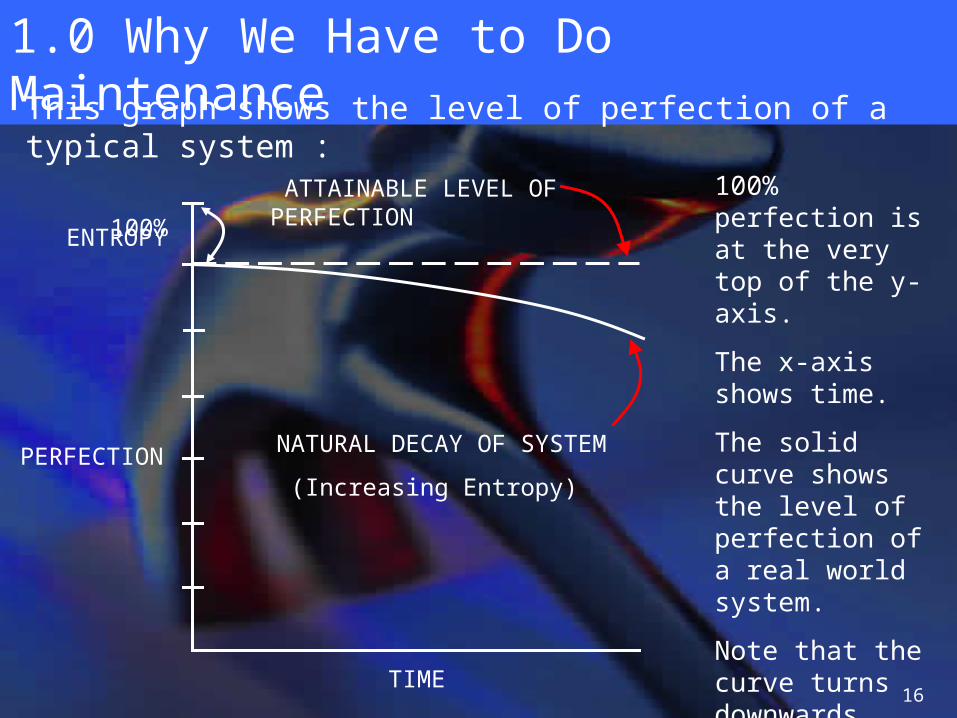
This graph shows the level of perfection of a typical system :
100% perfection is at the very top of the y-axis.
The x-axis shows time.
The solid curve shows the level of perfection of a real world system.
Note that the curve turns downwards with time.
17
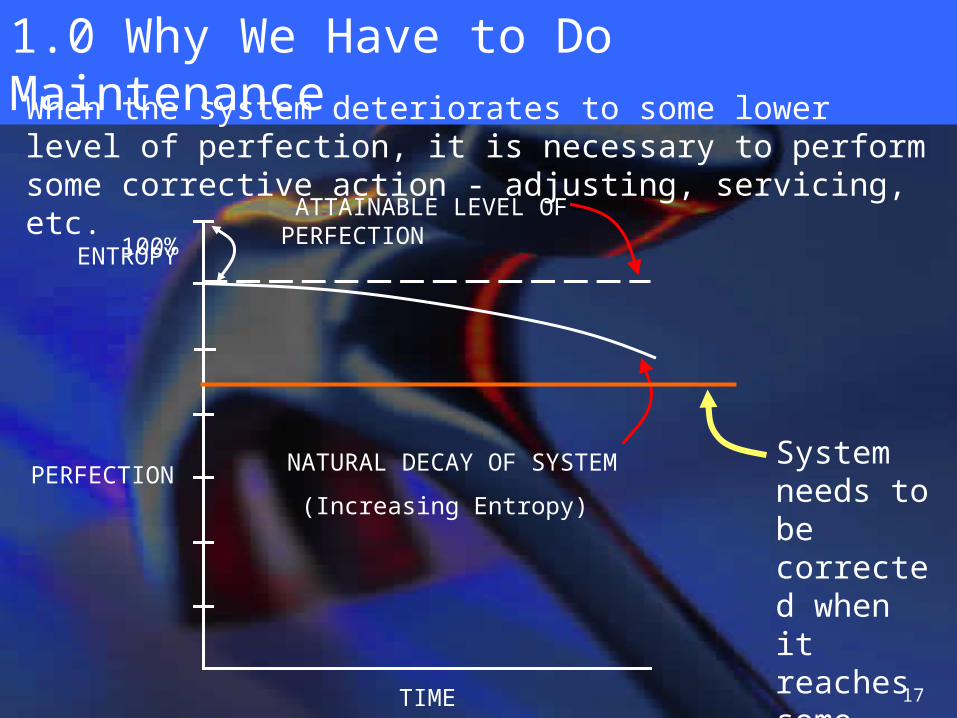
1.0 Why We Have to Do MaintenanceWhen the system deteriorates to some lower level of perfection, it is necessary to perform some corrective action - adjusting, servicing, etc.
TIME
100%
ENTROPY
PERFECTION NATURAL DECAY OF SYSTEM
(Increasing Entropy)
ATTAINABLE LEVEL OF PERFECTION
System needs to be corrected when it reaches some lower level.
18
1.0 Why We Have to Do MaintenanceIn other words, at some point, we have to perform some
maintenance to restore the system to its designed-in level of perfection.
We need to reduce the entropy to its original level.
This is called preventative maintenance and is usually performed at regular intervals.
This is done to prevent deterioration of the system to an unusable level.
Preventative maintenance is also sometimes referred to as sscheduled maintenance.
This schedule could be daily, every flight, every 200 flight hours, or every 100 cycles ( a cycle is a takeoff and landing).

19
Considering the number of components on a modern aircraft, maintenance is a complex, on-going process.
For this reason, we will see that aircraft maintenance must be approached systematically.
Definition systematic adjective done using a fixed and organized plan e.g. “the systematic collection and analysis of information”systematically adverb
1.0 Why We Have to Do Maintenance

20
1.0 Why We Have to Do Maintenance
100%
ENTROPY
PERFECTION
(OR RELIABILITY)
TIME
DESIGNED-IN LEVEL OF PERFECTION
POINT AT WHICH SCHEDULED
MAINTENANCE IS DONE
a b
c
d
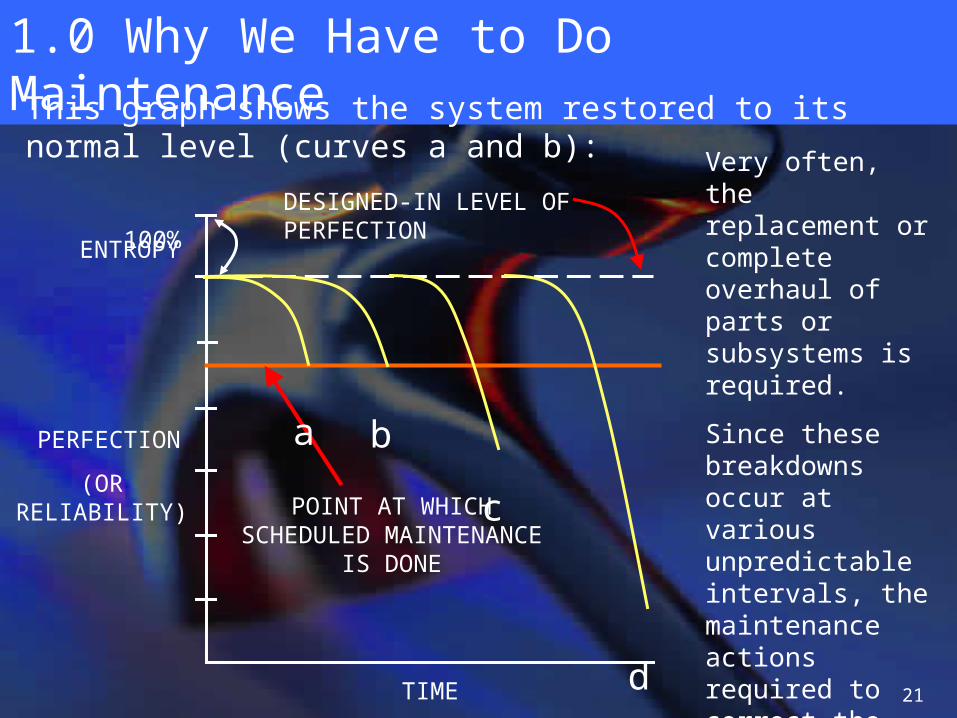
This graph shows the system restored to its normal level (curves a and b):
Sometimes the system can deteriorate rapidly in service to a low level of perfection (curve c).
At other times the system breaks down completely (curve d).
In these cases, the maintenance actions require extensive testing, trouble shooting, adjustment.
21
1.0 Why We Have to Do Maintenance
100%
ENTROPY
PERFECTION
(OR RELIABILITY)
TIME
DESIGNED-IN LEVEL OF PERFECTION
POINT AT WHICH SCHEDULED
MAINTENANCE IS DONE
a b
c
d
This graph shows the system restored to its normal level (curves a and b): Very often, the
replacement or complete overhaul of parts or subsystems is required.
Since these breakdowns occur at various unpredictable intervals, the maintenance actions required to correct the problems are referred to as unscheduled maintenance.
22
1.0 Why We Have to Do Maintenance
100%
ENTROPY
PERFECTION
(OR RELIABILITY)
TIME
DESIGNED-IN LEVEL OF PERFECTION
POINT AT WHICH SCHEDULED
MAINTENANCE IS DONE
a b
c
d
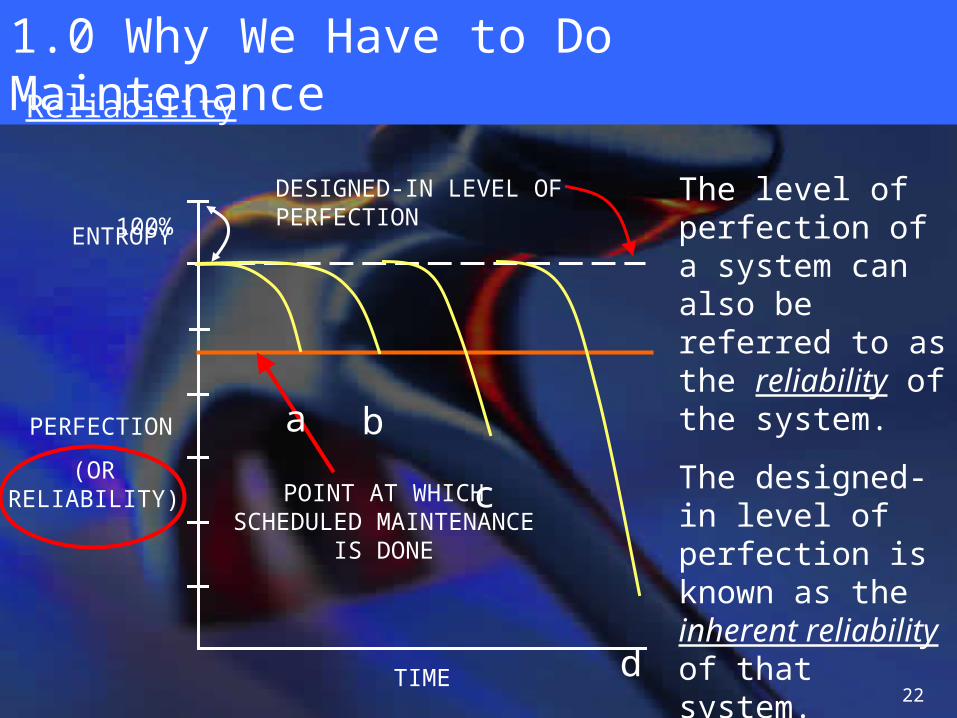
Reliability
The level of perfection of a system can also be referred to as the reliability of the system.
The designed-in level of perfection is known as the inherent reliability of that system.
23
1.0 Why We Have to Do Maintenance
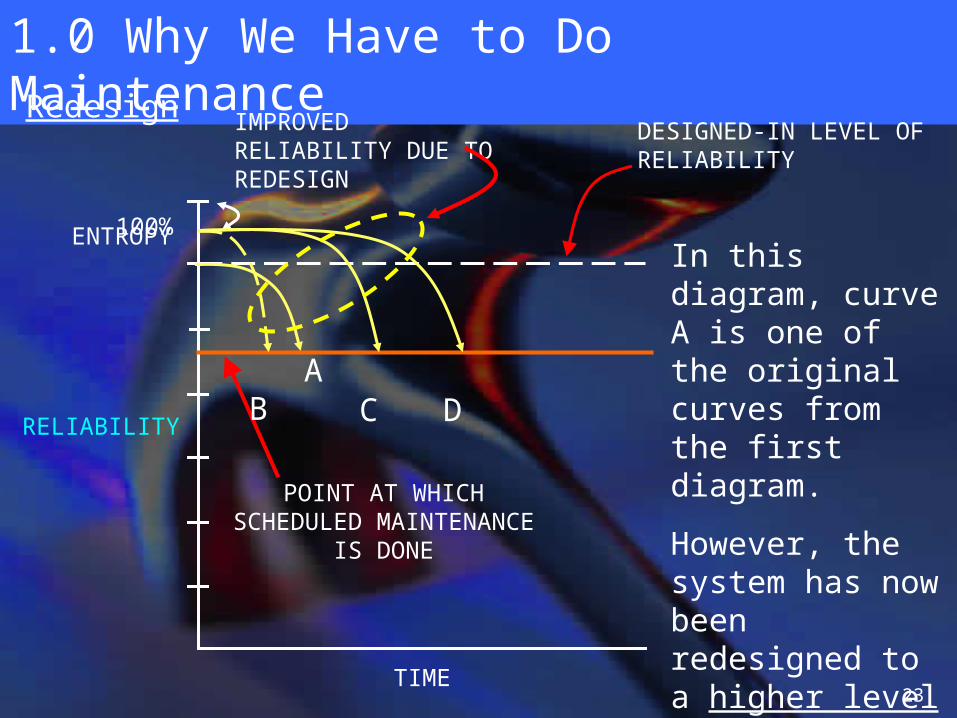
DESIGNED-IN LEVEL OF RELIABILITY
Redesign IMPROVED RELIABILITY DUE TO REDESIGN
100%
ENTROPY
RELIABILITY
TIME
POINT AT WHICH SCHEDULED
MAINTENANCE IS DONE
A B C D
In this diagram, curve A is one of the original curves from the first diagram.
However, the system has now been redesigned to a higher level of perfection – see curves B, C and D.
24
1.0 Why We Have to Do Maintenance
DESIGNED-IN LEVEL OF RELIABILITY
IMPROVED RELIABILITY DUE TO REDESIGN
100%
ENTROPY
RELIABILITY
TIME
POINT AT WHICH SCHEDULED
MAINTENANCE IS DONE
A B C D
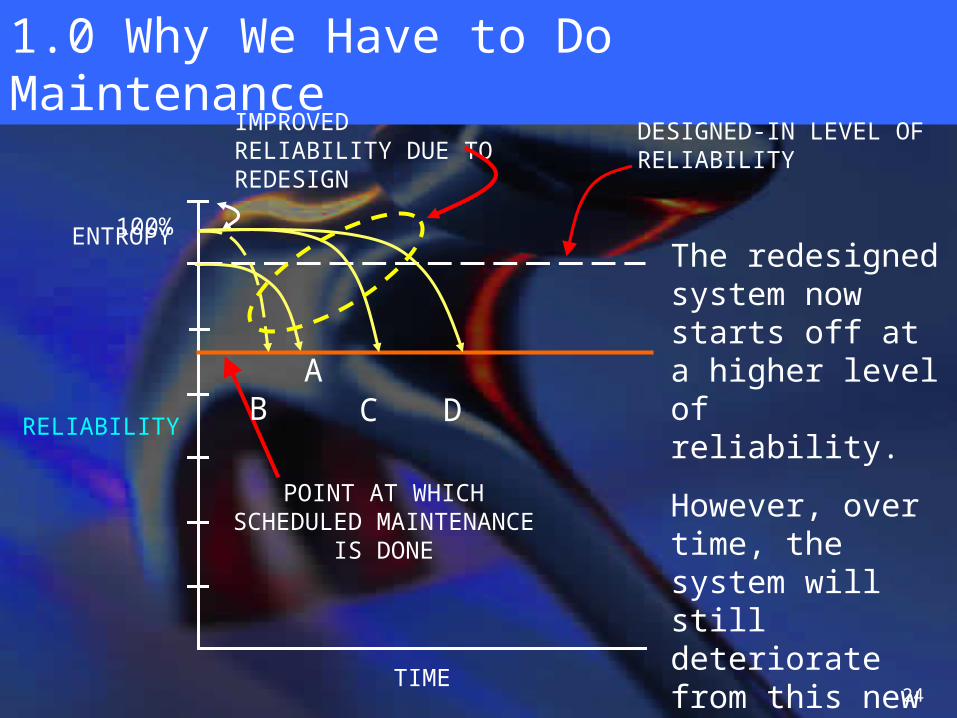
The redesigned system now starts off at a higher level of reliability.
However, over time, the system will still deteriorate from this new initial level of perfection.

25
1.0 Why We Have to Do Maintenance
DESIGNED-IN LEVEL OF RELIABILITY
IMPROVED RELIABILITY DUE TO REDESIGN
100%
ENTROPY
RELIABILITY
TIME
POINT AT WHICH SCHEDULED
MAINTENANCE IS DONE
A B C D
The rate of decay may change as a result of the redesign.
If the decay is steeper, as in (B), the point at which preventative maintenance needs to be performed might occur sooner.
26
1.0 Why We Have to Do Maintenance
DESIGNED-IN LEVEL OF RELIABILITY
IMPROVED RELIABILITY DUE TO REDESIGN
100%
ENTROPY
RELIABILITY
TIME
POINT AT WHICH SCHEDULED
MAINTENANCE IS DONE
A B C D
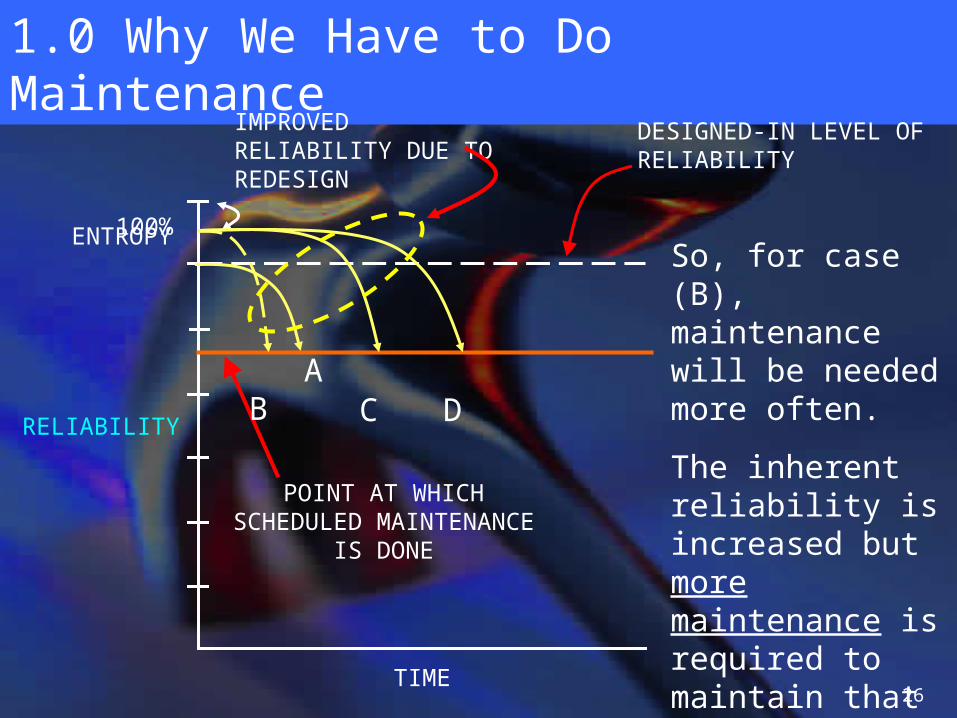
So, for case (B), maintenance will be needed more often.
The inherent reliability is increased but more maintenance is required to maintain that level of reliability.
27
1.0 Why We Have to Do Maintenance
DESIGNED-IN LEVEL OF RELIABILITY
IMPROVED RELIABILITY DUE TO REDESIGN
100%
ENTROPY
RELIABILITY
TIME
POINT AT WHICH SCHEDULED
MAINTENANCE IS DONE
A B C D
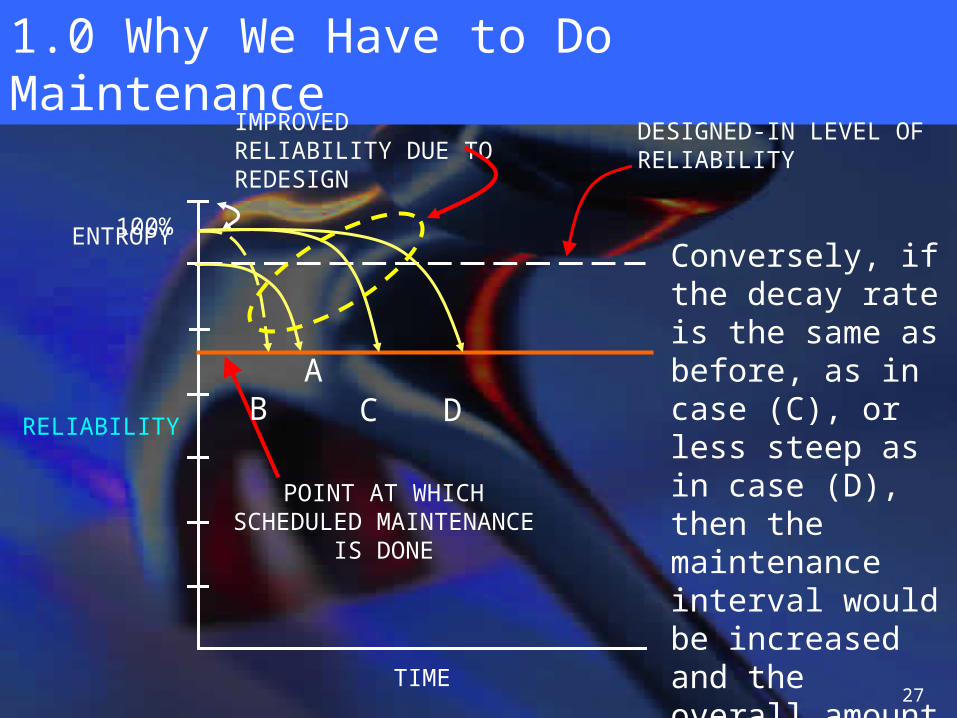
Conversely, if the decay rate is the same as before, as in case (C), or less steep as in case (D), then the maintenance interval would be increased and the overall amount of preventative maintenance might be reduced.
28
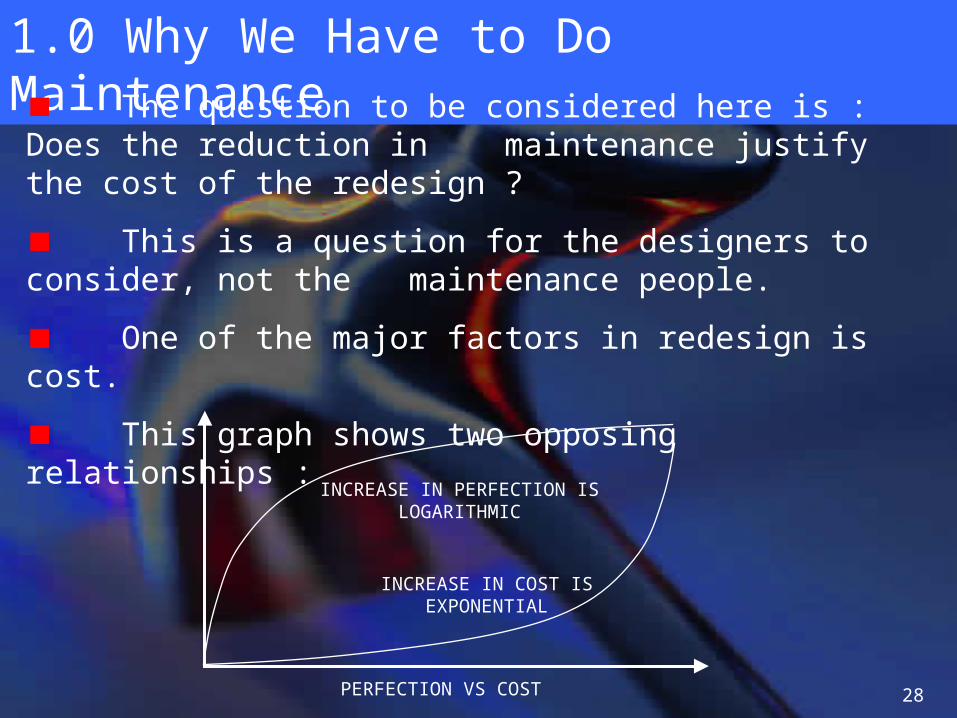
1.0 Why We Have to Do MaintenanceThe question to be considered here is : Does the reduction in maintenance justify the cost of the redesign ?
This is a question for the designers to consider, not the maintenance people.
One of the major factors in redesign is cost.
This graph shows two opposing relationships :
INCREASE IN PERFECTION IS LOGARITHMIC
INCREASE IN COST IS EXPONENTIAL
PERFECTION VS COST

29
1.0 Why We Have to Do Maintenance
INCREASE IN PERFECTION IS LOGARITHMIC
INCREASE IN COST IS EXPONENTIAL
PERFECTION VS COST
The upper curve is logarithmic. It represents the increasing perfection attained with more sophisticated design efforts – the closer we get to perfection, the harder it is to make a substantial increase.
The lower curve represents the cost of the efforts to improve the system. This is an exponential curve. The more we try to approach perfection, the more it is going to cost us.

30
1.0 Why We Have to Do Maintenance
INCREASE IN PERFECTION IS LOGARITHMIC
INCREASE IN COST IS EXPONENTIAL
PERFECTION VS COST
Designers are limited in their goal of perfection by both entropy and costs.
31
1.0 Why We Have to Do MaintenanceFailure Rate Patterns
Not all systems or components fail at the same rate nor do they all exhibit the same pattern of wear out and failure.
This is important because the nature of the maintenance to be performed on these systems and components is related to their failure rates and failure patterns.
United Airlines did some studies on lifetime failure rates and found six basic patterns.
These are shown in the following table.
Note :
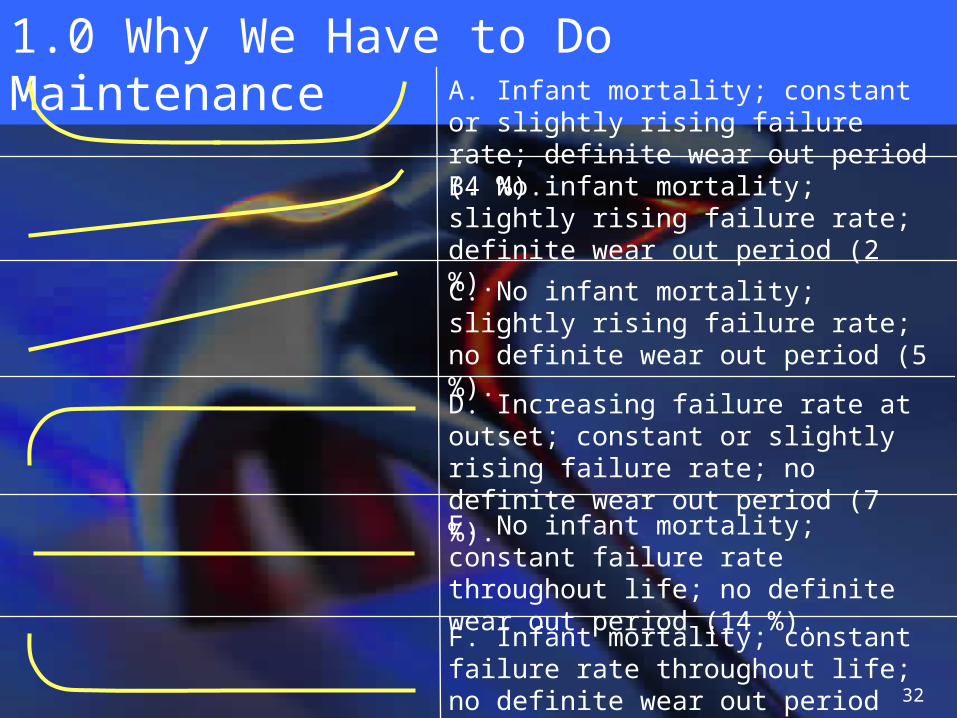
1. The vertical axes show failure rates, not reliability ! The higher the vertical position, the worse the failure rate.
2. The horizontal axes show time.
32
1.0 Why We Have to Do MaintenanceA. Infant mortality; constant or slightly rising failure rate; definite wear out period (4 %).
B. No infant mortality; slightly rising failure rate; definite wear out period (2 %).
C. No infant mortality; slightly rising failure rate; no definite wear out period (5 %).
D. Increasing failure rate at outset; constant or slightly rising failure rate; no definite wear out period (7 %).
E. No infant mortality; constant failure rate throughout life; no definite wear out period (14 %).
F. Infant mortality; constant failure rate throughout life; no definite wear out period (68 %).
33
1.0 Why We Have to Do Maintenance
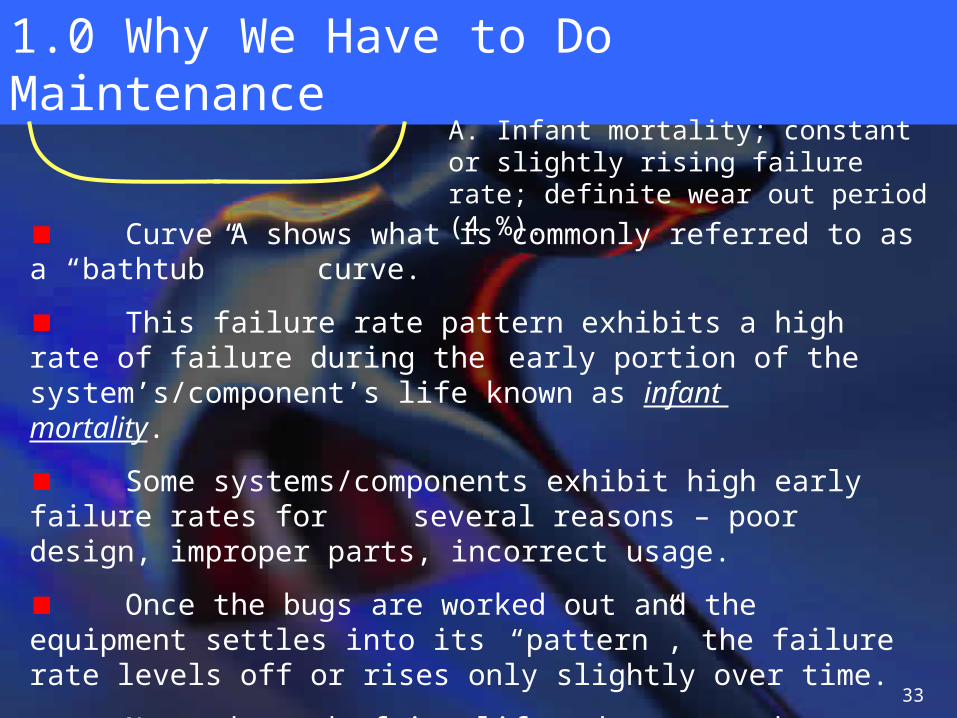
A. Infant mortality; constant or slightly rising failure rate; definite wear out period (4 %).
Curve A shows what is commonly referred to as a “bathtub” curve.
This failure rate pattern exhibits a high rate of failure during the early portion of the system’s/component’s life known as infant mortality.
Some systems/components exhibit high early failure rates for several reasons – poor design, improper parts, incorrect usage.
Once the bugs are worked out and the equipment settles into its “pattern”, the failure rate levels off or rises only slightly over time.
Near the end of its life, the curve shows a rapid rise in failure rate as the materials of the system/component reach some kind of physical limit.
34
1.0 Why We Have to Do Maintenance
The United Airlines study showed that only about 11 % of the items included in the experiment (curves A, B and C) would benefit from setting operating limits, or from applying a repeated check of wear conditions. The other 89 % would not.
Consequently, time of failure, or deterioration beyond useful levels could be predicted on only 11 % of the items.
Only components with definite life time limits and/or wear out periods will benefit from scheduled maintenance !
The required maintenance activity for these items can be spread out over the available time to even out the work load.
35
1.0 Why We Have to Do Maintenance
For the other 89 %, these items will have to be operated to failure before replacement or repair is done.
This is unpredictable and would result in a need for maintenance at odd times – i.e.. unscheduled maintenance.
These characteristics of failure make it necessary to approach maintenance in a systematic manner, to reduce periods of unscheduled maintenance.
The aviation industry has developed three management techniques for handling in-service interruptions which
occur where items must be operated to failure before maintenance can be done.
36
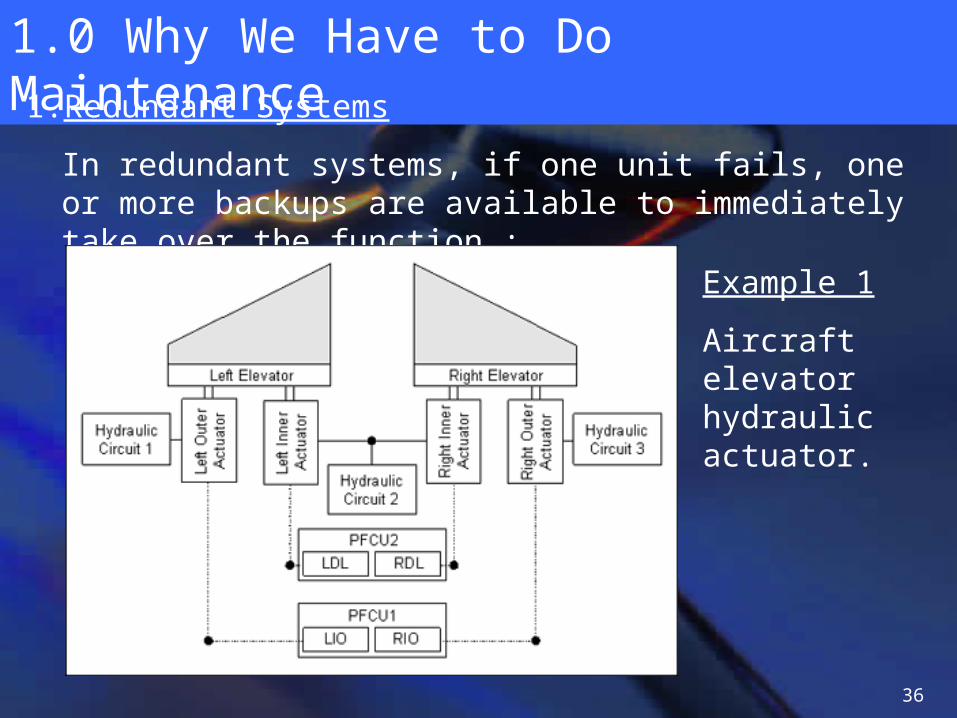
1.0 Why We Have to Do Maintenance1. Redundant Systems
In redundant systems, if one unit fails, one or more backups are available to immediately take over the function :
Example 1
Aircraft elevator hydraulic actuator.

37
1.0 Why We Have to Do MaintenanceExample 2
Aircraft flight data recorders.
38
1.0 Why We Have to Do Maintenance
Another example would be the VHF radios used in commercial aircraft.
A unique feature of redundant units also affects the maintenance requirements.
If both the primary and the backup units are instrumented such that the flight crew is aware of any malfunction, no prior maintenance check is required.
On the other hand, if neither system is so instrumented, maintenance personnel would need to perform some
check on both the primary and backup systems.
39
1.0 Why We Have to Do Maintenance2. Line Replaceable Unit (LRU)
An LRU is a component or system that has been designed in such a manner that the parts that most commonly fail can be quickly removed and replaced on the vehicle.
The vehicle can then continue in without any significant interruption in service.
The failed part can be discarded or repaired later.
40
1.0 Why We Have to Do Maintenance3. Minimum Equipment List (MEL)
This list allows a vehicle to be dispatched into service with certain items inoperative – provided that the loss of the function does not affect the safety and operation of the flight.
These items are carefully determined by the aircraft manufacturer and must also be sanctioned by the appropriate regulatory authority during the early stages of vehicle design and test.
The manufacturer issues a master minimum equipment list (MMEL) which indicates all equipment and accessories available for a particular aircraft model.
The airline then customizes this document to produce its own MEL.
41
1.0 Why We Have to Do Maintenance
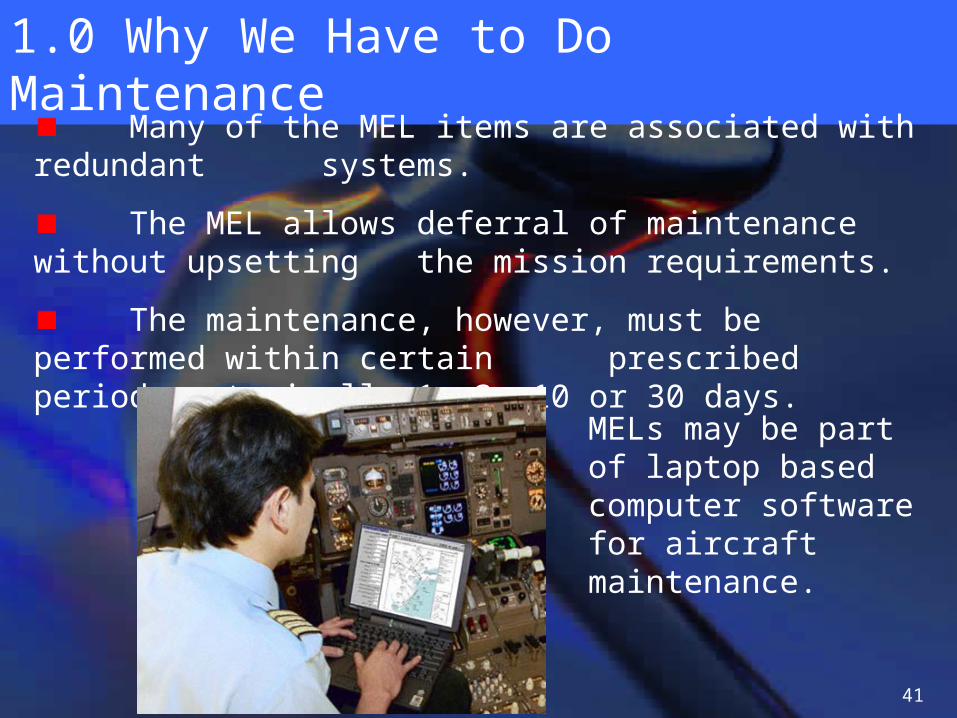
Many of the MEL items are associated with redundant systems.
The MEL allows deferral of maintenance without upsetting the mission requirements.
The maintenance, however, must be performed within certain prescribed periods – typically 1, 3, 10 or 30 days.
MELs may be part of laptop based computer software for aircraft maintenance.
42
1.0 Why We Have to Do MaintenanceSummary
Why We Have To Do Maintenance
Entropy and the Laws of Thermodynamics
The Role of the Engineer
The Role of the Mechanic
Perfection and Reliability
Failure Rate Patterns
Management Techniques for In-Service Interruptions –
Redundant Systems
Line Replaceable Units
Minimum Equipment List
43
What you need to know for the exam ! Explain what entropy is and its relationship to the need for maintenance.
What is the role of an engineer in the context of entropy ?
What is the role of a mechanic in the context of entropy ?
With the aid of a sketch diagram, explain the relationship between entropy or perfection and time.
With the aid of a sketch diagram illustrating the relationship between reliability and time, explain what is meant by the “designed-in level of perfection” and the “point at which scheduled maintenance is done”.
With the aid of a sketch diagram, explain the relationship between perfection and cost.
Give some examples of failure rate patterns. What is the “bath tub” curve ?
Explain each of the three management techniques which have been developed by the aviation industry for handling in-service interruptions due to equipment failures. What failure rate curves characterize these types of failures ?


