
1
Comparing Futures for the Sacramento-San Joaquin Delta
Engineers:Jay Lund, UC Davis*William Fleenor, UC
DavisEconomists:Ellen Hanak, PPIC*Richard Howitt, UC DavisBiologists:Peter Moyle, UC DavisWilliam Bennett, UC
DavisGeologist:Jeffrey Mount, UC Davis
*Lead authors
Supported with funding from
Stephen D. Bechtel, Jr.David and Lucile
Packard Foundation
2
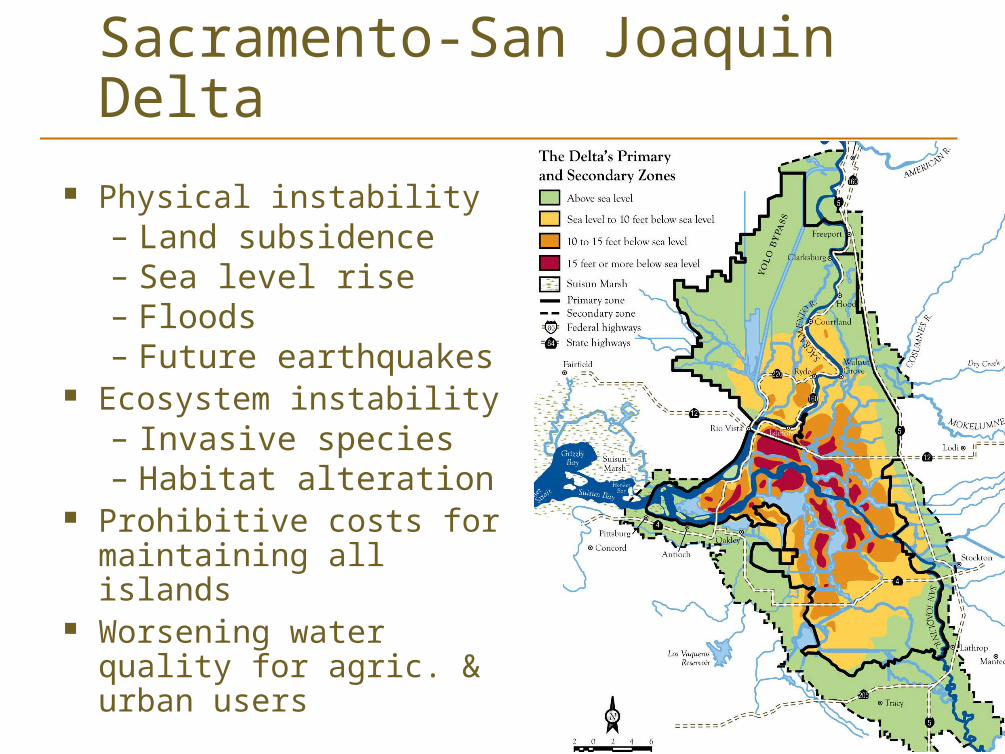
Problems of California’s Sacramento-San Joaquin Delta
Physical instability– Land subsidence– Sea level rise– Floods– Future earthquakes
Ecosystem instability – Invasive species – Habitat alteration
Prohibitive costs for maintaining all islands
Worsening water quality for agric. & urban users

3
Delta of Tomorrow Will be Different
Large bodies of open water and higher sea level
Increased salinity, habitat variability
Higher water quality costs – even if all islands remain intact
Based on economic value of land and assets, many islands not worth repairing after flooding (blue)

4
Comparing Water Export Strategies Long-Term (to Mid-Century)
Current Strategy: through the Delta
Peripheral Canal: around the Delta
Dual Conveyance: both through and around the Delta
No Exports: use other water sources and use less
5
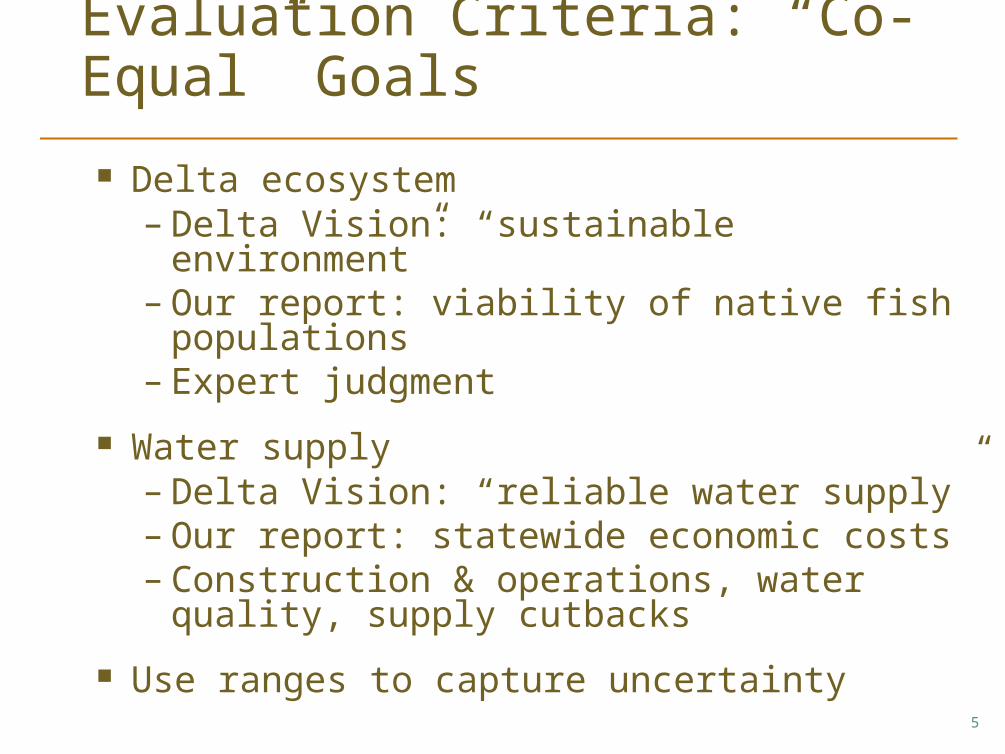
Evaluation Criteria: “Co-Equal” Goals
Delta ecosystem– Delta Vision: “sustainable environment”– Our report: viability of native fish
populations – Expert judgment
Water supply– Delta Vision: “reliable water supply”– Our report: statewide economic costs– Construction & operations, water
quality, supply cutbacks
Use ranges to capture uncertainty

6
Fish Population Viability Estimates
7
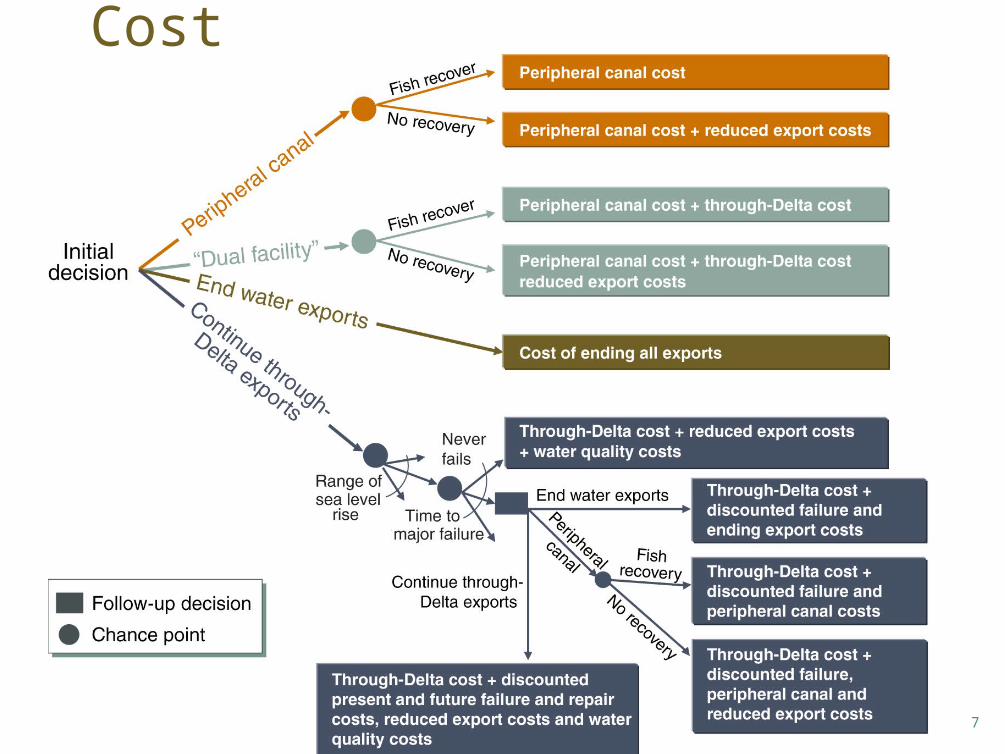
Decision Tree for Economic Cost

8
16 Questions with 32 AnswersQuestion Low High Sea level rise (ft)
1) How much will sea level rise by 2050? 0.5 1.5 Probability of extensive Delta failure (annual failure probability in parentheses) (%) 2) With the minimum sea level rise? 34 (1) 88 (5) 3) With the maximum sea level rise? 57 (2) 95 (7) Population viability in 2050 for delta smelt (Chinook salmon in parentheses) (%) 4) Probability of viable fish pop. with continued through-Delta exports? 5 (10) 30 (30) 5) Probability of viable fish populations with no Delta exports? 30 (40) 60 (80) 6) Probability of viable fish populations with a peripheral canal? 10 (20) 40 (50) 7) Probability of viable fish populations with dual conveyance? 10 (20) 40 (50) 8) % exports reduced with continued through-Delta pumping? 25 40 9) % reduction in PC exports if fish continue to decline? 25 40 Economic and financial costs ($ billion) 10) What is the construction cost of a peripheral canal? 4.75 9.75 11) Additional water quality cost from using Delta water? 0.3/ year 1.0/ year 12) What is the annualized cost of ending Delta exports? 1.5/ year 2.5/ year 13) Annualized cost to maintain continued through-Delta pumping? 0.15/ year 0.4/ year 14) Cost to water users of a sudden extensive failure of Delta levees? 7.8 15.7 15) Average cost to repair an extensive Delta levee failure? 0.2 2.5 16) What exponent relates export reduction to economic cost?* 2 3

9
Through-Delta Pumping: Low Chance of Restoring Fish, High Costs
Lik
elih
oo
d o
f F
ish
Via
bil
ity
(%)
Through-Delta Exports
Delta smelt
Economic Cost ($Billions/year)
0
20
40
60
80
100
0.5 1 1.5 2 2.5 3

10
Ending Exports: Better for Fish, But Even More Costly
Lik
elih
oo
d o
f F
ish
Via
bil
ity
(%)
Economic Cost ($Billions/year)
0
20
40
60
80
100
0.5 1 1.5 2 2.5 3
Delta smelt
Through-Delta Exports
No Exports
11
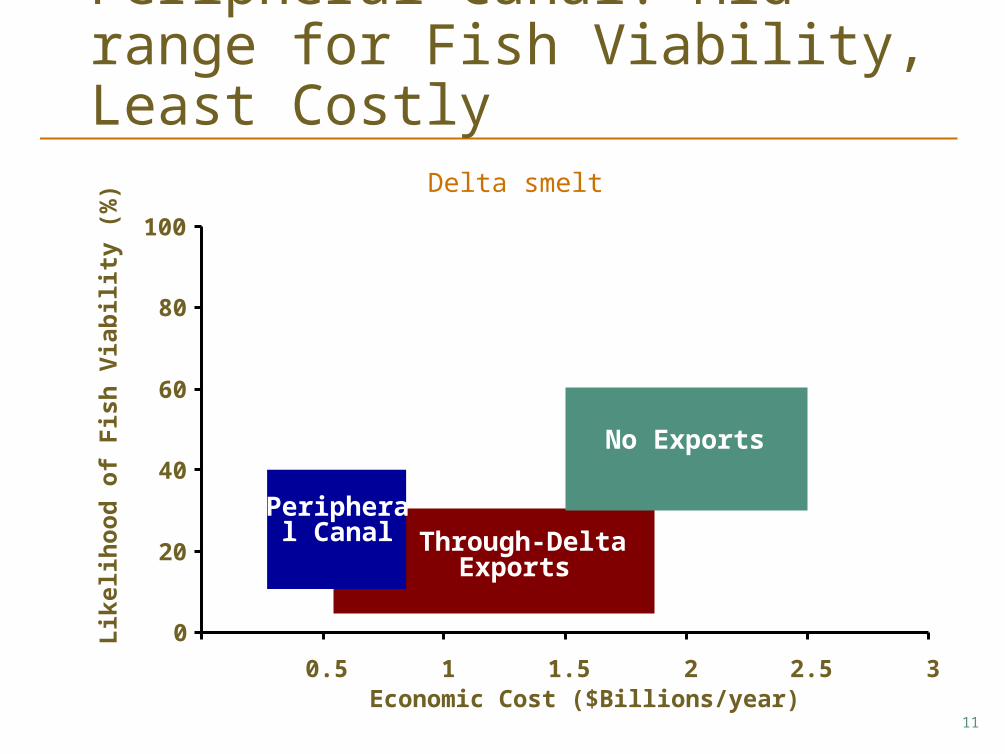
Peripheral Canal: Mid-range for Fish Viability, Least Costly
Economic Cost ($Billions/year)
Lik
elih
oo
d o
f F
ish
Via
bil
ity
(%)
No Exports
Through-Delta Exports
0
20
40
60
80
100
0.5 1 1.5 2 2.5 3
Delta smelt
Peripheral Canal
12
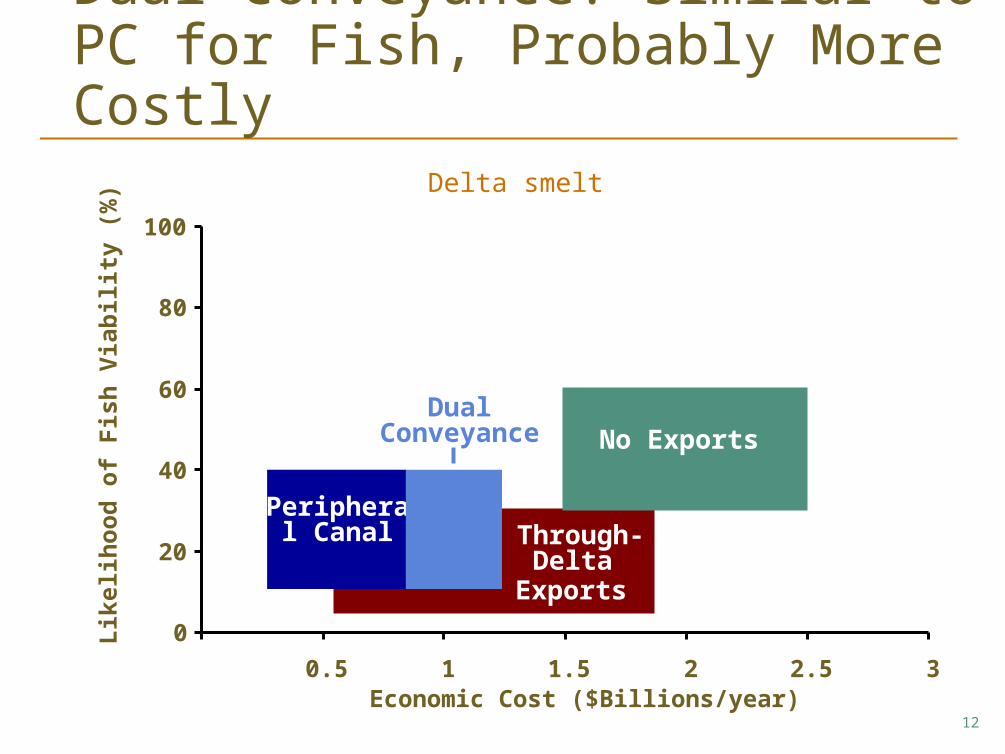
Dual Conveyance: Similar to PC for Fish, Probably More Costly
Economic Cost ($Billions/year)
Lik
elih
oo
d o
f F
ish
Via
bil
ity
(%)
No Exports
Peripheral Canal
Dual Conveyance
Through-Delta
Exports 0
20
40
60
80
100
0.5 1 1.5 2 2.5 3
Delta smelt
13
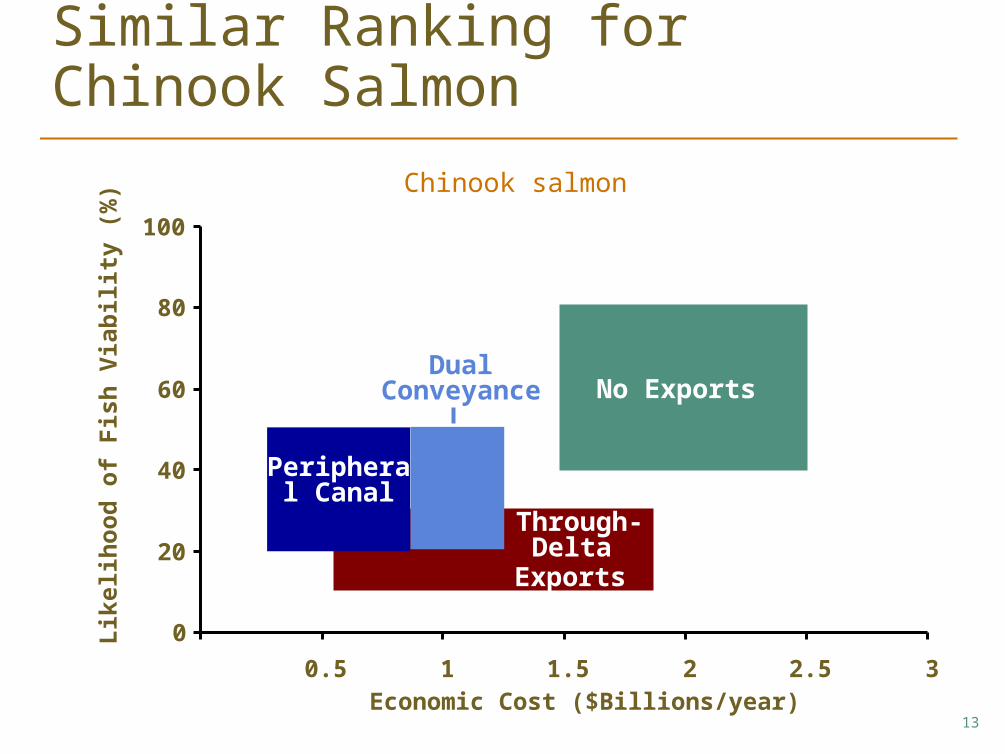
Similar Ranking for Chinook Salmon
Economic Cost ($Billions/year)
Lik
elih
oo
d o
f F
ish
Via
bil
ity
(%)
Through-Delta
Exports
No Exports
Peripheral Canal
Dual Conveyance
0
20
40
60
80
100
0.5 1 1.5 2 2.5 3
Chinook salmon
14
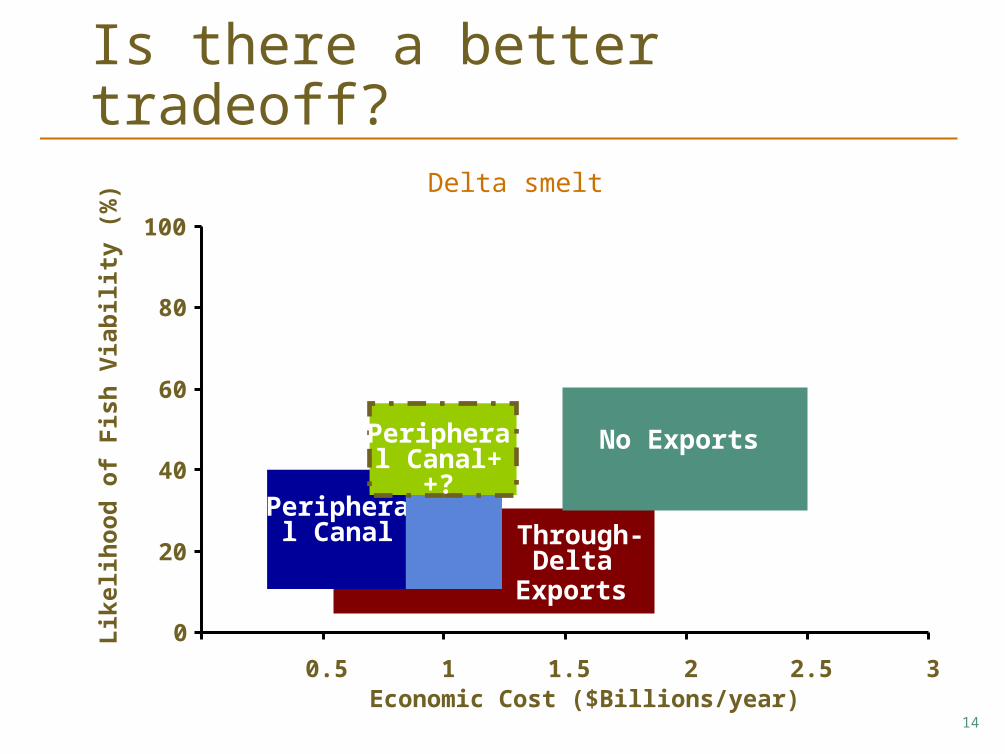
Is there a better tradeoff?
Economic Cost ($Billions/year)
Lik
elih
oo
d o
f F
ish
Via
bil
ity
(%)
No Exports
Peripheral Canal Through-
Delta Exports
0
20
40
60
80
100
0.5 1 1.5 2 2.5 3
Delta smelt
Peripheral Canal++?
15
Conclusions No perfect solutions.
Delta inevitably more saline with more open water, for any water export strategy.
Changes harm water users, but likely better for fish – especially with export pumping removed.
Peripheral canal seems best for “co-equal” fish and water supply. No exports best for fish alone.
Don’t rely on Delta levees to protect water supply.
These conclusions are more robust than we expected.
16
Build a Peripheral Canal for Economic, Environmental Goals
Export users commit up front to pay for facilities
Export water users and upstream diverters contribute funds/water for ecosystem– Water quality savings from a canal
Expand PC diversions with fish conditions
Do not arbitrarily limit canal size– Better environmental operations– Use governance & ownership safeguards
Use PC benefits to help fund environment
17
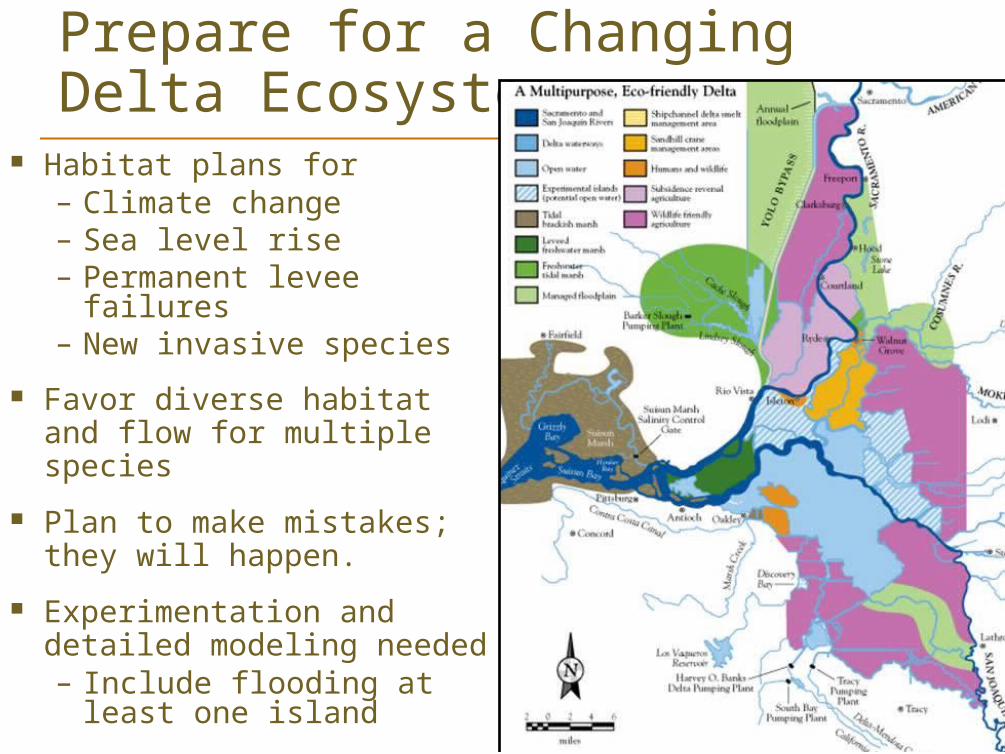
Prepare for a Changing Delta Ecosystem
Habitat plans for– Climate change – Sea level rise – Permanent levee
failures– New invasive species
Favor diverse habitat and flow for multiple species
Plan to make mistakes; they will happen.
Experimentation and detailed modeling needed– Include flooding at
least one island
18
Develop a New Framework for Delta Governance and Regulation
Build a more centralized, decision-capable system
Stakeholders cannot negotiate solution alone
State leadership (governor and legislature) is required
Prepare for regulatory consequences of sea level rise, climate warming, and island failures now
19
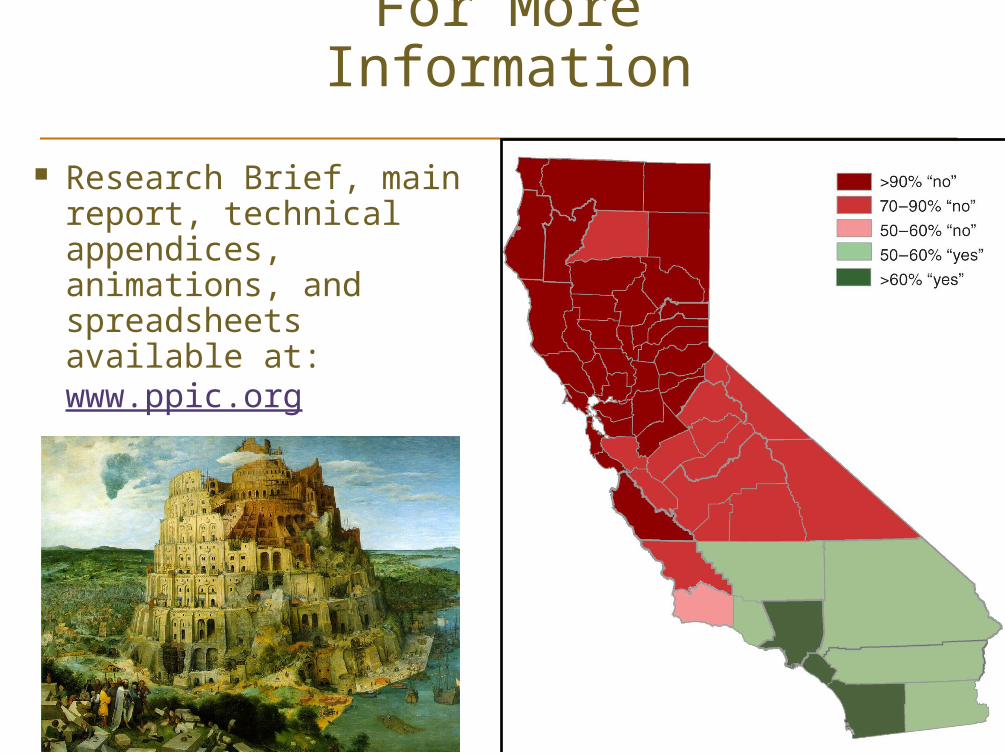
For More Information
Research Brief, main report, technical appendices, animations, and spreadsheets available at: www.ppic.org


