Download - 1 Lenawee Cradle to Career – Pathways to Success Leadership Team Meeting February 11, 2015
1
Lenawee Cradle to Career – Pathways to SuccessLeadership Team Meeting
February 11, 2015

22
• To review the Kindergarten Readiness community level outcome in terms of core indicators and baseline data.
• To review the training offered for those who have taken/will take the BRIGANCE Assessment tool professional development.
• To learn about a System Scan o What is it? o What additional information/data does it provide the
Student Success Network?
MEETING OBJECTIVES:

33
Agenda

Kindergarten ReadinessOur Journey in Lenawee County
Through theLenawee Cradle to Career Partnership

Data Committee Report, September 12, 2013(Stan Masters, Kyle Hoffman, Amy Palmer, Christine MacNaughton, Peggy
Molter)
• The committee began to identify the goals that could be measured using multiple data sets to determine how successful Lenawee County students currently are and can become as the result of a community effort.
• These goals include:• Readiness for entering school• High academic achievement in content areas and skills• Strong relationships with engaged adults • Healthy physical and emotional habits• Developing persistent and positive behaviors in school settings• Purposeful post-secondary plans for education and employment• Attainment of certificates and degrees in their chosen field of study• Desired employment leading to high levels of socioeconomic well-
being

Are young people in our county ready to enter Kindergarten?
Current State• Our county does not
collect uniform data sets
• The State does not provide a common data set
• There are many preschool options offered to families within Lenawee County

Are young people in our county ready to enter Kindergarten?
Current State• Our county does not
collect uniform data sets
• The State does not provide a common data set
• There are many preschool options offered to families within Lenawee County
Future State• Identify common traits
to collect data sets• Determine percent of
children assessed as readyfor school at kindergarten using multiple measures

Community
Level Outcom
es
Kindergarten
Readiness
Post-Second
aryComplet
ion
Early Grade
ReadingProficie
ncy
Middle GradeMath
Proficiency
Post-Seconda
ryEnrollm
ent
High School
Graduation
Ready for
Success
Mission
Vision Every One, Every Step of the Way, Cradle to Career.
To ensure that everyone has a pathway to reach their potential… cradle to career
Lenawee Cradle to Career – Pathways to Success
Middle Grade
Science Proficien
cy

Why is this topic important?
• At this time, there are no studies that identify early childhood indicators of postsecondary success.
• There are only a small number of early childhood predictors of postsecondary readiness
• Participation in child care and early education• Early approaches to learning leading to math and reading scores and grade
promotion• Positive “school readiness risk profile”
• Physical health, socio-emotional development, approaches to learning, cognitive development
• There are considerably more other potential factors. • Working memory, positive play interaction, engaging to task completion
Source: “Predictors of Postsecondary Success”, College and Career Readiness and Success Center at American Institutes for Research, 2013

Community Data Sets Criteria
• population based at the community level • valid measure outlined on the pathway• easily understandable to local stakeholders• reasonably similar across school districts• produced by a trusted source• have the ability to be compared• need to be affordable to gather and report• available consistently over time• changeable to a significant degree by local action
• useful in the work of the partnership

Domain and Assessment Targets for Kindergarten Readiness Data
CollectionDomain Assessment TargetAcademic/ Cognitive Knows Personal InformationLanguage Development Names Parts of the Body
Physical Development Gross Motor SkillsPhysical Development Visual Motor SkillsPhysical Development Prints Personal InformationAcademic/ Cognitive Literacy Recites Alphabet
Academic/ Cognitive Mathematics Sorts Objects by size, color, and shape
Academic/ Cognitive Mathematics Counts by Rote
Academic/ Cognitive Mathematics Matches Quantities with Numerals
Academic/ Cognitive Mathematics Determines Total of Two Sets
Academic/ Cognitive LiteracyReads Uppercase Letters OR Reads Lowercase Letters
Academic/ Cognitive Literacy Experience with Books and Text
Language Development Verbal Fluency and Articulation

Ready for Kindergart
en?

A Systems Approach for Meeting the Needs of Children Age 0-8
Strategic Planning Overview2/11/2015

Welcome
Introductions Kay Balcer, Balcer Consulting &
Prevention Service Group Facilitators
What is the Purpose of a GSC?The goal of the Great Start system is for all Michigan children to be healthy and ready to succeed in school and in life.
Four State Directed Outcomes1. Children are born healthy.2. Children are healthy, thriving, and
developmentally on track from birth to 3rd grade.
3. Children are developmentally ready to succeed in school at time of school entry.
4. Children are prepared to succeed in fourth grade and beyond by reading proficiently by the end of third grade.
Infrastructure Outcome
Highly effective GSC and Great Start Parent Coalition (GSPC) work together to build and reform the local early childhood system to achieve better outcomes for young children and their families.
ABLe Change Framework
Changing the System through a process of understanding and intentionally selecting system changes. What is happening in the system? Why is it happening? What actions will successfully address
issues in the system?

Family Conversation
Have a 60 minute meeting scheduled.
GSC conversation will include a few additional steps and additional time.


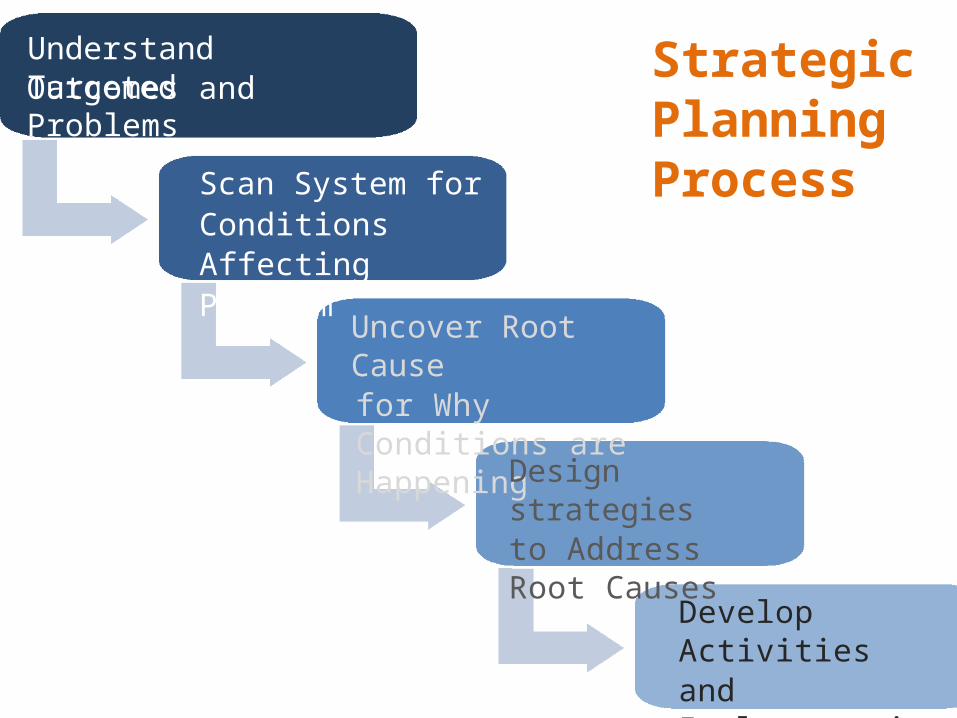
Understand Targeted Outcomes and Problems
Scan System for Conditions AffectingProblem
Strategic Planning Process
Uncover Root Cause for Why Conditions are Happening Design
strategies to Address Root Causes
Develop Activities and Implementation Supports

ABLe Simple Rules
Think Systemically
Engage Diverse Perspectives
Incubate Change
Implement Effectively
Adapt Quickly
Pursue Social Justice

ABLe Simple Rules
Think Systemically
Engage Diverse Perspectives

Thinking Systematically


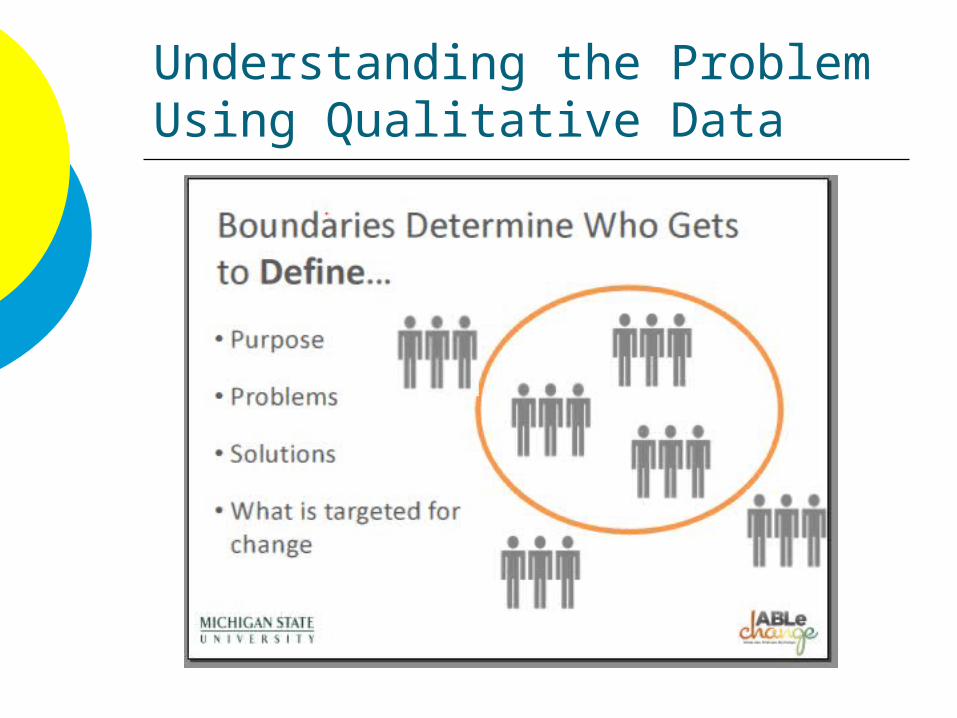
Understanding the Problem Using Qualitative Data
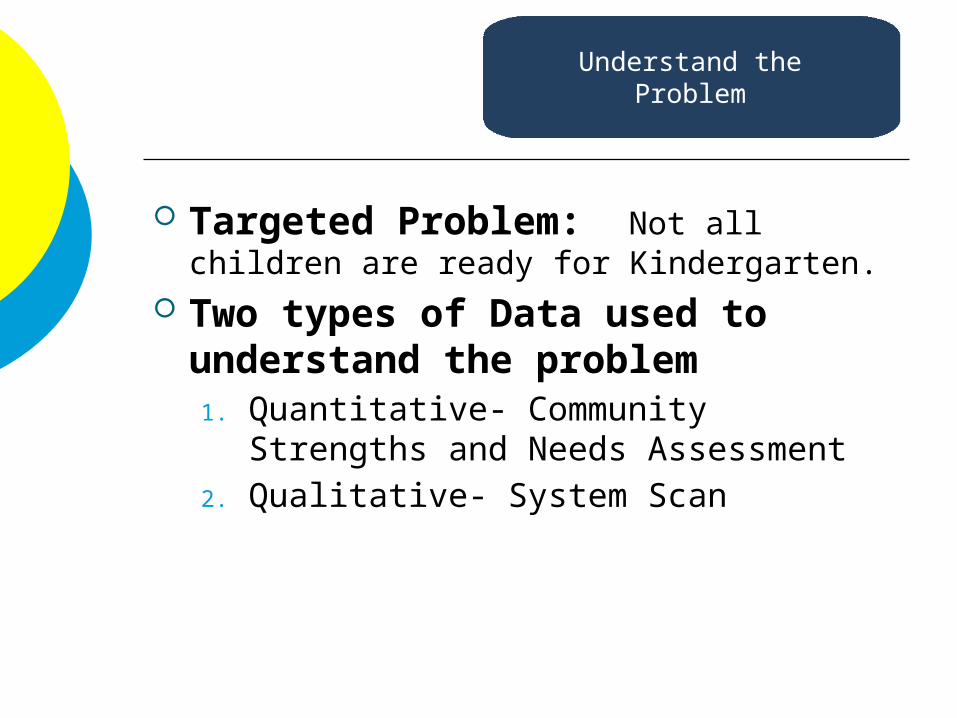
Targeted Problem: Not all children are ready for Kindergarten.
Two types of Data used to understand the problem1. Quantitative- Community Strengths
and Needs Assessment2. Qualitative- System Scan
Understand the Problem


What does the quantitative data tell us?
Strengths Economic indicators for
unemployment (improving trend) and median income (2012 data)
Severe Housing Problems Adequate Prenatal Care Low Birthweight Adult obesity indicators Child Insured Rates

What does the quantitative data tell us?
Strengths, cont. Mental Health Provider ratio Mothers with High School/GED Teen Births (trend) & Repeat Team
births Increase in GSRP Slots Estimated Preschool participation
rate (census) Reading & Math proficiency

What does the quantitative data tell us?
Indicated Needs Childhood poverty and low
income Single Parent Families Smoking During Pregnancy Low Income Child Obesity Immunizations (2013 data) Infant mortality (low # of 10)
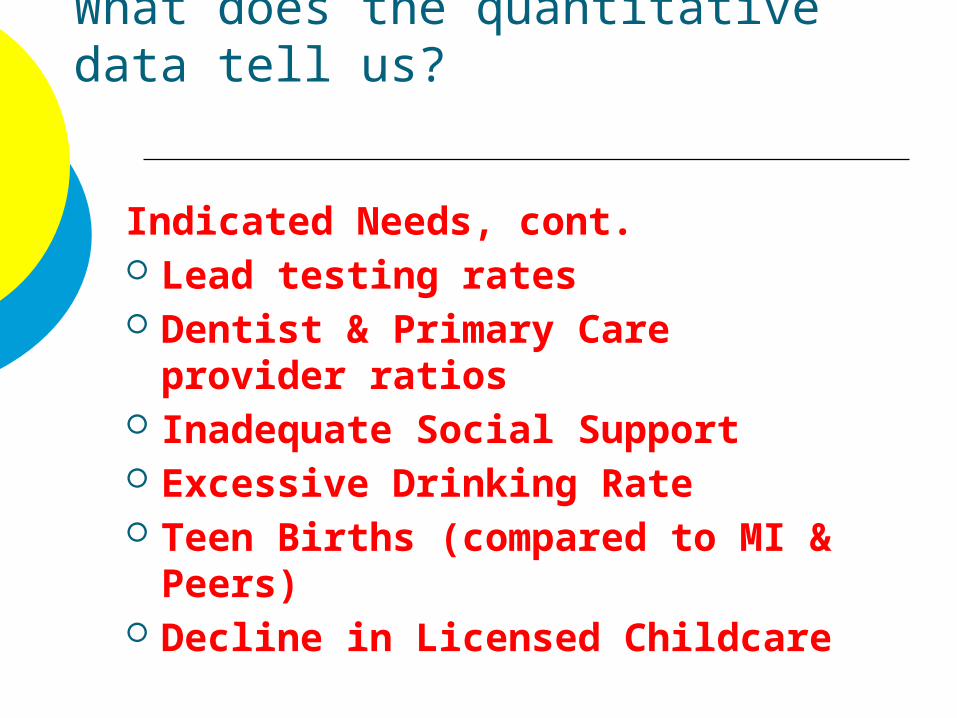
What does the quantitative data tell us?
Indicated Needs, cont. Lead testing rates Dentist & Primary Care provider
ratios Inadequate Social Support Excessive Drinking Rate Teen Births (compared to MI &
Peers) Decline in Licensed Childcare
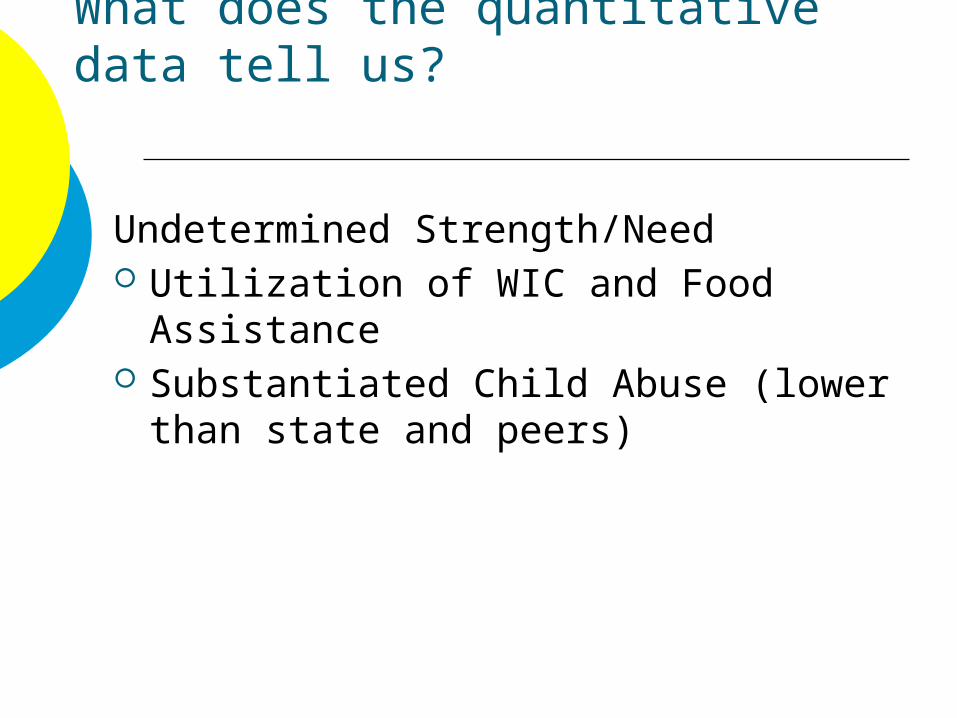
What does the quantitative data tell us?
Undetermined Strength/Need Utilization of WIC and Food Assistance Substantiated Child Abuse (lower than
state and peers)

Do these quantitative statistics tell the whole story?
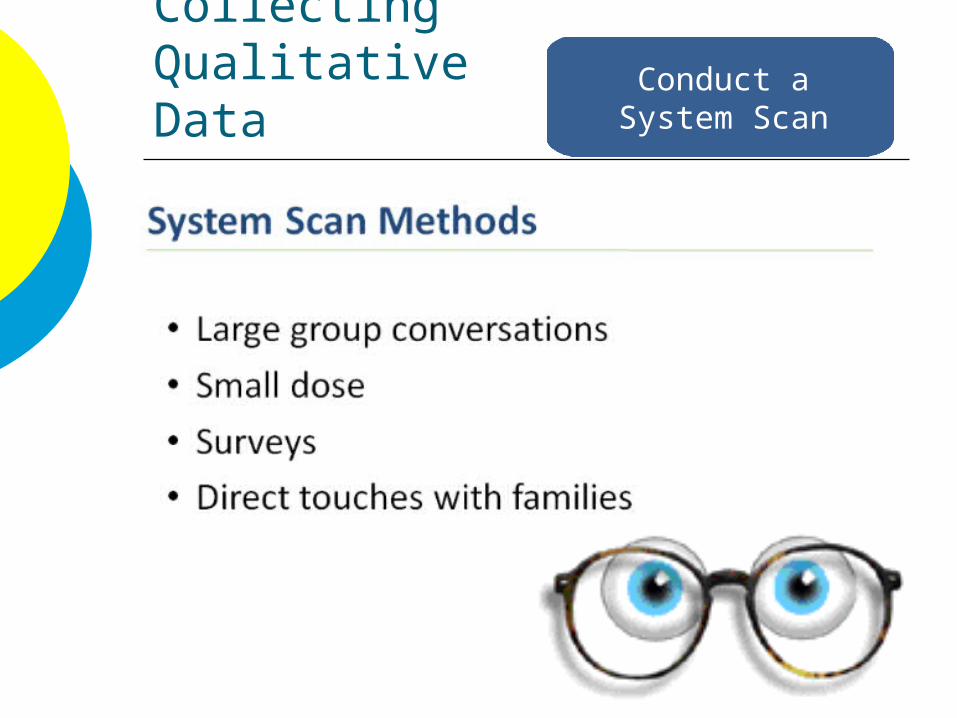
Collecting Qualitative Data
Conduct a System Scan

What will the Lenawee GSC System Scan Include?
Round 1-SurveysFamilyProvider
Survey data was utilized to produce the questions for Round 2

Childcare Provider Survey (27) 7 childcare providers would be interested in accepting
child care scholarships. 63% had gotten social/emotional support for children
(LiSD, Catholic Charities, local school staff) and 88% trained in some behavioral model
Reasons for expelling children- 5 for non-payment, 7 for behavioral issues of child, 1 for behavioral issue of parent.
Reasons for nonparticipation in rating system: 5 related to complexity of task or technical problem, one is part of school program, and one did not know about system

Provider Survey (39; 54)- Cross section of perspectives and 5 star points
24% reported having to deny services due to eligibility for 11 or more families per year and another 15% 1-5 families per year.
New mom's get their information from their parents/friends instead of listening to new research and recommendations.
** Note on the family survey: Most popular sources for information on child development- Doctor (86%); Family (72%); Friends (52%), Online (48%), Early On/LISD (36%)

Provider Survey, cont. Knowledge of services among providers is a
need Barriers related to enrollment in services
exist. 60% believe that regulations are
determined by external forces (state, funders, etc) and do not involve direct service staff or families.
40% believe that the regulations are determined by directors and leaders
90% believe that policies can be changed
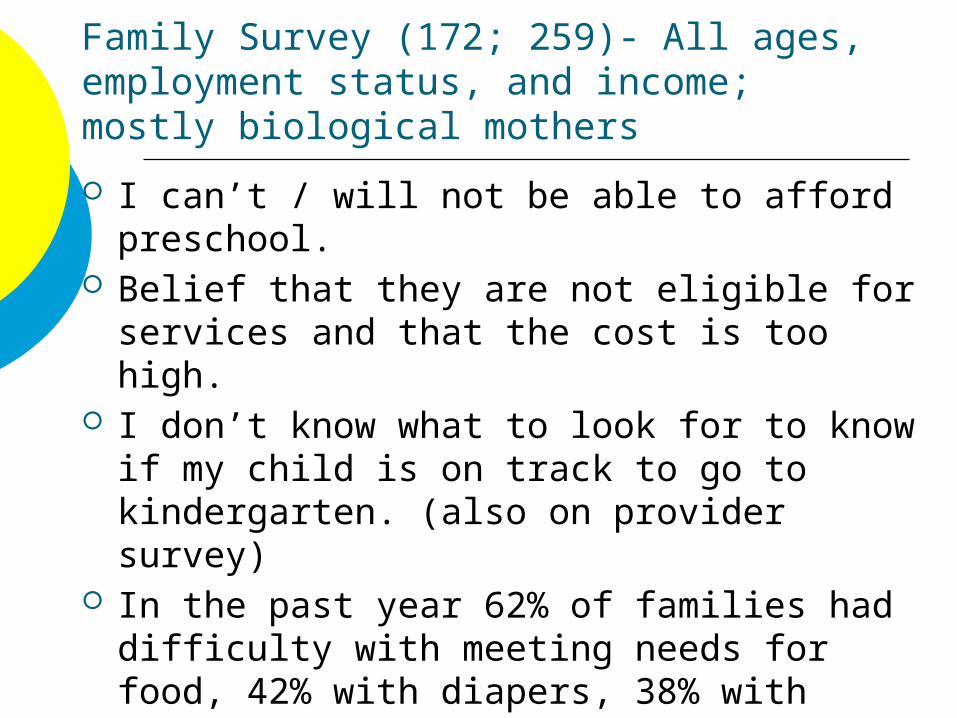
Family Survey (172; 259)- All ages, employment status, and income; mostly biological mothers
I can’t / will not be able to afford preschool. Belief that they are not eligible for services
and that the cost is too high. I don’t know what to look for to know if my
child is on track to go to kindergarten. (also on provider survey)
In the past year 62% of families had difficulty with meeting needs for food, 42% with diapers, 38% with housing, and 30% with healthcare.

Family Survey (172; 259)- All ages, employment status, and income; mostly biological mothers
92% believe that children start learning at birth
High degree of satisfaction with early learning and K-3 education
Top Concerns of Families (top 6)1. Child’s health (54%)2. Safety (50%)3. Feeding their family (50%)4. Child’s development (48%)5. Housing (37%)6. Children’s success in school (32%)

What will the Lenawee GSC System Scan Include?
Round 2- System Scan Meetings to fill in gaps and dig deeperLarge Group Conversation-
2/11/2015Other Ideas (To Be Determined)
Small Dose Conversations Interviews or Outreach to clients Other

Today’s Conversation We will be using worksheets to
explore a targeted problem. Remember this is a needs based
process- the goal is to find gaps and areas for change, avoid taking comments personally
Focused activity- have post it notes for questions or parking lot items to discuss later.
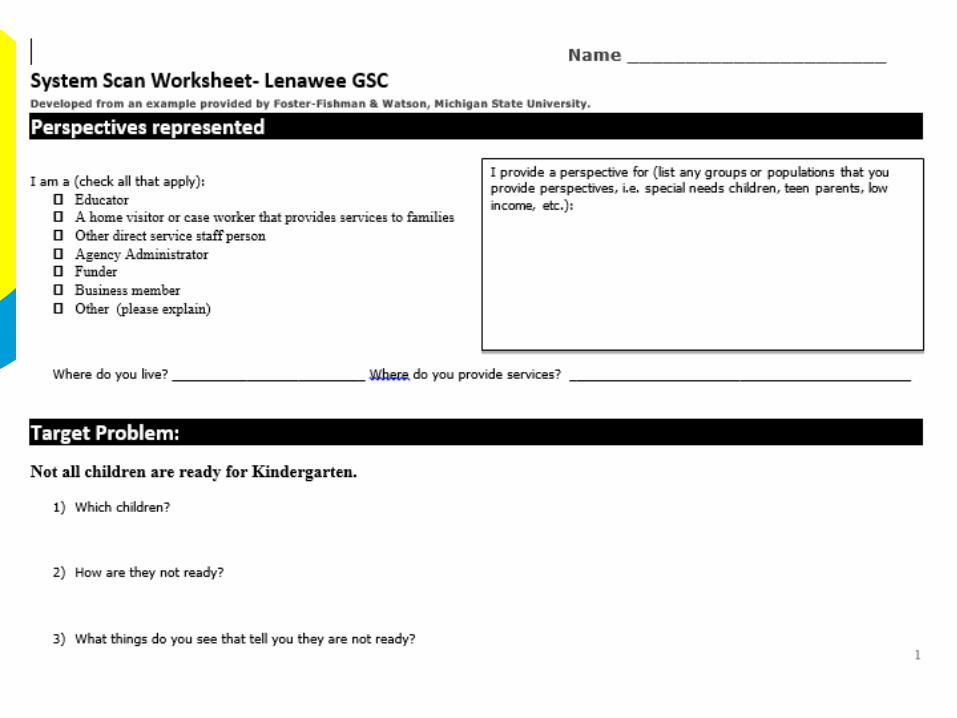

Sections of worksheet
Complete the Cover Sheet What perspective do you represent? Need to collect this information for 2
reasons:1. To identify if we need to reach out to
additional people2. To group answers so that we can
understand where there are differences in perspectives.

System Scan Process
You will be asked to answer six questions that are related to the system characteristics presented earlier. Program Components Connections Resources Regulations Mindsets Power

Important Notes!
Be specific- What is happening, NOT Why? To who is it happening (is there a
population group) Where is it happening? (Are the geographic
needs) Who in the system is involved? (i.e. is it all
home visiting programs or just one?) Are there needs related to something
shared in the data summary?

Important Notes!
Watch for assumptions Don’t jump to why Don’t jump to solutions Be careful about falling into a
pattern of blame Focus on system issues- what is
happening in the system? Write clearly

Instructions You will be working in three groups. We have a Facilitator for each table. You will have six questions to answer. We have allowed 10 minutes for each
question. Timekeeper will signal when it is time
to move to next step.

System Scan Form
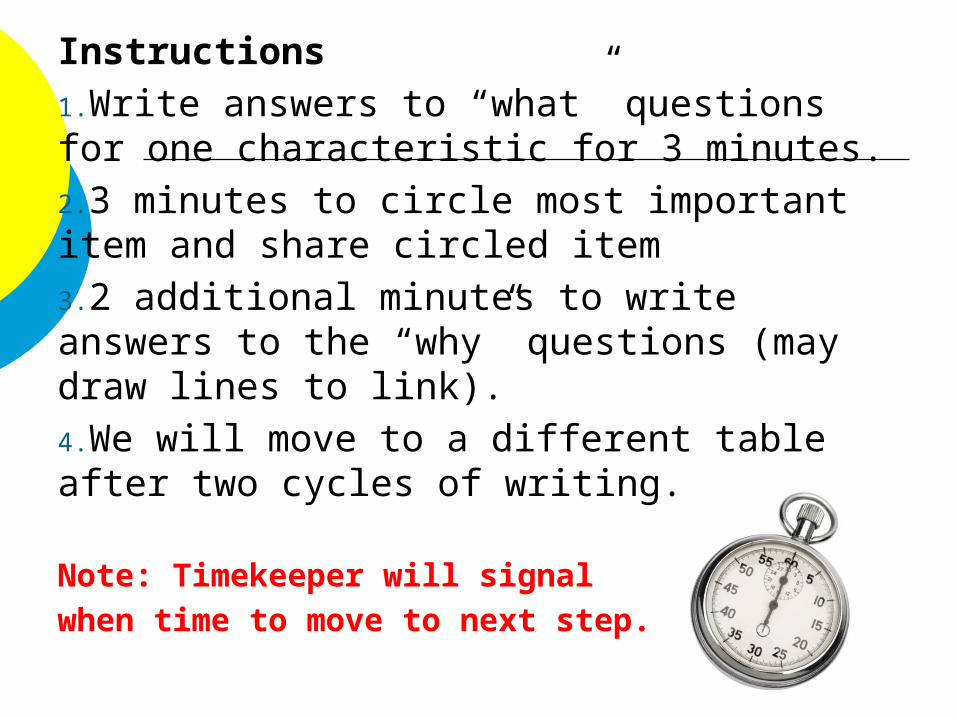
Instructions1.Write answers to “what” questions for one characteristic for 3 minutes.2.3 minutes to circle most important item and share circled item3.2 additional minutes to write answers to the “why” questions (may draw lines to link).4.We will move to a different table after two cycles of writing.
Note: Timekeeper will signal when time to move to next step.

Wrap Up What did you learn today? Anything that came up that
we should be paying attention to as we move forward?
What questions or parking lot items do you need to discuss now? Pass these to your group recorder.
Pass your data sheets to your group recorder.
Understand Targeted Outcomes and Problems
Scan System for Conditions AffectingProblem
Strategic Planning Process
Uncover Root Cause for Why Conditions are Happening Design
strategies to Address Root Causes
Develop Activities and Implementation Supports


