1
1
Biofuels
Biofuels: Release Prevention, Environmental Behavior, and Remediation
Sponsored by: Interstate Technology and Regulatory Council (www.itrcweb.org) Hosted by: US EPA Clean Up Information Network (www.cluin.org)
Welcome – Thanks for joining this ITRC Training Class
Biofuels and biofuel blends are a new category of transportation fuels and are defined as liquid fuels and blending components produced from renewable biomass feedstocks used as alternative or supplemental fuels for internal combustion engines. Their manufacture and consumption are increasing, in part, due to usage mandates and incentives both in the United States and abroad. This expanded use of biofuel and biofuel blends increases the potential frequency of releases due to the increased manufacture, transportation, storage, and distribution. Because biofuels differ from conventional fuels with respect to their physical, chemical, and biological properties, their introduction poses challenges with respect to understanding the potential impacts of releases to the environment. Specifically, once released into the environment, these fuels will exhibit different environmental behaviors as compared to conventional fuels.This training, which is based on the ITRC’s Biofuels: Release Prevention, Environmental Behavior, and Remediation (Biofuels-1, 2011), focuses on the differences between biofuels and conventional fuels specific to release scenarios, environmental impacts, characterization, and remediation. The trainers will define the scope of the potential environmental challenges by introducing biofuel fundamentals, regulatory status, and future usage projections. Participants will learn how and when to use the ITRC biofuels guidance document for their projects. They will understand the differences in biofuel and petroleum behavior; become familiar with the biofuel supply chain, potential release scenarios and release prevention; be able to develop an appropriate conceptual model for the investigation and remediation of biofuels and select appropriate investigation and remediation strategies; and be prepared to assess the behavior of new biofuels when alternatives come on the market.
ITRC (Interstate Technology and Regulatory Council) www.itrcweb.orgTraining Co-Sponsored by: US EPA Technology Innovation and Field Services Division (TIFSD) (www.clu-in.org) ITRC Training Program: [email protected]; Phone: 402-201-2419
2
2
Housekeeping
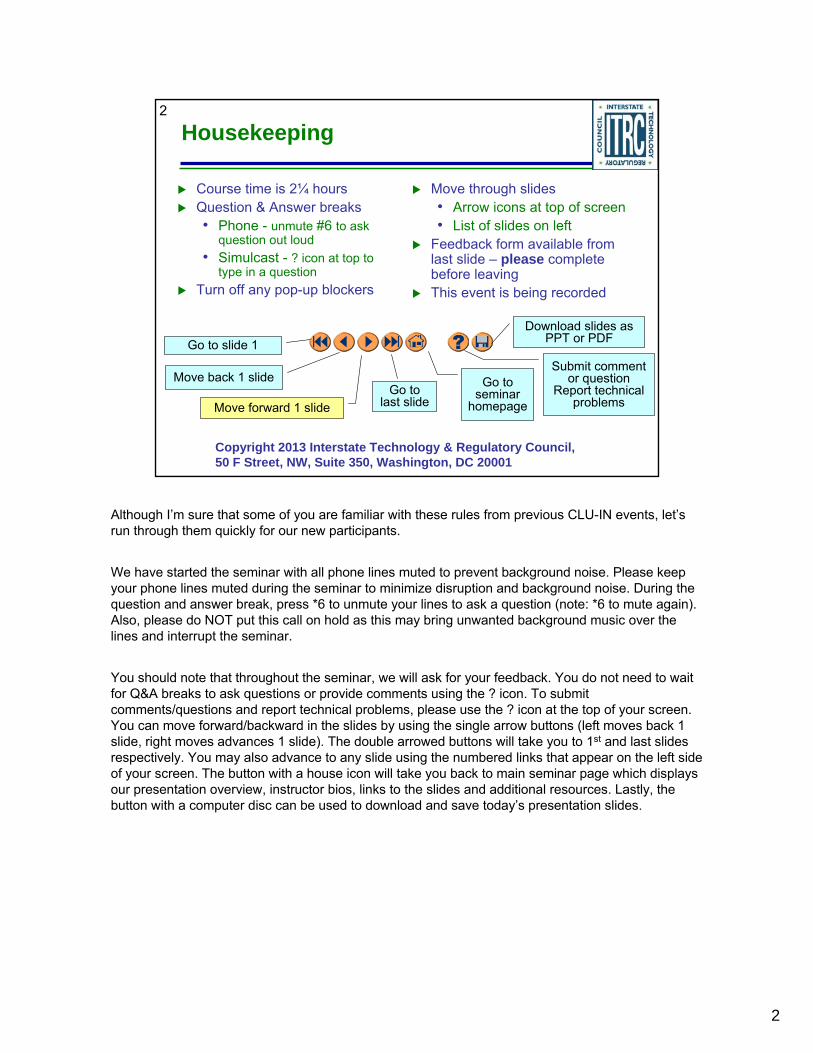
Course time is 2¼ hoursQuestion & Answer breaks• Phone - unmute #6 to ask
question out loud• Simulcast - ? icon at top to
type in a questionTurn off any pop-up blockers
Move through slides• Arrow icons at top of screen• List of slides on left
Feedback form available from last slide – please complete before leavingThis event is being recorded
Go to slide 1
Move back 1 slide
Download slides as PPT or PDF
Move forward 1 slide
Go to seminar
homepage
Submit comment or question
Report technical problems
Go to last slide
Copyright 2013 Interstate Technology & Regulatory Council, 50 F Street, NW, Suite 350, Washington, DC 20001
Although I’m sure that some of you are familiar with these rules from previous CLU-IN events, let’s run through them quickly for our new participants.
We have started the seminar with all phone lines muted to prevent background noise. Please keep your phone lines muted during the seminar to minimize disruption and background noise. During the question and answer break, press *6 to unmute your lines to ask a question (note: *6 to mute again). Also, please do NOT put this call on hold as this may bring unwanted background music over the lines and interrupt the seminar.
You should note that throughout the seminar, we will ask for your feedback. You do not need to wait for Q&A breaks to ask questions or provide comments using the ? icon. To submit comments/questions and report technical problems, please use the ? icon at the top of your screen. You can move forward/backward in the slides by using the single arrow buttons (left moves back 1 slide, right moves advances 1 slide). The double arrowed buttons will take you to 1st and last slides respectively. You may also advance to any slide using the numbered links that appear on the left side of your screen. The button with a house icon will take you back to main seminar page which displays our presentation overview, instructor bios, links to the slides and additional resources. Lastly, the button with a computer disc can be used to download and save today’s presentation slides.
3
3 ITRC (www.itrcweb.org) – Shaping the Future of Regulatory Acceptance
Host organizationNetwork• State regulators
All 50 states, PR, DC• Federal partners
• ITRC Industry Affiliates Program
• Academia• Community stakeholders
Disclaimer• Full version in “Notes” section• Partially funded by the U.S.
governmentITRC nor US government warrantee materialITRC nor US government endorse specific products
• ITRC materials copyrighted
Available from www.itrcweb.org• Technical and regulatory
guidance documents• Internet-based and classroom
training schedule• More…
DOE DOD EPA
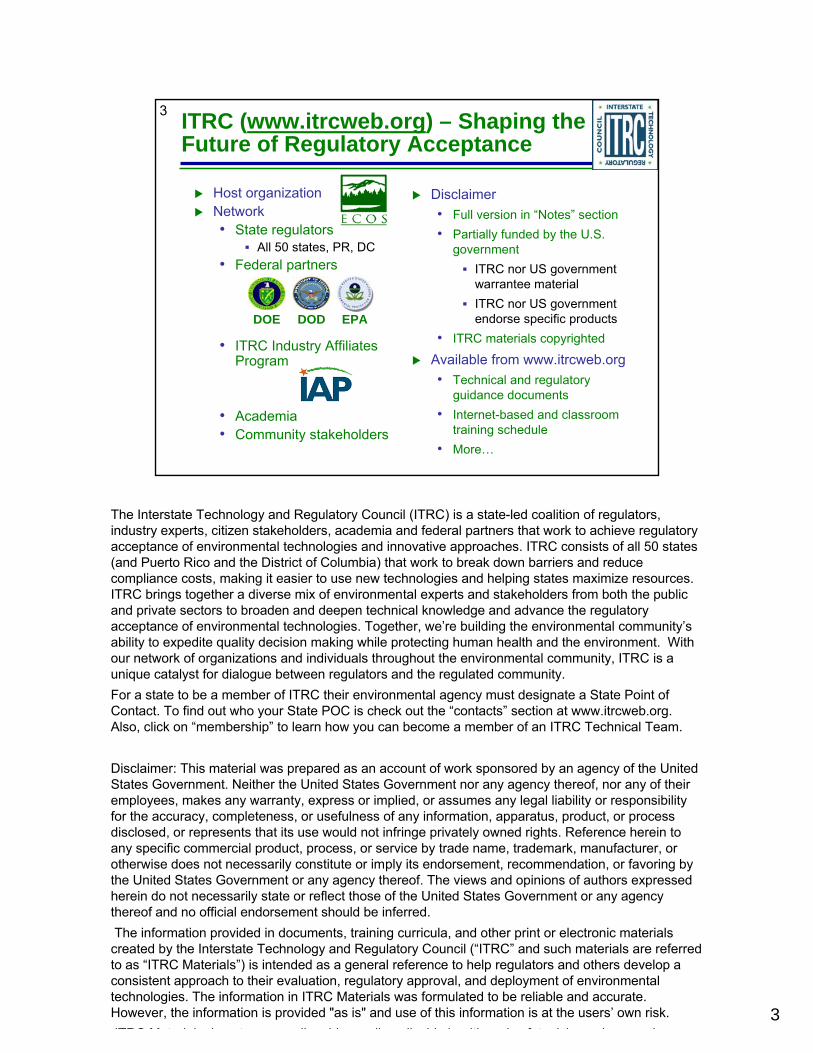
The Interstate Technology and Regulatory Council (ITRC) is a state-led coalition of regulators, industry experts, citizen stakeholders, academia and federal partners that work to achieve regulatory acceptance of environmental technologies and innovative approaches. ITRC consists of all 50 states (and Puerto Rico and the District of Columbia) that work to break down barriers and reduce compliance costs, making it easier to use new technologies and helping states maximize resources. ITRC brings together a diverse mix of environmental experts and stakeholders from both the public and private sectors to broaden and deepen technical knowledge and advance the regulatory acceptance of environmental technologies. Together, we’re building the environmental community’s ability to expedite quality decision making while protecting human health and the environment. With our network of organizations and individuals throughout the environmental community, ITRC is a unique catalyst for dialogue between regulators and the regulated community.For a state to be a member of ITRC their environmental agency must designate a State Point of Contact. To find out who your State POC is check out the “contacts” section at www.itrcweb.org. Also, click on “membership” to learn how you can become a member of an ITRC Technical Team.
Disclaimer: This material was prepared as an account of work sponsored by an agency of the United States Government. Neither the United States Government nor any agency thereof, nor any of their employees, makes any warranty, express or implied, or assumes any legal liability or responsibility for the accuracy, completeness, or usefulness of any information, apparatus, product, or process disclosed, or represents that its use would not infringe privately owned rights. Reference herein to any specific commercial product, process, or service by trade name, trademark, manufacturer, or otherwise does not necessarily constitute or imply its endorsement, recommendation, or favoring by the United States Government or any agency thereof. The views and opinions of authors expressed herein do not necessarily state or reflect those of the United States Government or any agency thereof and no official endorsement should be inferred.The information provided in documents, training curricula, and other print or electronic materials created by the Interstate Technology and Regulatory Council (“ITRC” and such materials are referred to as “ITRC Materials”) is intended as a general reference to help regulators and others develop a consistent approach to their evaluation, regulatory approval, and deployment of environmental technologies. The information in ITRC Materials was formulated to be reliable and accurate. However, the information is provided "as is" and use of this information is at the users’ own risk. ITRC M t i l d t il dd ll li bl h lth d f t i k d ti

4
4
Meet the ITRC Trainers
Mike MaddiganPennsylvania Department
Environmental Protection
Harrisburg, [email protected]
David TsaoBPNaperville, IL630-420-5147 [email protected]
Denice NelsonARCADIS-US, Inc.Minneapolis, MN612-386-4618denice.nelson
@arcadis-us.com
Mark TosoMinnesota Pollution
Control AgencySt. Paul, MN651-757-2158mark.toso
@state.mn.us
Mike Maddigan is an environmental chemist with the Pennsylvania Department of Environmental Protection’s (PADEP) Land Recycling Program (Act 2) in Harrisburg, PA. Since 2008, Mike has worked at PADEP focusing on human health and ecological risk assessment, vapor intrusion and the Uniform Environmental Covenants Act (UECA). Mike provides technical support for the administration of the Land Recycling Program (PA’s voluntary cleanup program) and has performed human health and ecological risk assessment reviews in support of Act 2 remediation projects throughout Pennsylvania. Mike also provides support with the administration of UECA, the development of an environmental covenant registry and the development of PADEP’s vapor intrusion guidance. Before joining PADEP, Mike served as an environmental scientist for 11 years with Gannett Fleming, Inc. in Camp Hill, PA. Mike’s duties at Gannett Fleming included managing projects for a variety of environmental investigations and site assessment projects along with performing human health and ecological risk assessment reviews and numerous field projects. Mike joined the ITRC Biofuels team in early 2009 and has served as the Fate and Transport Section subteam leader. This is Mike’s first experience working with ITRC. Mike earned a bachelor's degree in environmental resource management from Penn State University in 1993 in University Park, Pennsylvania and a master's degree in environmental pollution control in 1998 from Penn State University's Harrisburg, Pennsylvania campus. Dr. David Tsao is a technical specialist for the Remediation Engineering & Technology group in BP’s Remediation Management function at their Naperville, IL office. In response to the Deepwater Horizon incident, David was Strike Team Leader evaluating biological and chemical agents for the long term remediation and restoration of Gulf Coast shorelines and wetlands. Concurrent with these responsibilities, David has been leading BP’s evaluation of the potential environmental impacts of current and future biofuels and other fuel oxygenates since 1997. He is responsible for providing general technical support to a broad range of contaminated sites around the globe by developing site conceptual models, selecting appropriate remedies, and optimizing the performance of engineered remediation systems. David specializes in the development, advocacy, and implementation of bioremediation, phytotechnologies, treatment wetlands, ecosystem restoration, and other natural systems technologies. He has actively participated and taught these technologies through the Interstate Technology and Regulatory Council since 2000 (Phytotechnologies-1, Constructed Wetlands, Mitigation Wetlands, Ecological Land Reuse, Phytotechnologies -2). David was also involved on the MTBE and Mining Wastes teams, and is active on the Biofuels, Sediment Remediation, and Biochemical Reactors for Mine-Influenced Waters teams. He is a three-time chemical engineering graduate of Purdue University earning his baccalaureate degree in 1988, Masters in 1990, and Doctorates in 1997. His research theses included plant biotechnology, phytochemical and pharmaceutical production, plant nutrition, and plant biomass production for zero-gravity (NASA) applications. Dr. Denice Nelson is a Principal Remediation Engineer with ARCADIS-US, and is located in the Minneapolis, Minnesota office. Since 2000 she has focused on the application and optimization of injection-based bioremediation technologies including enhanced reductive dechlorination, anaerobic biological oxidation of petroleum hydrocarbons, metals precipitation, and explosives remediation. Denice’s current responsibilities include leading the In Situ Bioremediation Services group within ARCADIS-US which entails providing technical assistance, strategy development, and engineering oversight on several contaminated sites undergoing bioremediation. Through this role, she also manages a team of technical staff whose responsibilities include ensuring high quality and consistent design standards are applied to bioremediation sites throughout the United States. Denice has been an active member of the ITRC Biofuels team since 2010. She became involved with the team through her PhD research where she focused on quantifying the effect of ethanol-based fuel input on the indigenous microbial communities in groundwater, focusing on the effects that a low concentration E85 input had on methane-producing organisms and subsequent methane production, the type and quantity of fermentation products, and the structure of the groundwater aquifer microbial community. Denice routinely presents at national conferences, has taught several short courses on bioremediation, and has also authored several technical publications. Denice earned a bachelor’s degree in Civil Engineering in 1998, a master’s degree in Environmental Engineering in 2001, and a doctoral degree in Environmental Engineering in 2009 from the University of Minnesota in Minneapolis. Denice is a registered professional engineer in Minnesota.Mark Toso is a hydrogeologist at the Minnesota Pollution Control Agency in St Paul, MN. Working in the MPCA’s remediation division since 1992, his responsibilities include technical oversight of investigation and remediation at petroleum and chemical tank storage facilities, biofuel production facilities, RCRA and superfund sites, and pipeline releases. He also provides technical assistance for the emergency response program. Mark is a registered a Professional Geologist in Minnesota and Wisconsin. Prior to his work as a regulator he spent 5 years as a geologist in the private sector. Mark has been a member of the ITRC Biofuels team since its inception. Mark earned a bachelor's of science degree in geology from the University of Wisconsin in Madison in 1985 and since then has completed graduate level coursework within the University of Wisconsin system.
5
Biofuels and the Environment
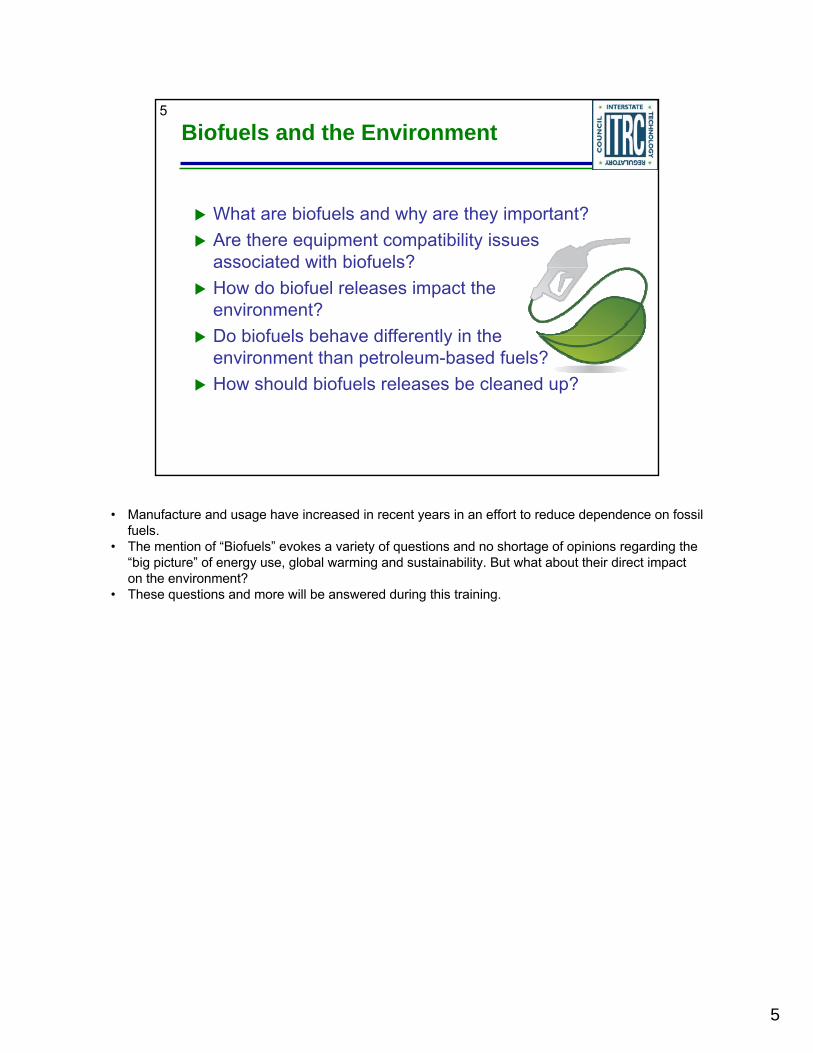
What are biofuels and why are they important?Are there equipment compatibility issues associated with biofuels?How do biofuel releases impact theenvironment?Do biofuels behave differently in the environment than petroleum-based fuels?How should biofuels releases be cleaned up?
• Manufacture and usage have increased in recent years in an effort to reduce dependence on fossil fuels.
• The mention of “Biofuels” evokes a variety of questions and no shortage of opinions regarding the “big picture” of energy use, global warming and sustainability. But what about their direct impact on the environment?
• These questions and more will be answered during this training.
5

6
What You Will Learn
Scope of potential environmental challenges Differences between biofuel and petroleum fuel behavior Biofuel supply chain, potential release scenarios, and release prevention How to develop an appropriate conceptual model for the investigation and remediation of biofuelsAppropriate investigation and remediation strategiesHow to assess the behavior of new biofuels when alternatives come on the market
This training is designed to help you get the most out of the ITRC biofuels document.
6

7
Training Roadmap
IntroductionReleasesFate and TransportQ&A Session #1Site InvestigationLong-Term Response StrategiesSummaryQ&A Session #2
= hypothetical case study
These “Roadmap” slides are shown when we change topics during the training.
The red star indicates we’re discussing the hypothetical case study used to better illustrate specific points.
7

8
CapillaryFringe
Aquifer
VadoseZone
DispensingStation
Our Hypothetical Case Study
UndergroundStorage TankSystem (UST)
DispenserSystem
GroundwaterFlow Direction
This case study will serve as a visual aid throughout the training and will be building upon the case study as we progress through the training.
8

9
What Are Biofuels?
For the purposes of this training, the term biofuel is applied to liquid fuels and blending components produced from renewable biomass feedstocks used as alternative or supplemental fuels for internal combustion engines.
“Biofuels” is a relatively general term and it is defined differently depending on who you ask. Biofuels can be in the form of solid and gas as well as liquid fuel.
9

10
Important Terms
Denatured Fuel Ethanol (DFE) – fuel ethanol made unfit for beverage use by the addition of a denaturant; also called E95.
FAME (Fatty Acid Mono-alkyl or Methyl Esters) –Transesterified oils derived from vegetable oils or animal fats, blended with or used in place of conventional diesel fuels.
Biofuel Blend – Mixture of biofuel and conventional petroleum-based fuel.
Conventional Fuel – A mixture of compounds, called hydrocarbons, refined from petroleum crude, plus additives to improve its stability, control deposit formation in engines, and modify other characteristics.
See Glossary (Appendix G) for complete list of terms used in the document. http://www.itrcweb.org/guidancedocument.asp?TID=76
In this training, conventional fuels include lower-percentage biofuel fuel blends, such as E10 and B5.
10
11
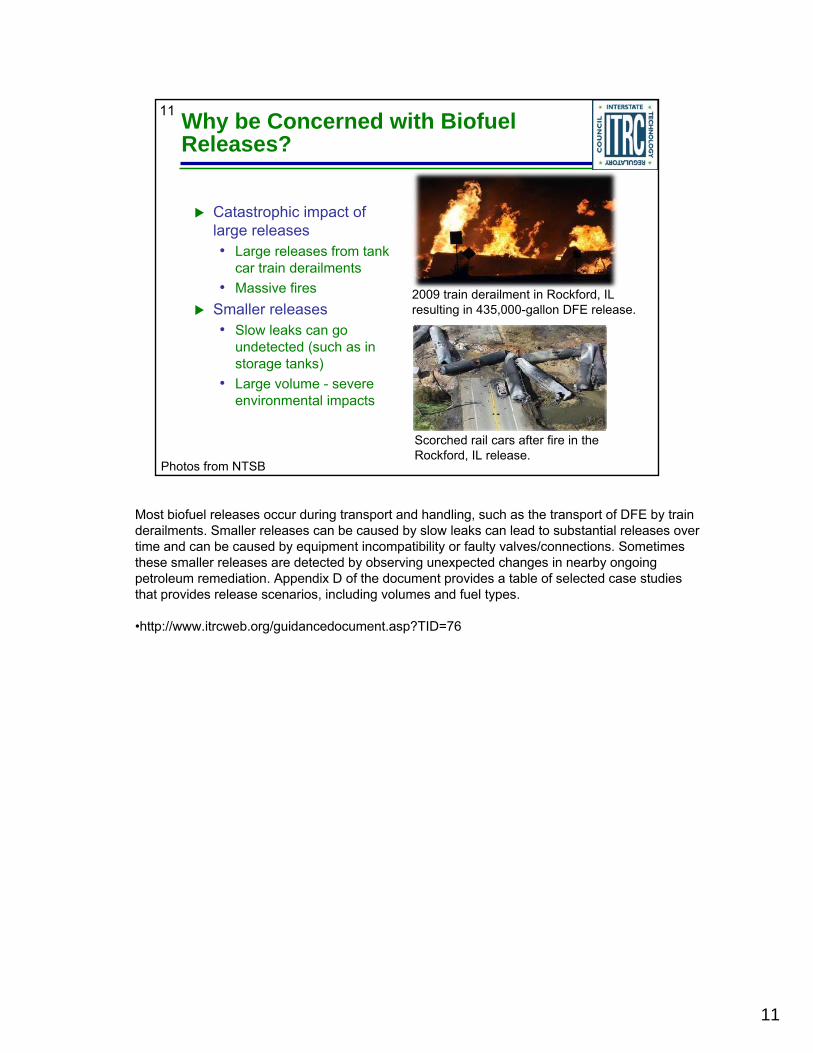
11 Why be Concerned with BiofuelReleases?
Catastrophic impact of large releases• Large releases from tank
car train derailments• Massive fires
Smaller releases• Slow leaks can go
undetected (such as in storage tanks)
• Large volume - severe environmental impacts
2009 train derailment in Rockford, IL resulting in 435,000-gallon DFE release.
Scorched rail cars after fire in the Rockford, IL release.
Photos from NTSB
Most biofuel releases occur during transport and handling, such as the transport of DFE by train derailments. Smaller releases can be caused by slow leaks can lead to substantial releases over time and can be caused by equipment incompatibility or faulty valves/connections. Sometimes these smaller releases are detected by observing unexpected changes in nearby ongoing petroleum remediation. Appendix D of the document provides a table of selected case studies that provides release scenarios, including volumes and fuel types.
•http://www.itrcweb.org/guidancedocument.asp?TID=76

12
Petroleum vs. Biofuel Releases
Behave differently in the environment• Site characterization and
remediation strategy• Safety risks• Potential release points
For more info on LNAPL training go to http://www.itrcweb.org
Biofuel releases behave differently than petroleum in the environmentSite characterization and remediation strategySafety risksPotential release points
Objectives of site characterization and remediation strategies for biofuel releases may be different from petroleum releases.
Methane generation at biofuel spill locations can pose a safety risk during site investigation activities.
Most petroleum is transported via pipeline while biofuels are transported via truck or rail. Increased handling and transfer of biofuels poses a higher potential frequency of releases.
ITRC LNAPL Training and Documents
ITRC’s 2-day classroom training on LNAPLs, Light Nonaqueous-Phase Liquids: Science, Management, and Technology, will enable you to develop and apply an LNAPL Conceptual Site Model (LCSM), understand and assess LNAPL subsurface behavior, develop and justify LNAPL remedial objectives including maximum extent practicable considerations, select appropriate LNAPL remedial technologies and measure progress, and use ITRC’s science-based LNAPL guidance to efficiently move sites to closure. More information is available from http://www.itrcweb.org/crt.asp
ITRC also offers Internet-based training on LNAPLs. More information and registration fromhttp://www.itrcweb.org/ibt.asp LNAPL Part 1: An Improved Understanding of LNAPL Behavior in the Subsurface LNAPL Part 2: LNAPL Characterization and RecoverabilityLNAPL Part 3: Evaluating LNAPL Remedial Technologies for Achieving Project Goals
ITRC LNAPL team products are available from http://www.itrcweb.org/LNAPLs
12
13
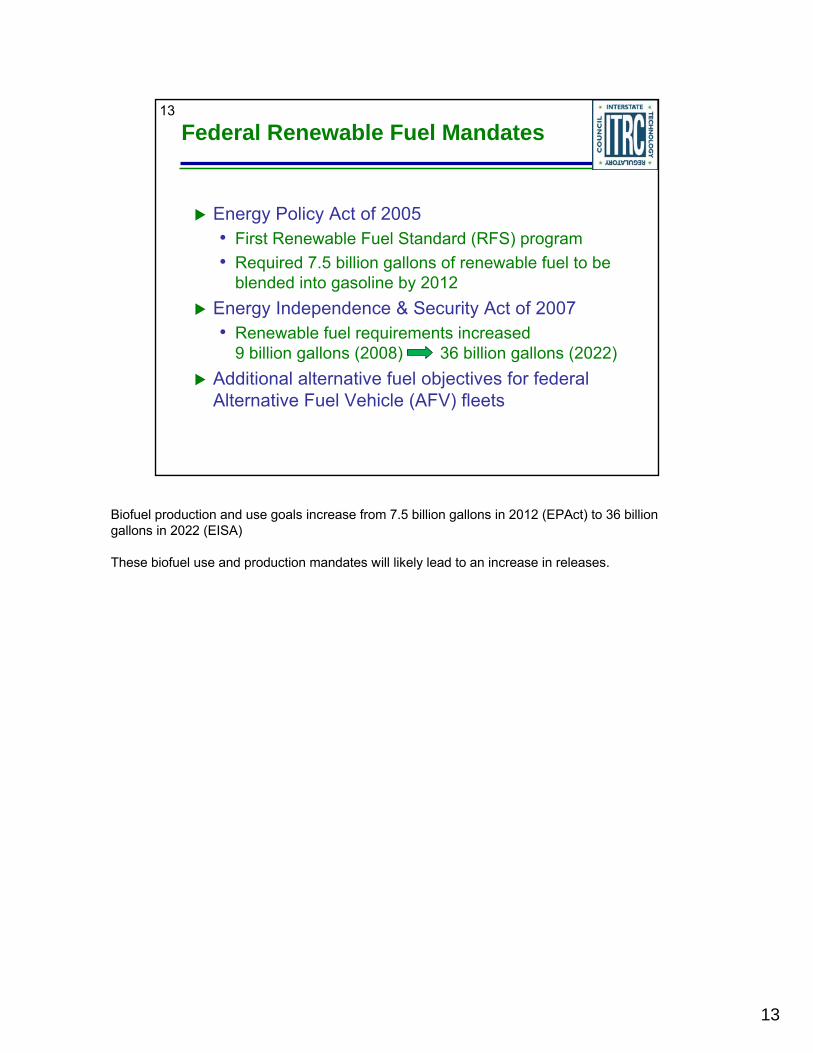
Federal Renewable Fuel Mandates
Energy Policy Act of 2005• First Renewable Fuel Standard (RFS) program• Required 7.5 billion gallons of renewable fuel to be
blended into gasoline by 2012Energy Independence & Security Act of 2007• Renewable fuel requirements increased
9 billion gallons (2008) 36 billion gallons (2022)Additional alternative fuel objectives for federal Alternative Fuel Vehicle (AFV) fleets
Biofuel production and use goals increase from 7.5 billion gallons in 2012 (EPAct) to 36 billion gallons in 2022 (EISA)
These biofuel use and production mandates will likely lead to an increase in releases.
13

14
14 State Renewable Fuel MandatesTable 1-3
NM
MTWA
OR MN
MO
LAFL
PA MA
HI
As of April 2011, eleven U.S. states have passed mandates on the use of biofuels or biofuel blends. (Table 1-3 in document).
•Florida*•Hawaii•Louisiana•Massachusetts*•Minnesota•Missouri•Montana•New Mexico•Oregon•Pennsylvania•Washington
* As of June 2010, Massachusetts has suspended the formal requirement on grounds of unreasonable cost. As of July 1, 2013, Florida has repealed the state’s renewable fuel standard on the grounds that it is a duplication of the Federal Renewable Fuel Standard and that it is inconsistent with efforts to reduce the regulatory burden on Floridians.
Some states have one or more of the following mandates:• Producer or retailer incentive programs• Labeling requirements• State fleet fuel purchase/use requirements
15
International Mandates
European Union• Directive 2003/30/EC• Promotes biofuels use in
transportation sector• Proposes non-mandatory
biofuels use targetsBrazil• Has required the use of
biofuels since 1976
International mandates – EU and Brazil
15

16 ITRC Guidance: Biofuels: Release Prevention, Environmental Behavior, and Remediation
1. Biofuel basics2. Release prevention and
response planning3. Fate & transport (F&T) of
biofuels in the environment4. Characterizing release
sites5. Long-term response
strategies6. Stakeholder concerns
ITRC document Biofuels: Release Prevention, Environmental Behavior, and Remediation. Released in September 2011.
Stakeholder concerns are addressed in the document in Section 6. Stakeholder concerns are associated with the prevention, environmental behavior, and remediation of accidental biofuel releases and generally depend on the location and timing of the incident, emergency response, and long-term management and cleanup. In this training, stakeholder concerns are incorporated into each section of the training. For example, fish kills as described in the fate and transport and site investigation section are a significant potential stakeholder concern. Methane generation and the explosive hazard it presents is another significant concern discussed throughout the training.
16
17
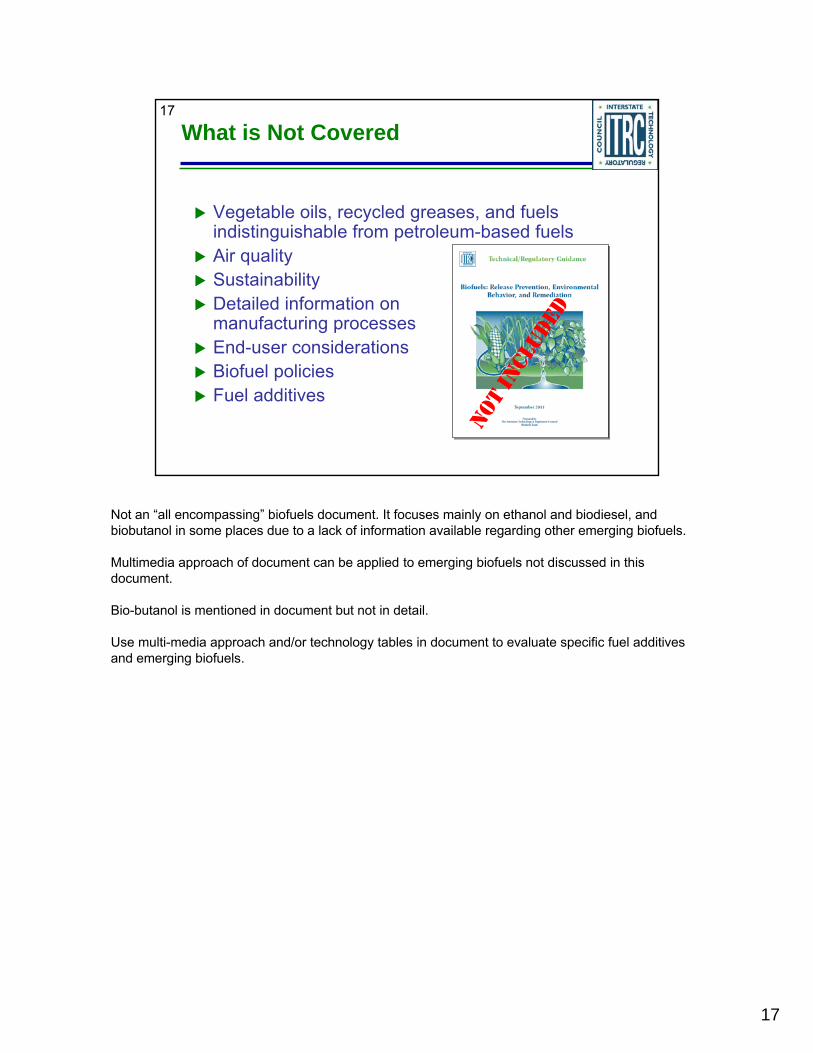
What is Not Covered
Vegetable oils, recycled greases, and fuels indistinguishable from petroleum-based fuelsAir qualitySustainabilityDetailed information on manufacturing processesEnd-user considerationsBiofuel policiesFuel additives
NO
T IN
CLU
DED
Not an “all encompassing” biofuels document. It focuses mainly on ethanol and biodiesel, and biobutanol in some places due to a lack of information available regarding other emerging biofuels.
Multimedia approach of document can be applied to emerging biofuels not discussed in this document.
Bio-butanol is mentioned in document but not in detail.
Use multi-media approach and/or technology tables in document to evaluate specific fuel additives and emerging biofuels.
17

18 Applying the ITRC Document Before a Release
Release prevention• Ensure materials
compatibility• Update best management
practicesRelease response planning• Fire/explosion threats• Rapid containment
Prevention: Can prevent chronic releases (slow leaks) caused by high corrosion rates and high permeation rates of incompatible materials. Updating BMPs can help prevent releases from inadequate equipment inspection and/or maintenance.
Response: Potential for catastrophic releases necessitate up to date emergency response procedures including rapid containment methods (e.g. prevent releases to surface water bodies).
18

19 Applying the ITRC Document After a Release
Site characterization, sampling, F&T modeling• Physical, chemical, and biological properties• Developing Site Conceptual Model (SCM)
Long-term responses• Determining remediation strategy• Assessing hazards and risks
Stakeholder concerns• Location of incident• Timing of response
Emerging biofuels• Multi-media evaluation process
Site Characterization, Sampling, F&T Modeling: Biofuel physical, chemical and biological properties differ from conventional fuels so they will behave differently in the environment. Examples of different considerations in Site Conceptual Model (SCM) include remobilization of pre-existing contamination and potential for methane production.
Long-Term Response: Remediation strategies will depend on physical, chemical and biological characteristics of biofuel released and site characteristics. Hazards and risks will be different from conventional fuel releases.
Stakeholder Concerns: As with any release, need to consider the sensitiveness of the location of the incident and the timing of the response. Remediators and regulators also need to be sensitive to the potential impact of any lingering or residual contamination on stakeholders.
Emerging Biofuels: Multi-media approach evaluates the potential HH and environmental impacts of a release of a given fuel or fuel additive and assesses how contaminants may interact with the flora, fauna, and natural resources within different environmental media. This approach can be used with emerging fuels not addressed in this document.
19
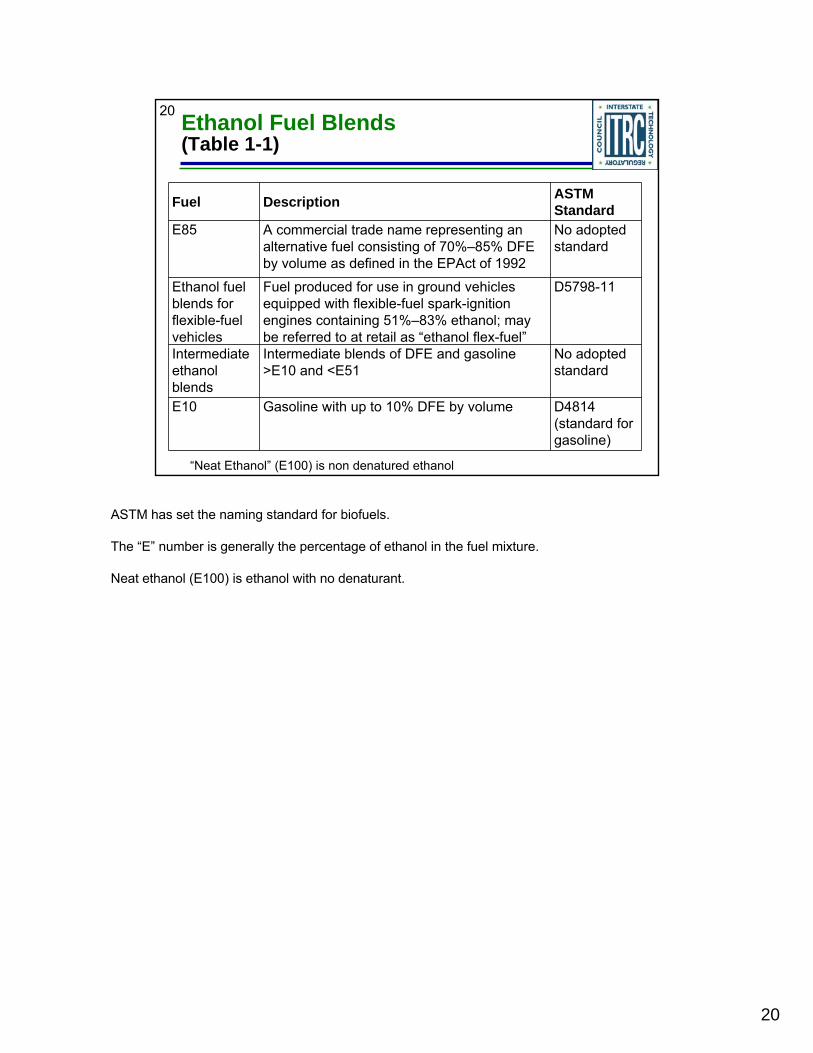
20 Ethanol Fuel Blends (Table 1-1)
Fuel Description ASTM Standard
E85 A commercial trade name representing an alternative fuel consisting of 70%–85% DFE by volume as defined in the EPAct of 1992
No adopted standard
Ethanol fuel blends for flexible-fuel vehicles
Fuel produced for use in ground vehicles equipped with flexible-fuel spark-ignition engines containing 51%–83% ethanol; may be referred to at retail as “ethanol flex-fuel”
D5798-11
Intermediate ethanol blends
Intermediate blends of DFE and gasoline >E10 and <E51
No adopted standard
E10 Gasoline with up to 10% DFE by volume D4814 (standard for gasoline)
“Neat Ethanol” (E100) is non denatured ethanol
ASTM has set the naming standard for biofuels.
The “E” number is generally the percentage of ethanol in the fuel mixture.
Neat ethanol (E100) is ethanol with no denaturant.
20

21 Biodiesel and Biodiesel Blends(Table 1-2)
Fuel Description ASTM Standard
B100 Biodiesel fuel blend stock; legally registered as a fuel and fuel additive with USEPA under Section 211(b) of the Clean Air Act
D6751-11
>B20 to <B100
A blend of petroleum-distillate and biodiesel fuel that contains between 21% to 99% biodiesel
No standard adopted
>B5 to B20 A blend of petroleum-distillate and biodiesel fuel that contains between 6% to 20% biodiesel D7467-10
Up to B5Fuel blends of up to 5% biodiesel fuel are considered a fungible component of conventional petroleum-based diesel fuel
D975 (same as petroleum standard)
“Neat Biodiesel” is biodiesel not blended with petroleum-based diesel and is designated as “B100”
ASTM has set the naming standard for biofuels.
The “B” number is the percentage of biodiesel in the fuel mixture.
Neat biodiesel (B100) is biodiesel with no petroleum denaturant.
Biodiesel is defined as mono-alkyl, but often referred to as methyl esters interchangeably
21

22 Biofuel Production Projections(Figures 1-1 and 1-2)
World Ethanol Production Projections
(millions of gallons)
World Biodiesel Production Projections
(millions of gallons)
35,000
25,000
15,000
2010
2012
2014
2016
2018
6,000
5,000
4,000
3,000
2010
2012
2014
2016
2018
Historic biofuel use in US• Ethanol: 277% increase in US consumption from 2004 to 2010 [3.5 billion gallons in 2004
to 13.2 billion gallons in 2010 (EIA 2010)].• Biodiesel: 722% increase in US consumption from 2004 to 2010 [27 million gallons in
2004 to 222 million gallons in 2010 (EIA 2010)].
Projected biofuel use worldwide• Ethanol ≈ 55% increase in worldwide consumption projected from 2010 to 2018 [22 billion
gallons in 2010 to 34 billion gallons by 2018 (FAPRI 2009)].• Biodiesel ≈ 31% increase in worldwide consumption project from 2010 to 2018 [4.2 billion
gallons in 2010 to 5.5 billion gallons by 2018 (FAPRI 2009)].
22
23 Opportunities to Use this Document in Your State
Connection to your state vapor intrusion regulations or guidance• Fate & transport modeling• Indoor air modeling
Equipment compatibility requirements• Storage tank programs• Bulk transport requirements
Facility response plans• Emergency response• Spill Prevention Control and Countermeasures
(SPCC) plans
The biofuels document can be used in concurrence with ITRC’s “Vapor Intrusion Pathway: A Practical Guide” and “Vapor Intrusion Pathway: Investigative Approaches for Typical Scenarios” both published in January 2007 and available at http://www.itrcweb.org/guidancedocument.asp?TID=49.
23
24
Training Roadmap
IntroductionReleasesFate and TransportQ&A Session #1Site InvestigationLong-Term Response StrategiesSummaryQ&A Session #2
No associated notes.
24

25
25 Biofuel Releases(Section 2)
Evaluated based on the differences between petroleum and biofuel
supply chains
Prevention
Release Scenarios and Frequencies
Release Causes
This section will cover
Emergency Response Planning
Section includes information collected on:Release Scenarios and Frequencies - based on an analysis of statistics from NTSB, DOT, petroleum industryRelease Causes and Prevention - based on incident root cause analyses and inspection best management practicesEmergency Response Planning - based on petroleum industry response plans, SPCC, fire fighting associations

26
26 Petroleum vs. Biofuel Supply Chains(Combined Figures 2-1 and 2-2)
ManufacturingFacility
Bulk Depot /Supply Terminal
DispensingStation
Transport Distribution
AST
Piping & Manifold
Loading Rack
AST
Piping & Manifold
Unloading / Loading Rack
Truck
Truck
Rail
Barge
Pipeline
UST System
Product Piping
Dispenser
UST
Refinery –OR–(Blended)(Bulk)
Com
pone
nts
This combined figure is meant to represent generalized supply chains for petroleum and biofuels.The current (2010 data) production moving through these chains per day:
0.93 million barrels fuel ethanol vs. 4.9 million barrels gasoline0.17 million barrels biodiesel vs. 4.1 million barrels diesel
The major differences from petroleum supply chain: type of manufacturing facility and modes of transport to bulk depot/supply terminal. Everything from the bulk depot/supply terminal and downstream are the same for both supply chains.
There are exceptions to these generalizations such as many petroleum refineries also contain loading racks to transport bulk petroleum via barges. Similarly, a pipeline was retrofitted with ethanol-compatible materials and opened in 2009 in Florida for DFE transport; other ethanol compatible pipelines are in various stages of consideration, construction, and/or operation in the United States, Brazil, and other countries.
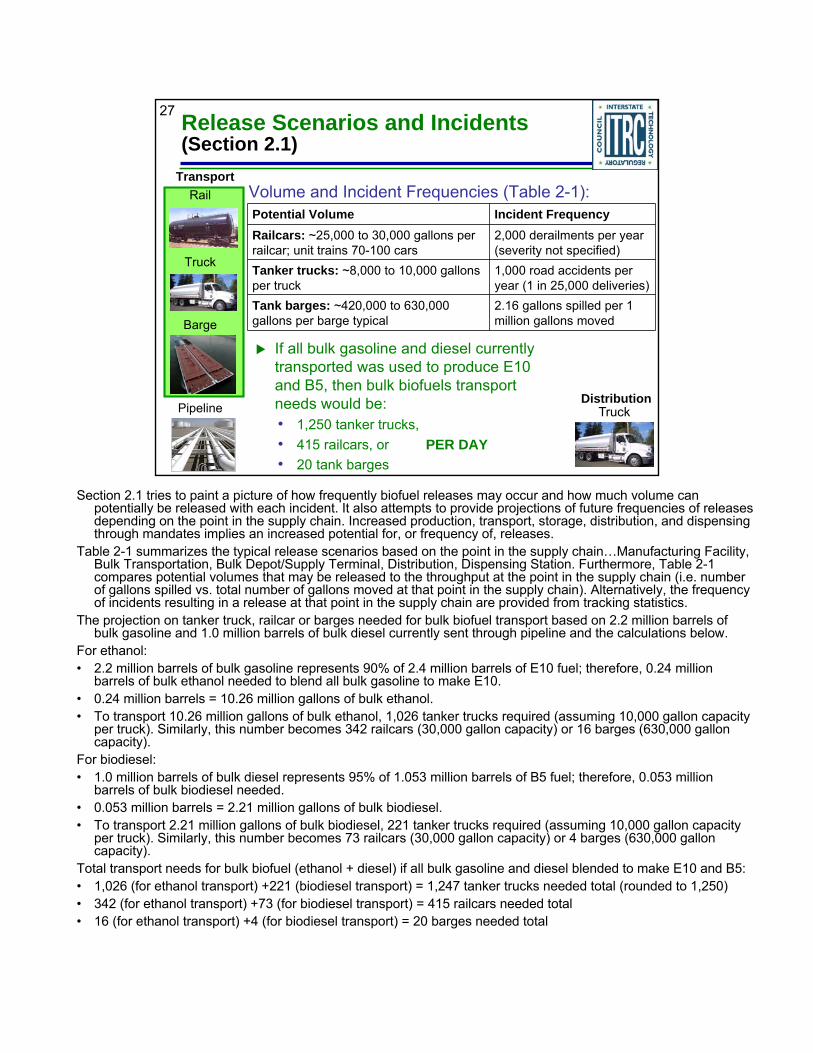
27 Release Scenarios and Incidents (Section 2.1)
If all bulk gasoline and diesel currently transported was used to produce E10 and B5, then bulk biofuels transport needs would be:• 1,250 tanker trucks,• 415 railcars, or PER DAY• 20 tank barges
Potential Volume Incident FrequencyRailcars: ~25,000 to 30,000 gallons per railcar; unit trains 70-100 cars
2,000 derailments per year (severity not specified)
Tanker trucks: ~8,000 to 10,000 gallons per truck
1,000 road accidents per year (1 in 25,000 deliveries)
Tank barges: ~420,000 to 630,000 gallons per barge typical
2.16 gallons spilled per 1 million gallons moved
Volume and Incident Frequencies (Table 2-1):
Truck
Transport
Distribution
Truck
Rail
Barge
Pipeline
Section 2.1 tries to paint a picture of how frequently biofuel releases may occur and how much volume can potentially be released with each incident. It also attempts to provide projections of future frequencies of releases depending on the point in the supply chain. Increased production, transport, storage, distribution, and dispensing through mandates implies an increased potential for, or frequency of, releases.
Table 2-1 summarizes the typical release scenarios based on the point in the supply chain…Manufacturing Facility, Bulk Transportation, Bulk Depot/Supply Terminal, Distribution, Dispensing Station. Furthermore, Table 2-1 compares potential volumes that may be released to the throughput at the point in the supply chain (i.e. number of gallons spilled vs. total number of gallons moved at that point in the supply chain). Alternatively, the frequency of incidents resulting in a release at that point in the supply chain are provided from tracking statistics.
The projection on tanker truck, railcar or barges needed for bulk biofuel transport based on 2.2 million barrels of bulk gasoline and 1.0 million barrels of bulk diesel currently sent through pipeline and the calculations below.
For ethanol:• 2.2 million barrels of bulk gasoline represents 90% of 2.4 million barrels of E10 fuel; therefore, 0.24 million
barrels of bulk ethanol needed to blend all bulk gasoline to make E10.• 0.24 million barrels = 10.26 million gallons of bulk ethanol. • To transport 10.26 million gallons of bulk ethanol, 1,026 tanker trucks required (assuming 10,000 gallon capacity
per truck). Similarly, this number becomes 342 railcars (30,000 gallon capacity) or 16 barges (630,000 gallon capacity).
For biodiesel:• 1.0 million barrels of bulk diesel represents 95% of 1.053 million barrels of B5 fuel; therefore, 0.053 million
barrels of bulk biodiesel needed. • 0.053 million barrels = 2.21 million gallons of bulk biodiesel. • To transport 2.21 million gallons of bulk biodiesel, 221 tanker trucks required (assuming 10,000 gallon capacity
per truck). Similarly, this number becomes 73 railcars (30,000 gallon capacity) or 4 barges (630,000 gallon capacity).
Total transport needs for bulk biofuel (ethanol + diesel) if all bulk gasoline and diesel blended to make E10 and B5:• 1,026 (for ethanol transport) +221 (biodiesel transport) = 1,247 tanker trucks needed total (rounded to 1,250)• 342 (for ethanol transport) +73 (for biodiesel transport) = 415 railcars needed total• 16 (for ethanol transport) +4 (for biodiesel transport) = 20 barges needed total
28 Release Causes (Section 2.2)
DispensingStation
UST System
Product Piping
Dispenser
UST
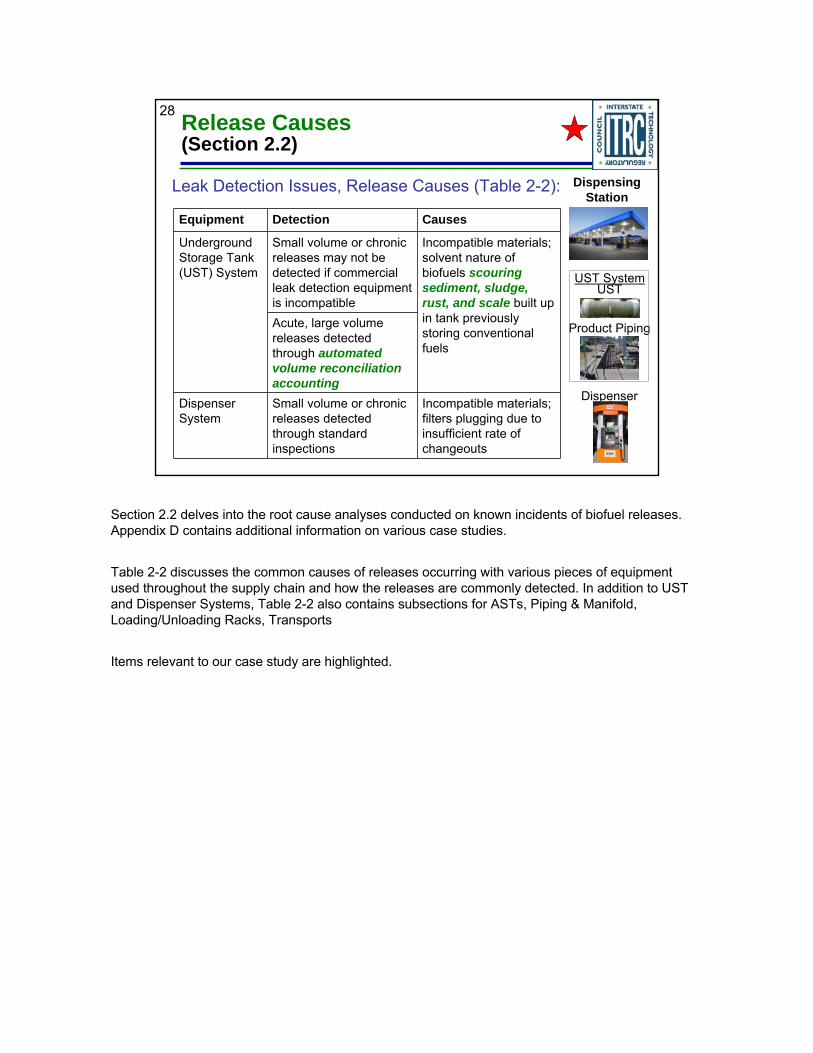
Leak Detection Issues, Release Causes (Table 2-2):
Equipment Detection Causes
Underground Storage Tank (UST) System
Small volume or chronic releases may not be detected if commercial leak detection equipment is incompatible
Incompatible materials; solvent nature of biofuels scouring sediment, sludge, rust, and scale built up in tank previously storing conventional fuels
Acute, large volume releases detected through automated volume reconciliation accounting
Dispenser System
Small volume or chronic releases detected through standard inspections
Incompatible materials; filters plugging due to insufficient rate of changeouts
Section 2.2 delves into the root cause analyses conducted on known incidents of biofuel releases. Appendix D contains additional information on various case studies.
Table 2-2 discusses the common causes of releases occurring with various pieces of equipment used throughout the supply chain and how the releases are commonly detected. In addition to UST and Dispenser Systems, Table 2-2 also contains subsections for ASTs, Piping & Manifold, Loading/Unloading Racks, Transports
Items relevant to our case study are highlighted.
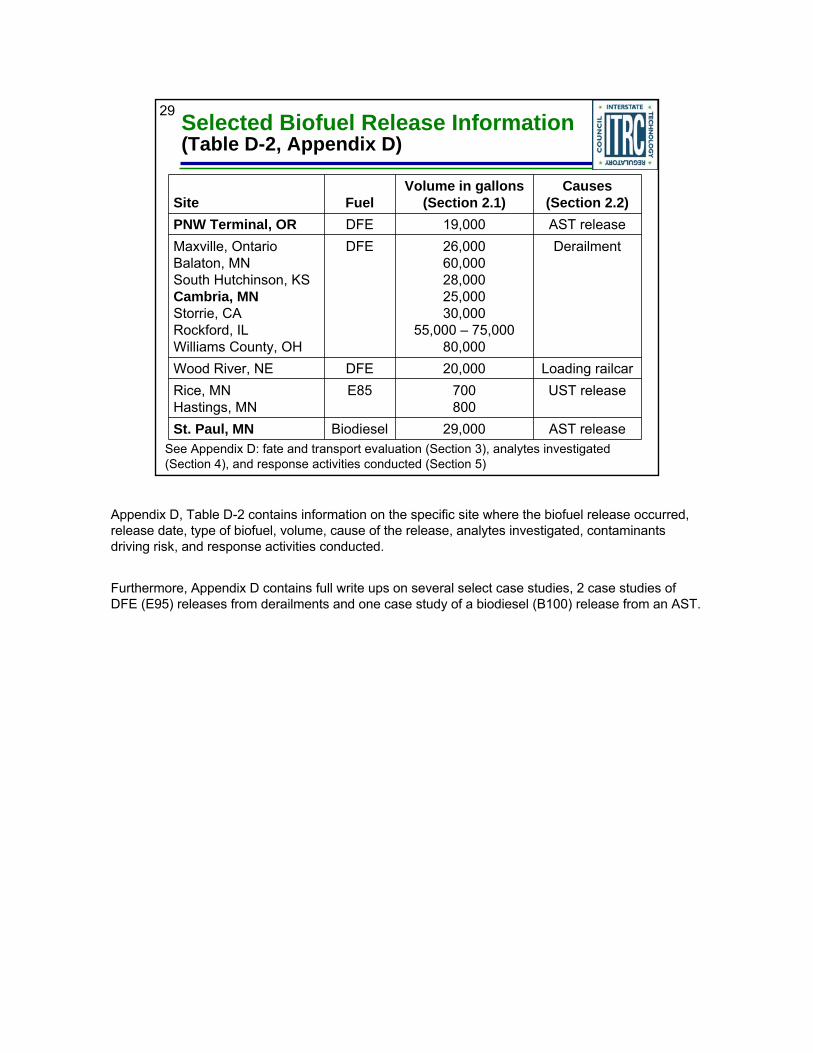
29 Selected Biofuel Release Information (Table D-2, Appendix D)
See Appendix D: fate and transport evaluation (Section 3), analytes investigated (Section 4), and response activities conducted (Section 5)
Site FuelVolume in gallons
(Section 2.1)Causes
(Section 2.2)PNW Terminal, OR DFE 19,000 AST releaseMaxville, OntarioBalaton, MNSouth Hutchinson, KSCambria, MNStorrie, CARockford, ILWilliams County, OH
DFE 26,00060,00028,00025,00030,000
55,000 – 75,00080,000
Derailment
Wood River, NE DFE 20,000 Loading railcarRice, MNHastings, MN
E85 700800
UST release
St. Paul, MN Biodiesel 29,000 AST release
Appendix D, Table D-2 contains information on the specific site where the biofuel release occurred, release date, type of biofuel, volume, cause of the release, analytes investigated, contaminants driving risk, and response activities conducted.
Furthermore, Appendix D contains full write ups on several select case studies, 2 case studies of DFE (E95) releases from derailments and one case study of a biodiesel (B100) release from an AST.

30
30 Release Prevention (Section 2.3)
Compatible materials and equipment • Plastics, polymers, and elastomers• Metal components and solders• Commercial leak detection equipment
Management practices• Changing out filters more frequently can
prevent clogging issues• Proper Operations & Maintenance and
frequency on leak detection equipment prevents undetected releases
Appendix B (checklist) provides guidance on compatibility of UST systems for biofuels
ITRC, Biofuels-1, Figure 2-7
ITRC, Biofuels-1, Figure 2-5
Several published guidance documents provide ethanol and biodiesel material compatibility information (listed in ITRC BIOFUELS-1)General examples of compatibility issues include the following:•zinc, brass, lead, and aluminum are sensitive to high-blend alcohol fuels•plated steel (referred to as "terne-plated," a lead-tin alloy) and lead-based solder are not compatible with E85. •natural rubber, cork, leather, polyurethane, polyvinyl chloride (PVC), polyamides, methyl-methacrylate plastics, and some types of thermo and thermoset plastics may degrade in high—blend alcohol fuels•B100 is not compatible with certain elastomers, metals, and plastics; generally biodiesel blends of 20% or lower have a much smaller effect on these materials (NREL 2009).Pictures are figures provided in the document. Figure 2-7. (l. to r.) Corroded ATG in an E85 UST, corrosion in an E85 STP sump likely caused by degradation products of ethanol vapors, and corrosion in E85 STP sump. Sources: South Carolina Department of Health and Environmental Control. Figure 2-5. Blocked filter caused by biodiesel. 30 micron diesel pump filter element covered in gel like material. Filter changeout frequency was increased to weekly. Source: BP.
General changes in management practices needed for biofuels include the following:•use of compatible materials and proper documentation of equipment•increased frequency of filter changeouts•increased frequency of inspections for corrosion•use of appropriate leak detection equipment
See also the example tank conversion checklist (Appendix B)
31
31 Emergency Response Planning (Section 2.4)
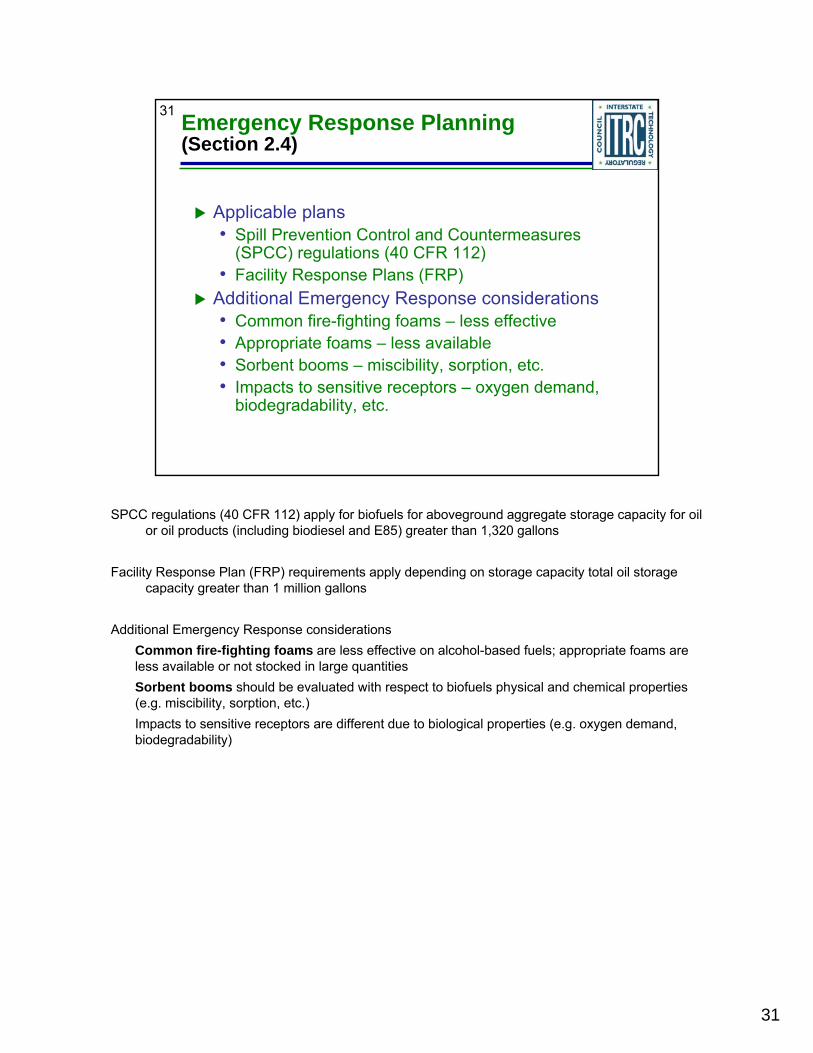
Applicable plans • Spill Prevention Control and Countermeasures
(SPCC) regulations (40 CFR 112) • Facility Response Plans (FRP)
Additional Emergency Response considerations• Common fire-fighting foams – less effective • Appropriate foams – less available• Sorbent booms – miscibility, sorption, etc.• Impacts to sensitive receptors – oxygen demand,
biodegradability, etc.
SPCC regulations (40 CFR 112) apply for biofuels for aboveground aggregate storage capacity for oil or oil products (including biodiesel and E85) greater than 1,320 gallons
Facility Response Plan (FRP) requirements apply depending on storage capacity total oil storage capacity greater than 1 million gallons
Additional Emergency Response considerationsCommon fire-fighting foams are less effective on alcohol-based fuels; appropriate foams are less available or not stocked in large quantitiesSorbent booms should be evaluated with respect to biofuels physical and chemical properties (e.g. miscibility, sorption, etc.)Impacts to sensitive receptors are different due to biological properties (e.g. oxygen demand, biodegradability)

32
Our Case Study: The Release
Release Cause (Section 2.2)E85 scoured the sludge, rust, sediment, & scale
Release Volume (Section 2.1)10,000 gallons E85 released from a UST that was switched from storing E10
Release Prevention (Section 2.3)Guidance on converting tanks to E85 NOT used
160,000 dispensing stations in the U.S. (2009)Average 120,000 gallons per month volume sales from one station (2009)Shifting product slate: information on current stations dispensing B20 and E85 updated at: http://www.afdc.energy.gov/afdc/fuels/stations_counts.html
We will build our case study during this presentation so that it contains the same information as the case studies provided in Appendix D.

33
33 Biofuel Releases Summary(Section 2)
Biofuel releases will occur somewhere along the supply chainCurrent case studies (Appendix D) indicate they occur more often in association with bulk transport or during storageFrequency is likely to increase as storage and handling increasesRoot causes are often materials compatibility and management practices associated with equipmentCan be addressed to prevent releases such as using the tank conversion checklist (Appendix B)Resources for emergency response preparedness are also available
No associated notes.

34
Training Roadmap
IntroductionReleasesFate and TransportQ&A Session #1Site InvestigationLong-Term Response StrategiesSummaryQ&A Session #2
No associated notes.
34
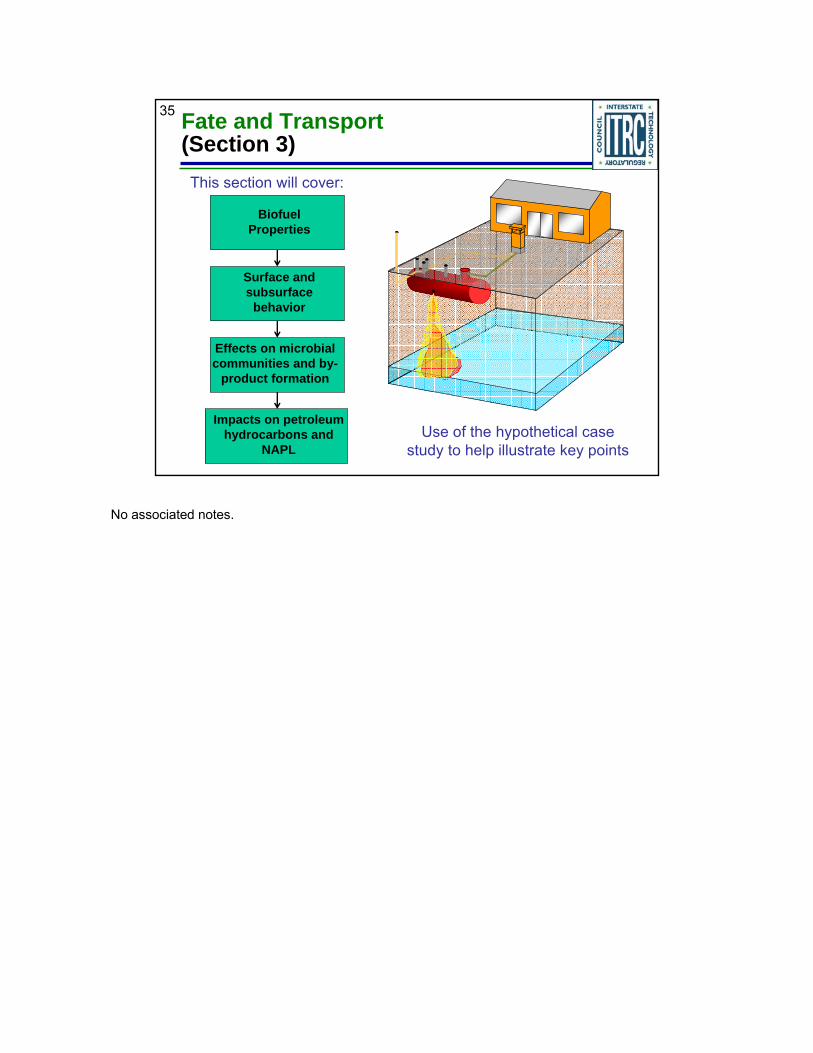
35 Fate and Transport(Section 3)
Effects on microbial communities and by-
product formation
BiofuelProperties
Surface and subsurface
behavior
Use of the hypothetical case study to help illustrate key points
This section will cover:
Impacts on petroleum hydrocarbons and
NAPL
No associated notes.
36
Solubility (mg/L)
Henry’s Law Constant (unitless)
Vapor Pressure (mm Hg)
Biodegradation Potential Implications
Ethanol Infinite 2.1E-4 to 2.6E-4
59 Aerobic: hours to days Anaerobic: days to weeks
Readily partitions to water and dilutes according to availability. Rapidly biodegradable
Benzene 1,800 0.22 75 Aerobic: days to months Anaerobic: years
Readily partitions to vapor phase from NAPL and from water
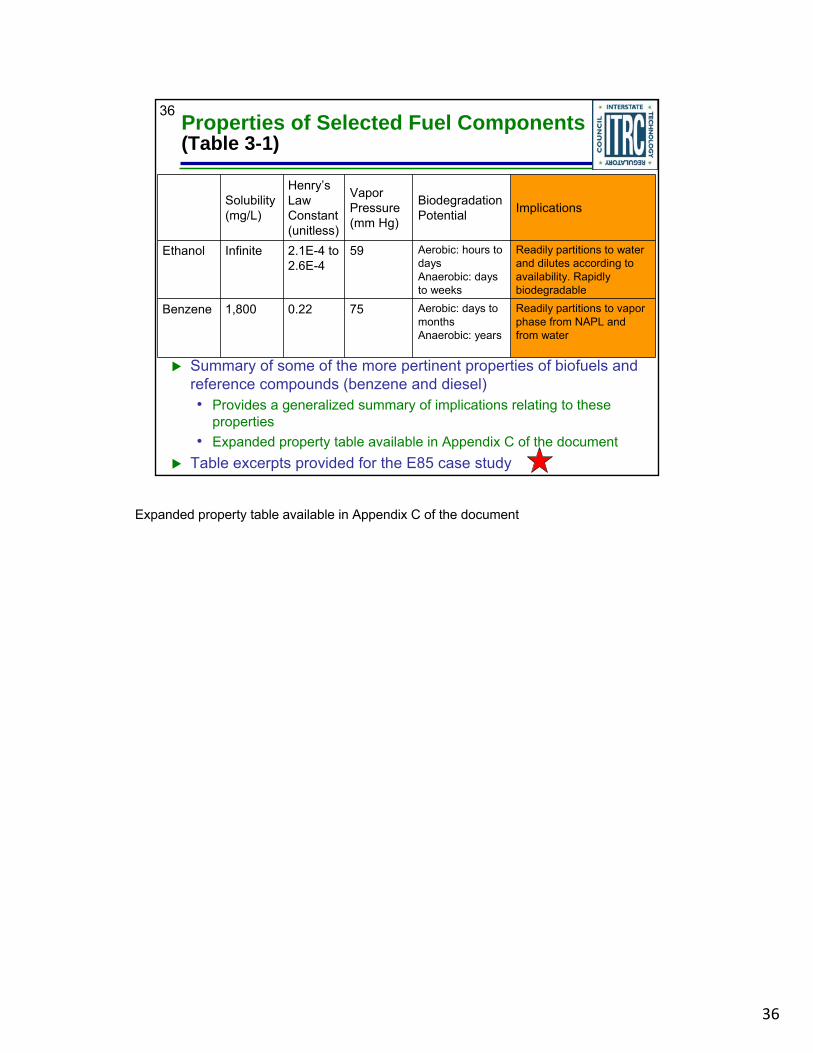
Properties of Selected Fuel Components (Table 3-1)
Summary of some of the more pertinent properties of biofuels and reference compounds (benzene and diesel)• Provides a generalized summary of implications relating to these
properties• Expanded property table available in Appendix C of the document
Table excerpts provided for the E85 case study
Expanded property table available in Appendix C of the document
36

37 Behavior in Surface Spills (Section 3.5.1 and 3.5.2)
Initial fate can be controlled by• Vaporization• Ignition and consumption by fire• Surface drainage • Surface water dilution
Immediate short-term impacts on surface water biota• Aquatic species toxicity (Section 1.6)
Ethanol and isobutanol: aquatic toxicity values range from 1,000 mg/L to > 14,000 mg/LBiodiesel: numerical values currently not available (area of research)
• Dissolved oxygen depletion Can result in detrimental impacts to aquatic life (i.e. fish kills)
No associated notes.
37
38
Groundwater flow direction
Dissolved phase plume
Aquifer
Unsaturated zone
Capillary fringe
Diss
olut
ion
NAPLbody
Volatilization
Primary source (short term)Trapped and sorbed residual
Groundwater source (longer term)
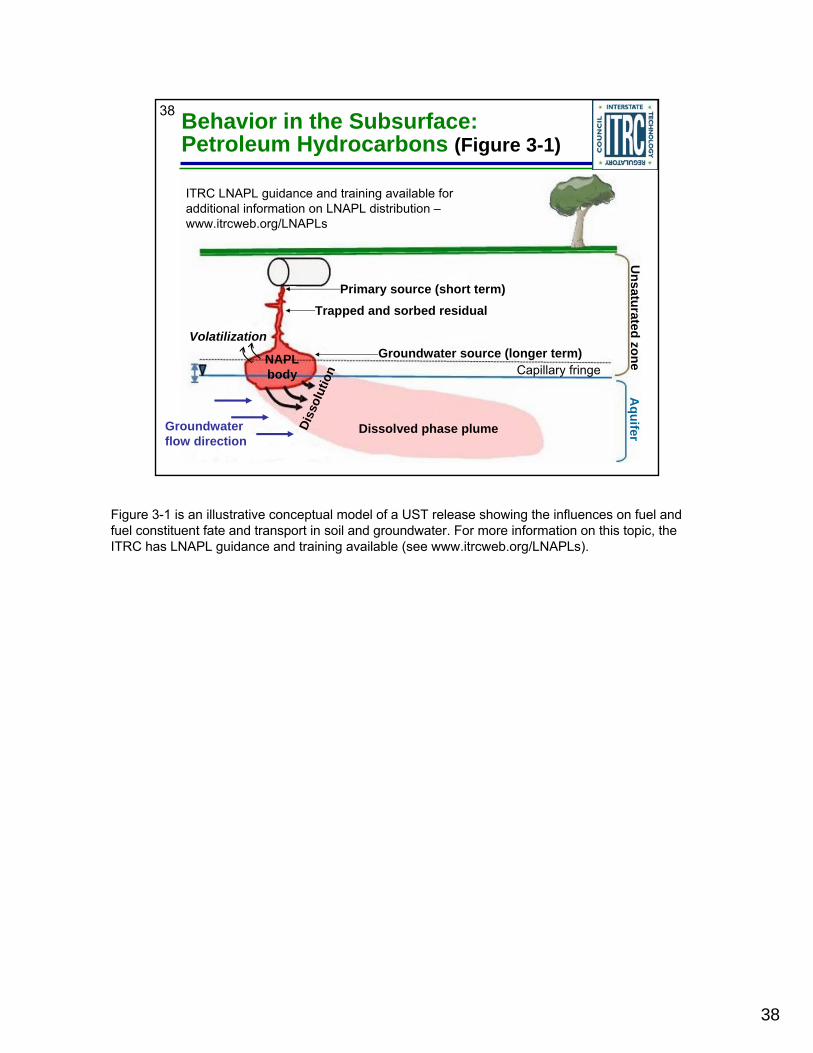
Behavior in the Subsurface: Petroleum Hydrocarbons (Figure 3-1)
ITRC LNAPL guidance and training available for additional information on LNAPL distribution –www.itrcweb.org/LNAPLs
Figure 3-1 is an illustrative conceptual model of a UST release showing the influences on fuel and fuel constituent fate and transport in soil and groundwater. For more information on this topic, the ITRC has LNAPL guidance and training available (see www.itrcweb.org/LNAPLs).
38
39
(collapsed) capillary fringe
capillary fringe
aquifer
Conventional gasoline (E0) E10 DFE
Dissolution to groundwater
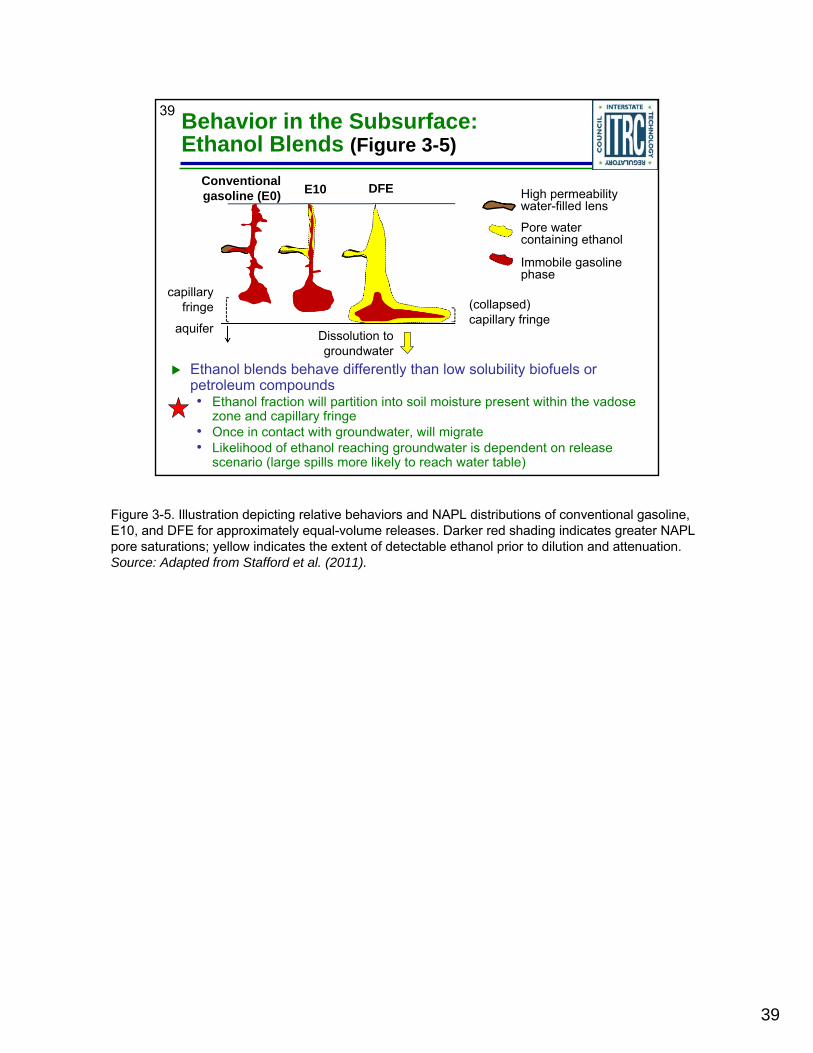
Behavior in the Subsurface: Ethanol Blends (Figure 3-5)
Ethanol blends behave differently than low solubility biofuels or petroleum compounds• Ethanol fraction will partition into soil moisture present within the vadose
zone and capillary fringe• Once in contact with groundwater, will migrate• Likelihood of ethanol reaching groundwater is dependent on release
scenario (large spills more likely to reach water table)
High permeability water-filled lens
Pore water containing ethanol
Immobile gasoline phase
Figure 3-5. Illustration depicting relative behaviors and NAPL distributions of conventional gasoline, E10, and DFE for approximately equal-volume releases. Darker red shading indicates greater NAPL pore saturations; yellow indicates the extent of detectable ethanol prior to dilution and attenuation. Source: Adapted from Stafford et al. (2011).
39

40Potential Media Impacts by Equipment Type (Table 3-2)
Table objective: provide information regarding potential releasepoints, release volumes and media that can be affected by releaseExample for E85 case study (UST release)
Equipment Type Potential Media ImpactsUnderground storage
tank systems (Section 2.2.5)
• Dispensing stations• May be present at
manufacturing facilities and bulk depots/supply terminals
• Surrounding backfill and soil in the UST “pit”• Groundwater impacts depend on the proximity of the
water table to the UST as well as a sufficient driving force to cause the biofuel to percolate to depth
• If groundwater is impacted, cosolvency issues may be present if historic petroleum releases have occurred at the same location
Example of information presented in Table 3-2 in the document. In this example, the longer version of potential media impacts as provided in Table 3-2 are as follows: Media immediately impacted from a UST release is the surrounding backfill in the UST “pit.” Depending on the size or duration of the biofuel release, the soil around the UST pit is generally likely to be impacted as well. Groundwater impacts depend on the proximity of the water table to the UST as well as a sufficient driving force to cause the biofuel to percolate to depth. Soil is likely to be impacted by a release from underground product piping. Only under rare circumstances where groundwater is very shallow do impacts from product piping occur. Regardless of the location of the release, should groundwater be impacted by biofuel, cosolvency issues may be present if historic petroleum releases have occurred at the same location.
40

41 Biochemical Oxygen Demand (Section 3.3.2.2)
Release of biofuel into an aqueous environment will result in rapid consumption of dissolved oxygen (DO)
In groundwater, rapid biodegradation will induce anaerobic conditions Dead paddlefish resulting from a
release of Wild Turkey Bourbon
Release of biofuel into an aqueous environment will result in rapid consumption of oxygen; this is particularly detrimental in surface water. The Impact on dissolved oxygen (DO) in surface water is strongly dependent on receiving water. This can be particularly detrimental in surface waters where low oxygen levels can adversely affect biological communities.
In groundwater, rapid biodegradation will induce anaerobic conditions. Once oxygen is depleted, alternate electron acceptors such as nitrate, ferric iron, sulfate and carbon dioxide will be utilized by anaerobic organisms during the breakdown of the biofuel.
42
Figure 3-2. Major routes of the anaerobic fermentation of ethanol
Methane
Methane
Acetyl CoA Butyryl CoA
AcetoacetylCoA
EthanolCO2
H2 Butyrate
Butanol
Acetate
Acetone
CO2
CO2
Biofuel Biodegradation(Figure 3-2)
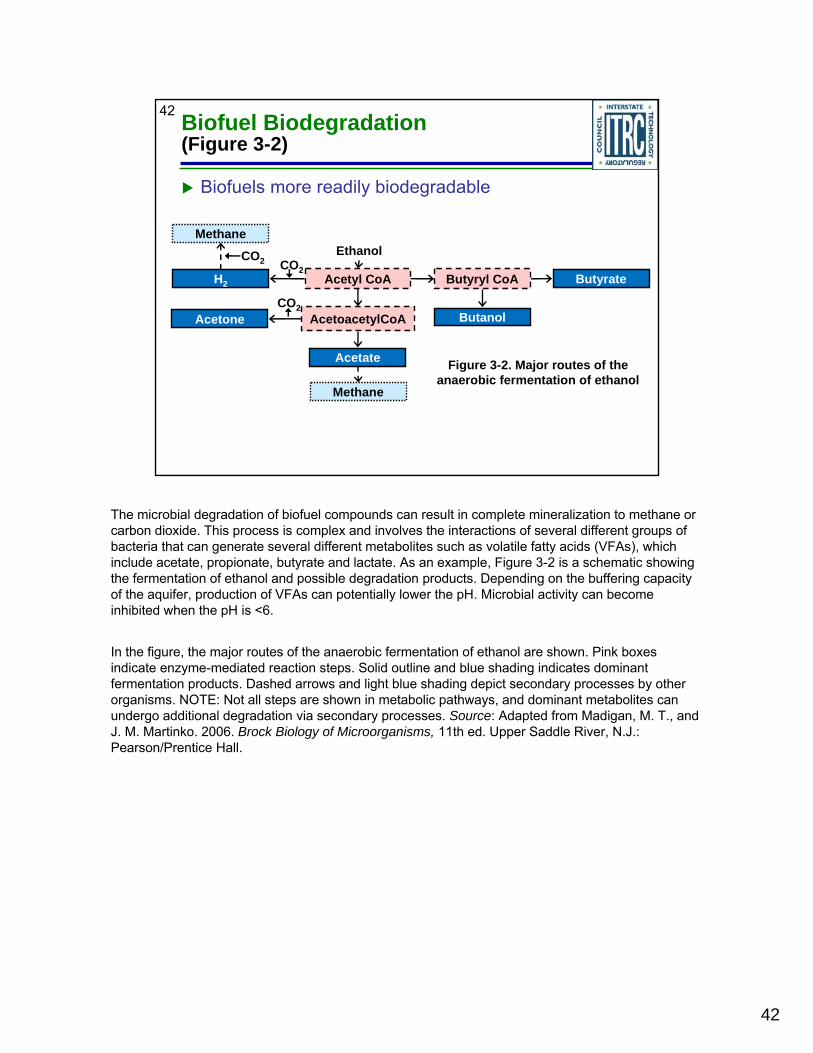
Biofuels more readily biodegradable
The microbial degradation of biofuel compounds can result in complete mineralization to methane or carbon dioxide. This process is complex and involves the interactions of several different groups of bacteria that can generate several different metabolites such as volatile fatty acids (VFAs), which include acetate, propionate, butyrate and lactate. As an example, Figure 3-2 is a schematic showing the fermentation of ethanol and possible degradation products. Depending on the buffering capacity of the aquifer, production of VFAs can potentially lower the pH. Microbial activity can become inhibited when the pH is <6.
In the figure, the major routes of the anaerobic fermentation of ethanol are shown. Pink boxes indicate enzyme-mediated reaction steps. Solid outline and blue shading indicates dominant fermentation products. Dashed arrows and light blue shading depict secondary processes by other organisms. NOTE: Not all steps are shown in metabolic pathways, and dominant metabolites can undergo additional degradation via secondary processes. Source: Adapted from Madigan, M. T., and J. M. Martinko. 2006. Brock Biology of Microorganisms, 11th ed. Upper Saddle River, N.J.: Pearson/Prentice Hall.
42
43
Factors Affecting Biodegradation
Inhibition of biological degradation at high concentrations (6% - 10% ethanol)Rate affected by• Available electron acceptors • Nutrients• pH (optimal = 6-8)
Production of volatile fatty acids during metabolism can lower pH
Once biofuel concentrations are diluted to below inhibitory levels, they are metabolized, although factors such as nutrient limitation, available electron acceptors, and thermodynamic inhibition resulting from the buildup of some metabolites can affect the efficiency and subsequent biological decay rate of biofuels. These effects cause delays in methane generation to significant levels.
Depending on the buffering capacity of the aquifer, production of volatile fatty acids can potentially lower the pH. Microbial activity can become inhibited when the pH is <6.

44 Methane Hazards(Figure 3-4)
Methane is aflammable gas• Lower explosive limit (LEL)
= 5% in atmosphere• Upper explosive limit (UEL)
= 15% in atmosphereLEL equivalent concentration in groundwater • 1 - 2 mg/L• Dependent on temperature
Methane
Capable of forming explosive mixtures
with air
Not capable of forming explosive mixtures with air
Explosive
Mixtures which cannot be produced from methane
and air
Oxy
gen
0
4%
8%
12%
16%
20%
4% 8% 12% 16% 20%
Relationship Between Quantitative Composition and Explosivity of Mixtures of Methane and Air
0
Figure source: 30 CFR 57.22003
Methane LEL equivalent concentration in groundwater (based on Henry’s Law) is between 1 and 2 mg/L (dependent on temperature). The methane solubility limit is approximately 25 mg/L (also temperature dependent).
The OSHA action level for methane in the atmosphere is 0.5%, or 50,000 ppm (10% of the LEL) .
The lower explosive limit (LEL) for gasoline is 1.4% and the upper explosive limit (UEL) is 7.6%.
44

45 Generation of Methane(Figure 3-3)
Methanogens utilize acetate and hydrogen• Partitioning between
dissolved and gaseous methane concentrations
• Dissolved methane concentration dependent on groundwater temps
Delays (months to years) in methane production have been observed in both lab and field studiesMethane soil gas may undergo attenuation in the vadose zone
Dissolved Methane (mg/L)
Estim
ated
Soi
l Gas
Met
hane
(%)
Temperature (70oF)Temperature (45oF)
0 10 20 30
100
80
60
40
20
0
The same factors affecting biofuel degradation (nutrient limitation, available electron acceptors, and thermodynamic inhibition resulting from the buildup of some metabolites) can also delay the onset of significant methane production. The Cambria Case Study (Appendix D) describes delayed methane production at a large release site in Minnesota. Methane will also be generated at sites with conventional fuel spills (including E10), but the rate and extent of methane production is typically much lower than that of biofuel sites.
A recent laboratory study was released evaluating the role of methanotrophs (aerobic organisms that consume methane) in the attenuation of methane soil gas in the vadose zone. The study indicated that even though dissolved methane concentrations in groundwater reached saturation levels (20 to 23 mg/L), methane in soil gas did not reach an explosive level at the ground surface as significant attenuation (up to 99%) occurred within the vadose zone. It should be noted that this observation may not hold true at all sites, as the level of attenuation is affected by several parameters such as the thickness of the vadose zone, the presence of oxygen in the vadose zone, etc. For example, methane was found at the ground surface at concentrations exceeding 1.5% (and within the vadose zone at 8%) at the Cambria Site which has a shallow depth to groundwater, and likely contains an anoxic vadose zone as portions of the site are submerged during the year. Nevertheless, the ability of methane to attenuate within the vadose zone is something that should be considered when designing and sampling for soil gas at ethanol sites.
For more information on the laboratory study referenced above, please refer to: Ma, J. ,Rixey, W., DeVaull, G., Stafford, B., Alvarez, P. "Methane Bioattenuation and Implications for Explosion Risk Reduction along the Groundwater to Soil Surface Pathway above a Plume of Dissolved Ethanol" Environ. Sci. Technol., 2012, 46 (11), pp 6013–6019
45

46Preferential Biodegradation of BiofuelsOver COCs (Section 3.4.3 and 3.4.4)
Readily degradable nature of biofuels can result in preferential biodegradation of biofuels over COCsPlume elongation expected to be temporaryElongated plumes may have shorter lifetimes because of lower concentrations of petroleum hydrocarbons and buildup up biomassRedox changes in the subsurface may lead to changes in the mobilization of metals
Plume elongation may be predicted by modeling studies, however, other research has indicated that no plume elongation, or shortening of plume occurs because of increased biomass stimulated by biofuel presence. Any plume elongation is expected to be temporary and elongated plumes may have shorted lifetimes because of lower concentrations of petroleum hydrocarbons (from denaturant) than a petroleum hydrocarbon release.
Mobilization of Metals (Section 3.4.4.) A shift from oxidizing to reducing conditions can occur in a plume when a spill of either conventional fuel or biofuel reaches the groundwater. The rate at which the redox shift occurs, however, may be more rapid for a biofuel spill because biofuels contain more readily degradable constituents. The shift towards more reducing conditions can result in the localized mobilization of naturally occurring redox sensitive metals such as iron, manganese, and arsenic near the release location where conditions remain anaerobic (see Brown, R.A., K.E. Patterson, M.D. Zimmerman, and G.T. Ririe. 2010. Attenuation of Natural Occurring Arsenic at Petroleum Hydrocarbon-Impacted Sites. Proceedings: Seventh International Conference onRemediation of Chlorinated and Recalcitrant Compounds, Monterey, CA 2010.)
46

47 Enhanced Solubility of Petroleum(Section 3.4.1)
Some biofuels can act as cosolvent• High concentrations (> 20% ethanol)• May occur within capillary fringe• Unlikely to occur in groundwater
Releases of highly soluble biofuels (e.g. ethanol) onto prior hydrocarbon releases• May result in mobilization of pre-existing residual
separate phase hydrocarbons• Section 3.4.2
Some biofuels can act as a cosolvent when present in water at high enough concentrationsAqueous concentrations must be greater than 20% (ethanol) to enhance solubility limits of petroleum hydrocarbonsMay occur within capillary fringeIn groundwater, biofuels concentrations unlikely to occur at levels greater than a few percent –making cosolvency unlikely in groundwater
Releases of highly soluble biofuels (e.g. ethanol) onto prior hydrocarbon releases may result in mobilization of pre-existing residual separate phase hydrocarbons (Section 3.4.2)

48
Our Case Study: Fate & Transport
Media impacts to vadose zone, capillary fringe and groundwater• Capillary fringe can
act as a lingering source area for ethanol
Groundwater will become anaerobic, possibly leading to methane generation
CH4
No associated notes.
48

49
Fate and Transport Summary
Property differences between biofuels and petroleum fuels influence fate and transport in the environment
Highly soluble biofuels readily partition into waterBiodegradable nature of biofuels significantly impacts dissolved oxygen concentrationsEthanol can be retained in the capillary fringe (lingering source)Cosolvency effects likely limited to capillary fringe and large E95 releasesPotential for significant methane generationTemporary plume elongation
• Highly soluble biofuels will partition into water encountered along migration pathway (e.g., soil moisture)
• Biodegradable nature of biofuels will significantly impact dissolved oxygen concentrations in surface water
• Ethanol can be retained above water table (capillary fringe) limiting mass transfer to saturated zone (lingering source)
• Enhanced solubility of hydrocarbons from cosolvency effects of biofuels are likely limited to capillary fringe, and large E95 releases
• In groundwater, significant methane can be generated, with potential for transport into the vadose zone
• Plume elongation resulting from biofuels expected to be temporary
50
Training Roadmap
IntroductionReleasesFate and TransportQ&A Session #1Site InvestigationLong-Term Response StrategiesSummaryQ&A Session #2
No associated notes.
50
51
Training Roadmap
IntroductionReleasesFate and TransportQ&A Session #1Site InvestigationLong-Term Response StrategiesSummaryQ&A Session #2
No associated notes.
51

52 Site Investigation(Section 4)
Analytical Methods
RiskDrivers
Monitoring
Use of the hypothetical case study to help illustrate key points
This section will cover:
Site Closure Considerations
CH4
Site investigation considerations – what’s different from a typical petroleum release
Emphasis on new potential risk drivers
52

53
Risk Drivers for Site Investigation
Surface water• Ethanol can not be recovered due to solubility; biodiesel can be
recovered like petroleum• Dissolved oxygen depletion – risk to aquatic species a significant
new concern
Vadose zone• Explosive risk from increased methane production – NO ODOR• Potential increased vapor intrusion (VI) risk for petroleum VOCs
Groundwater• Risk to drinking water supplies due to plume elongation• Biofuel degradation can produce taste and odor issues in
drinking water supplies
No associated notes.
53

54 July 2008 – Lanesboro, MN3,000 gals E95
No associated notes.
54

55 Our Case Study: Site Investigation (Section 4)
Site investigation strategy:• Dependent on age, volume,
composition of release• Potential risk receptors
Case study:• Recent E85 spill
• Dispensing station building and surrounding residential area
CH4
The receptors are the same as a typical petroleum release, but the risks are not.
55
56
Site Investigation – What’s Different
Different chemical and physical properties of biofuels require changes to investigation design• Monitoring well screen length and type• Additional analytical parameters
Additional vapor risk assessment for VOCs and methane (if receptors are present)
Time factor• Longer monitoring duration needed to assess risk
Based on what was discussed in Section 3, the different chemical and physical properties of biofuels require a different approach to Site Investigation.
Typical UST investigation: 3-5 water table monitoring wells, 10’ long screens. Shorter-screened wells are recommended for biofuel investigations.
VI investigation typically one time snapshot. However, this will not work for biofuels because of the potential for delayed methane generation.
The time factor is important, may not be able to close out sites as quickly or with limited investigation.
56
57
Methane Monitoring (Section 4.1.1)
Biofuels have the potential to generate significantly more methane than petroleum
Initial evaluation should determine if explosive conditions exist
Methane appearance may not be immediate, suggesting extended monitoring when receptors are present• Low or no initial methane may not mean no future risk• May appear without detection of source biofuel
Subsurface methane may be sampled in:• Soil gas using push probes or vapor points• Groundwater using push probes or wells for dissolved
methane
Biofuels, such as ethanol, butanol, and biodiesel are more readily degradable via microbial processes when compared to petroleum hydrocarbons at equivalent aqueous concentrations. As discussed in the previous section, methane generation can be delayed and can also continue for years after the apparent disappearance of the source biofuel in groundwater. Long-term monitoring may be required to assess potential methane generation and persistence.
The potential for methane generation presents a significant concern. Methane has no odor. OSHA action level of 10% LEL is 0.5%, or 50,000 ppm.
Case study sites, such as the Balaton DFE release (Appendix D, Table D-2), have shown 2.7% methane in surface gas samplers with over 12’ of vadose zone. Cambria case study (Appendix D) shows that the methane flux is about the same as a municipal solid waste landfill.
Methane usually degrades in a very short distance once oxygen is encountered in the subsurface, but the flux at biofuel sites is too great and overwhelms the system.
Soil gas sampling methods for methane same as vapor intrusion methods.
57

58
Methane Monitoring (Section 4.1.1)
Groundwater • Generally more reliable than soil gas for detection• Well screen lengths may affect concentrations• Must closely follow QA/QC sampling procedures
• Methane is easily lost during sampling• Levels above 25 mg/L indicate saturated levels where
ebullition (bubbling) may be occurring
Soil gas• Sampling points and procedures same as VOCs (ITRC
2007, Vapor Intrusion Pathway: A Practical Guideline)• If potential receptors are present at least one vapor
monitoring point should be placed in the release area
Soil gas has variables related to weather that can impact results, so groundwater is a more stable and reliable indictor. If methane is present in groundwater, it will also be present in soil gas.
Longer screens may result in lower concentrations from the effects of dilution. Shorter-screen lengths sampling at the water table interface is most important because methane is produced at the water table interface.
Methane can be easily lost from the water sample, therefore, close adherence to proper sampling methods is needed.
Ebullition can also transport the VOCs further away from the source zone than in a typical petroleum release.
58

59 November 2006 - Cambria, MN25,000 gals DFE (E95)
No associated notes.
60Delayed Methane Generation: Cambria, MN Case Study July 2007 (Appendix D)
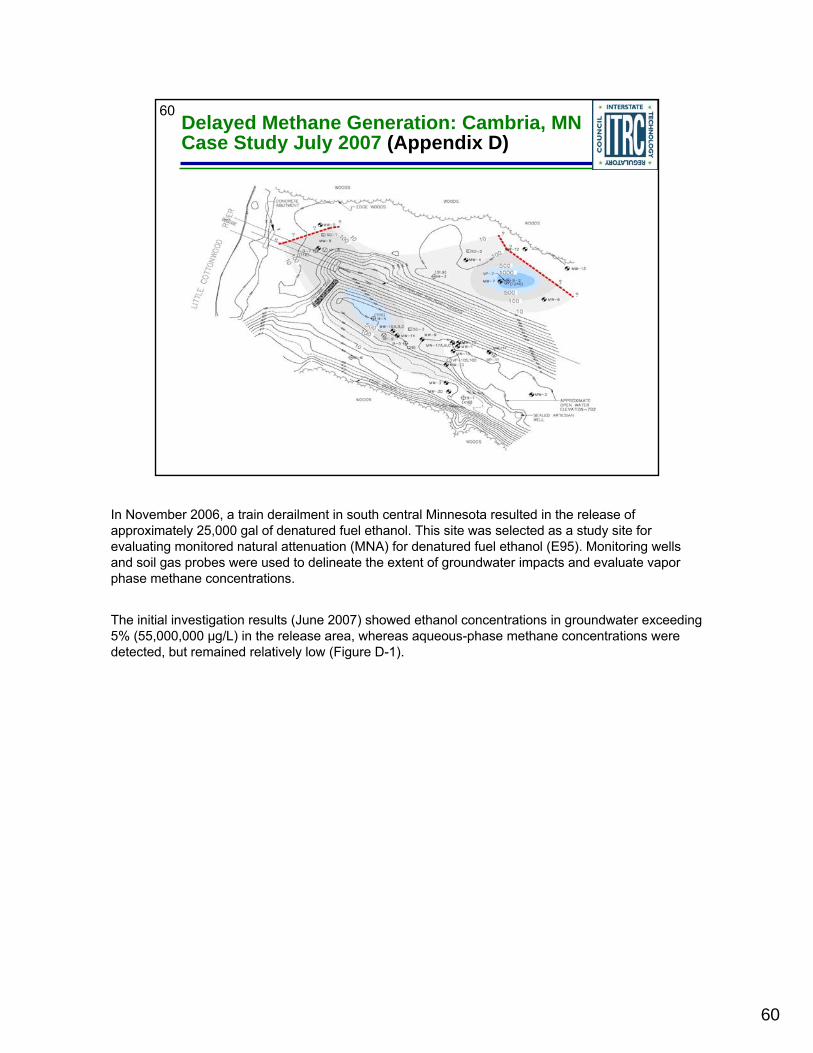
In November 2006, a train derailment in south central Minnesota resulted in the release of approximately 25,000 gal of denatured fuel ethanol. This site was selected as a study site for evaluating monitored natural attenuation (MNA) for denatured fuel ethanol (E95). Monitoring wells and soil gas probes were used to delineate the extent of groundwater impacts and evaluate vapor phase methane concentrations.
The initial investigation results (June 2007) showed ethanol concentrations in groundwater exceeding 5% (55,000,000 μg/L) in the release area, whereas aqueous-phase methane concentrations were detected, but remained relatively low (Figure D-1).
60
61Delayed Methane Generation: Cambria, MN Case Study December 2007 (Appendix D)
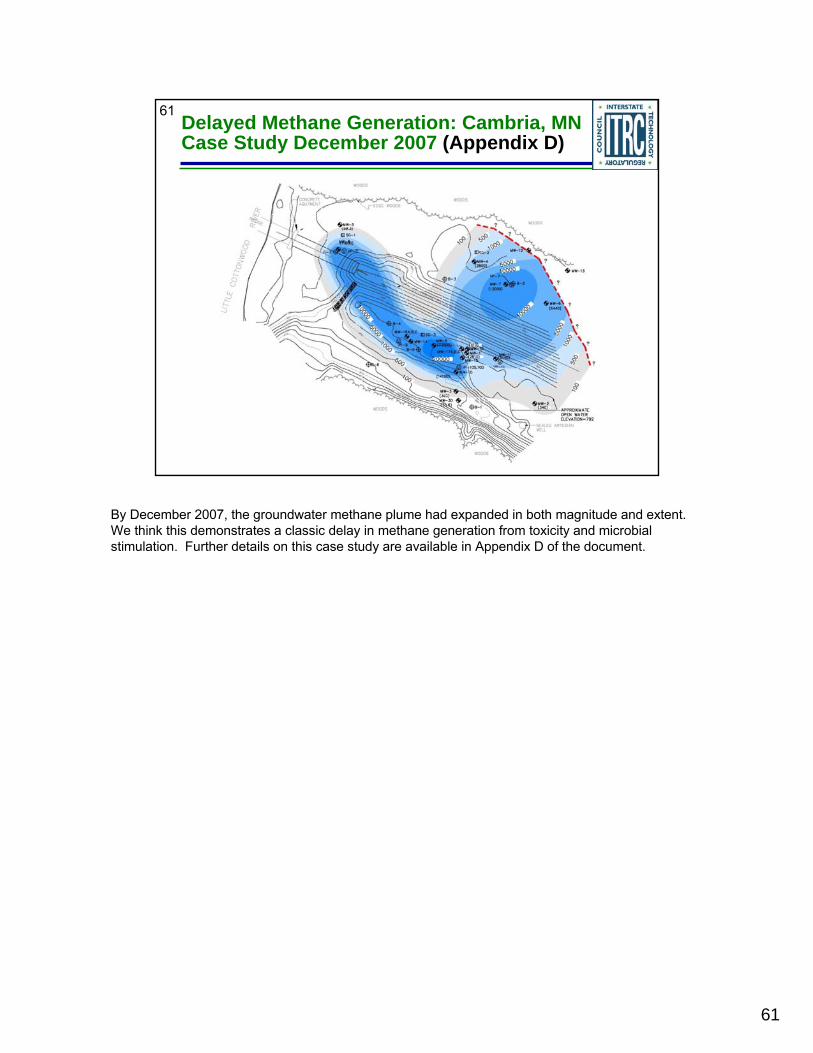
By December 2007, the groundwater methane plume had expanded in both magnitude and extent. We think this demonstrates a classic delay in methane generation from toxicity and microbial stimulation. Further details on this case study are available in Appendix D of the document.
61
62
Ethanol Monitoring (Section 4.1.2)
Vadose zone• Soil gas monitoring same as VOCs• Soils can be sampled using standard VOC methodology
Capillary fringe• Lysimeters have been used, but sampling capillary fringe not
necessary
Groundwater• Shorter monitoring well screens recommended to capture ethanol
draining, and/or leaching from the capillary fringe • Multi-level wells may be needed• Detection of ethanol in groundwater should not be used alone for
methane risk assessment
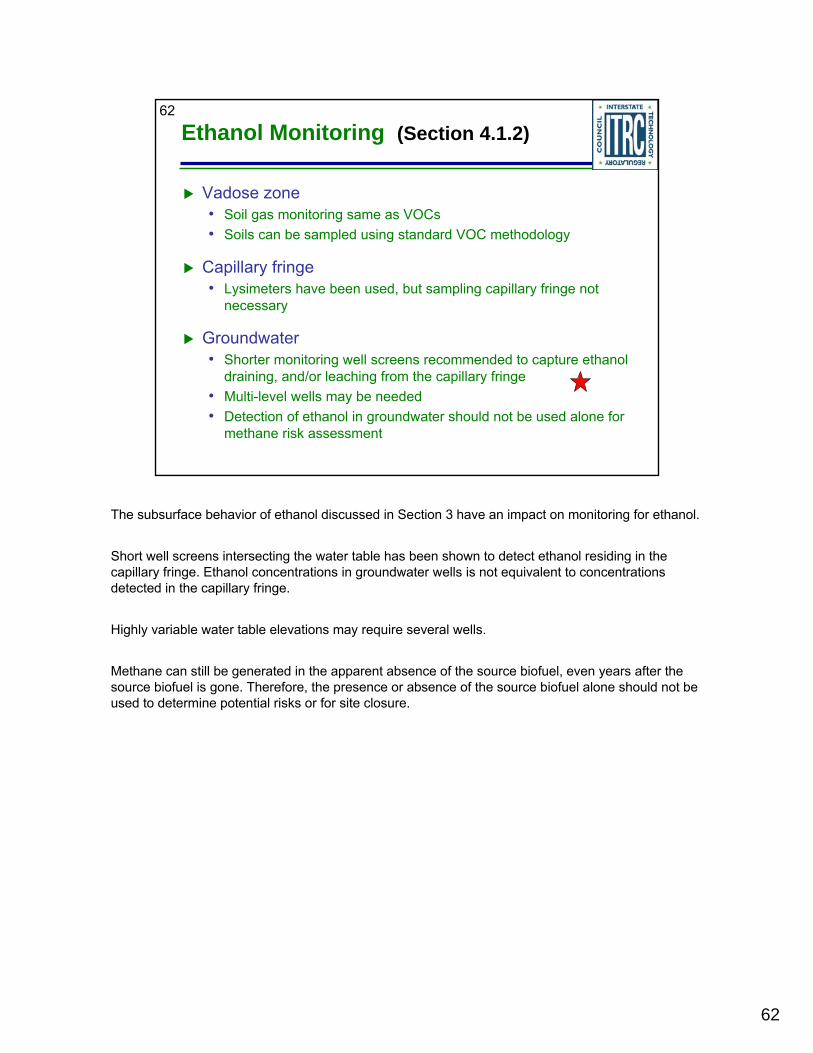
The subsurface behavior of ethanol discussed in Section 3 have an impact on monitoring for ethanol.
Short well screens intersecting the water table has been shown to detect ethanol residing in the capillary fringe. Ethanol concentrations in groundwater wells is not equivalent to concentrations detected in the capillary fringe.
Highly variable water table elevations may require several wells.
Methane can still be generated in the apparent absence of the source biofuel, even years after the source biofuel is gone. Therefore, the presence or absence of the source biofuel alone should not be used to determine potential risks or for site closure.
62

63
Cambria, MN Case Study
Groundwater
Capillary fringe
Ethanol
Aq. Ethanol
MW-1 (10’ screen) ND
MW-20 (5’ screen) 5,300,000 ug/L
Soil Sample6,340,000 ug/kg
Note: Not in ITRC document
Geology also plays a factor, MW-1 taps a more transmissive zone at depth
MW-1 Screen 3’-13’MW-20 screen 2’-7’
63
64
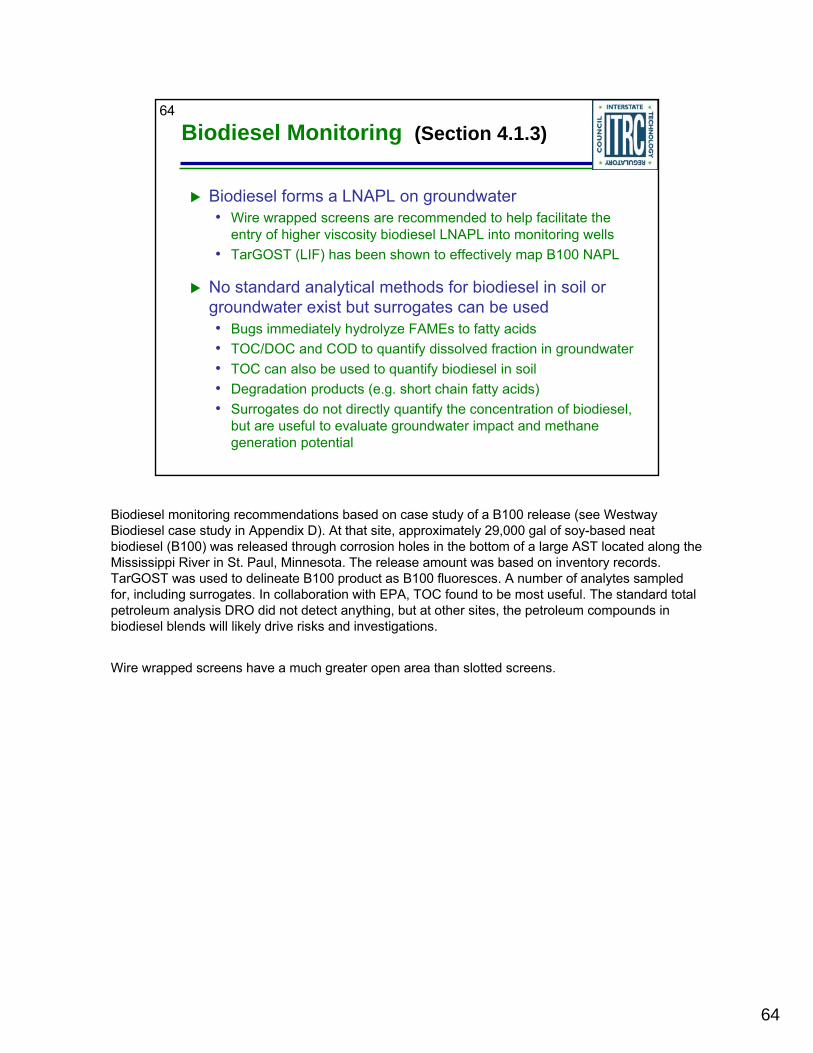
Biodiesel Monitoring (Section 4.1.3)
Biodiesel forms a LNAPL on groundwater• Wire wrapped screens are recommended to help facilitate the
entry of higher viscosity biodiesel LNAPL into monitoring wells• TarGOST (LIF) has been shown to effectively map B100 NAPL
No standard analytical methods for biodiesel in soil or groundwater exist but surrogates can be used• Bugs immediately hydrolyze FAMEs to fatty acids• TOC/DOC and COD to quantify dissolved fraction in groundwater• TOC can also be used to quantify biodiesel in soil• Degradation products (e.g. short chain fatty acids) • Surrogates do not directly quantify the concentration of biodiesel,
but are useful to evaluate groundwater impact and methane generation potential
Biodiesel monitoring recommendations based on case study of a B100 release (see Westway Biodiesel case study in Appendix D). At that site, approximately 29,000 gal of soy-based neat biodiesel (B100) was released through corrosion holes in the bottom of a large AST located along the Mississippi River in St. Paul, Minnesota. The release amount was based on inventory records. TarGOST was used to delineate B100 product as B100 fluoresces. A number of analytes sampled for, including surrogates. In collaboration with EPA, TOC found to be most useful. The standard total petroleum analysis DRO did not detect anything, but at other sites, the petroleum compounds in biodiesel blends will likely drive risks and investigations.
Wire wrapped screens have a much greater open area than slotted screens.
64

65
Biodiesel Monitoring (Section 4.1.3)
Biodiesel (B100) produces a lot of methane (and CO2)
Like ethanol ebullition (bubbling) may increase methane risks, and VI risks for blended fuels
1.4L FAME → 662 L methane
Biodiesel also has a taste/odor/appearance impact on water quality
Petroleum fraction of blends may be the risk driver for biodiesel blends; however methane may still be an issue for higher percentage blends
At the Westway site, high levels of DOC, TOC and CBOD indicated a high concentration of organic matter in groundwater attributed to the B100 release. This high level of organic loading resulted in an anoxic and methane-generating groundwater plume. Soil gas in monitoring wells comprised of 67% methane, 33% CO2.
FAME methane gas is almost a 500x expansion factor
Picture is from Westway biodiesel case study site, note foam. Also contained particles of biomass. Bugs immediately hydrolyze FAMEs to fatty acid which at pH >5.5 forms alkanates (soap)
65
66
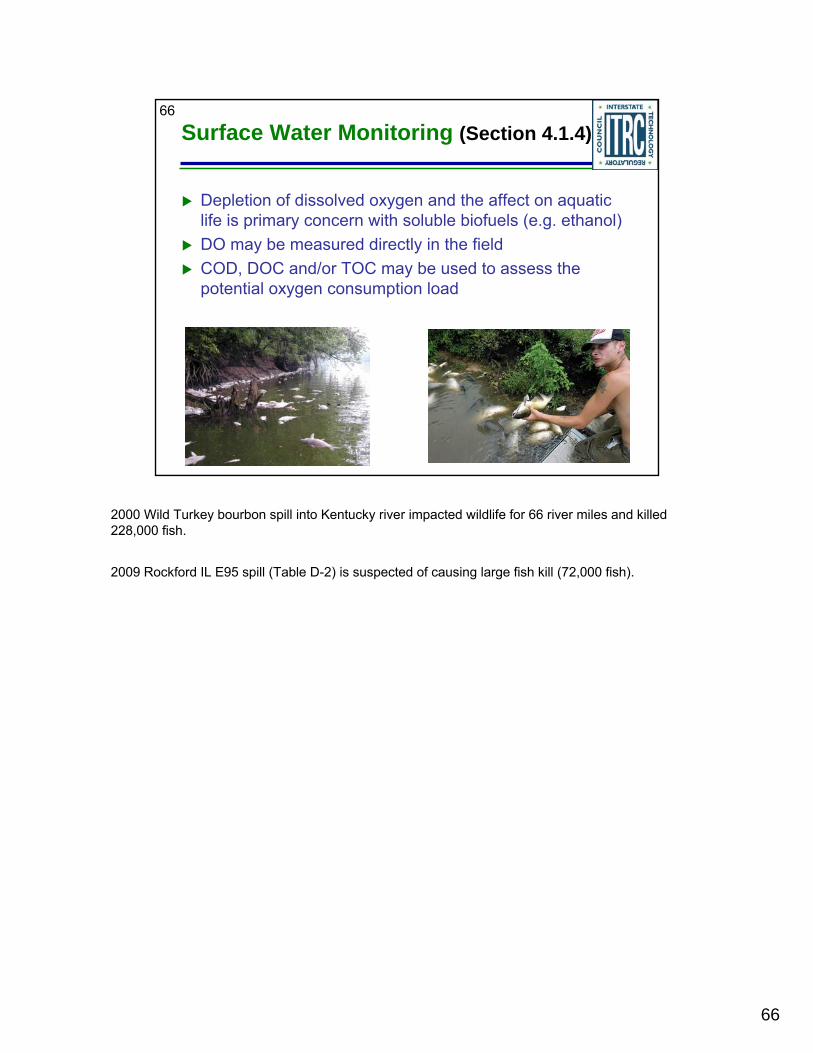
Surface Water Monitoring (Section 4.1.4)
Depletion of dissolved oxygen and the affect on aquatic life is primary concern with soluble biofuels (e.g. ethanol)DO may be measured directly in the fieldCOD, DOC and/or TOC may be used to assess the potential oxygen consumption load
2000 Wild Turkey bourbon spill into Kentucky river impacted wildlife for 66 river miles and killed 228,000 fish.
2009 Rockford IL E95 spill (Table D-2) is suspected of causing large fish kill (72,000 fish).
66
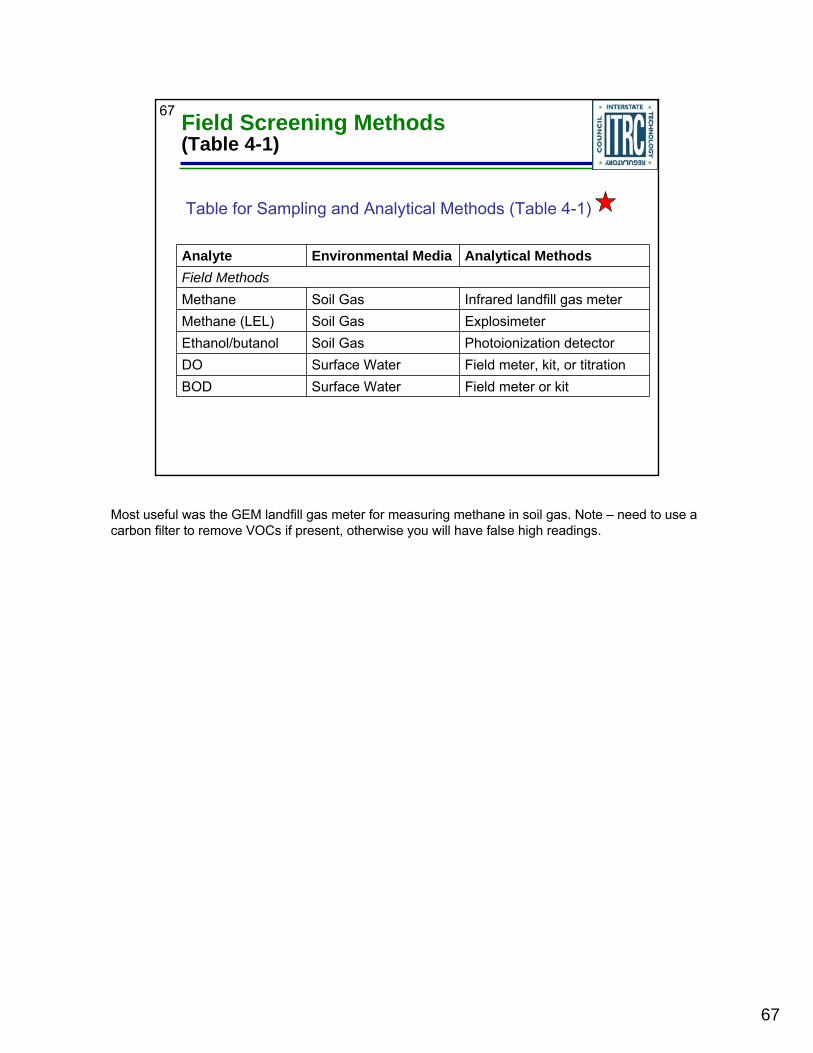
67 Field Screening Methods (Table 4-1)
Analyte Environmental Media Analytical MethodsField MethodsMethane Soil Gas Infrared landfill gas meterMethane (LEL) Soil Gas ExplosimeterEthanol/butanol Soil Gas Photoionization detectorDO Surface Water Field meter, kit, or titrationBOD Surface Water Field meter or kit
Table for Sampling and Analytical Methods (Table 4-1)
Most useful was the GEM landfill gas meter for measuring methane in soil gas. Note – need to use a carbon filter to remove VOCs if present, otherwise you will have false high readings.
67
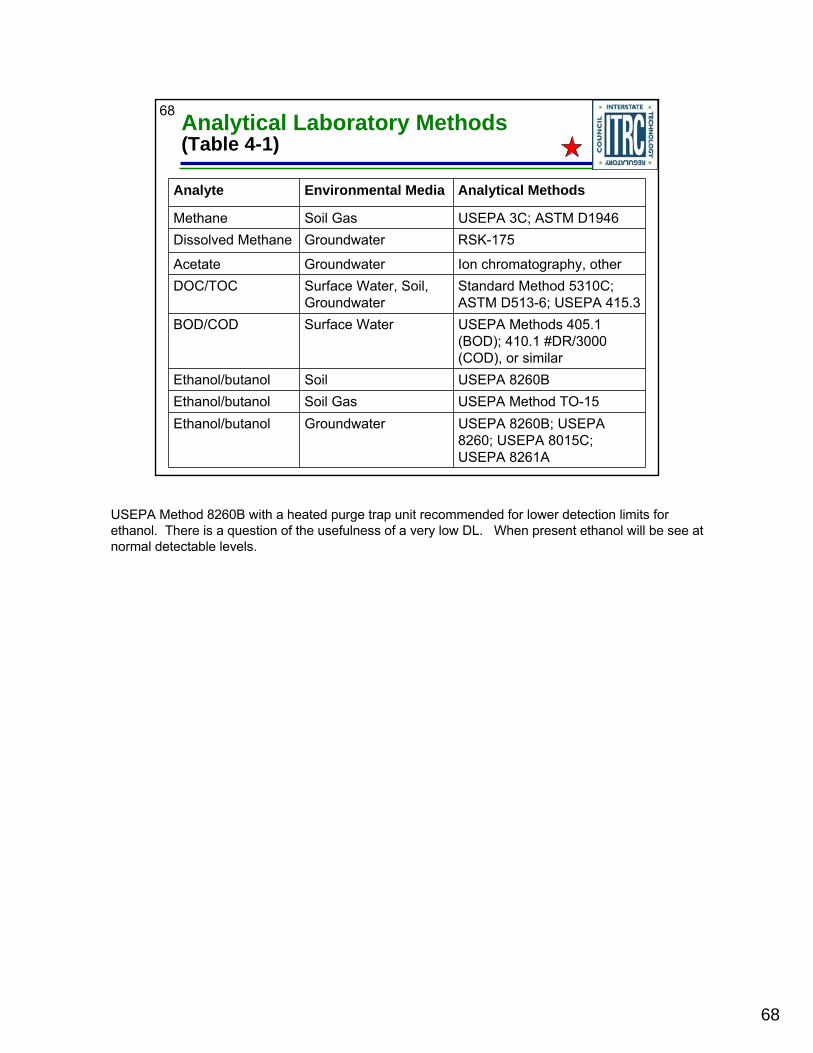
68 Analytical Laboratory Methods (Table 4-1)
Analyte Environmental Media Analytical Methods
Methane Soil Gas USEPA 3C; ASTM D1946Dissolved Methane Groundwater RSK-175
Acetate Groundwater Ion chromatography, otherDOC/TOC Surface Water, Soil,
GroundwaterStandard Method 5310C; ASTM D513-6; USEPA 415.3
BOD/COD Surface Water USEPA Methods 405.1 (BOD); 410.1 #DR/3000 (COD), or similar
Ethanol/butanol Soil USEPA 8260BEthanol/butanol Soil Gas USEPA Method TO-15Ethanol/butanol Groundwater USEPA 8260B; USEPA
8260; USEPA 8015C; USEPA 8261A
USEPA Method 8260B with a heated purge trap unit recommended for lower detection limits for ethanol. There is a question of the usefulness of a very low DL. When present ethanol will be see at normal detectable levels.
68
69
Our Case Study: Site Investigation
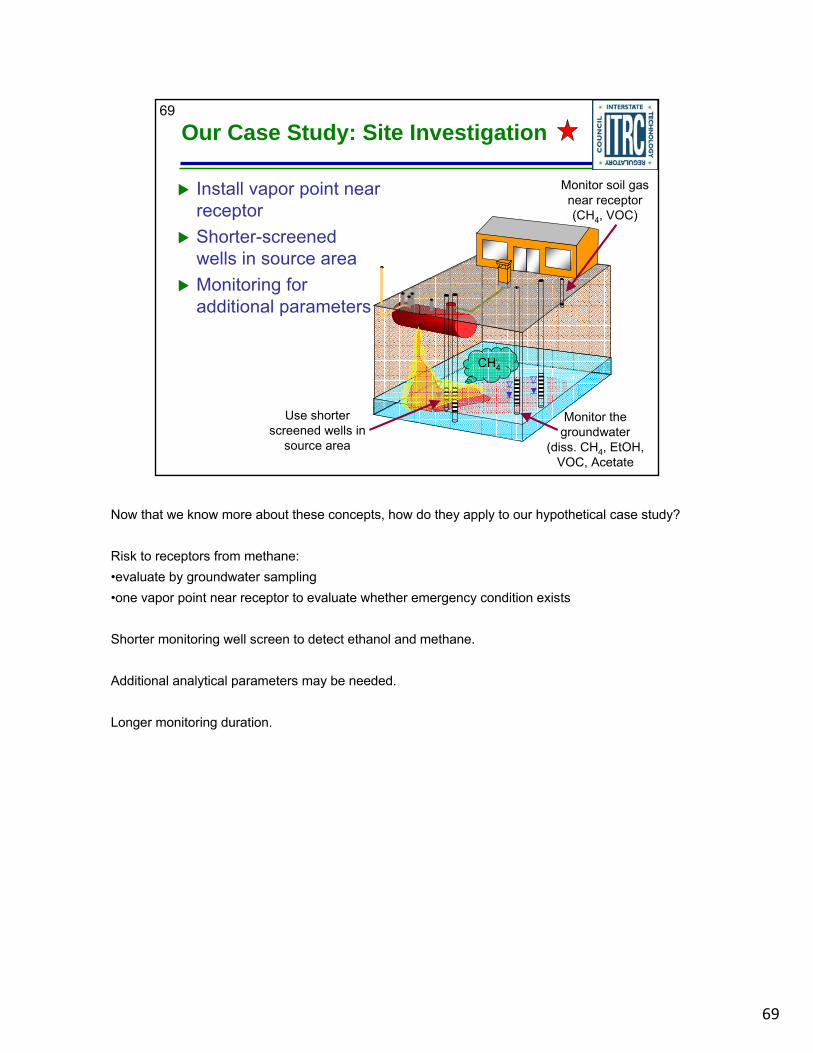
Install vapor point near receptorShorter-screened wells in source areaMonitoring for additional parameters
CH4
Monitor soil gasnear receptor(CH4, VOC)
Use shorter screened wells in
source area
Monitor the groundwater
(diss. CH4, EtOH, VOC, Acetate
Now that we know more about these concepts, how do they apply to our hypothetical case study?
Risk to receptors from methane:•evaluate by groundwater sampling•one vapor point near receptor to evaluate whether emergency condition exists
Shorter monitoring well screen to detect ethanol and methane.
Additional analytical parameters may be needed.
Longer monitoring duration.
69
70 Site Investigation Summary(Section 4)
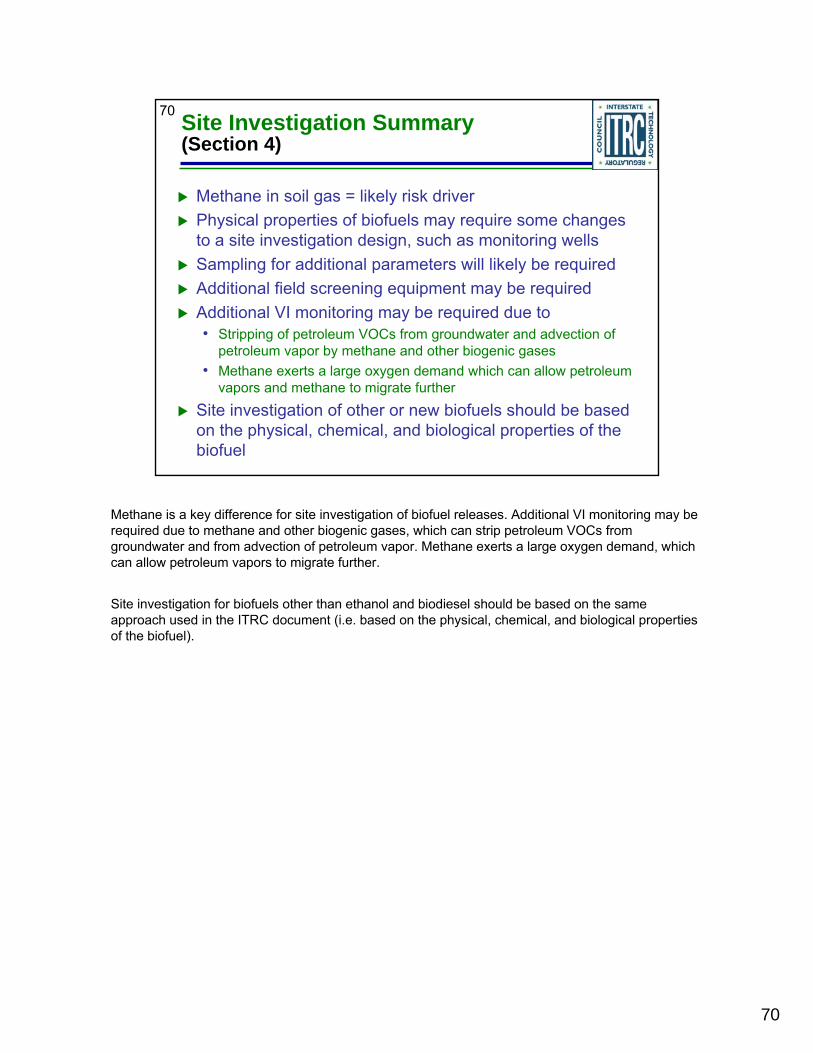
Methane in soil gas = likely risk driver Physical properties of biofuels may require some changes to a site investigation design, such as monitoring wellsSampling for additional parameters will likely be requiredAdditional field screening equipment may be requiredAdditional VI monitoring may be required due to• Stripping of petroleum VOCs from groundwater and advection of
petroleum vapor by methane and other biogenic gases• Methane exerts a large oxygen demand which can allow petroleum
vapors and methane to migrate further
Site investigation of other or new biofuels should be based on the physical, chemical, and biological properties of the biofuel
Methane is a key difference for site investigation of biofuel releases. Additional VI monitoring may be required due to methane and other biogenic gases, which can strip petroleum VOCs from groundwater and from advection of petroleum vapor. Methane exerts a large oxygen demand, which can allow petroleum vapors to migrate further.
Site investigation for biofuels other than ethanol and biodiesel should be based on the same approach used in the ITRC document (i.e. based on the physical, chemical, and biological properties of the biofuel).
70

71
Site Closure Considerations
Was the site investigation adequate for a biofuel release?
Have all groundwater and vapor risks been identified?
Are degradation products still present in groundwater (e.g. methane, acetate)
Has monitoring adequately accounted for delayed methane generation?
If elevated risks and hazardous conditions exist, remediation may be required
All states are different, but these are key items to consider beyond a typical petroleum release.
If the site investigation follows a standard petroleum investigation, you maybe missing out on significant risks to receptors.
Don’t rely on just detection of the biofuel, look for degradation products.
Time is very important, especially for UST releases where you may not know where you are at in the lifecycle, so err on the side on greater monitoring.
71
72
Training Roadmap
IntroductionReleasesFate and TransportQ&A Session #1Site InvestigationLong-Term Response StrategiesSummaryQ&A Session #2
No associated notes.
72

73 Long-Term Response Strategies(Section 5)
General considerations for remediation
Risk management
Remedial selection Use of the hypothetical case
study to help illustrate key points
This section will cover:
CH4
Long-term response strategies for a biofuel release require consideration of a number of factors, including the following:• Type of biofuel• Extent and magnitude of the release• Regulatory threshold for a COC•Risk to identified receptors

74 Our Case Study: Long-Term Response Strategies (Section 5)
Requires consideration of:• Type of biofuel• Extent and magnitude of the
release• Regulatory threshold for a
COC(s)• Risk to identified receptors
Case study:• E85 spill• Media impacted:
• Vadose zone• Capillary Fringe• Groundwater
• State regulations applicable to gasoline components
• Dispensing station building and surrounding residential area
CH4
At this hypothetical site, state regulations are applicable to gasoline components (no regulatory thresholds established for ethanol, methane or other degradation products)
75 Generalized Framework (Figure 5-1)
Site Conceptual Model/Site
Characterization
Yes
No Further Action/Site
Closure
No
Implement closure monitoring and/or
controlsYes
Yes
No
Active Remedy
Yes
No
No
Yes
Sections 3 and 4
Sect 5.1
Sect 5.2.1 Sect 5.3
Sect 5.3.3
Sect 5.2.2
Sect 5.4
Meetremedial
endpoints?
Riskacceptable or
manageable w/ controls?
Above regulatory
threshold and/or a potential hazard
exists?
Meet closure
requirements?
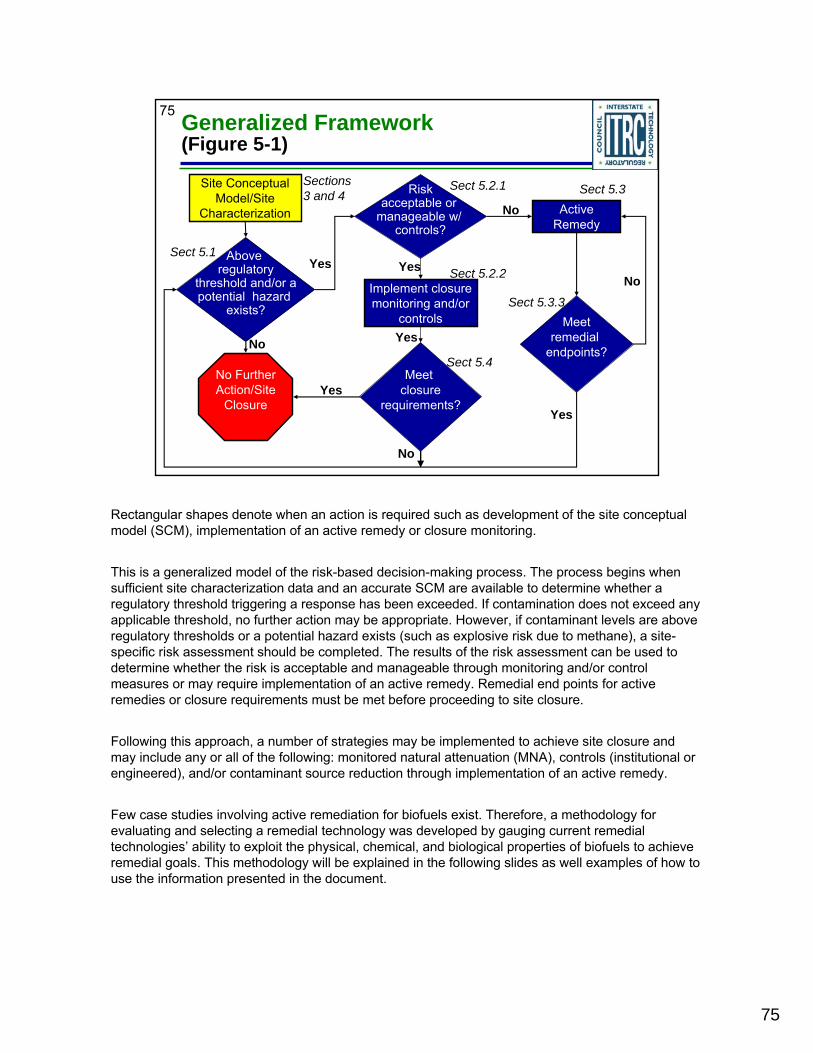
Rectangular shapes denote when an action is required such as development of the site conceptual model (SCM), implementation of an active remedy or closure monitoring.
This is a generalized model of the risk-based decision-making process. The process begins when sufficient site characterization data and an accurate SCM are available to determine whether a regulatory threshold triggering a response has been exceeded. If contamination does not exceed any applicable threshold, no further action may be appropriate. However, if contaminant levels are above regulatory thresholds or a potential hazard exists (such as explosive risk due to methane), a site-specific risk assessment should be completed. The results of the risk assessment can be used to determine whether the risk is acceptable and manageable through monitoring and/or control measures or may require implementation of an active remedy. Remedial end points for active remedies or closure requirements must be met before proceeding to site closure.
Following this approach, a number of strategies may be implemented to achieve site closure and may include any or all of the following: monitored natural attenuation (MNA), controls (institutional or engineered), and/or contaminant source reduction through implementation of an active remedy.
Few case studies involving active remediation for biofuels exist. Therefore, a methodology for evaluating and selecting a remedial technology was developed by gauging current remedial technologies’ ability to exploit the physical, chemical, and biological properties of biofuels to achieve remedial goals. This methodology will be explained in the following slides as well examples of how to use the information presented in the document.
75

76 Risk Management(Section 5.2.1; Table 5-1)
Management of risk through long-term monitoring Controls (institutional or engineering)• Provide protection from exposure to contaminant(s)
that exist or remain on a site
Benefits LimitationsDissolved biofuel is readily biodegradable without additional enhancement
• High concentrations of some dissolved biofuel constituents (i.e., ethanol) can be toxic to microorganisms
• Delayed biodegradation of more recalcitrant contaminants via preferential biodegradation of the biofuel
• Does not address immediate risks• High potential for methane generation• Does not address LNAPL, although microbial processes can enhance dissolution in groundwater
• Surface water may become anoxic, impacting aquatic species and habitat
Implement closure monitoring and/or
controls
Depending on state regulations, risks may be manageable with MNA or institutional or engineering controls. Impacts requiring an active remedy are generally associated with human and ecological receptors, such as inhabitants of an impacted structure, users of an impacted water supply well, and aquatic and terrestrial organisms. An active remedy may also be driven by planned or future land use, explosive or dangerous conditions, or other state-specific regulatory requirements.
Monitored natural attenuation (MNA) relies on a variety of physical, chemical, and biological processes that reduce the toxicity, mobility, or concentration of contaminants in soil, soil gas, and groundwater. MNA may be an applicable alternative to an active remedy. MNA takes advantage of the ability of biofuels to readily dissolve and biodegrade, although it also has some limitations (Table 5-1).
The Pacific Northwest Terminal case study in Appendix D of the document utilized MNA and an active remedy together in the remediation process.
76
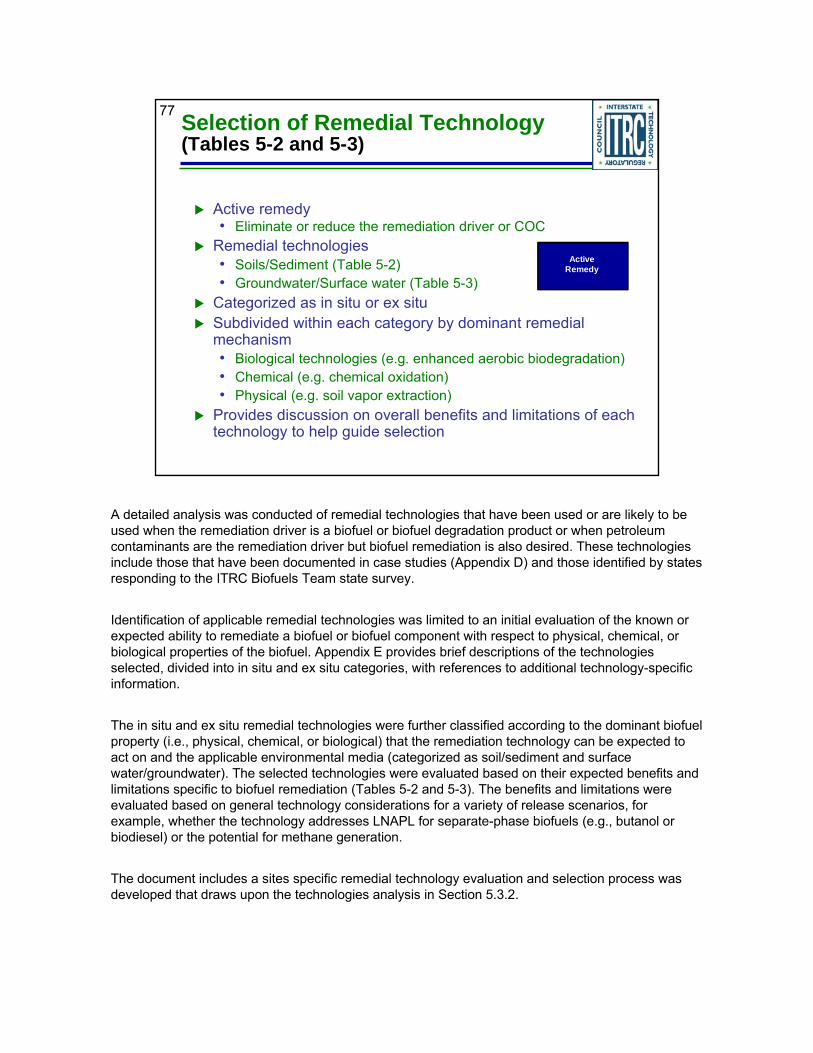
77 Selection of Remedial Technology(Tables 5-2 and 5-3)
Active remedy• Eliminate or reduce the remediation driver or COC
Remedial technologies • Soils/Sediment (Table 5-2)• Groundwater/Surface water (Table 5-3)
Categorized as in situ or ex situSubdivided within each category by dominant remedial mechanism• Biological technologies (e.g. enhanced aerobic biodegradation)• Chemical (e.g. chemical oxidation)• Physical (e.g. soil vapor extraction)
Provides discussion on overall benefits and limitations of each technology to help guide selection
Active Remedy
A detailed analysis was conducted of remedial technologies that have been used or are likely to be used when the remediation driver is a biofuel or biofuel degradation product or when petroleum contaminants are the remediation driver but biofuel remediation is also desired. These technologies include those that have been documented in case studies (Appendix D) and those identified by states responding to the ITRC Biofuels Team state survey.
Identification of applicable remedial technologies was limited to an initial evaluation of the known or expected ability to remediate a biofuel or biofuel component with respect to physical, chemical, or biological properties of the biofuel. Appendix E provides brief descriptions of the technologies selected, divided into in situ and ex situ categories, with references to additional technology-specific information.
The in situ and ex situ remedial technologies were further classified according to the dominant biofuel property (i.e., physical, chemical, or biological) that the remediation technology can be expected to act on and the applicable environmental media (categorized as soil/sediment and surface water/groundwater). The selected technologies were evaluated based on their expected benefits and limitations specific to biofuel remediation (Tables 5-2 and 5-3). The benefits and limitations were evaluated based on general technology considerations for a variety of release scenarios, for example, whether the technology addresses LNAPL for separate-phase biofuels (e.g., butanol or biodiesel) or the potential for methane generation.
The document includes a sites specific remedial technology evaluation and selection process was developed that draws upon the technologies analysis in Section 5.3.2.

78 Remedial Technology (Soils Example) Table 5-2
Examples applicable to E85 impacts to vadose zone/capillary fringe
Active Remedy
Technology Benefits Limitations
In Situ Treatm
ent
PhysicalSoil vapor extraction (SVE)Soil
Rapidly removes readily strippable compounds (constituents with a high Henry's Law Constant, vapor pressure, and/or biodegradability). Promotes aerobic biodegradation of biofuels and methane oxidation (if present).
Not effective for constituents with a low Henry's Law Constant, vapor pressure, and/or biodegradability; may require ex situ vapor treatment.
BiologicalEnhanced Aerobic Biodegradation Bioventing - soil
Can result in rapid elimination of dissolved constituents and increase in dissolution and subsequent biodegradation of residual NAPL. Promotes methane oxidation. Likely inhibits formation of anaerobic conditions and methane generation.
Does not directly address LNAPL. High concentrations of some dissolved biofuelconstituents (e.g. ethanol) can be toxic to microorganisms.
This slide provides examples of two technologies as provided in Table 5-2. This table provides benefits and limitations of technologies with some level of expected effectiveness for biofuel remediation, addressing expected benefits and limitations for each technology.
78
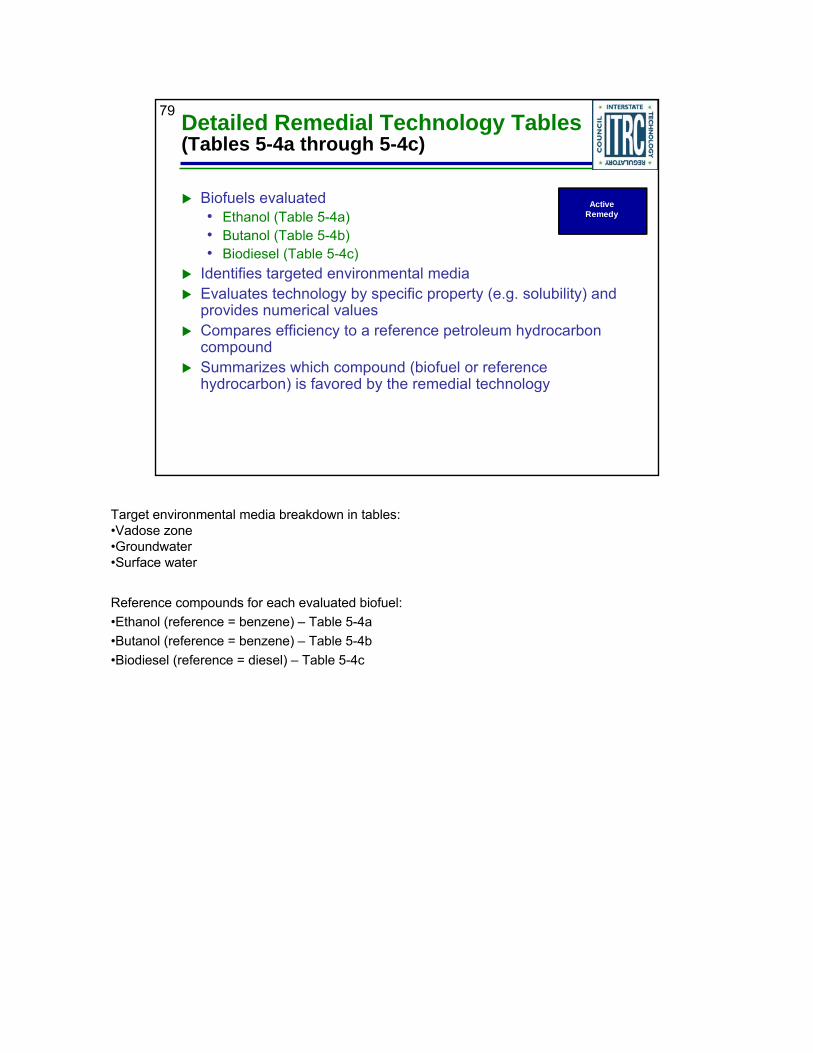
79 Detailed Remedial Technology Tables (Tables 5-4a through 5-4c)
Biofuels evaluated• Ethanol (Table 5-4a)• Butanol (Table 5-4b)• Biodiesel (Table 5-4c)
Identifies targeted environmental mediaEvaluates technology by specific property (e.g. solubility) and provides numerical valuesCompares efficiency to a reference petroleum hydrocarbon compoundSummarizes which compound (biofuel or reference hydrocarbon) is favored by the remedial technology
Active Remedy
Target environmental media breakdown in tables: •Vadose zone•Groundwater•Surface water
Reference compounds for each evaluated biofuel:•Ethanol (reference = benzene) – Table 5-4a•Butanol (reference = benzene) – Table 5-4b•Biodiesel (reference = diesel) – Table 5-4c

80 Example Table 5-4a(Figure 5-2)
Expanding on the examples selected from Table 5-2 as applicable to vadose zone remediation of the E85 case study:
Technology Target Media P/C/B Properties Benzene Ethanol Favors
VZ GW SW
SVEX
Vapor Pressure
Aerobic Bio Potential
75 mm Hg
days
49 -56.6 mm Hg
hours
Benzene
Ethanol
Bioventing X Aerobic Bio Potential days hours Ethanol
Depicts the media that the technology is applicable to
Describes what physical, chemical
or biological properties are affected by the
technology
Property values for benzene (reference
compound for ethanol)
Property values for
ethanol
Describes which compound the technology favors with respect to
the targeted property
Active Remedy
In this example from Table 5-4a, Soil Vapor Extraction applies to ethanol in the vadose zone by acting on ethanol’s vapor pressure and aerobic biodegradation potential properties. The reference for ethanol is benzene. Comparison of the property values for benzene and ethanol for vapor pressure and aerobic biodegradation potential show that SVE favors benzene with respect to vapor pressure and ethanol with respect to ethanol. Similarly, bioventing will affect the aerobic biodegradation potential of ethanol and will favor ethanol over benzene.
80

81
Example Table 5-4d (Methane)
Evaluates technology effectiveness on methane remediation versus methane generation
Technology Target Media P/C/B Properties Methane Remediation
Methane Generation
VZ GW SW
SVEX
Vapor Pressure
Aerobic Bio Potential
Applicable
Applicable
N/A
Inhibits
Bioventing X Aerobic Bio Potential Applicable Inhibits
Depicts the media that the technology is applicable to
Describes what physical, chemical or biological properties are affected by the
technology
Evaluates whether
technology can remediate
methane, and by which P/C/B
property
Specifies whether technology
inhibits methane generation, and by
which P/C/B property
Active Remedy
In this example from Table 5-4d, the table shows that both SVE and bioventing may be applicable for methane remediation and will inhibit methane generation.

82 Our Case Study: Long-Term Response Strategies
Application of SVE for vadosezone:• Physical removal • Enhanced biodegradation
Long-term monitoring for both soil gas and dissolved plume to assess and re-evaluate risk
Additional technologies can be evaluated/implemented CH4
Approach presented for the hypothetical case study is similar to that taken at the Pacific Northwest Terminal Case Study presented in Appendix D. Application of SVE for vadose zone:
Physically remove regulated compounds, ethanol, and methane (if present); addresses explosive riskBiologically enhance degradation of ethanol, regulated compounds, and methane
82
83 Long-Term Response Strategies Summary
Response strategies should be based on risks presented by biofuel releaseMNA may be a viable response strategyIf methane is a concern, longer-term monitoring and/or engineering controls may be warrantedTechnology evaluation process can be applied to biofuels, the petroleum component of the blend, and future biofuels
Current widely used biofuels (ethanol and biodiesel) are readily biodegradable; therefore, MNA may be a viable strategy.
The technology evaluation and selection process can be also be applied to future biofuels based on their physical, chemical, and biological properties.
83
84
Training Roadmap
IntroductionReleasesFate and TransportQ&A Session #1Site InvestigationLong-Term Response StrategiesSummaryQ&A Session #2
No associated notes.
84

85
Our Case Study: Summary
Equipment compatibility issuesBiofuels fate & transport in the environmentMethane gas generationSite investigation designMonitoring in environmental mediaLong-term response strategiesRisk management
CH4
The hypothetical case study was used to illustrate all of these points and also how biofuel releases, investigations and remediation strategies differ from petroleum releases.
85

86
Overall Summary
Biofuel production and consumption is increasing= increase in potential frequency of releases= potential for environmental impacts
By using the ITRC document, you will be prepared and able to:• Build a better Site Conceptual Model (SCM)• Understand fate & transport in the environment• Know how to investigate a biofuel release site• Formulate a better response strategy
• The use of biofuels has increased and is expected to continue increasing with a concurrent expected increase in biofuel releases
• Differences in the supply chain of biofuels from conventional fuels have implications for potential release scenarios
• The physical, chemical, and biological properties of biofuels influence their fate and transport in the environment
• Characterization of biofuel releases based on the site conceptual model and can include monitoring for methane and methane precursors
• Long-term response strategies may include the use of monitored natural attenuation and/or active remediation technologies, depending on remediation goals
• Use remediation technology tables to evaluate potential technologies for remediation• Future biofuels may be evaluated using a similar multi-media approach
86

87
87
Thank You for Participating
2nd question and answer break Links to additional resources• http://www.cluin.org/conf/itrc/biofuels/resource.cfm
Feedback form – please complete• http://www.cluin.org/conf/itrc/biofuels/feedback.cfm
Need confirmation of your participation today?
Fill out the feedback form and check box for confirmation email.
Links to additional resources: http://www.cluin.org/conf/itrc/biofuels/resource.cfm
Your feedback is important – please fill out the form at: http://www.cluin.org/conf/itrc/biofuels/feedback.cfm
The benefits that ITRC offers to state regulators and technology developers, vendors, and consultants include:
Helping regulators build their knowledge base and raise their confidence about new environmental technologies
Helping regulators save time and money when evaluating environmental technologiesGuiding technology developers in the collection of performance data to satisfy the requirements of
multiple statesHelping technology vendors avoid the time and expense of conducting duplicative and costly
demonstrationsProviding a reliable network among members of the environmental community to focus on
innovative environmental technologies
How you can get involved with ITRC:Join an ITRC Team – with just 10% of your time you can have a positive impact on the regulatory
process and acceptance of innovative technologies and approachesSponsor ITRC’s technical team and other activitiesUse ITRC products and attend training coursesSubmit proposals for new technical teams and projects


