Casey FitzgeraldDirector, Bureau of Basin ProjectsSt. Johns River Water Management District
Epic Lake Restoration:Lake Apopka
and the Harris Chain of Lakes
Lake Apopka Restoration FSA 2012
Presentation Outline
I. Geographic Orientation II. Natural History of Lake ApopkaIII.Human History of Lake ApopkaIV.Legislative Actions V. Lake Apopka Restoration Program VI.Harris Chain Case Study: Lake Griffin
Lake Apopka Restoration FSA 2012
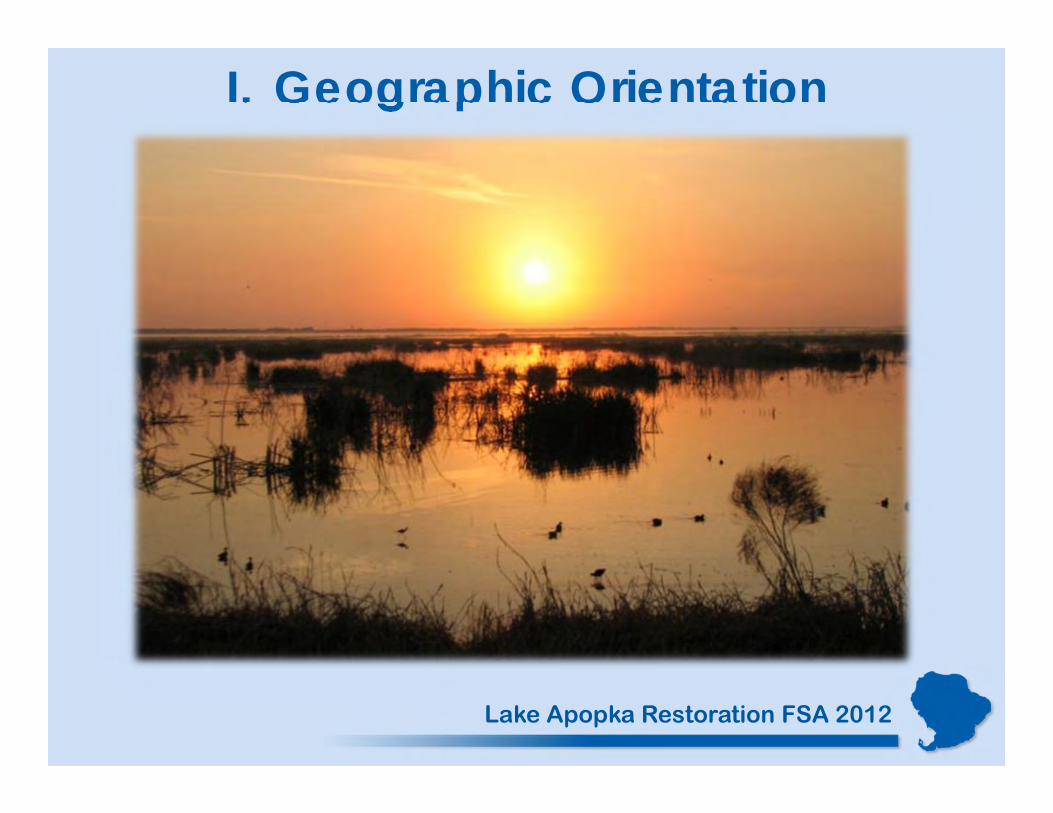
I. Geographic Orientation
• Aerial lake or other photo
Lake Apopka Restoration FSA 2012
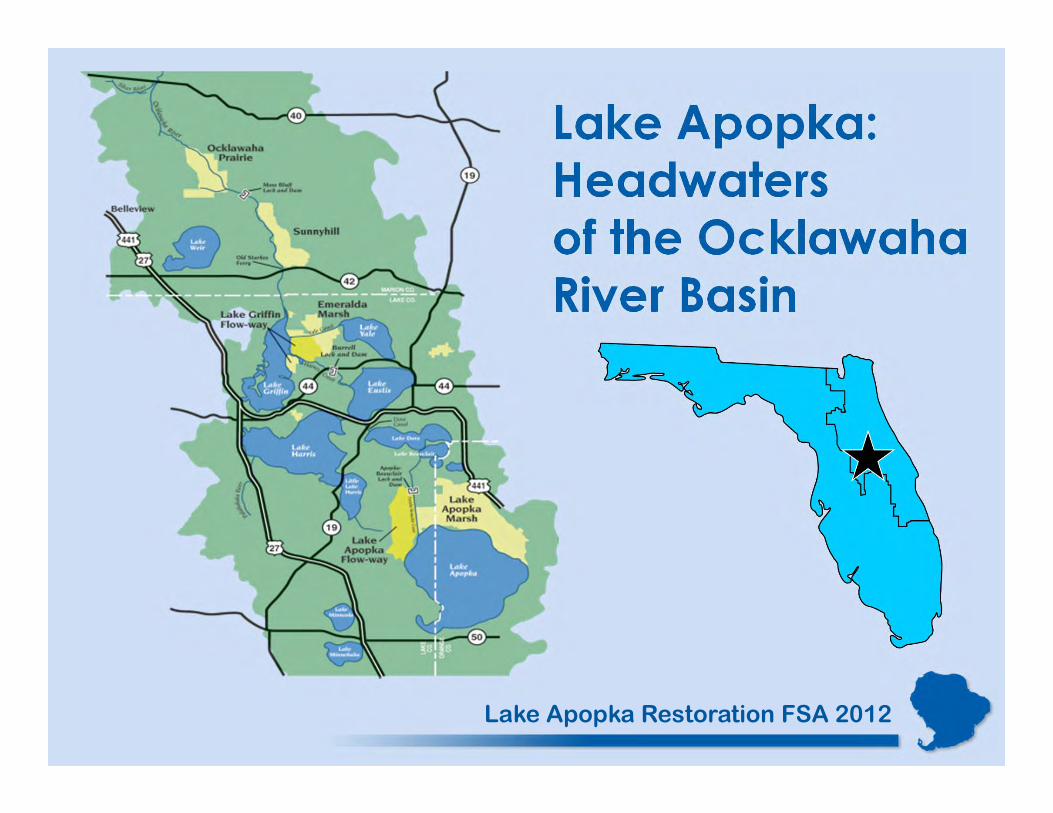
Lake Apopka: Headwaters of the Ocklawaha River Basin
Lake Apopka Restoration FSA 2012
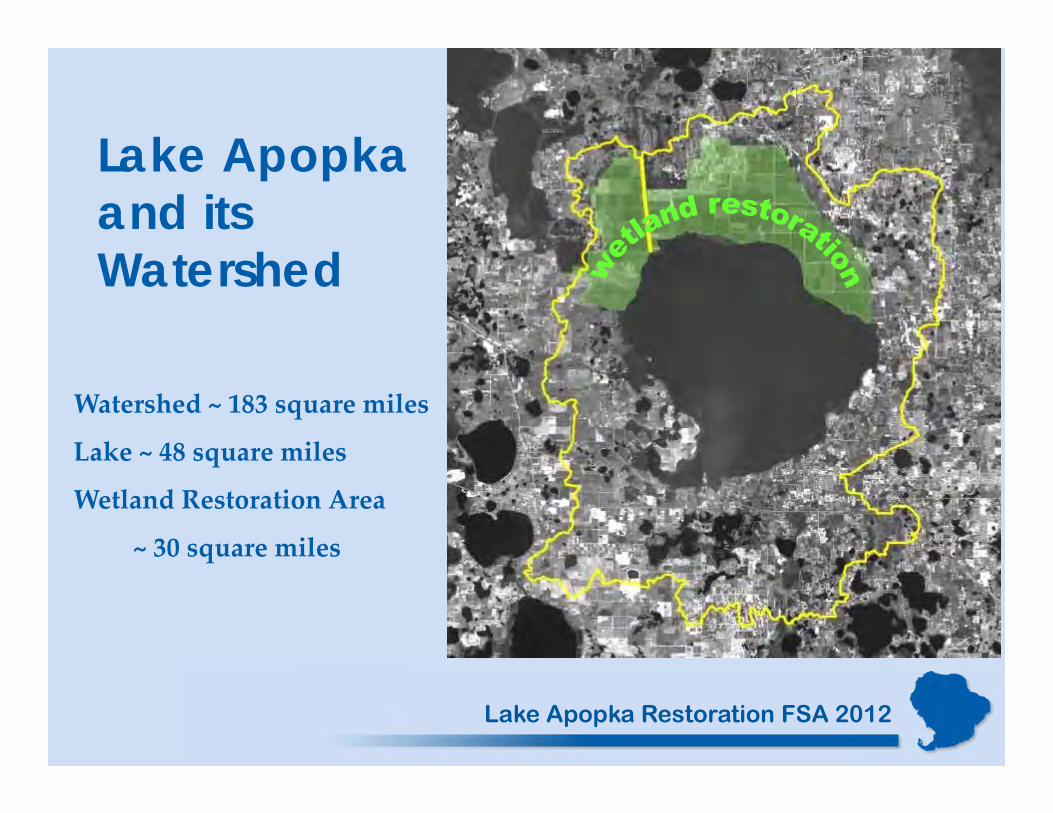
Lake Apopka and its Watershed
Watershed ~ 183 square miles
Lake ~ 48 square miles
Wetland Restoration Area
~ 30 square miles
Lake Apopka Restoration FSA 2012
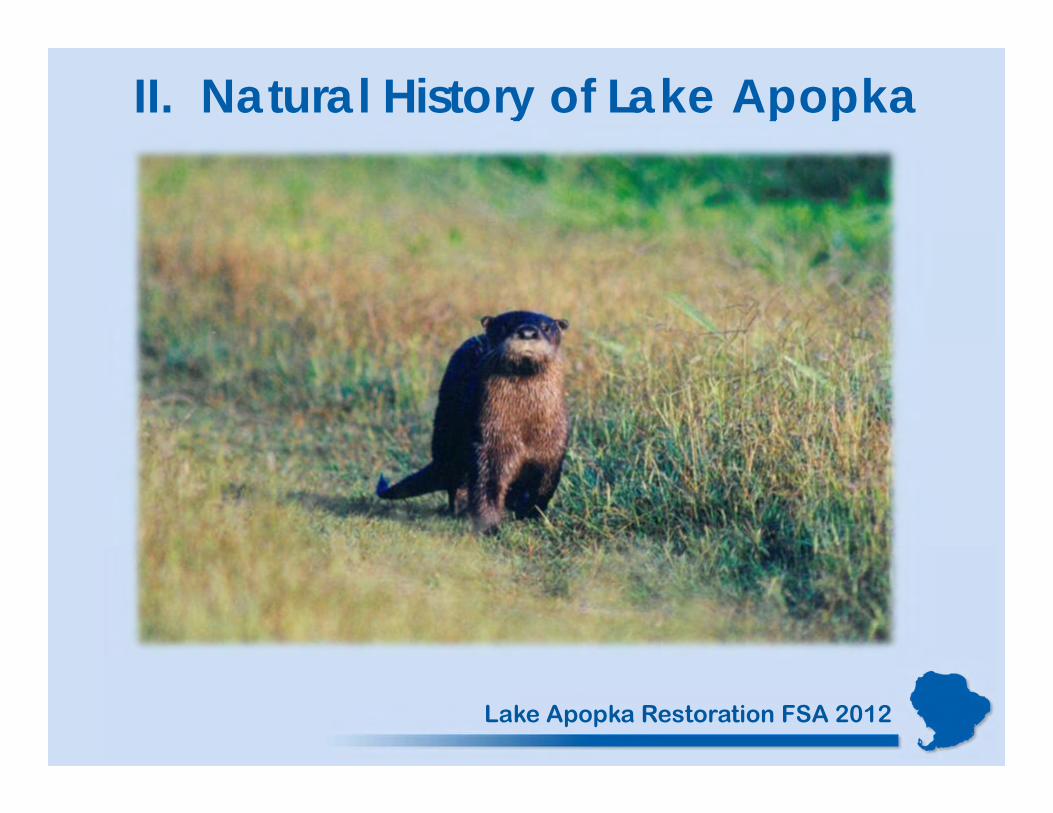
II. Natural History of Lake Apopka
• Lake photo
Lake Apopka Restoration FSA 2012
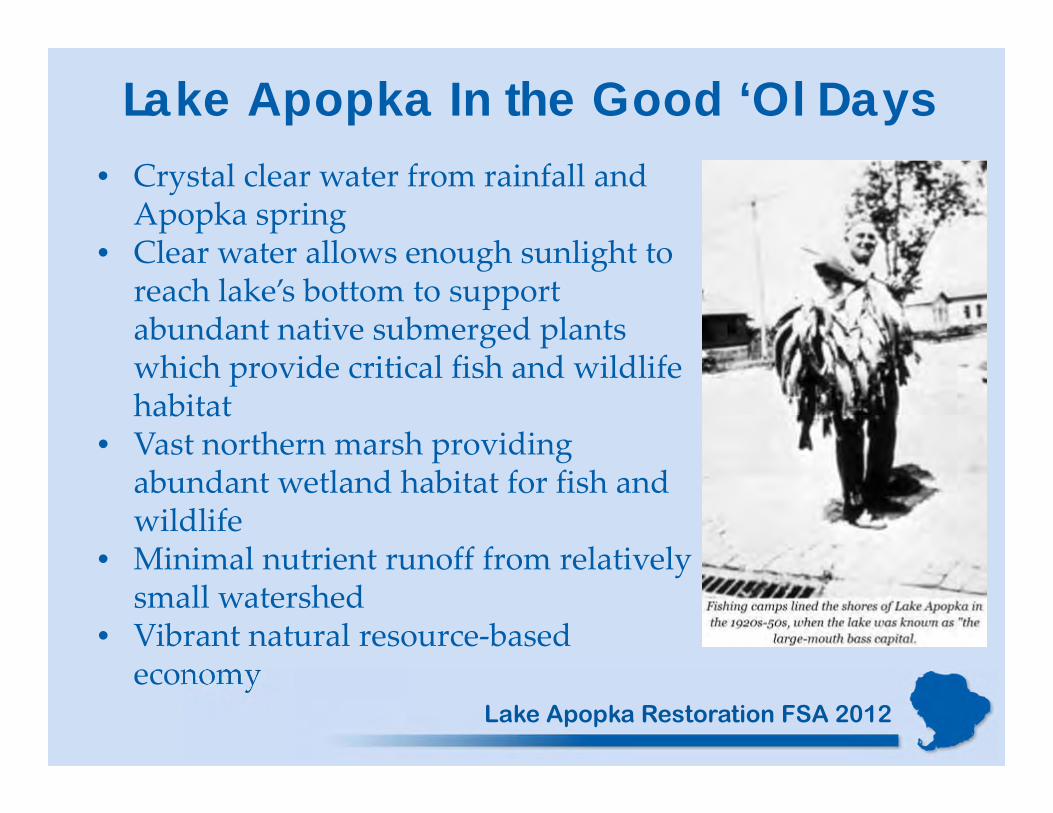
Lake Apopka In the Good ‘Ol Days• Crystal clear water from rainfall and
Apopka spring• Clear water allows enough sunlight to
reach lake’s bottom to support abundant native submerged plants which provide critical fish and wildlife habitat
• Vast northern marsh providing abundant wetland habitat for fish and wildlife
• Minimal nutrient runoff from relatively small watershed
• Vibrant natural resource‐based economy
Lake Apopka Restoration FSA 2012
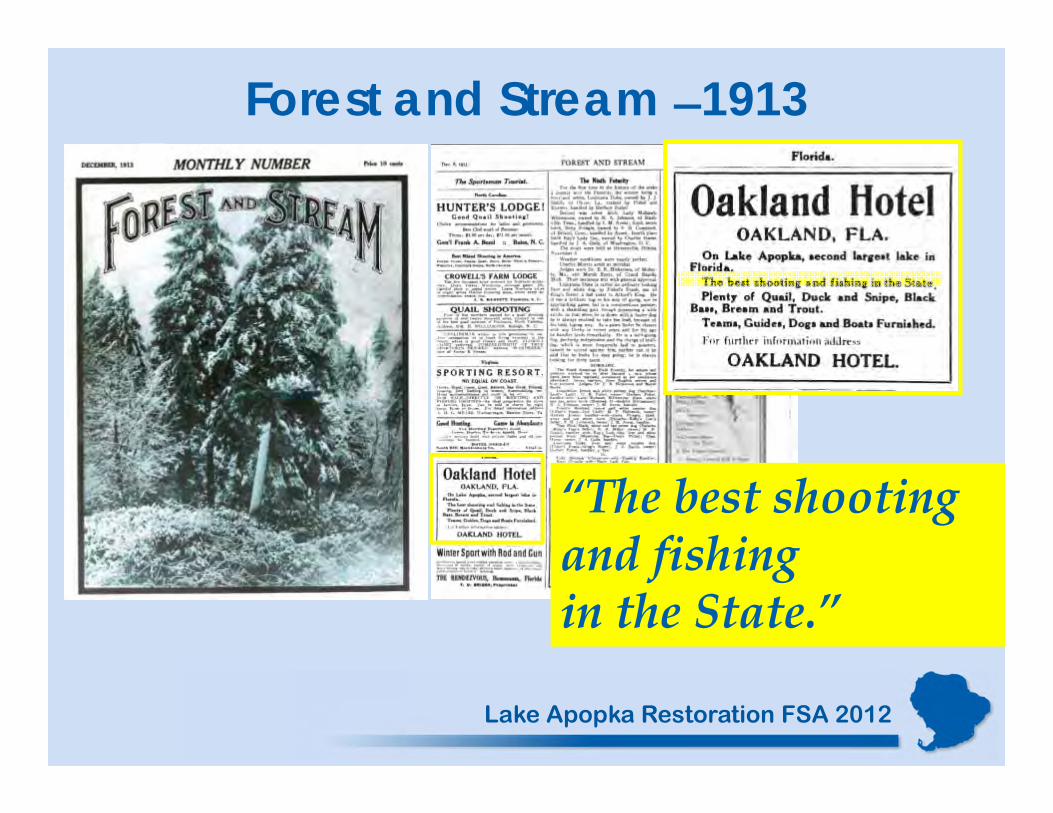
Forest and Stream ̶ 1913
“The best shooting and fishingin the State.”
Lake Apopka Restoration FSA 2012
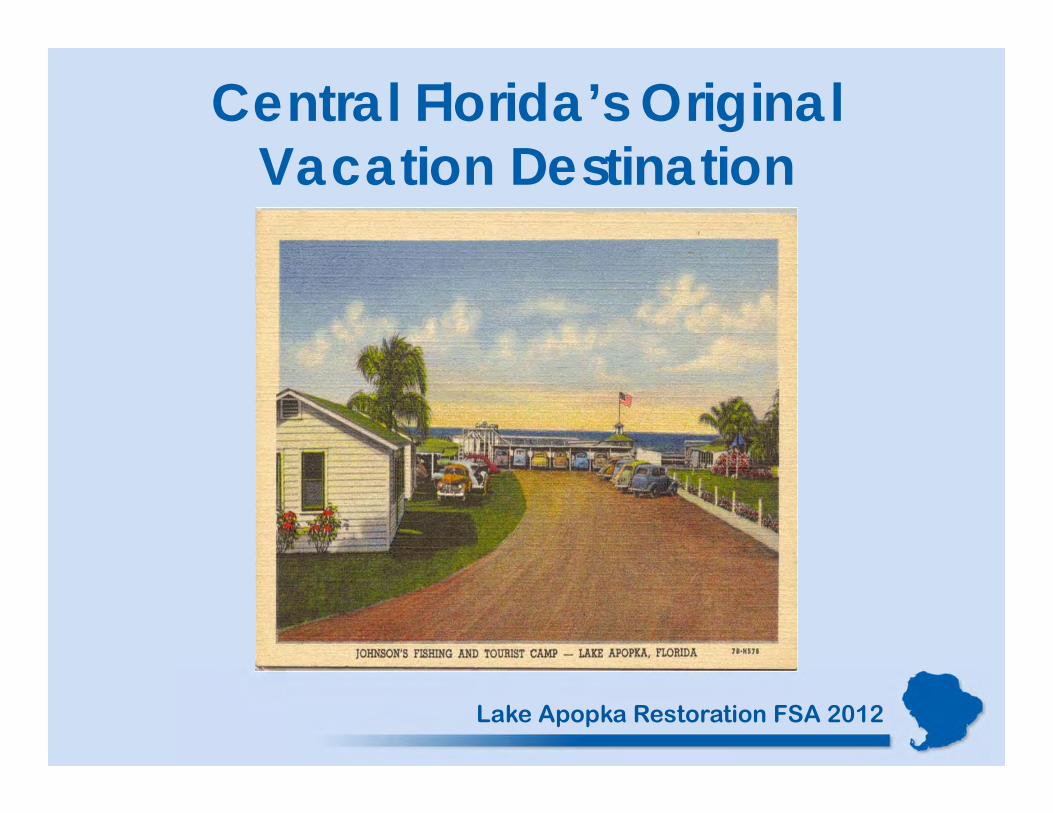
Central Florida’s Original Vacation Destination
Lake Apopka Restoration FSA 2012
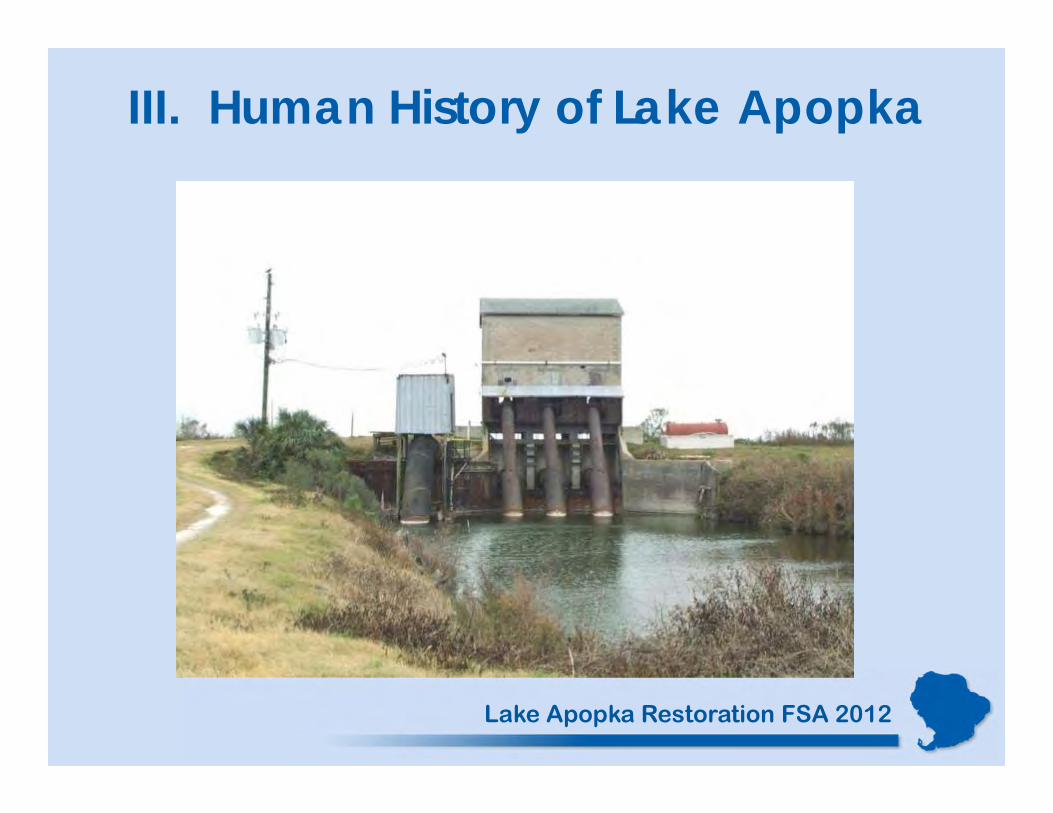
III. Human History of Lake Apopka
• Dredging or pumping photo
Lake Apopka Restoration FSA 2012
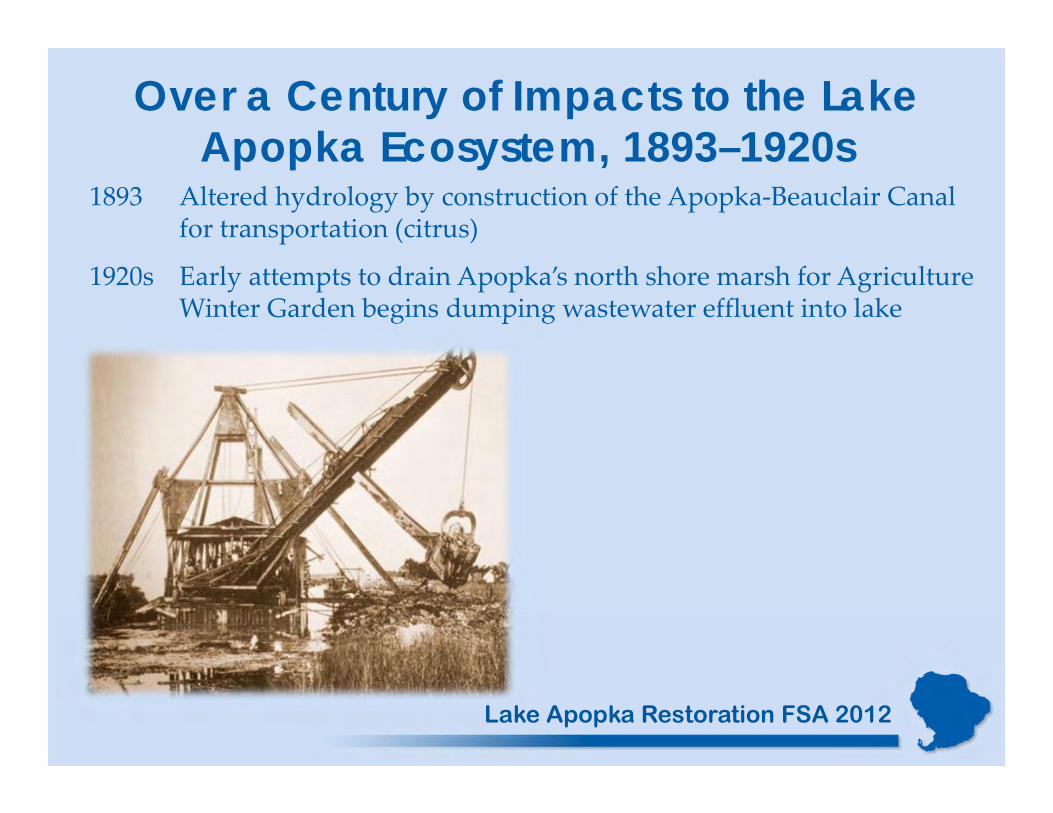
Over a Century of Impacts to the Lake Apopka Ecosystem, 1893–1920s
1893 Altered hydrology by construction of the Apopka‐Beauclair Canal for transportation (citrus)
1920s Early attempts to drain Apopka’s north shore marsh for AgricultureWinter Garden begins dumping wastewater effluent into lake
Lake Apopka Restoration FSA 2012
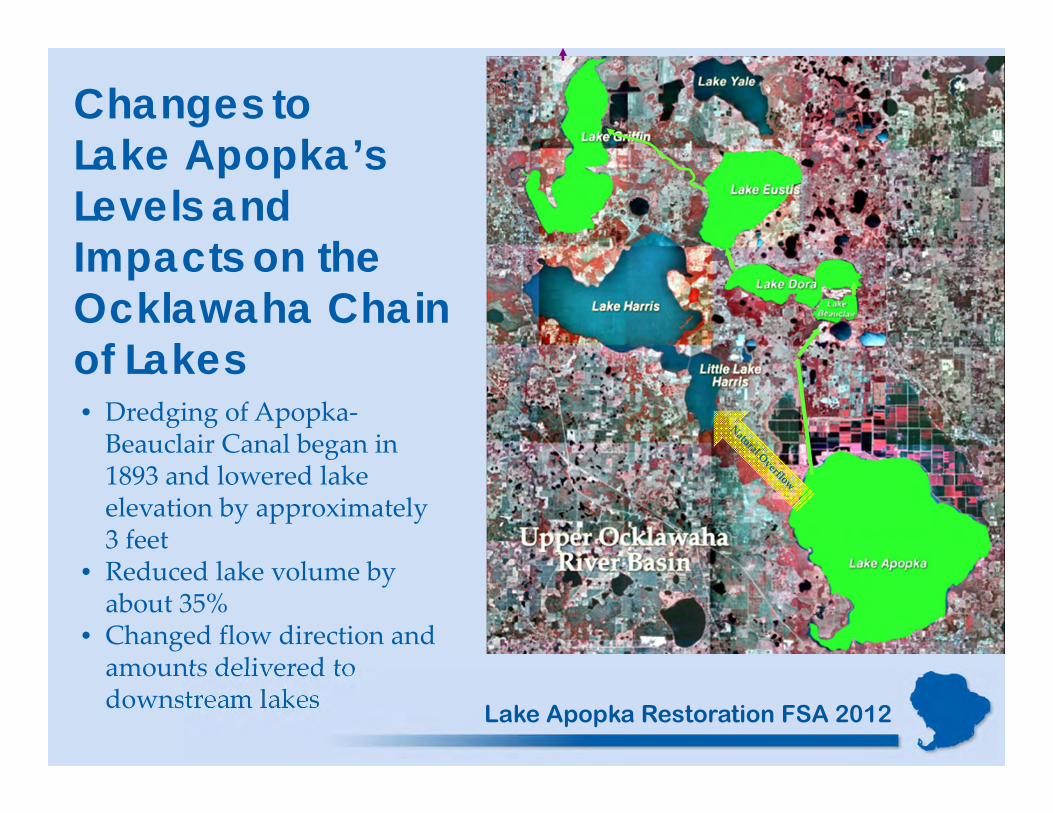
Changes to Lake Apopka’s Levels and Impacts on the Ocklawaha Chainof Lakes• Dredging of Apopka‐Beauclair Canal began in 1893 and lowered lake elevation by approximately 3 feet
• Reduced lake volume by about 35%
• Changed flow direction and amounts delivered to downstream lakes
Lake Apopka Restoration FSA 2012
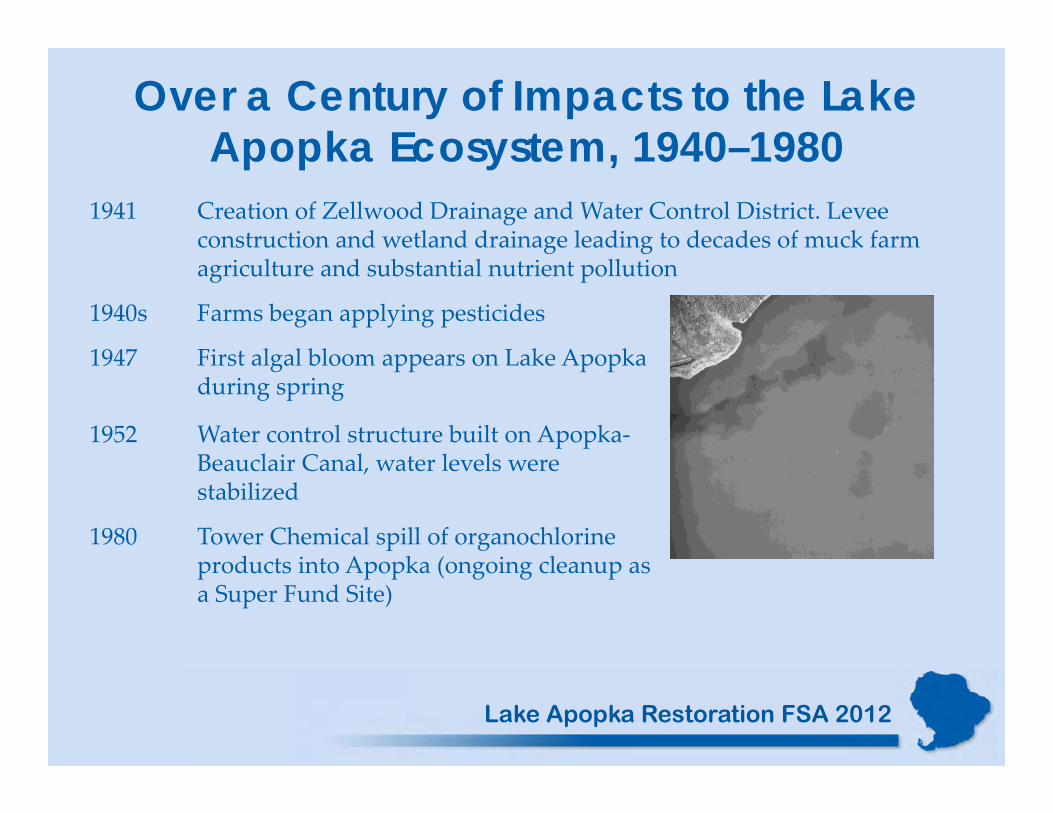
Over a Century of Impacts to the Lake Apopka Ecosystem, 1940–1980
1941 Creation of Zellwood Drainage and Water Control District. Levee construction and wetland drainage leading to decades of muck farm agriculture and substantial nutrient pollution
1940s Farms began applying pesticides
1947 First algal bloom appears on Lake Apopkaduring spring
1952 Water control structure built on Apopka‐Beauclair Canal, water levels were stabilized
1980 Tower Chemical spill of organochlorineproducts into Apopka (ongoing cleanup as a Super Fund Site)
Lake Apopka Restoration FSA 2012
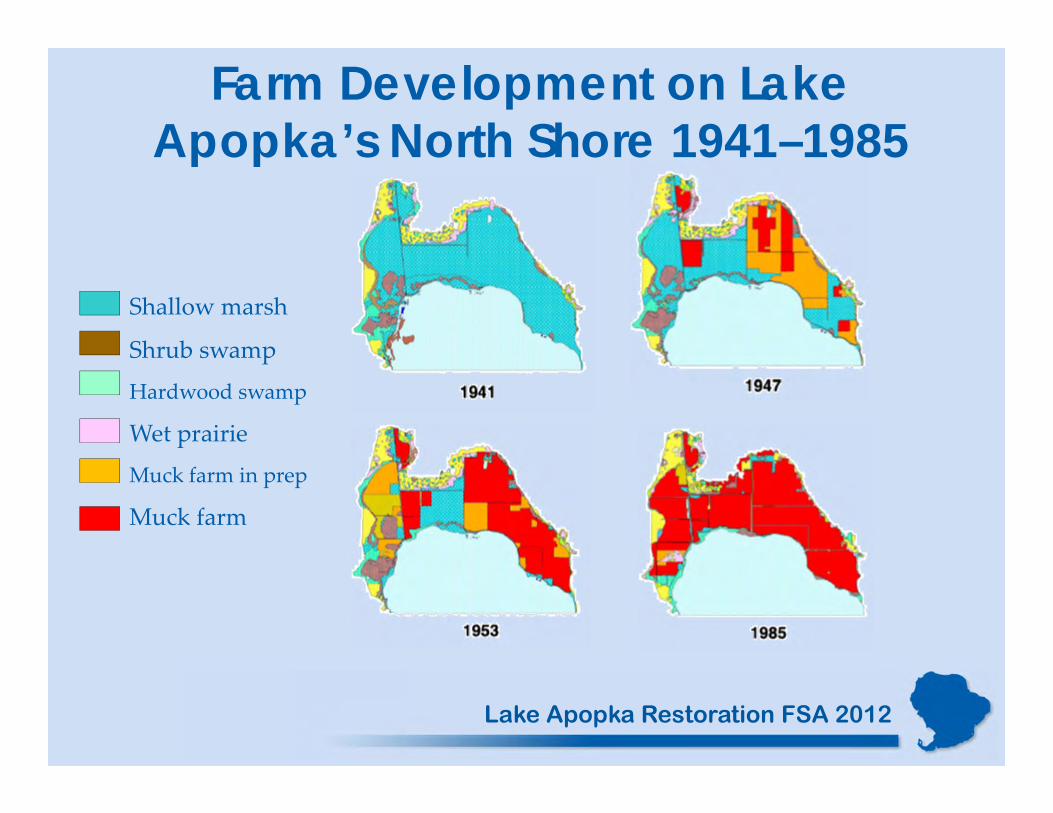
Shallow marsh
Shrub swamp
Hardwood swamp
Wet prairie
Muck farm in prep
Muck farm
Farm Development on Lake Apopka’s North Shore 1941–1985
Lake Apopka Restoration FSA 2012
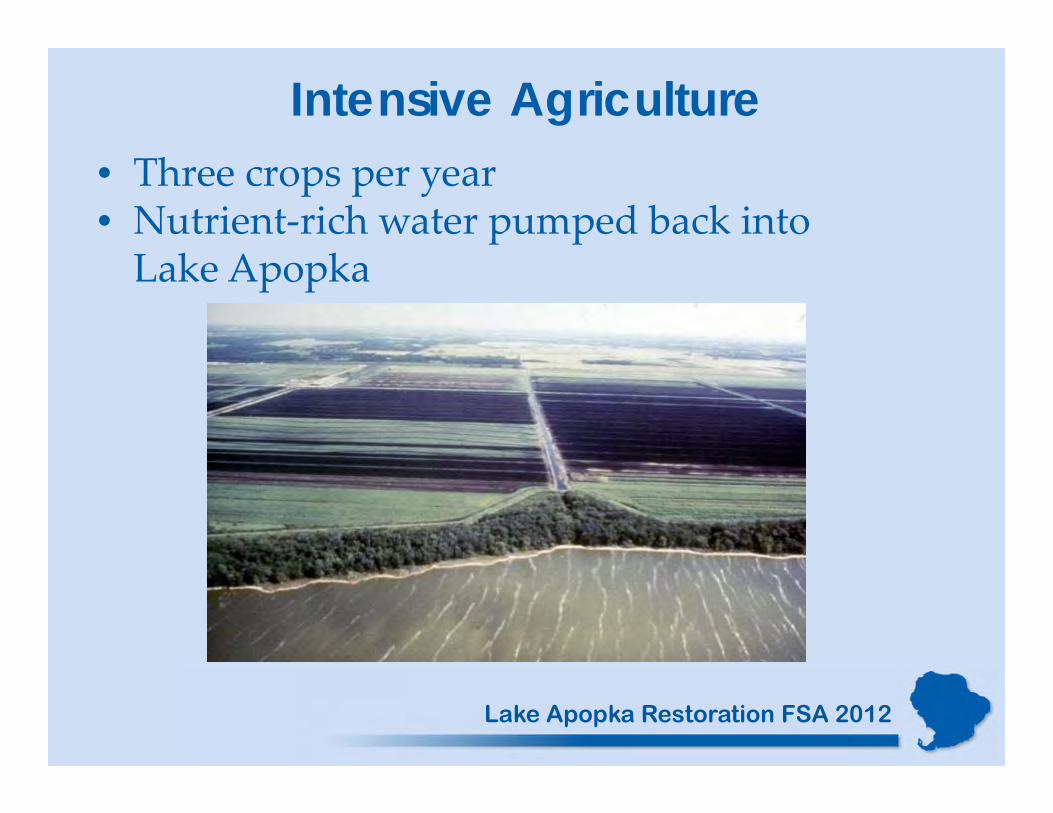
Intensive Agriculture • Three crops per year• Nutrient‐rich water pumped back into Lake Apopka
Lake Apopka Restoration FSA 2012
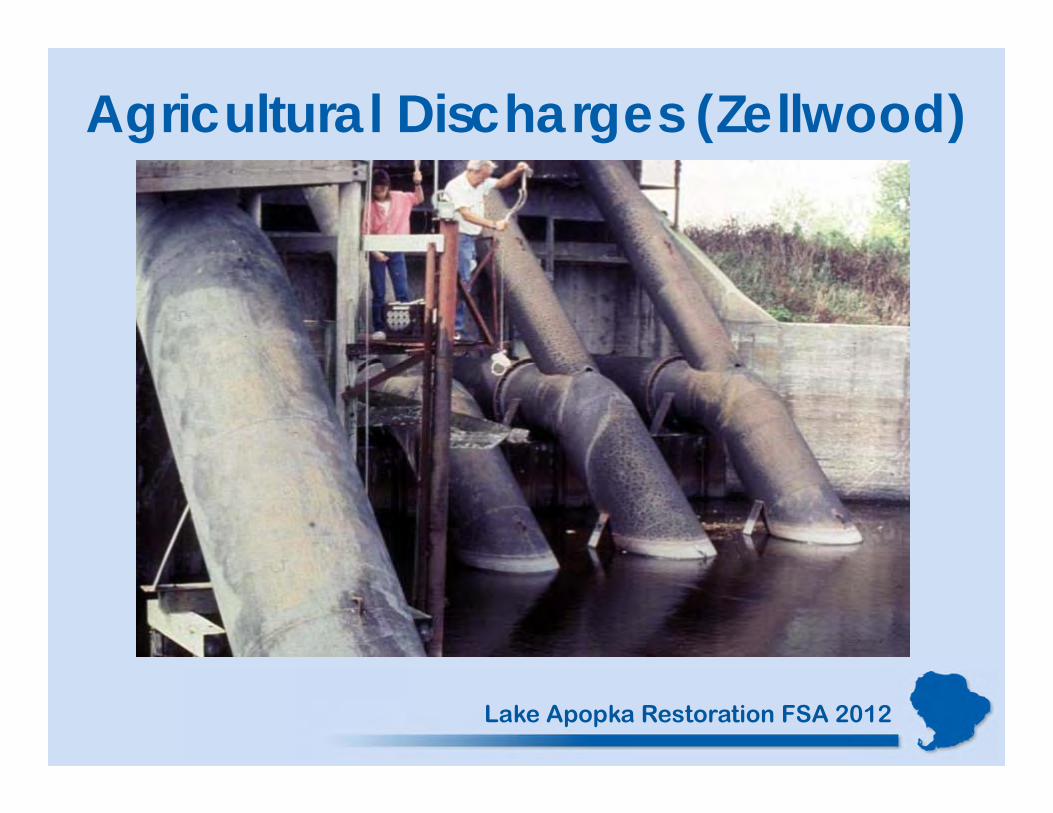
Agricultural Discharges (Zellwood)
Lake Apopka Restoration FSA 2012
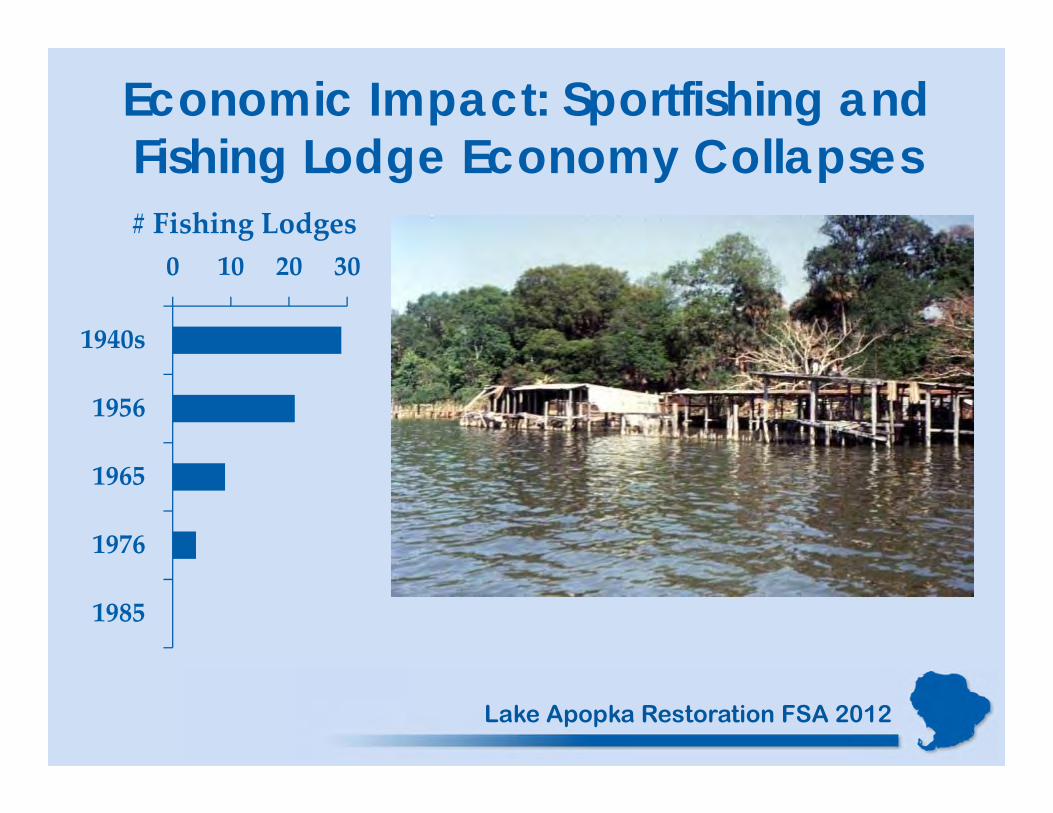
Economic Impact: Sportfishing and Fishing Lodge Economy Collapses
0 10 20 30
1940s
1956
1965
1976
1985
# Fishing Lodges
Lake Apopka Restoration FSA 2012
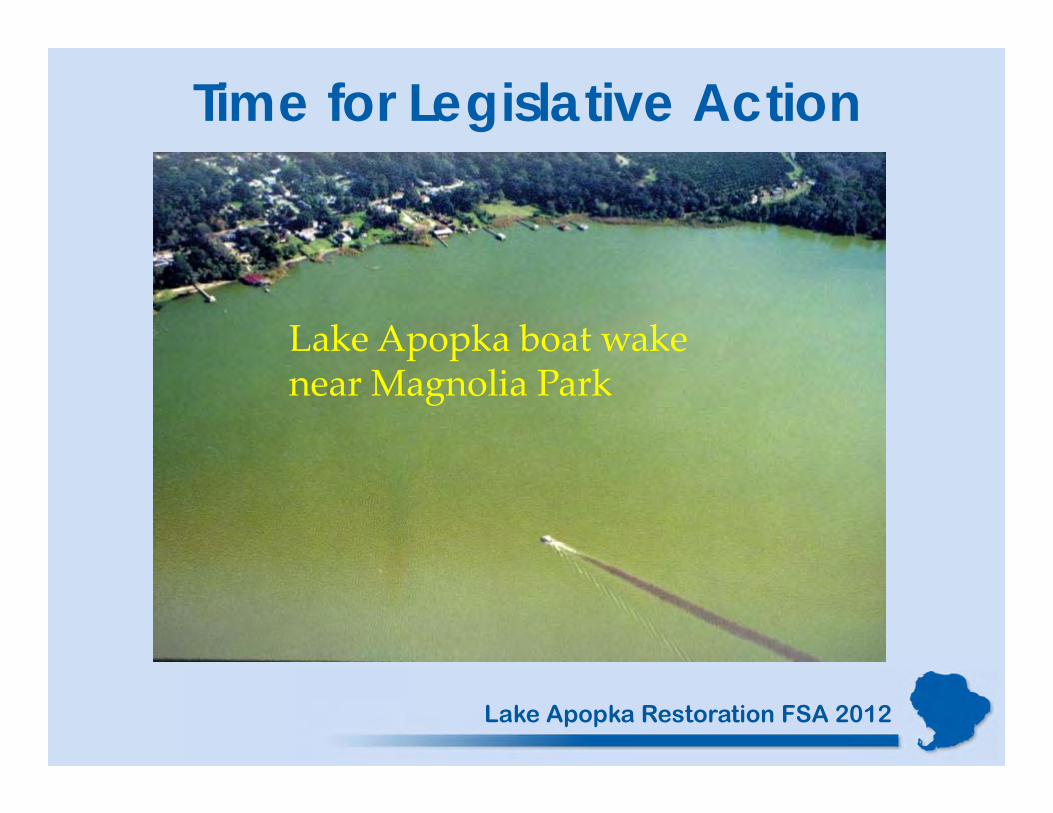
Time for Legislative Action
Lake Apopka boat wakenear Magnolia Park
Lake Apopka Restoration FSA 2012
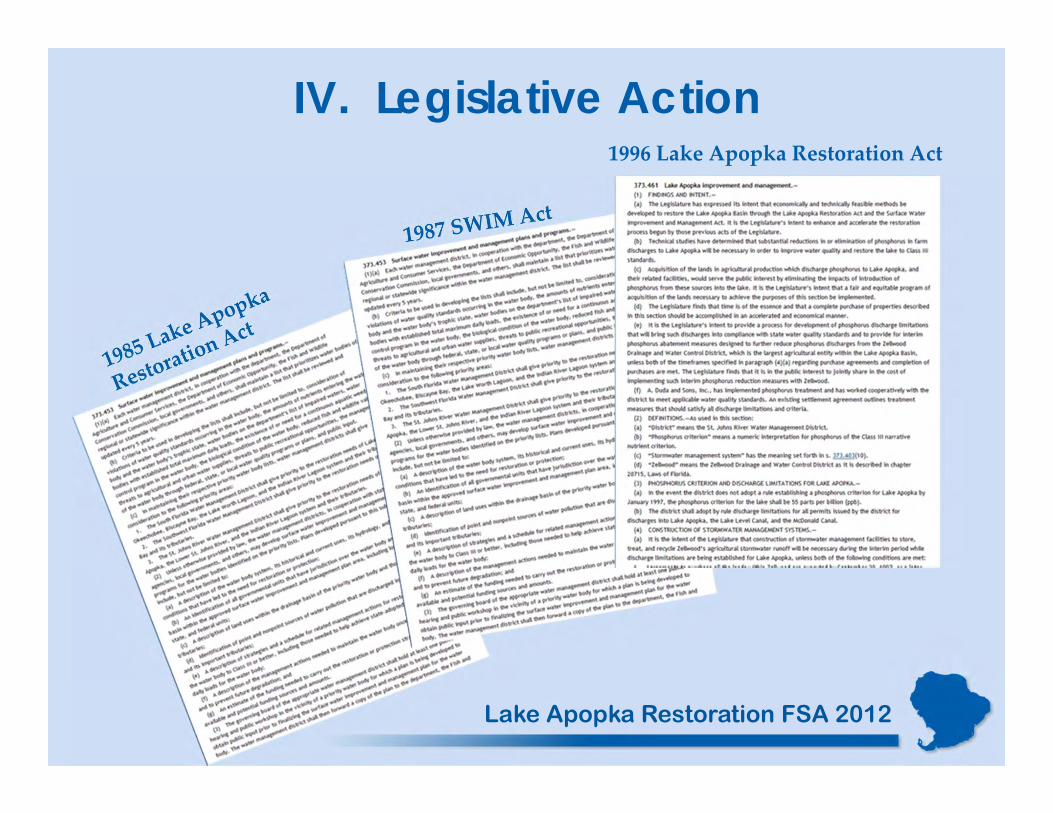
IV. Legislative Action 1996 Lake Apopka Restoration Act
Lake Apopka Restoration FSA 2012
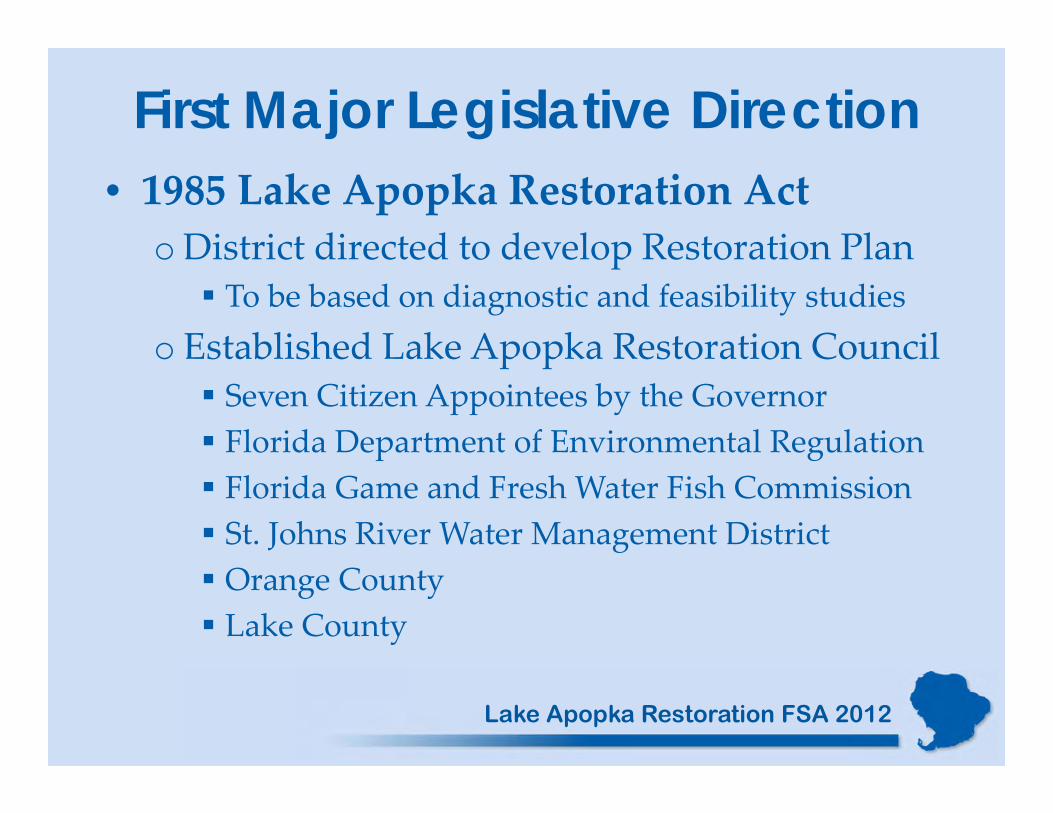
First Major Legislative Direction• 1985 Lake Apopka Restoration Act
oDistrict directed to develop Restoration Plan To be based on diagnostic and feasibility studies
o Established Lake Apopka Restoration Council Seven Citizen Appointees by the Governor Florida Department of Environmental Regulation Florida Game and Fresh Water Fish Commission St. Johns River Water Management District Orange County Lake County
Lake Apopka Restoration FSA 2012
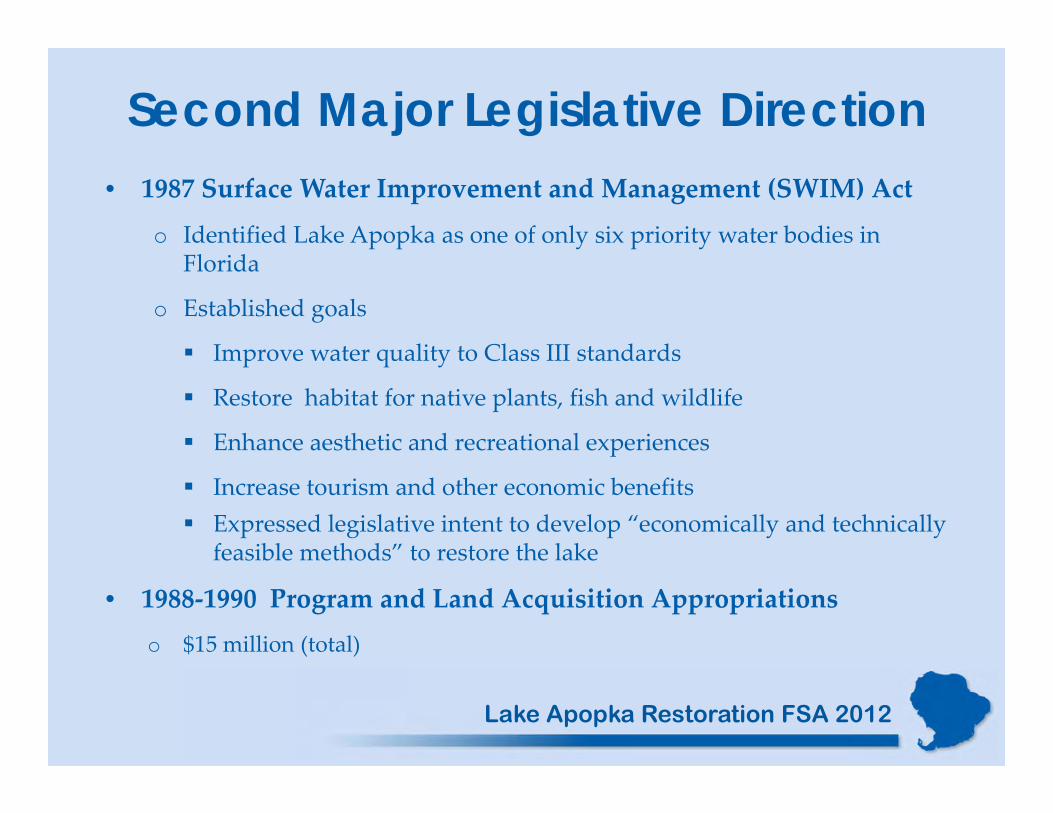
Second Major Legislative Direction• 1987 Surface Water Improvement and Management (SWIM) Act
o Identified Lake Apopka as one of only six priority water bodies in Florida
o Established goals
Improve water quality to Class III standards
Restore habitat for native plants, fish and wildlife
Enhance aesthetic and recreational experiences
Increase tourism and other economic benefits Expressed legislative intent to develop “economically and technically
feasible methods” to restore the lake
• 1988‐1990 Program and Land Acquisition Appropriationso $15 million (total)
Lake Apopka Restoration FSA 2012
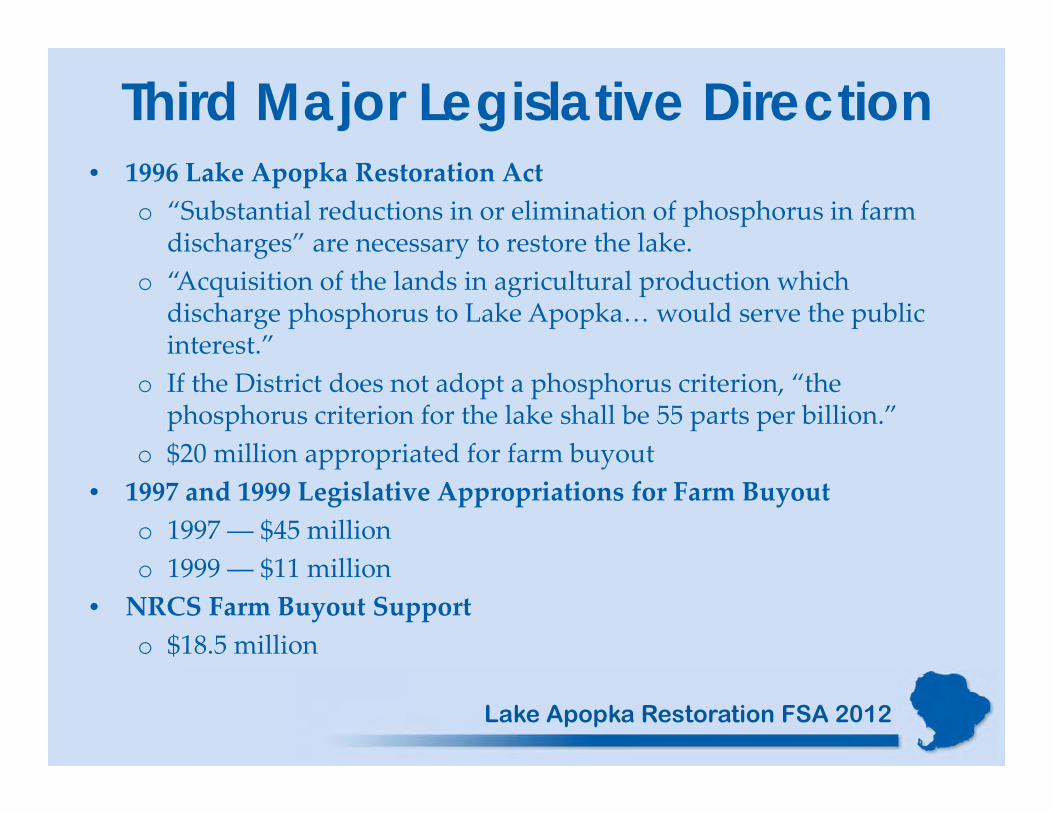
Third Major Legislative Direction• 1996 Lake Apopka Restoration Act
o “Substantial reductions in or elimination of phosphorus in farm discharges” are necessary to restore the lake.
o “Acquisition of the lands in agricultural production which discharge phosphorus to Lake Apopka… would serve the public interest.”
o If the District does not adopt a phosphorus criterion, “the phosphorus criterion for the lake shall be 55 parts per billion.”
o $20 million appropriated for farm buyout• 1997 and 1999 Legislative Appropriations for Farm Buyout
o 1997 ― $45 milliono 1999 ― $11 million
• NRCS Farm Buyout Supporto $18.5 million
Lake Apopka Restoration FSA 2012
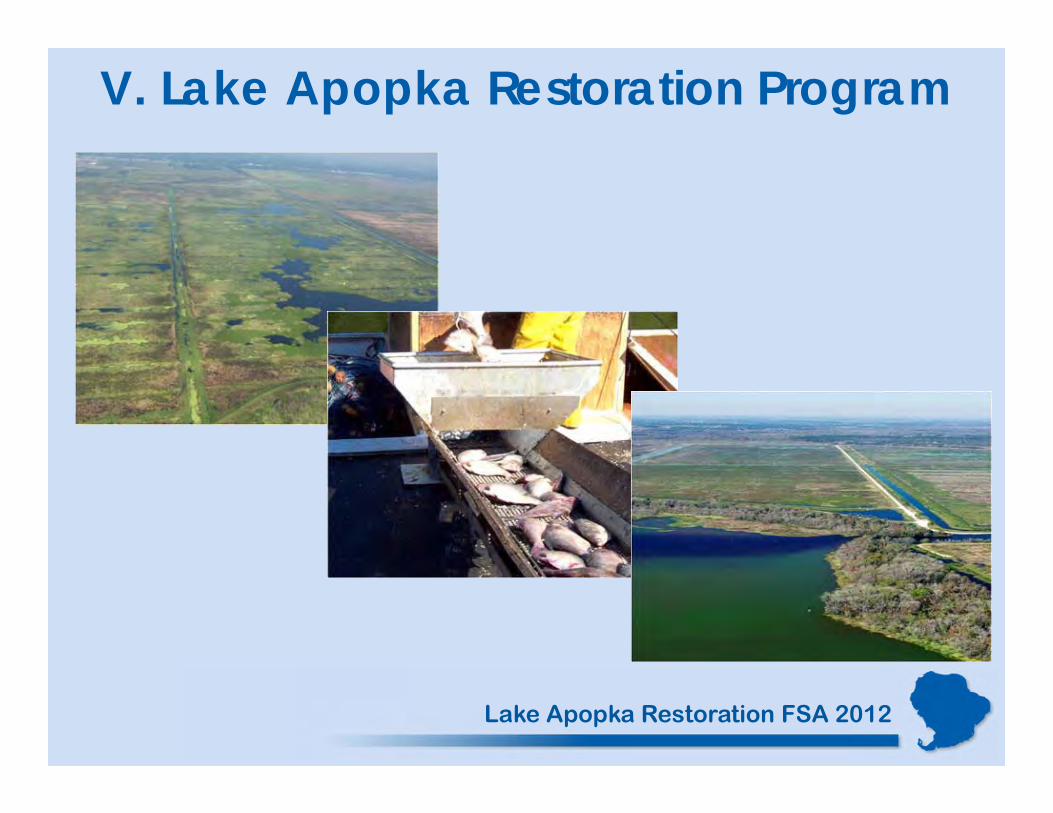
V. Lake Apopka Restoration Program
Lake Apopka Restoration FSA 2012
Diagnostic and Feasibility Studies were the Basis for the Restoration Program• Diagnostic studies – What causes the degraded condition of the lake?
• Feasibility studies – What approaches can cost‐effectively deal with the causes of degradation?
Lake Apopka Restoration FSA 2012
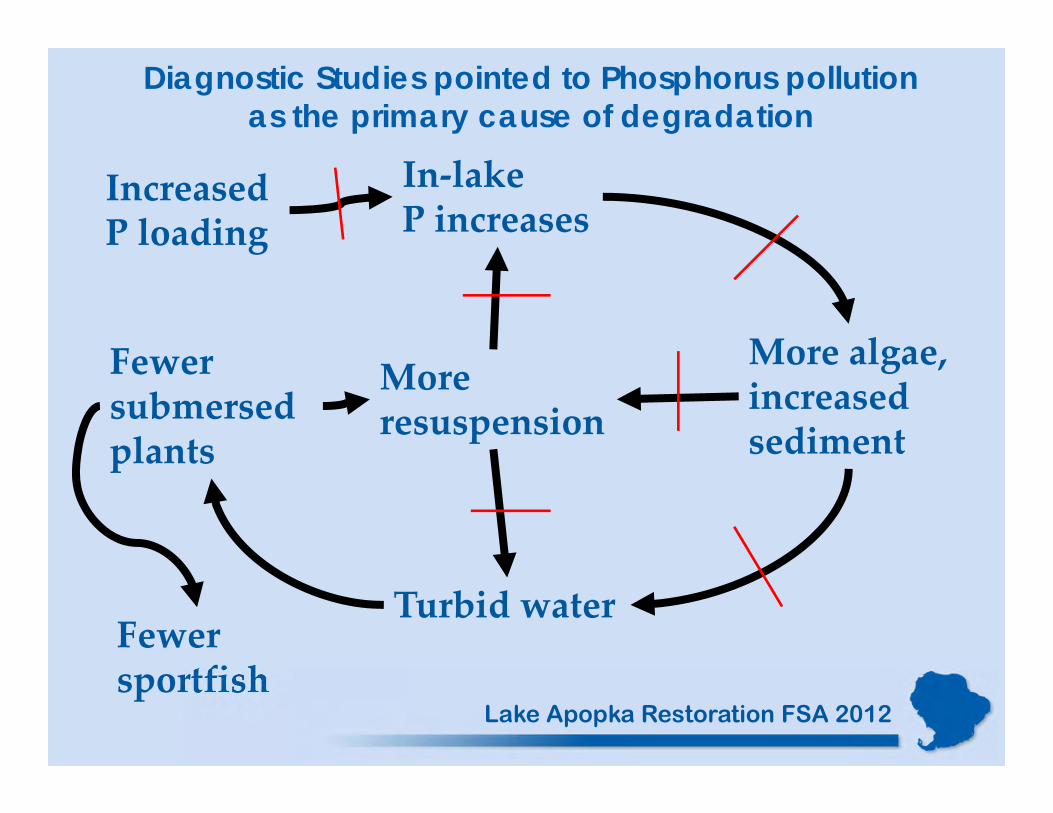
Diagnostic Studies pointed to Phosphorus pollution as the primary cause of degradation
In‐lake P increases
More algae,increased sediment
Turbid water
Fewersubmersed plants
Moreresuspension
Increased P loading
Fewer sportfish
Lake Apopka Restoration FSA 2012
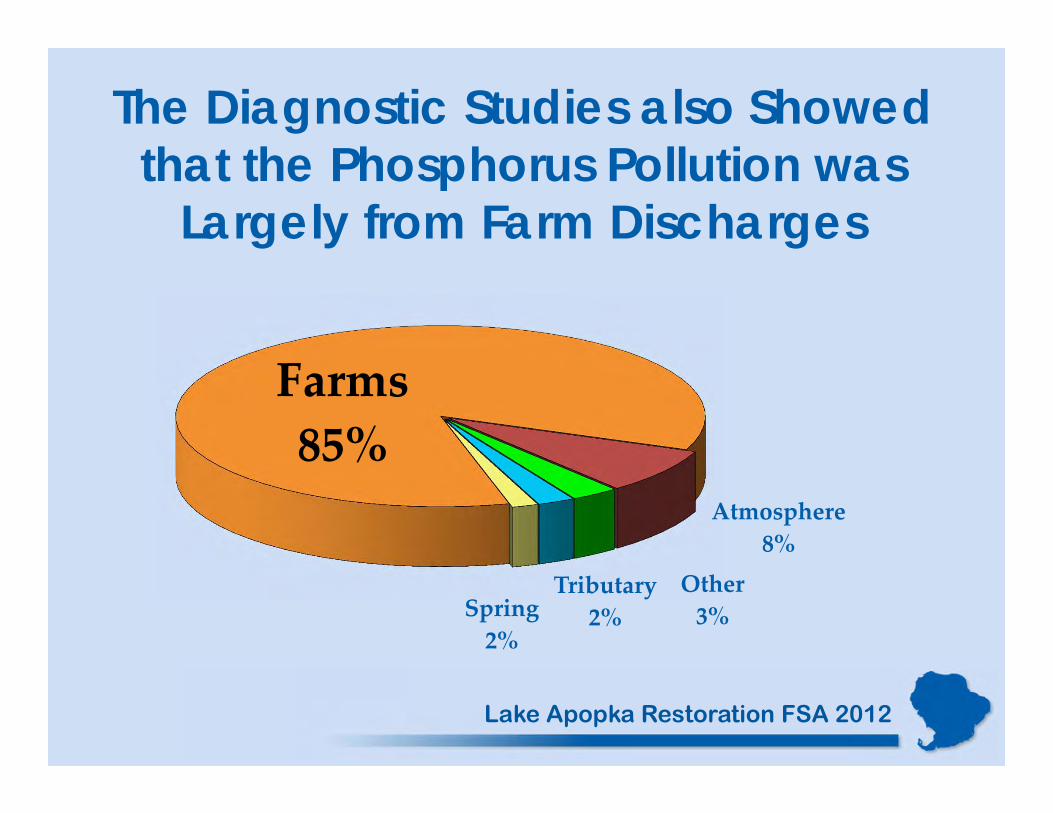
Farms85%
Atmosphere8%
Other3%
Tributary2%Spring
2%
The Diagnostic Studies also Showed that the Phosphorus Pollution was
Largely from Farm Discharges
Lake Apopka Restoration FSA 2012
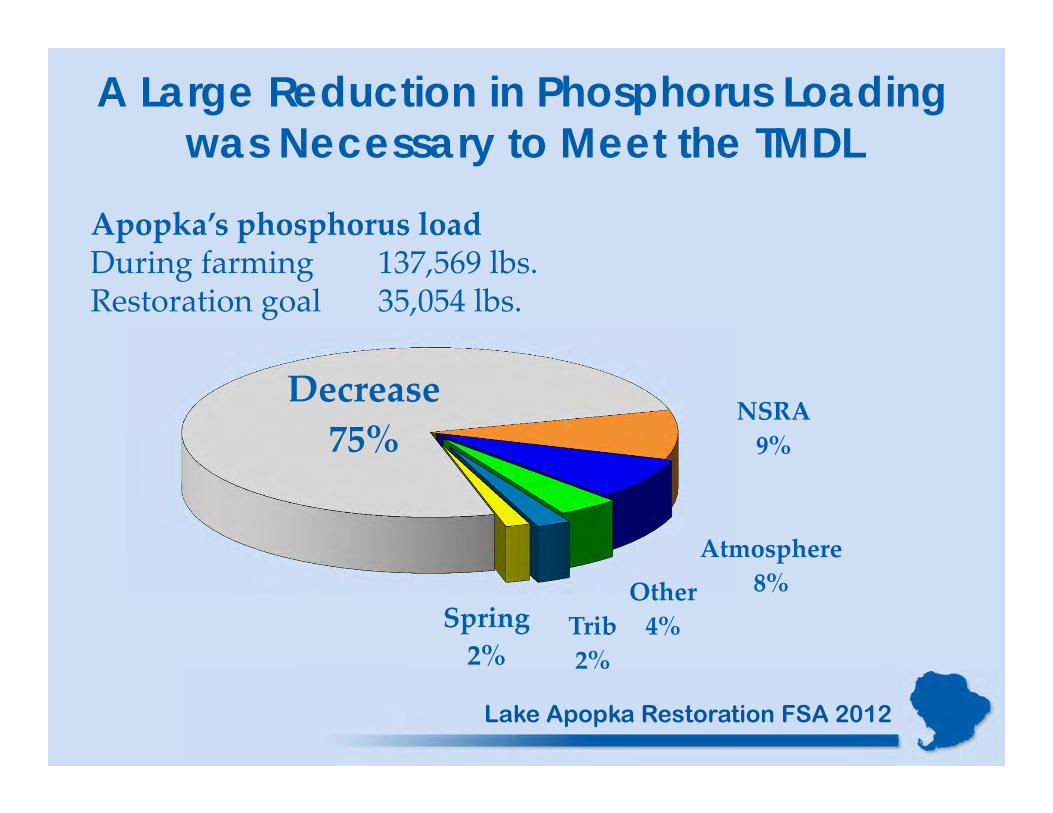
A Large Reduction in Phosphorus Loading was Necessary to Meet the TMDL
Apopka’s phosphorus load During farming 137,569 lbs.Restoration goal 35,054 lbs.
Decrease75%
NSRA9%
Atmosphere8%Other
4%Trib2%
Spring2%
Lake Apopka Restoration FSA 2012
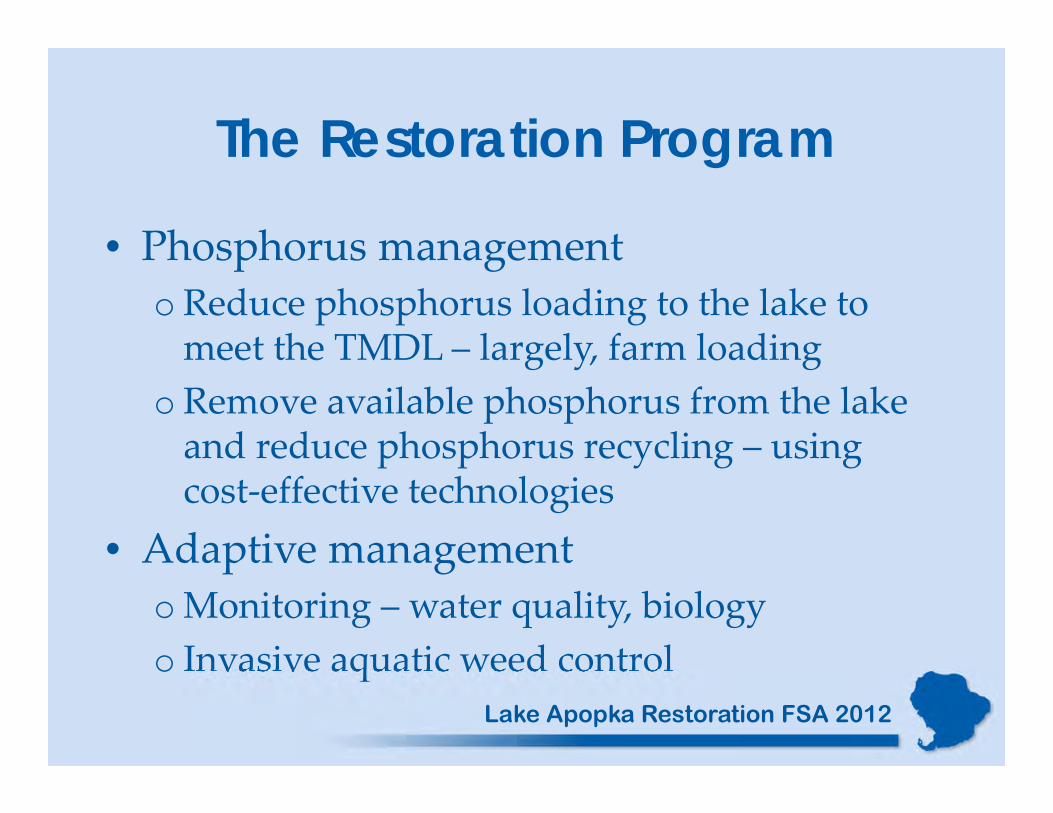
The Restoration Program
• Phosphorus managemento Reduce phosphorus loading to the lake to meet the TMDL – largely, farm loading
o Remove available phosphorus from the lake and reduce phosphorus recycling – using cost‐effective technologies
• Adaptive managementoMonitoring – water quality, biologyo Invasive aquatic weed control
Lake Apopka Restoration FSA 2012
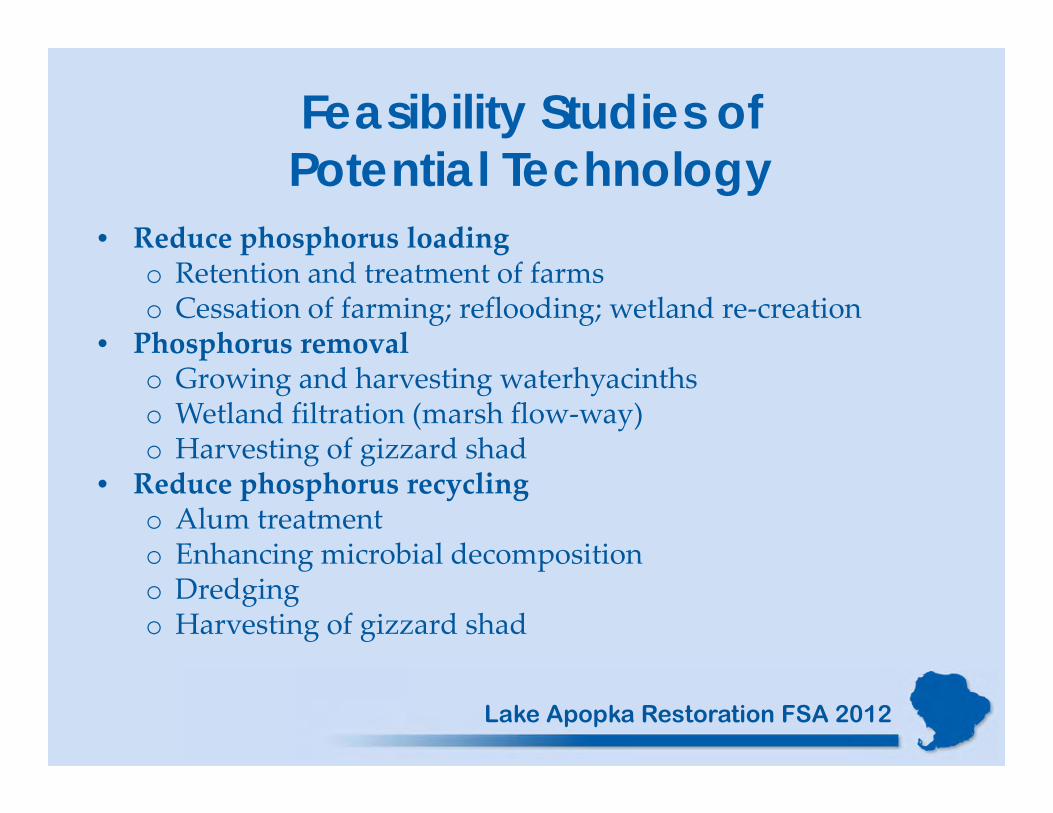
• Reduce phosphorus loadingo Retention and treatment of farmso Cessation of farming; reflooding; wetland re‐creation
• Phosphorus removalo Growing and harvesting waterhyacinthso Wetland filtration (marsh flow‐way)o Harvesting of gizzard shad
• Reduce phosphorus recyclingo Alum treatmento Enhancing microbial decompositiono Dredgingo Harvesting of gizzard shad
Feasibility Studies of Potential Technology
Lake Apopka Restoration FSA 2012
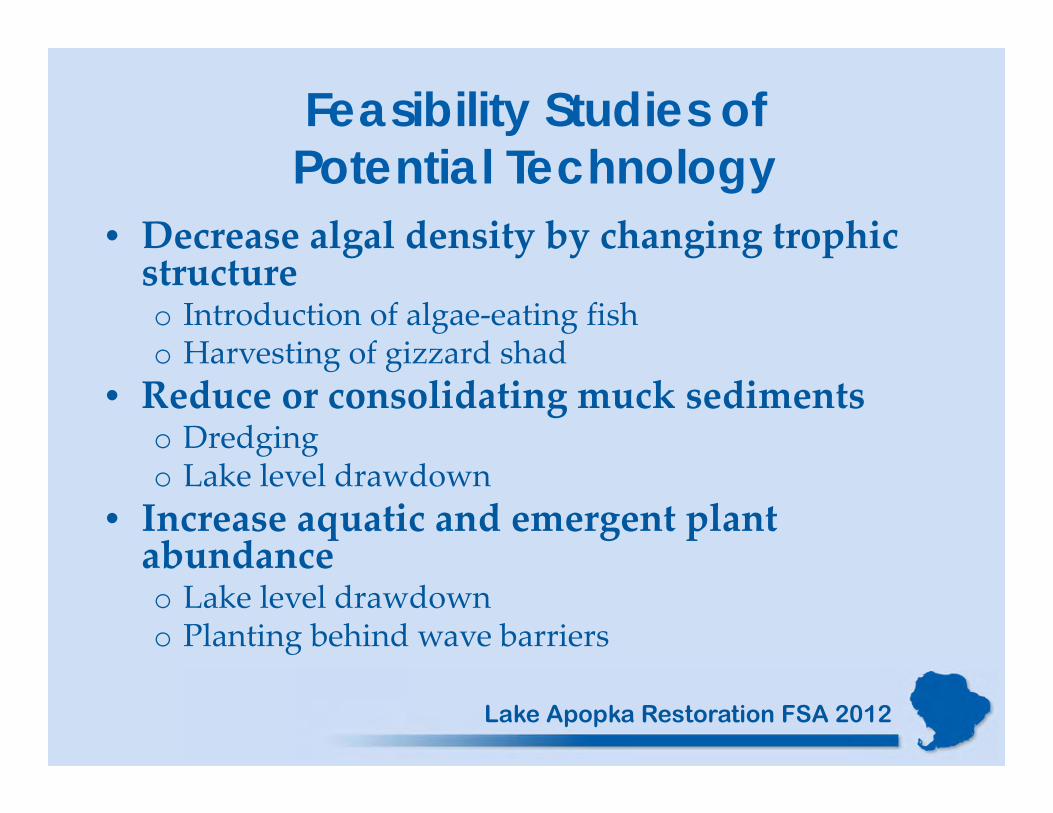
Feasibility Studies of Potential Technology
• Decrease algal density by changing trophicstructureo Introduction of algae‐eating fisho Harvesting of gizzard shad
• Reduce or consolidating muck sedimentso Dredgingo Lake level drawdown
• Increase aquatic and emergent plant abundanceo Lake level drawdowno Planting behind wave barriers
Lake Apopka Restoration FSA 2012
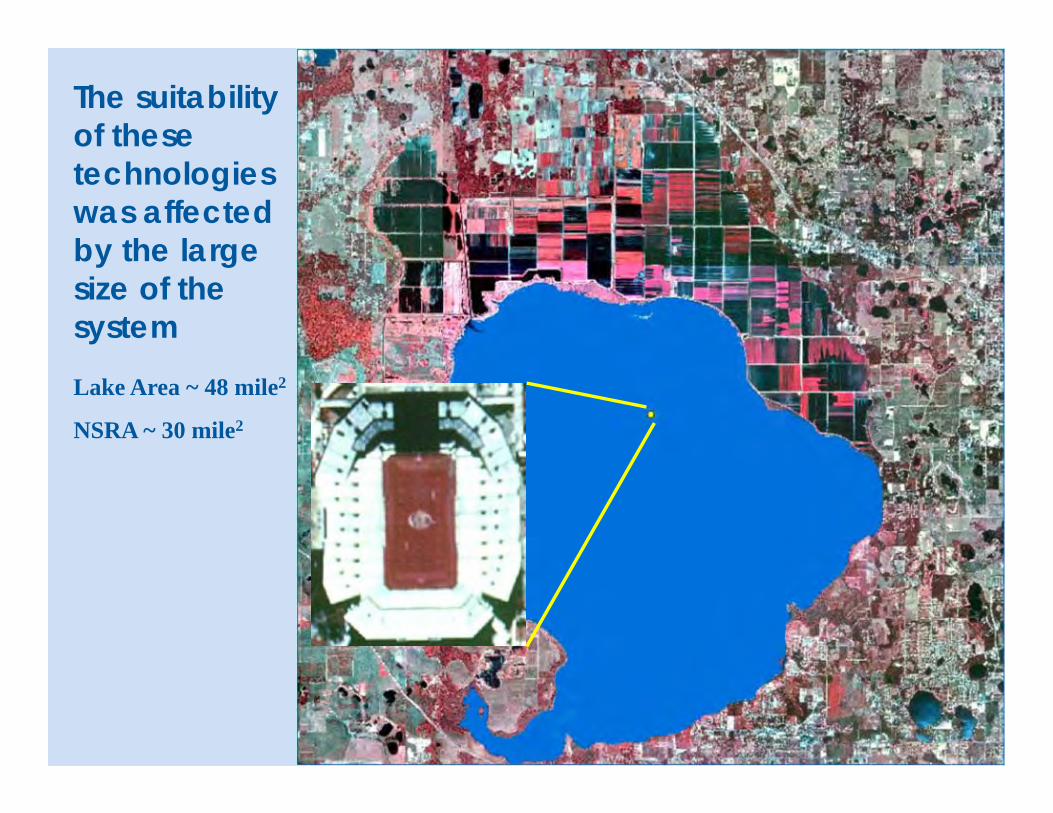
Lake Area ~ 48 mile2
NSRA ~ 30 mile2
The suitability of these technologies was affected by the large size of the system

The restoration plan is based on the findings of the feasibility studies
Technology Logistically Feasible?
Effective? Estimated or Actual Cost
Treatment of discharge water
Yes Yes NA
Conversion of farms to wetlands
Yes Yes $116 million
Growing and harvesting hyacinths
No NA NA
Wetland filtration Yes Yes $13.2 millionHarvesting shad Yes Yes $5.9 millionLake level drawdown Yes Uncertain $0.4 –23 millionAlum treatment of lake Yes Uncertain $16.8 million Microbial enhancement Yes No NAWhole‐lake dredging Yes Yes, after load
reduction$800 million
Introducing algae‐eating fish
Yes No NA
Planting behind barriers Yes Yes 0.7 M
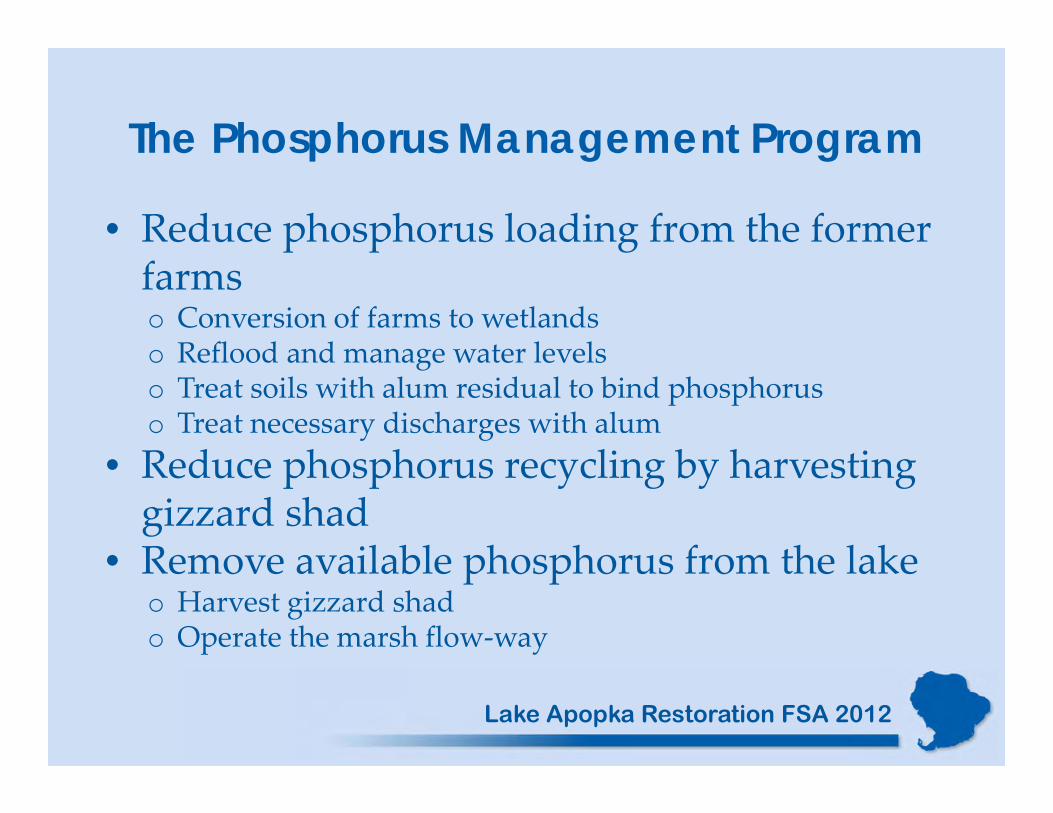
The Phosphorus Management Program
• Reduce phosphorus loading from the former farmso Conversion of farms to wetlandso Reflood and manage water levelso Treat soils with alum residual to bind phosphoruso Treat necessary discharges with alum
• Reduce phosphorus recycling by harvesting gizzard shad
• Remove available phosphorus from the lakeo Harvest gizzard shad o Operate the marsh flow‐way
Lake Apopka Restoration FSA 2012
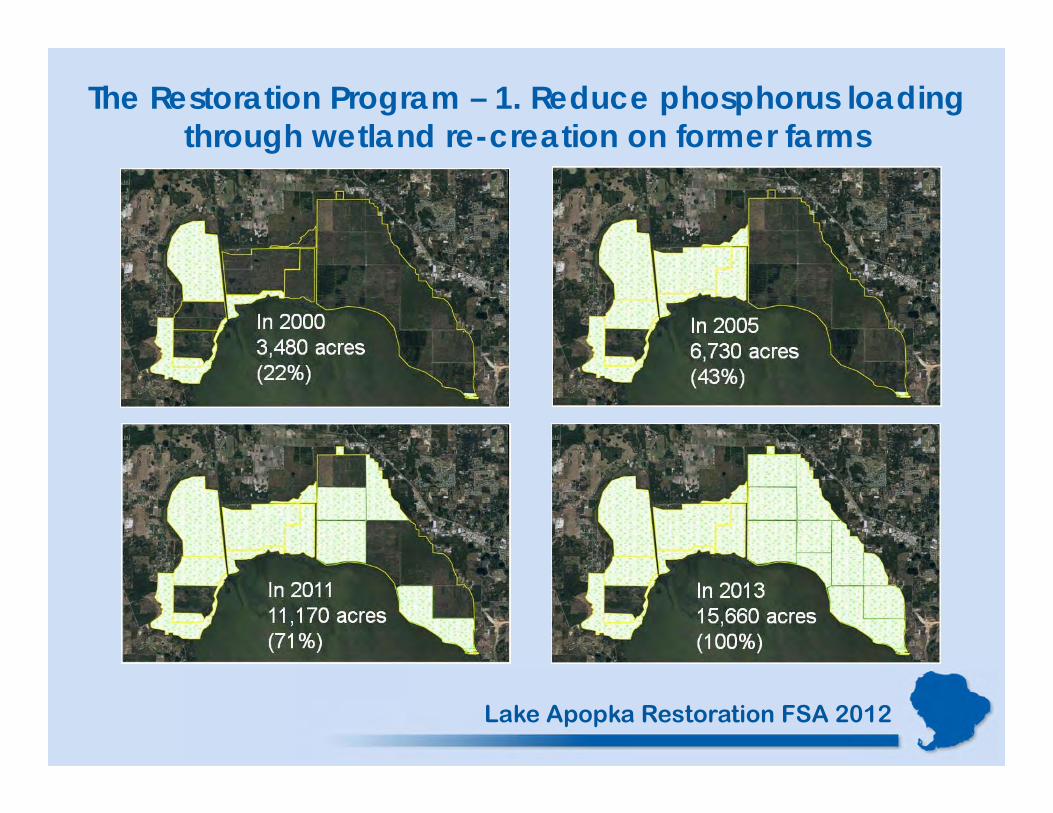
The Restoration Program – 1. Reduce phosphorus loading through wetland re-creation on former farms
Lake Apopka Restoration FSA 2012
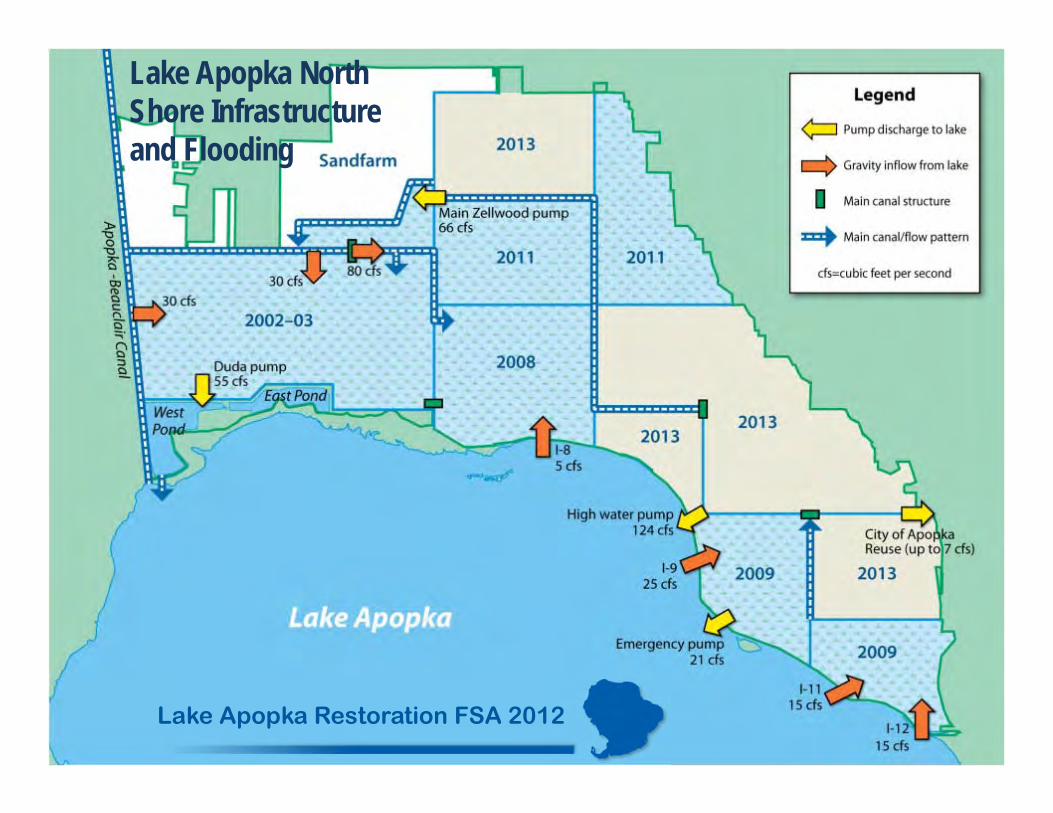
Lake Apopka North Shore Infrastructure and Flooding
Lake Apopka Restoration FSA 2012
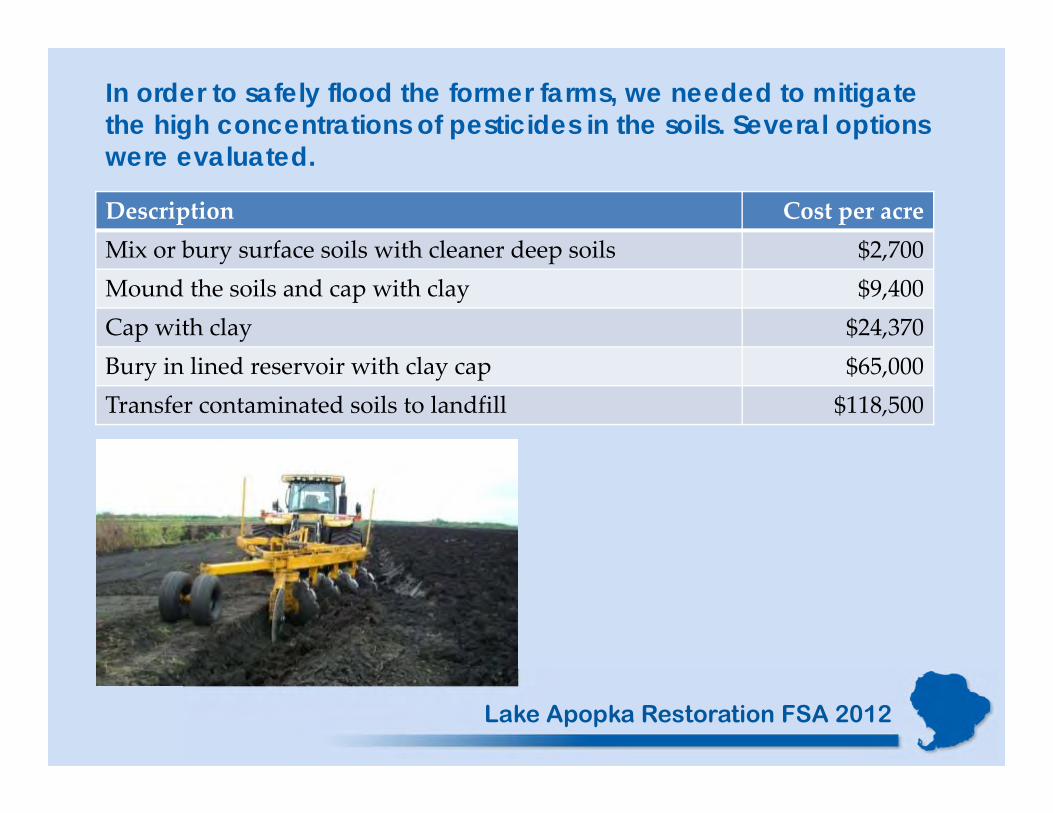
In order to safely flood the former farms, we needed to mitigate the high concentrations of pesticides in the soils. Several options were evaluated.
Description Cost per acreMix or bury surface soils with cleaner deep soils $2,700Mound the soils and cap with clay $9,400Cap with clay $24,370Bury in lined reservoir with clay cap $65,000Transfer contaminated soils to landfill $118,500
Lake Apopka Restoration FSA 2012

• Between 2003–2007, the average annual harvest was about 1.3 million pounds• Now the annual harvest is lower ― 2011 estimated at about 650,000 pounds • Public‐private partnership ― partly funded by private profi ts• Directly supports private‐sector jobs
The Restoration Program – 2. Reduce recycling of phosphorus in the lake by large-scale harvesting of gizzard shad
Lake Apopka Restoration FSA 2012
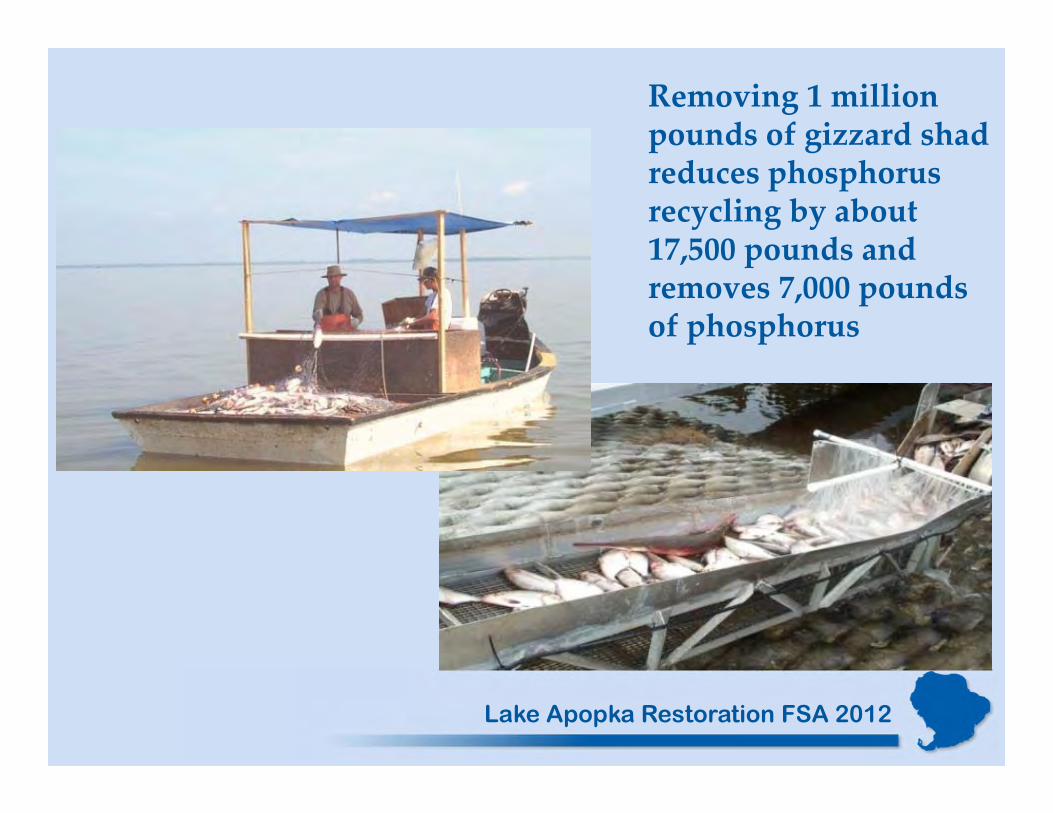
Removing 1 million pounds of gizzard shad reduces phosphorus recycling by about 17,500 pounds and removes 7,000 pounds of phosphorus
Lake Apopka Restoration FSA 2012
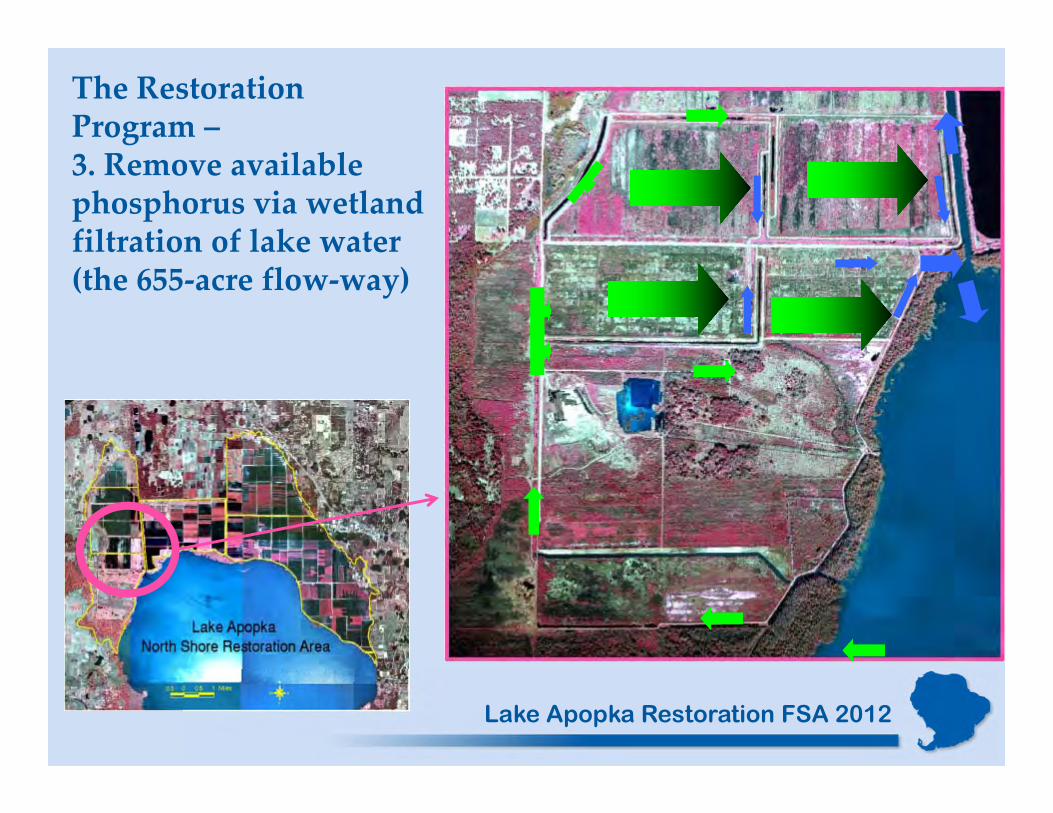
The Restoration Program –3. Remove available phosphorus via wetland filtration of lake water (the 655‐acre flow‐way)
Lake Apopka Restoration FSA 2012
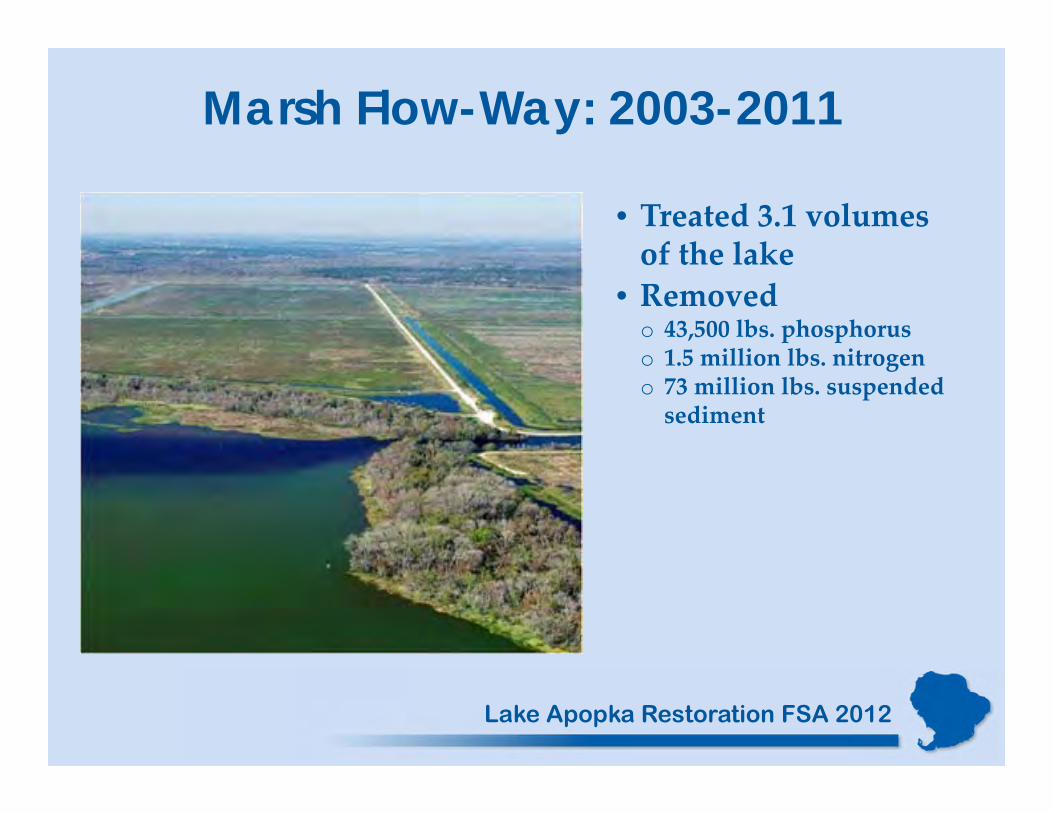
Marsh Flow-Way: 2003-2011
• Treated 3.1 volumes of the lake
• Removedo 43,500 lbs. phosphoruso 1.5 million lbs. nitrogeno 73 million lbs. suspended sediment
Lake Apopka Restoration FSA 2012
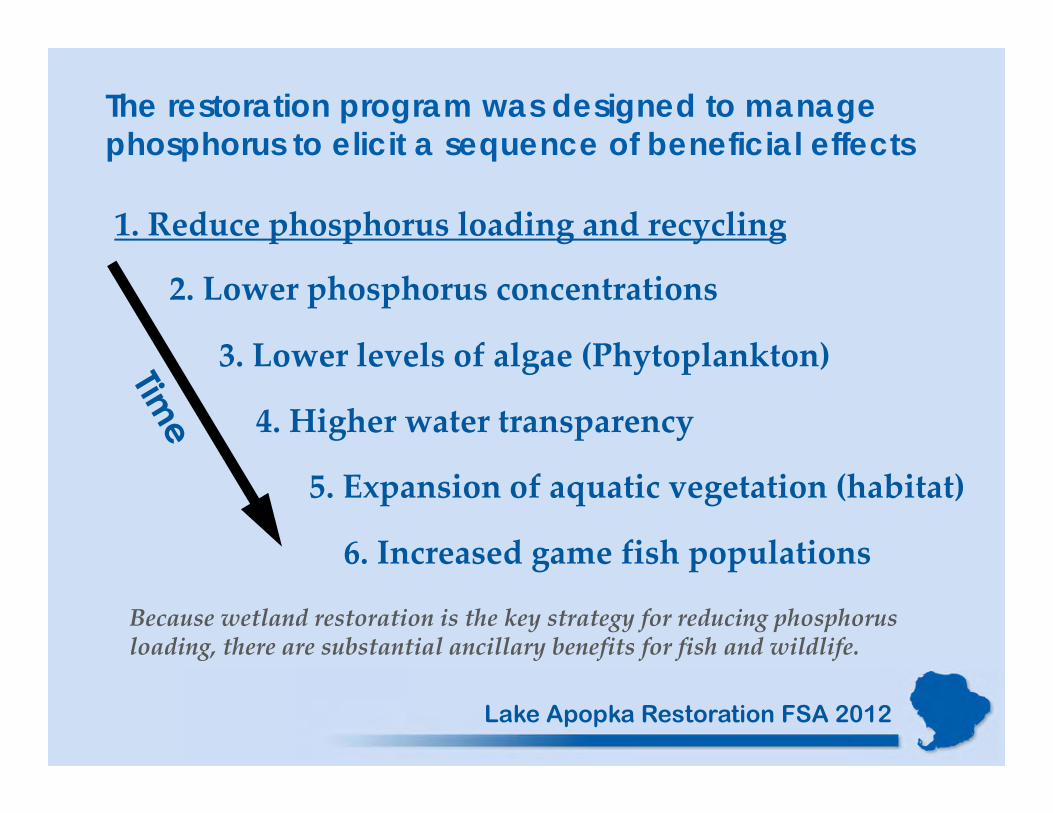
1. Reduce phosphorus loading and recycling
2. Lower phosphorus concentrations
3. Lower levels of algae (Phytoplankton)
4. Higher water transparency
5. Expansion of aquatic vegetation (habitat)
6. Increased game fish populations
The restoration program was designed to manage phosphorus to elicit a sequence of beneficial effects
Because wetland restoration is the key strategy for reducing phosphorus loading, there are substantial ancillary benefits for fish and wildlife.
Lake Apopka Restoration FSA 2012

1. Reduce Phosphorus Loading –Progress has Been Substantial
Year
19701980
19891992
19951998
20012004
20072010
P Lo
ad m
etric
tons
0
20
40
60
80
100
120
140Ag LandsAtmosphereOther
19-Yr Avg1968 - 87
*
*2011 Estimated
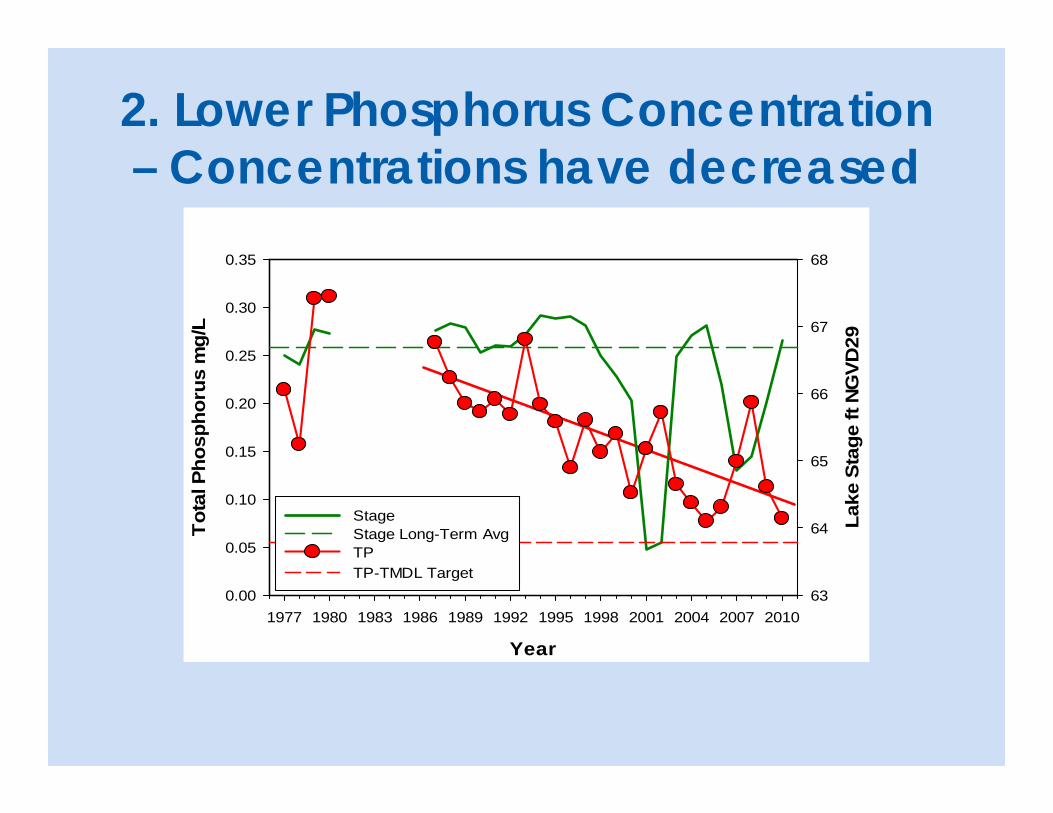
2. Lower Phosphorus Concentration – Concentrations have decreased
Year
1977 1980 1983 1986 1989 1992 1995 1998 2001 2004 2007 2010
Tota
l Pho
spho
rus
mg/
L
0.00
0.05
0.10
0.15
0.20
0.25
0.30
0.35
Lake
Sta
ge ft
NG
VD29
63
64
65
66
67
68
Stage Stage Long-Term AvgTP TP-TMDL Target
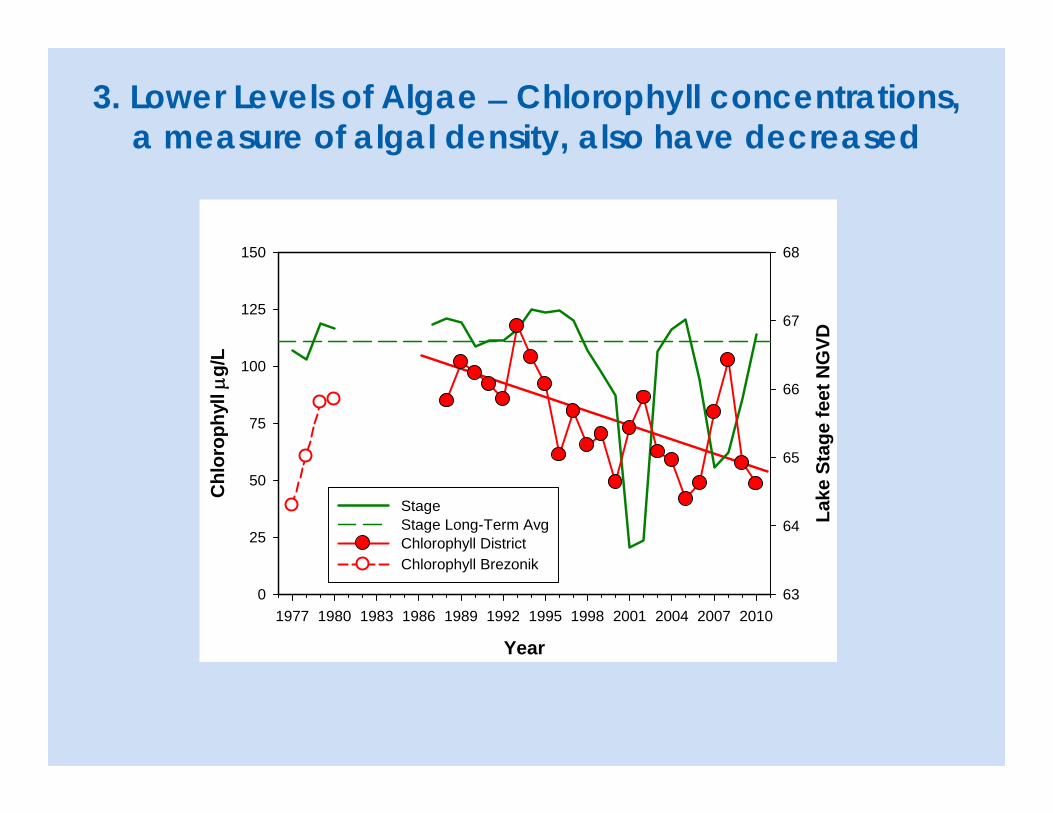
3. Lower Levels of Algae ̶ Chlorophyll concentrations, a measure of algal density, also have decreased
Year
1977 1980 1983 1986 1989 1992 1995 1998 2001 2004 2007 2010
Chl
orop
hyll g
/L
0
25
50
75
100
125
150
Lake
Sta
ge fe
et N
GVD
63
64
65
66
67
68
Stage Stage Long-Term AvgChlorophyll DistrictChlorophyll Brezonik
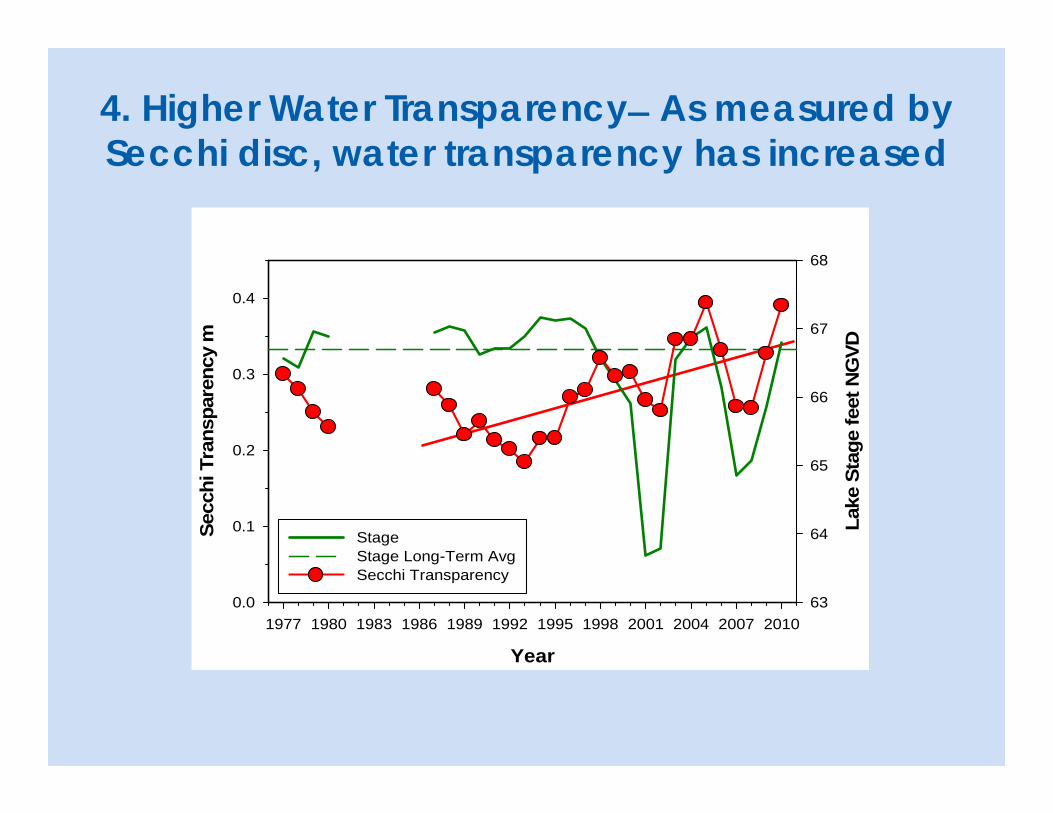
4. Higher Water Transparency ̶ As measured by Secchi disc, water transparency has increased
Year
1977 1980 1983 1986 1989 1992 1995 1998 2001 2004 2007 2010
Secc
hi T
rans
pare
ncy
m
0.0
0.1
0.2
0.3
0.4
Lake
Sta
ge fe
et N
GVD
63
64
65
66
67
68
Stage Stage Long-Term AvgSecchi Transparency

5. Expansion of Aquatic Vegetation –Significant Progress
0
10
20
30
40
50
60
1997 2000 2003 2006 2007 2008 2009 2011
Acr
es
Drought 2001-02
Drought 2007-08
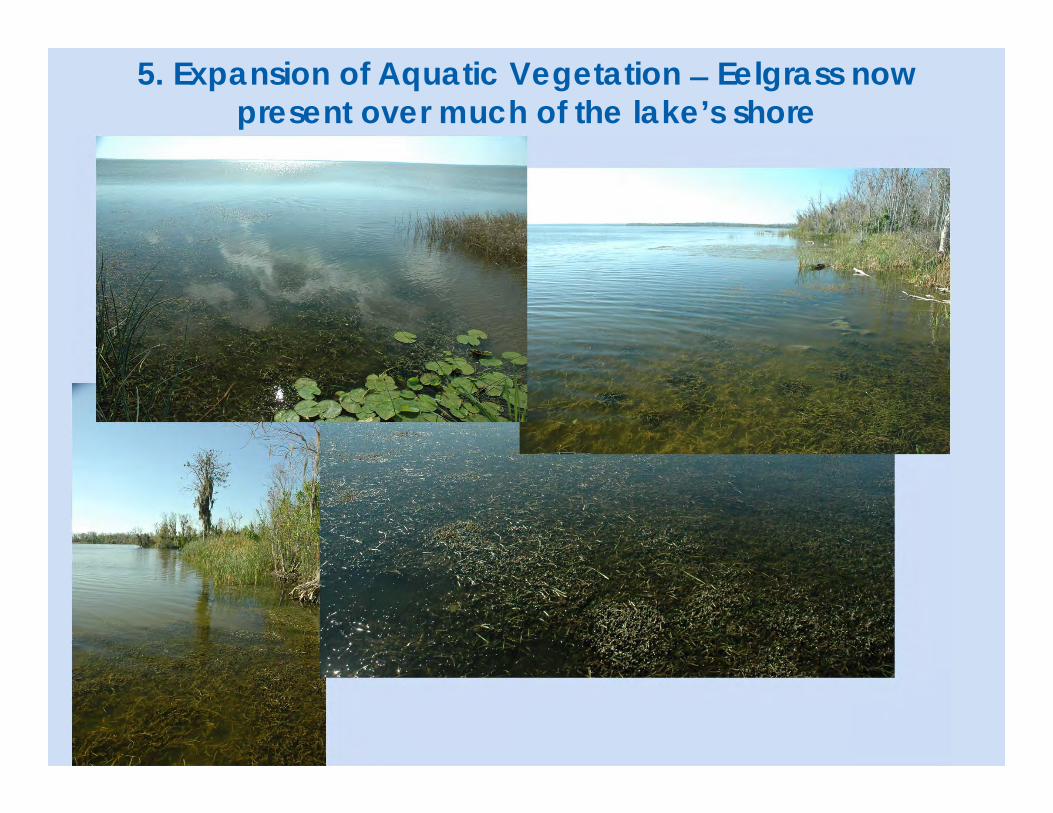
5. Expansion of Aquatic Vegetation ̶ Eelgrass now present over much of the lake’s shore
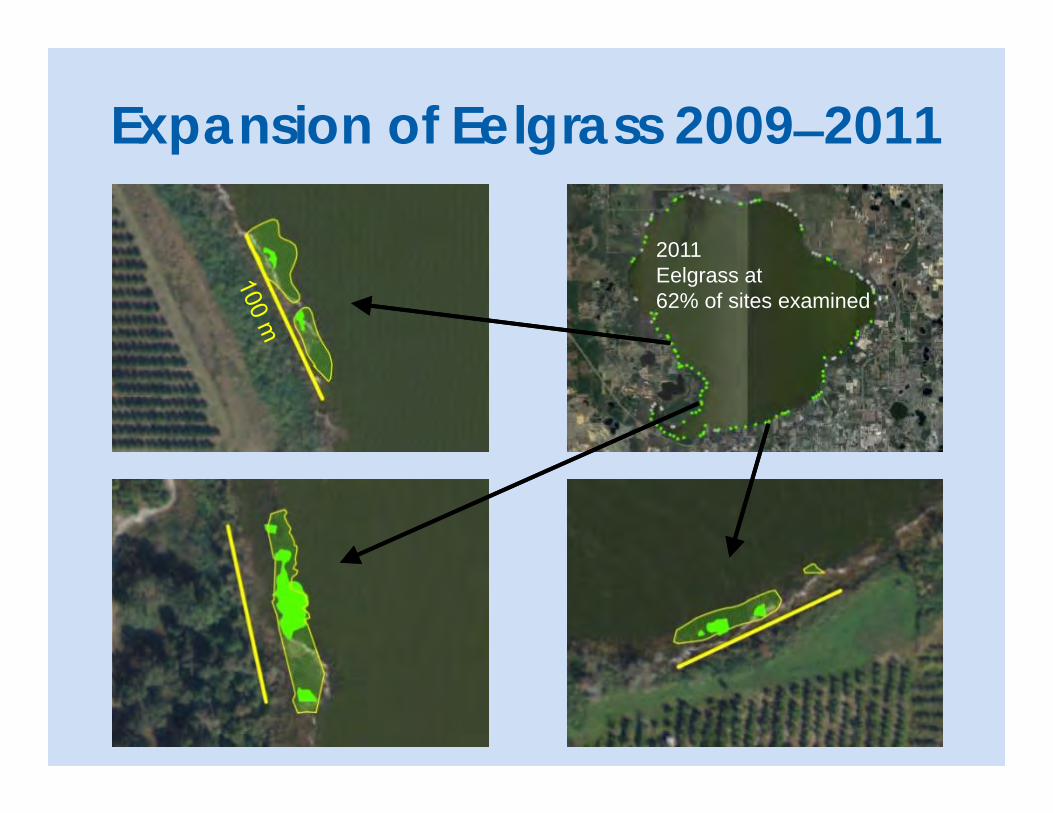
Expansion of Eelgrass 2009 ̶ 2011
2011Eelgrass at62% of sites examined
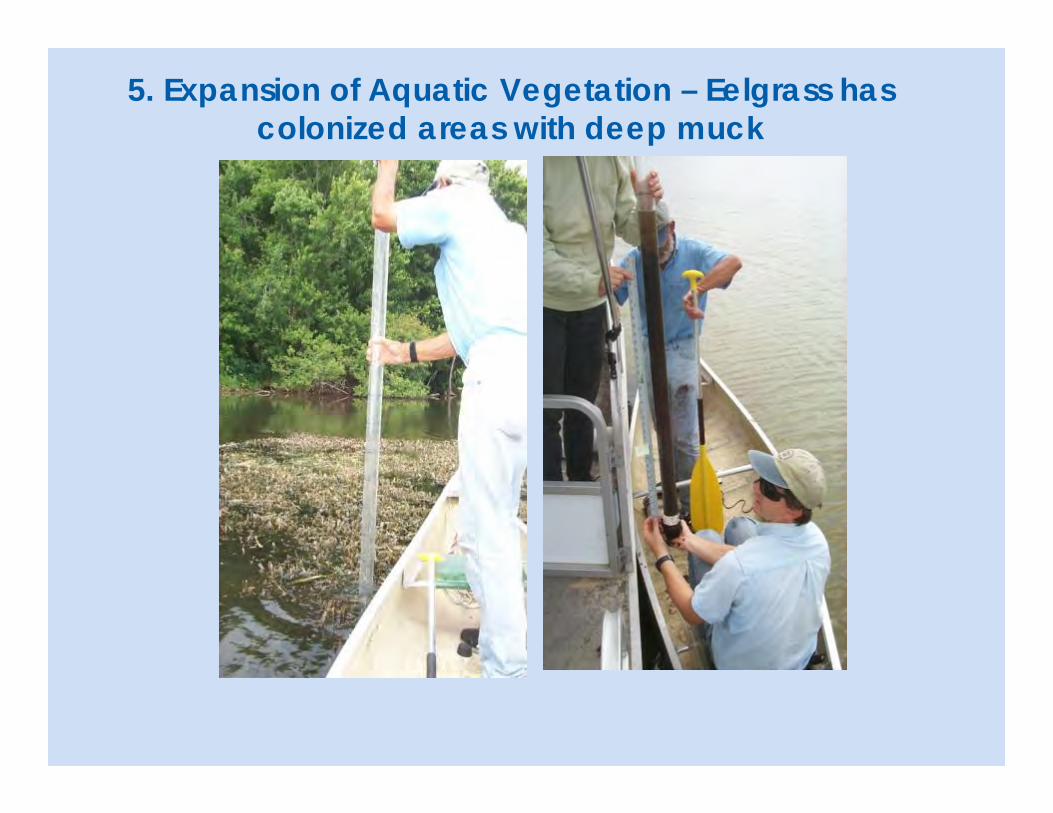
5. Expansion of Aquatic Vegetation – Eelgrass has colonized areas with deep muck
6. Increased Game Fish Populations
• Some indications of progress• No monitoring data for fish populations• In Lake Griffin, where a similar program is further along, game fish populations have improved substantially in recent years
Lake Apopka Restoration FSA 2012
Important Ancillary Benefits
• Improved flood control• Alternative water source• Potential for better management of lake levels and improved low flow discharges
• Wetland re‐creation• Benefits for populations of fish and wildlife
• Potential for ecotourism
Lake Apopka Restoration FSA 2012
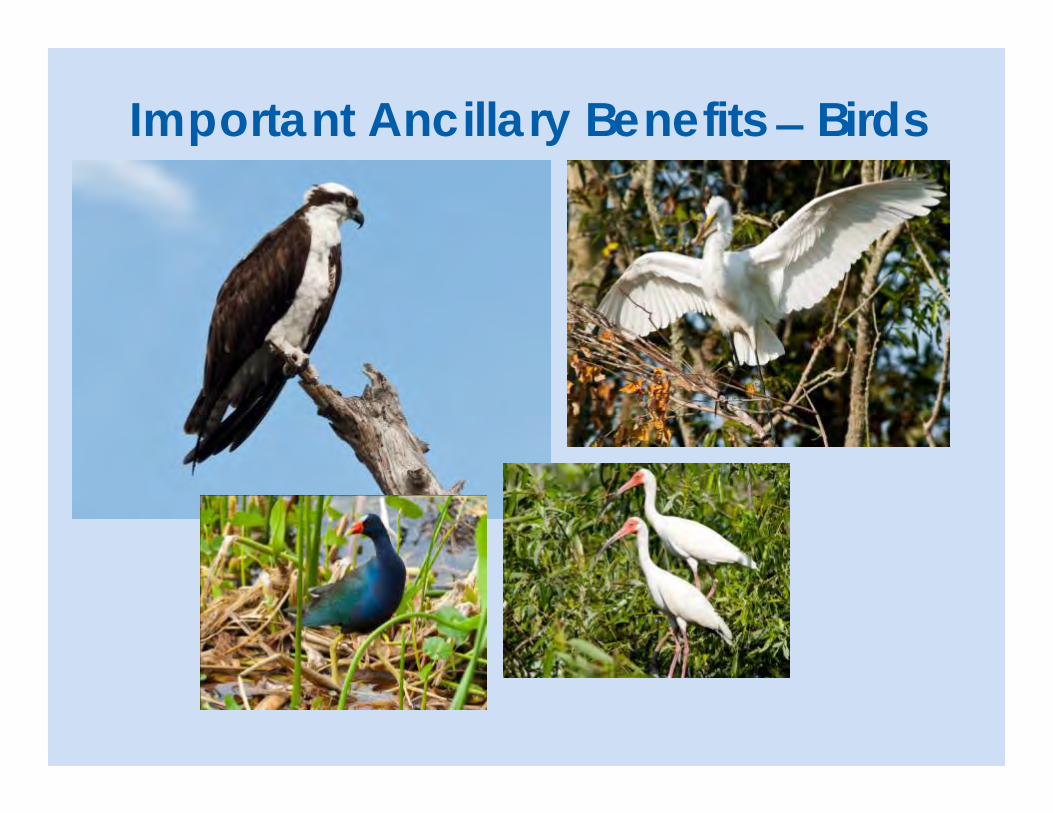
Important Ancillary Benefits ̶ Birds

Important Ancillary Benefits ̶ Ecotourism potential similar to Merritt Island, St. Marks, and Ding Darling
national wildlife refuges
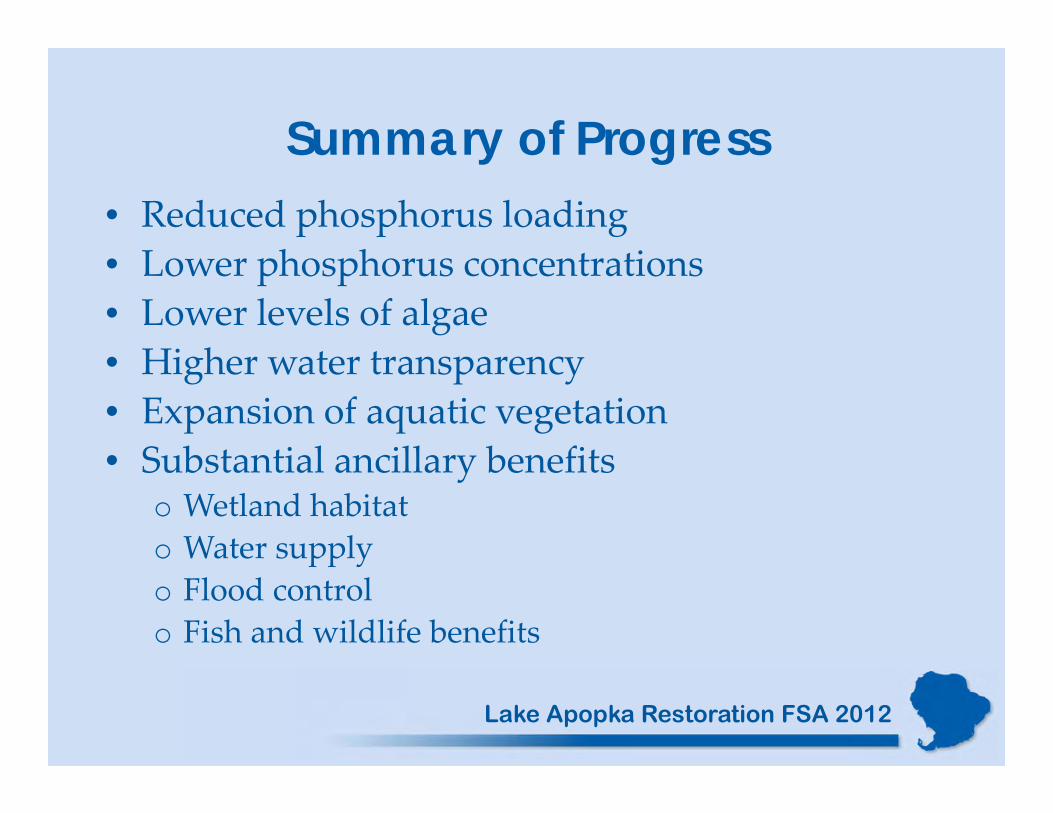
Summary of Progress• Reduced phosphorus loading• Lower phosphorus concentrations• Lower levels of algae• Higher water transparency• Expansion of aquatic vegetation• Substantial ancillary benefits
o Wetland habitato Water supplyo Flood controlo Fish and wildlife benefits
Lake Apopka Restoration FSA 2012
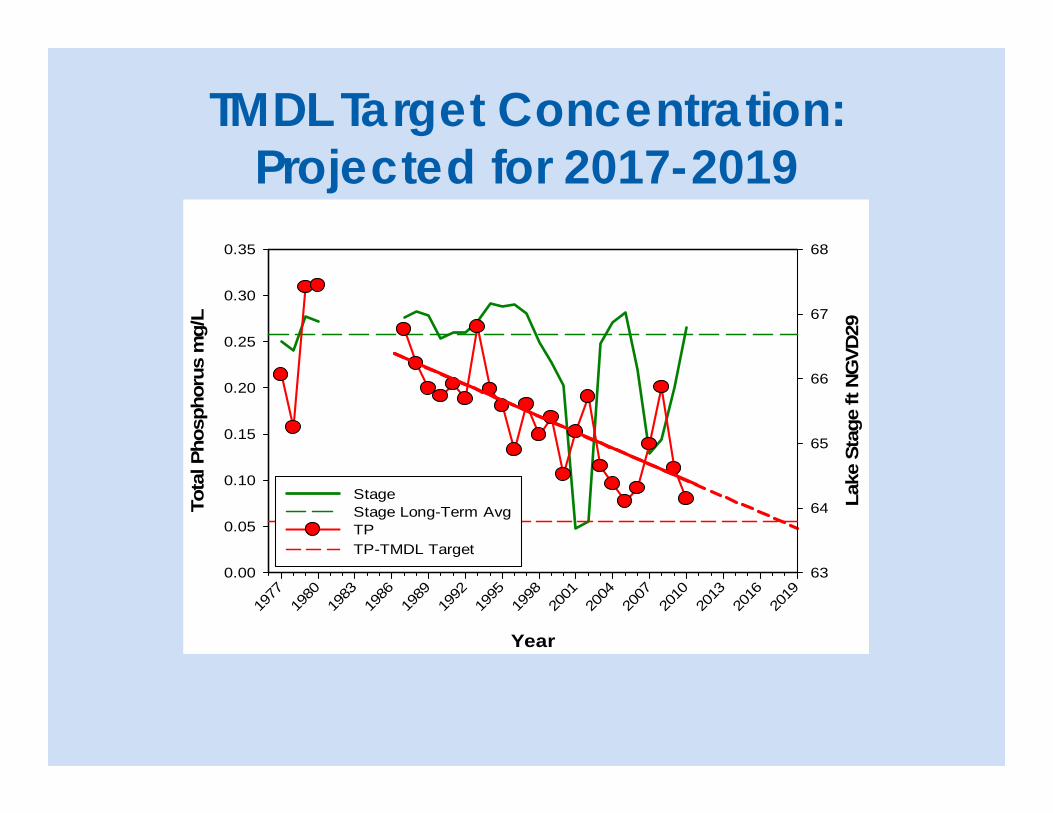
TMDL Target Concentration:Projected for 2017-2019
Year
1977
1980
1983
1986
1989
1992
1995
1998
2001
2004
2007
2010
2013
2016
2019
Tota
l Pho
spho
rus
mg/
L
0.00
0.05
0.10
0.15
0.20
0.25
0.30
0.35
Lake
Sta
ge ft
NG
VD29
63
64
65
66
67
68
Stage Stage Long-Term AvgTP TP-TMDL Target
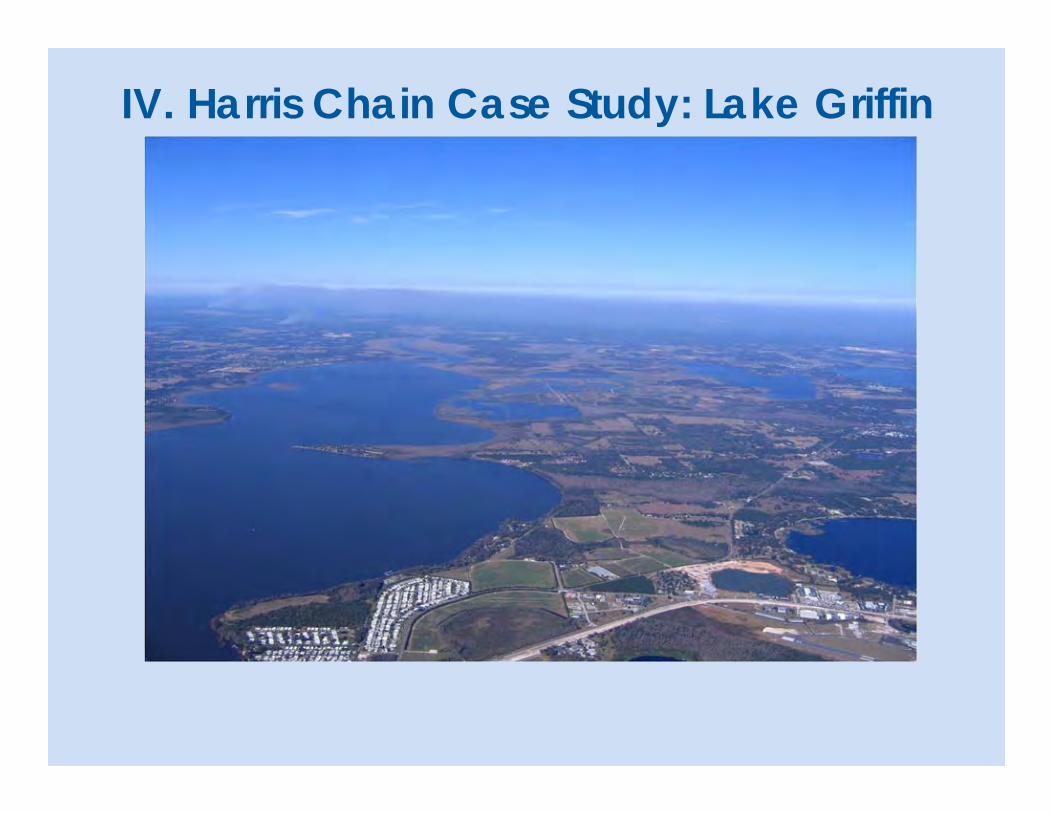
IV. Harris Chain Case Study: Lake Griffin
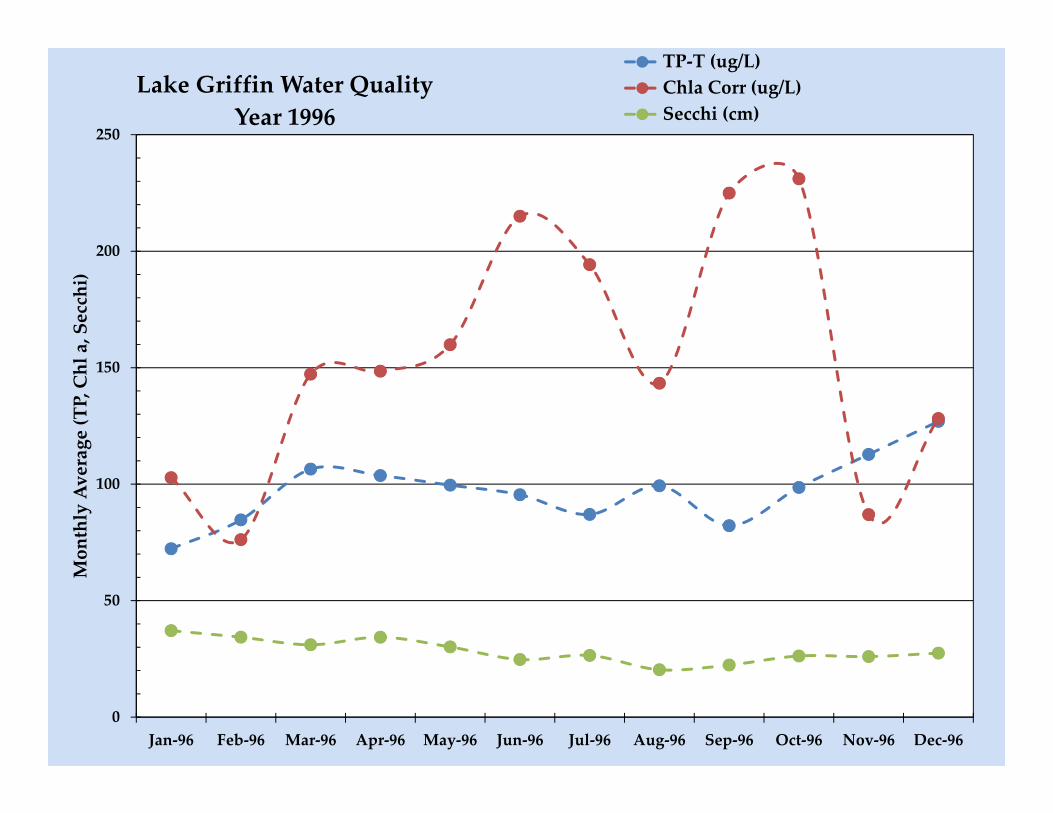
0
50
100
150
200
250
Jan‐96 Feb‐96 Mar‐96 Apr‐96 May‐96 Jun‐96 Jul‐96 Aug‐96 Sep‐96 Oct‐96 Nov‐96 Dec‐96
Monthly Average (TP, Chla, Secchi)
Lake Griffin Water QualityYear 1996
TP‐T (ug/L)Chla Corr (ug/L)Secchi (cm)
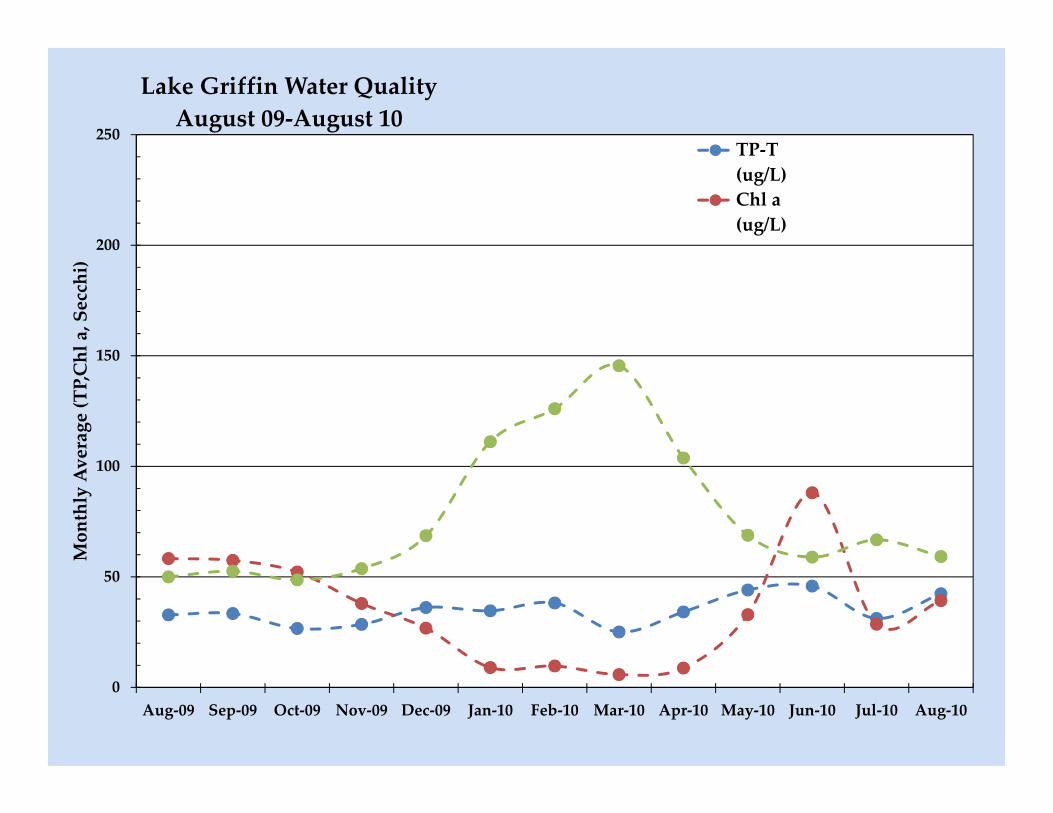
0
50
100
150
200
250
Aug‐09 Sep‐09 Oct‐09 Nov‐09 Dec‐09 Jan‐10 Feb‐10 Mar‐10 Apr‐10 May‐10 Jun‐10 Jul‐10 Aug‐10
Monthly Average (TP,Chl a, Secchi)
Lake Griffin Water QualityAugust 09‐August 10
TP‐T(ug/L)Chl a(ug/L)
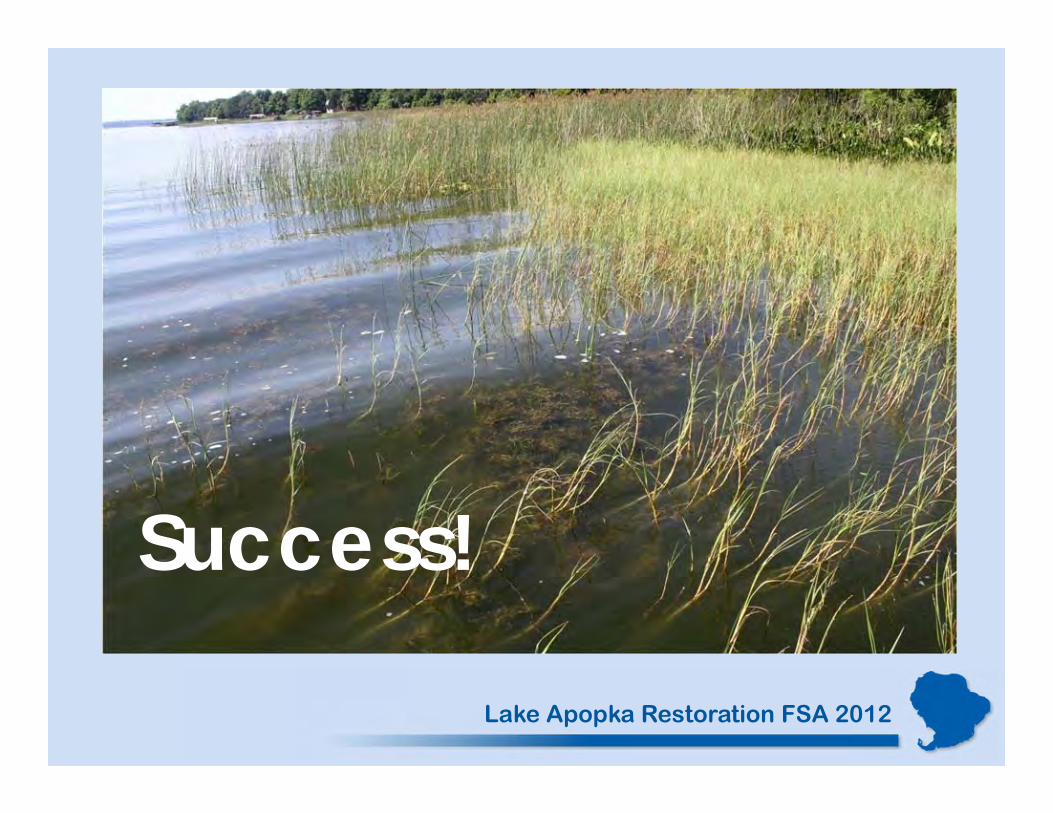
Success!
Lake Apopka Restoration FSA 2012
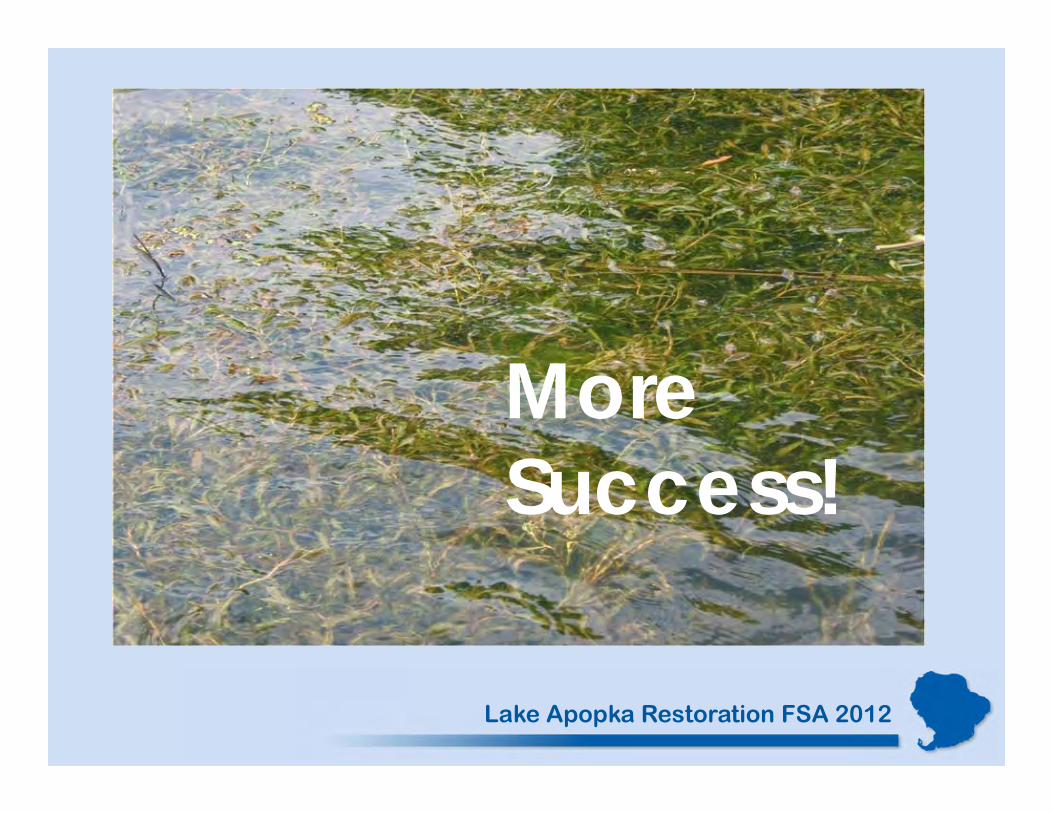
MoreSuccess!
Lake Apopka Restoration FSA 2012

Reaping the Rewards!
Lake Apopka Restoration FSA 2012

Questions?
Lake Apopka Restoration FSA 2012


