
1Q2018 Financial Results
25 April 2018

2
Agenda
Key Financial Highlights
Market Performance
Conclusion
Appendices

3
Key Financial Highlights
Financial Highlights for 1Q2018
Operating Revenue
Operating Expenses

4
Financial HighlightsHighest 1st quarter PAT since 2007
Operating revenue increased due to higher Securities Trading, Listing and Issuer Services and
Depository Services revenue. The increase was partially offset by lower revenue from Derivatives
Market.
ROE and Cost to Income Ratio both improved by 4 and 3 percentage points to 30% and 42%
respectively.
1Q2018 vs. 1Q2017:
Financial Items 1Q2018
1Q2018
vs.
1Q2017
1Q2018
vs.
4Q2017
Operating Revenue (RM million) 144.8 7.5% 11.4%
Operating Expenses (RM million) 62.9 1.4% 5.3%
PATAMI (RM million) 63.8 12.6% 15.4%
EPS (sen) * 7.9 12.9% 14.5%
Annualised ROE 30%4 percentage
points3 percentage points
Cost to Income Ratio 42%3 percentage
points 5 percentage points
*The EPS shown above has been retrospectively adjusted for the bonus issue which was completed on 13 April 2018

5
Operating RevenueGrowth from securities trading and listing & issuer services
Increase in Securities Trading Revenue from higher ADV-OMT.
Higher Listing & Issuer Services due the increase in the number of corporate
exercises and structured warrants issued.
Higher Depository Services fees contributed by CDS custody fees.
Lower Derivatives Trading Revenue due to revision in guarantee fee and lower
number of FCPO and FKLI contracts traded.
(RM mil)
Total
RM144.8 mil
Total
RM134.7 milGrowth contribution by revenue streams:
Securities Trading Revenue
Derivatives Trading Revenue
Listing & Issuer Services
Depository Services
Market Data
Member Services & Connectivity
BSAS Trading Revenue
Conference Fee & Exhibition-Related Income
67.276.3
21.219.0
4.04.012.7
15.79.810.58.6
8.45.2
5.46.0
5.5
1Q2017 1Q2018
7.5%
1Q2017 1Q2018
+9.1 -2.2 +3.0 +0.7 -0.2 +0.2 -0.5
13.5%
10.5% 23.0%
7.3% 1.4% 5.3% 7.9%
134.7
144.8

6
Total
RM63.8 milTotal
RM62.9 mil
Operating ExpensesDecrease in operating expenses from lower technology costs
Note^ - Other operating expenses include building maintenance, administrative expenses and CDS expenses.
Higher staff cost due to annual salary increment.
Higher marketing and development expenses incurred as more marketing and
engagement activities were carried out.
Decrease in service fees mainly due to lower Globex service fees payable to CME
as a result of the decrease in number of derivatives contracts traded.
Staff costs
Depreciation & amortisation
Marketing & development
IT maintenance
Service fees
Other operating expenses^
1.4%
(RM mil)
Movement of expenses:
63.862.9
1Q2017 1Q2018
34.0 34.8
6.1 5.63.8 4.64.8 4.9
7.2 5.0
7.9 8.0
1Q2017 1Q2018
+0.8 -0.5 +0.8 +0.1 -2.2
+0.1
2.4% 8.4% 21.3% 0.8%
30.3% 1.3%

7
Market Performance
Securities Market Overview
Derivatives Market Overview
Islamic Capital Market Overview

8
34
31
35
Securities Market OverviewHigher retail trades in 1Q18 resulting from improved
market sentimentsAverage Daily Value
(ADV)(RM mil)Market Capitalisation
(RM bil)Fund Raised from New Listings &
Secondary Market (RM bil)
1,350 1,309 1,452
544 484
643
484 523
621
1Q2017 4Q2017 1Q2018
2,316
17.3%
14.2%
2,378
2,716
Velocity (%)
1,740.09 1,796.81
1,863.46
FBMKLCI
0.9
0.0 0.2
3.34.3
2.6
1Q2017 4Q2017 1Q2018
2.8
4.3
No. of New Listing
Fund raised from new listings
Fund raised from secondary
market
ADV of Domestic Institutions
ADV of Retail
ADV of Foreign Institutions Market Capitalisation
43
7
33%
4.2
5.2%
31 Mar
2017
31 Mar
2018
31 Dec
2017
1,801 1,907 1,896
0.6%
35%

9
ADC - Crude Palm Oil Futures
Volatility of Crude Palm Oil Futures
Derivatives Market OverviewTrades influenced by the volatility of the underlying
ADC - OthersADC – FBMKLCI Futures
Volatility of FBMKLCI Futures
Average Daily Contracts (“ADC”)
& VolatilityOpen Interest (No. of Contract)
9,378 7,599 8,940
52,515
46,448 44,516
183
301 564
1Q2017 4Q2017 1Q2018
21% 17% 17%
7% 6%9%
85%
15%
82%
17%
13.0%
54,348
62,076
28 Feb
2018
261,572
30 Mar
2018
283,201
1 Sept 2010
111,548
26 May
2016
337,267
54,020
85%
14%
1% 1%
0.6%

10
Islamic Capital Market Overview30% increase in ADV compared to 1Q2017
No. of Shariah Compliant
Stocks (%)
No. of Trading Participants
Bursa Suq Al-Sila’ (“BSAS”)
ADV (RM bil)
Market Capitalisation of
Shariah Compliant Stocks
(RM bil)
No. of Sukuk
Value of Listed Sukuk (USD bil)
Domestic Foreign Market Capitalisation of Shariah
Compliant Stocks
Domestic Foreign
13.6
16.3 16.2
3.8
5.36.5
1Q2017 4Q2017 1Q2018
17.4
21.6
30.2% 22.6
130
141
146
21.8 25.4 26.1
30.6
30.6 30.9
31 MAR 2017 31 DEC 2017 31 MAR 2018
52.4
56.0 57.0
25 25
26
1.8%
1,123 1,154 1,144
31 MAR 2017 31 DEC 2017 31 MAR 2018
0.9%
1.9%
74%61% 60%
4.6%
8.8%

11
Conclusion
Moving Forward

12
Moving Forward
SECURITIES MARKET• The Securities Market segment is expected to be resilient, given the strong fundamentals of the
economy and the continued improvements of corporate earnings into 2018.
• Trading volatilities however, may be influenced by domestic and external factors, such as monetary
policy shifts in advanced economies and rising trade protectionism by major trading partners.
DERIVATIVES MARKET• Trading and hedging activities will continue to be influenced by volatility in commodity prices and the
underlying equity market.
• The inclusion of traceability feature, extension of trading hours, tenure of contracts and position limits
for FCPO contracts announced by the Exchange during the quarter will further enhance derivatives
trading.
ISLAMIC CAPITAL MARKET• The Exchange will continue with its efforts in promoting Shariah-compliant investing on Bursa Malaysia-i
platform through engagements with market players, focusing on widening the investor base.
• Bursa Suq Al-Sila’, on the other hand, will continue its reach into new regions in 2018.

13
Moving Forward
As part of the continuing initiatives to further enhance the vibrancy and liquidity in the equity market, the
following have been introduced to-date:
• Stamp duty waiver on shares of mid and small cap companies for three (3) years from 1 March 2018 to
28 February 2021;
• Liberalisation of margin financing rules;
• Intra day short selling allowed for all investors;
• A new category of traders who trade on their own account, known as “Trading Specialists”;
• A volume-based incentive programme; and
• All new investors to be given a fee waiver on trading and clearing fees for six (6) months.
The Exchange is currently engaged in the establishment of a stock market trading link between Bursa
Malaysia and Singapore Exchange. In addition, Bursa Malaysia will continue with its initiatives to enhance
the breadth and depth of the ecosystem, which amongst others, through digitalisation of services,
liberalisation of rules framework and greater diversification of the investor base.
With the above initiatives and barring any unforeseen circumstances, the Exchange expects the positive
momentum in the market to continue and to achieve a sustainable performance for the current financial
year.

14
Appendices
Securities Market Trading Activity
Securities Market Trading Participation
Securities Market Foreign Ownership
Foreign Inflow/Outflow
Derivatives Market Activity
Derivatives Market Demography
Islamic Capital Market Activity

15
2,161
1,579 1,732
1,341
1,841
1,439 1,595
1,430 1,643
2,308
2,002
1,686
2,068 2,053 2,196
1,901 2,081
1,913 1,933 2,042 1,981
1,842 1,740 1,690
2,378
2,621
1,951
2,316
2,716
1Q11 2Q11 3Q11 4Q11 1Q12 2Q12 3Q12 4Q12 1Q13 2Q13 3Q13 4Q13 1Q14 2Q14 3Q14 4Q14 1Q15 2Q15 3Q15 4Q15 1Q16 2Q16 3Q16 4Q16 1Q17 2Q17 3Q17 4Q17 1Q18
42
3034
27
34
27 2825
28
3731
2530 29 30 28 30 28 29 30 29 27 26 25
34 35
2631
35
34 34 33 3328 30 29 30
2732
35
1,181 1,129 1,454
1,699 1,573 1,915 2,053 1,991
1,812
2,314
2,716
2008 2009 2010 2011 2012 2013 2014 2015 2016 2017 1Q18
Turnover Velocity (%)
Quarterly ADV Traded & Velocity
Average Daily Value Traded (OMT, RM mil)
Average Daily Value Traded (OMT, RM mil)Turnover Velocity (%)
Annual ADV Traded & Velocity
Securities Market Trading Activity

16
283 369 392
442 354
424
530 464
372
525
643
7667 73 74 77 78 74 77 79 77 76
2433 27 26 23 22 26 23 21 23 24
2008
2009
2010
2011
2012
2013
2014
2015
2016
2017
1Q
18
5873 73 74 74 74 76 73 73 78 77
4227 27 26 26 26 24 27 27 22 23
2008
2009
2010
2011
2012
2013
2014
2015
2016
2017
1Q
18
From 2008 to 2009, the statistics were based on Brokers’ submission. From 2010 onwards statistics
were based on Bursa’s internal system.
Retail
(%)
Institutions
(%)Local(%)
Foreign(%)
Retail ADVTraded (RM mil)
Foreign ADV
Traded (RM mil)
Retail vs. Institution Foreign vs. Local
Securities Market Trading Participation
496
323 392 437 404
507 492 544
491 506 630
17
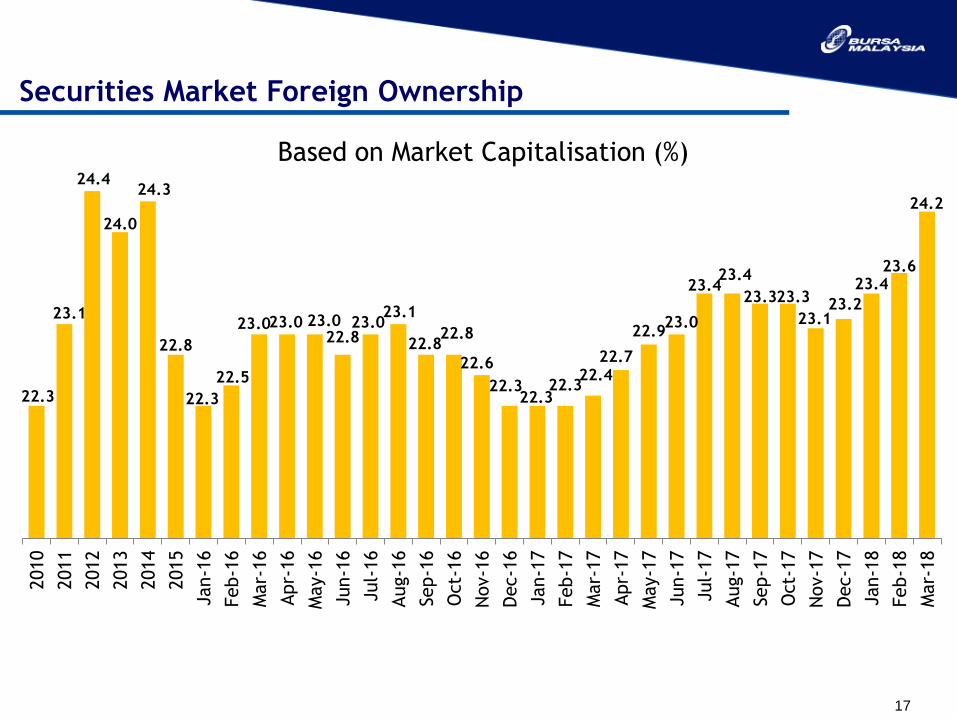
Securities Market Foreign Ownership
22.3
23.1
24.4
24.0
24.3
22.8
22.3
22.5
23.023.0 23.022.8
23.023.1
22.822.8
22.6
22.322.3
22.322.4
22.7
22.923.0
23.423.4
23.323.3
23.123.2
23.423.6
24.2
2010
2011
2012
2013
2014
2015
Jan-1
6
Feb-1
6
Mar-
16
Apr-
16
May-1
6
Jun-1
6
Jul-
16
Aug-1
6
Sep-1
6
Oct-
16
Nov-1
6
Dec-1
6
Jan-1
7
Feb-1
7
Mar-
17
Apr-
17
May-1
7
Jun-1
7
Jul-
17
Aug-1
7
Sep-1
7
Oct-
17
Nov-1
7
Dec-1
7
Jan-1
8
Feb-1
8
Mar-
18
Based on Market Capitalisation (%)

18
-10,000
-5,000
0
5,000
10,000
2015
TNFO: RM19.7 bil
2013
TNFI: RM2.6 bil
2014
TNFO: RM6.9 bil
TNFI: Total Net Foreign Inflow
(RM mil)
TNFO: Total Net Foreign Outflow
Foreign Inflow/Outflow
Monthly foreign inflow/outflow from 2013 to March 2018
4,355
2,6101,977
359 419
-241 -738 -231-15
959
3,376
-1,120
-64
-2,000
-1,000
0
1,000
2,000
3,000
4,000
5,000Monthly foreign inflow/outflow from March 2017 to March 2018(RM mil)
2016
TNFO: RM3.2 bil
1Q2018
TNFI: RM2.2 bil
2017
TNFI: RM10.8 bil

19
2008
2009
2010
2011
2012
2013
2014
2015
2016
2017
1Q
18
1Q
11
2Q
11
3Q
11
4Q
11
1Q
12
2Q
12
3Q
12
4Q
12
1Q
13
2Q
13
3Q
13
4Q
13
1Q
14
2Q
14
3Q
14
4Q
14
1Q
15
2Q
15
3Q
15
4Q
15
1Q
16
2Q
16
3Q
16
4Q
16
1Q
17
2Q
17
3Q
17
4Q
17
1Q
18
17%
136
162171
152
174
146
172
214
196
213
204196
218
239
288
196
207
229
235
230
283
293
226
237
262263
261
295
283
40
Quarterly Average Daily Contracts (’000)
31
42
35
60
Total Annual Contract (mil)
Crude Palm Oil FuturesOthersOpen Interest (’000)
17%
82%
6.1 6.1 6.2
8.4
9.6
FBMKLCI Futures
37
`
`
82
%3234
44 4542
4642
10.7
50
12.5
44
54
Derivatives Market Activity
55
14.2
62
51
62
56
14.0
5856
62
55
as
14.1
57 5754
156
123
132
152
214196 196
230
237
295
283
54
3.3

20
15 20 21 19 15 18 20 18 14 11 14
46
5244
42
2828 24
23
1918
21
2
3
22
21 2
5
33
3
37
2633
37
55 53 54 55
6468
62
2008 2009 2010 2011 2012 2013 2014 2015 2016 2017 1Q18
(%)FKLI
27
36 34 34 36 33 34 31 2823
19
3827
26 24 1917 15
1516
20 26
1
11
1 11
1 1
15 17
1513
12
10 15 2121 23 20
20 1925 28
3239
35 32 34 33 34
2008 2009 2010 2011 2012 2013 2014 2015 2016 2017 1Q18
(%)FCPO
1
Local
Domestic Retail
Domestic
Institutions
Foreign Institutions Local
Domestic RetailDomestic
Institutions
Foreign Institutions Foreign Retail
Derivatives Market Demography

21
0.9 1.6 2.75.5
13.5 13.4 15.1 16.2
0.2 0.71.2
1.4
1.7 2.9
4.56.4
2011 2012 2013 2014 2015 2016 2017 1Q18
BSAS Annual Average Daily Value
Local ADV Foreign ADV
1.22.3 3.9
6.9
15.2 16.319.6
22.6(RM bil)
BSAS ADV (RM bil)
13.5
0.9
0.8 0.9 1.1 1.1 1.3 1.5 1.6 1.8 2.6 2.4 2.7 3.2 3.7 3.7 5.9
8.5 10.4
12.0 14.4
16.9 16.1
12.7 12.2 12.6 13.6 15.1 15.5 16.1 16.2
0.2 0.2 0.2 0.3 0.3 0.7 0.9 1.2 1.1 1.0 1.1 1.5 1.4 1.5
1.4
1.4
1.5 1.6
1.6
2.1 2.6
2.7 3.0 3.2 3.8
3.7 4.9
5.6 6.4
1Q
11
2Q
11
3Q
11
4Q
11
1Q
12
2Q
12
3Q
12
4Q
12
1Q
13
2Q
13
3Q
13
4Q
13
1Q
14
2Q
14
3Q
14
4Q
14
1Q
15
2Q
15
3Q
15
4Q
15
1Q
16
2Q
16
3Q
16
4Q
16
1Q
17
2Q
17
3Q
17
4Q
17
1Q
18
BSAS Quarterly Average Daily Value(RM bil)
Islamic Capital Market Activity

DISCLAIMER:
These presentation slides are owned by Bursa Malaysia Berhad and/or the Bursa Malaysia group of companies (“Bursa Malaysia”). Whilst Bursa Malaysia endeavors to
ensure that the contents in this presentation are accurate, complete, current and have been obtained from sources believed by Bursa Malaysia to be accurate and
reliable, neither Bursa Malaysia or the presenter of this presentation make any warranty, express or implied, nor assume any legal liability or responsibility for the
accuracy, completeness or currency of the contents of this presentation. In no event shall Bursa Malaysia be liable for any claim, however arising, out of or in relation to
this presentation.
Copyright Bursa Malaysia Berhad 2017 (30632-P)
www.bursamalaysia.com
RASMONA ABDUL RAHMAN
603-2034 7175
E-mail : [email protected]
RAFIDAH AZIZ
603-2034 7262
ADAM ISKANDAR AHMAD ZAHAR
603-2034 7351
INVESTOR RELATIONS CONTACT INFORMATION


