
Mining Consultancy Services © 2008 Mining Consultancy Services (Australia) Pty Ltd

Mining Consultancy Services © 2008 Mining Consultancy Services (Australia) Pty Ltd
MINING CONSULTANCY SERVICESTechnical Capability:Unique combination of experience, expertise & innovation in:
•Mine Design and Layouts
•Mining Systems and Operations
•Productivity Optimisation
•Process Analysis Software and Electronics
•Training

Mining Consultancy Services © 2008 Mining Consultancy Services (Australia) Pty Ltd
MINING CONSULTANCY SERVICES• Established in 1988• Employ over 40 personnel between offices in Australia and RSA• Rapidly expanding company with focus on underground mining• Project work with clients such as BHP, Anglo, Xstrata, AMCI,
Peabody, Sasol , Solid Energy• Projects in Australia, South Africa and New Zealand• ISO Accreditation

Mining Consultancy Services © 2008 Mining Consultancy Services (Australia) Pty Ltd
MANUAL CM’S• HM9 / 17 / 21• 14CM15• 12CM5
VOEST-ALPINE• ABM 12 / 25 / 30
Monitoring70
Miningmachines
Numerousrecordbreakingachievements
Identifiedcommonattributesof highly
successfulunits
All shift systemsAll conditions
JOY• JNA1: HM 31 / 21• JNA 2: HM 31
Productivityimprovement
processes
Basis for the role of monitoring

Mining Consultancy Services © 2008 Mining Consultancy Services (Australia) Pty Ltd
Process Based Management
PRODUCTION=UPTIME HOURSXOPERATING RATE
UNITS TONNES=XMETRES PERHOUR
MINUTES60
POP PROJECTS
The focus is not on tonnes and metres as this is purely a result
By influencing the primary drivers of cutting rate and time we influence theresult which is production

Mining Consultancy Services © 2008 Mining Consultancy Services (Australia) Pty Ltd
OperatingRate
Uptime Hours
Shift SystemQty Shifts
PRIMARYDRIVERS
OptimalCycle
CycleRepetition
Face TimeStart & End Of
Shift
Lost TimeLost TimeAnalysis
Time Usage*Relocation
*Loading*Cutting
OPTIMISATION FOCUSPARAMETERS
ProductionIncrease
OUTPUT
Process MapDrilling down to the next level of the primary drivers
POP PROJECTS

Mining Consultancy Services © 2008 Mining Consultancy Services (Australia) Pty Ltd
Face Time
Lost Time
Shift Time
Time Usage
Cutting
Loading Flitting
ElectricalDelays
MechanicalDelays
Non-Face Time
Idle TimePlanned
Maintenance
Meetings
Crib
Travel
Shift Time ClassificationPOP PROJECTS

Mining Consultancy Services © 2008 Mining Consultancy Services (Australia) Pty Ltd
Process MappingQuantifying Constraints
ABM Process
Time (min)1 2 3 4 5 6 7 8 9 10 11 12 13 14 15 16 17 18 19 20 21
Cut
Load
Mesh Roof Bolt x 6
SCAT
Cut
Load
Roof Bolt x 2
SCAT
Rib Bolt x 4 -6
Tram CanopyDown
CanopyUp
CanopyUp
CanopyDown
Tram
“X” Minute cycle
“Y” Minute cycle
Current Joy Process Map
Time (min)1 2 3 4 5 6 7 8 9 10 11 12 13 14 15 16 17 18
Cut &Tram
Load
Roof Mesh Roof Bolt x 4
SCAT
Cut & Tram
Load
Roof Bolt x 2
SCAT
Rib Bolt x 4 -6 TramRibMesh
Mining Consultancy Services © 2008 Mining Consultancy Services (Australia) Pty Ltd
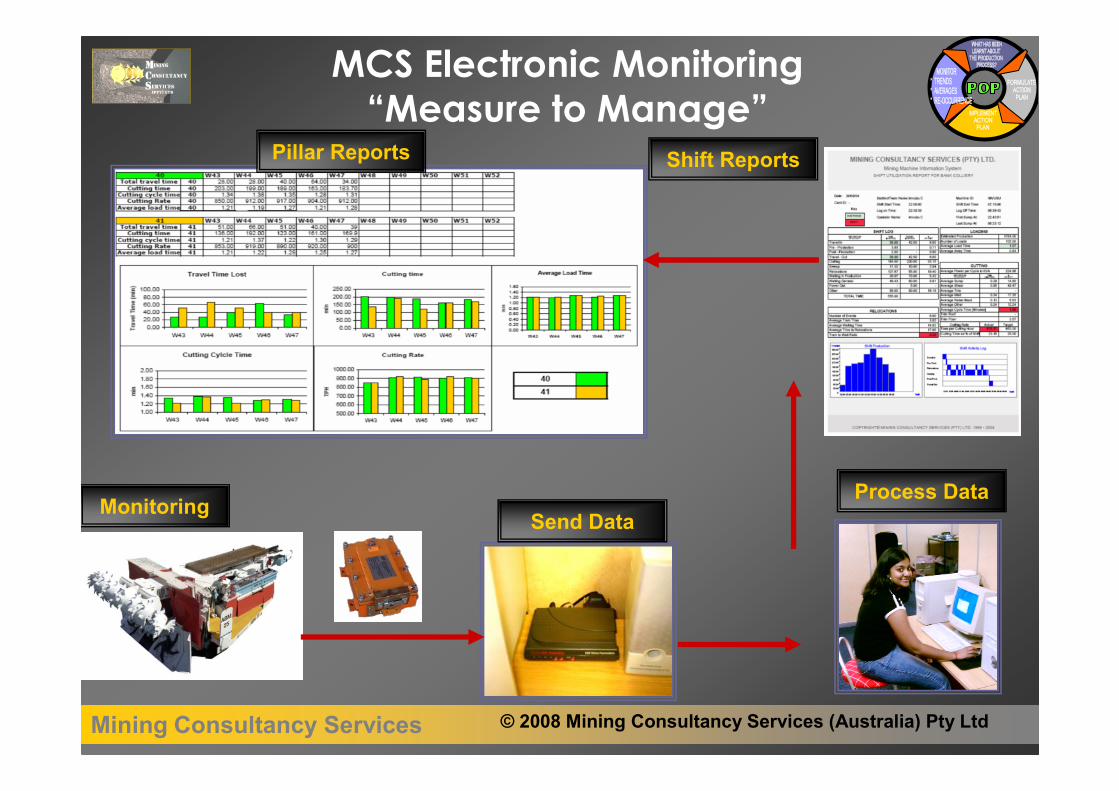
Monitoring
MCS Electronic Monitoring“Measure to Manage”
Shift Reports
Send DataProcess Data
Pillar Reports

Mining Consultancy Services © 2008 Mining Consultancy Services (Australia) Pty Ltd
Shuttle Car Away Time (SCAT)
SCATTimes
0.75 1 1.25 1.5 21 2.5 3 3.5 4 5
1.25 2.75 3.25 3.75 4.25 5.251.5 3 3.5 4 4.5 5.5
1.75 3.25 3.75 4.25 4.75 5.752 3.5 4 4.5 5 6
2.25 3.75 4.25 4.75 5.25 6.252.5 4 4.5 5 5.5 6.5
2.75 4.25 4.75 5.25 5.75 6.753 4.5 5 5.5 6 7U
nloa
ding
Tim
e
Wheeling time
Improve wheeling time� Cut a consistent floor� Water management� Floor cleaning� Cable anchor points and condition of intersections� Manage use of SC to bring in materialsImprove Unloading Time� Improve discharge rate, e.g. improve belts, breaker feeder, overlap etc.� Improve approach to tipping area

Mining Consultancy Services © 2008 Mining Consultancy Services (Australia) Pty Ltd
Formalising and Coaching Best Practice

Mining Consultancy Services © 2008 Mining Consultancy Services (Australia) Pty Ltd
Time to First and Last Coal
Optimising Operating Time

Mining Consultancy Services © 2008 Mining Consultancy Services (Australia) Pty Ltd
Case Study Example - Easy Gain
0
20
40
60
80
100
120
140
160
Week 29 Week 30 Week 31 Week 32 Week 33 Week 34 Week 35 Week 36 Week 37
Min
utes
Team A Team B
Travel In Time
Focus on discipline ofTeam A Saving 130 minutes
over 9 weeks(±12% overallimprovement)

Mining Consultancy Services © 2008 Mining Consultancy Services (Australia) Pty Ltd
Section 35 - Last sump dayshift and first sump nightshift
16:00
17:12
18:24
19:36
20:48
22:00
23:12
00:24
01:36
13-Nov
15-Nov
16-Nov
19-Nov
20-Nov
21-Nov
22-Nov
23-Nov
24-Nov
26-Nov
27-Nov
28-Nov
29-Nov
30-Nov
01-Dec
02-Dec
03-Dec
04-Dec
05-Dec
06-Dec
07-Dec
Sun Tue Wed Sat Sun Mon Tue Wed Thu Sat Sun Mon Tue Wed Thu Fri Sat Sun Mon Tue Wed
time
Last sump - day First sump -night
Target22:00
Target21:45 Improvement in shift change
times and consistency
Section C – Shift Change Time (Day shift to Night shift)
Case Study Example -Optimising Face Time

Mining Consultancy Services © 2008 Mining Consultancy Services (Australia) Pty Ltd
Case Study Example - Complex Gain
0
5
10
15
20
25
30
35
40
Week 29 Week 30 Week 31 Week 32 Week 33 Week 34 Week 35 Week 36 Week 37
Min
utes
Team A Team B
Average Time Per Relocation(±4 times per shift)
Saving of 8 minutesper relocation (±32minutes per shift)(±6% overallimprovement)
Teamwork andprocess improvement

Mining Consultancy Services © 2008 Mining Consultancy Services (Australia) Pty Ltd
Electronic Monitoring Function and Purpose
JOYPempek
ABMSandvik
FCR
FC
SCR
MCS Shift Report
Weekly KPI Report
Pillar KPI Report
Process Management
Initiative Management
Operating
Time
Face Time
Lost Time
Flitting
Rate
SCLT
SCAT
BT
Shuttle Car Away Time
3
2
0
1
2
3
4
5
6
1
Min
utes
Bolting Cycle Time
6
2
0123456789
1
Min
utes
0
5
10
15
20
25
30
35
1 2 3 4 5 6 7 8 9 10 11 12
Shift Hours
Tim
e (m
inue
ts)
0
0.5
1
1.5
2
2.5
3
3.5
Met
res
Per H
our
Bolt ingM ining
M et res Per Hour
MachinePanelCrewDateShift
Parameter Target Actual VarianceMetresM / Operating HrOperating Hours
Parameter Start End Log On Time:ShiftF / L Production TARGET Log Off Time:F / L Production ACTUALVariance
TRIPS QTYCutterCutter ImbConveyorPumpTractionWater flowMethane
AVG Line Volts
% Time -10% Volts
FLITTING Time
FLITTING Events
PARAMETER QTY CycleTIME TOTAL HeightCut Cycles RoofCut Cycles MidWaiting for SCMining CyclesBolting CyclesLH Bolting CyclesRH Bolting Cycles
Shuttle Car Load Time
80
20
0
20
40
60
80
100
120
1
Seco
nds
QTY: 42
PLANPLAN
MONITORMONITOR IMPLEMENTIMPLEMENT
ANALYSEANALYSE PLANPLAN
MONITORMONITOR IMPLEMENTIMPLEMENT
ANALYSEANALYSE
Improvement Cycle
Crinum East Development Performance KPI's
Panel KPI's
Primary Crew KPI's
Secondary Crew KPI's
Total Pillar Time
0
100
200
300
400
500
1 2 3 4 5 6 7 8 9 10
Pillar
Pill
ar T
ime
(Hrs
)
Face Time Lost T ime Operating Delays Panel Advance Operating Time
Panel Advance Time
05
1015
20
2530
35
4045
1 2 3 4 5 6 7 8 9 10Pillar
Pill
ar T
ime
(Hrs
)
Belt Extension Panel Extension Time
Lost Time
0
50
100
150
200
250
300
1 2 3 4 5 6 7 8 9 10Pillar
Pilla
r Ti
me
(Hrs
)
Operating Delays Mechanical Delays Electrical Delays Maintenance
Crew Operating Rate
22.25
2.52.75
33.25
3.53.75
44.25
4.54.75
5
1 2 3 4 5 6 7 8 9 10Pillar
Ope
ratin
g R
ate
(M/H
)
A Operating Rate (M/H) B Operating Rate (M/H)C Operating Rate (M/H) D Operating Rate (M/H)
Crew Operating Time
2
4
6
8
10
1 2 3 4 5 6 7 8 9 10Pillar
Ope
ratin
g H
ours
(H)
A Operating Hours (H/Shift) B Operating Hours (H/Shift€)C Operating Hours (H/Shift) D Operating Hours (H/Shift)
Crew Operating Metres
2
12
22
32
1 2 3 4 5 6 7 8 9 10Pillar
Prod
uct
ion
Met
res
(M)
A Production Metres (Shift) B Production Metres (Shift)C Production Metres (Shift) D Production Metres (Shift)
Crew Shuttle Car Load Time
2.002.252.502.753.003.253.503.754.004.254.504.755.00
1 2 3 4 5 6 7 8 9 10Pillar
S/C
Loa
d Ti
me
(Min
)
A SC Load Time (Mins) B SC Lost T ime (Mins)C SC Lost Time (Mins) D SC Lost Time (Mins)
Crew Shuttle Car Away Time
2.002.252.502.753.003.253.503.754.004.254.504.755.005.255.505.756.00
1 2 3 4 5 6 7 8 9 10Pillar
S/C
Aw
ay T
ime
(Min
)
A SC Away Time (Mins) B SC Away Time (Mins)C SC Away Time (Mins) D SC Away Time (Mins)
Time To First Coal
2
17
32
47
62
77
92
107
1 2 3 4 5 6 7 8 9 10Pillar
Tim
e To
Fir
st C
oal (
Min
)
A Time to 1st Coal (Mins) B Time to 1st Coal (Mins)C Time to 1st Coal (Mins) D Time to 1st Coal (Mins)

Mining Consultancy Services © 2008 Mining Consultancy Services (Australia) Pty Ltd© 2008 Mining Consultancy Services (Pty) Ltd
Involvement of the TeamInvolvement of the Team
When they arrive atWhen they arrive atthe waiting place /the waiting place /crew section, theycrew section, theydiscuss the reportdiscuss the reportwith their team towith their team todecide where theydecide where they
need to focus on toneed to focus on toimprove.improve.

Mining Consultancy Services © 2008 Mining Consultancy Services (Australia) Pty Ltd
InitiativesEvaluation and Selection Process

Mining Consultancy Services © 2008 Mining Consultancy Services (Australia) Pty Ltd
InitiativesSorting and Sequencing
70 Issues/Solutions filtered down to Top 20Initiatives
The Top 20 then rated to determine theoverall effect to pillar time
Initiatives plotted in a constraints analysis tomaintain a balanced mining cycle
Initiatives then sequenced in terms ofpracticality and cycle constraints
ABM25s Constraint Analysis & Initiative Implementation
23456789
10111213
2 3 4 5 6
Bolting Cycle Time (min)
Min
ing
Cyc
le T
ime
(min
)
EquilibriumLine
Analysis on Basis of 0.5 mMiningConstrained
BoltingConstrained
Order ToImplement Init No BMA Initiatives
1 3 Panel Advance Sequence Control Chart2 8 Panel Construction Control Chart3 12 BMA Time To First & Last Coal4 4 Shuttle Car Filling Practice5 2 Second Auxiliary Fan6 1 Second Mobile Bootend7 5 Dedicated Outbye Person8 6 Supply storage cut-through & Supply Person9 7 Horizon & Grade Control
10 9 Water Management Plan11 11 Mining Cycle Optimisation Training Scheme12 15 Crew Fitter & Electrician13 16 Two Shuttle Car System14 10 Roof & Rib Bolting Pattern15 17 Breaker Feeder16 18 Digitial Drill Rigs17 20 Floor Brushing18 19 Roadway Width 5m
Init No Init iative Prob Cons
Risk RatingWith
ExistingControls
RiskRanking
Crew Sol ution
Solutions
Issues Pros AddHours Cons Lost
HoursNet OperatingTime Benefit
Mining RateLoading &Haulage
Benefit (min)
Mining RateBolting
Benefit (min)Re vised
Pr obRev ised
Cons
Revise dRisk
Rating
RevisedRisk
Ranking
ImpactRating
Time ToImpleme
t
Cost ToImplem
e nt
Ease ToImplem
ent
SafetyValue
Adding
1
Implement second mobile bootend1. Implement second mobile bootend2. Create stringer closures3. Change mining sequence to mine B hdg first.*Use of second mobi le boot allows belt to be built in B hdg whileproduc ing in A hdg.Initiative 1 linked to Initiative 2
5 5 25 Extreme
Setup sequence for fanjob to be done wit h allc rews followingsequence
1. Change mining sequence to mine B hdg first. Use of second mobile boot al lowsbelt to be bui lt in B hdg while producing in A hdg. Closure r equir ed for belt extension.
Panel advance times are excessive,sequence of fan cycle
Reduce belt ex tens ion time as work can be conducted in parallelwith cutting in Ahdg Maintenance onadditional bootend can be completed as it is leapfrogged
12 Requires second mobile bootendRemoval & storage of MBE requires designated location = 2 hppClosure time for bridging structure and pul ling belt = 4 hpp
-6
6 1 1 1 Low 24 1 1 2
2
Second Auxiliary Fan1. Implementation of second auxil iar y fan for ventilation of Ahdg. A llows pipework to be done in A hdg in paral lel with B hdgworkInitiative 1 linked to Initiative 2
5 5 25 Extreme
Setup sequence for fanjob to be done wit h allc rews followingsequence
1. Venti lation of A hdg with second fan being investigated to allow pipework to bedone in A hdg in parallel with B hdg work
P ipe extension times are excessive
Opportunity to do floor cleaning, roadwork , pumping and pipewor k in non production heading
18 Requires second auxi liary fan, purchase & storage of additionalvent tubes Advance timefor additonal fan = 2 hpp Advance Additionalvent tubes = 3 hpp Additonal delayswith98% availabi li ty = (130)*0.02 = 3 hpp
-8
10 2 1 2 Low 23 2 2 4 2
3
Panel Advance Sequence Cont rol Chart1. Implementation of Panel Advance Sequence Control Chart2. Implementation of Control BoardInitiative 3 linked to Initiative 8 & 9
5 5 25 Extreme
Setup sequence for fanjob to be done wit h allc rews followingsequence
1. Implementation of Panel Advance Sequence Control Chart 2.Implementation of Panel Construc tion Control Chart 3. Use ofControl Boards
Panel advance times are excessive,sequence of fan cycle, Not util ising lostproduc tion time to do cri tical non-productionwork
Organisation of all supplies and tasks prior to the panel advance- 15 % improvement on 47 hours per panel ex tens ion = 7 hpp
7 Organisation of board and deputiesbooks
7 1 2 2 Low 23 1 1 2
4
Shuttle Car Filling Practice 1.Investigate fi ll ing pr actice on shuttle cars with new tai l 2.Best practice tr aining scheme for shuttle car drivers how to loadcar effec tively using selected best operator over a period of 1month. 3.Trial use of choke chains on shuttle cars4. Trial of hungr yboardson shuttle carsInitiative 4 linked to Initiatives 7,11 & 15
5 5 25 Extreme Cycle made for 2 cars
1. Look at choke chains on shuttle cars 2.Inves tigate hungry board options for shuttle car 3. Internalbes t practice training scheme for shuttle car drivers how to load car effec tively* (Lengthened ABM tail by 250mm may help)
More than 2 cars per cycle on ABM affectingcycle time
Removal of 5 minute away time for shuttle car per cyc le290 m x 5 minutes / cycle x 2 cycles/m / 60 min /hr / 2 (every2nd s/c) = 24 h
24 Cost of choke chain & hungry boardsReallocation of best operator to train crews for 1 month
24 5.0 2 2 4 Low 21 1 1 2
5
Dedicated outbye person1. Dedicated outbye person allocated to each crew who isresponsible for floor cleaning, pumping & running suppl iesInitiative 5 linked to Initiatives 18 & 19
5 5 25 Extreme
1. Inbye Roadway maintenance plan, Create accountabil ity for roadway profi le andmaintenance as part of the process
Floor c leaning to a standard, shuttle carwheel ing time
Floor cleaning 2hpp improvement to panel advance timeSupplyavailabili ty4hppPumping at face 2hpp10% reduc tion in shuttle car travel time 20 s/ cycle x 2 cycles/m x290 m / 3600s/h =3 hpp Reduction in timelos t for attachments = 3hpp
12 Cost of additional labourTransport logistics for additional manRequires a supply person to work successfully
12 0.3 2 1 2 Low 23 2 2 4 1
6
Supply st orage cut-through & Supply Person 1.Use of a dedicated supply storage cut-through with appropriates ignage 2.Dedicated supply person to serv ice both panels, performroadworks and maintian pumps3. A llocation of dedicated Supply eimco ( available during paneladvances and for paral lel work)Initiative 5 linked to Initiatives 18 & 19
5 5 25 HighContrac tors to bringsupplies into panel
1. Refurb & uti lise Myne grader for roadworks outbye of crib room with supply personwhen not delivering suppl ies 2. Supply personmaintaining ballast stock 3. Bobcat withattachment for under belt c leaning used to clean up floor heave and under the belt inB hdg. 4. Roadway maintenance plan,Create accountabi li ty for roadway profile and maintenance as par t of the process
Outbye roadworks to a s tandard, mantransport & eimco travel time
Running in bulk supplies to both panels , Fil l pipetrai lers,quickdusters, toilet runs, r oadworks and accountabil ity forsuppl ies& supplyc /t 2 hppTravel time r eduction for c rews 10% of 30 min/shift x 39 shifts /pil lar / 60 min/hr = 2hpp
4 Cost of additional labourRequires an outbye person to work success fully Costof additonal LHD
4 2 1 2 Low 23 2 2 4 1
7
Horizon & Grade Control 1.Documented best practice cutting cycle and horizon controlprocedure for each machine (laser usage for grade & linecontrol) 2.Internal best practice training scheme for miner drivers on ABMand Joy using selected bes t operator over a period of 1 month.Initiative 4 linked to Initiatives 7,11 & 15
5 4 20 Extreme
1. Cutting & sumping standardised plan to prevent cutting holes and maintain aconsistent floor grade2. More training for miner driver s for driving via screens 3.Complete dedicated c lean up runs as part of panel s tandar ds4. Use of inc linometer alarm5. Training on new expectations with the standards
Horizon control to a standard, Shuttle carspeed / travel time, man transport & eimcotravel time, training of miner drivers
5% reduction in shuttle car tr avel time10 s / cycle x 2 cycles /m x 290 m / 3600s/h =1.5 Fl ittingtime = 2 hpp Reductionin road construction time = 2 hpp
5.5 Grade target on cmReallocation of best operator to train crews for 1 month
5.5 0.2 2 2 4 Low 16 1 1 2 1
8
Panel Construction Control Chart1. Implementation of Panel Construc tion Control Chart2. Implementation of Control BoardInitiative 3 linked to Initiative 7 & 8
5 4 20 Extreme
1. Audit of attachments which should be on-si te 2.A ttachments des ignated to panelsand stored in al located location 3. Lockingof s torage location, attachments should be secured behind chain barrier or lockablepole barrier 4. Ped tracker dev ice on allattachments to al low location to be identified 5. Inbye Roadway maintenanceplan, Cr eate accountabil ity for roadway profi le and maintenance as part of theprocess
Floor c leaning to a standard, shuttle carwheel ing time, E imco attachmentslost/removed
Organisation of all floor cleaningOrganisation of water management & pumping 2 hppTracking of all installed serv icesLocation of equipment and attachments 6 hpp
8 Organisation of board and deputiesbooks
8 2 2 4 Low 16 1 1 2 1
9
Water Management Plan1. Implement a water management standardInitiative 3 linked to Initiative 7 & 8
5 5 25 Extreme
1. Instal l 4 auger holes per pi llar centre (1: MBE, 2: inbye of intersection A-heading,3: mid pil lar A-heading, 4: mid pi llar B-heading) 2. Advance pumpsat working face 3. Water managementplan 4. Recyc ling water onABM's 5. Fine mist water spr ays oncutting head & dri ll rigs
Poor water contr ol & management, creatingdifficult conditons, s lower wheel ing rates, carsbeing half loaded with slop to remove fromface
Standar d practice to reduce pump setup time at face = 2 hpp 5%Reduction in Shuttle car travel time 10 s /cycle x2 cycles/m x 290 m / 3600s/h =1.5Improved shuttle car availabili ty+ 1h/w = 3h/p
6.5 Compilation of a water management standard
6.5 0.2 3 3 9 Medium 16 1 1 2 1
10
Roof & Rib Bolting Pattern1. Implement 4/4 roof bolting pattern in place of 6/2 roof boltingpattern2. Implement 2/1 rib bolting pattern in place of 3/0 rib boltingpatternInitiative 10 linked to Initiative 19
4 4 16 High
1. Change roof bolting pattern from 6/2 to 4/4 2.Change rib bolting pattern from 3/0 to 2/1 3.Internal best practice training scheme for operators on ABM and Joy us ing .
Roof & rib bolting time cons training miningcycle
Reduction in bolting time by 2 min per metr e1min/m x 290 m / 60 min/h = 10 h
10 Change management for bolting pattern
10 0.5 1 2 2 Low 14 1 1 2 2
11
Training Scheme 1.Internal best practice training scheme for operators on ABM andJoyInitiative 4 linked to Initiatives 7,11 & 15
4 4 16 High
1. Internal bes t practice training scheme for operators on ABM and Joy us ing .
Roof & rib bolting time cons training miningcycle
Reduction in effect of trainee operators on multiple c rews shuttlecar loading 2 min/m x290 m / 60 min/h = 10 h
10 Reallocation of best operator to train crews for 1 month Lossof 1min/m x290 m / 60 min/h / 4 = 1.25
-1.25
8.75 0.5 1 2 2 Low 14 1 1 2 2
12
BMA Time To First & Last Coal 1.Time to firs t coal monitor ing & rev iew 2.Pass meetings to be conducted in the panel 3.Mini bus for transporting crew to trench Inititiative13 linked to Initiat ive 14
5 4 20 Extreme
Someone else other t hant he deputy chai ring passmeeting
1. Pass meetings to be run by every other member of the team and chair to rotate2. Pass meetings to be conducted in the panel 3.Review shift start & finish times to al low supervisors to perform handover * Shorterpass & communications meetingswhere possible 4. Review vehicle allocationsons ite to maximise use of under-util ised vehicles5. Additional Toyota troop carrier or small bus to get crew to trench at start of theshift and end of the shift
Time to firs t coal, Length of start of shiftmeetings, dis ruptions with off going deputy&ongoing deputy commmunications, affectingtime to first coal, Lack of vehicles to getMastermyne to tr ench at start of shift, ie 2runs with 1 vehicle, interaction of BMAlongwal l & development on vehicle use
Reduce BMA s tart of shift communication & Pass meeting time45 mins -> 20 min/shift = 25 min/shift x 39 shifts / 60min/h x75%(allowing for 1s t shift of r oster ) for start = 12 hppPrep for going u/g & at c rib room at start of shift 5min/shift x 39 shifts/ 60min/h = 3.25 hpp
15.25
15.25 2 2 4 Low 16 1 1 2
13
Mastermyne Time To First & Last Coal 1.Time to firs t coal monitor ing & rev iew 2.Pass meetings to be conducted in the panelInititiative 13 linked to Initiative 14
5 4 20 Extreme
Someone else other t hant he deputy chai ring passmeeting
1. Pass meetings to be run by every other member of the team and chair to rotate2. Pass meetings to be conducted in the panel 3.Review shift start & finish times to al low supervisors to perform handover * Shorterpass & communications meetingswhere possible 4. Rev iew vehic le allocationsons ite to maximise use of under-util ised vehicles5. Additional Toyota troop carrier or small bus to get crew to trench at start of theshift and end of the shift
Time to firs t coal, Length of start of shiftmeetings, dis ruptions with off going deputy&ongoing deputy commmunications, affectingtime to first coal, Lack of vehicles to getMastermyne to tr ench at start of shift, ie 2runs with 1 vehicle, interaction of BMAlongwal l & development on vehicle use
Reduce Mastermyne travel time to trench 15-5 mins10 mins /shift x 36 shifts / 60 min/h x 75%(allowing for 1st shift ofr oster) = 6 hpp Prep forgoing u/g & at crib room at s tart of shift 5 min/shiftx 36 shifts/ 60min/h = 3 hpp
9
9 2 2 4 Low 16 1 1 2
14
Training Crew 1.Trial training crew nominated for trainee operators on ABM andJoy with training officer on crew.Initiative 4 linked to Initiatives 7,11 & 15
5 5 25 Extreme
1. Hir e ski lled operators trained/familiar with equipment being used2. Training focus with training officer on site, performing coaching role with minerdrivers and operators
Skil ls shortage, Insufficient training oftradesmen on development equipment,tic kets, Shortage of quali ty miner drivers
Reduction in bolting time by 1 min per metre 1min/m x 290 m / 60 min/h = 5 h
5 Cost of trainerLoss of 2min/m x 290 m / 60 min/h / 4 = 2.5
-2.5
2.5 1 2 2 4 Medium 21 2 2 4
15
Crew Fitter & Electrician1. A llocate a dedicated fitter & electr ician to each crew
5 5 25 ExtremeFitt er/elect to be part off ace crews
1. A llocate a dedicated fitter & electrician to each crew
Wait on tradesmen
Reduction in waiting for trades time from 15 hpm - 2.5 hpm12.5 hpm x0.75 m/pil lar = 9.5 hppReduction in delay downtime with familiari ty with equipment 10%of elec delays of 13 hpp = 1.5 hpp
11 Cost of tradesman
11 1 1 1 Low 24 2 3 5
16
Two Shuttle Car System 1.Trial of shuttlecar as temporary feeder over bootend to quanti fythe benefits of a Stamler breaker feeder 2. Trialtwo shuttlecar system, use left and right shuttle cars withelephants foot anchor on inbye r ibs , using backspool ing andreversing into cut- through to reduce shuttle car away timeInitiative 16 linked to Initiative 17
5 4 20 Extreme
1. Inves tigate use of two shuttlecars, left and right shuttle cars with elephants footanchor on inbye ribs, using backspooling and reversing into cut-through to reduceshuttle car away time 2. Instal lation of Stamler breaker feeder (hire unit & refurbexisting unit)
Shuttle car away time excessive
Reduction in shuttle car away time1 min/cycle x 2cyc le/m x 290 m / 60 min/h = 10 h
10 Change out shuttle cars between headings 1 hpp Costof additional oper ator Cost ofadditonal cables Length ofcables / reeler capacity / backspooling Shuttle carcable damage delays 2h per 2nd weekx 1.5 = 3 Shuttle caravai labi lity reduced shuttle car availabili ty= 1h/w = 3hpp
-7
3 1 2 2 4 Low 16 1 2 3
17
Breaker Feeder 1.Trial of shuttlecar as temporary feeder over bootend to quanti fythe benefits of a Stamler breaker feeder 2.Installation of S tamler br eaker feeder (hire unit & refurb existingunit) Initiat ive16 linked to Initiat ive 17
5 4 20 Extreme
1. Inves tigate use of two shuttlecars, left and right shuttle cars with elephants footanchor on inbye ribs, using backspooling and reversing into cut-through to reduceshuttle car away time 2. Instal lation of Stamler breaker feeder (hire unit & refurbexisting unit)
Shuttle car away time excessive
Reduction in bootend damage / alignment 1 hppReduction in blockages 0.5 hpp Evenloading reducing slippage 1 hppReduction in shuttle car away time1 min/cycle x 2cyc le/m x 290 m / 60 min/h = 10 h
12.5 Cost of breaker feederPosition of bootendRelocation time for breaker feeder 2.5 hppIncr eased delays due to breaker feeder availabil ity 99% =(130)*0.01 = 1.5 hpp
-4
8.5 1 2 2 4 Low 16 1 2 3
18
Digitial Drill Rigs1. Task force on improving rel iabil ity of the digital dri ll rigs withmonthly feedback on downtime
4 4 16 High
1. Task force on improv ing rel iabi lity of the digital dri ll rigs
Roof & rib bolting time cons training miningcycle
Reduction in digital dri ll rig delays 5 hpp (Delays of 25 hpm withdigital rigs, 12.5 hpm with hydraulic rigs)
5 Requires task force to be setup to investigate downtime fordigi tal rigs
5 2 2 4 Low 12 2 1 3 2
19
Roadway Width 5m1. Redes igning roadway opening to 5m2. Investigate option of repos itioning middle rib bolt Initiative10 linked to Initiat ive 19
5 3 15 HighRib bolter modif ied t o beable to single pass
1. Redesigning roadway opening to 5m2. Inves tigate option of repos itioning middle rib bolt
Double pass when rib bolting
Reduction in rib bolting time 0.75 min/m x 290 m /60min/h = 3.5hReduced fl itting time 3 hpp
6.5 Additional cost of wider head ?Longer cutting & loading time +4 % volume = 4 % longer cutting& loading time 15 s/cycle x2cycles/m x 290m / 3600 s/h = 2.5 h
-2.5
4 0.75 1 2 2 Low 13 1 1 2

Mining Consultancy Services © 2008 Mining Consultancy Services (Australia) Pty Ltd
Process Accountability
ProductionIncrease
EVERYONE’SRESPONSIBILITY
Optimal Process Repetition
Mining Sequence
Cutting Cycle
Loading Cycle
Relocation Cycle
SECTION TEAMRESPONSIBILITY
STOPS(Lost Time)
Equipment
Conveyors
Transport
Materials And Resources
Planning
MANAGEMENTRESPONSIBILITY
Who Is Responsible In Terms Of The Process ?
POP PROJECTS

Mining Consultancy Services © 2008 Mining Consultancy Services (Australia) Pty Ltd
Standards and Prep WorkAccountability
EVERYONE ISRESPONSIBLE FOR
EVERYTHING
NO ONE ISACCOUNTABLE FOR
ANYTHING
EVERYONE ISRESPONSIBLE FOR
SOMETHING(defined)
EVERYONE ISACCOUNTABLE FOR
SOMETHING(defined)
Floor Cleaning, Roadway Construction, Water Control,Pipe Extensions, Panel Supplies, Panel Advance Prep

Mining Consultancy Services © 2008 Mining Consultancy Services (Australia) Pty Ltd
Decrease Length of Panel Extensions::� Improve Planning and Coordination� Adherence to the plan� Implementation of Panel Advance Control Chart� Water management to prevent water build-up� Roadway conditions (build & maintain roads on advance)� Supply & Logistics
Panel Extensions

Mining Consultancy Services © 2008 Mining Consultancy Services (Australia) Pty Ltd
Process Based Training-Training is Key to Sustainability-
MCS Training Academy
World leadingcompetency based
mining processtraining courses tocomplement and
sustain POP and CI
Modular courses
Mentoring program Customised training tools
Formalisedassessment
Mining Consultancy Services © 2008 Mining Consultancy Services (Australia) Pty Ltd
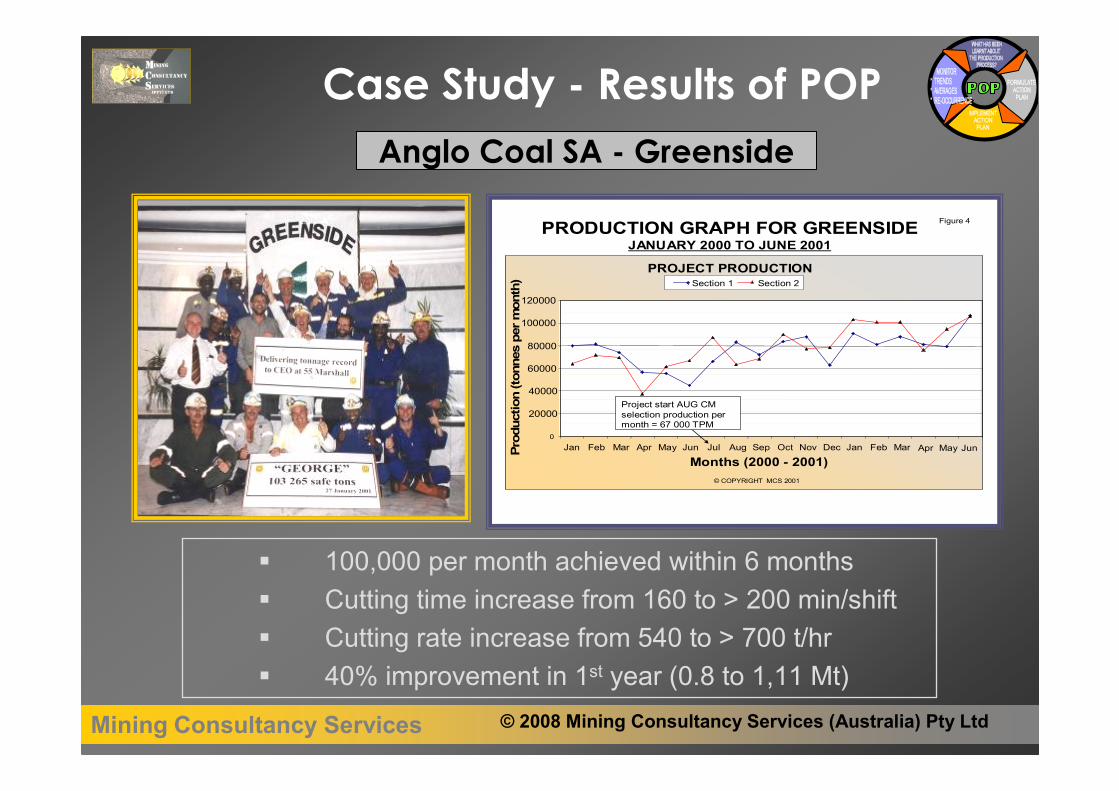
Case Study - Results of POPAnglo Coal SA - Greenside
� 100,000 per month achieved within 6 months� Cutting time increase from 160 to > 200 min/shift� Cutting rate increase from 540 to > 700 t/hr� 40% improvement in 1st year (0.8 to 1,11 Mt)
PRODUCTION GRAPH FOR GREENSIDEJANUARY 2000 TO JUNE 2001
PROJECT PRODUCTION
0
20000
40000
60000
80000
100000
120000
Jan Feb Mar Apr May Jun Jul Aug Sep Oct Nov Dec Jan Feb Mar
Months (2000 - 2001)
Prod
uctio
n (to
nnes
per
mon
th) Section 1 Section 2
JunMayApr
Project start AUG CMselection production permonth = 67 000 TPM
© COPYRIGHT MCS 2001
Figure 4
Mining Consultancy Services © 2008 Mining Consultancy Services (Australia) Pty Ltd
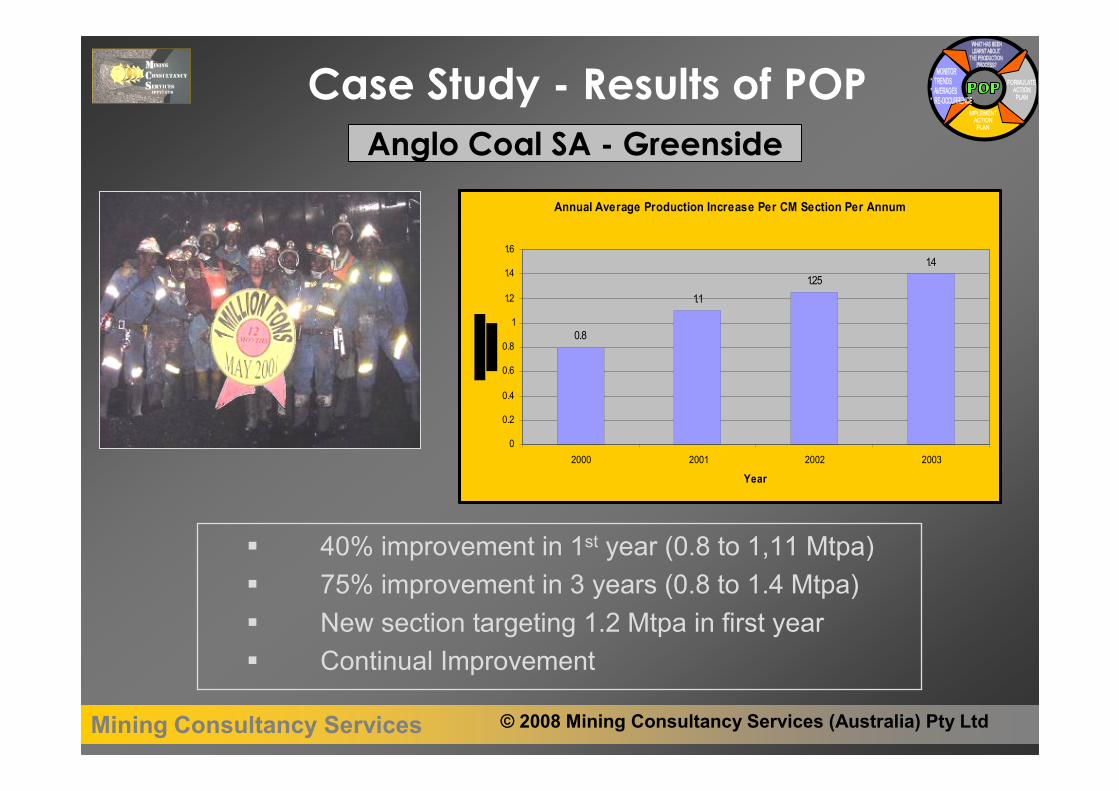
Anglo Coal SA - Greenside
� 40% improvement in 1st year (0.8 to 1,11 Mtpa)� 75% improvement in 3 years (0.8 to 1.4 Mtpa)� New section targeting 1.2 Mtpa in first year� Continual Improvement
Annual Average Production Increase Per CM Section Per Annum
0.8
1.11.25
1.4
0
0.2
0.4
0.6
0.8
1
1.2
1.4
1.6
2000 2001 2002 2003
Year
Case Study - Results of POP


