Australian Human Rights Commission
2015-16 Complaint statistics
2015 - 2016 Complaint statistics
Enquiries and complaints received
In 2015-16 the Commission received 16 836 enquiries. The majority of enquiries (63%) were received via the Commission’s National Information Hotline. The main issues raised by enquirers in this reporting year related to disability discrimination (18%), general employment matters including harassment and bullying (15%), discrimination on grounds covered by the Sex Discrimination Act (11%), human rights related issues including immigration and immigration detention (7%) and racial discrimination including racial hatred (7%).
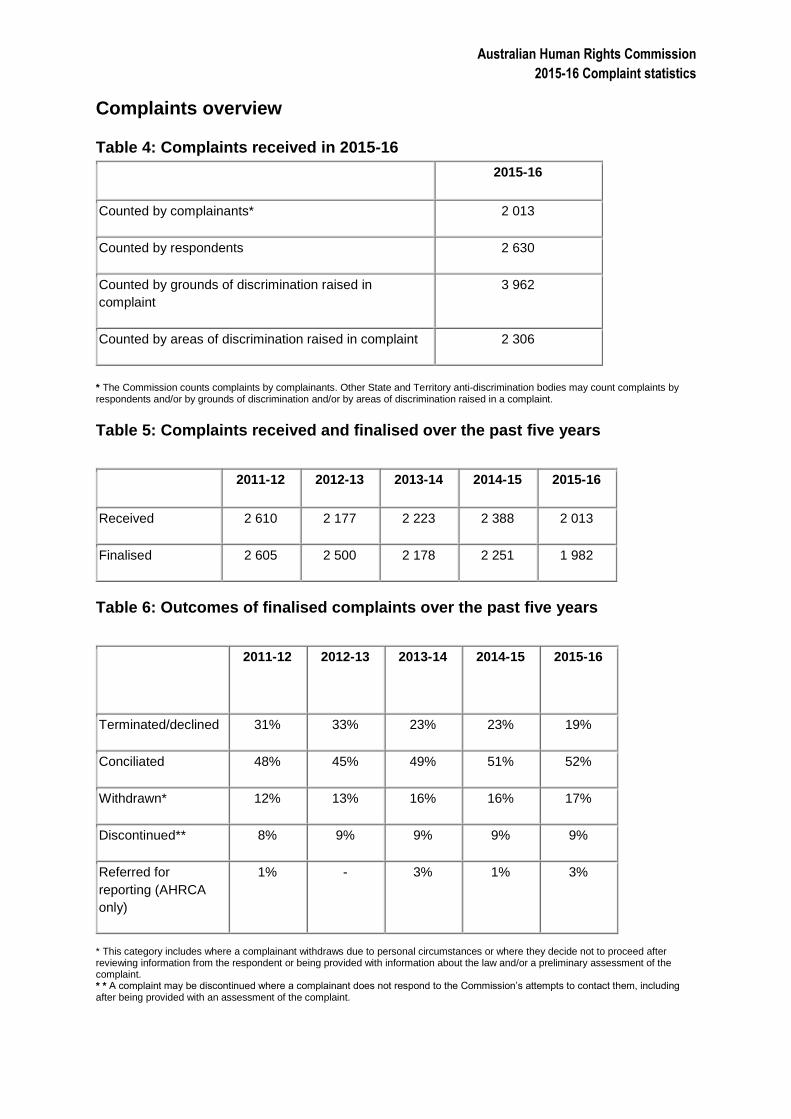
In 2015-16 the Commission received 2 013 complaints. One complaint may raise a number of grounds and areas of discrimination and be against one or more respondents. If the Commission counted complaints by respondents, the number of complaints received in 2015-16 would increase to 2 630. If the Commission counted complaints received by grounds and areas of discrimination, the number of complaints received would increase to 3 962 and 2 306 respectively.
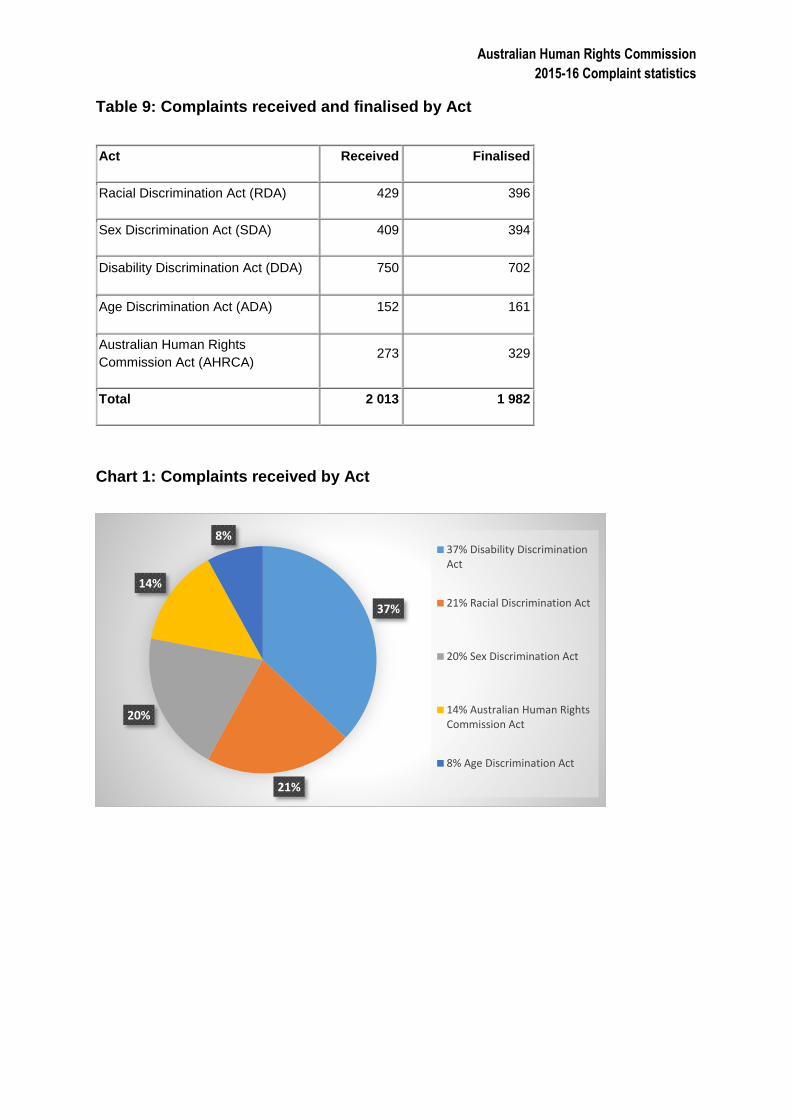
In 2015-16:
37% of complaints were lodged under the Disability Discrimination Act
21% of complaints were lodged under the Racial Discrimination Act
20% of complaints were lodged under the Sex Discrimination Act
14% of complaints were lodged under the Australian Human Rights Commission Act
8% of complaints were lodged under the Age Discrimination Act. Complaints about employment made up 82% of complaints under the Sex Discrimination Act, 62% of complaints under the Age Discrimination Act, 35% of complaints under the Disability Discrimination Act and 21% of complaints under the Racial Discrimination Act. The provision of goods, services and facilities was the other main area of complaint making up 33% of complaints under the Disability Discrimination Act, 23% of complaints under the Age Discrimination Act, 18% of complaints under the Racial Discrimination Act and 12% of complaints under the Sex Discrimination Act.
Outcomes of complaints
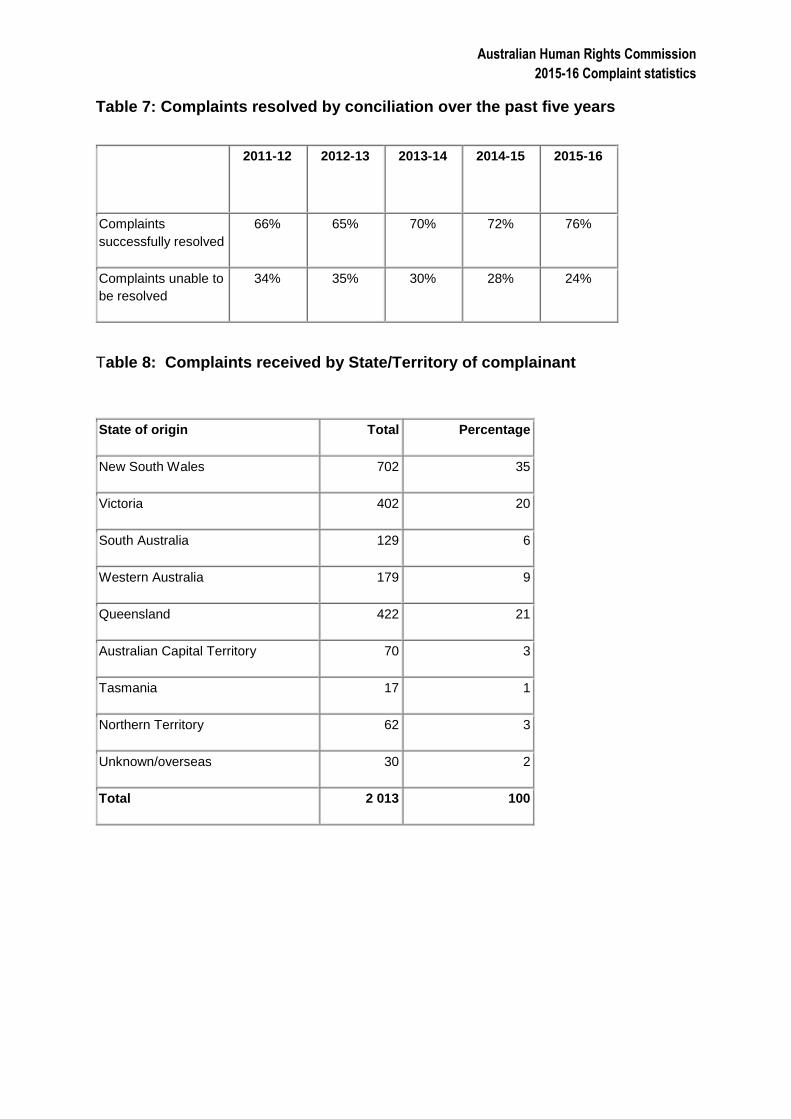
The Commission finalised 1 982 complaints during 2015-16. The Commission conducted approximately 1 308 conciliation processes of which 989 complaints (76%) were successfully resolved. This represents successful dispute resolution for more than 1 978 people and organisations involved in complaints before the Commission. The conciliation success rate in 2015-16 is the highest on record.
Information on the outcomes of conciliated complaints under federal anti-discrimination law indicates that 34% included terms which will have benefits for people beyond the individual complainant. For example, agreements to introduce anti-discrimination policies and provide anti-discrimination training in workplaces and agreements to undertake modifications to buildings and services to address potential discriminatory factors. Commission survey data also highlights the educative effect of the Commission’s complaint process. For example, in relation to conciliated complaints, 72% of surveyed participants indicated that
Australian Human Rights Commission
2015-16 Complaint statistics
involvement in the complaint process had assisted them to better understand rights and responsibilities under federal human rights and anti-discrimination law1. Data provided to the Commission indicates that in 2015-16, approximately 3% of finalised complaints regarding unlawful discrimination proceeded to court.
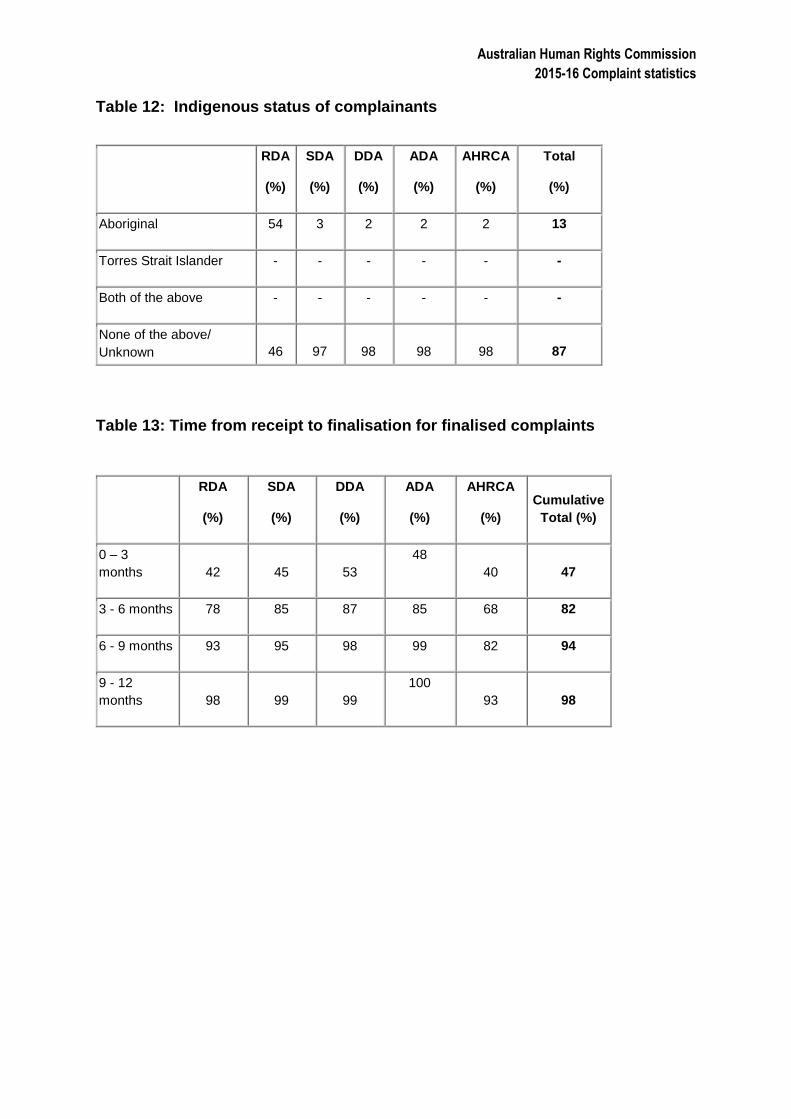
Timeliness of the complaint process In 2015-16, just under half of all complaints were finalised within 3 months (47%), 82% were finalised within 6 months, 94% within 9 months and 98% within 12 months. The average time from receipt to finalisation of a complaint was approximately 3.8 months.
Demographic data Information on the geographical location and ethnicity of complainants is provided in the Tables 8, 11 and 12 below. Available demographic data indicates that in 2015-16, 50% of complaints were lodged by individual females, 47% by individual males and 3% by other categories. Other categories include intersex, sex not specified, joint/multiple complainants and organisations. Where referral source was identified, 41% of complainants reported that they knew about the Commission prior to lodging their complaint. The other main identified referral sources were private lawyers (19%), family members, friends or support people (11%), the internet (9%), Community Legal Centres (4%) and specialist advocacy agencies such as advocacy agencies for people with disabilities, women, migrants or Aboriginal and Torres Strait Islander peoples (4%). The majority of complainants (67%) indicated that their main source of income at the time of the alleged act was from a form of employment. The majority of complainants (51%) indicated they were in full or part-time permanent employment, 14% were engaged in casual, contract or outwork and 2% were self-employed.
Approximately 39% of complainants said they were represented at the beginning of the complaint process which is consistent with the average level of representation over recent years. Of these complainants, 48% said they were represented by privately funded solicitors. Other identified forms of representation were family members or friends (22%), community legal centres, including Aboriginal or disability legal services (13.5%), other advocacy groups such as working women’s centres or disability advocacy services (13%) and trade unions or professional associations (3.5%). In 2015-16, the main respondent organisation categories were private enterprise (50%), State departments/statutory authorities (20%) and Commonwealth departments/statutory authorities (16%). These consistently are the main respondent organisation categories.
Satisfaction with the complaint service
We seek feedback on aspects of the service from people lodging complaints (complainants) and people responding to complaints (respondents). The survey can be completed online or in other formats.
Australian Human Rights Commission
2015-16 Complaint statistics
Feedback is sought regardless of the outcome of the complaint and include feedback from parties where the complaint was terminated, withdrawn or discontinued.
In 2015-16, 223 complainants and 247 respondents agreed to participate in the survey. Details of survey feedback is provided below.
94% of surveyed parties (88% of complainants and 98% of respondents) reported that they were satisfied with the service provided and 73% (68% of complainants and 78% of respondents) rated the service as ‘very good’ or ‘excellent’. Where complaints were conciliated, these figures increased with 98% reporting they were satisfied with the service and 82% rating the service as ‘very good ‘or ‘excellent’.
94% of participants (93% of complainants and 95% of respondents) felt that Commission staff explained things in a way that was easy for them to understand.
94% of participants (93% of complainants and 95% of respondents) felt that forms and correspondence from the Commission were easy to understand.
79% of participants (75% of complainants and 83% of respondents) felt that the Commission dealt with the complaint in a timely manner.
88% of participants (82% of complainants and 93% of respondents) felt they were treated fairly.
Our Charter of Service provides an avenue through which complainants and respondents can understand the nature and standard of service they can expect, as well as contribute to continual improvement of our service. All complainants are provided with a copy of the Charter when their complaint is accepted by the Commission. Respondents receive a copy when notified of a complaint. Our Charter of Service is available at http://www.humanrights.gov.au/complaints-charter-service. In 2015–16 the Commission received one complaint about its service under the complaint process provided in the Charter.
Australian Human Rights Commission
2015-16 Complaint statistics
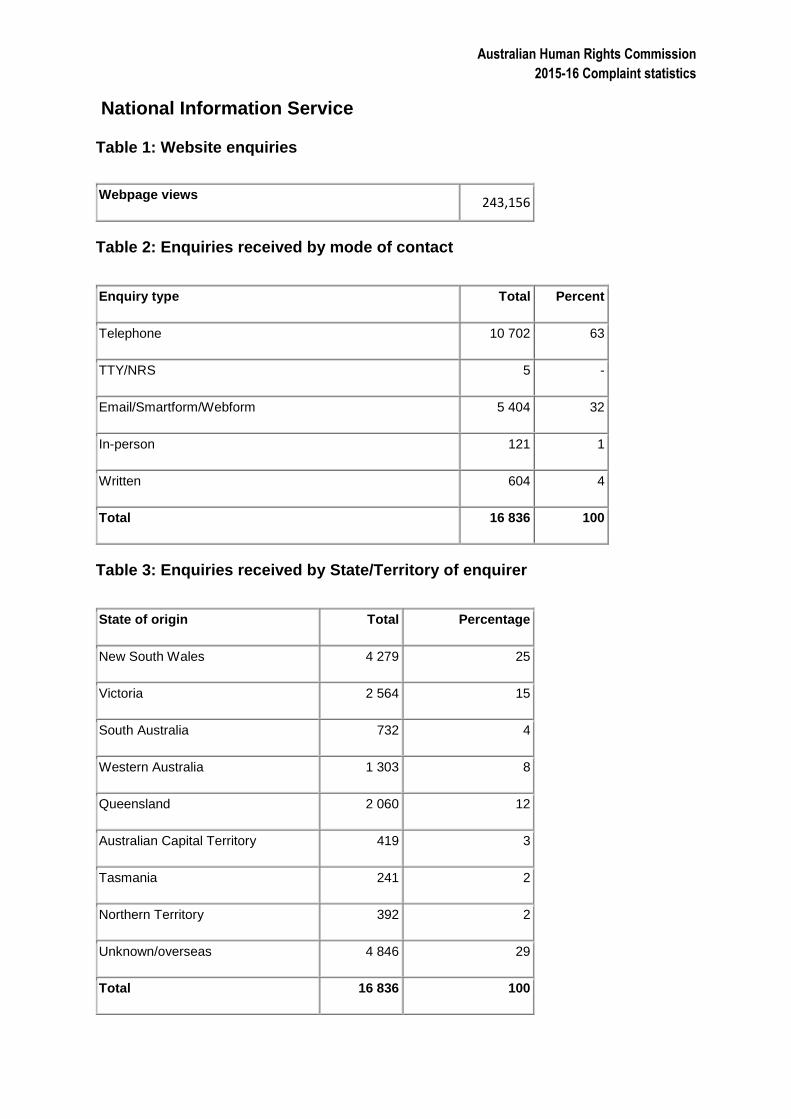
National Information Service
Table 1: Website enquiries
Webpage views 243,156
Table 2: Enquiries received by mode of contact
Enquiry type Total Percent
Telephone 10 702 63
TTY/NRS 5 -
Email/Smartform/Webform 5 404 32
In-person 121 1
Written 604 4
Total 16 836 100
Table 3: Enquiries received by State/Territory of enquirer
State of origin Total Percentage
New South Wales 4 279 25
Victoria 2 564 15
South Australia 732 4
Western Australia 1 303 8
Queensland 2 060 12
Australian Capital Territory 419 3
Tasmania 241 2
Northern Territory 392 2
Unknown/overseas 4 846 29
Total 16 836 100
Australian Human Rights Commission
2015-16 Complaint statistics
Complaints overview
Table 4: Complaints received in 2015-16
2015-16
Counted by complainants* 2 013
Counted by respondents 2 630
Counted by grounds of discrimination raised in
complaint
3 962
Counted by areas of discrimination raised in complaint 2 306
* The Commission counts complaints by complainants. Other State and Territory anti-discrimination bodies may count complaints by respondents and/or by grounds of discrimination and/or by areas of discrimination raised in a complaint.
Table 5: Complaints received and finalised over the past five years
2011-12 2012-13 2013-14 2014-15 2015-16
Received 2 610 2 177 2 223 2 388 2 013
Finalised 2 605 2 500 2 178 2 251 1 982
Table 6: Outcomes of finalised complaints over the past five years
2011-12
2012-13
2013-14 2014-15 2015-16
Terminated/declined 31% 33% 23% 23% 19%
Conciliated 48% 45% 49% 51% 52%
Withdrawn* 12% 13% 16% 16% 17%
Discontinued** 8% 9% 9% 9% 9%
Referred for
reporting (AHRCA
only)
1% - 3% 1% 3%
* This category includes where a complainant withdraws due to personal circumstances or where they decide not to proceed after reviewing information from the respondent or being provided with information about the law and/or a preliminary assessment of the complaint. * * A complaint may be discontinued where a complainant does not respond to the Commission’s attempts to contact them, including after being provided with an assessment of the complaint.
Australian Human Rights Commission
2015-16 Complaint statistics
Table 7: Complaints resolved by conciliation over the past five years
2011-12
2012-13 2013-14 2014-15 2015-16
Complaints
successfully resolved
66% 65% 70% 72% 76%
Complaints unable to
be resolved
34% 35% 30% 28% 24%
Table 8: Complaints received by State/Territory of complainant
State of origin Total Percentage
New South Wales 702 35
Victoria 402 20
South Australia 129 6
Western Australia 179 9
Queensland 422 21
Australian Capital Territory 70 3
Tasmania 17 1
Northern Territory 62 3
Unknown/overseas 30 2
Total 2 013 100
Australian Human Rights Commission
2015-16 Complaint statistics
Table 9: Complaints received and finalised by Act
Act Received Finalised
Racial Discrimination Act (RDA) 429 396
Sex Discrimination Act (SDA) 409 394
Disability Discrimination Act (DDA) 750 702
Age Discrimination Act (ADA) 152 161
Australian Human Rights
Commission Act (AHRCA) 273 329
Total 2 013 1 982
Chart 1: Complaints received by Act
37%
21%
20%
14%
8%37% Disability DiscriminationAct
21% Racial Discrimination Act
20% Sex Discrimination Act
14% Australian Human RightsCommission Act
8% Age Discrimination Act
Australian Human Rights Commission
2015-16 Complaint statistics
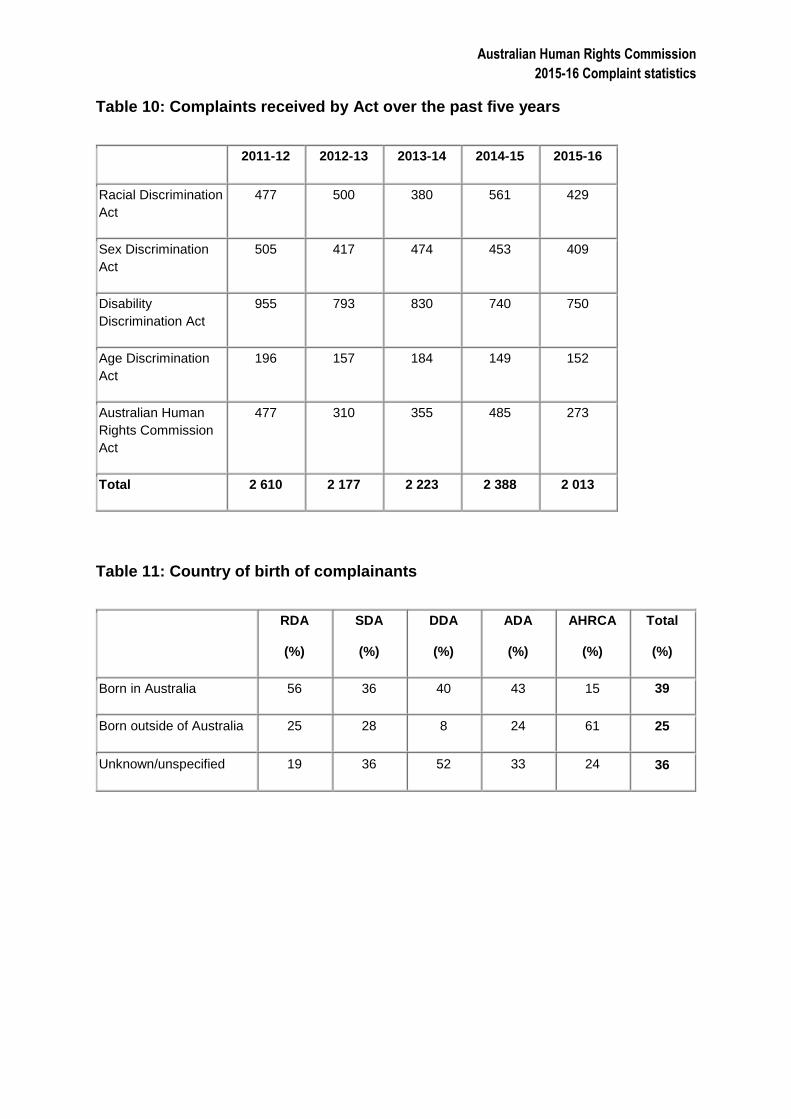
Table 10: Complaints received by Act over the past five years
2011-12 2012-13 2013-14 2014-15 2015-16
Racial Discrimination
Act
477 500 380 561 429
Sex Discrimination
Act
505 417 474 453 409
Disability
Discrimination Act
955 793 830 740 750
Age Discrimination
Act
196 157 184 149 152
Australian Human
Rights Commission
Act
477 310 355 485 273
Total 2 610 2 177 2 223 2 388 2 013
Table 11: Country of birth of complainants
A RDA
(%)
SDA
(%)
DDA
(%)
ADA
(%)
AHRCA
(%)
Total
(%)
Born in Australia 56 36 40 43 15 39
Born outside of Australia 25 28 8 24 61 25
Unknown/unspecified 19 36 52 33 24 36
Australian Human Rights Commission
2015-16 Complaint statistics
Table 12: Indigenous status of complainants
A RDA
(%)
SDA
(%)
DDA
(%)
ADA
(%)
AHRCA
(%)
Total
(%)
Aboriginal 54 3 2 2 2 13
Torres Strait Islander - - - - - -
Both of the above - - - - - -
None of the above/
Unknown 46 97 98 98 98 87
Table 13: Time from receipt to finalisation for finalised complaints
A RDA
(%)
SDA
(%)
DDA
(%)
ADA
(%)
AHRCA
(%)
Cumulative
Total (%)
0 – 3
months 42 45 53
48
40 47
3 - 6 months 78 85 87 85 68 82
6 - 9 months 93 95 98 99 82 94
9 - 12
months 98 99 99
100
93 98
Australian Human Rights Commission
2015-16 Complaint statistics
Racial Discrimination Act
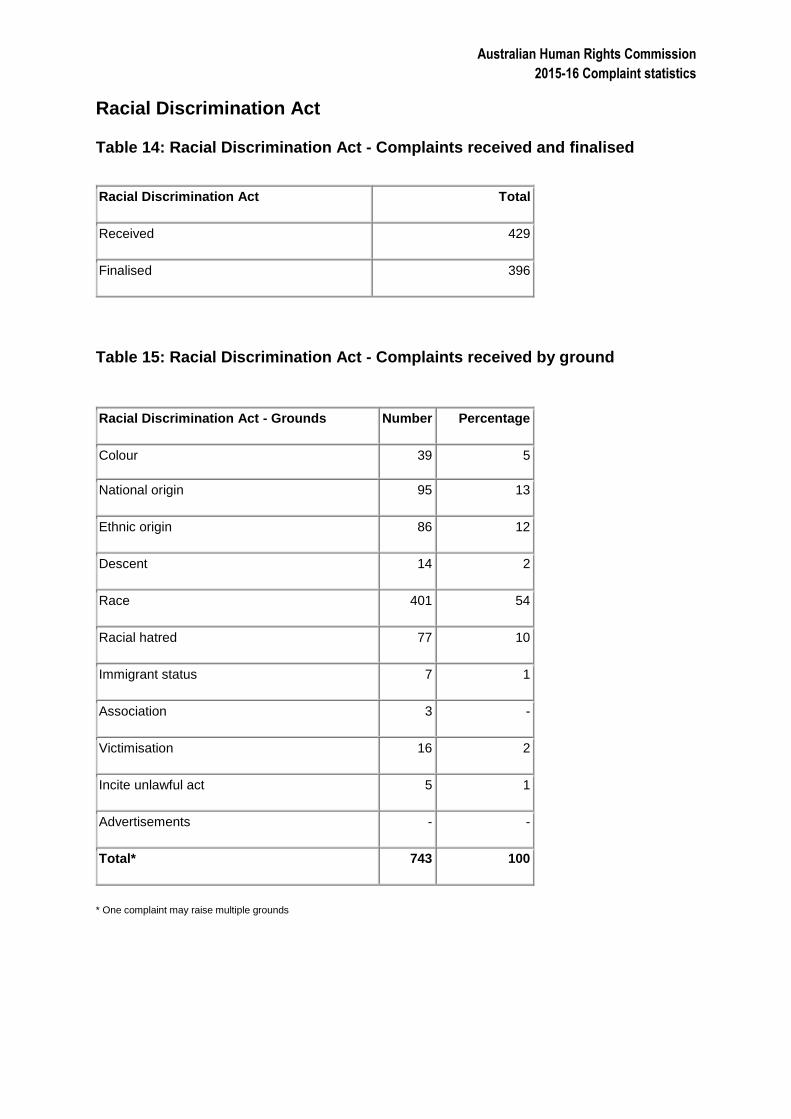
Table 14: Racial Discrimination Act - Complaints received and finalised
Racial Discrimination Act Total
Received 429
Finalised 396
Table 15: Racial Discrimination Act - Complaints received by ground
Racial Discrimination Act - Grounds Number Percentage
Colour 39 5
National origin 95 13
Ethnic origin 86 12
Descent 14 2
Race 401 54
Racial hatred 77 10
Immigrant status 7 1
Association 3 -
Victimisation 16 2
Incite unlawful act 5 1
Advertisements - -
Total* 743 100
* One complaint may raise multiple grounds
Australian Human Rights Commission
2015-16 Complaint statistics
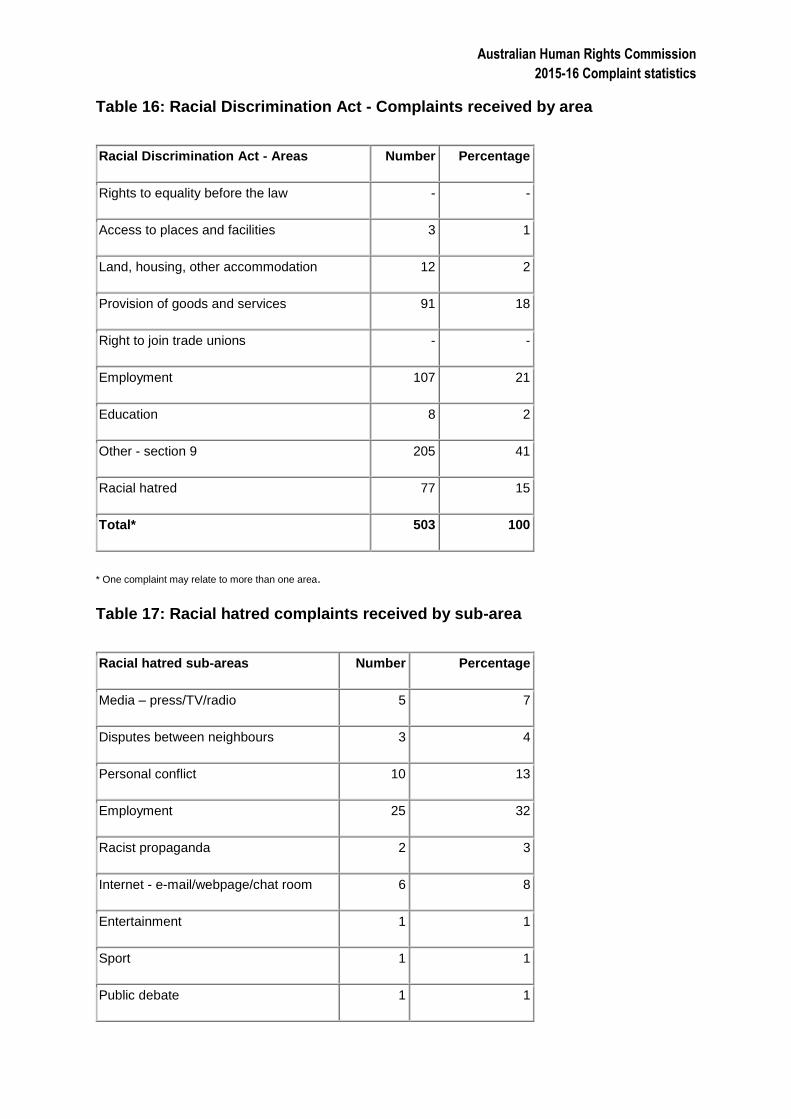
Table 16: Racial Discrimination Act - Complaints received by area
Racial Discrimination Act - Areas Number Percentage
Rights to equality before the law - -
Access to places and facilities 3 1
Land, housing, other accommodation 12 2
Provision of goods and services 91 18
Right to join trade unions - -
Employment 107 21
Education 8 2
Other - section 9 205 41
Racial hatred 77 15
Total* 503 100
* One complaint may relate to more than one area.
Table 17: Racial hatred complaints received by sub-area
Racial hatred sub-areas Number Percentage
Media – press/TV/radio 5 7
Disputes between neighbours 3 4
Personal conflict 10 13
Employment 25 32
Racist propaganda 2 3
Internet - e-mail/webpage/chat room 6 8
Entertainment 1 1
Sport 1 1
Public debate 1 1
Australian Human Rights Commission
2015-16 Complaint statistics
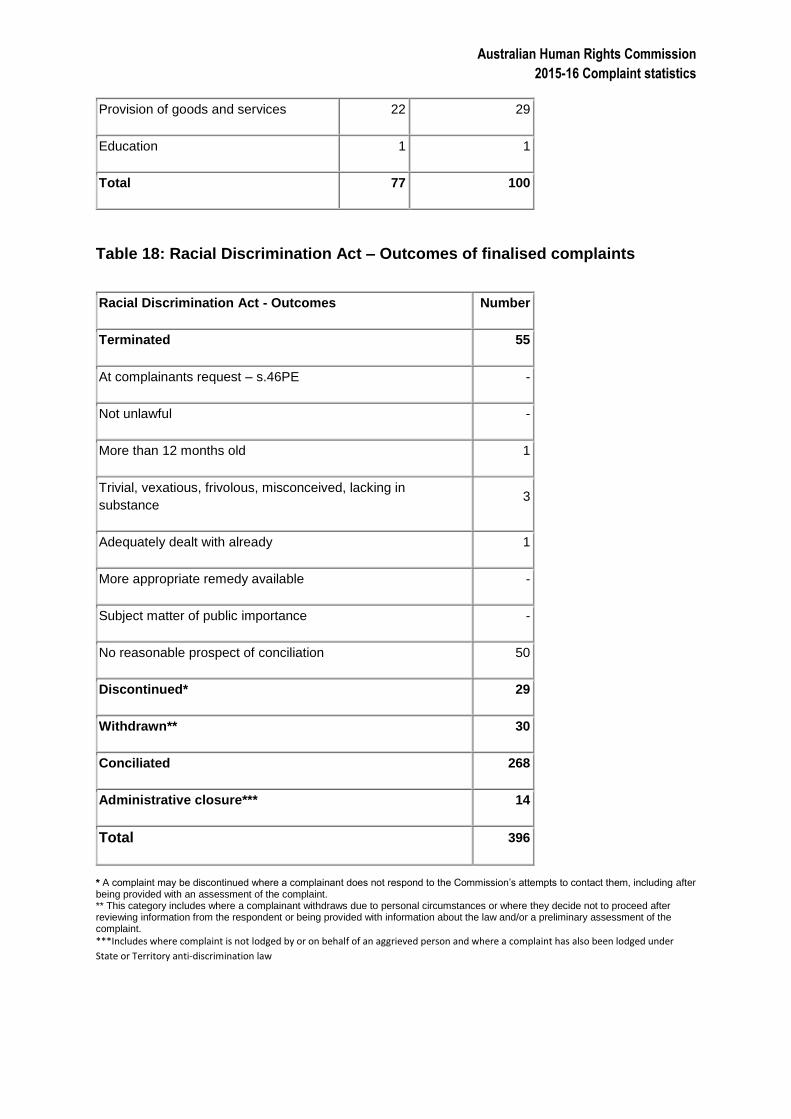
Table 18: Racial Discrimination Act – Outcomes of finalised complaints
Racial Discrimination Act - Outcomes Number
Terminated 55
At complainants request – s.46PE -
Not unlawful -
More than 12 months old 1
Trivial, vexatious, frivolous, misconceived, lacking in
substance 3
Adequately dealt with already 1
More appropriate remedy available -
Subject matter of public importance -
No reasonable prospect of conciliation 50
Discontinued* 29
Withdrawn** 30
Conciliated 268
Administrative closure*** 14
Total 396
* A complaint may be discontinued where a complainant does not respond to the Commission’s attempts to contact them, including after being provided with an assessment of the complaint. ** This category includes where a complainant withdraws due to personal circumstances or where they decide not to proceed after reviewing information from the respondent or being provided with information about the law and/or a preliminary assessment of the complaint.
***Includes where complaint is not lodged by or on behalf of an aggrieved person and where a complaint has also been lodged under
State or Territory anti-discrimination law
Provision of goods and services 22 29
Education 1 1
Total 77 100
Australian Human Rights Commission
2015-16 Complaint statistics
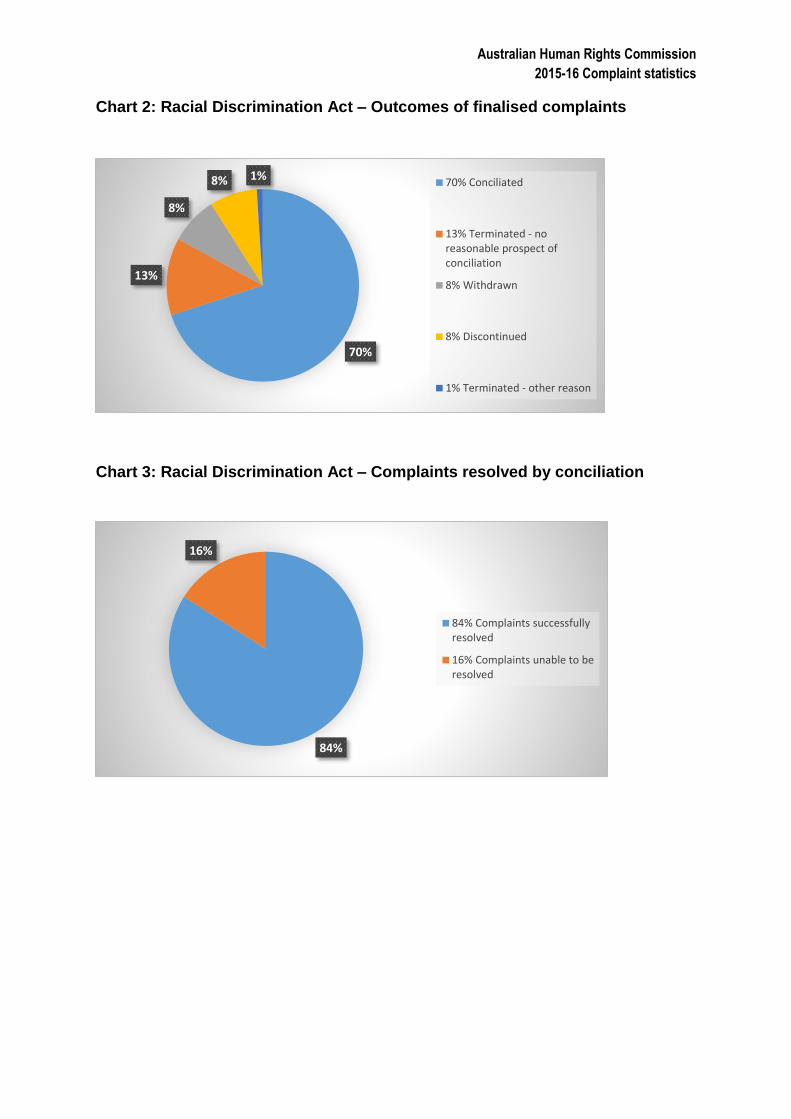
Chart 2: Racial Discrimination Act – Outcomes of finalised complaints
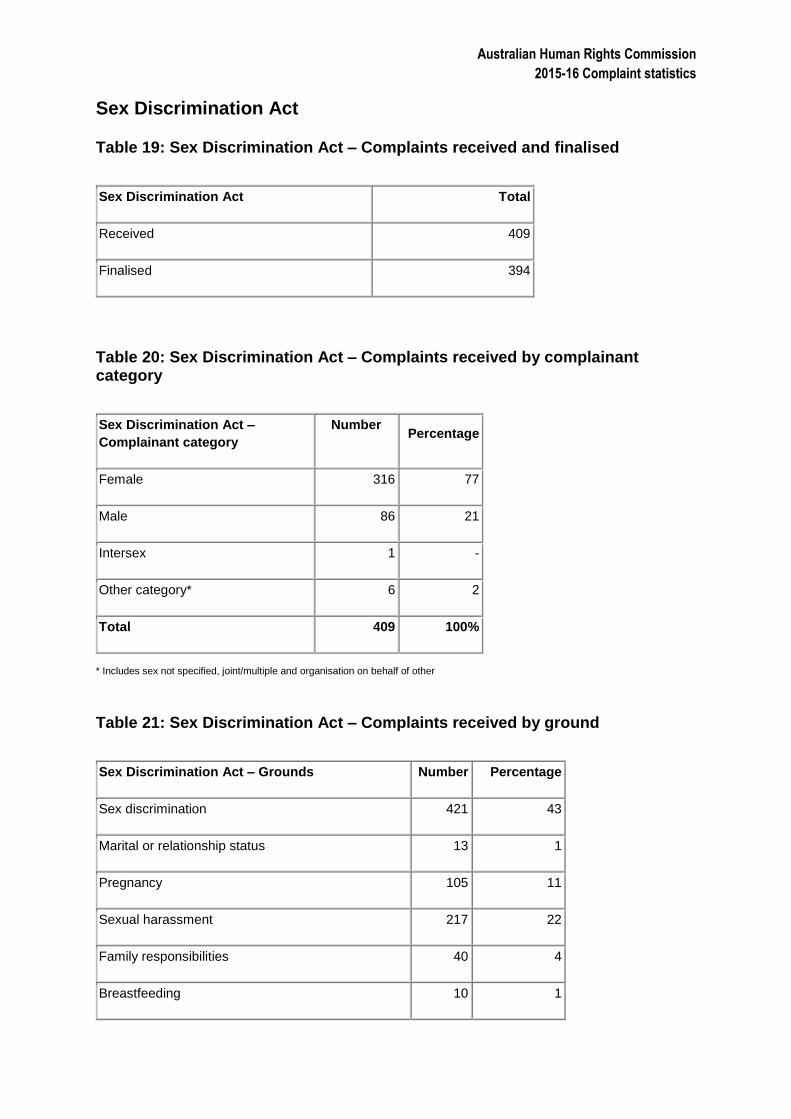
Chart 3: Racial Discrimination Act – Complaints resolved by conciliation
70%
13%
8%
8% 1%70% Conciliated
13% Terminated - noreasonable prospect ofconciliation
8% Withdrawn
8% Discontinued
1% Terminated - other reason
84%
16%
84% Complaints successfullyresolved
16% Complaints unable to beresolved
Australian Human Rights Commission
2015-16 Complaint statistics
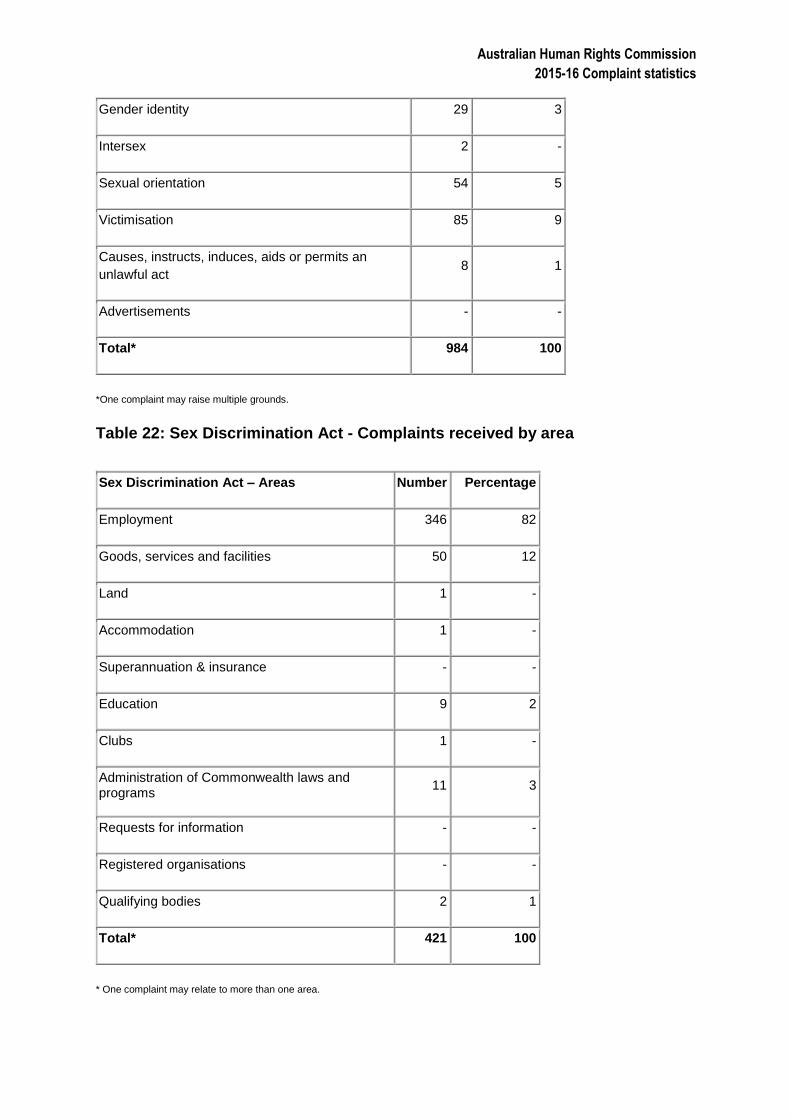
Sex Discrimination Act
Table 19: Sex Discrimination Act – Complaints received and finalised
Sex Discrimination Act Total
Received 409
Finalised 394
Table 20: Sex Discrimination Act – Complaints received by complainant category
Sex Discrimination Act –
Complainant category
Number Percentage
Female 316 77
Male 86 21
Intersex 1 -
Other category* 6 2
Total 409 100%
* Includes sex not specified, joint/multiple and organisation on behalf of other
Table 21: Sex Discrimination Act – Complaints received by ground
Sex Discrimination Act – Grounds Number Percentage
Sex discrimination 421 43
Marital or relationship status 13 1
Pregnancy 105 11
Sexual harassment 217 22
Family responsibilities 40 4
Breastfeeding 10 1
Australian Human Rights Commission
2015-16 Complaint statistics
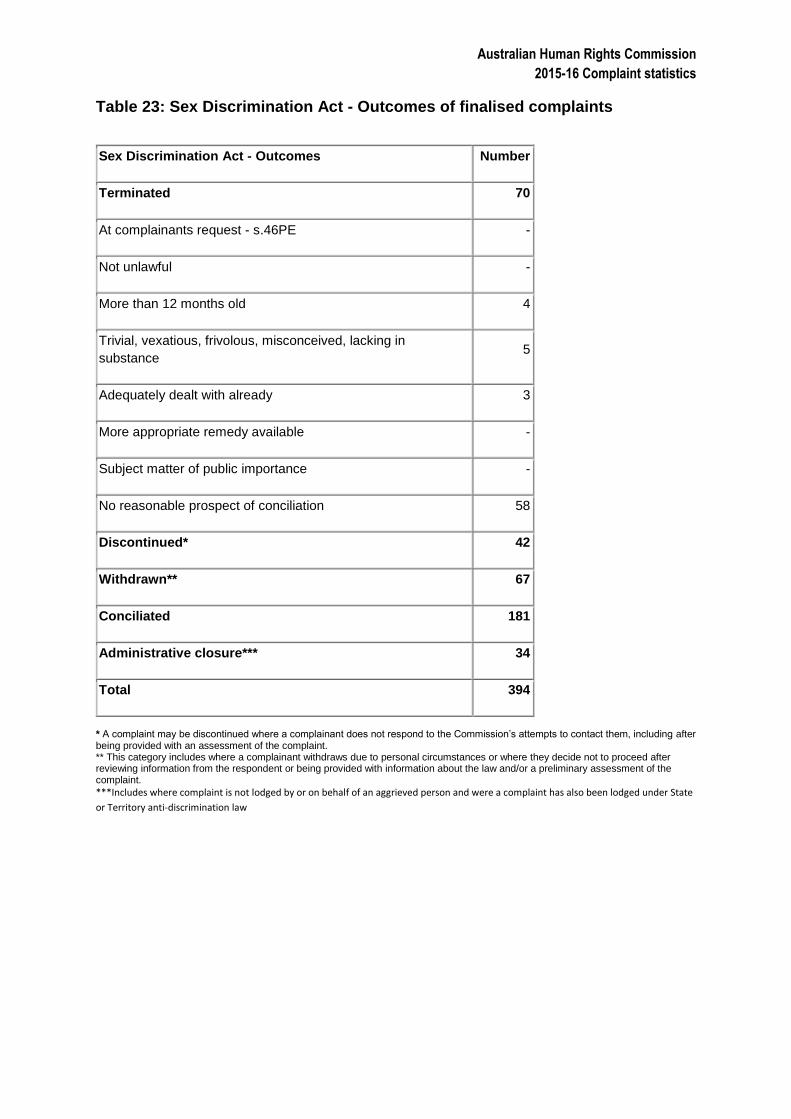
Gender identity 29 3
Intersex 2 -
Sexual orientation 54 5
Victimisation 85 9
Causes, instructs, induces, aids or permits an
unlawful act 8 1
Advertisements - -
Total* 984 100
*One complaint may raise multiple grounds.
Table 22: Sex Discrimination Act - Complaints received by area
Sex Discrimination Act – Areas Number Percentage
Employment 346 82
Goods, services and facilities 50 12
Land 1 -
Accommodation 1 -
Superannuation & insurance - -
Education 9 2
Clubs 1 -
Administration of Commonwealth laws and programs
11 3
Requests for information - -
Registered organisations - -
Qualifying bodies 2 1
Total* 421 100
* One complaint may relate to more than one area.
Australian Human Rights Commission
2015-16 Complaint statistics
Table 23: Sex Discrimination Act - Outcomes of finalised complaints
Sex Discrimination Act - Outcomes Number
Terminated 70
At complainants request - s.46PE -
Not unlawful -
More than 12 months old 4
Trivial, vexatious, frivolous, misconceived, lacking in
substance 5
Adequately dealt with already 3
More appropriate remedy available -
Subject matter of public importance -
No reasonable prospect of conciliation 58
Discontinued* 42
Withdrawn** 67
Conciliated 181
Administrative closure*** 34
Total 394
* A complaint may be discontinued where a complainant does not respond to the Commission’s attempts to contact them, including after being provided with an assessment of the complaint. ** This category includes where a complainant withdraws due to personal circumstances or where they decide not to proceed after reviewing information from the respondent or being provided with information about the law and/or a preliminary assessment of the complaint.
***Includes where complaint is not lodged by or on behalf of an aggrieved person and were a complaint has also been lodged under State
or Territory anti-discrimination law
Australian Human Rights Commission
2015-16 Complaint statistics
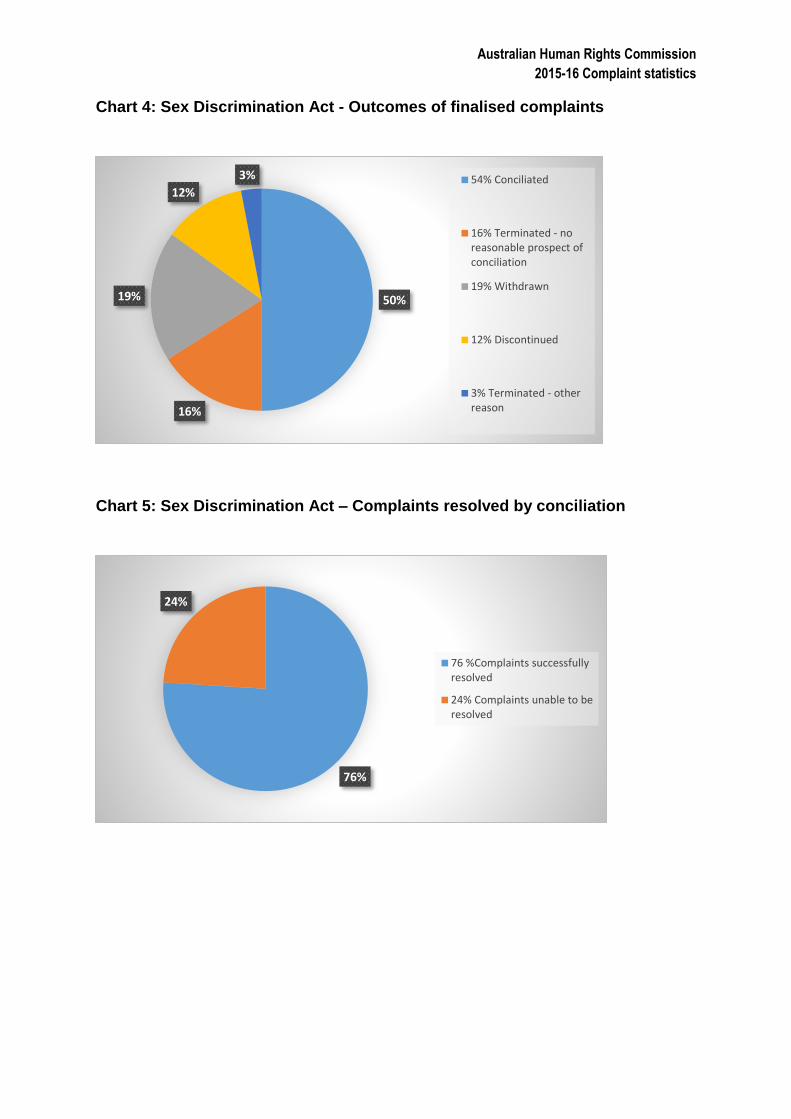
Chart 4: Sex Discrimination Act - Outcomes of finalised complaints
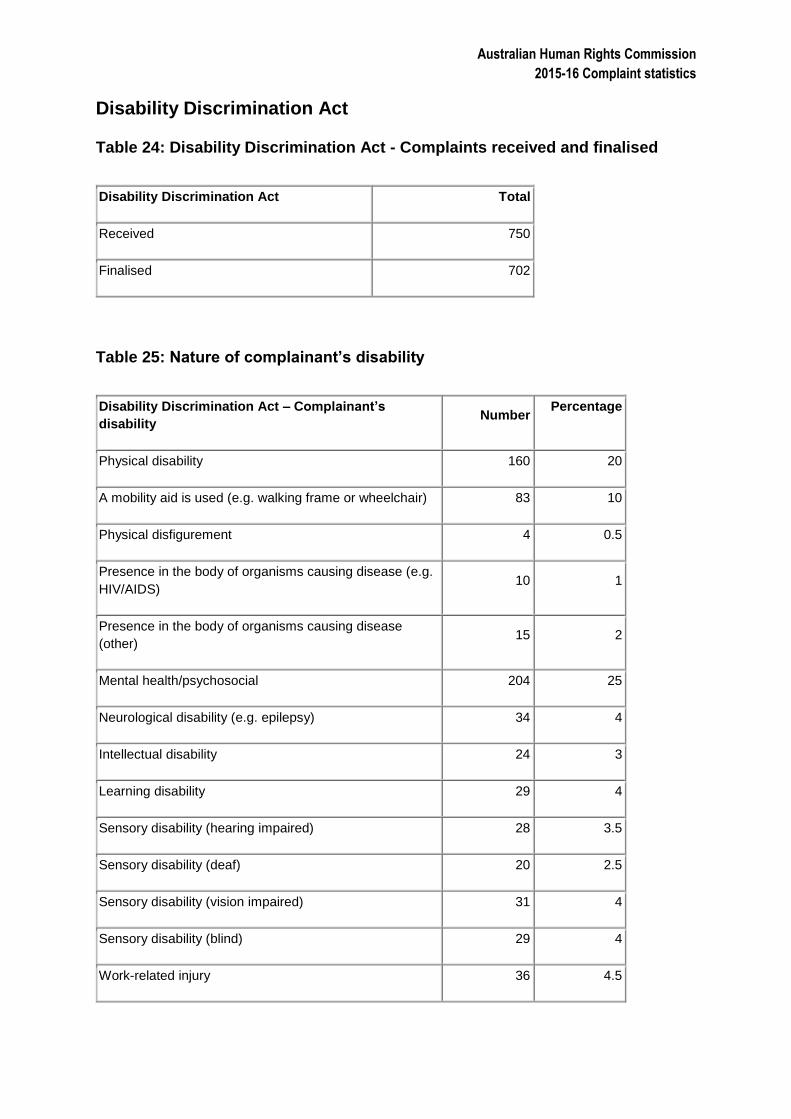
Chart 5: Sex Discrimination Act – Complaints resolved by conciliation
50%
16%
19%
12%
3% 54% Conciliated
16% Terminated - noreasonable prospect ofconciliation
19% Withdrawn
12% Discontinued
3% Terminated - otherreason
76%
24%
76 %Complaints successfullyresolved
24% Complaints unable to beresolved
Australian Human Rights Commission
2015-16 Complaint statistics
Disability Discrimination Act
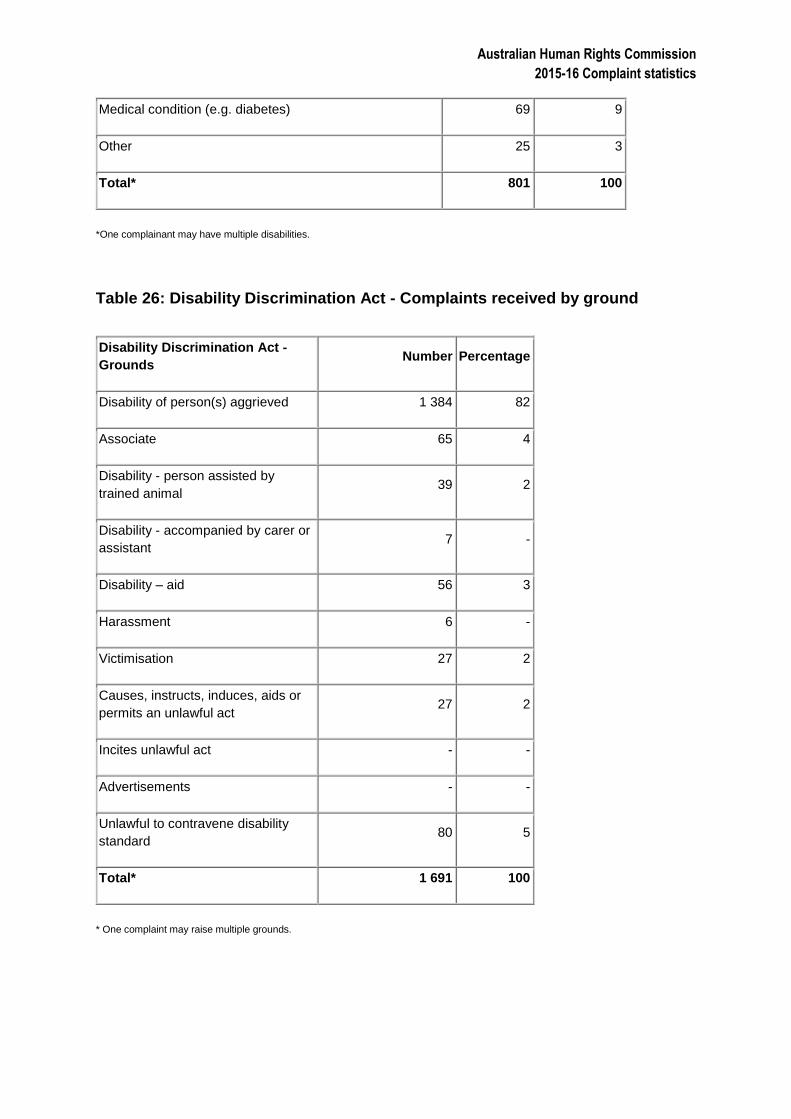
Table 24: Disability Discrimination Act - Complaints received and finalised
Disability Discrimination Act Total
Received 750
Finalised 702
Table 25: Nature of complainant’s disability
Disability Discrimination Act – Complainant’s
disability Number
Percentage
Physical disability 160 20
A mobility aid is used (e.g. walking frame or wheelchair) 83 10
Physical disfigurement 4 0.5
Presence in the body of organisms causing disease (e.g.
HIV/AIDS) 10 1
Presence in the body of organisms causing disease
(other) 15 2
Mental health/psychosocial 204 25
Neurological disability (e.g. epilepsy) 34 4
Intellectual disability 24 3
Learning disability 29 4
Sensory disability (hearing impaired) 28 3.5
Sensory disability (deaf) 20 2.5
Sensory disability (vision impaired) 31 4
Sensory disability (blind) 29 4
Work-related injury 36 4.5
Australian Human Rights Commission
2015-16 Complaint statistics
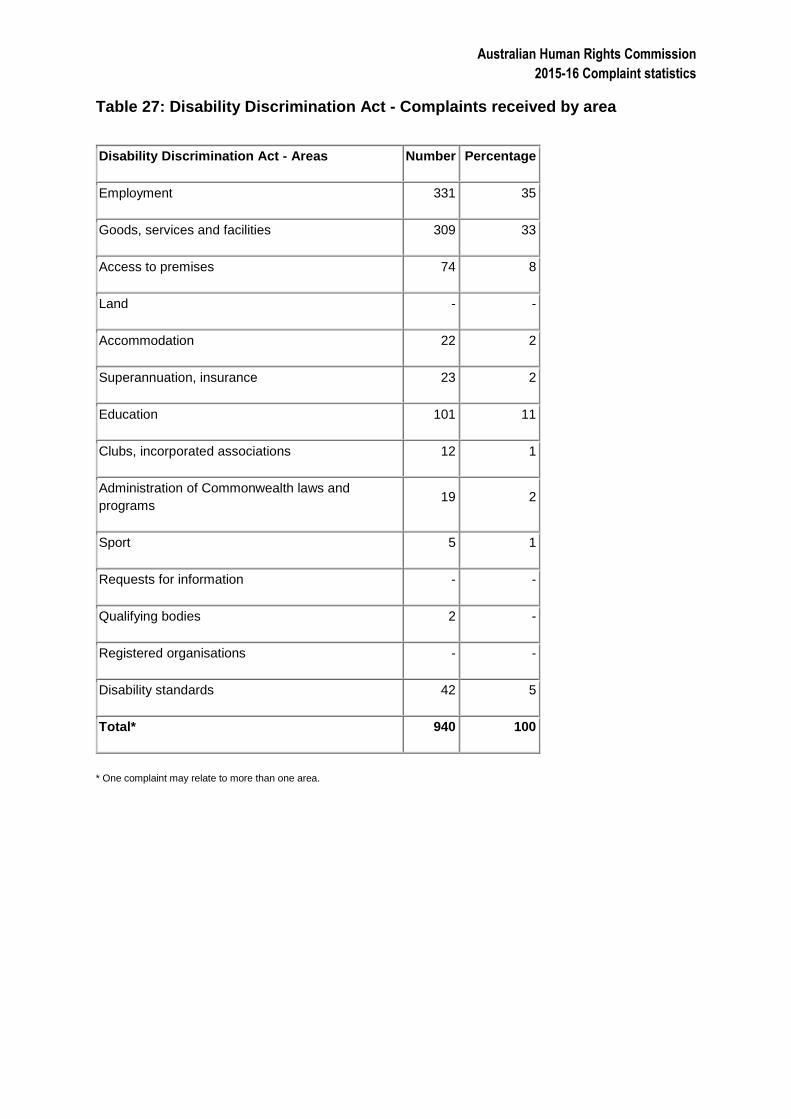
Medical condition (e.g. diabetes) 69 9
Other 25 3
Total* 801 100
*One complainant may have multiple disabilities.
Table 26: Disability Discrimination Act - Complaints received by ground
Disability Discrimination Act -
Grounds Number Percentage
Disability of person(s) aggrieved 1 384 82
Associate 65 4
Disability - person assisted by
trained animal 39 2
Disability - accompanied by carer or
assistant 7 -
Disability – aid 56 3
Harassment 6 -
Victimisation 27 2
Causes, instructs, induces, aids or
permits an unlawful act 27 2
Incites unlawful act - -
Advertisements - -
Unlawful to contravene disability
standard 80 5
Total* 1 691 100
* One complaint may raise multiple grounds.
Australian Human Rights Commission
2015-16 Complaint statistics
Table 27: Disability Discrimination Act - Complaints received by area
Disability Discrimination Act - Areas Number Percentage
Employment 331 35
Goods, services and facilities 309 33
Access to premises 74 8
Land - -
Accommodation 22 2
Superannuation, insurance 23 2
Education 101 11
Clubs, incorporated associations 12 1
Administration of Commonwealth laws and
programs 19 2
Sport 5 1
Requests for information - -
Qualifying bodies 2 -
Registered organisations - -
Disability standards 42 5
Total* 940 100
* One complaint may relate to more than one area.
Australian Human Rights Commission
2015-16 Complaint statistics
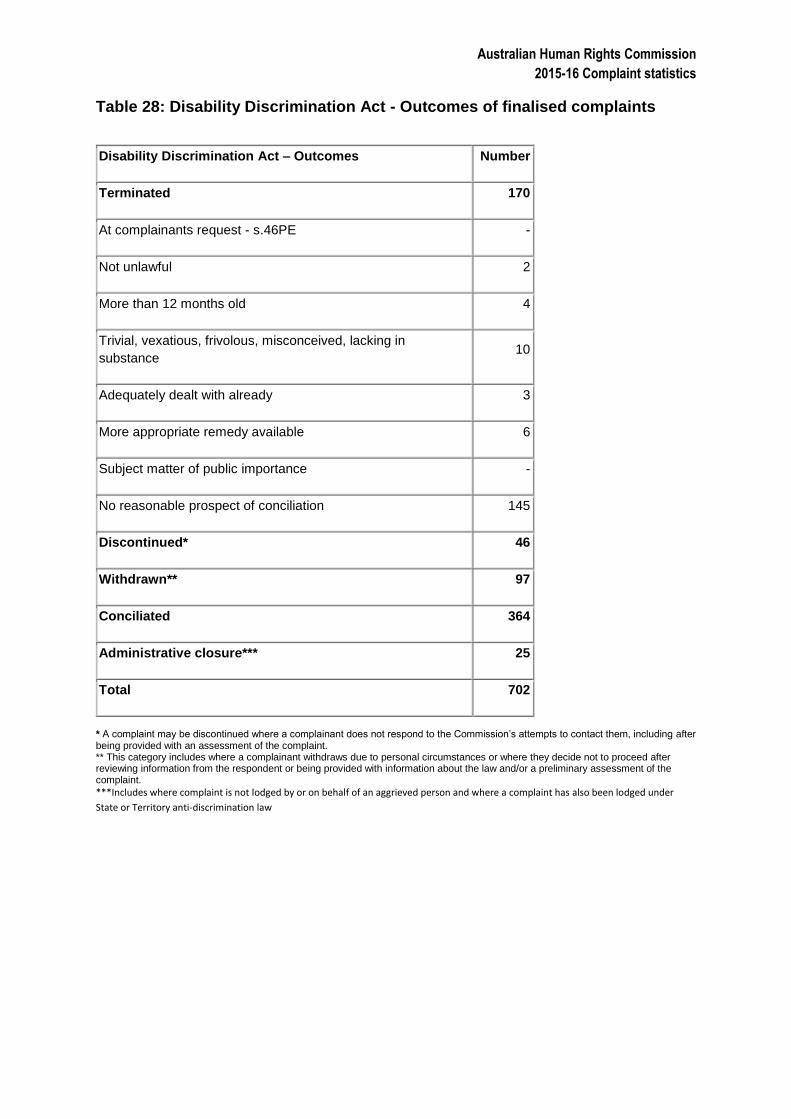
Table 28: Disability Discrimination Act - Outcomes of finalised complaints
Disability Discrimination Act – Outcomes Number
Terminated 170
At complainants request - s.46PE -
Not unlawful 2
More than 12 months old 4
Trivial, vexatious, frivolous, misconceived, lacking in
substance 10
Adequately dealt with already 3
More appropriate remedy available 6
Subject matter of public importance -
No reasonable prospect of conciliation 145
Discontinued* 46
Withdrawn** 97
Conciliated 364
Administrative closure*** 25
Total 702
* A complaint may be discontinued where a complainant does not respond to the Commission’s attempts to contact them, including after being provided with an assessment of the complaint. ** This category includes where a complainant withdraws due to personal circumstances or where they decide not to proceed after reviewing information from the respondent or being provided with information about the law and/or a preliminary assessment of the complaint.
***Includes where complaint is not lodged by or on behalf of an aggrieved person and where a complaint has also been lodged under
State or Territory anti-discrimination law
Australian Human Rights Commission
2015-16 Complaint statistics
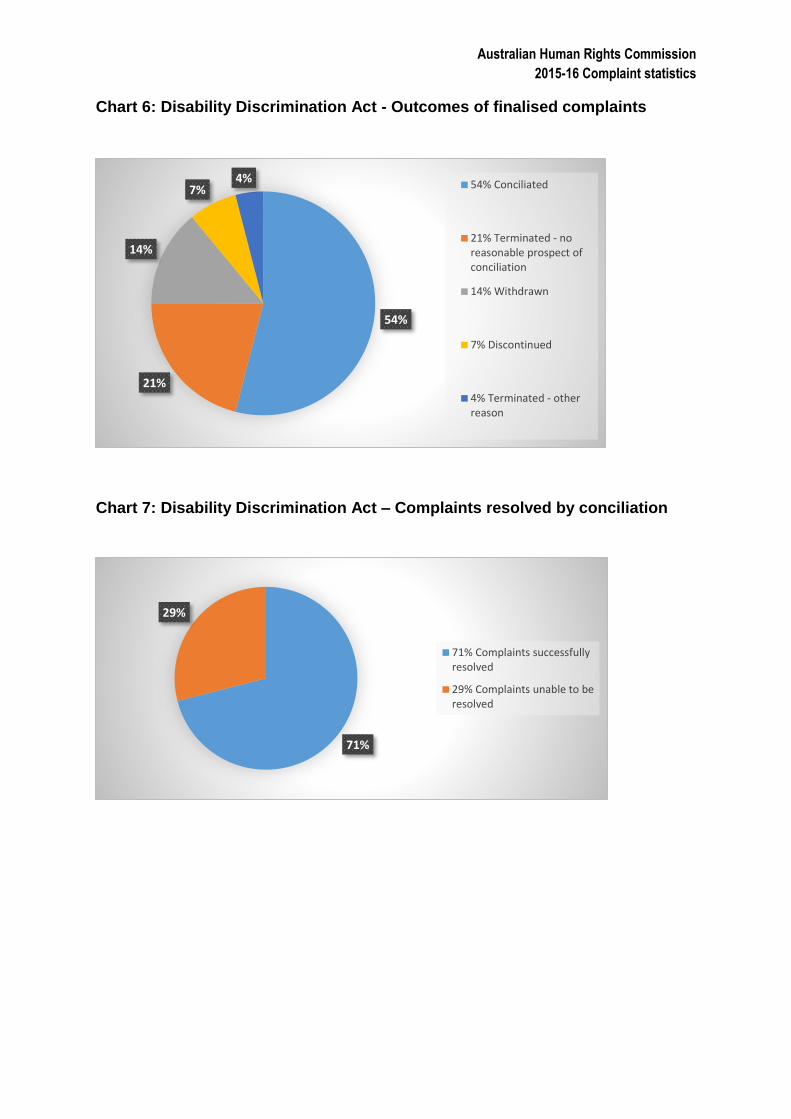
Chart 6: Disability Discrimination Act - Outcomes of finalised complaints
Chart 7: Disability Discrimination Act – Complaints resolved by conciliation
54%
21%
14%
7%4% 54% Conciliated
21% Terminated - noreasonable prospect ofconciliation
14% Withdrawn
7% Discontinued
4% Terminated - otherreason
71%
29%
71% Complaints successfullyresolved
29% Complaints unable to beresolved
Australian Human Rights Commission
2015-16 Complaint statistics
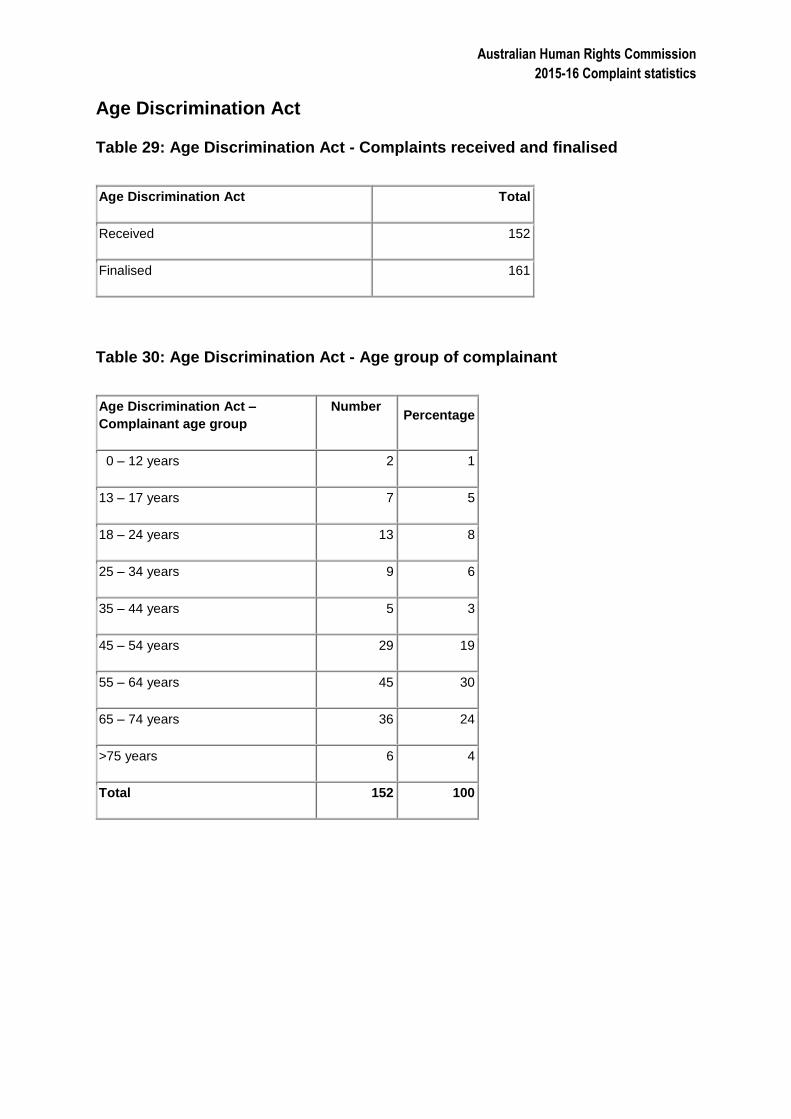
Age Discrimination Act
Table 29: Age Discrimination Act - Complaints received and finalised
Age Discrimination Act Total
Received 152
Finalised 161
Table 30: Age Discrimination Act - Age group of complainant
Age Discrimination Act –
Complainant age group
Number Percentage
0 – 12 years 2 1
13 – 17 years 7 5
18 – 24 years 13 8
25 – 34 years 9 6
35 – 44 years 5 3
45 – 54 years 29 19
55 – 64 years 45 30
65 – 74 years 36 24
>75 years 6 4
Total 152 100
Australian Human Rights Commission
2015-16 Complaint statistics
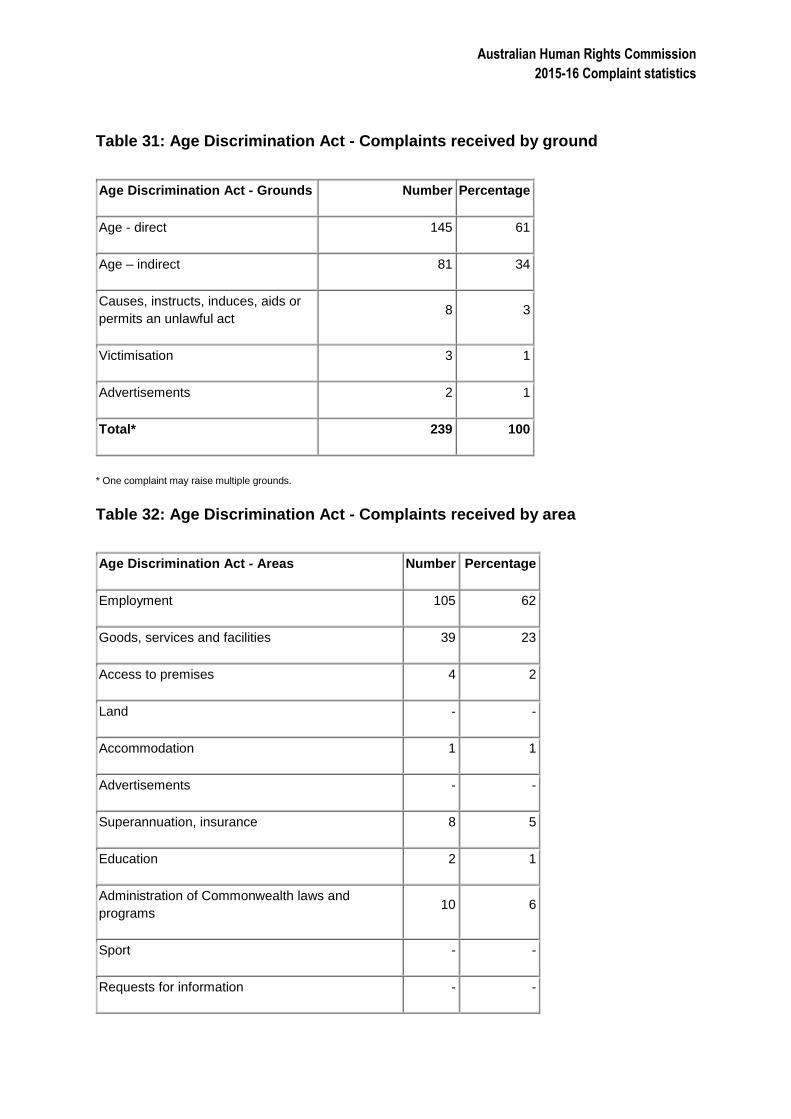
Table 31: Age Discrimination Act - Complaints received by ground
Age Discrimination Act - Grounds Number Percentage
Age - direct 145 61
Age – indirect 81 34
Causes, instructs, induces, aids or
permits an unlawful act 8 3
Victimisation 3 1
Advertisements 2 1
Total* 239 100
* One complaint may raise multiple grounds.
Table 32: Age Discrimination Act - Complaints received by area
Age Discrimination Act - Areas Number Percentage
Employment 105 62
Goods, services and facilities 39 23
Access to premises 4 2
Land - -
Accommodation 1 1
Advertisements - -
Superannuation, insurance 8 5
Education 2 1
Administration of Commonwealth laws and
programs 10 6
Sport - -
Requests for information - -
Australian Human Rights Commission
2015-16 Complaint statistics
Registered organisations - -
Qualifying bodies - -
Victimisation - -
Total* 169 100
* One complaint may relate to more than one area.
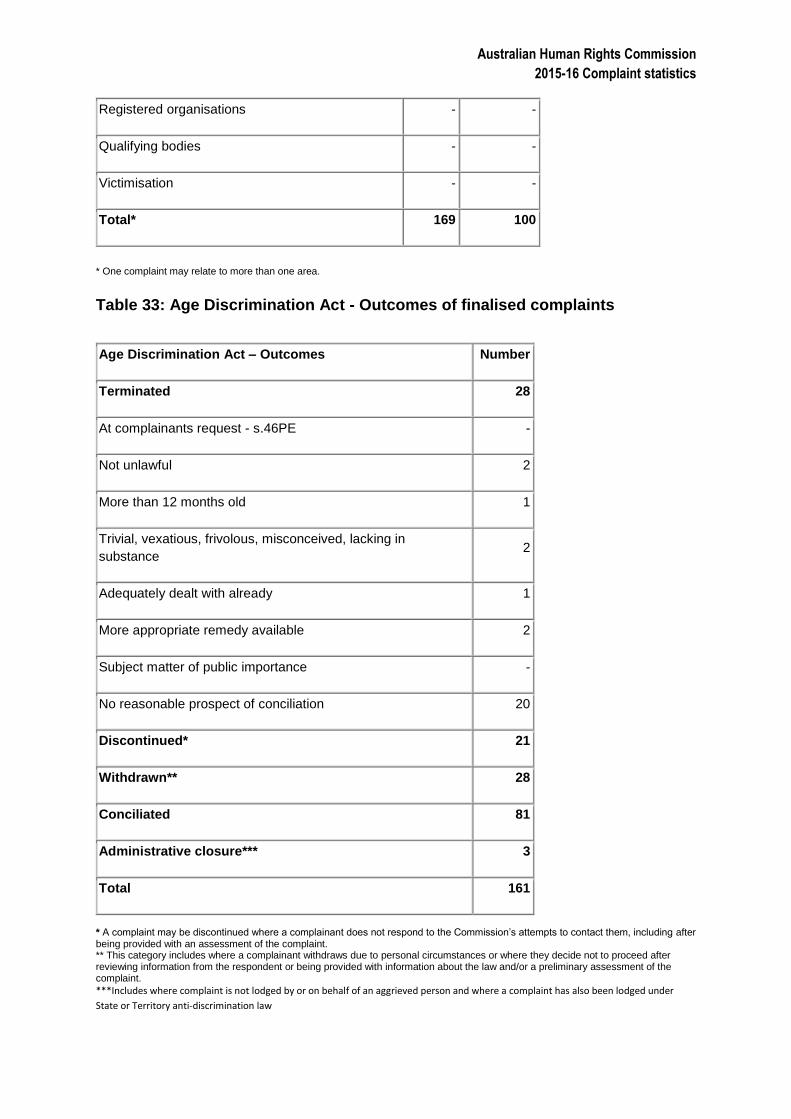
Table 33: Age Discrimination Act - Outcomes of finalised complaints
Age Discrimination Act – Outcomes Number
Terminated 28
At complainants request - s.46PE -
Not unlawful 2
More than 12 months old 1
Trivial, vexatious, frivolous, misconceived, lacking in
substance 2
Adequately dealt with already 1
More appropriate remedy available 2
Subject matter of public importance -
No reasonable prospect of conciliation 20
Discontinued* 21
Withdrawn** 28
Conciliated 81
Administrative closure*** 3
Total 161
* A complaint may be discontinued where a complainant does not respond to the Commission’s attempts to contact them, including after being provided with an assessment of the complaint. ** This category includes where a complainant withdraws due to personal circumstances or where they decide not to proceed after reviewing information from the respondent or being provided with information about the law and/or a preliminary assessment of the complaint.
***Includes where complaint is not lodged by or on behalf of an aggrieved person and where a complaint has also been lodged under
State or Territory anti-discrimination law
Australian Human Rights Commission
2015-16 Complaint statistics
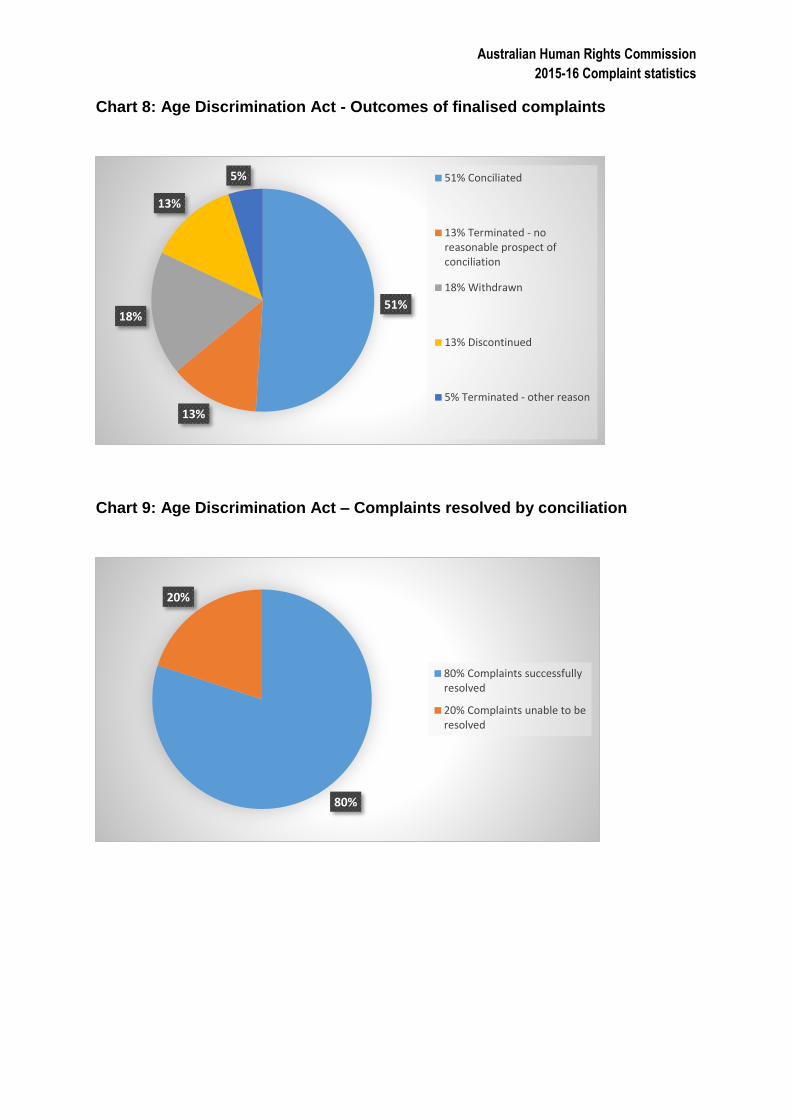
Chart 8: Age Discrimination Act - Outcomes of finalised complaints
Chart 9: Age Discrimination Act – Complaints resolved by conciliation
51%
13%
18%
13%
5% 51% Conciliated
13% Terminated - noreasonable prospect ofconciliation
18% Withdrawn
13% Discontinued
5% Terminated - other reason
80%
20%
80% Complaints successfullyresolved
20% Complaints unable to beresolved
Australian Human Rights Commission
2015-16 Complaint statistics
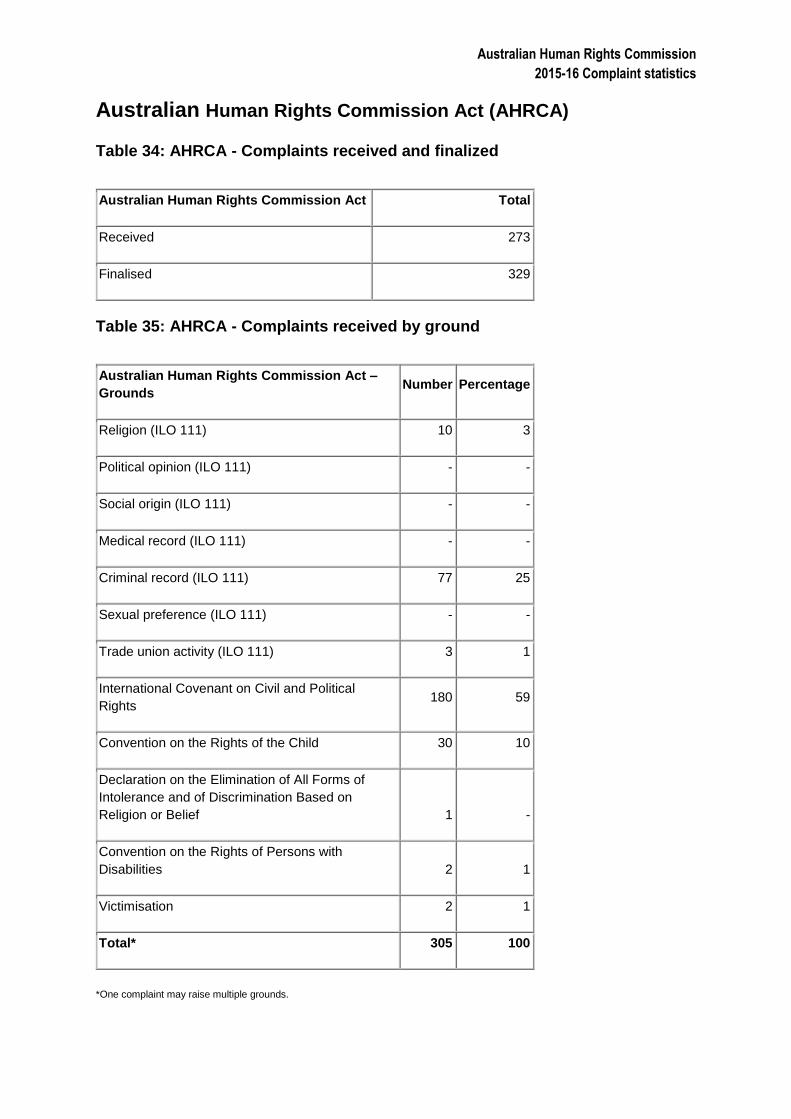
Australian Human Rights Commission Act (AHRCA)
Table 34: AHRCA - Complaints received and finalized
Australian Human Rights Commission Act Total
Received 273
Finalised 329
Table 35: AHRCA - Complaints received by ground
Australian Human Rights Commission Act –
Grounds Number Percentage
Religion (ILO 111) 10 3
Political opinion (ILO 111) - -
Social origin (ILO 111) - -
Medical record (ILO 111) - -
Criminal record (ILO 111) 77 25
Sexual preference (ILO 111) - -
Trade union activity (ILO 111) 3 1
International Covenant on Civil and Political
Rights 180 59
Convention on the Rights of the Child 30 10
Declaration on the Elimination of All Forms of
Intolerance and of Discrimination Based on
Religion or Belief 1 -
Convention on the Rights of Persons with
Disabilities 2 1
Victimisation 2 1
Total* 305 100
*One complaint may raise multiple grounds.
Australian Human Rights Commission
2015-16 Complaint statistics
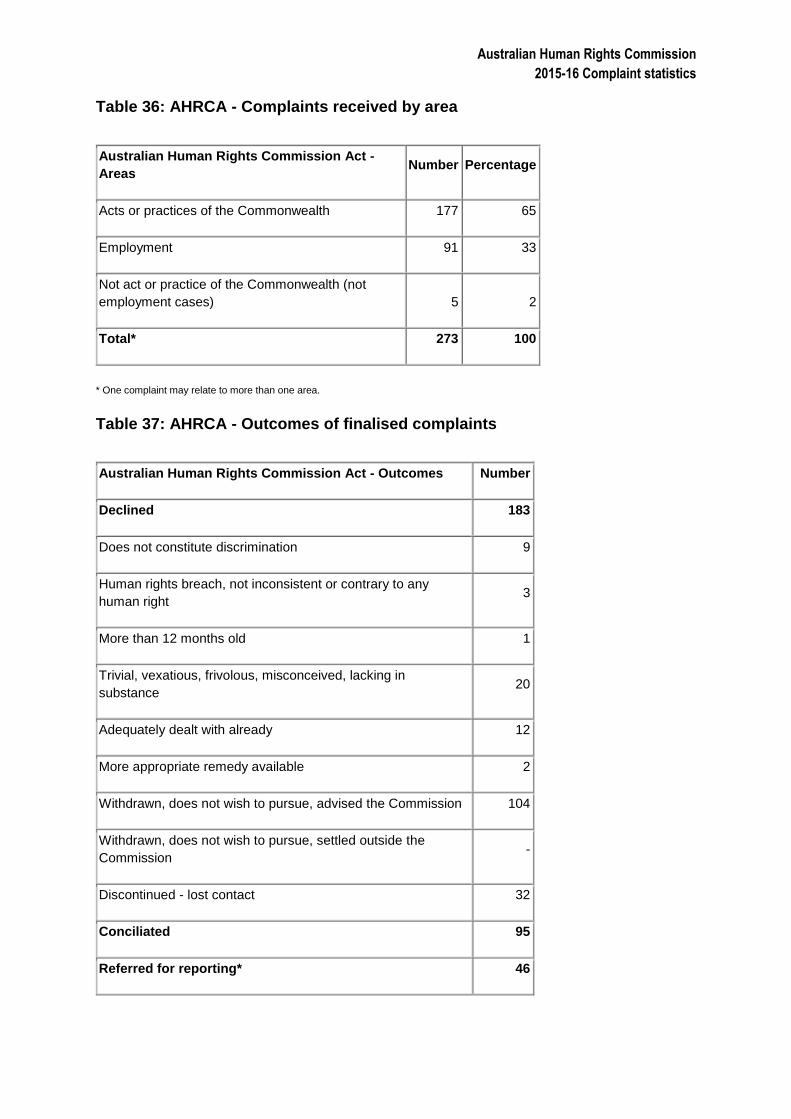
Table 36: AHRCA - Complaints received by area
Australian Human Rights Commission Act -
Areas Number Percentage
Acts or practices of the Commonwealth 177 65
Employment 91 33
Not act or practice of the Commonwealth (not
employment cases) 5 2
Total* 273 100
* One complaint may relate to more than one area.
Table 37: AHRCA - Outcomes of finalised complaints
Australian Human Rights Commission Act - Outcomes Number
Declined 183
Does not constitute discrimination 9
Human rights breach, not inconsistent or contrary to any
human right 3
More than 12 months old 1
Trivial, vexatious, frivolous, misconceived, lacking in
substance 20
Adequately dealt with already 12
More appropriate remedy available 2
Withdrawn, does not wish to pursue, advised the Commission 104
Withdrawn, does not wish to pursue, settled outside the
Commission -
Discontinued - lost contact 32
Conciliated 95
Referred for reporting* 46
Australian Human Rights Commission
2015-16 Complaint statistics
Administrative closure 5
Total 329
* Complaints in this category could not be conciliated and were transferred from the Commission’s Investigation and Conciliation Section to the Legal Section for further inquiry and possible reporting.
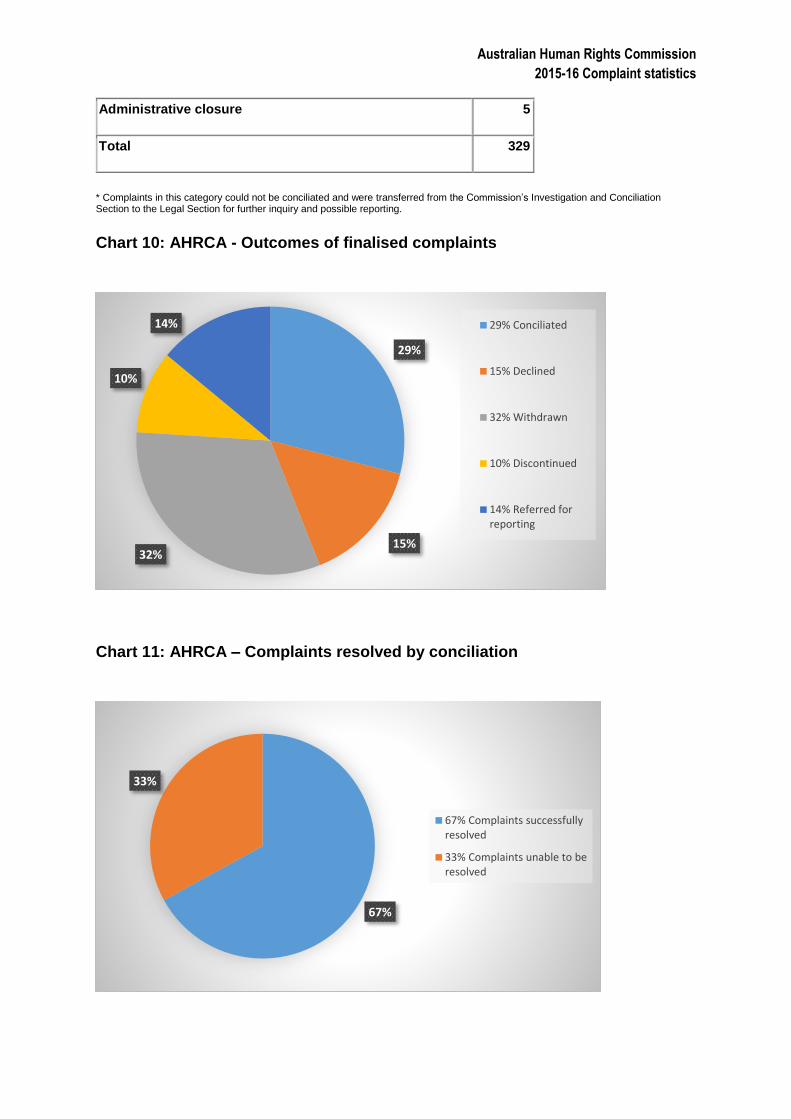
Chart 10: AHRCA - Outcomes of finalised complaints
Chart 11: AHRCA – Complaints resolved by conciliation
29%
15%32%
10%
14% 29% Conciliated
15% Declined
32% Withdrawn
10% Discontinued
14% Referred forreporting
67%
33%
67% Complaints successfullyresolved
33% Complaints unable to beresolved

Australian Human Rights Commission
2015-16 Complaint statistics


