
2016 STRATEGIC & FINANCIAL PLAN UPDATEPrepared for the Connect for Health Colorado Board of Directors
May 11, 2015

2
Executive summary
1) Connect for Health Colorado is approximately mid-way through its 2016 planning process. Reminder—constant goals in front of us:
1. Optimize the customer experience
2. Stabilize & right-size staffing, systems, processes
3. Put Marketplace on the path to financial sustainability
2) We continue to receive valuable input to our many planning elements from all stakeholders, which is greatly informing our planning decisions and recommendations
3) We received solid direction during our past two joint Finance-Operations Committee meetings on several of our most critical business cases, including:
• Enrollment projections, SHOP, MA Site, Service Center structure, IT planning, Assistance Network planning, Sales Channel planning, and initial financial forecasts
4) SES End-to-End Review RFP results are in; the joint Committee reviewed and recommends holding off on the Review given timing and cost.
5) Today:
1) Update on the planning and budgeting process
2) Gain minimum Assistance Network funding level commitment to bridge AN funding
3) SES E2E Review recommendation and decision
4) Introduce Fee-setting options, timing requirements, and approval process
3
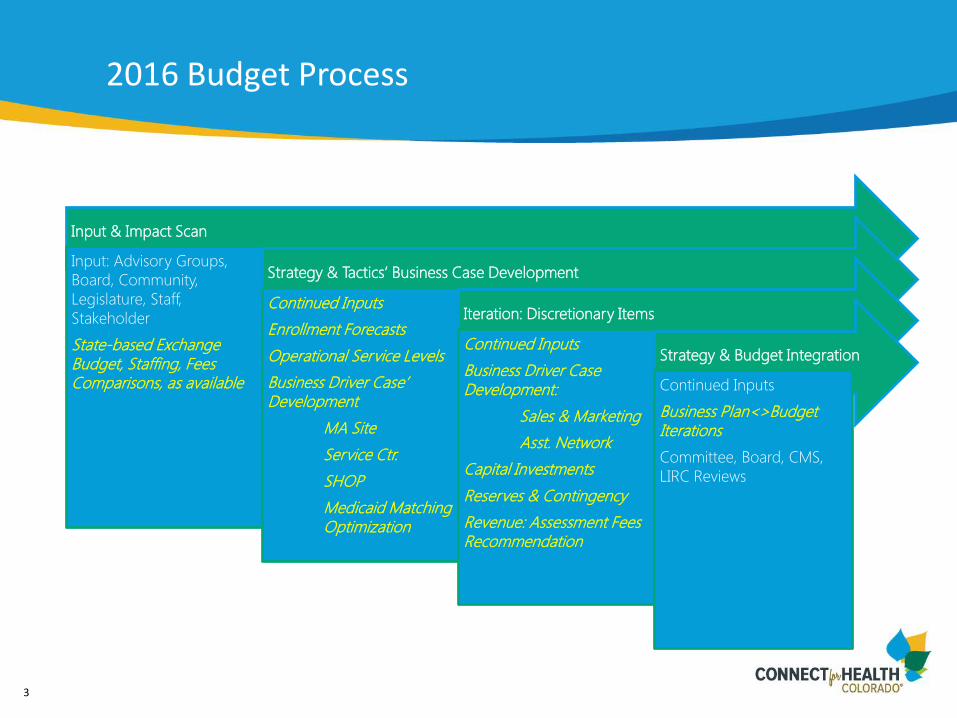
2016 Budget Process
Input & Impact Scan
Input: Advisory Groups,
Board, Community,
Legislature, Staff,
Stakeholder
State-based Exchange Budget, Staffing, Fees Comparisons, as available
Strategy & Tactics’ Business Case Development
Continued Inputs
Enrollment Forecasts
Operational Service Levels
Business Driver Case’ Development
MA Site
Service Ctr.
SHOP
Medicaid Matching Optimization
Iteration: Discretionary Items
Continued Inputs
Business Driver Case Development:
Sales & Marketing
Asst. Network
Capital Investments
Reserves & Contingency
Revenue: Assessment Fees Recommendation
Strategy & Budget Integration
Continued Inputs
Business Plan<>Budget Iterations
Committee, Board, CMS,
LIRC Reviews
4
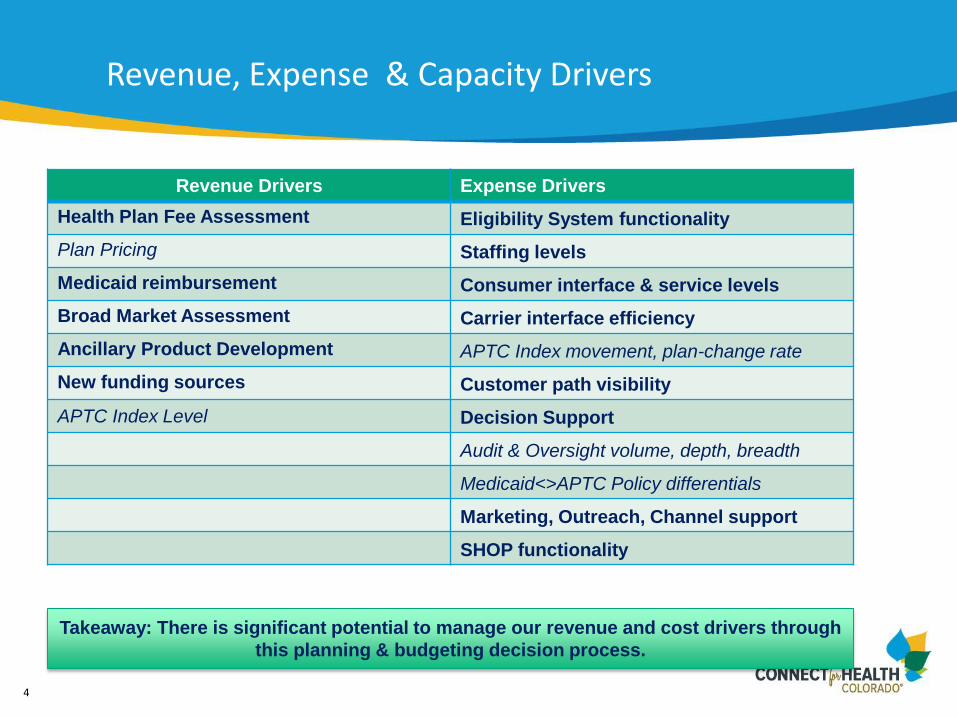
Revenue, Expense & Capacity Drivers
Revenue Drivers Expense Drivers
Health Plan Fee Assessment Eligibility System functionality
Plan Pricing Staffing levels
Medicaid reimbursement Consumer interface & service levels
Broad Market Assessment Carrier interface efficiency
Ancillary Product Development APTC Index movement, plan-change rate
New funding sources Customer path visibility
APTC Index Level Decision Support
Audit & Oversight volume, depth, breadth
Medicaid<>APTC Policy differentials
Marketing, Outreach, Channel support
SHOP functionality
Takeaway: There is significant potential to manage our revenue and cost drivers through
this planning & budgeting decision process.

5
Business Cases in Development
Description Top Decision Components Direction
Enrollment Targets &Sales Business Case
1. Enhancements to SHOP product offering2. Development of strategy around transition plans3. SES functionality, effectuation rate
1. Moderately aggressive 3-year targets presented with enrollment drivers reviewed internally and with the Joint Committee
2. The Committee recommended proceeding as presented
Service CenterStructure/Re-negotiation
1. Expectations regarding service levels2. Physical location of primary and overflow service centers3. Strategies for non-Marketplace calls (re-direct or support)
1. RFP responses reviewed, including service levels, strategy, locations, costs, systems, contract structure, and management
2. Negotiation strategy will be discussed in Executive Session
SHOP
1. Completion of market due diligence and the RFP process2. Financial ROI’s of sustaining structure vs. outsourcing3. Expansion of Small Group Market to 100 or less
1. Two options presented, with potential ROI and service levels, capacity, functionality, and timelines debated
2. The Committee recommended proceeding with outsourcing exploration, RFP distribution, and evaluation of responses
Sales Channels
1. Distribution od appropriate level of sales targets across channels
2. Initiatives that will support and drive sales and engage key channels
3. Development of Broker lead tool
1. Reviewed sales channel strategies, plans, estimated enrollment projections by channel, Board support
2. No Committee recommendation sought; input collected
Assistance Network (AN)
1. Development of alignment strategy2. Refocusing enrollment best practices3. Significant partnering with Marketing and Outreach
teams and community based champions
1. Reviewed Statement of Need, ACA requirements, current status, KPI’s, market segmentation and strategy, timeline, Board support, rec. minimum funding commitment ($500k)
2. Committee supported general direction recognizing TCHF grant is pending approval
3. Board Request: Approve minimum funding commitment to assist in grant award and bridge funding for the AN
IT, Decision Support,Broker Portal, V.3.0
1. ROI, Funding Prioritization2. Functionality improvement, regulatory requirements3. Evaluation of enhancements in new version of code and
relative impact on sales & costs4. Stay on most current versions of code to stay under
warranty and receive product fixes5. Decision Support tools’ effectiveness assessment
1. Reviewed High-level 3 year IT roadmap, current stabilization phase components, Key projects, prelim cost projections
2. No Committee recommendation sought; input collected
6
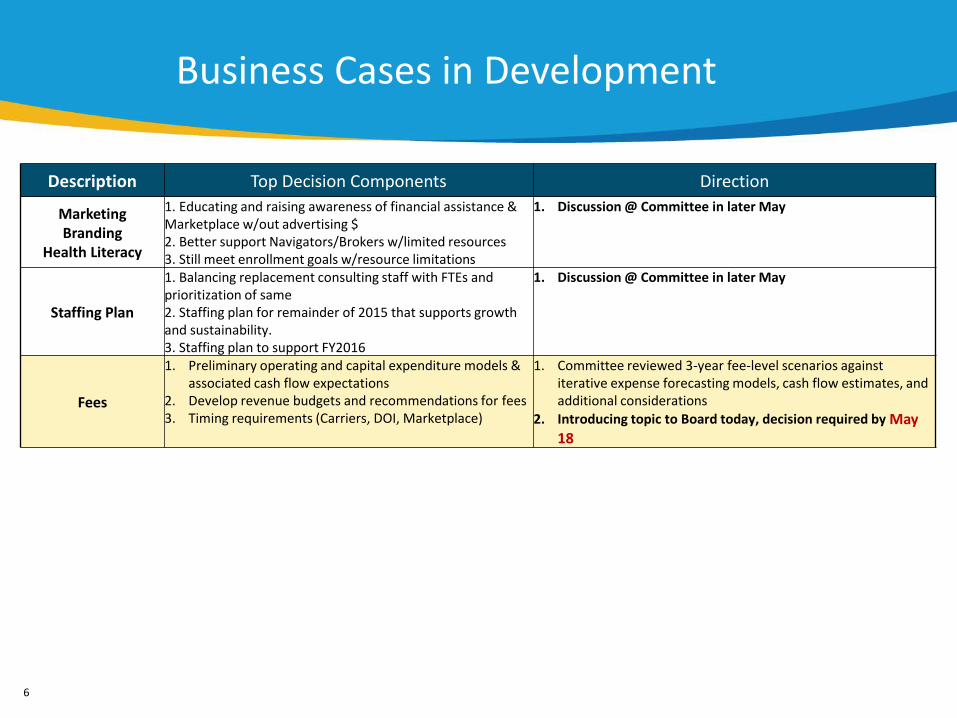
Business Cases in Development
Description Top Decision Components Direction
MarketingBranding
Health Literacy
1. Educating and raising awareness of financial assistance & Marketplace w/out advertising $2. Better support Navigators/Brokers w/limited resources3. Still meet enrollment goals w/resource limitations
1. Discussion @ Committee in later May
Staffing Plan
1. Balancing replacement consulting staff with FTEs and prioritization of same2. Staffing plan for remainder of 2015 that supports growth and sustainability.3. Staffing plan to support FY2016
1. Discussion @ Committee in later May
Fees
1. Preliminary operating and capital expenditure models & associated cash flow expectations
2. Develop revenue budgets and recommendations for fees3. Timing requirements (Carriers, DOI, Marketplace)
1. Committee reviewed 3-year fee-level scenarios against iterative expense forecasting models, cash flow estimates, and additional considerations
2. Introducing topic to Board today, decision required by May 18
7
SALES GOALS AND CHANNEL INITIATIVES FOR FY 2016

8
Enrollment Projections (4-28-15)
Primary Enrollment Drivers:
• Retention rates
• New business: General
• New business: Eligibility process improved thru-put and recapture
• New business: Transition plans
• Life Change Event volume
• Effectuation rate
• SHOP 51-100 size group increase
Enrollment Type
Covered
Lives 6/30/15
Covered Lives
6/30/16
% Inc. 2016
v 2015
Covered Lives
6/30/17
% Inc. 2017 v
2016
Covered
Lives 6/30/18
% Inc. 2018
v 2017
Individual- Gross 142,896 217,306 59% 256,242 17% 295,178 10%
Individual-
Effectuation 111,459 169,499 204,994 236,142
SHOP: Small Groups 336 764 127% 1,226 60% 1,874 53%
Covered Lives 2,688 6,878 156% 12,256 78% 15,935 30%
9
Rationale for Sales Targets
• The third and subsequent Open Enrollment Periods must build off the success achieved thus far
• There is the one and only opportunity in OEP III to “recapture” Individual enrollments lost due to SES complications
• Several unique market forces are presenting an increased “sales” opportunity in FY16 and FY17: 1.) The end of transition plans in both segments, and the expansion of the definition of small group business
• Connect for Health Colorado has refined its partnership with Brokers and Health Coverage Guides-now we must capitalize on their passion and the books of business they have entrusted to the Marketplace

10
What the Ops/Finance Committee Outlined for the Sales Channel Teams
Feedback on Enrollment Targets:
• Moderately aggressive, dependent on enhancements and driving performance, agreement with targets and direction and.. agree with the below requests for Board support of sales:
Support of aggressive targets through:
• Accountability to deliver SES enhancements to the Channels
• Committing to Assistance Network direction
• Participating in Broker appreciation events
• Visiting the Service Center
• Participating in community awareness and brand building events

11
ASSISTANCE NETWORK STRATEGIC ALIGNMENT
12
Rationale for Assistance Site Alignment Strategy
• Now is the time to build on 2 years of broad outreach and the fine work by 50+ Assistance Sites- best practices, winning strategies, etc.
• Evolving the program to focus on contribution to Marketplace sustainability, ie: balance between revenue contribution and fiscal conservatism needed to maintain this imperative program for the long term
• Ensuring the grants received to support Marketplace are not redundant
• Focus resources, efforts, lessons learned to key communities across the geography and demography of Colorado

13
Key Performance Indicators Across All Assistance Sites Total OEP1 + Post OEP 1 + OEP 2 + Post OEP 2: Oct. 1, 2013-Apr. 8. 2015
230,951
116,079
27,465
15,566Marketplace
Enrolled
Reached
Appointments
Medicaid/CHP+ Enrollment (24%)
*Self-Reported by AS

14
Recommended Site Types for Continued Engagement and Further Budget Development
Draft D i s t r i b u t i o n o f ~ 2 4 S i t e s
Number of Sites Funding Range2 Less than $50,0005 $50,000 to $99,9999 $100,000 to $150,0008 $200,000 to $250,000
• Estimated $3 million for distribution• ~ 20 to 23 organizations geographically focused• ~ 3 to 5 organizations targeting specific populations statewide

15
What the Ops/Finance Committees Outlined for the Assistance Network Team
• Connect for Health Colorado endorses the imperative value of the Assistance Network to the mission of Connect for Health Colorado
• The Committees support the Management team in their direction to strategically align the Assistance Network:
o Based on our hard-won cumulative experience two years post-launch,
o Based on a deeper appreciation for Colorado’s unique needs and
regional diversity,
o Based on the strong relationships established with partner
organizations statewide
• Awareness that we have submitted a grant application to The Colorado Health Foundation for $2,500,000 for FY 2015-2016 and we are seeking approval for a base amount of $500,000 to serve as the required matching operating funds to proceed with securing the grant

16
Assistance Network Recommendation: Minimum Funding Commitment
Minimum Funding Commitment Request:
1. Request: Provide commitment of a minimum of $500,000 budget allocation to the FY2016 Assistance Network program
2. Why do we need the commitment ahead of finalizing the budget
1. Assistance sites (and the Marketplace) wish to retain the trained and
talented Health Coverage Guides for OE3; funding level is required
for Sites to make that commitment to their employees
2. Matching funds are required to evidence our commitment to the AN
Program for the Colorado Health Foundation to evaluate our grant
proposal
17
MEDICAL ASSISTANCE SITE OPTIONS AND DIRECTION

18
Background and Rationale for MA Site Capabilities
Top Reasons Have MA Site Capabilities:• As customers proceed through the Eligibility Determination phase and
if they do NOT receive a RTE, Marketplace-Brokers and HCGs have no way to intervene without CBMS access
• Verifications require access to and in depth knowledge of CBMS
• Simultaneous Enrollment can be more tightly controlled with end to end intervention ability
• Currently, Marketplace customers are being handled by a multitude of Medical Assistance Sites... We need to own the customer experience

19
MA Site Projections
Scenario 1- CURRENT STATE with 2015MCD Estimates
Scenario 2- Medical Asst. site w/ Coordinated Referral Strategy
Work Streams Handled by MA Site
OPEN ENROLLMENT November -
January
Enrollment Wrap Ups February -
March
Life Change Event
Enrollments April - October
TOTAL
OPEN ENROLLMENT November -
January
Enrollment Wrap Ups February -
March
Life Change Event
Enrollments April - October
TOTAL
Eligibility Applications (Assumes Expedited Pathway)
$154,352 $56,719 $37,813 $248,884 $154,352 $56,719 $37,813 $248,884
Verifications $66,173 $33,086 $16,543 $115,802 $66,173 $33,086 $16,543 $115,802
Case Maintenance $46,999 $46,999 $46,999 $140,997 $46,999 $46,999 $46,999 $140,997
Medicaid Cases Presenting to Connectfor Health Colorado
$630,214 $283,596 $37,813 $951,624 $378,129 $113,439 $37,813 $529,380
TOTAL COSTS $897,738 $420,401 $139,168 $1,457,307 # $645,652 $250,243 $139,168 $1,035,063
Subtotal withoutMedicaid
$267,524 $136,805 $101,355 $505,683 # $267,524 $136,805 $101,355 $505,683
Costs Not included: These Costs reflect Eligibility and Verifications FTE only. There are additional costs associated with supervision, audit and appeals that have not been included. There are also indirect costs to Connect for Health in the areas of Finance, Human Resources, Information Technology and Administrative Support. Additional Leased Space and Operating Costs may also need to be factored in.

20
Option 1: Marketplace Becomes an M.A. Site Option 2: Marketplace Contracts with and M.A. Site
OPTION 1: Benefits
• Gain oversight of cases and expand ability to closely monitor workload
• Funding through HCPF and marketplace revenue could offset cost of staff
• Could hire current HCPF contractors
OPTION 2: Benefits
• Contractor will be able to perform CBMS related work for our Marketplace customers
• An existing MA sites will have knowledge and experience expediting the start up time
• MA Site can work/accept all general Medicaid cases
• Potential cost allocation from CMS
21
What the Ops/Finance Committee Outlined to the MA Site Project Team
• Supports Option 2 for its speed to execution advantage
• Understands current contract with HCPF ends 5/15, and the need for continued capabilities are immediate
• Supports Medicaid strategic referral initiatives; thus resourcing Medicaid eligible folks to counties, etc. who are experts
• Supports pursuit of cost allocation efforts to mitigate costs related to MA Site activities related to Medicaid eligibility

22
STRATEGIC MARKET DIRECTION SMALL EMPLOYER HEALTH OPTION PROGRAM

23
New Partnership Small Employer Marketplace - Rationale
• The BEST partnership includes: solid technology, small group expertise and market credibility
• Current costs outweigh benefits
• We desire a solution that leapfrogs the Marketplace into a market leader
• The need to move from solely an IT platform to an integrated business solution is driving an RFP project to “white label”
• A Small Group Marketplace is required by federal law
• Colorado is a state of small businesses, with 85% of companies employing 10 employees or less
• 2016 poses great growth opportunity w/Transitional plans
• 2017 poses great growth opportunity w/Expanded market

24
Financial Improvement: Small Group MarketplaceRevised Strategy
Incremental Revenue/Expense (000’s)
Year 2015 (@3.5%) 2016 2017 2018
Revenue $423 $1,083 $1,930 $2,510
Expense****Preliminary Assumptions
$3,002 $1,599 $1,316 $1,334
Margin $(2,579) $(516) $614 $1,176

25
The Small Business Marketplace- Project Timeline

26
What the Ops/Finance Committee Outlined to the Small Group Project Team
• Confirmed the opportunities for growth
• Supports the imperative to select a partner who can offer an integrated business solution
• Understands partner selection will occur in early June

27
SERVICE CENTER & INFORMATION TECHNOLOGY

28
Service Center Planning
Timeline
• Review proposals from vendors – to 4/24
• Present summary findings to Ops Committee – 4/28
• Additional negotiations and review –4/24 – 5/7
• Board approval on negotiation strategy -5/11
• Continued negotiations – 5/26
• Final contract – week of 6/4
• FY 2016 Service center budget finalized –week of 6/4
Item Range Comments
Total cost of service center
$17.5 - $17.8M(33% reduction from FY 2015 -~4.5M savings)
Both vendors provided proposals with exclusions, this is the ‘all in cost’Both assume SES savings. Both include SHOP costs.
Answer time SLA
80/300 to8/360
Both vendors are able to define other SLAs and be held accountable to them
Contract types Variable/fixed with SLA and credits or not to exceed price
Contractcommitment
4 or 5 years
Work location Both retain call center staff in Colorado Springs, both use regional locations with lower cost of living for overflow and/or lower skill staff
Technologyrefresh
Amortized over term of contract – not priced separately

29
Key IT projects over next 20 months Projects FY2015 FY 2016 FY 2017
Calendar Year 2015 Calendar Year 2016
Q1 2015 Q2 2015 Q3 2015 Q4 2015 Q1 2016 Q2 2016 Q3 2016 Q4 2016
Shared Eligibility System
Improvements
2015 Marketplace
improvements
Carrier EDI
improvements
Target architecture /
2016 Marketplace
improvements (“4.0”)
SHOP
BI improvements
Service Center
Technology Refresh
Contract review and
renegotiation
SES improvements
Marketplace “3.0”
Follow – on SES improvements
Change EDI implementation
Renewals
OEP
Complete Change EDI
Planning and Preparation Execution
Implementation Transition
Planning and implementation
Planning and implementation
Planning and analysis Negotiation
Ongoing improvements
Ongoing improvements
Ongoing improvements
OEP Begins

30
Preliminary IT project cost projections for FY 2016 / 2017Project
FY 2016 Cost
Projections
FY 2017 Cost
Projections
Total FY 2016/17
Projections Comments
SES improvements $ 4,800,000 $ 800,000 $ 5,600,000 Assumes additional changes are
needed after September 2015
2015 Marketplace
Improvements $ 750,000 $ - $ 750,000
Assumes limited ability to make
changes to Marketplace for 2016
OEP other than SES (e.g, defect
fixes, renewals processing
improvements, some usability
improvements)
Carrier EDI
improvements $ 500,000 $ 300,000 $ 800,000
Assume EDI will be completely
working with all carriers by end of
FY 2016 and ongoing improvements
costs are about $300K/yr
Migration to target
architecture/ 2017 OEP
changes*
$ 1,000,000 $ 1,400,000 $ 2,400,000
Assumes that we will reduce the
number of products in the
Marketplace to allow us to realize
more fully the benefit of hCentive
product enhancements and reduce
overall M&O costs
SHOP migration*
Assume net neutral during FY 2016
due to service center cost
reductions, some capital may be
required initially
BI improvements $ 250,000 $ 200,000 $ 450,000
Service center
technology refresh
Included in service center
proposals
Other projects and
ongoing costs $ 500,000 $ 800,000 $ 1,600,000
Includes desktop maintenance and
other costs,
Total $ 7,800,000 $ 2,700,000 $ 10,000,000 * waiting for proposals from vendors
NOTE: These are preliminary (+/- 25%) cost estimates for new / ongoing project work. Total annual IT costs (not including staff costs) include the above project work plus ~$8M in annual license, maintenance and operations, and hosting fees.

31
FINANCIAL SCENARIOS

32
Directional Context: SBM State Comparison
CO State #1 State #2 State #3 State #4
Enrollment 150,000
YTD
100K–
180K
100K–
180K
100K–
180K
100K–
180K
Annual Revenue $ 27.5M $ 40M $ 44M $ 43M $50M
Exchange Admin Fees $ 6.5M 1.4%
$ 25M $ 14M $ 8M
Broad Market Assessment $16M$ 1.25
$ 25M $ 20M
Medicaid Recovery/Gen Fund $ 15M $ 19M $ 29M $ 20M
Other $ 5M $ 2M
OPEX TBD $ 37M $ 50M $ 43M $50M
Call Center $ 21M $ 18M $ 20M $ 12M $ 28M
Salaries/Fringes $ 6M $ 9M $ 8M $ 7M $ 14M
Headcount 50 75 67 70 150
Takeaways (Above figures are approximate and ‘in motion’ as SBM’s are in their planning processes as well)
• Other similarly situated SBM’s are generating $12m-22m greater revenue, primarily thru Medicaid
reimbursement and/or higher Admin fees/assessments.
• Service Center expenses, generally the largest expense item, are in similar ranges
• Staffing models vary, but indicate the Marketplace is staffed at approximately 2/3 other SBM levels.

33
DRAFT I: Financial Scenarios: Revenue
Draft Revenue Scenarios - May 1, 2015 update
Cash Basis Estimates ($000's) Working Model
FY 2015 2.8%/$1.60 Model 3.5%/$1.80 Model 4.5%/$1.80 Model
Estimate FY 2016 FY 2017 FY 2018 FY 2016FY 2017 FY 2018 FY 2016 FY 2017 FY 2018
2014 Assessment Fees 5,100 400 0 0 400 0 0 400 0 0
Health Plan Assessment Fees 987 7,795 14,031 22,394 9,617 24,187 27,993 11,047 31,098 35,991
Special Broad Market Assessment 4,500 19,260 17,280 0 19,980 19,440 0 19,980 19,440 0
Tax Credit Donations 5,000 5,000 5,000 5,000 5,000 5,000 5,000 5,000 5,000 5,000
Shop (w/ new investment) 120 220 800 1,600 220 1,500 2,000 220 1,925 2,575
Vision 9 18 20 24 18 20 24 18 20 24
Foundation Grants (estimates only - no
commitments made or received) 2,500 2,500 1,000 1,000 2,500 1,000 1,000 2,500 1,000 1,000
Interest Income 46 18 3 3 18 3 3 18 3 3
Medicaid Cost Recovery (PLACEHOLDER) 2,500 2,000 2,000 2,500 2,000 2,000 2,500 2,000 2,000
Level 2 Grant 60,500 200 0 0 200 0 0 200 0 0
CoverColorado 14,034 0 0 0 0 0 0 0 0 0
Total Revenue 92,796 37,911 40,104 32,021 40,453 53,150 38,020 41,883 60,486 46,593

34
Draft I: Financial Scenarios: Expenses
FY 2016 Draft Expense Models - May 1, 2015 Update
Expense Category FY 2015 Forecast3.5% - Revenue
Driven Model
1st Draft. Hi-Level Strategy-Based
ModelGeneral & Administrative 7,325 9,172 10,672 Salaries & Benefits 5515 9,126Rent, Tech Infrastructure, equip, connectivity 797 781Other 1,013 765
Marketing & Public Relations 4,771 1,000 2,000 Assistance Network 6,040 3,000 5,000 Operations 2,683 1,260 1,260 Business Development 673 468Carrier Support & Other Operations 731 360Training 324 54Other 955 378
Customer Service Center (net of SES savings) 21,280 17,623 17,623 Technology 10,942 8,889 9,389 Hosting 2,108 2,053M&O Costs 6,653 5,588Additional Marketplace Maintenance/Enhancements 986 888Other 1195 860SHOP Savings (100) (100)Total Operating Expense 53,041 40,944 45,944
Technology CapEx and Other ProjectsCompletion of Carrier Coordination ProjectMarketplace Improvements/Licenses 15,531 2,800 2,800 SES (includes 2,200k in new SES project) 7,060 3,650 3,650 Shop 500 500 MA Site TBD TBDEDI 750 750 Other 400 400 Total CapEx and Projects 22,591 8,100 8,100
Total Cash Outlays 75,632 49,044 54,044
Does not include depreciation/amortization

35
Summary: DRAFT I Financial Scenarios
FY 2016 Expense Models
Expense Category FY 2015 Forecast3.5%- Revenue Driven
Model1st Draft, Hi-Level'
Strategy-based Model
Total Cash Outlays, including CapEx 75,632 49,044 54,044
FY Revenue Models
FY 2015 1.8%/2.8%/$1.60 Model 3.5%/$1.80 Model 4.5%/$1.80 Model
EstimateFY 2016 FY 2017
FY 2018
FY 2016
FY 2017
FY 2018
FY 2016
FY 2017
FY 2018
Total Revenue 92,796 37,911 40,104 32,021 40,453 53,150 38,020 41,883 60,486 46,593
Takeaway:
• Budget process is in initial stages as planning work continues.
• Operational costs can be covered at the mid-level funding model.
• There is strategic work to do on both the revenue and expense sides of the bottom line
equation, most notably continuing pursuit of Medicaid reimbursement.

36
Optimal Expense Level Cash Flow
Cash Balance Forecast ($000's)
Using Optimal Expense Budget
Budget Model 6/30/15 12/31/15 6/30/16 12/31/16 6/30/17 12/31/17 6/30/18
1.8%/2.8%/$1.60
Model 26,000 18,200 9,500 8,700 NA NA NA
3.5%/$1.80 Model 26,000 18,200 12,000 18,400 13,300 8,400 NA
4.5%/$1.80 Model 26,000 18,200 13,500 23,900 22,700 21,000 16,200
Takeaways:
• Broad Market Assessment Fee runs CY 2015 + 2016
• Many options exist to backfill the revenue source and/or reduce
expense between now and 2017
• Additional organizational capacity investment is required to
continue the sustainability path

37
FY 2016 FEE DISCUSSION

38
2016 Assessment Fees
• Marketplace Revenue Sourceso Health Insurance Carrier Assessment; Broad Market Assessment, Carrier tax credit
donations, grant revenue, Other
o CMS reimbursement levels for Medicaid support is under research, retrospectively
and prospectively
• Timing:o Setting the Carrier Assessment Fee level for CY 2016 is required presently for
carriers to accurately set and submit plan rates due to DOI by 5/29
o Timeline allows for adequate Marketplace testing time in the fall
• Health Insurance Carrier Assessment:o Board establishes Health Insurer Assessment for calendar year 2016
o Cash receipt from the fee level set now will primarily impact FY 2017
o Current fee is set at 1.4% of effectuated premiums; no cap in place
• Broad Market Assessment (HB 13-1245) o Board establishes broad market Health Insurer Assessment for calendar years
2014, 2015 and 2016; fee is capped at $1.80 pmpm
o Cash receipt from the fee level set now will impact FY 2017 revenue
o 2014 Fee was waived; 2015 rate is set at $1.25 pmpm

39
Health Insurance Carrier Assessment
• Considerations for setting fee:
o Rates set now will impact cash for 2 months of FY2016 and most of FY 2017
o 2016 Budget and long-term forecast are not yet completed, i.e. true costs of operation and capital requirements are in process following plan development
• Optimal operations budget requires fee increase and Medicaid reimbursement funding for long-term sustainability
o Cash Flow forecasts at current budget projections (incomplete) utilizing Reserves to bridge funding sources:
• At previously projected level, operations funded through CY2016
• At 3.5% (FFM level), operations funded at least through CY2017
• At 4.5%, operations funded through at least CY2018
o Additional unbudgeted funding requirements: Capital investment, Operational Reserves, New product development, unforeseeable revenue/cost impacts
o Fee level impacts carrier margins and Marketplace ROI; and ultimately consumers
o Context: Other States’ fee levels vary greatly given State structures (up to 4.5% plus addl. Funding sources), and Medicaid reimbursement

40
State-based Exchange Value Propositions
• Gear strategies toward Colorado’s specific needs, geography, and populations
• Stakeholders are able to provide input and feedback to design, functionality, training, operations
• The Marketplace and State own the data, and can use it, report on it, and learn from it (e.g. FFM does not provide its data to the states)
• Decision Support tools available to consumers, brokers, HCG’s
• No Wrong Door Consumer support
• Local governance of the Marketplace
• Brokers, Coverage Guides and interfaces with Medicaid supports are local and directly connected to the Marketplace (certified)
• FFM, by comparison, excludes above elements and their funding (i.e. Federal Marketplace excludes above services, resulting in state-based costs not included in the FFM 3.5% fee)
• Economic development—jobs stay in Colorado
• Others??

41
Broad Market Health Insurance Carrier Assessment
• Considerations
o Broad Market Assessment was carried over from Cover Colorado (CC rate $38.00 pmpm)
o 3 year fee: 1st year of fee waived; 2nd year set @ $1.25 (67% of cap)
• $1.25 rate generates approx. $14m ; $1.80 rate generates approx. $21m
• Converted to a % of the average Marketplace premium, $1.25 = .35%; $1.80 = .5%
o Cash receipt from rate set now begins approx. 12 months later
o Maximizing the fee during its short availability is key for bridging funding from Federal Grants to earned revenue, and assisting with additional unbudgeted funding requirements and sustaining reserves
42
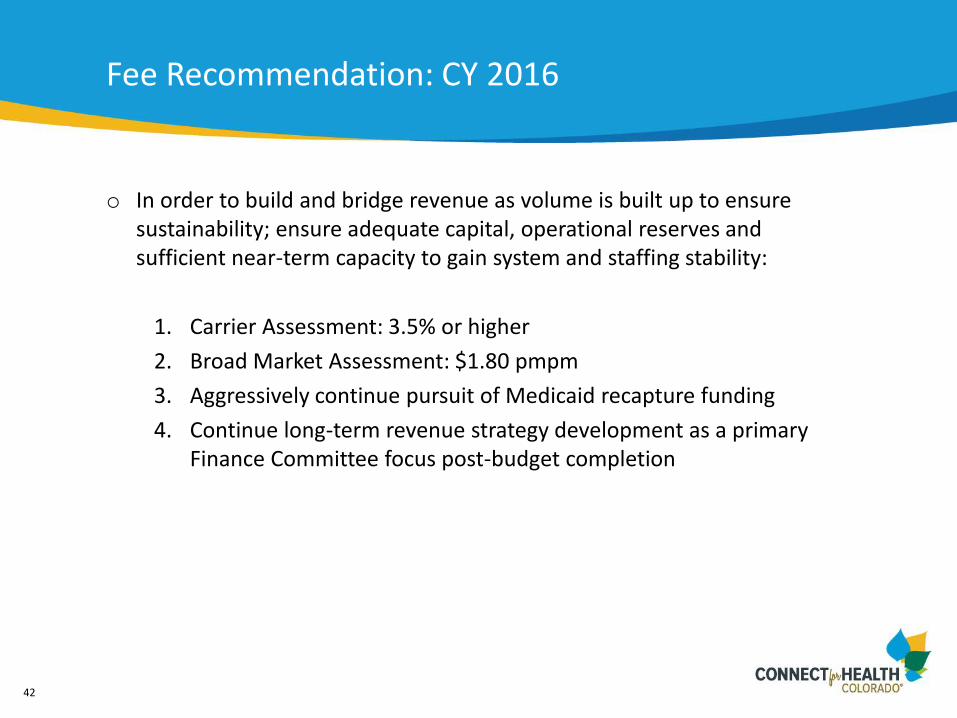
Fee Recommendation: CY 2016
o In order to build and bridge revenue as volume is built up to ensure sustainability; ensure adequate capital, operational reserves and sufficient near-term capacity to gain system and staffing stability:
1. Carrier Assessment: 3.5% or higher
2. Broad Market Assessment: $1.80 pmpm
3. Aggressively continue pursuit of Medicaid recapture funding
4. Continue long-term revenue strategy development as a primary Finance Committee focus post-budget completion
43
SES E2E REVIEW
44
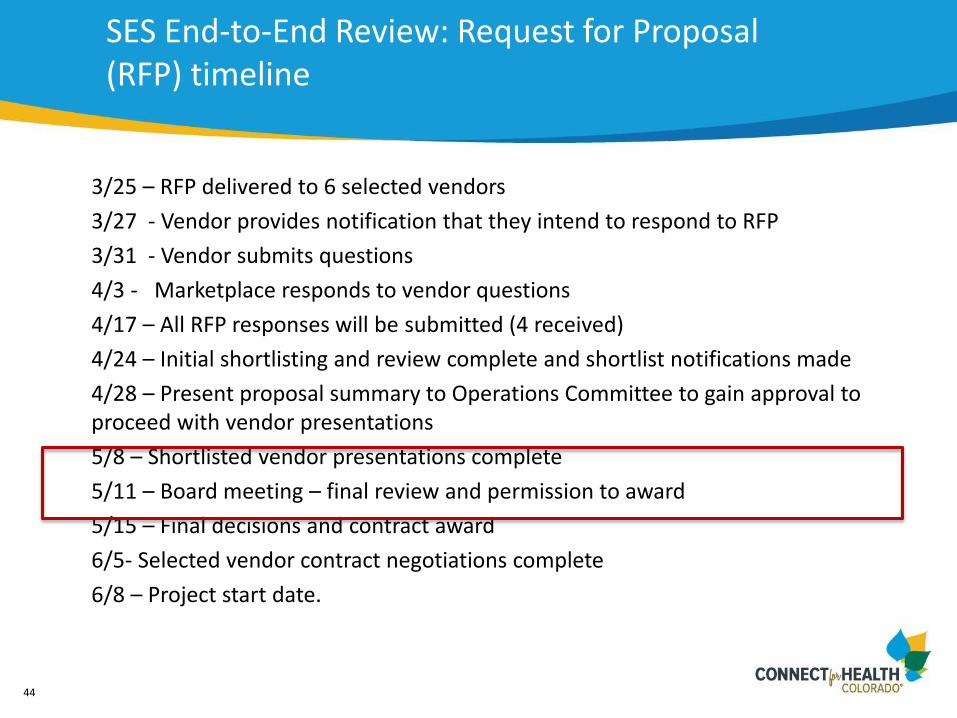
SES End-to-End Review: Request for Proposal (RFP) timeline
3/25 – RFP delivered to 6 selected vendors
3/27 - Vendor provides notification that they intend to respond to RFP
3/31 - Vendor submits questions
4/3 - Marketplace responds to vendor questions
4/17 – All RFP responses will be submitted (4 received)
4/24 – Initial shortlisting and review complete and shortlist notifications made
4/28 – Present proposal summary to Operations Committee to gain approval to proceed with vendor presentations
5/8 – Shortlisted vendor presentations complete
5/11 – Board meeting – final review and permission to award
5/15 – Final decisions and contract award
6/5- Selected vendor contract negotiations complete
6/8 – Project start date.

45
SES End-to-End Review: Summary of Proposals
• Average cost from 4 responding vendors is $323K. Excludes indirect costs of:o Running RFP process (exec team)
o Support the investigation (Connect for Health Colorado, HCPF, OIT, CGI, Deloitte, etc)
• Time to complete review and present findings ranges from 6 weeks to 4 months.
Content of review
• SES and the integration points with upstream and downstream systemso IT requirements
o Testing
o Reports and documentation
• Systems and operations for helping people navigate the SESo Call center
o Call/issue reporting
o Roles and responsibilities
o Enrollment issue process
o Costs
• Governanceo Vendor oversight
o Governance structure
We have shortlisted 2 vendors for additional conversations if the Board approves: • Both vendors expect to complete the
assessment in ~10 weeks• Average cost ~$200K As part of the due diligence process / next steps, we are asking shortlisted vendors to provide an estimate of impact on staff and vendors to determine overall cost of the assessment.


