
2017 IPO Corporate IP Practices Study
August 2017
Administered by
ipPerformance

2 2017 IPO Corporate IP Management Benchmarking Survey
TABLE OF CONTENTS
Introduction .............................................................................................................................................................. 3
Methodology ............................................................................................................................................................ 3
Key Findings ............................................................................................................................................................ 3
Section 1: Questions (Organizational Data) ............................................................................................................ 5
1A. Company Size (Employees) .......................................................................................................................... 6 1B. Company Size (Financial) ............................................................................................................................. 6
Section 2 Questions (IP Staffing) ............................................................................................................................ 9
Section 3 Questions (IP Department) .................................................................................................................... 11
Section 4: Outside Counsel ................................................................................................................................. 177
4A. Billing arrangement and cost for preparing patent applications .................................................................. 17 4B. Billing arrangement and cost for preparing responses to patent office actions .......................................... 19 4C. Billing arrangements for litigation ................................................................................................................ 21 4D. Alternative fee arrangements (other than hourly rates) .............................................................................. 22 4E. Timing for patent application preparation .................................................................................................... 24 4F.Other Outside Counsel Information .............................................................................................................. 26
Section 5 Questions (Operational Data) ................................................................................................................ 28
5A. Utilization of Patent Office Procedures ....................................................................................................... 31 5B. Filing in the U.S. vs. Filing Abroad ............................................................................................................ 311 5C. Licensing ..................................................................................................................................................... 33 5D. Non-Practicing Entities (NPEs) ................................................................................................................... 34
NOTES: 1. This is the fifth time IPO has conducted this survey. It incorporates many of the questions from IPO’s 2006, 2009, 2011 and 2013 benchmarking surveys.
2. The survey was developed by IPO’s Corporate IP Management Committee with the help of
the IPO staff. We extend special thanks to Neil Kardos, Robert Williamson, Todd Reynolds,
Jeff Fougere, Shawn Foster, Tom Beall, Dan Enebo, Colm Dobbyn, Joel Meyer, Ambar Nayate
and Scott Weingust
3. The survey respondents were primarily Chief Patent Counsel and Chief IP Counsel with responsibility for patents and trademarks at their companies.
4. ipPerformance Group (ipperform.com) can provide additional analysis.

3 2017 IPO Corporate IP Management Benchmarking Survey
INTRODUCTION
Welcome to the IPO IP Management– Benchmark Report. This unique report analyzes
data compiled from 82 companies.
SURVEY METHODOLOGY
• The survey respondents were those responsible for, or intimately knowledgeable about the intellectual property/patent department (e.g., chief IP counsel, IP manager, senior patent attorney).
• The survey included 81 questions.
• The survey was conducted as a digital online questionnaire.
• All of the data was collected between April 2017 and June 2017.
KEY FINDINGS
Among the findings that emerged from this research are the following:
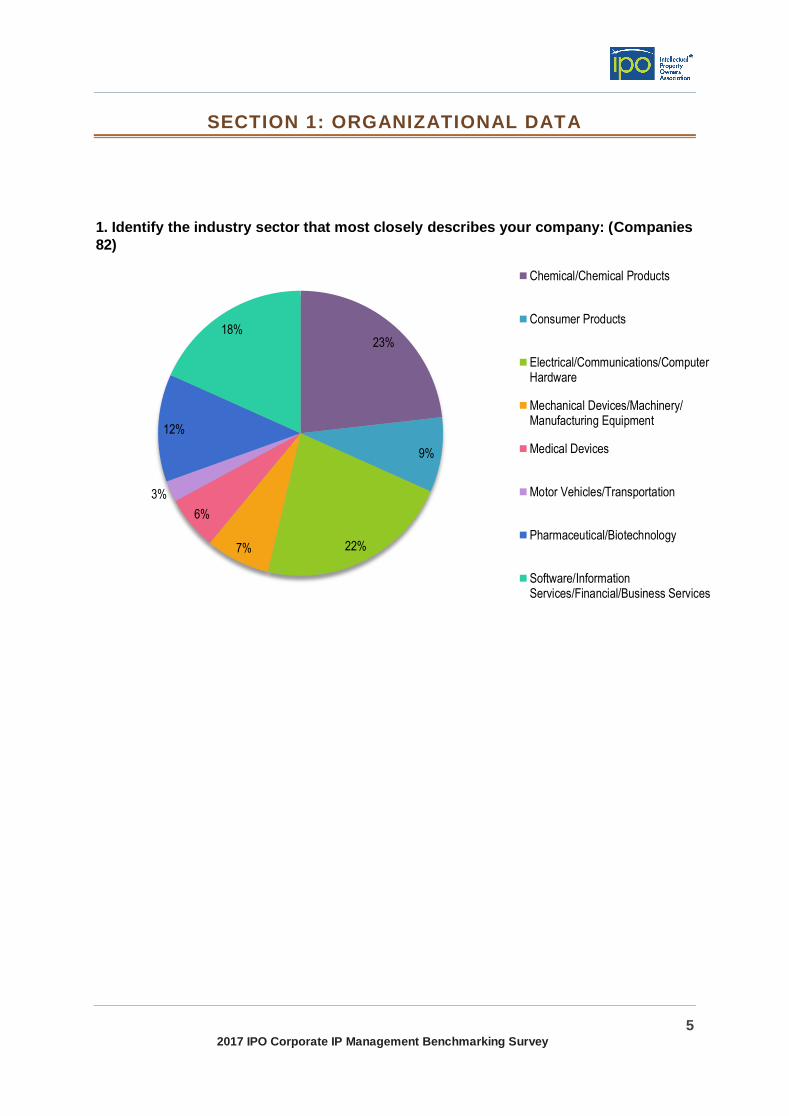
• Industries with the greatest participations are chemicals, electrical, and software.
• Compared to 2013 study, in-house attorneys are spending a slightly higher
percentage of their time on preparation and prosecution. (48%-2017 vs. 45%-2013)
• Eighty-three percent of companies indicated that the intellectual property (IP)
department is responsible for running the patent committee.
• Forty-one percent of companies stated that they benchmark their IP programs.
• Thirty percent of companies indicated that the IP department is directly responsible
for collecting licensing revenue.
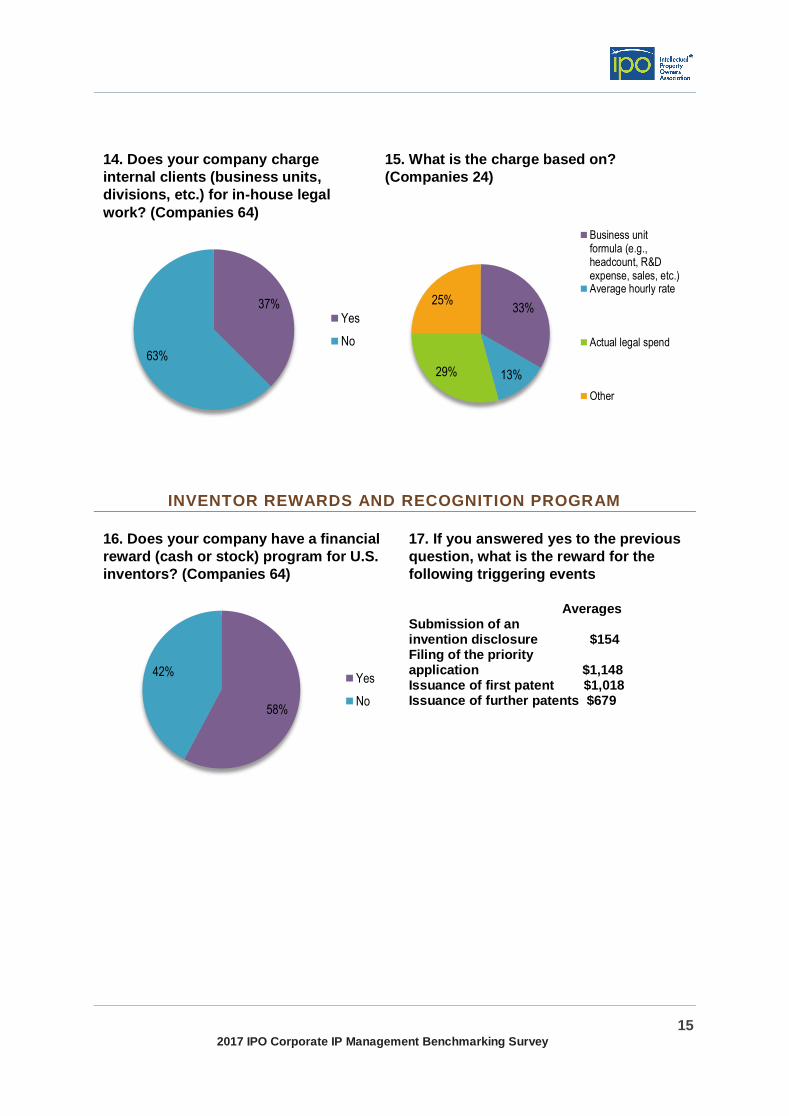
• Fifty-eight percent of companies reported that they have a financial reward for
inventors.
• Billing arrangements for preparing patent applications varied greatly among the
participants. The most pervasive method that was indicated was the fixed-fee billing
arrangement.
• Overall, participants indicated that their outside counsel is responsible for performing
three tasks in the patent application preparation process. The three most popular
activities included: drafting the patent application, interviewing the inventor(s), and
filing the patent application.
• The most common (79%) activity participants outsourced offshore is patentability/
prior art searches.

4 2017 IPO Corporate IP Management Benchmarking Survey
• Thirty-seven percent of companies stated that for inventions originating outside of the U.S., they always file in the US first.
• Twenty-five percent of companies stated that their licensing income is greater than $100 million.
• Thirty-six percent of companies indicated that they license from non-practicing
entities (NPEs).
• Compared to 2013, there are increases in the number of patent agents, litigation attorneys, and other attorneys in IP groups, but a decrease in non-attorney professionals.
• Compared to 2013, the 2017 average docket size reported is slightly higher.
5 2017 IPO Corporate IP Management Benchmarking Survey
SECTION 1: ORGANIZATIONAL DATA
1. Identify the industry sector that most closely describes your company: (Companies
82)
23%
9%
22%7%
6%
3%
12%
18%
Chemical/Chemical Products
Consumer Products
Electrical/Communications/ComputerHardware
Mechanical Devices/Machinery/Manufacturing Equipment
Medical Devices
Motor Vehicles/Transportation
Pharmaceutical/Biotechnology
Software/InformationServices/Financial/Business Services

6 2017 IPO Corporate IP Management Benchmarking Survey
1A. COMPANY SIZE (EMPLOYEES)
1. Number of total worldwide
employees: (Companies 82)
2. Percentage of employees in the U.S.?
(Companies 61)
3. Number of total worldwide R&D
employees: (Companies 72)
4. Percentage of R&D employees in the
U.S. (Companies 58)
23%
35%
27%
15%
Fewer than 10,000
10,000-50,000
50,001-100,000
Over 100,000
9
21
1112
8
0-20% 21-40% 41-60% 61-80% 81-100%
Companies
35%
25%
18%
22%Fewer than 1,000
1,000-5,000
5,001-10,000
Over 10,000 4
10
1513
16
0-20% 21-40% 41-60% 61-80% 81-100%
Companies

7 2017 IPO Corporate IP Management Benchmarking Survey
1B. COMPANY SIZE (FINANCIAL)
1. Last completed fiscal year revenue range: (Companies 77)
2. Last completed fiscal year R&D
budget: (Companies 73)
3. Last completed fiscal year budget for
Intellectual Property Department
(including labor): (Companies 72)
13%
14%
10%
27%
20%
16%
Less than $1 Billion
$1 Billion to $5 Billion
$5 Billion to $10 Billion
$10 Billion to $25 Billion
$25 Billion to $50 Billion
Over $50 Billion
25%
10%
5%15%
25%
20%
Less than $100Million
$100 Million to $250Million
$250 Million to $500Million
$500 Million to $1Billion
$1 Billion to $3 Billion
Over $3 Billion
24%
8%
19%
38%
11%
Less than $5Million
$5 Million to $10Million
$10 Million to $25Million
$25 Million to$100 Million
Over $100 Million

8 2017 IPO Corporate IP Management Benchmarking Survey
4. How does your IP Department budget for the current fiscal year compare to last
year? (Companies 73)
5. Percentage of the IP budget to the R&D budget: (Companies 53)
Mean: .06
Median: .04
6. Percentage of the IP budget to Revenue (Companies 55)
Mean: .01
Median: 0.002
31%
32%
37%
Current year’s budget is greater than last year’s budget
Current year’s budget is less than last year’s budget
Current year’s budget is the same as last year’s budget

9 2017 IPO Corporate IP Management Benchmarking Survey
SECTION 2 IP STAFFING
1.List the number of in-house full-time equivalent (FTE) worldwide IP professionals,
reporting through the Chief IP Counsel, employed at the end of the last completed
fiscal year: (Companies 63) Average
In-House IP Professionals Male Female
Patent Attorneys 15.38 8.28
Patent Agents 5.23 4.39
Trademark Attorneys 1.07 1.33
Litigation Attorneys 1.98 1.51
Other Attorneys in IP Group 1.37 1.00
Other Non-Attorney Professionals
6.83 4.87
2. List the number of in-house FTE worldwide support staff, reporting through the
Chief IP Counsel, employed at the end of the last completed fiscal year: (Companies
63) Average
In-house FTE: Support Staff Male Female
Patent Paralegals: 0.70 4.27
Trademark Paralegals: 0.52 2.12
Litigation Paralegals: 0.23 0.62
Agreement Paralegals: 0.04 1.03
Docketing/Clerical Staff: 0.72 4.65
Secretaries/Administrative Staff:
0.52 7.53
Other: 0.54 2.46
3. During the next fiscal year, do you
expect the number of in-house IP
employees (professionals and support
staff) to: (Companies 63)
4. How are most of your IP attorneys
assigned? (Companies 66)
24%
20%56%
Increase
Decrease
Stay the same

10 2017 IPO Corporate IP Management Benchmarking Survey
5. Identify the number of in-house attorneys/agents that carry a docket of patent
applications (i.e., are responsible for drafting/ managing preparation and/or
prosecution of U.S. / foreign applications): (Companies 61)
Mean: 20
Median: 11
6. Last fiscal year, what was the average docket size (number of applications) per in-
house attorney/agent referred to in the previous question? (Companies 50)
U.S. applications: Foreign applications:
Mean: 105 Median 64
Mean: 200 Median 122
7. Estimate the percentage of time that the entire in-house attorney/agent staff
spends on the preparation/prosecution docket (include time spent drafting,
reviewing, and working with outside counsel, foreign associates, and inventors on
substantive matters): (Companies 56)
Mean: 48%
Median: 48%

11 2017 IPO Corporate IP Management Benchmarking Survey
SECTION 3 IP DEPARTMENT
1. Are patent operations centralized or
decentralized? (Companies 66)
2. Provide the number of locations of
U.S. IP operations: (Companies 64)
3. Select the non-U.S. regions in which IP operations are located (Percentages):
28%
53%
14%
5%
1
2-4
5-8
More than 8
0
10
20
30
40
50
60
70
80
90
Non-U.S.North
America
Europe Brazil Russia India China Japan Argentina Other

12 2017 IPO Corporate IP Management Benchmarking Survey
4. The Chief IP Counsel (or head of IP functions) primarily reports to: (Companies 64)
5. Does your company use patent
committees to review invention
disclosures and select disclosures
for which to pursue patent
protection? (Companies 64)
6. If your company uses more than one
committee, identify how the committees are
primarily organized: (Companies 48)
7. Where does the primary responsibility for running the patent committees reside?
(Companies 48)
81%
9%
5%
2%
3%Chief Legal Officer (General Counsel)
Other Non-IP Attorney
Chief Executive Office / President
Engineering or R&D Executive
Other
75%
25%
Yes
No56%
33%
11%Business unit
Technology
Only one committee
83%
15%
2%
IP Department
Engineering / Research & Development
Business

13 2017 IPO Corporate IP Management Benchmarking Survey
8. In the past fiscal year, did your company’s IP department use external benchmarks
to manage performance? (Companies 63)
9. What was the source of the external benchmark? (26 Companies) (Percentages)
Other trade organization(s), specify: AIPLA ACPC surveys Interpat
ipPerformance Group INTA EP Survey, US Census Survey
41%
59%
Yes
No
65
23
54
39
27
0
10
20
30
40
50
60
70
IPO survey General CounselRoundtable
Peer company Other tradeorganization(s),
specify:
Other, specify:

14 2017 IPO Corporate IP Management Benchmarking Survey
10. Was there an annual goal for the
number of patent applications to be filed
by your company? (Companies 64)
11. Was there an annual ceiling on the
number of patent applications that
would be filed by your company?
(Companies 64)
12. Is the IP Department directly responsible for generating and collecting IP licensing revenue? (Companies 63)
13. Is there another department that is
responsible for generating and
collecting IP licensing revenue?
(Companies 18)
42%
58%
Yes
No
17%
83%
Yes
No
30%
70%
Yes
No
11%
89%
Yes
No
15 2017 IPO Corporate IP Management Benchmarking Survey
14. Does your company charge
internal clients (business units,
divisions, etc.) for in-house legal
work? (Companies 64)
15. What is the charge based on?
(Companies 24)
INVENTOR REWARDS AND RECOGNITION PROGRAM
16. Does your company have a financial
reward (cash or stock) program for U.S.
inventors? (Companies 64)
17. If you answered yes to the previous
question, what is the reward for the
following triggering events
Averages
Submission of an invention disclosure $154 Filing of the priority application $1,148 Issuance of first patent $1,018 Issuance of further patents $679
37%
63%
Yes
No
33%
13%29%
25%
Business unitformula (e.g.,headcount, R&Dexpense, sales, etc.)Average hourly rate
Actual legal spend
Other
58%
42%Yes
No

16 2017 IPO Corporate IP Management Benchmarking Survey
IP MANAGEMENT SOFTWARE
19. Please name the IP management software tools currently in use by your company.
(e.g., docketing, document management, invention disclosure management, workflow
management, etc.): (Companies 60)
Software Applications Companies
Thomson IP Manager 10
CPA Memotech 8
CPI docketing 8
FoundationIP 7
Anaqua IP management system 6
Microsoft-SharePoint (document
management) 4
Innography 3
FileSite 2
IPfolio 2
Lecorpio 2
Patricia 2
20. Please rate your satisfaction level with the IP management software tools
currently in use by your company (Companies 62)
32%
45%
13%
8%
2%
Highly satisfied
Somewhat satisfied
Neutral
Somewhat dissatisfied
Highly dissatisfied

17 2017 IPO Corporate IP Management Benchmarking Survey
SECTION 4: OUTSIDE COUNSEL
4A. BILLING ARRANGEMENT AND COST FOR PREPARING PATENT
APPLICATIONS
1. Billing arrangement and cost for preparing patent applications Identify, by
percentage of use, the billing arrangements used with outside counsel in preparing
complete patent applications for filing:
Billing arrangement Average
Fixed Fee (per application) 80%
Hourly Rate with a Cap 59%
Hourly Rate 50%
Other billing arrangement: 51%
2. If using fixed fee arrangements for
preparing patent applications, how
much is the typical fixed fee
amount? (Companies 58)
3. If using hourly rates with a cap for patent
applications, what is the typical cap
amount? (Companies 50)
15%
14%
31%
12%
28%
Less than $6,000
$6,001-$7,499
$7,500-$9,000
More than $9,000
N/A
4%
10%
16%
12%
58%
Less than $6,000
$6,001-$7,499
$7,500-$9,000
More than $9,000
N/A

18 2017 IPO Corporate IP Management Benchmarking Survey
4. If using hourly rates for patent applications, what is the average cost per patent
application? (Companies 50)
10%
14%
20%56%
$6,001-$7,499
$7,500-$9,000
More than $9,000
N/A

19 2017 IPO Corporate IP Management Benchmarking Survey
4B. BILLING ARRANGEMENT AND COST FOR PREPARING
RESPONSES TO PATENT OFFICE ACTIONS
1. Identify, by percentage of use, the billing arrangements used with outside counsel
in preparing responses to office actions during the prosecution of patent
applications:
Billing arrangement: Patent office actions Averages
Fixed Fee (per response): 70
Hourly Rate with a Cap 59
Hourly Rate 60
Other billing arrangement 25
2. If using fixed fee arrangements for
responses to office actions, how much is
the typical fixed fee amount? (Companies
57)
3. If using hourly rates with a cap for
responses to office actions, what is the
typical cap amount? (Companies 50)
19%
21%
16%5%
39%
Less than $2,000
$2,001-$2,500
$2,501-$3,000
More than $3,000
N/A
14%
12%
12%62%
$2,001-$2,500
$2,501-$3,000
More than$3,000
N/A

20 2017 IPO Corporate IP Management Benchmarking Survey
4. If using hourly rates for responses to office actions, what is the average cost per
response? (Companies 51)
16%
17%
10%
57%
$2,001-$2,500
$2,501-$3,000
More than $3,000
N/A

21 2017 IPO Corporate IP Management Benchmarking Survey
4C. BILLING ARRANGEMENTS FOR LITIGATION
1. Identify, by percentage of use, the billing arrangements used with outside counsel
in litigation matters:
Billing arrangements for litigation Averages
Hourly rate 71
Hourly rate not to exceed per task/litigation stage
55
Contingency 18
Fixed fee per task/litigation stage 50
Fixed or capped fee with results based incentives
38
Other, specify 0
2. Identify, by percentage of use, the billing arrangements used with outside counsel
in litigation matters: - comments
Responses
• Budget set before each litigation. Some fixed fee/contingent fee arrangements
• Close monitoring of spend
• Depends on the case, no statistics available
• Have a budget as a guide
• Have only encountered pre-litigation scenarios
• Specific budgeting for each stage required. If different, then approval required before
invoicing.
• This depends on the case ... case by case.
• We use hourly rates with a negotiated discount percentage.
• Litigation matters managed by another department with IP support
• We have used a combination of hourly rate, and hourly rate not to exceed per
task/litigation stage, about 80%/20%.
3. Has your company used litigation
financing for IP litigation (Select all that
apply.)? (Companies 55)

22 2017 IPO Corporate IP Management Benchmarking Survey
4D. ALTERNATIVE FEE ARRANGEMENTS (OTHER THAN HOURLY
RATES)
1. Have you adopted alternative billing
arrangements? (Companies 57)
2. What has been the impact on per task
costs? (Companies 36)
100%
No
67%
33%
Yes
No
69%3%
28% Lower per-task costs
Higher per-task costs
Same per-task costs

23 2017 IPO Corporate IP Management Benchmarking Survey
3. What has been the impact on overall quality of work? (Companies 36)
11%
89%
Higher overall quality of work
Same overall quality of work

24 2017 IPO Corporate IP Management Benchmarking Survey
4E. TIMING FOR PATENT APPLICATION PREPARATION
1. What is the average cycle time from time of invention disclosure submission to
transmission of instructions to outside counsel for preparation of a non-provisional
patent application by outside counsel? (Companies 52)
2. What is the average cycle time of outside counsel for non-provisional patent
application preparation from the time outside counsel receives an invention
disclosure to filing? (Companies 54)
10%
35%
23%
12%
21%15 days or less
16-30 days
31-45 days
46-60
More than 60 days
52%
33%
15%
60 days or less
61-90 days
91-120 days

25 2017 IPO Corporate IP Management Benchmarking Survey
3. Which of the following is outside counsel responsible for performing in the cycle
time indicated in the above question (Select all that apply.)? (Percentages)
0102030405060708090
100
Conducting a prior artsearch
Interviewing theinventor(s)
Drafting the patentapplication
Obtaining inventorsignatures for formal
documents(declaration,
assignment, etc
Filing the patentapplication
26 2017 IPO Corporate IP Management Benchmarking Survey
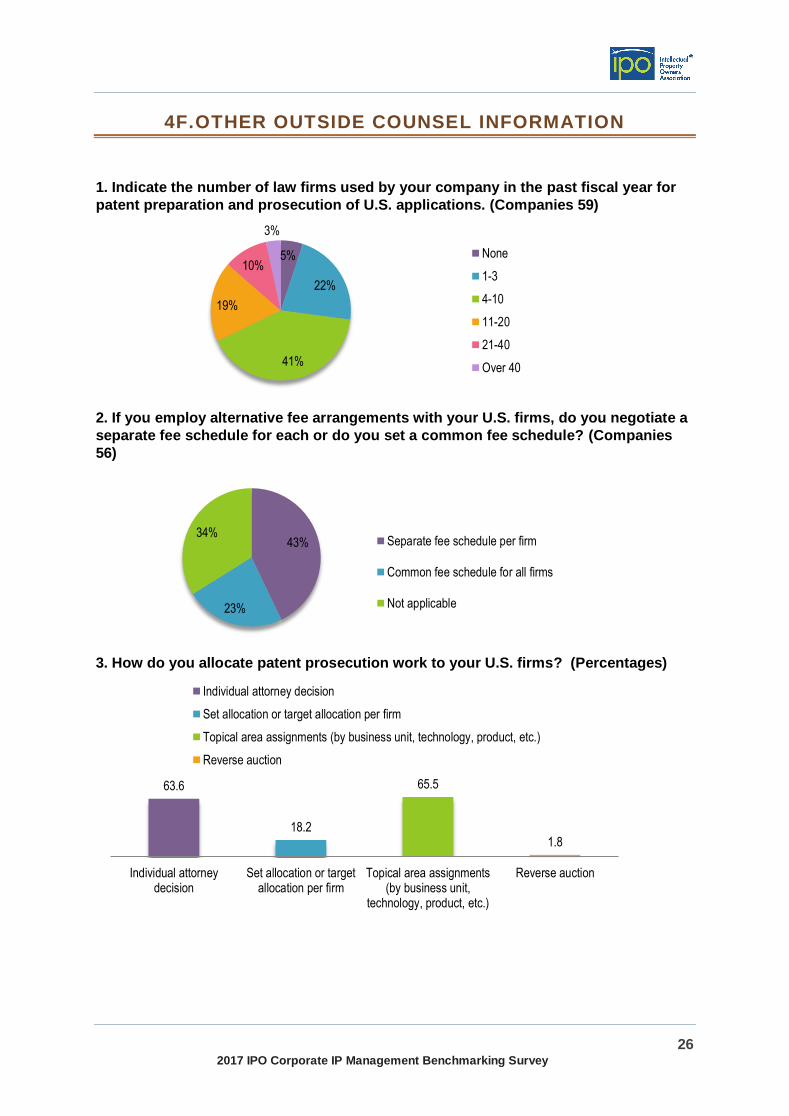
4F.OTHER OUTSIDE COUNSEL INFORMATION
1. Indicate the number of law firms used by your company in the past fiscal year for
patent preparation and prosecution of U.S. applications. (Companies 59)
2. If you employ alternative fee arrangements with your U.S. firms, do you negotiate a
separate fee schedule for each or do you set a common fee schedule? (Companies
56)
3. How do you allocate patent prosecution work to your U.S. firms? (Percentages)
5%
22%
41%
19%
10%
3%
None
1-3
4-10
11-20
21-40
Over 40
43%
23%
34%Separate fee schedule per firm
Common fee schedule for all firms
Not applicable
63.6
18.2
65.5
1.8
Individual attorneydecision
Set allocation or targetallocation per firm
Topical area assignments(by business unit,
technology, product, etc.)
Reverse auction
Individual attorney decision
Set allocation or target allocation per firm
Topical area assignments (by business unit, technology, product, etc.)
Reverse auction

27 2017 IPO Corporate IP Management Benchmarking Survey
4. Indicate the number of law firms used by your company in the past fiscal year for
patent litigation and disputes in the U.S. (Companies 54)
5. Which of the following factors does your company use to qualify new patent
preparation/prosecution firms? (Percentages)
11%
57%
26%
4% 2%
None
1-3
4-10
11-20
Over 20
53
84
65
3540
26
72
37
Request for proposal (RFP)
In-person presentation/pitch
Attorney resumes
Review of law firm writing samples (writing samples that are not work product fo
Qualification period with work product review
Review of law firm Information technology security
Formal engagement letter/agreement
Diversity in gender and/or ethnicity

28 2017 IPO Corporate IP Management Benchmarking Survey
SECTION 5 OPERATIONAL DATA
Mean Median
1. During the last completed fiscal
year, identify the number of utility
patents owned by your company
and in force in the U.S.
5052 2400
2. How many of those utility
patents name at least one female
inventor?
92 25.5
3. During the last completed fiscal
year, identify the number of utility
patents owned by your company
and in force outside of the U.S.
9894 4269
4. During the last completed fiscal
year, identify the number of
invention disclosures generated
by your company
1132 525
5. What is the filing approval rate
for invention disclosures for filing
a patent application for your
company? (percentage)
35 34
6. During the last completed fiscal
year, identify the number of
original utility applications filed
by your company
578 302
7. What percentage of utility
patents originally filed in the U.S.
were prepared in-house?
31 12
8. How do you expect the percentage of utility patents prepared in-house to change in
the next 12 months? (Companies 61)
20%
10%
70%
Increase
Decrease
Stay the same

29 2017 IPO Corporate IP Management Benchmarking Survey
9. Does your company use data analytics (Examiner data, Art Unit data, etc.) to drive
patent prosecution strategy? (Companies 51)
10. Has your company outsourced any of the following activities? (Note: Outsourcing
means work done by non-employees outside the U.S. for the purposes of achieving
cost savings or not increasing headcount, and does not include work done on foreign
applications by foreign associates): (Percentages)
35%
65%
Yes
No
3929.3 26.8 31.7
78
56.1
29.3
65.9
24.4
Any aspect of patent application preparation (includes preparation of technical
Any aspect of preparing responses to patent office actions (includes technical a
Any aspect of infringement/non-infringement opinions (includes analyzing technic
Any aspect of validity/invalidity opinions (includes analyzing technical differe
Patentability / prior art searches
State of the art / IP landscaping / Competitive activity monitoring searches
Docketing and paralegal services

30 2017 IPO Corporate IP Management Benchmarking Survey
11. If you outsourced any of the above tasks, rate your experience with outsourcing: (Companies 42)
62%
36%
2%
Positive
Neutral
Negative

31 2017 IPO Corporate IP Management Benchmarking Survey
5A. UTILIZATION OF PATENT OFFICE PROCEDURES
1. In the past 12 months, has your company utilized any of the following patent office
procedures? (Percentages)
8.2
16.3
53.1
14.3
44.942.9
81.6
24.526.5
28.6
Pre-issuance submissions
Supplemental examination
Inter partes review
Post-grant review
Track One Prioritized Examination
Accelerated Examination
Patent Prosecution Highway (PPH)
Patent Application Capture and Entry(PACE)
PCT Article 19 Amendments
PCT Article 34 Amendments

32 2017 IPO Corporate IP Management Benchmarking Survey
5B. FILING IN THE U.S. VS. FILING ABROAD
1. For inventions originating outside of the U.S., where does your company file first?
(Companies 51)
2. For originally filed non-provisional U.S. utility applications, what percentage of
those applications receive at least one foreign counterpart filing? (Companies 53)
37%
18%
10%
35%
Almost always in the U.S.
Almost always in the country of origin
Almost always elsewhere, includingusing PCT
Sometimes in the U.S. andsometimes in the country of origin
13%
17%
17%
53%
0-25%
26-50%
51-75%
76-100%

33 2017 IPO Corporate IP Management Benchmarking Survey
3. For applications first filed in the U.S. and also filed abroad, what is the average
number of jurisdictions where corresponding filings were made? (Companies 53)
5C. LICENSING
1. Last fiscal year, how much licensing or IP sales revenue was collected by your
company? (Companies 52)
53%
28%
11%
8%
5 or fewer
6-10
11-20
More than 20
23%
37%
15%
25% None
Less than $10 Million
$10 Million to $100 Million
Over $100 Million

34 2017 IPO Corporate IP Management Benchmarking Survey
5D. NON-PRACTICING ENTITIES (NPES)
1. In the last fiscal year, were you a
defendant in a patent litigation commenced
by an NPE? (Companies 53)
2. Do you license from any NPEs? (Companies 52)
53%
47% Yes
No
36%
64%
Yes
No

35 2017 IPO Corporate IP Management Benchmarking Survey
Companies choosing to be listed as participating in this survey:
Accenture
Avaya
BTG International Ltd.
Caterpillar Inc.
Corning Incorporated
Dell EMC
Digimarc Corporation
E. I. du Pont de Nemours and Company
Ingenious e Brain Solutions
Koninklijke Philips N.V.
Mastercard
Micron Technology Inc.
Nielsen
Pfizer Inc.
Rolls-Royce
Takeda Pharmaceutical Company Limited
TE Connectivity
The Dow Chemical Company
The Procter & Gamble Company
United Technology Corp
WD
Xerox Corporation


